the Creative Commons Attribution 4.0 License.
the Creative Commons Attribution 4.0 License.
 | 20 Oct 2021
Modification of a conventional photolytic converter for improving aircraft measurements of NO2 via chemiluminescence
Clara M. Nussbaumer
Uwe Parchatka
Ivan Tadic
Birger Bohn
Daniel Marno
Monica Martinez
Roland Rohloff
Hartwig Harder
Flora Kluge
Klaus Pfeilsticker
Florian Obersteiner
Martin Zöger
Raphael Doerich
John N. Crowley
Jos Lelieveld
Horst Fischer
Nitrogen oxides () are centrally involved in the photochemical processes taking place in the Earth's atmosphere. Measurements of NO2, particularly in remote areas where concentrations are of the order of parts per trillion by volume (pptv), are still a challenge and subject to extensive research. In this study, we present NO2 measurements via photolysis–chemiluminescence during the research aircraft campaign CAFE Africa (Chemistry of the Atmosphere – Field Experiment in Africa) 2018 around Cabo Verde and the results of laboratory experiments to characterize the photolytic converter used. We find the NO2 reservoir species MPN (methyl peroxy nitrate) to produce the only relevant thermal interference in the converter under the operating conditions during CAFE Africa. We identify a memory effect within the conventional photolytic converter (type 1) associated with high NO concentrations and rapidly changing water vapor concentrations, accompanying changes in altitude during aircraft measurements, which is due to the porous structure of the converter material. As a result, NO2 artifacts, which are amplified by low conversion efficiencies, and a varying instrumental background adversely affect the NO2 measurements. We test and characterize an alternative photolytic converter (type 2) made from quartz glass, which improves the reliability of NO2 measurements in laboratory and field studies.
- Article
(1390 KB) - Full-text XML
-
Supplement
(845 KB) - BibTeX
- EndNote


Nitrogen oxides (NOx) represent the sum of NO (nitric oxide) and NO2 (nitrogen dioxide), which can rapidly interconvert in the atmosphere in the presence of sunlight and O3 (ozone) as shown in Reactions (R1) and (R2) (Jacob, 1999).
Considering only these two reactions in atmospheric NOx chemistry, the so-called Leighton ratio represents NO2, NO and O3 in the photostationary state (PSS) as shown in Eq. (1) (Leighton, 1961). is the rate coefficient of Reaction (R1), and is the photolysis frequency for NO2 in Reaction (R2).
Several studies have shown that the Leighton ratio as presented in Eq. (1) is only valid for highly polluted environments, whereas in other regions, besides O3, oxidized halogen species and peroxy radicals (HO2 and RO2) significantly contribute to the oxidation of NO to NO2 and require an extension of the Leighton expression for a reliable calculation of PSS NO2 concentrations, as presented in Sect. 2.4. (Mannschreck et al., 2004; Griffin et al., 2007; Ma et al., 2017; Reed et al., 2016).
NOx can be emitted from either natural or anthropogenic sources, with the latter dominating globally. Natural emissions include, for example, biogenic soil emissions, biomass burning and lightning. Anthropogenic emissions are mainly from combustion processes in vehicles or from power and industrial plants, which contribute almost two-thirds to the global burden (Pusede et al., 2015; Ganzeveld et al., 2002; Logan, 1983). Nitrogen oxides are, together with volatile organic compounds, important precursors to tropospheric ozone, which can be a hazard to plant, animal and human health, causing multiple diseases regarding the cardiovascular and respiratory system (Nussbaumer and Cohen, 2020; Nuvolone et al., 2018; Lippmann, 1989). NOx additionally promotes the formation of acid rain (through conversion to HNO3) – hazardous to many ecosystems – and is a threat to human health itself (Boningari and Smirniotis, 2016; Greaver et al., 2012). Beyond that, NOx controls the abundance of OH radicals, which regulate the oxidizing capacity of the atmosphere (Levy, 1971; Lelieveld and Dentener, 2000). Due to the health implications and the impact on atmospheric photochemical processes, it is highly relevant to measure and monitor ambient NOx concentrations with sophisticated instruments that provide reliable concentration measurements, especially in remote areas where NO and NO2 are low. More specifically, this requires a low instrumental background, which, particularly for NO2, is often impacted by unwanted chemical processes that can lead to artifact signals (Reed et al., 2016; Andersen et al., 2021; Jordan et al., 2020).
Many different measurement techniques have been deployed to measure nitrogen oxides such as cavity-enhanced absorption spectroscopy (and variants – e.g., cavity-attenuated phase-shift spectroscopy, Ge et al., 2013, Kebabian et al., 2005; cavity ring-down spectroscopy, O'Keefe and Deacon, 1988; other techniques, Zheng et al., 2018), differential optical absorption spectroscopy (Hüneke et al., 2017; Winer and Biermann, 1994) and laser-induced fluorescence (Thornton et al., 2000; Javed et al., 2019) for NO2 or absorption spectroscopy for NO (Ventrillard et al., 2017). However, detection of NO and NO2 via chemiluminescence (CLD) is likely the most common technique for the measurement of nitrogen oxides in the atmosphere and is distinguished by the simultaneous in situ measurement of both NO and NO2, low detection limits, and deployability in research aircraft at high altitudes for measurements in the upper troposphere (Pollack et al., 2010; Reed et al., 2016; Tadic et al., 2020). The measurement principle is based on the reaction of nitric oxide and ozone, which yields electronically excited NO2 () that (along with physical quenching) returns to the electronic ground state by fluorescence whereby a photon of a wavelength >600 nm is emitted, which can be detected by a photomultiplier tube. The resulting signal is proportional to the initial NO concentration (Clough and Thrush, 1967). For nitrogen dioxide detection, NO2 is first converted to NO. The standard method for this conversion is the use of a catalytic converter, in which NO2 passes through a heated molybdenum converter where it is reduced by Mo to NO (). However, high temperatures (300–350 ∘C) in the converter along with catalytic surface effects lead to interferences with other atmospheric compounds that can be converted to NO2, such as HONO (nitrous acid), HNO3 (nitric acid) or PAN (peroxyacyl nitrate), and bias the measurement (Demerjian, 2000; Villena et al., 2012; Jung et al., 2017). An alternative and widespread method is the use of a photolytic converter (photolysis–chemiluminescence: P-CL), also referred to as blue light converter, which utilizes LEDs emitting at a wavelength of around 395 nm to dissociate NO2 to NO (Pollack et al., 2010; Reed et al., 2016; Tadic et al., 2020; Ryerson et al., 2000). Interferences (as described above) in the blue light converter are still possible but to a significantly lesser extent. Reed et al. (2016) investigated potential interferences in a photolytic converter related to the presence of PAN, methyl peroxy nitrate (MPN, CH3O2NO2) or pernitric acid (PNA, HO2NO2). These compounds are NO2 reservoir species, and their decomposition (to NO2) is dependent on the temperature, pressure and residence time in the blue light converter (Nault et al., 2015; Fischer et al., 2014). Please note that none of these compounds are photolyzed in the blue light converter and are only subject to thermal decomposition (Reed et al., 2016; Tadic et al., 2020). Generally, increasing temperature and increasing residence time promote the decay of thermally unstable trace gases and the release of NO2, which is further described in Sect. 2.5 (Reed et al., 2016). With increasing residence time in the converter and high atmospheric HONO NO2 ratios, photolysis of HONO could become relevant, as recently shown by Gingerysty et al. (2021).
The CLD detects a signal (which we call the NOc signal) composed of the ambient NO concentration and the ambient NO2 concentration multiplied by the conversion efficiency Ce according to Eq. (2).
The conversion efficiency describes the fraction of NO2 that is converted to NO in the converter and can be thought of as the NO yield from NO2. Its value is dependent on the optical output of the LEDs as well as the NO2 residence time and the pressure in the converter. Ce is therefore in competition with unwanted formation of NO2 from NO2 reservoir species. For example, a longer residence time increases the conversion efficiency but could potentially increase the quantity of NO2 reservoir species that decay in the converter, which takes place according to first-order kinetics, as described in more detail in Sect. 2.5. The NO2 concentration is calculated from the difference in the signal with and without use of the photolytic converter: (Sadanaga et al., 2010; Tadic et al., 2020; Ryerson et al., 2000).
While NO measurements are generally reliable and well-understood, NO2 measurement techniques utilizing the conversion of NO2 to NO are subject to extensive research. Hosaynali Beygi et al. (2011) found a strong deviation from the Leighton ratio at low NOx concentrations between 5 and 25 pptv despite the inclusion of HO2, RO2 and halogen oxides, suggesting the occurrence of a so far unknown atmospheric oxidant. Frey et al. (2015) also reported higher measured ratios than expected from PSS based on measurements in Antarctica and hypothesized the presence of an additional oxidant or a measurement bias. This is in line with findings and suggestions by Silvern et al. (2018) based on observations during the aircraft campaign SEAC4RS over the United States of America. Reed et al. (2016) examined the described deviation through the laboratory investigation of potential NO2 interferences of thermally unstable trace gases such as peroxyacyl nitrate (PAN) within the photolytic converter in comparison to laser-induced fluorescent NO2 measurement and found that this could contribute to the higher-than-expected NO2 concentrations measured by P-CL instruments. Jordan et al. (2020) investigated interferences in a photolytic converter made from quartz glass and showed how the converter conditions affect the conversion efficiency and the artifact signal (caused by NO2 reservoir species). The correct adjustment of the conditions, preferably including low pressure, high flow rates and small temperature variations, can minimize interferences, which was also concluded by Reed et al. (2016). Andersen et al. (2021) reported the measurement of a significant NO2 measurement bias during ground-based observations in the remote marine tropical troposphere with a conventional blue light converter, which was related to its porous walls. They were able to eliminate this effect by implementation of a photolytic converter made from quartz glass, which reduced the overall measurement uncertainty by around 50 %. The use of quartz glass in a blue light converter was also reported by Pollack et al. (2010), who compared the commercially available converter BLC-A manufactured by Droplet Measurement Technologies to other photolytic converters.
An additional challenge is the significant decrease in the ratio with altitude. At the surface during daytime, NO2 concentrations are approximately 2 to 4 times higher than NO concentrations. The ratio decreases by around 1 order of magnitude when going from the lower to the upper troposphere, which increases the uncertainty when deriving NO2 mixing ratios using Eq. (2) (Travis et al., 2016; Silvern et al., 2018; Logan et al., 1981). At the same time, the concentration of NO2 reservoir species such as PNA or MPN is significantly higher in the upper troposphere compared to that at the surface, and consequently interferences are more likely to occur at high altitudes (Nault et al., 2015; Kim et al., 2007). These aspects result in particularly strict requirements regarding airborne NO2 measurements.
In this study, we describe a modified blue light converter (BLC) (type 1) originally purchased from Droplet Measurement Technologies, which we have deployed in NO2 measurements via photolysis–chemiluminescence during the research aircraft campaign CAFE Africa (Chemistry of the Atmosphere: Field Experiment in Africa) and also in laboratory investigations. We show how high NO concentrations and rapidly changing water vapor concentrations affect the instrumental background and induce a memory effect that cannot be corrected retrospectively. This is particularly relevant to aircraft measurements during which water vapor concentrations are subject to rapid changes due to variations in flight altitude, but also to all other application areas. The photolytic converter and similar designs are widely used for field measurements of NO2 all across the world (e.g., Andersen et al., 2021; Jung et al., 2017; Xu et al., 2013; Breuninger et al., 2013; Fuchs et al., 2010; Reidmiller et al., 2010; Crowley et al., 2010; Sather et al., 2006) and can provide reliable results for stationary use and locations with only little variation in ambient NO and low humidity levels, but they suffer from enhanced uncertainty in other applications. We propose the elimination of any direct contact points between the sample gas and the porous inner converter surface and have developed an alternative photolytic converter entirely made from quartz glass (type 2). Highly reflective properties are achieved by an outer mantle made from optical PTFE (polytetrafluoroethylene, also known as Teflon). The type 2 quartz converter shows promising results in the laboratory regarding its application in field studies for more reliable NO2 measurements. We do not claim to be the first to present an alternative quartz glass converter for P-CL measurement of NO2. However, we are the first to point out the technical difficulties of the application of conventional NO2 converters in airborne studies and believe the presented results to be a guidepost for future NO2 aircraft measurements via photolysis–chemiluminescence.
2.1 Instrument
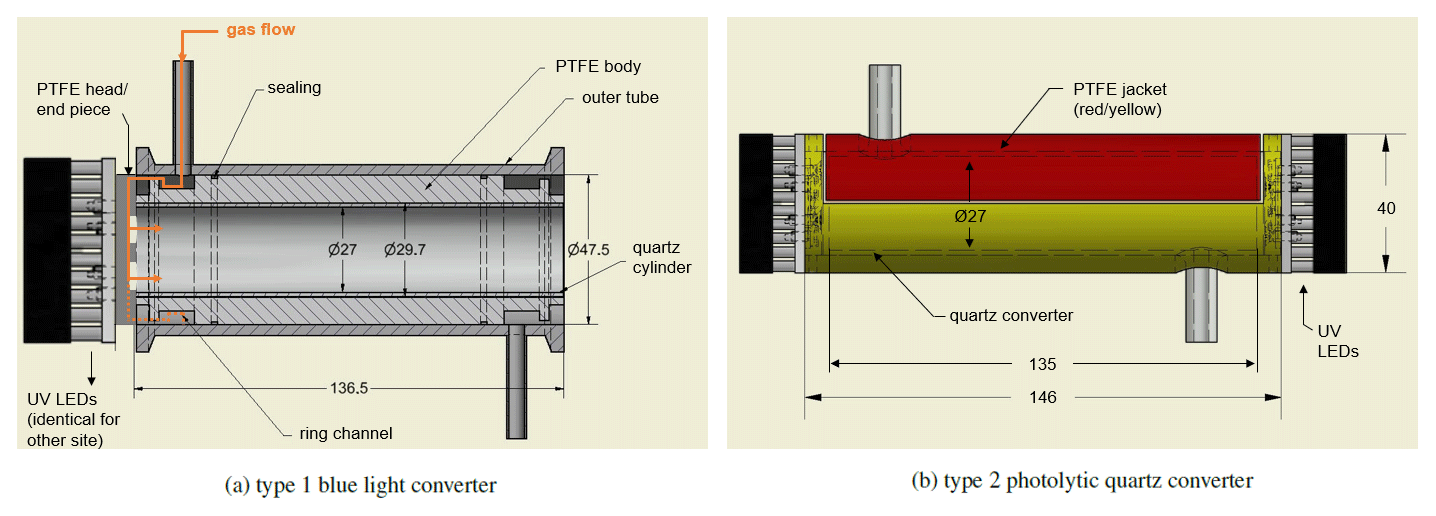
All NOx measurements were performed using a modified two-channel chemiluminescence instrument originally purchased from ECO Physics (Dürnten, Switzerland; CLD 790 SR), as described by Tadic et al. (2020) (Fig. 2 presents the instrument schematic), operated at a total gas flow of 3 SLM, equally divided into the two channels. NO concentrations are measured in the first channel, also referred to as the NO channel, through formation of via reaction with O3. The resulting excited emits a photon (>600 nm) detected by a photomultiplier tube and preamplifier setup, and it is recorded as counts per second. The second channel, also referred to as the NOc channel, is structurally identical except for the implementation of a photolytic converter, which converts a known fraction of NO2 to NO prior to the reaction with O3 and is operated at a constant pressure of 110 hPa (105 hPa during the CAFE Africa field experiment). NO2 concentrations are obtained from the difference in counts from each channel and the conversion efficiency Ce as described above (see Eq. 2). We use a blue light converter (type 1) purchased from Droplet Measurement Technologies in 2005 (later Air Quality Design, now Teledyne API) equipped with UV LEDs emitting at a wavelength of 397 nm (FWHM=14 nm, as characterized in the laboratory), which is shown in Fig. 1a. The converter was designed for airborne applications. The inner material is made of porous, optically active PTFE (polytetrafluoroethylene) for providing highly reflective properties. To reduce surface effects the converter was equipped with a quartz cylinder covering approximately half of the PTFE surface (the gas still has contact with the PTFE surface in the ring channel and through the head piece). Please note that this modification was made prior to the CAFE Africa research campaign within a limited time frame and did not have the desired outcome. The sample gas enters the converter sideways into the ring channel and reaches the inner tube via the PTFE head piece, which has four circular recesses, one for each UV LED. The sample gas outlet proceeds analogously. The inner volume of the converter is V=78 cm3, which gives a residence time of . The conversion efficiency for this type 1 photolytic converter operated under the conditions described above is approximately 20 % (j=0.66 s−1), which was determined via gas-phase titration (GPT) of NO with ozone. The results obtained with the described type 1 converter were compared to an alternative photolytic converter completely made from quartz glass (type 2), which is shown in Fig. 1b. For maintaining the reflective properties of the type 1 blue light converter, the type 2 quartz converter was jacketed with optical PTFE, which provides diffuse reflectance of >99 % in the wavelength range 350–1500 nm (SphereOptics GmbH, 2017). The PTFE material was found to provide a higher conversion efficiency in the converter compared to aluminum foil and additionally provides a stable housing for the sensitive quartz tube. The volume of the type 2 converter is 77 cm3, which gives a residence time of t=0.33 s and a conversion efficiency of approximately 14 % (j=0.46 s−1) under the operating conditions. The applied LEDs were purchased from LED ENGIN (San Jose, California, USA) (high-efficiency VIOLET LED emitter LZ1-10UB00-01U6, 2–2.2 W, 395–400 nm peak wavelength). Please note that the low conversion efficiencies in both converters result from the operation at low pressures, which we have implemented to pursue aircraft measurements during which altitude changes are accompanied by pressure variations. Operating the converter at lower than minimum ambient pressure levels (max. ∼15 km flight altitude) has the benefit of a constant conversion efficiency. The fractional dissociation of thermally unstable NOx reservoir species increases with increasing pressure in the converter, which can be seen in Fig. S1a in the Supplement. On the other hand, a higher conversion efficiency would be desirable for improved accuracy of the measurement. The main difference between the two converters is that the sample gas flow does not have direct contact with the porous surface of the material for the type 2 quartz converter. Additionally, the sample gas flow in the type 2 quartz converter does not have contact with the LEDs, which likely minimizes the sample gas heating and consequently the thermal interferences when passing through the converter. The reaction chambers (where the reaction of NO and O3 takes places) are operated at a constant temperature of 25 ∘C and a pressure of 9–10 mbar in order to minimize quenching of by other molecules. The dry ozone flow is humidified with water vapor for maintaining a constant humidity level at all times.
Besides the photons emitted from relaxation of , the PMT (photomultiplier tube) signal also includes detected photons from interference reactions, for example the reaction of O3 with alkenes (Alam et al., 2020), as well as a dark current signal. Therefore, a pre-chamber measurement is operated for 20 s every 5 min with ozone added to the sample gas flow. The residence time in the pre-chamber allows for the reaction of O3 and NO as well as the relaxation of before entering the main reaction chamber (pre-chamber efficiency >96 % for the NO channel and ∼100 % for the NOc channel). It is not long enough to convert interfering compounds, which then occurs in the following main chamber. Consequently, during pre-chamber measurements, the PMT signal only includes the interfering signal and the dark current signal (Ridley and Howlett, 1974; ECO PHYSICS AG, 2002). We subtracted the interpolated signal obtained during pre-chamber measurements from the signal detected during main chamber measurements in order to obtain the signal generated from NO. The material of both the pre-chamber and the main chamber is gold-plated stainless steel.
The instrumental background of each channel is determined via zero (synthetic) air measurements from a gas cylinder and can be converted to mixing ratios using calibration measurements with a known NO concentration, which define the sensitivity ( – parts per billion by volume) of each channel to NO, as shown in Eq. (3) (after pre-chamber corrections). The signal detected from zero air measurement (counts(zero air)) is subtracted from the signal detected from NO calibration (counts(NO calibration)) and divided by the absolute concentration of the NO calibration (c(NO calibration)) to calculate the sensitivity. Dividing the signal detected from zero air measurements by this value gives the instrumental background concentration in mixing ratios, e.g., ppbv. The precision is determined from the reproducibility of the NO calibrations and is 3 % (1σ). The NO concentration is 4.96±0.21 ppmv, which gives a 4 % uncertainty on the secondary standard used. The resulting NO calibration mixing ratio is 15.8±0.7 ppbv. The detection limit is given by the reproducibility of the zero air measurements, which is around 5 pptv for the NO channel and the NOc channel using the type 2 quartz converter. The detection limit is higher when using the type 1 converter, but it is difficult to determine due to the observed memory effects and is estimated at >10 pptv.
Please note that the utilized zero air can include a trace concentration of NOx. The manufacturer specifies the maximum concentration of NOx to be 0.1 ppmv (parts per million by volume) (Westfalen Gas Schweiz GmbH, 2021).
2.2 CAFE Africa field experiment
The CAFE Africa research campaign took place in August and September 2018 and included 14 measurement flights (MF03–MF16), which were performed with the HALO (High Altitude Long Range) research aircraft starting from the campaign base in Sal on Cabo Verde (16.75∘ N, 22.95∘ W). We included data measured during the measurement flights MF10, MF12, MF13, MF14 and MF15 in this analysis (MF11 was a nighttime flight and therefore excluded) for which CLD NO2 measurements were available. An overview of the flight tracks is presented in Fig. 2. A bypass line provided the instruments with air from the aircraft inlet for which the residence time depended on the ambient pressure level (for high altitudes<0.1 s). The sample line temperature was approximately 25 ∘C. More details on the campaign can be found in Tadic et al. (2021).
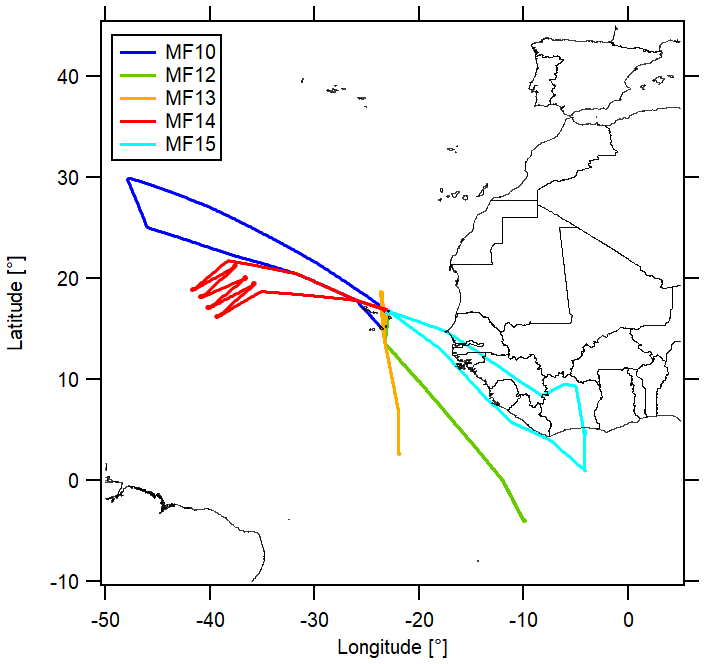
Figure 2Geographic overview of the measurement flight tracks included in this analysis.
NO and NO2 were measured via photolysis–chemiluminescence with the instrument described in Sect. 2.1 using the type 1 conventional blue light converter equipped with the quartz glass cylinder, operated at a temperature of 313 K and a pressure of 105 hPa (0.32 s residence time). Please note that it was not possible to measure the temperature inside the converter. Instead, the temperature of the gas outflow from the converter in the ring channel was measured, which we equate to the inner temperature. Zero air measurements and NO calibrations using a secondary NO standard (cylinder concentration of 1.187±0.036 ppmv and calibration mixing ratio of 2.97±0.09 ppbv) were performed regularly to determine the variability in the instrumental background and the sensitivity of the channels. The ambient measurement was interrupted every 1–2 h by a 1 min zero air measurement, followed by 1 min NO calibration and another 1 min zero air measurement. These calibration background cycles (CB cycles) were performed four to six times during each measurement flight. We linearly interpolated these instrumental background and calibration measurements to each entire flight. The NO data were processed as described by Tadic et al. (2021) (5 pptv detection limit at 1 min integration time and 6 % relative uncertainty, 1σ). Please note that the instrumental background for the NO data was determined at 5.0±5.3 pptv during a nighttime measurement on 26 August 2018 of NO as presented by Tadic et al. (2021) and previously described by Lee et al. (2009). The instrumental background determined via zero air measurement was similar with 4±7 pptv (Tadic, 2021) (measured four to six times per MF). For the NO2 data, the NOc channel sensitivity and the instrumental background concentration were calculated after pre-chamber correction according to Eq. (3). The ambient NOc signal was divided by the channel sensitivity accordingly. Final NO2 concentrations were determined via Eq. (4); this includes subtraction of the calculated (and interpolated) NOc instrumental background concentration and the NO concentration in the NO channel and dividing by the conversion efficiency of the blue light converter, which was 24.2±2.8 % during the campaign.
2.3 Further measurements
Additional measurements of atmospheric trace gases during CAFE Africa including O3, CO, CH4, HO2, OH, NO2 and water vapor as well as the photolysis frequencies and jPNA were used in this study. O3 was measured via UV absorption and chemiluminescence with the FAIRO (Fast AIRborne Ozone) instrument (total measurement uncertainty of 2.5 %; Zahn et al., 2012). CO and CH4 were measured via quantum cascade laser absorption spectroscopy (total measurement uncertainty of 4.3 % and 0.3 %, respectively; Schiller et al., 2008). HO2 and OH were measured with the custom-built HORUS (HydrOxyl Radical measurement Unit based on fluorescence Spectroscopy) instrument via fluorescence spectroscopy (Novelli et al., 2014; Marno et al., 2020). Please note that these data are still preliminary, and the measurement uncertainty is estimated at 50 %. Additional NO2 concentrations for comparison were measured via differential optical absorption spectroscopy (miniDOAS) with a detection limit of about 5 pptv and an uncertainty depending on the altitude and cloud cover of typically 40 pptv (Hüneke et al., 2017; Kluge et al., 2020). Water vapor was measured via direct absorption by the tunable diode laser system SHARC (Sophisticated Hygrometer for Atmospheric ResearCh) (accuracy of 5 %, detection limit typically in the range of 2–3 ppmv) (Kaufmann et al., 2018). The photolysis frequencies were calculated from actinic flux densities measured with a spectral radiometer (Meteorologie Consult GmbH, Metcon, Koenigstein, Germany) (uncertainty<15 %) (Bohn and Lohse, 2017). Please note that all measurement data were converted to a uniform timescale with a 1 min time resolution as a basis for this analysis.
2.4 NO2 calculations
For calculating the photostationary-state NO2 concentrations during CAFE Africa, we assume that NO2 production occurs through reaction of NO with O3 (Reaction R1), HO2 (Reaction R3) and RO2 (Reaction R4). Tadic et al. (2021) showed that RO2 is well-represented by CH3O2 during CAFE Africa via model simulations (80 % at 200 hPa of altitude and up to 90 % below), which we therefore use as surrogate for describing all organic peroxy radicals. In analogy to Leighton (1961), we describe NO2 loss by photodissociation as shown in Reaction (R2). Other loss pathways for NO2, for example, via OH can be neglected (<1 %) (Bozem et al., 2017).
NO2 concentration in photostationary state can therefore be obtained via Eq. (5), whereas the concentration of CH3O2 is calculated with the help of Eq. (6), which was derived by Bozem et al. (2017). For the calculation via Eq. (6) we assume that CH3O2 and HO2 formation occurs through CH4 and CO oxidation, respectively. We estimate an uncertainty of around 20 % resulting from these assumptions. Propagating the measurement uncertainties of HO2, CH4 and CO suggests a 50 % uncertainty in the calculated CH3O2 data. The NO2 PSS data have an uncertainty of 22 % regarding the trace gas measurements according to Gaussian error propagation (uncertainty of rate coefficients is considered negligible).
The temperature-dependent rate coefficients were obtained from the data sheets of the IUPAC Task Group on Atmospheric Chemical Kinetic Data Evaluation (2021) (Atkinson et al., 2004, 2006).
2.5 Calculation of NO2 reservoir species
We consider the NO2 reservoir species PAN (peroxyacetyl nitrate), MPN (methyl peroxy nitrate) and PNA (pernitric acid). PAN was measured during CAFE Africa via chemical ionization mass spectrometry (CIMS) (Phillips et al., 2013). MPN and PNA were not measured and instead estimated via photostationary-state calculations as suggested by Murphy et al. (2004). PNA (HO2NO2) production occurs through reaction of HO2 and NO2 (R5), while PNA loss is described by Reactions (R6)–(R8) either through thermal decomposition, photolysis or reaction with OH (Veres et al., 2015; IUPAC Task Group on Atmospheric Chemical Kinetic Data Evaluation, 2021; Atkinson et al., 2004). PSS HO2NO2 concentrations can then be calculated via Eq. (7). k is the rate coefficient for each reaction and jPNA is the photolysis frequency for Reaction (R7).
MPN production and loss terms are in analogy to PNA, as shown in Reactions (R9)–(R11), except for the reaction with OH, which is negligible (Nault et al., 2015; Browne et al., 2011; Murphy et al., 2004; Bahta et al., 1982). The calculation in PSS is performed via Eq. (8). k represents the rate coefficients and jMPN is the photolysis frequency for Reaction (R11). During CAFE Africa, only the photolysis frequency jPNA was evaluated because reliable molecular data for MPN were missing. As suggested by Murphy et al. (2004) we assume identical UV cross sections of MPN and PNA and therefore jMPN to be identical to jPNA.
In the photolytic converter, PNA, MPN and PAN can decompose to NO2 depending on the temperature, pressure and residence time t according to first-order kinetics. The resulting NO2 artifact is determined via Eq. (9).
Gaussian error propagation gives an uncertainty of 55 % for the calculated PNA and MPN data. We use the residence time according to the volume and the flow rate in the photolytic converter as described earlier. The actual value could deviate from the calculated one due to unknown flow dynamics and temperature gradients. Assuming 30 % uncertainty in the residence time gives an overall uncertainty of around 60 % in the NO2 formed from PNA and MPN in the photolytic converter.
3.1 Aircraft measurements
3.1.1 NO2 reservoir species
Figure 3a shows the vertical concentration profiles of the NO2 reservoir species PNA and MPN according to photostationary steady-state calculations (Eqs. 7 and 8) as well as PAN measurements during CAFE Africa. MPN concentrations were close to zero at low altitudes up to 10 km and increased above, reaching 57±40 pptv between 13 and 14 km of altitude. The concentration increased further aloft but had a large variability. PNA mixing ratios were low below 8 and above 12 km of altitude and showed peak concentrations of 54±21 pptv between 9 and 10 km. PAN increased from ground level to mid-range altitudes, with a maximum of 383±283 pptv at 4–5 km. Concentrations subsequently decreased with altitude, reaching 92±44 pptv at 14–15 km. Figure 3b shows the NO2 artifact concentrations resulting from thermal decomposition of the reservoir species in the type 1 blue light converter according to first-order decay. It can be seen that only relevant artifact signals originated from MPN, more than 50 % of which decomposed to NO2 at the conditions present in the converter; 3 % of the ambient PNA was converted to NO2. Even though atmospheric PAN concentrations, particularly at mid-range altitudes, were high, temperature, pressure and residence time in the blue light converter were too low for PAN to decay to NO2. As an overview, Fig. 3c shows the temperature-dependent decay () of the discussed NO2 reservoir species in the converter. The calculation is based on constant pressure (105 hPa) and residence time (0.32 s). The temperature in the converter is shown with the black dashed line. Increasing temperature increases the decomposition share. It can be seen that, for PAN and PNA, the converter temperature would need to be significantly higher to observe a relevant decay (10 % decay of PNA at >50 ∘C and of PAN at ∼80 ∘C). In contrast, for MPN, small changes in the temperature have a strong effect on the decomposing share (4 at the steepest point). We show the time- and pressure-dependent decay of PAN, PNA and MPN in Fig. S1. PAN and PNA decay only slightly depending on pressure at the given temperature and residence time. Please note that the residence time and the pressure are correlated, which we have neglected in this calculation. Based on these results, we recommend the implementation of a monitoring system for both temperature and pressure within the photolytic converter, which is difficult to implement in the type 1 blue light converter but allows for a more accurate calculation of the decomposing share and consequently a reliable correction of the NO2 signal.
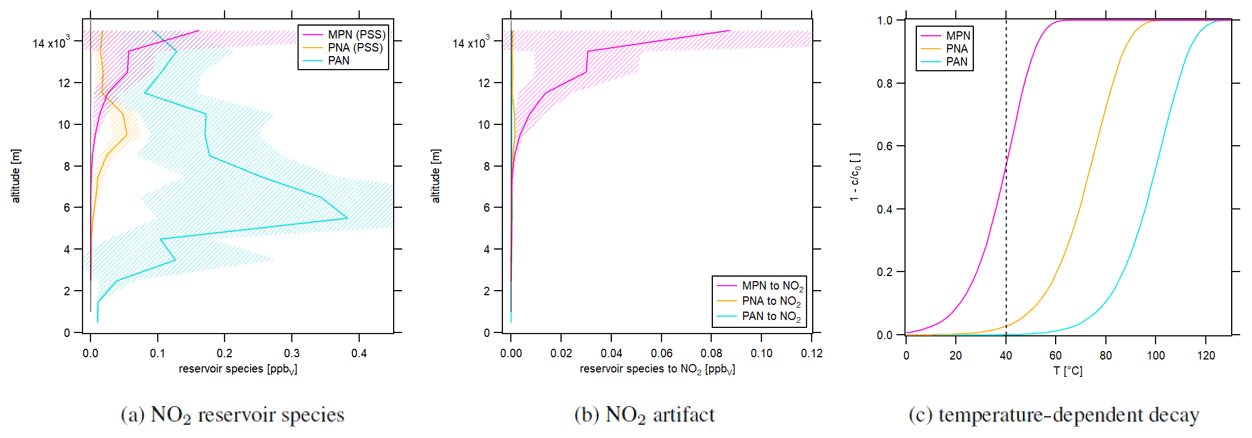
Figure 3Vertical profiles of (a) NO2 reservoir species MPN, PNA (from PSS calculations) and PAN (measured during CAFE Africa) as well as (b) NO2 artifacts in the blue light converter from reservoir species according to first-order decay. The shaded plot areas present the 1σ standard deviation resulting from averaging the concentrations at each considered altitude range. (c) Temperature-dependent decay of the NO2 reservoir species in the type 1 blue light converter.
We have subtracted the NO2 artifact signal arising from the decomposition of MPN and PNA from the CLD NO2 concentrations. Please note that the data coverage for the NO2 artifact from MPN is 55 % and from PNA is 48 % (difference due to OH data coverage). We have interpolated the data used in the following sections to reach full coverage of the CLD NO2 concentrations. Sometimes the data were incomplete at the start or the end of a measurement flight in which case we considered the averaged NO2 artifact signal according to the vertical profile shown in Fig. 3b as a function of the altitude.
3.1.2 Atmospheric NO2 concentrations
Figure 4a shows the vertical profile of NO2 concentrations measured via CLD in green, miniDOAS measurements in purple and NO2 from PSS calculations in red. Calculated PSS NO2 concentrations were on average 17±14 pptv and approximately constant over the considered altitude range. At high altitudes, NO2 from decomposing reservoir species exceeded the PSS values by around a factor of 5. NO2 concentrations measured by the miniDOAS instrument were 95±31 ppt at ground level and decreased with altitude up to 2 km. They were constant at 15±16 pptv between 2 and 10 km of altitude and agreed to within ∼ 85 % to the calculated values. Concentrations increased again above, reaching 54±31 pptv between 11 and 12 km, and decreased aloft with values similar to PSS NO2 between 14 and 15 km. Average NO2 concentrations measured by the CLD were 49±76 pptv below 10 km of altitude where decomposition of reservoir species did not play a role and decreased with altitude above. Figure 4b shows the calculated difference in NO2 concentrations between PSS calculations and miniDOAS measurements in black and between PSS calculations and CLD measurements in gray. It is notable that NO2 concentrations from PSS and miniDOAS measurements were nearly identical apart for a difference with a maximum value of 48±4 pptv between 10 and 13 km of altitude. In contrast, CLD NO2 concentrations were higher by 45±62 pptv compared to the calculation up to 10 km of altitude and lower at higher altitudes with a maximum deviation of more than 100 pptv between 14 and 15 km. Figure 4a shows that the NO2 CLD mixing ratios are negative at high altitudes. This is an indicator of a wrongly measured instrumental background signal in the second channel. If the determined instrumental background was too high, Eq. (4) could return underestimated or even negative NO2 concentrations. However, the CLD NO2 data were not generally too small, but even enhanced at lower altitudes compared to PSS and miniDOAS data, which may indicate the contribution of additional factors that we investigate in the following with the help of NO, H2O and NO2 concentrations in the course of selected measurement flights. For comparison, Fig. 4c shows the CLD NO2 data with and without the calculated artifact signal. It can be seen that the data are already negative before the subtraction of decomposing NO2 reservoir species.
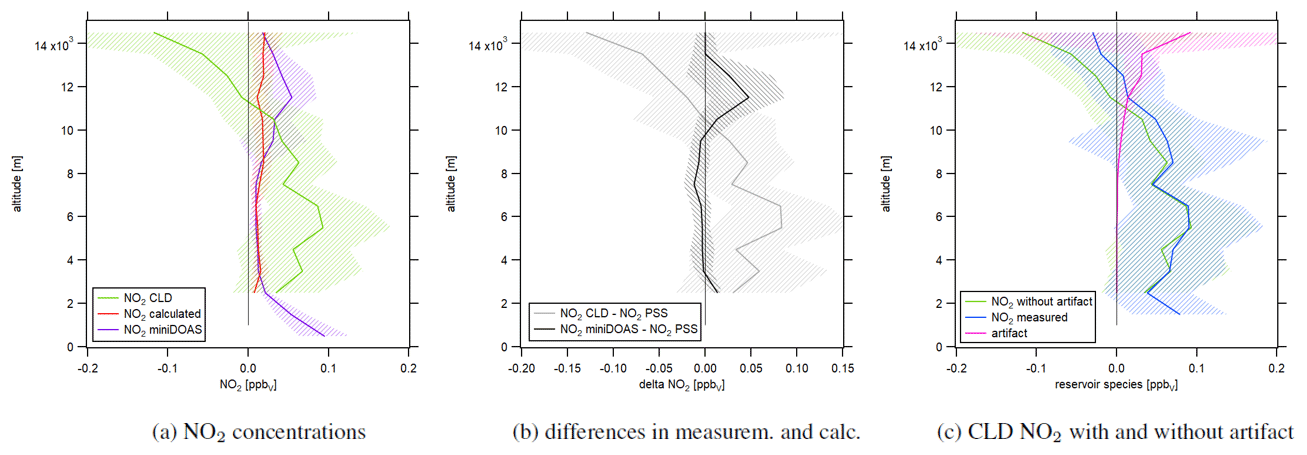
Figure 4Vertical profiles of (a) NO2 concentrations measured by the CLD, measured by miniDOAS and calculated via Eq. (5). (b) The difference in NO2 concentrations from PSS calculations and measurements and (c) CLD NO2 concentrations with and without an artifact. The shaded plot areas present the 1σ standard deviation resulting from averaging concentrations at each considered altitude range.
3.1.3 Influence of atmospheric water vapor
Atmospheric water vapor concentrations are highest at ground level and decrease with increasing altitude. As an example, the vertical concentration profile of atmospheric water vapor during CAFE Africa is shown in Fig. S2. Accordingly, altitude changes during aircraft measurements introduce rapid changes in relative humidity to the instruments on board.
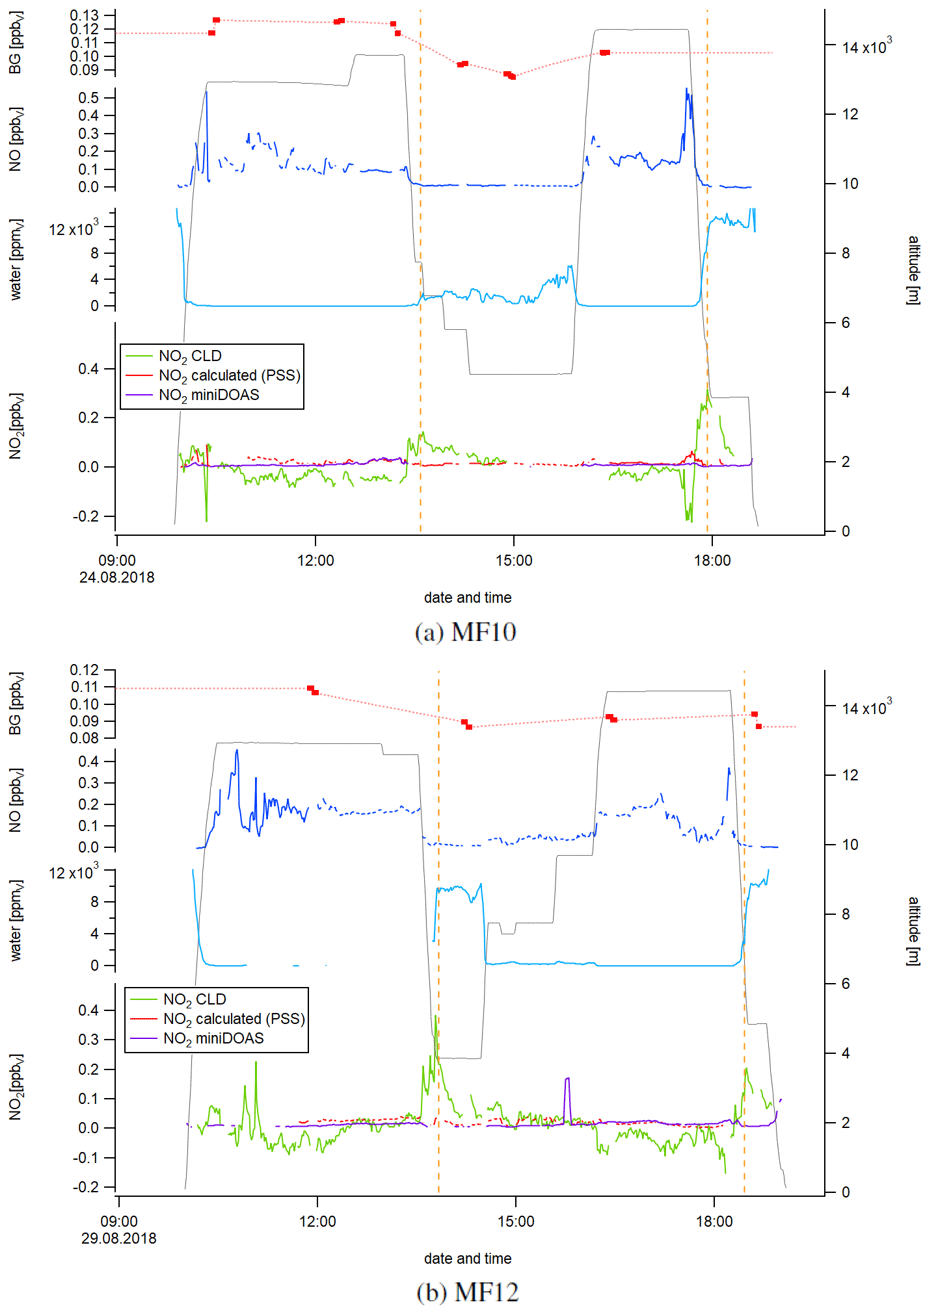
Figure 5Temporal development of the instrumental background (BG) in the NOc channel, NO, water vapor, and calculated and measured NO2 for measurement flights 10 and 12. The orange dashed lines indicate the simultaneous occurrence of a rapid decrease in altitude, an increase in water vapor concentration and a peak in the NO2 CLD data.
Figure 5 shows a time series of NO, water vapor, and calculated and measured NO2 concentrations during the measurement flights MF10 (Fig. 5a) and MF12 (Fig. 5b). NO concentrations varied between 0.005 and 0.56 ppbv for MF10 and between 0.005 and 0.46 ppbv for MF12. We have recently shown that enhanced NO concentrations in the morning and afternoon of MF12 were due to local, recent lightning activity (Nussbaumer et al., 2021). For MF10, enhanced NO concentrations at high altitudes had their source over the African continent. At low altitudes, NO concentrations were close to zero as there were no significant NO emissions in the marine boundary layer. Water vapor concentrations showed the expected inverse correlation with the flight altitude, with mixing ratios below the detection limit at high altitudes. As already suggested by the vertical NO2 concentration profiles in Fig. 4a, NO2 concentrations obtained from CLD measurements were lower than NO2 concentrations from miniDOAS measurements and PSS calculations (and sometimes even below zero) at high altitudes and higher at low altitudes. Please note that the CLD NO2 data shown in Fig. 5 were processed as described earlier. This includes the interpolation of the instrumental background and calibration measurements, which were performed six times for MF10 and four times for MF12. A potential variation of the instrumental background or the sensitivity of the channels between two CB cycles would therefore be unaccounted for. We show the instrumental background measurements in the top data trace of each panel in Fig. 5 by red dots and the interpolation as a red dashed line. For MF10, the measured instrumental background in the NOc channel varied between 85 and 127 pptv and for MF12 between 87 and 109 pptv. In comparison, the instrumental background in the NO channel varied between 1 and 11 pptv for MF10 and between −2 and 6 pptv for MF12. We show the instrumental background for MF10 and MF12 in each channel in Fig. S3. Calculated PSS NO2 concentrations ranged between 1 and 93 pptv for MF10 and between 2 and 46 pptv for MF12. Local maxima mainly accompanied peaks of nitric oxide, which is a result of the NO dependence of Eq. (5). NO2 concentrations measured by the miniDOAS instrument varied between 2 and 39 pptv for MF10. For MF12, concentrations were 15±16 pptv and generally lower for low altitudes and higher for high altitudes. NO2 concentrations measured by the CLD instrument ranged from −224 to 317 pptv for MF10 and from −153 to 384 pptv for MF12. It is striking that the maxima were obtained simultaneously with a sharp decrease in altitude accompanied by an increase in water vapor concentration. For each measurement flight shown here, this phenomenon was observed twice, indicated by the orange dashed lines. For example, the research aircraft descended from 12.6 to 3.9 km at 13:30 UTC during MF12. At the same time, the CLD NO2 concentration increased from an average of 23±14 pptv between 13:00 and 13:30 UTC to its maximum of 384 pptv at 13:45 UTC when reaching the new lower flight altitude. Water vapor measurements were incomplete before 13:00 UTC, but it can be assumed that they were constant and close to zero at 12.6 km of altitude, rising to ppmv on average after reaching 3.9 km (+15 min). Similar observations were made for MF12 at 18:30 UTC and for MF10 at around 13:30 and 18:00 UTC, in each case accompanied by a decrease in altitude and an increase in water vapor concentrations. The observed NO2 peaks appeared only for the CLD measurement and not for the values from PSS calculation or miniDOAS measurement, which underlines the instrumental cause. The time series for the measurement flights MF13, MF14 and MF15 shows similar results and can be found in Fig. S4.
We hypothesize that these observations were influenced by a surface effect in the type 1 blue light converter, which has a highly porous inner surface as described earlier. This material can adsorb atmospheric compounds, such as NO, and desorb them at a later stage (for example, supported by an increase in humidity), which we will refer to as memory effect in the following. In a series of laboratory studies, we have investigated the impact of NO concentrations and humidity on the effects described above, particularly in regard to the instrumental background.
3.2 Laboratory experiments and implications for CAFE Africa
We propose that the memory effect described in the previous section is strongly affected by NO molecules and is dependent on changes in the introduced relative humidity. In order to show this, we have conducted different experiments in the laboratory to investigate the instrumental background produced by the photolytic converter in the NOc channel. Beside NO and H2O, we suggest that one or more additional factors affect the observed instrumental background signal, which are connected to the light of the LEDs and which we discuss at the end of this section.
For the first set of experiments, we exposed the converter (LEDs switched on) to 15.8 ppbv of NO for 2 h followed by 4 h zero air measurements. The first experiment was carried out under dry conditions, sampling NO and zero air directly from the gas cylinder. For the second experiment, we introduced water vapor by passing zero air through a washing bottle with deionized water before entering the instrument. The thus obtained relative humidity was ∼95 % at ambient temperature and decreased over time with decreasing water temperature (through evaporation). For the third and fourth experiment, zero air was humidified only for the zero air measurement and the NO measurement, respectively. We repeated the latter, introducing a lower relative humidity of ∼35 %, and obtained the same result.
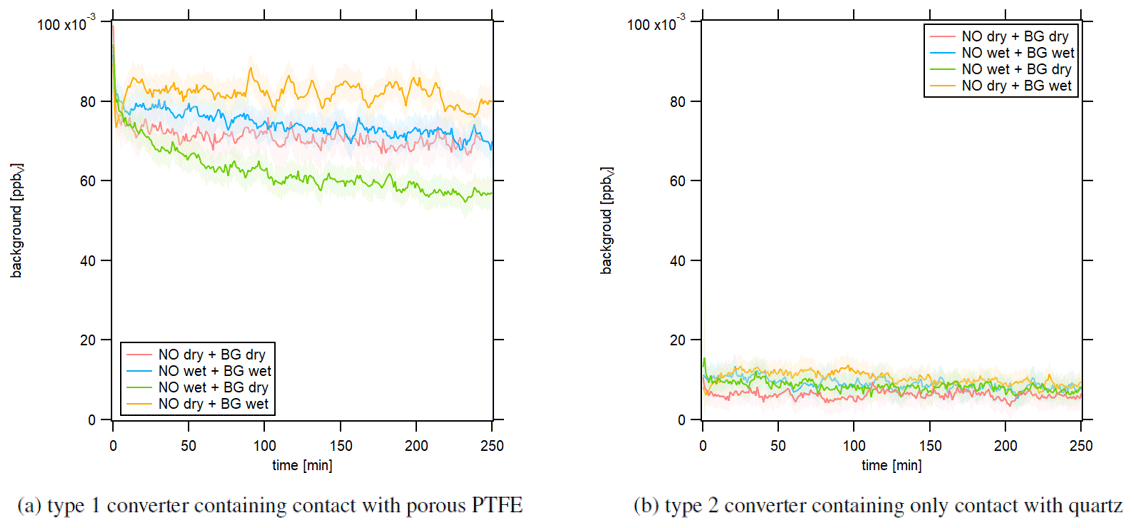
Figure 6Instrumental background in response to dry and humid conditions after 2 h of NO calibration at 15.8 ppbv in the NOc channel. The LEDs of the photolytic converter were switched on.
Figure 6 shows the temporal development of the instrumental background signal in the NOc channel after 2 h of NO measurement with a concentration of 15.8 ppbv. The red line shows the experiment under dry conditions, and the blue line presents the experiment under humid conditions. For the yellow line, we performed the NO measurement under dry conditions and the following instrumental background measurement under humid conditions. The green line shows a humid NO measurement and dry instrumental background measurement. Figure 6a presents the results obtained with the type 1 blue light converter. All experiments showed a decreasing instrumental background signal over time in the NOc channel. For comparison, the instrumental background signal in the NO channel over time is presented in Fig. S5. The lines show no significant trend over time. This indicates that the converter adsorbs NO molecules, for example during NO measurements, and desorbs them during zero air measurements. At t=0 min, the instrumental background signals for all experiments were approximately the same between 90 and 100 pptv but showed a different development over time. The strongest decline by around 25 % over 250 min was observed for a dry instrumental background measurement after a humid NO measurement (green curve). For the opposite case, a humid instrumental background measurement after a dry NO measurement, the signal decreased by around 5 % over the observed time period (yellow curve). Performing the whole experiment under dry or humid conditions (red and blue curve, respectively) had a similar outcome, with an instrumental background signal decrease of approximately 10 %. These observations indicate that the instrumental background measurements in the NOc channel, which were performed during CAFE Africa and used for the data processing according to Eq. (4), were consistently too high as they were only run for 2×1 min (per CB cycle) and therefore did not represent the actual instrumental background but an artifact signal. In the laboratory, we observed the strongest effect for a dry instrumental background measurement following a humid NO measurement, which was a likely scenario for the ambient monitoring during CAFE Africa as zero air for an instrumental background measurement was sampled from a gas cylinder (dry conditions) and the measured ambient concentration was subject to ambient meteorological conditions. This would explain the occurrence of negative NO2 concentrations obtained from CLD measurements as mentioned earlier. These experiments also suggest that water molecules might not just promote adsorptive or desorptive processes, but also participate in the surface allocation themselves and compete with NO. Following this hypothesis, the surface spaces would fill with NO during an NO measurement under dry conditions and with both NO and H2O molecules under wet conditions. A subsequent instrumental background measurement under dry conditions would then lead to NO (and possibly H2O) desorption. For a subsequent instrumental background measurement under humid conditions, H2O molecules could actively replace NO molecules because of their higher surface affinity, leading to a temporally longer “leakage” of NO and a slower decrease in the instrumental background signal. The described effect would be highest for a dry NO measurement, which gives the maximum NO surface coverage and a wet zero air measurement (yellow), while it would be lowest for the opposite case for which we observed the lowest instrumental background signal after 250 min (green). This hypothesis fits well with the observations during CAFE Africa presented in Sect. 3.1.3; we observed a sharp increase in the NO2 signal along with rapid increases in water vapor concentration. H2O molecules could replace adsorbed NO molecules (or other atmospheric compounds), which were detected by the CLD as an artifact signal. Because of the conversion efficiency of 24.4 % of the type 1 blue light converter, the signal difference from the NO and NOc channel was multiplied by a factor of around 4 (compare Eq. 4). Therefore, the resulting NO2 signal was distorted by 4 times the actual desorbed NO, explaining the large peaks accompanying altitude descents. As we do not observe these effects in the NO channel (and the two channels are structurally identical), we can exclude that any of the humidity effects are caused by components in the instrument other than the photolytic converter.
We repeated the same laboratory experiments using the type 2 photolytic converter. The resulting temporal development of the instrumental background is presented in Fig. 6b, which shows significant improvements compared to the type 1 converter. The instrumental background in the NOc channel was many times smaller for the type 2 quartz converter, with mixing ratios of around 10 to 15 pptv, and was, most importantly, constant over time. For stationary long-term experiments it could be possible to measure the instrumental background on the scale of hours. However, for aircraft measurements and the accompanying rapid air mass changes due to the high aircraft velocity, it is vital to obtain a reliable instrumental background measurement within a short time interval, which would be possible with the type 2 converter. Furthermore, changes in humidity did not seem to impact the measurement as all four experiments show the same result. This, too, suggests the suitability of the type 2 converter in aircraft measurements or more generally in field studies impacted by high and changing humidities.
Performing zero air measurements after NO2 measurements had a similar outcome for each of the applied converters. The instrumental background measurement in the type 1 blue light converter showed a decreasing trend over time, while it was constant and significantly smaller in the type 2 quartz converter.
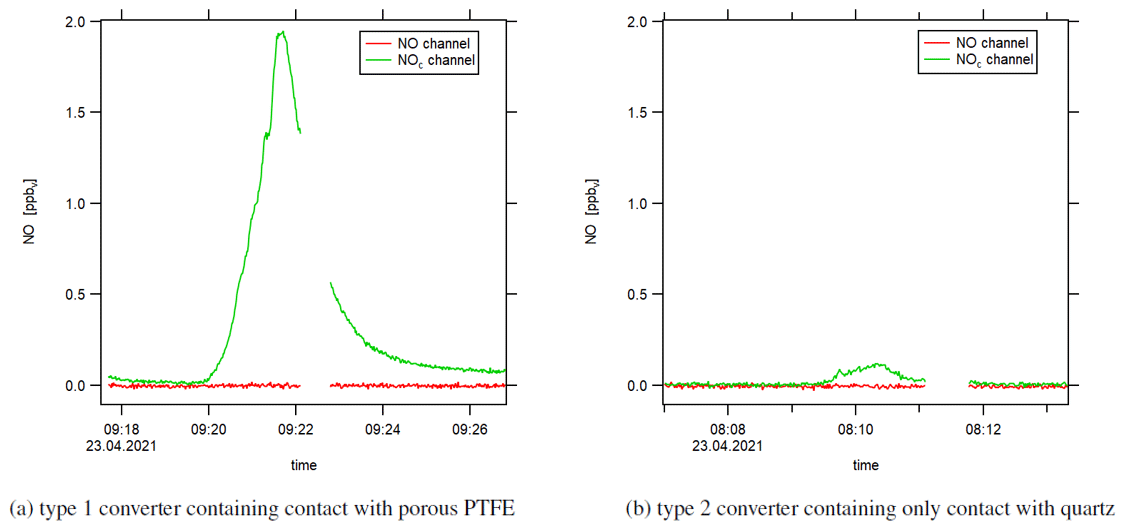
Figure 7Instrumental background (zero air measurement) when heating the switched-off photolytic converter with a heat gun. The small data gaps are due to pre-chamber measurements.
Our assumption that the observed effect is – at least partly – associated with NO molecules is supported by an experiment wherein we heated the type 1 blue light converter with switched-off LEDs with a heat gun and observed a sharp increase in the NOc channel during zero air measurement (following NO calibration measurement). The increase in temperature promoted the desorptive process and had to include NO molecules. Otherwise, the CLD would not have detected any increase in the signal as the converters' LEDs were switched off and NO2 could not form NO via the photolytic reaction. We show the result of the heating experiment in Fig. 7a. The converter surface was heated for 2 min (under constant movement of the heat gun) at a distance of around 10 cm during zero air measurement. We estimate the surface temperature to not have exceeded 200 ∘C. We observed a peak NO concentration of 2 ppbv (NOc instrumental background was 0 ppbv). In comparison, Fig. 7b shows the experiment repeated with the type 2 quartz converter, which showed a small increase in the NOc signal, too, but approximately 1 order of magnitude smaller compared to the type 1 blue light converter. The qualitative outcome of this experiment was the same with the LEDs switched on as well as with preceding NO2 (instead of NO) measurement. Please note that a direct comparison of experiments regarding adsorptive and desorptive processes with switched-on and -off LEDs is difficult because the operation of the LEDs increases the temperature within the converter, which, as shown above, strongly impacts the surface allocation.
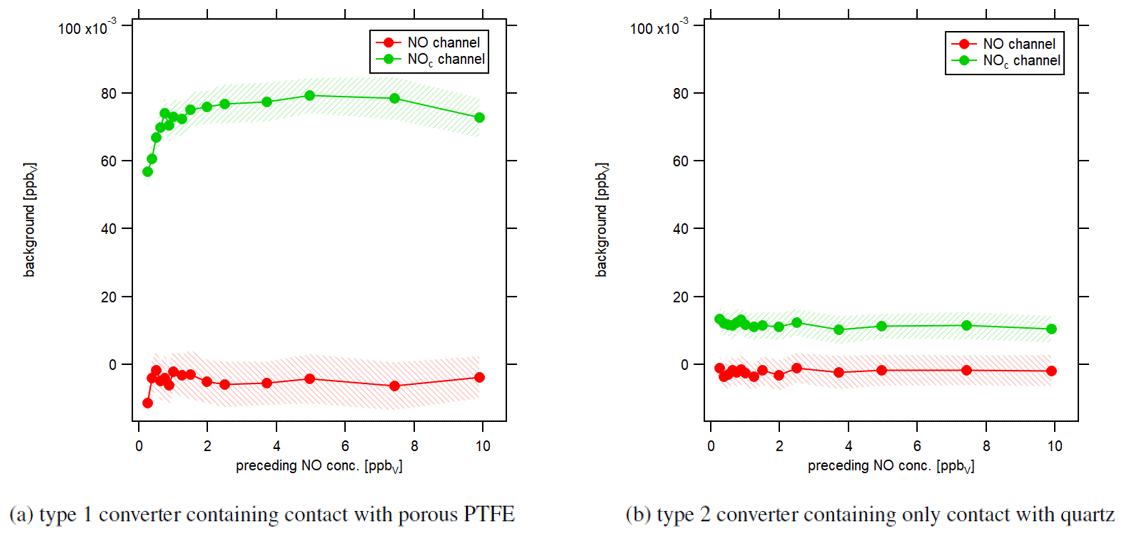
Figure 8Instrumental background in response to different preceding NO concentrations under dry conditions. Each data point shows the level of the signal of the first 5 min of instrumental background measurements after NO calibrations.
Beyond that, we performed an experiment to investigate how NO calibration measurements affect subsequent zero air measurements in response to different NO concentrations. Figure 8 shows the influence of the preceding NO concentration level on the following first 5 min of zero air measurement. We have performed 30 min NO calibrations with NO concentrations between 0.25 and 10 ppbv. Red data points represent the instrumental background of the NO channel, and green data points show the instrumental background of the NOc channel. Instrumental background concentrations in the NO channel were independent of preceding NO concentrations. In contrast, for the type 1 blue light converter, instrumental background concentrations in the NOc channel increased with increasing NO concentrations and leveled off for high values, as shown in Fig. 8a. Measured NO concentrations during CAFE Africa were between 0 and 1 ppbv and were therefore situated in the rising part of the curve. That shows that instrumental background measurements during CAFE Africa were not only too high, but also depended on the preceding NO concentration. We tried to retrospectively correct the NO2 data with a lower instrumental background as obtained from laboratory investigations after several hours of zero air sampling. However, it was not possible to quantify the effect of varying the preceding NO levels. Additionally, the impact of humidity had the exact opposite effect on the NO2 measurements. While the higher-than-actual instrumental background led to lower-than-actual NO2 concentrations, increases in humidity triggered higher-than-actual NO2 concentrations. Figure 8b shows that the development of the instrumental background in the NOc channel did not depend on the preceding NO concentrations for the type 2 quartz converter. The instrumental background was 12±1 pptv and constant over the whole experiment. The detected instrumental background signal for the NOc channel disappeared when switching off the light of the UV LEDs. A possible explanation can be a trace concentration of NO2 in the utilized synthetic air as mentioned earlier.
While we have shown above that NO and humidity strongly affect the instrumental background measurements in the type 1 blue light converter, it is likely that there are other factors contributing to the observed effects, too. When switching off the LEDs in the type 1 converter, the observed instrumental background decreased rapidly (too rapidly for a sole temperature effect), which we present in Fig. S6a. This suggests that the light of the LEDs impacts the instrumental background in the NOc channel. Many other compounds can be photolyzed to form NO, such as PAN, ClNO2 or BrONO2. However, their absorption cross sections suggest no interference at 397 nm, which is the spectral output maximum of the LEDs (Reed et al., 2016; Pollack et al., 2010). Only small interference could occur with HONO and NO3 at the edge of the spectral output, and this would require the presence of these compounds in the converter, which should not be the case for the described laboratory investigations but is conceivable given the memory effect observations. For comparison, Fig. S6b shows that the effect of switching the LEDs on and off during zero air measurement is marginal when using the type 2 quartz converter. We have performed an uptake experiment for HNO3 (nitric acid) to investigate the adsorptive capacity of the converters. HNO3 in zero air (2500 sccm) was first routed through a bypass, and after reaching a constant signal, the gas flow was changed to include the converter. The HNO3 concentration behind the converter was monitored via chemical ionization mass spectrometry (CIMS). Figure S7a and b show the resulting adsorption behavior for the type 1 and the type 2 converter, respectively. When directing the gas flow through the type 1 converter, the detected HNO3 flux decreased rapidly by around a factor of 4, and we did not observe the signal return to its initial value within 40 min (which is when we terminated the experiment). This indicates a high absorptive capacity or a decay of HNO3 in the converter (or both). Integration of the HNO3 flux shows that the converter took up approximately 1.7×10¹⁶ HNO3 molecules in the considered time frame. In contrast, for the type 2 converter, the HNO3 flux decreased, too, but returned to its initial value within 10 min, while it adsorbed only HNO3 molecules. The observed adsorption capacity can be minimized by coating the quartz surface with FEP (fluorinated ethylene propylene), which provides a highly hydrophobic surface (Neuman et al., 1999; Liebmann et al., 2017). The number of adsorbed HNO3 molecules was a factor of 4–5 smaller compared to the non-coated quartz converter (Fig. S7c). We did not observe any differences between the coated and non-coated quartz converter regarding the experiments investigating the role of NO and humidity presented above. This uptake experiment shows the high adsorptive capacity of the type 1 blue light converter in comparison to the type 2 quartz converter. In the case of HNO3, which could have been adsorbed by the type 1 converter, e.g., during stratospheric measurements, we hypothesize a potential source of NO or NO2 through, for example, surface-catalyzed chemistry, possibly involving the light of the LEDs or elevated temperature. Again, this experiment underlines the superiority of the type 2 quartz converter over the type 1 blue light converter and suggests applicability for ambient and airborne measurements.
In this study, we have investigated a modified conventional blue light converter (type 1) with a highly reflective and porous inner surface made from optical PTFE regarding its application during the research aircraft campaign CAFE Africa, which took place in August and September 2018 around Cabo Verde. We have identified a memory effect in the blue light converter, which is affected by humidity, especially rapid changes in water vapor concentrations, and preceding NO levels; this is particularly relevant for the low ratio in the upper troposphere. More specifically, this includes the subtraction of a fluctuating, higher-than-actual instrumental background in the NOc channel, yielding negative NO2 values and humidity-triggered spontaneous desorption of stored molecules appearing as large NO2 peaks; both effects are amplified by the low conversion efficiency. The high adsorptive capacity regarding other atmospheric trace gases such as HNO3 and the light of the LEDs could additionally play a role in the observed effects. Because of the complex correlations between these parameters it is not possible to retrospectively correct the NO2 signal measured during CAFE Africa to receive reliable data. If a conventional blue light converter is still in use, we would suggest avoiding constant altitude changes in aircraft applications. Instead, we highly recommend the application of an alternative photolytic converter made from quartz glass (type 2) in order to prevent the gas flow from coming into contact with the porous PTFE surface, which can additionally be coated with FEP to obtain highly hydrophobic properties. Laboratory results indicate a high suitability of the alternative converter in aircraft measurements, which, looking into the future, should be investigated in detail in order to improve in-field NO2 measurements. With an improved instrumental background, other important questions of current atmospheric NO2 research, such as deviations from photostationary-state NO2 in remote locations or interferences from NOy species, could be addressed and investigated more easily.
Data measured during the flight campaign CAFE Africa are available at https://keeper.mpdl.mpg.de (last access: 17 May 2021, registration required) to all scientists agreeing to the CAFE Africa data protocol.
The supplement related to this article is available online at: https://doi.org/10.5194/amt-14-6759-2021-supplement.
HF had the idea. CMN and HF designed the study. CMN analyzed the data and wrote the paper. CMN performed the laboratory experiments. CMN, UP and HF designed the type 2 quartz converter. IT provided CLD NOx, CO and CH4 data for CAFE Africa. Photolysis frequencies were received from BB. DM, MM, RR and HH measured and provided the OH and HO2 data. KP and FK measured and provided the NO2 miniDOAS data. FO measured and provided the O3 data. H2O data were received from MZ. RD and JNC measured and provided the PAN data. HF, JL and HH made a large contribution to the operation and planning of the aircraft campaign.
Hartwig Harder is a member of the editorial board of Atmospheric Measurement Techniques.
Publisher's note: Copernicus Publications remains neutral with regard to jurisdictional claims in published maps and institutional affiliations.
We acknowledge the collaboration with the DLR (German Aerospace Center) during CAFE Africa. This work was supported by the Max Planck Graduate Center with the Johannes Gutenberg-Universität Mainz (MPGC). Flora Kluge and Klaus Pfeilsticker acknowledge the support given by the Deutsche Forschungsgemeinschaft (DFG) through the projects PF 384-16, PF 384-17 and PF 384-19.
The article processing charges for this open-access publication were covered by the Max Planck Society.
This paper was edited by Keding Lu and reviewed by three anonymous referees.
Alam, M. S., Crilley, L. R., Lee, J. D., Kramer, L. J., Pfrang, C., Vázquez-Moreno, M., Ródenas, M., Muñoz, A., and Bloss, W. J.: Interference from alkenes in chemiluminescent NOx measurements, Atmos. Meas. Tech., 13, 5977–5991, https://doi.org/10.5194/amt-13-5977-2020, 2020. a
Andersen, S. T., Carpenter, L. J., Nelson, B. S., Neves, L., Read, K. A., Reed, C., Ward, M., Rowlinson, M. J., and Lee, J. D.: Long-term NOx measurements in the remote marine tropical troposphere, Atmos. Meas. Tech., 14, 3071–3085, https://doi.org/10.5194/amt-14-3071-2021, 2021. a, b, c
Atkinson, R., Baulch, D. L., Cox, R. A., Crowley, J. N., Hampson, R. F., Hynes, R. G., Jenkin, M. E., Rossi, M. J., and Troe, J.: Evaluated kinetic and photochemical data for atmospheric chemistry: Volume I - gas phase reactions of Ox, HOx, NOx and SOx species, Atmos. Chem. Phys., 4, 1461–1738, https://doi.org/10.5194/acp-4-1461-2004, 2004. a, b
Atkinson, R., Baulch, D. L., Cox, R. A., Crowley, J. N., Hampson, R. F., Hynes, R. G., Jenkin, M. E., Rossi, M. J., Troe, J., and IUPAC Subcommittee: Evaluated kinetic and photochemical data for atmospheric chemistry: Volume II – gas phase reactions of organic species, Atmos. Chem. Phys., 6, 3625–4055, https://doi.org/10.5194/acp-6-3625-2006, 2006. a
Bahta, A., Simonaitis, R., and Heicklen, J.: Thermal decomposition kinetics of methyl peroxynitrate (CH3O2NO2), J. Phys. Chem.-US, 86, 1849–1853, 1982. a
Bohn, B. and Lohse, I.: Calibration and evaluation of CCD spectroradiometers for ground-based and airborne measurements of spectral actinic flux densities, Atmos. Meas. Tech., 10, 3151–3174, https://doi.org/10.5194/amt-10-3151-2017, 2017. a
Boningari, T. and Smirniotis, P. G.: Impact of nitrogen oxides on the environment and human health: Mn-based materials for the NOx abatement, Curr. Opin. Chem. Eng., 13, 133–141, https://doi.org/10.1016/j.coche.2016.09.004, 2016. a
Bozem, H., Butler, T. M., Lawrence, M. G., Harder, H., Martinez, M., Kubistin, D., Lelieveld, J., and Fischer, H.: Chemical processes related to net ozone tendencies in the free troposphere, Atmos. Chem. Phys., 17, 10565–10582, https://doi.org/10.5194/acp-17-10565-2017, 2017. a, b
Breuninger, C., Meixner, F. X., and Kesselmeier, J.: Field investigations of nitrogen dioxide (NO2) exchange between plants and the atmosphere, Atmos. Chem. Phys., 13, 773–790, https://doi.org/10.5194/acp-13-773-2013, 2013. a
Browne, E. C., Perring, A. E., Wooldridge, P. J., Apel, E., Hall, S. R., Huey, L. G., Mao, J., Spencer, K. M., Clair, J. M. St., Weinheimer, A. J., Wisthaler, A., and Cohen, R. C.: Global and regional effects of the photochemistry of CH3O2NO2: evidence from ARCTAS, Atmos. Chem. Phys., 11, 4209–4219, https://doi.org/10.5194/acp-11-4209-2011, 2011. a
Clough, P. and Thrush, B. A.: Mechanism of chemiluminescent reaction between nitric oxide and ozone, T. Faraday Soc., 63, 915–925, https://doi.org/10.1039/TF9676300915, 1967. a
Crowley, J. N., Schuster, G., Pouvesle, N., Parchatka, U., Fischer, H., Bonn, B., Bingemer, H., and Lelieveld, J.: Nocturnal nitrogen oxides at a rural mountain-site in south-western Germany, Atmos. Chem. Phys., 10, 2795–2812, https://doi.org/10.5194/acp-10-2795-2010, 2010. a
Demerjian, K. L.: A review of national monitoring networks in North America, Atmos. Environ., 34, 1861–1884, https://doi.org/10.1016/S1352-2310(99)00452-5, 2000. a
ECO PHYSICS AG: CLD 790 SR User-Manual, Dürnten, Switzerland, 2002. a
Fischer, E. V., Jacob, D. J., Yantosca, R. M., Sulprizio, M. P., Millet, D. B., Mao, J., Paulot, F., Singh, H. B., Roiger, A., Ries, L., Talbot, R. W., Dzepina, K., and Pandey Deolal, S.: Atmospheric peroxyacetyl nitrate (PAN): a global budget and source attribution, Atmos. Chem. Phys., 14, 2679–2698, https://doi.org/10.5194/acp-14-2679-2014, 2014. a
Frey, M. M., Roscoe, H. K., Kukui, A., Savarino, J., France, J. L., King, M. D., Legrand, M., and Preunkert, S.: Atmospheric nitrogen oxides (NO and NO2) at Dome C, East Antarctica, during the OPALE campaign, Atmos. Chem. Phys., 15, 7859–7875, https://doi.org/10.5194/acp-15-7859-2015, 2015. a
Fuchs, H., Ball, S. M., Bohn, B., Brauers, T., Cohen, R. C., Dorn, H.-P., Dubé, W. P., Fry, J. L., Häseler, R., Heitmann, U., Jones, R. L., Kleffmann, J., Mentel, T. F., Müsgen, P., Rohrer, F., Rollins, A. W., Ruth, A. A., Kiendler-Scharr, A., Schlosser, E., Shillings, A. J. L., Tillmann, R., Varma, R. M., Venables, D. S., Villena Tapia, G., Wahner, A., Wegener, R., Wooldridge, P. J., and Brown, S. S.: Intercomparison of measurements of NO2 concentrations in the atmosphere simulation chamber SAPHIR during the NO3Comp campaign, Atmos. Meas. Tech., 3, 21–37, https://doi.org/10.5194/amt-3-21-2010, 2010. a
Ganzeveld, L., Lelieveld, J., Dentener, F., Krol, M., Bouwman, A., and Roelofs, G.-J.: Global soil-biogenic NOx emissions and the role of canopy processes, J. Geophys. Res.-Atmos., 107, ACH–9, https://doi.org/10.1029/2001JD000684, 2002. a
Ge, B., Sun, Y., Liu, Y., Dong, H., Ji, D., Jiang, Q., Li, J., and Wang, Z.: Nitrogen dioxide measurement by cavity attenuated phase shift spectroscopy (CAPS) and implications in ozone production efficiency and nitrate formation in Beijing, China, J. Geophys. Res.-Atmos., 118, 9499–9509, https://doi.org/10.1002/jgrd.50757, 2013. a
Gingerysty, N. J., Odame-Ankrah, C. A., Jordan, N., and Osthoff, H. D.: Interference from HONO in the measurement of ambient air NO2 via photolytic conversion and quantification of NO, J. Environ. Sci., 107, 184–193, https://doi.org/10.1016/j.jes.2020.12.011, 2021. a
Greaver, T. L., Sullivan, T. J., Herrick, J. D., Barber, M. C., Baron, J. S., Cosby, B. J., Deerhake, M. E., Dennis, R. L., Dubois, J.-J. B., Goodale, C. L., Herlihy, A. T., Lawrence, G. B., Liu, L., Lynch, J. A., and Novak, K. J.: Ecological effects of nitrogen and sulfur air pollution in the US: what do we know?, Front. Ecol. Environ., 10, 365–372, https://doi.org/10.1890/110049, 2012. a
Griffin, R. J., Beckman, P. J., Talbot, R. W., Sive, B. C., and Varner, R. K.: Deviations from ozone photostationary state during the International Consortium for Atmospheric Research on Transport and Transformation 2004 campaign: Use of measurements and photochemical modeling to assess potential causes, J. Geophys. Res.-Atmos., 112, D10S07, https://doi.org/10.1029/2006JD007604, 2007. a
Hosaynali Beygi, Z., Fischer, H., Harder, H. D., Martinez, M., Sander, R., Williams, J., Brookes, D. M., Monks, P. S., and Lelieveld, J.: Oxidation photochemistry in the Southern Atlantic boundary layer: unexpected deviations of photochemical steady state, Atmos. Chem. Phys., 11, 8497–8513, https://doi.org/10.5194/acp-11-8497-2011, 2011. a
Hüneke, T., Aderhold, O.-A., Bounin, J., Dorf, M., Gentry, E., Grossmann, K., Grooß, J.-U., Hoor, P., Jöckel, P., Kenntner, M., Knapp, M., Knecht, M., Lörks, D., Ludmann, S., Matthes, S., Raecke, R., Reichert, M., Weimar, J., Werner, B., Zahn, A., Ziereis, H., and Pfeilsticker, K.: The novel HALO mini-DOAS instrument: inferring trace gas concentrations from airborne UV/visible limb spectroscopy under all skies using the scaling method, Atmos. Meas. Tech., 10, 4209–4234, https://doi.org/10.5194/amt-10-4209-2017, 2017. a, b
IUPAC Task Group on Atmospheric Chemical Kinetic Data Evaluation: Evaluated Kinetic Data, available at: http://iupac.pole-ether.fr, last access: 2 February 2021. a, b
Jacob, D. J.: Introduction to atmospheric chemistry, Princeton University Press, Princeton, USA, 1999. a
Javed, U., Kubistin, D., Martinez, M., Pollmann, J., Rudolf, M., Parchatka, U., Reiffs, A., Thieser, J., Schuster, G., Horbanski, M., Pöhler, D., Crowley, J. N., Fischer, H., Lelieveld, J., and Harder, H.: Laser-induced fluorescence-based detection of atmospheric nitrogen dioxide and comparison of different techniques during the PARADE 2011 field campaign, Atmos. Meas. Tech., 12, 1461–1481, https://doi.org/10.5194/amt-12-1461-2019, 2019. a
Jordan, N., Garner, N. M., Matchett, L. C., Tokarek, T. W., Osthoff, H. D., Odame-Ankrah, C. A., Grimm, C. E., Pickrell, K. N., Swainson, C., and Rosentreter, B. W.: Potential interferences in photolytic nitrogen dioxide converters for ambient air monitoring: Evaluation of a prototype, J. Air Waste Manage., 70, 753–764, https://doi.org/10.1080/10962247.2020.1769770, 2020. a, b
Jung, J., Lee, J., Kim, B., and Oh, S.: Seasonal variations in the NO2 artifact from chemiluminescence measurements with a molybdenum converter at a suburban site in Korea (downwind of the Asian continental outflow) during 2015–2016, Atmos. Environ., 165, 290–300, https://doi.org/10.1016/j.atmosenv.2017.07.010, 2017. a, b
Kaufmann, S., Voigt, C., Heller, R., Jurkat-Witschas, T., Krämer, M., Rolf, C., Zöger, M., Giez, A., Buchholz, B., Ebert, V., Thornberry, T., and Schumann, U.: Intercomparison of midlatitude tropospheric and lower-stratospheric water vapor measurements and comparison to ECMWF humidity data, Atmos. Chem. Phys., 18, 16729–16745, https://doi.org/10.5194/acp-18-16729-2018, 2018. a
Kebabian, P. L., Herndon, S. C., and Freedman, A.: Detection of nitrogen dioxide by cavity attenuated phase shift spectroscopy, Anal. Chem., 77, 724–728, https://doi.org/10.1021/ac048715y, 2005. a
Kim, S., Huey, L. G., Stickel, R., Tanner, D., Crawford, J. H., Olson, J. R., Chen, G., Brune, W., Ren, X., Lesher, R., Wooldridge, P. J., Bertram, T. H., Perring, A., Cohen, R. C., Lefer, B. L., Shetter, R. E., Avery, M., Diskin, G., and Sokolik, I.: Measurement of HO2NO2 in the free troposphere during the Intercontinental Chemical Transport Experiment–North America 2004, J. Geophys. Res.-Atmos., 112, https://doi.org/10.1029/2006JD007676, 2007. a
Kluge, F., Hüneke, T., Knecht, M., Lichtenstern, M., Rotermund, M., Schlager, H., Schreiner, B., and Pfeilsticker, K.: Profiling of formaldehyde, glyoxal, methylglyoxal, and CO over the Amazon: normalized excess mixing ratios and related emission factors in biomass burning plumes, Atmos. Chem. Phys., 20, 12363–12389, https://doi.org/10.5194/acp-20-12363-2020, 2020. a
Lee, J., Moller, S., Read, K., Lewis, A., Mendes, L., and Carpenter, L.: Year-round measurements of nitrogen oxides and ozone in the tropical North Atlantic marine boundary layer, J. Geophys. Res., 114, D21302, https://doi.org/10.1029/2009JD011878, 2009. a
Leighton, P.: Photochemistry of air pollution, Academic Press, Inc., New York, USA, 1961. a, b
Lelieveld, J. and Dentener, F. J.: What controls tropospheric ozone?, J. Geophys. Res.-Atmos., 105, 3531–3551, 2000. a
Levy, H.: Normal atmosphere: Large radical and formaldehyde concentrations predicted, Science, 173, 141–143, https://doi.org/10.1126/science.173.3992.141, 1971. a
Liebmann, J. M., Schuster, G., Schuladen, J. B., Sobanski, N., Lelieveld, J., and Crowley, J. N.: Measurement of ambient NO3 reactivity: design, characterization and first deployment of a new instrument, Atmos. Meas. Tech., 10, 1241–1258, https://doi.org/10.5194/amt-10-1241-2017, 2017. a
Lippmann, M.: Health effects of ozone a critical review, JAPCA J. Air Waste Ma., 39, 672–695, https://doi.org/10.1080/08940630.1989.10466554, 1989. a
Logan, J. A.: Nitrogen oxides in the troposphere: Global and regional budgets, J. Geophys. Res.-Oceans, 88, 10785–10807, https://doi.org/10.1029/JC088iC15p10785, 1983. a
Logan, J. A., Prather, M. J., Wofsy, S. C., and McElroy, M. B.: Tropospheric chemistry: A global perspective, J. Geophys. Res.-Oceans, 86, 7210–7254, https://doi.org/10.1029/JC086iC08p07210, 1981. a
Ma, Y., Lu, K., Chou, C. C.-K., Li, X., and Zhang, Y.: Strong deviations from the NO–NO2–O3 photostationary state in the Pearl River Delta: Indications of active peroxy radical and chlorine radical chemistry, Atmos. Environ., 163, 22–34, https://doi.org/10.1016/j.atmosenv.2017.05.012, 2017. a
Mannschreck, K., Gilge, S., Plass-Duelmer, C., Fricke, W., and Berresheim, H.: Assessment of the applicability of NO–NO2O3 photostationary state to long-term measurements at the Hohenpeissenberg GAW Station, Germany, Atmos. Chem. Phys., 4, 1265–1277, https://doi.org/10.5194/acp-4-1265-2004, 2004. a
Marno, D., Ernest, C., Hens, K., Javed, U., Klimach, T., Martinez, M., Rudolf, M., Lelieveld, J., and Harder, H.: Calibration of an airborne HOx instrument using the All Pressure Altitude-based Calibrator for HOx Experimentation (APACHE), Atmos. Meas. Tech., 13, 2711–2731, https://doi.org/10.5194/amt-13-2711-2020, 2020. a
Murphy, J. G., Thornton, J. A., Wooldridge, P. J., Day, D. A., Rosen, R. S., Cantrell, C., Shetter, R. E., Lefer, B., and Cohen, R. C.: Measurements of the sum of HO2NO2 and CH3O2NO2 in the remote troposphere, Atmos. Chem. Phys., 4, 377–384, https://doi.org/10.5194/acp-4-377-2004, 2004. a, b, c
Nault, B. A., Garland, C., Pusede, S. E., Wooldridge, P. J., Ullmann, K., Hall, S. R., and Cohen, R. C.: Measurements of CH3O2NO2 in the upper troposphere, Atmos. Meas. Tech., 8, 987–997, https://doi.org/10.5194/amt-8-987-2015, 2015. a, b, c
Neuman, J., Huey, L., Ryerson, T., and Fahey, D.: Study of inlet materials for sampling atmospheric nitric acid, Environ. Sci. Technol., 33, 1133–1136, https://doi.org/10.1021/es980767f, 1999. a
Novelli, A., Hens, K., Tatum Ernest, C., Kubistin, D., Regelin, E., Elste, T., Plass-Dülmer, C., Martinez, M., Lelieveld, J., and Harder, H.: Characterisation of an inlet pre-injector laser-induced fluorescence instrument for the measurement of atmospheric hydroxyl radicals, Atmos. Meas. Tech., 7, 3413–3430, https://doi.org/10.5194/amt-7-3413-2014, 2014. a
Nussbaumer, C. M. and Cohen, R. C.: The Role of Temperature and NOx in Ozone Trends in the Los Angeles Basin, Environ. Sci. Technol., 54, 15652–15659, https://doi.org/10.1021/acs.est.0c04910, 2020. a
Nussbaumer, C. M., Tadic, I., Dienhart, D., Wang, N., Edtbauer, A., Ernle, L., Williams, J., Obersteiner, F., Gutiérrez-Álvarez, I., Harder, H., Lelieveld, J., and Fischer, H.: Measurement report: In situ observations of deep convection without lightning during the tropical cyclone Florence 2018, Atmos. Chem. Phys., 21, 7933–7945, https://doi.org/10.5194/acp-21-7933-2021, 2021. a
Nuvolone, D., Petri, D., and Voller, F.: The effects of ozone on human health, Environ. Sci. Pollut. R., 25, 8074–8088, https://doi.org/10.1007/s11356-017-9239-3, 2018. a
O'Keefe, A. and Deacon, D. A.: Cavity ring-down optical spectrometer for absorption measurements using pulsed laser sources, Rev. Sci. Instrum., 59, 2544–2551, https://doi.org/10.1063/1.1139895, 1988. a
Phillips, G. J., Pouvesle, N., Thieser, J., Schuster, G., Axinte, R., Fischer, H., Williams, J., Lelieveld, J., and Crowley, J. N.: Peroxyacetyl nitrate (PAN) and peroxyacetic acid (PAA) measurements by iodide chemical ionisation mass spectrometry: first analysis of results in the boreal forest and implications for the measurement of PAN fluxes, Atmos. Chem. Phys., 13, 1129–1139, https://doi.org/10.5194/acp-13-1129-2013, 2013. a
Pollack, I. B., Lerner, B. M., and Ryerson, T. B.: Evaluation of ultraviolet light-emitting diodes for detection of atmospheric NO2 by photolysis-chemiluminescence, J. Atmos. Chem., 65, 111–125, https://doi.org/10.1007/s10874-011-9184-3, 2010. a, b, c, d
Pusede, S. E., Steiner, A. L., and Cohen, R. C.: Temperature and recent trends in the chemistry of continental surface ozone, Chem. Rev., 115, 3898–3918, https://doi.org/10.1021/cr5006815, 2015. a
Reed, C., Evans, M. J., Di Carlo, P., Lee, J. D., and Carpenter, L. J.: Interferences in photolytic NO2 measurements: explanation for an apparent missing oxidant?, Atmos. Chem. Phys., 16, 4707–4724, https://doi.org/10.5194/acp-16-4707-2016, 2016. a, b, c, d, e, f, g, h, i, j
Reidmiller, D. R., Jaffe, D. A., Fischer, E. V., and Finley, B.: Nitrogen oxides in the boundary layer and free troposphere at the Mt. Bachelor Observatory, Atmos. Chem. Phys., 10, 6043–6062, https://doi.org/10.5194/acp-10-6043-2010, 2010. a
Ridley, B. and Howlett, L.: An instrument for nitric oxide measurements in the stratosphere, Rev. Sci. Instrum., 45, 742–746, https://doi.org/10.1063/1.1686726, 1974. a
Ryerson, T., Williams, E., and Fehsenfeld, F.: An efficient photolysis system for fast-response NO2 measurements, J. Geophys. Res.-Atmos., 105, 26447–26461, https://doi.org/10.1029/2000JD900389, 2000. a, b
Sadanaga, Y., Fukumori, Y., Kobashi, T., Nagata, M., Takenaka, N., and Bandow, H.: Development of a selective light-emitting diode photolytic NO2 converter for continuously measuring NO2 in the atmosphere, Anal. Chem., 82, 9234–9239, https://doi.org/10.1021/ac101703z, 2010. a
Sather, M. E., Slonecker, E. T., Kronmiller, K. G., Williams, D. D., Daughtrey, H., and Mathew, J.: Evaluation of short-term Ogawa passive, photolytic, and federal reference method sampling devices for nitrogen oxides in El Paso and Houston, Texas, J. Environ. Monitor., 8, 558–563, https://doi.org/10.1039/b601113f, 2006. a
Schiller, C., Bozem, H., Gurk, C., Parchatka, U., Königstedt, R., Harris, G., Lelieveld, J., and Fischer, H.: Applications of quantum cascade lasers for sensitive trace gas measurements of CO, CH4, N2O and HCHO, Appl. Phys. B-Lasers O., 92, 419–430, 2008. a
Silvern, R., Jacob, D., Travis, K., Sherwen, T., Evans, M., Cohen, R., Laughner, J., Hall, S., Ullmann, K., Crounse, J., Wennberg, P. O., Peischl, J., and Pollack, I. B.: Observed NO/NO2 ratios in the upper troposphere imply errors in NO–NO2–O3 cycling kinetics or an unaccounted NOx reservoir, Geophys. Res. Lett., 45, 4466–4474, https://doi.org/10.1029/2018GL077728, 2018. a, b
SphereOptics GmbH: Introduction Diffuse Reflecting Materials, available at: https://sphereoptics.de/en/product/introduction-diffuse-reflecting-materials/?gclid=EAIaIQobChMI9cGJkfH87AIVjql
3Ch2jMQ0TEAAYASAAEgJSyvD_BwE (last access: 2 February 2021), 2017. a
Tadic, I.: Photochemical studies on low- and high-NOx regimes with respect to ozone formation during AQABA and CAFE-Africa, PhD thesis, Mainz, Germany, 2021. a
Tadic, I., Crowley, J. N., Dienhart, D., Eger, P., Harder, H., Hottmann, B., Martinez, M., Parchatka, U., Paris, J.-D., Pozzer, A., Rohloff, R., Schuladen, J., Shenolikar, J., Tauer, S., Lelieveld, J., and Fischer, H.: Net ozone production and its relationship to nitrogen oxides and volatile organic compounds in the marine boundary layer around the Arabian Peninsula, Atmos. Chem. Phys., 20, 6769–6787, https://doi.org/10.5194/acp-20-6769-2020, 2020. a, b, c, d, e
Tadic, I., Nussbaumer, C. M., Bohn, B., Harder, H., Marno, D., Martinez, M., Obersteiner, F., Parchatka, U., Pozzer, A., Rohloff, R., Zöger, M., Lelieveld, J., and Fischer, H.: Central role of nitric oxide in ozone production in the upper tropical troposphere over the Atlantic Ocean and western Africa, Atmos. Chem. Phys., 21, 8195–8211, https://doi.org/10.5194/acp-21-8195-2021, 2021. a, b, c, d
Thornton, J. A., Wooldridge, P. J., and Cohen, R. C.: Atmospheric NO2: In situ laser-induced fluorescence detection at parts per trillion mixing ratios, Anal. Chem., 72, 528–539, https://doi.org/10.1021/ac9908905, 2000. a
Travis, K. R., Jacob, D. J., Fisher, J. A., Kim, P. S., Marais, E. A., Zhu, L., Yu, K., Miller, C. C., Yantosca, R. M., Sulprizio, M. P., Thompson, A. M., Wennberg, P. O., Crounse, J. D., St. Clair, J. M., Cohen, R. C., Laughner, J. L., Dibb, J. E., Hall, S. R., Ullmann, K., Wolfe, G. M., Pollack, I. B., Peischl, J., Neuman, J. A., and Zhou, X.: Why do models overestimate surface ozone in the Southeast United States?, Atmos. Chem. Phys., 16, 13561–13577, https://doi.org/10.5194/acp-16-13561-2016, 2016. a
Ventrillard, I., Gorrotxategi-Carbajo, P., and Romanini, D.: Part per trillion nitric oxide measurement by optical feedback cavity-enhanced absorption spectroscopy in the mid-infrared, Appl. Phys. B-Lasers O., 123, 1–8, https://doi.org/10.1007/s00340-017-6750-7, 2017. a
Veres, P. R., Roberts, J. M., Wild, R. J., Edwards, P. M., Brown, S. S., Bates, T. S., Quinn, P. K., Johnson, J. E., Zamora, R. J., and de Gouw, J.: Peroxynitric acid (HO2NO2) measurements during the UBWOS 2013 and 2014 studies using iodide ion chemical ionization mass spectrometry, Atmos. Chem. Phys., 15, 8101–8114, https://doi.org/10.5194/acp-15-8101-2015, 2015. a
Villena, G., Bejan, I., Kurtenbach, R., Wiesen, P., and Kleffmann, J.: Interferences of commercial NO2 instruments in the urban atmosphere and in a smog chamber, Atmos. Meas. Tech., 5, 149–159, https://doi.org/10.5194/amt-5-149-2012, 2012. a
Westfalen Gas Schweiz GmbH: Synth. Luft, KW frei T50 MFl, https://shop.westfalen.com/ch/de/Home/Gase/Sondergase/Synthetische-Luft-KW-frei/p/S09110150, last access: 26 March 2021. a
Winer, A. and Biermann, H.: Long pathlength differential optical absorption spectroscopy (DOAS) measurements of gaseous HONO, NO2 and HCNO in the California South Coast Air Basin, Res. Chem. Intermediat., 20, 423–445, 1994. a
Xu, Z., Wang, T., Xue, L., Louie, P. K., Luk, C. W., Gao, J., Wang, S., Chai, F., and Wang, W.: Evaluating the uncertainties of thermal catalytic conversion in measuring atmospheric nitrogen dioxide at four differently polluted sites in China, Atmos. Environ., 76, 221–226, https://doi.org/10.1016/j.atmosenv.2012.09.043, 2013. a
Zahn, A., Weppner, J., Widmann, H., Schlote-Holubek, K., Burger, B., Kühner, T., and Franke, H.: A fast and precise chemiluminescence ozone detector for eddy flux and airborne application, Atmos. Meas. Tech., 5, 363–375, https://doi.org/10.5194/amt-5-363-2012, 2012. a
Zheng, K., Zheng, C., Zhang, Y., Wang, Y., and Tittel, F. K.: Review of incoherent broadband cavity-enhanced absorption spectroscopy (IBBCEAS) for gas sensing, Sensors, 18, 3646, https://doi.org/10.3390/s18113646, 2018. a