the Creative Commons Attribution 4.0 License.
the Creative Commons Attribution 4.0 License.
 | 27 Oct 2021
On the use of reference mass spectra for reducing uncertainty in source apportionment of solid-fuel burning in ambient organic aerosol
Chunshui Lin
Darius Ceburnis
Anna Trubetskaya
William Smith
Stig Hellebust
John Wenger
Colin O'Dowd
Jurgita Ovadnevaite
Reference mass spectra are routinely used to facilitate source apportionment of ambient organic aerosol (OA) measured by aerosol mass spectrometers. However, source apportionment of solid-fuel-burning emissions can be complicated by the use of different fuels, stoves, and burning conditions. In this study, the organic aerosol mass spectra produced from burning a range of solid fuels in several heating stoves have been compared using an aerosol chemical speciation monitor (ACSM). The same samples of biomass briquettes and smokeless coal were burnt in a conventional stove and Ecodesign stove (Ecodesign refers to a stove conforming to EU Directive 2009/125/EC), while different batches of wood, peat, and smoky coal were also burnt in the conventional stove, and the OA mass spectra were compared to those previously obtained using a boiler stove. The results show that although certain ions (e.g., 60) remain important markers for solid-fuel burning, the peak intensities obtained at specific values in the normalized mass spectra were not constant with variations ranging from < 5 % to > 100 %. Using the OA mass spectra of peat, wood, and coal as anchoring profiles and the variation of individual values for the upper/lower limits (the limits approach) in the positive matrix factorization (PMF) analysis with the Multilinear Engine algorithm (ME-2), the respective contributions of these fuels to ambient submicron aerosols during a winter period in Dublin, Ireland, were evaluated and compared with the conventional a-value approach. The ME-2 solution was stable for the limits approach with uncertainties in the range of 2 %–7 %, while relatively large uncertainties (8 %–29 %) were found for the a-value approach. Nevertheless, both approaches showed good agreement overall, with the burning of peat (39 % vs. 41 %) and wood (14 % vs. 11 %) accounting for the majority of ambient organic aerosol during polluted evenings, despite their small uses compared to electricity and gas. This study, thus, accounts for the source variability in ME-2 modelling and provides better constraints on the primary factor contributions to the ambient organic aerosol estimations. The finding from this study has significant implications for public health and policymakers considering that it is often the case that different batches of solid fuels are often burnt in different stoves in real-world applications.
- Article
(2238 KB) - Full-text XML
-
Supplement
(641 KB) - BibTeX
- EndNote


Aerosol particles adversely affect human health and play an important role in the climate system (Fuzzi et al., 2015; Hallquist et al., 2009; Zhang et al., 2015). A better understanding of their sources is crucial to develop cost-effective air quality control strategies, as well as to better constrain their corresponding climate effects (An et al., 2019; Shrivastava et al., 2017). Aerosols can be broadly categorized into primary aerosols, which are directly emitted from sources such as biomass and fossil-fuel burning, and secondary aerosols, which are formed in the atmosphere from precursor gases, such as volatile organic compounds, ammonia, sulfur, and nitrogen dioxide. Organic aerosol (OA) is a major component of ambient particulate levels in the atmosphere, and the aerosol chemical speciation monitor (ACSM) is regularly used to quantitatively evaluate the contribution of its various primary and secondary sources. This approach to OA source apportionment uses receptor models such as positive matrix factorization (PMF) with the Multilinear Engine algorithm (ME-2) (Canonaco et al., 2013; Canonaco et al., 2015; Paatero, 1997, 1999). However, the selection of reference OA mass spectra or profiles in the ME-2 modelling can be a significant source of uncertainty (Canonaco et al., 2013; Lanz et al., 2008). Using reference profiles that are representative of specific local sources can reduce the uncertainty of source apportionment (Lin et al., 2017), while the use of more generic profiles from the literature can sometimes cause substantial uncertainty (Hopke, 2016). However, even for local sources, the profiles of the emissions may vary significantly, e.g., for biomass burning due to the use of different fuels, stoves, and burning conditions, causing uncertainty in the ME-2-based source apportionment.
Residential solid-fuel burning, such as biomass burning and coal combustion, has been reported to be an important source of particulate pollution, affecting local and regional air quality in both developing and developed countries across the world (Crippa et al., 2014; Li et al., 2017). Dublin is a moderately sized city in western Europe with a population of around 1 million. Recent studies in Dublin show that residential burning of solid fuels – mainly peat and wood but also coal to a lesser degree – is a significant source of ambient organic aerosol (OA) during the heating season (Lin et al., 2019, 2018). In a case study, Lin et al. (2018) show residential heating and particularly peat and wood burning caused an extraordinarily high concentration (over 300 µg m−3) of submicron aerosol, affecting air quality on a local to regional scale in suburban Dublin. Source attribution of the measured OA to different types of solid fuels was performed using reference profiles from locally sourced fuels (Lin et al., 2017) as the anchoring profiles in the ME-2 modelling (i.e., the a-value approach; Canonaco et al., 2013). The reference profiles for solid fuels was obtained from a combustion experiment using a boiler stove with no emission control (Lin et al., 2017). However, the questions remain on how these reference profiles vary with stove type and what uncertainties this variation causes in the ME-2 modelling.
In this study, mass spectral signatures of OA emissions from combustion of the same batch of wood, peat, smoky coal, biomass briquettes, and smokeless coal in two different heating stoves – a conventional stove and an Ecodesign stove (Trubetskaya et al., 2021) – were characterized using an ACSM. The corresponding implications for ambient OA source apportionment are discussed. Moreover, through comparison with a different batch of wood, peat, and smoky coal combusted in a boiler stove (Lin et al., 2017), the variation of the source profiles for these solid fuels was further characterized. The obtained source profiles were subsequently used as upper/lower limits (i.e., the limits approach) in the ME-2 modelling of ambient OA in Dublin from 1 November 2016 to 31 January 2017 and compared with the a-value approach (Canonaco et al., 2013). This enabled determination of the contribution of peat, wood, and coal burning to ambient OA, as well as the corresponding uncertainties.
Table 1Fuel types and stove types that were included in the combustion experiments.
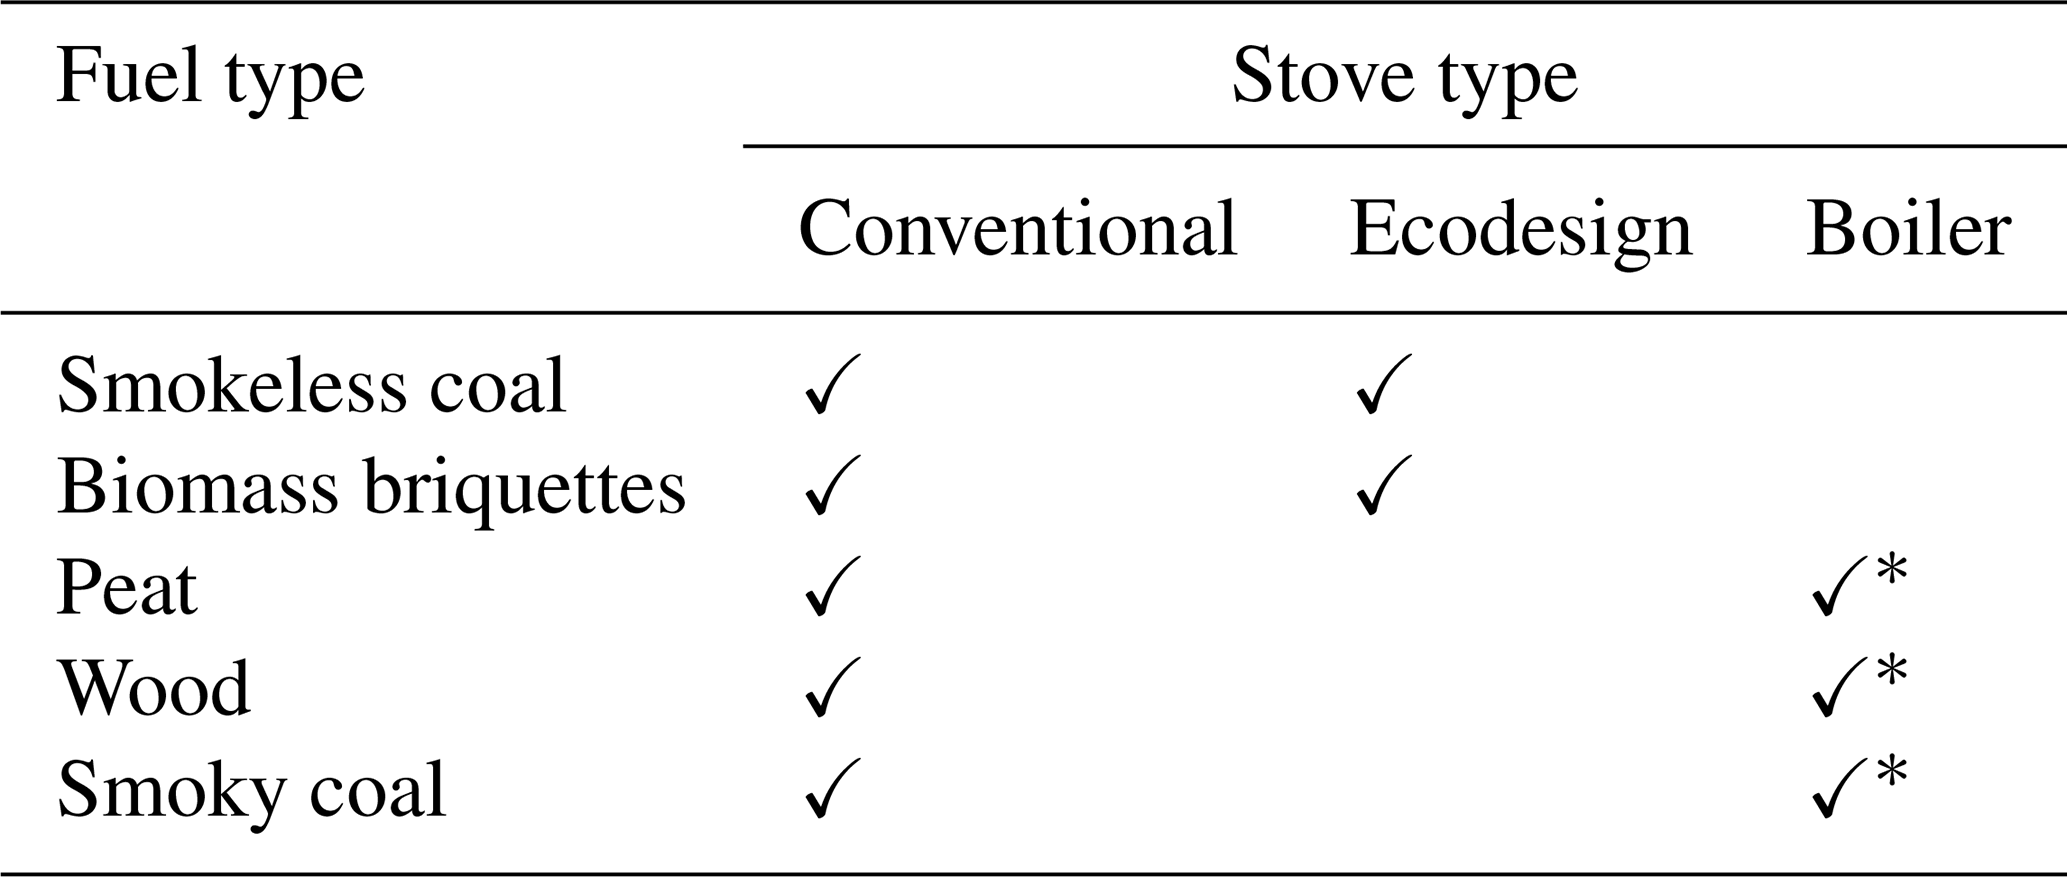
∗ A different batch of fuel was tested.
2.1 Combustion experiments
Two different testing stoves – a conventional stove and an Ecodesign stove – were used for the burning experiments in this study (Schematic S1 in the Supplement). The description of the stoves and experimental setup are detailed in Trubetskaya et al. (2021). Briefly, the conventional stove uses a primary air supply through an inlet below the door of the stove, while the Ecodesign stove draws both primary and secondary air through two valves on the rear side of the stove. Five fuel types were tested including wood, peat, smoky coal, biomass briquettes, and smokeless coal (Table 1). Specifically, wood logs were cut from softwood grown in Ireland; peat was obtained from the peatland in Leitrim, Ireland, and was naturally dried before testing; smoky coal (Silesia, Poland) was purchased from local retail outlets (Trubetskaya et al., 2021); and biomass briquettes and smokeless coal (i.e., Ecobrite ovoids) were manufactured at Arigna Fuels (Carrick-on-Shannon, Ireland). For each burning experiment, 3.5 kg of the test fuel was placed in the stove, and 100 g of firelighters (Tesco Ireland) were used to ignite the solid fuels. In order to avoid sampling of aerosol emissions from firelighter burning, the ACSM measurements were not started until the firelighters were burnt out (15 min after ignition). The combustion experiment lasted 1–3 h depending on the fuel and stove types. The time resolution of ACSM was set to 2 min to capture the variation of the combustion emission. The stove was cleared of residue following the combustion of each fuel. The particle samples generated from the combustion of fuels were extracted from a port in the chimney, 112 cm above the stove. The sampling line was made of ordinary in. copper pipe, with a total length of 2 m. After drawing the flue gas through a PM2.5 cyclone and moisture trap, a diluter (DI-1000, Dekati Ltd) was used. Through the diluter, the raw flue gas was diluted with compressed clean cool air with a dilution range of 70–200:1. The cooled, diluted sample was then split and fed into the particulate matter (PM) sampling system described below.
2.2 Instruments
A quadrupole ACSM (Aerodyne Research Inc.) (Ng et al., 2011b) was used to characterize the mass spectral signatures of organic aerosol particles produced from solid-fuel burning. The operation principles of the ACSM are detailed in Ng et al. (2011b). In this study, a PM2.5 cyclone was deployed to remove coarse particles. The aerosol particles were passed through a Nafion dryer (Perma Pure PD-50T-24SS) before they entered the ACSM. A PM1 aerodynamic lens was used to focus the submicron particles into a narrow beam. In the vacuum chamber of the ACSM, the particle beam was deposited on the heated surface (600 ∘C) where the non-refractory materials including OA, sulfate, nitrate, ammonium, and chloride were vaporized. Note that chloride in the aerosol emission from biomass burning is often present as KCl, which vaporizes slowly at 600 ∘C, requiring a non-standard treatment of the ACSM chloride data (Lee et al., 2010). In this study, we focused on the mass spectral profiles of OA emissions, and the slow vaporization issue was not accounted for (Lee et al., 2010). Upon deposition at 600 ∘C, the resulting vapour for the non-refractory species was ionized by electron impact (70 eV), and the gaseous ions were analysed using the quadrupole mass spectrometer. ACSM was calibrated following the procedure described by Ng et al. (2011b). Briefly, a scanning mobility particle sizer (SMPS, TSI 3938) was used to size-select (300 nm) the atomized ammonium nitrate or ammonium sulfate, which was subsequently fed into the ACSM system. For the fingerprinting experiments, the OA mass spectra from each testing stove were averaged, representative of the fingerprints of the different types of solid-fuel burning in different stoves.
For ambient measurement of submicron aerosol (PM1) in Dublin, an ACSM and Aethalometer (AE33, Magee Scientific; Drinovec et al., 2015) were deployed at University College Dublin (UCD) from 1 November 2016 to 31 January 2016 (Lin et al., 2018). The ACSM sampling site is ∼ 5 km south of Dublin city centre and is ∼ 500 m away from a nearby road (Fig. S1 in the Supplement). ACSM measurements were conducted on the roof of the O'Brien Centre for Science building (∼ 30 m above the ground). Previous studies conducted at the same sampling site show that the aerosol population was mainly affected by the heating emissions but with a relatively minor contribution from traffic or cooking emissions (Lin et al., 2020; Lin et al., 2018). The Aethalometer measured the light absorption of the particles collected on a filter at seven wavelengths (370, 470, 520, 590, 660, 880, and 950 nm). The mass absorption cross section of 7.77 m2 g−1 was used to calculate the BC mass concentration based on the changes in optical attenuation at 880 nm (Drinovec et al., 2015). Local PM2.5 measurements were obtained from EPA Ireland, who operates an air quality monitoring station in Rathmines, Dublin (https://airquality.ie/, last access: 1 September 2021), which is ∼ 3 km north-west of the ACSM sampling site. Meteorological parameters were from the meteorological station at Dublin Airport.
2.3 OA source apportionment
Positive matrix factorization (PMF; Paatero, 1997) with the Multilinear Engine version 2 (ME-2; Paatero, 1999) in the interface of SoFi (version 6.F1) (Canonaco et al., 2013) was employed to apportion the measured OA into different factors by constraining their corresponding reference profiles. The PMF model in matrix notation is defined as
where the measured matrix X is approximated by the product of G and F, while E is the model residual. The PMF output is a set of factors representing factor profiles (mass spectra) and their corresponding time series. For unconstrained or free PMF, no priori information about the source profiles is required to obtain a mathematical solution. However, the PMF solutions are not mathematically unique due to rotational ambiguity. Instead, interpretation of the factors (e.g., source type and contribution) is usually carried out with reference to known profiles of source emissions or typical diurnal patterns (Ulbrich et al., 2009). Nevertheless, the unconstrained PMF can experience difficulties in separating aerosol sources with temporal covariations, resulting in unrealistic or highly mixed factors (Canonaco et al., 2013).
As shown in Fig. S2 in the Supplement, unconstrained or free PMF suffered from factor mixing due to temporal covariation of the candidate factors (i.e., all increasing in the evening corresponding to the time of domestic heating activities). To evaluate the contribution of different types of solid fuels, source profiles obtained from the combustion experiments can be used as the anchoring factor profiles (i.e., reference mass spectra) in the ME-2 algorithm (Canonaco et al., 2013). However, without extensive and objective analysis, both free PMF and ME-2 analysis can fail to apportion the sources accurately, especially when the reference mass spectra can be complicated by the use of different fuels, stoves, and burning conditions. The “a value” approach (Canonaco et al., 2013) allows for a certain degree of variation from the anchoring profiles. For example, an a value of 0.3 corresponds to 30 % variation, while an a value of 1 is equivalent to the completely unconstrained (or free) PMF situation. In the conventional a-value approach, the same a value is applied to all of the values at the same time. However, if certain values vary to a differing extent, the conventional a-value approach might fail to capture the full variation or result in constraints that are too loose for certain . For example, in the conventional a-value approach, an a value of 0.3 was applied for all 's while certain 's could vary over 100 %, failing to capture the variation of these 's. But for certain 's, an a value of 0.3 would result in a too loose constraint given that the variation is less than 5 %.
In this study, individual was only allowed to vary within the range of the source profiles from different stoves (defined as the “limits” approach in SoFi (6.F1); https://datalystica.com/sofi, last access: 1 April 2021). In other words, different degrees of constraint were applied to individual values to capture their specific variations instead of the universal constraint as in the conventional a-value approach. To examine the statistical uncertainty of this approach, a bootstrap-based resampling strategy with a total of 100 runs was applied. Through bootstrapping, a new input matrix was created by random resampling of rows from the original ones (Paatero et al., 2014). By randomly duplicating some time points while excluding others, the original dimension of the input matrix was preserved. These ME-2 bootstrapping runs were averaged as the optimized solution, with the variation reflecting the model uncertainty.
3.1 Source profiles for solid-fuel burning in different domestic stoves
Table 1 summarizes the fuel types and stove types that were tested in the combustion experiments. Two scenarios are considered regarding the real-world application of solid-fuel burning. One scenario is when people might purchase the same type of solid fuel (e.g., smokeless coal or biomass briquettes) from the same producers but have different stoves for heating their homes (i.e., the same batch of fuels burnt in different stoves). The other scenario is when people might purchase the same type of fuel from different producers and burn them in different stoves (i.e., different batches of solid fuel burnt in different stoves). Below, we discuss the signatures and differences in the profiles (i.e., organic aerosol mass spectra characterized with an ACSM), as well as their implications for OA source apportionment.
3.1.1 Biomass briquettes and smokeless coal burnt in a conventional stove and an Ecodesign stove
Figure 1 compares the normalized organic aerosol mass spectra (MS) obtained from burning the same batch of biomass briquettes and smokeless coal in two different stoves – a conventional stove and an Ecodesign stove. Although sampled from different stoves, the mass spectral signatures as a whole were similar with an uncentred R2 (i.e., ∼ R2) of 0.87 for biomass briquettes and ∼ R2 of 0.97 for smokeless coal. All MS profiles appear to be dominated by fragments of CnH2n+1 ( 29, 43, 57, 71, etc.) and CnH2n−1 ( 27, 41, 55, 69, etc.), indicating a large contribution from saturated alkanes, alkenes, and/or cycloalkanes. However, the normalized peak intensities at specific (e.g., 41) sometimes varied significantly for the same type of solid fuel in the different stoves. The differences in the MS (discussed in Sect. 3.1.3) could be due to the different burning conditions (e.g., air supply and temperature) employed by the stoves, resulting in different thermal decomposition processes of the solid fuel and the corresponding pyrolysis products (Andreae, 2019; Weimer et al., 2008).

Figure 1Source profile (i.e., mass spectra; a, c) of the organic aerosol from the combustion of biomass briquettes and smokeless coal in the conventional versus Ecodesign stove, as well as their corresponding linear correlation relationship (b, d). For clarity, values in the mass spectra from the conventional stove were offset by 0.5. Inset text shows the uncentred R2 (i.e., ∼ R2) and the slope of the correlation.
3.1.2 Wood, peat, and smoky coal burnt in a conventional stove and boiler stove
Figure 2 compares the normalized organic aerosol mass spectra (MS) obtained from burning different batches of wood, peat, and smoky coal in a conventional stove (from this study) and a boiler stove (from Lin et al., 2017). The wood-burning OA produced in the two stoves shows the largest variation with ∼ R2 = 0.78, followed by smoky coal (∼ R2 = 0.88) and peat (∼ R2 = 0.95). The large variation in the MS of wood burning was likely associated with the high volatile content (80.8 wt %) in wood (Trubetskaya et al., 2021), which can be sensitive to the burning conditions. Although these solid fuels were purchased from different locations at different times (Dublin, 2019, and Tipperary, 2016) the general signatures were similar for each fuel type and displayed the expected marker ions. The key marker ion in wood-burning OA appears at 60 and 73 (Alfarra et al., 2007). The mass fragment at 60 (mostly from the ) is due to the fragmentation of anhydrosugars (e.g., levoglucosan, mannosan, and galactosan from the combustion of cellulose/hemicellulose; Lee et al., 2010) in the ACSM, and it is, therefore, commonly used as a marker for biomass burning in the AMS/ACSM studies (Cubison et al., 2011; Lee et al., 2010). Therefore, the differences in the content of cellulose/hemicellulose in the test fuels partly contribute to the differences in ion intensity at 60 in ACSM. Specifically, the MS of wood-burning OA has a prominent contribution from 60 (i.e., f60 > 2.9 %; f60 denotes the fraction of 60 in the total organic signal), while the MS of coal burning has a very low contribution from 60 (f60 < 0.1 %). In contrast, f60 in the MS of peat burning was in between coal and wood (1.6 %–1.7 %). This finding is consistent with the cellulose content in each of the solid fuels – wood > peat ≫ coal. While marker ions are important in the identification of specific OA factors during ambient studies, the differences in the intensities at specific are an important source of uncertainty when used as inputs for ME-2 modelling (Canonaco et al., 2013; Canonaco et al., 2021). Therefore, examining variations in the intensities of specific values due to the use of different stoves has great implications for factor analysis of an ambient dataset.

Figure 2Source profile (i.e., mass spectra; a, c, and e) of the organic aerosol from the combustion of wood, peat, and smoky coal in the boiler versus the conventional stove, as well as their corresponding linear correlation relationship (b, d, and f). For clarity, values in the mass spectra from the conventional stove were offset by 0.5. Inset text shows the uncentred R2 (i.e., ∼ R2) and the slope of the correlation.
3.1.3 Differences in source profiles and implications for factor analysis
The MS obtained using different stoves are compared by plotting the relative differences in individual values (calculated by (, where represents the fraction of the measured to the total organic signal, while stove y represents the Ecodesign or the boiler stove, and stove x represents the conventional stove; Figs. S3 and S4 in the Supplement). For wood burning in the conventional and boiler stoves, large differences (0.84 or 84 %) were associated with the intensity of the marker ion 60 (Fig. S3). In addition to 60, other fragments also showed large variations (Fig. S3). For example, the relative difference was 0.5 (or 50 %) for 44, a marker ion for aged or more oxidized OA (Canonaco et al., 2015). In ambient studies, the triangle space between 44 and 60 is often used to study the ageing of biomass burning, in which a decreasing f60 and an increasing f44 are usually associated with the atmospheric ageing process (Ng et al., 2011a). However, the results from our study suggest that variations in f60 and f44 could also be due to different burning conditions (i.e., in different stoves) and do not necessarily correspond to primary OA ageing or atmospheric processing. For peat-burning OA, there is a lower f60 (0.016–0.017) than that for wood (0.029–0.053) due to the lower content of cellulose (Brown et al., 1988; Mikucioniene et al., 2019). Compared to wood, the peat MS appeared to be less affected by the stove type with a difference ratio of −0.06 (or 6 %) for 60 (Fig. 2). But for other fragments (e.g., 29, 41, 43, etc.), a difference ratio of up to 0.46 is also indicative of significant variations caused by the type of stove.
f60 in the MS of biomass briquettes was 0.005–0.008, which was 4–10 times lower than wood and 2–3 times lower than peat. This can be explained by the manufacturing process for the biomass briquettes, which involves torrefaction at a temperature of > 250 ∘C that causes thermal decomposition of the raw biomass. The briquettes thus contain less cellulose and produce a lower f60 as a result. The difference ratios for the MS of biomass briquettes burnt in the conventional and Ecodesign stoves were in the range of −0.4 to 0.6 for the major fragments (e.g., 41, 43, 55, 57). For some minor fragments (e.g., 71 and 85), the difference ratios were even higher with values of up to 1.4 (i.e., 140 %; Fig. S4), again suggesting the large impact of burning conditions on the MS profiles.
For the MS of smoky coal, f60 was reduced to 0.00071–0.00081 (< 0.1 %) while for smokeless coal f60 was 0.0027–0.0045, both of which were lower than that for wood/peat. The reduced f60 in the normalized mass spectra for smoky/smokeless coal is likely due to the breakdown of, for example, cellulose during coal formation over millions of years (Höök, 2012), resulting in a relatively low content of cellulose, while accumulating other carbon-rich content, leading to the observed ions at other 's. As a comparison, the large contribution from the fragments at 77, 91, and 115 suggests a high content of aromatic/polycyclic aromatic hydrocarbon (PAH) compounds in the smoky coal burning emissions. Specifically, f77, f91, and f115 were in the range of 0.015–0.016, 0.014–0.015, and 0.019–0.026, respectively, for the MS of smoky coal. However, for the MS of smokeless coal, f77, f91, and f115 were lower with values of less than 0.015. Compared to smoky coal, the lower levels of aromatic/PAH-related fragments (i.e., 77, 91, and 115) in the MS of smokeless coal are associated with its production process, which removed most of the volatiles in the raw coal during torrefaction at high temperatures (Trubetskaya et al., 2021), resulting in lower emission factors.
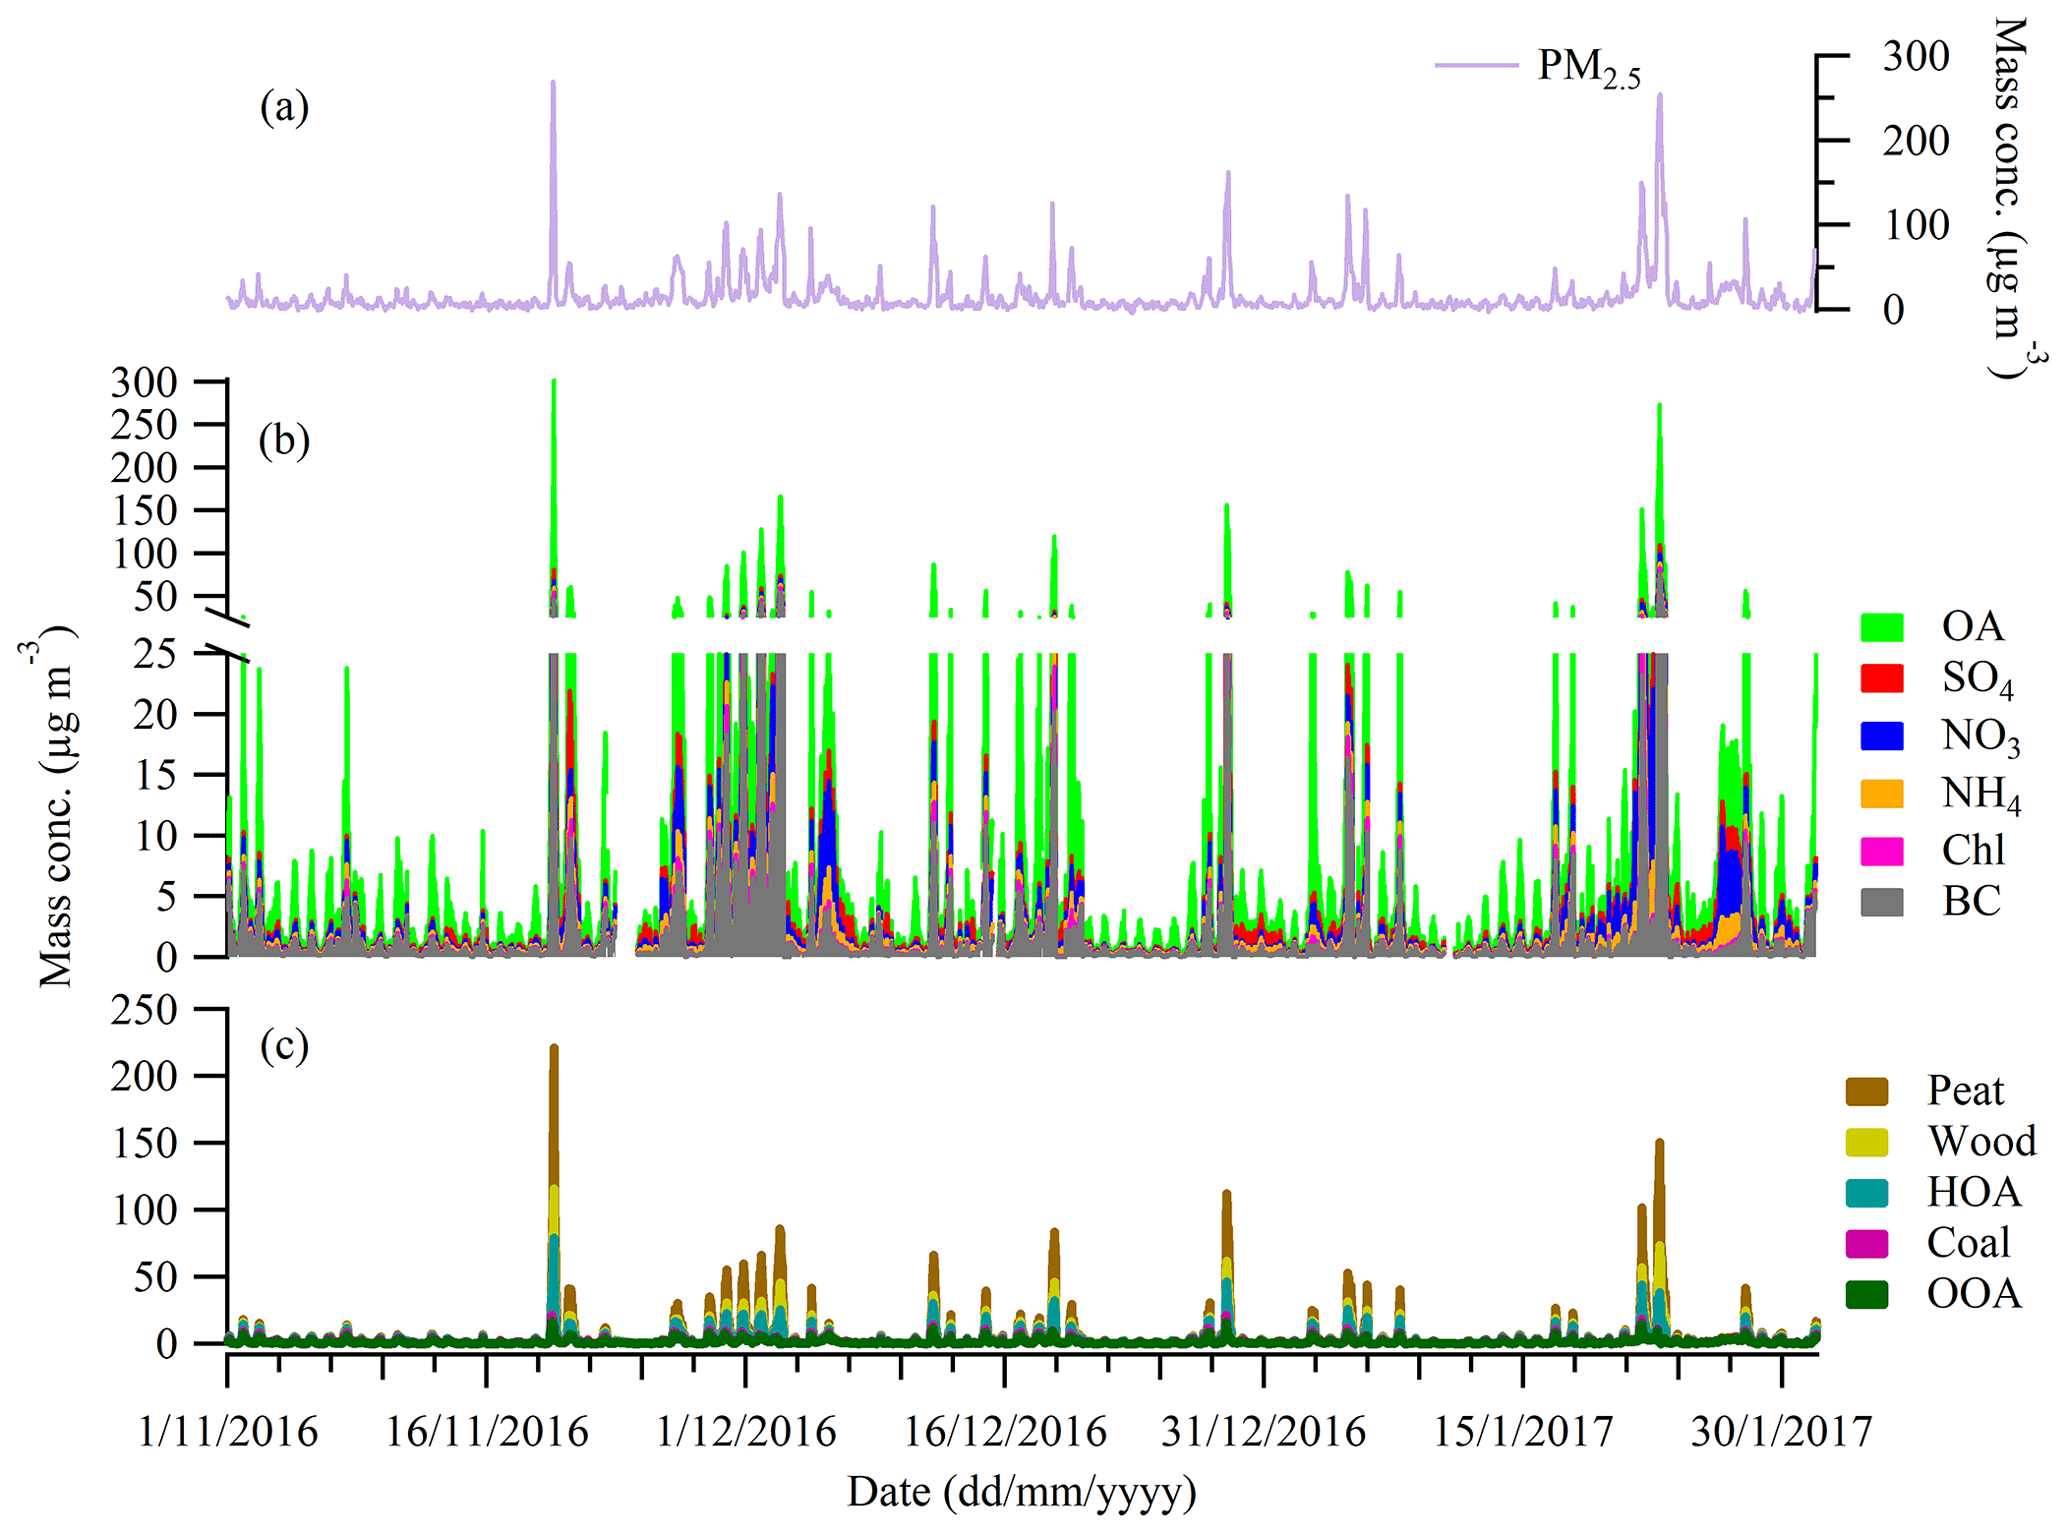
Figure 3Time series of (a) PM2.5 at Rathmines station, ∼ 3 km north-west of the ACSM sampling site; (b) organic aerosol (OA), sulfate (SO4), ammonium (NH4), nitrate (NO3), chloride (Chl), and black carbon (BC); and (c) OA factors for peat, wood, hydrocarbon-like OA (HOA), coal, and oxygenated OA (OOA) obtained using the limits approach.
3.2 Use of different source profiles for source apportionment of organic aerosol in Dublin, Ireland
3.2.1 Overview of ambient aerosol measurements
Figure 3 shows the time series of PM2.5, PM1 components, and OA factors (discussed in Sect. 3.2.2) in suburban Dublin from 1 November 2016 to 31 January 2017. During the sampling period, PM1 (sum of ACSM and BC measurements) showed large variations with 30 min averaged concentrations ranging from < 0.5 to 302.0 µg m−3. In particular, PM1 concentrations of 25 µg m−3 were often (roughly 1 in 3 d) exceeded during the sampling period. The PM1 at the sampling site showed a strong correlation with PM2.5 at the Rathmines station (R2 of 0.87, a slope of 0.74; Fig. S1), thus confirming that the ACSM sampling site was representative of the residential areas in southern Dublin (Fig. 3a). The slope of 0.74 for the linear relationship between PM1 and PM2.5 suggests that PM1 on average accounts for 74 % of PM2.5. However, during pollution events, the values of PM1 and PM2.5 are very similar, indicating that most PM is in the submicron size ranges.
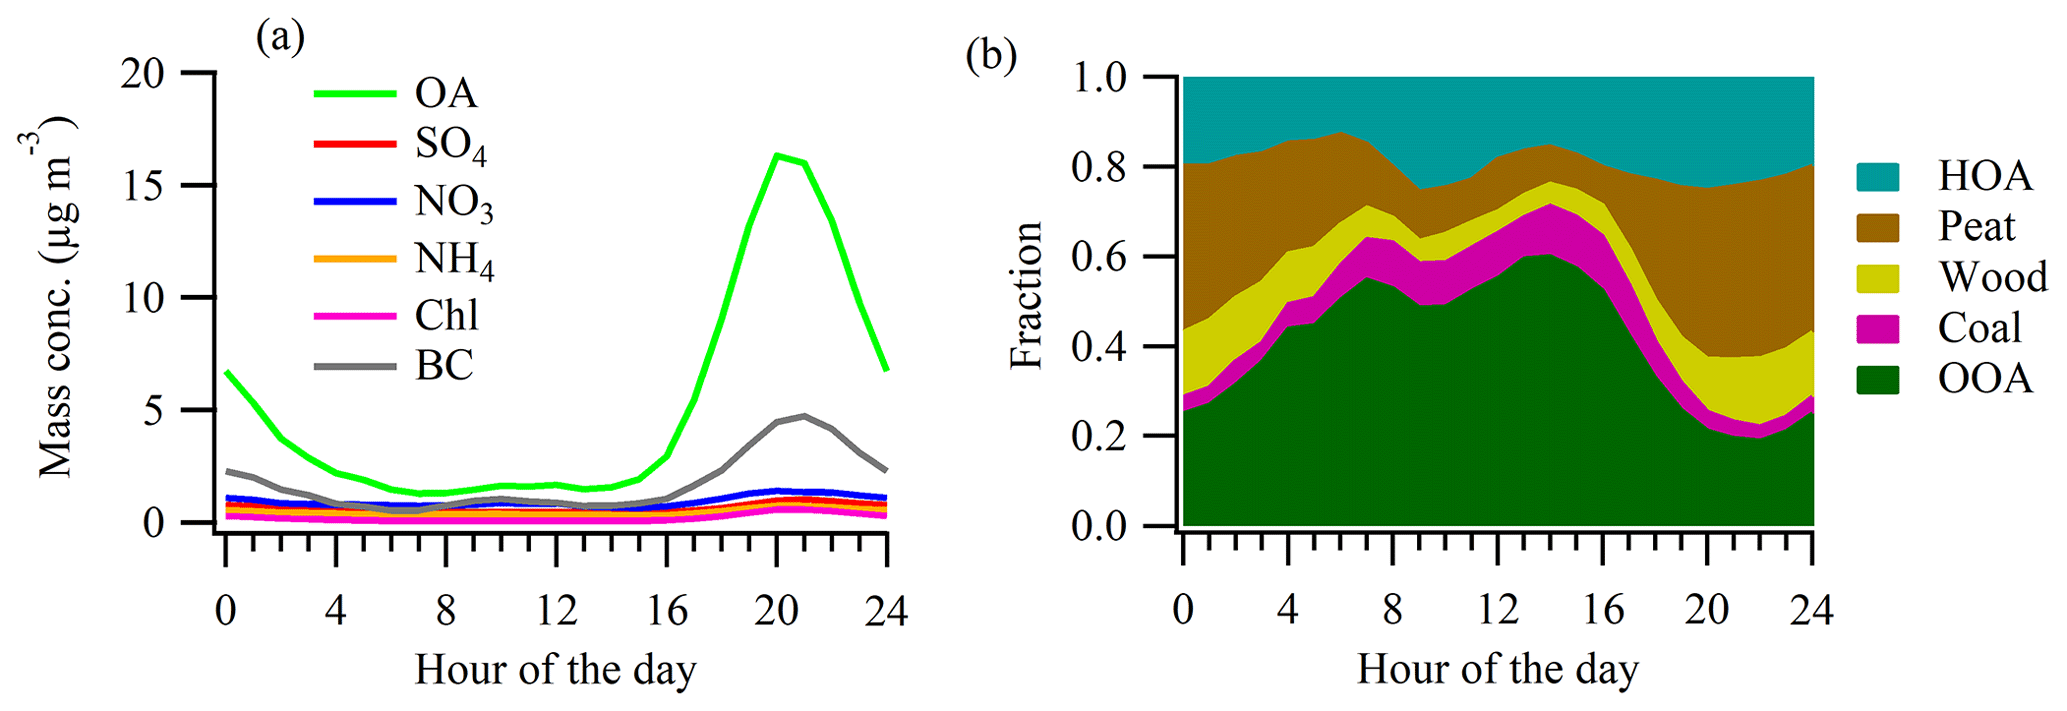
Figure 4Averaged diurnal cycle of (a) organic aerosol (OA), sulfate (SO4), ammonium (NH4), nitrate (NO3), chloride (Chl), and black carbon (BC); (b) relative contribution of OA factors of HOA, peat, wood, coal, and OOA.
Consistent with the overall trend of PM1, all the measured PM1 components showed similar temporal variation with enhanced concentrations during the evening. The diurnal cycle of OA showed an increase from 16:00 LT (local time; all times in this paper are given in local time unless stated otherwise) which peaked during 20:00–22:00 (Fig. 4). However, OA decreased sharply overnight and remained at a low concentration during the day (08:00–16:00). Similarly, BC concentrations were over 4 times higher in the evening than during the day. The very similar diurnal patterns of OA and BC suggest that they have common emission sources (i.e., heating) during the evening and night hours. Meteorological parameters like temperature and wind speed were also partly contributing to the elevated concentrations in the evening. The scatter plot (Fig. S5 in the Supplement) between OA and temperature or wind speed suggests that the high OA concentrations were coupled with low temperatures (< 7 ∘C) and low wind speed (< 5 m s−1). Also, the shallower planetary boundary layer was an important factor for the increased OA concentration in the evening (Lin et al., 2018). In addition, the diurnal pattern of ammonium, nitrate, and sulfate all showed peaks at the same evening hours with the BC (Fig. 4a), suggesting that they may also be related to heating emissions coupled with low temperatures in the evening (Fig. S6 in the Supplement). Sulfate was likely associated with the primary emissions from solid-fuel combustion given that, in the stove emission, sulfate was found to contribute to < 1 % of PM1 for wood burning but the fraction of sulfate was up to 21 % of PM1 for smokeless coal burning, reflecting the higher content of sulfur in the raw fuel (Trubetskaya et al., 2021). This is consistent with our previous study (Lin et al., 2019), where we demonstrated that sulfate, nitrate, and ammonium can be locally emitted or formed, as well as regionally transported, through the comparison of the ACSM measurement at the same Dublin sampling site and at Carnsore Point, a regional background site.
3.2.2 Contribution of solid-fuel burning to ambient organic aerosol
To evaluate the contributions of solid-fuel burning to the ambient OA in suburban Dublin, the MS of wood, peat, and smoky coal were used as the anchoring profiles for ME-2 modelling (Lin et al., 2017; Lin et al., 2018; Trubetskaya et al., 2021). In the ME-2 analysis, the individual values in the MS for wood, peat, and coal were allowed to vary between the reference profiles (i.e., the limits approach; see Sect. 2; Figs. S7–S10). The time series of solid-fuel-burning factors (Fig. 3c) were very similar (i.e., all peaked during the same evening hours; Fig. S8) due to the similar emission time from the domestic heating activities. This is the reason why ME-2 was used to separate these factors since unconstrained PMF led to highly mixed and not physically meaningful factors (Lin et al., 2017). In addition to solid fuels, a hydrocarbon-like OA (HOA) factor and an oxygenated OA (OOA) factor were also resolved (Fig. S7). HOA was associated with the emissions from oil heating during the evening, while OOA was related to regional transport and/or secondary processes (Lin et al., 2020). Increasing the number of factors during the ME-2 analysis (i.e., the six-factor solution; Fig. S9) identified an additional OOA factor (OOA2) which, however, featured a very low signal at 41 in the normalized mass spectra but a similar signal level at 43 with the already identified OOA factor (Fig. S7). The unambiguous separation of two OOA types requires further research. Nevertheless, for the five-factor solution, the good correlation (R2 = 1, slope = 0.99; Fig. S10) between the time series of the explained fraction and the PMF input suggests that the five-factor solution explained the input matrix well.
Figure 4b shows the diurnal cycle of the averaged contribution of the resolved factors over the entire period. On average, solid-fuel burning (the sum of peat, wood, and coal) was the major contributor (> 50 %) to the total OA during the evening, while during the day OOA was the dominant factor. Therefore, primary emissions from solid-fuel burning were the dominant sources of pollution in the evening, while regional transport and/or secondary processes of OA were the major source during the day. The oil heating factor was contributing, on average, 22 %–25 % of the total OA in the evening. Even though the overall results from the limits approach were consistent with those from the conventional a-value approach in Lin et al. (2018), a detailed comparison of results between the two approaches as well as the corresponding uncertainties are provided below.
Table 2Uncertainties in OA factor attribution obtained using the limits approach versus the a-value approach.
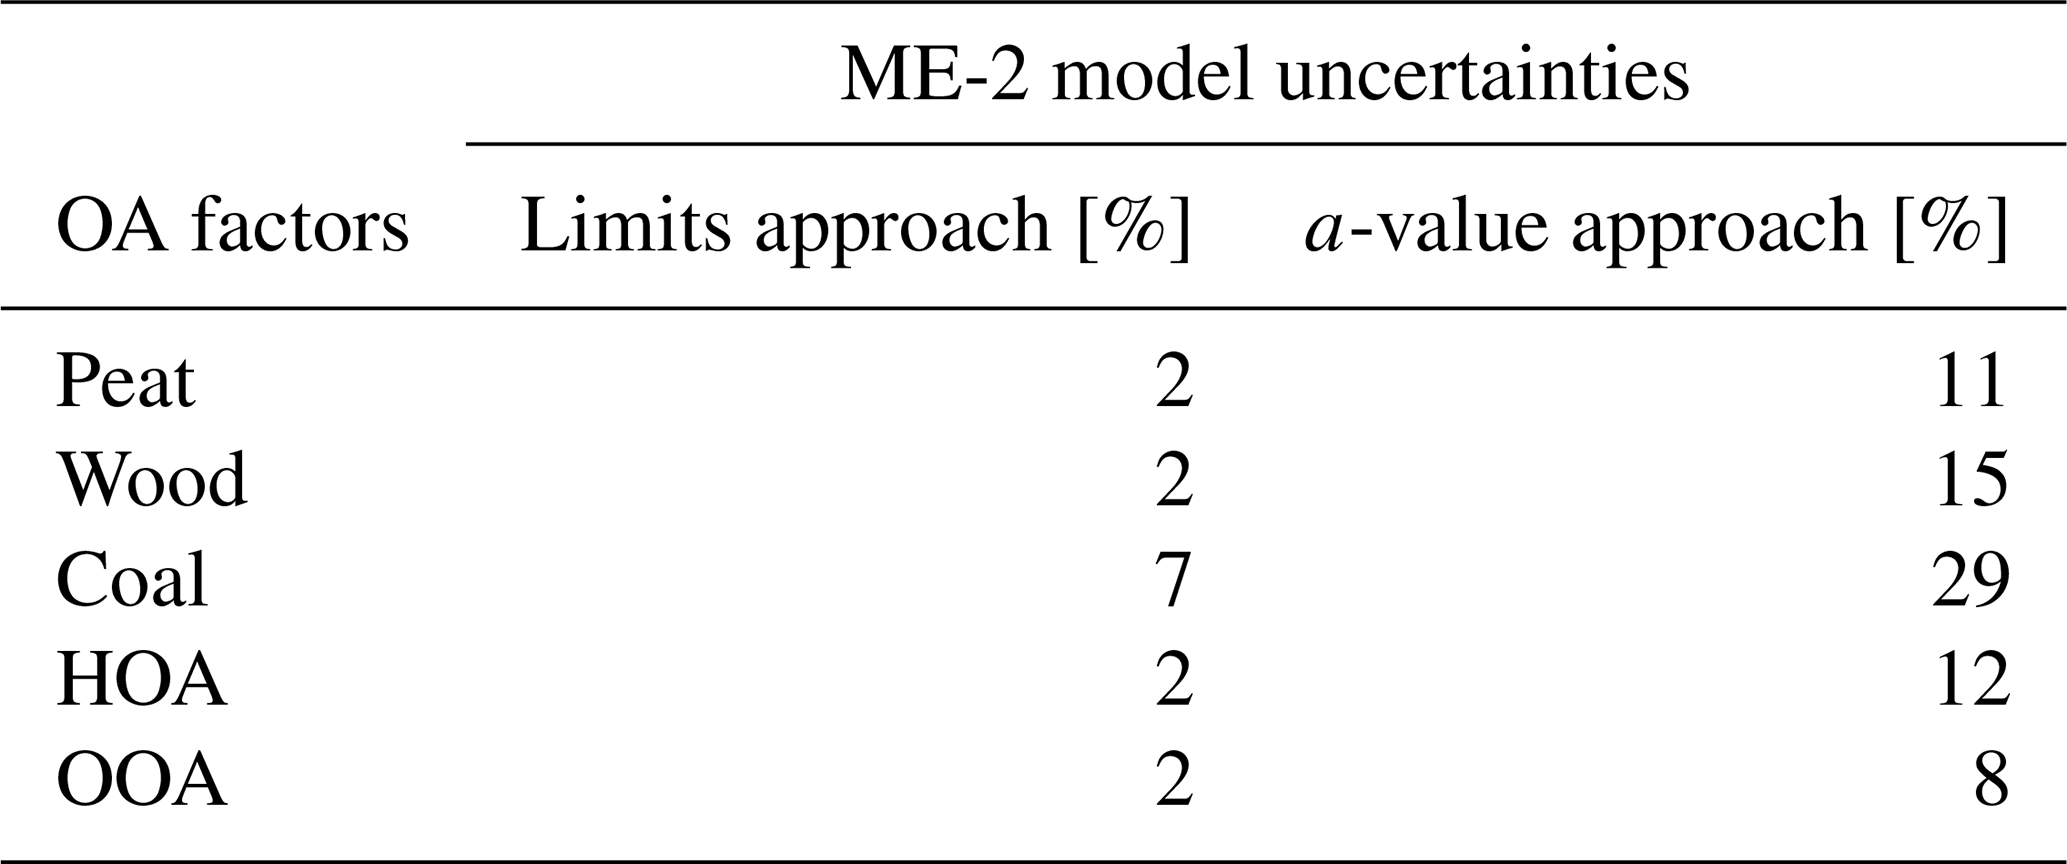
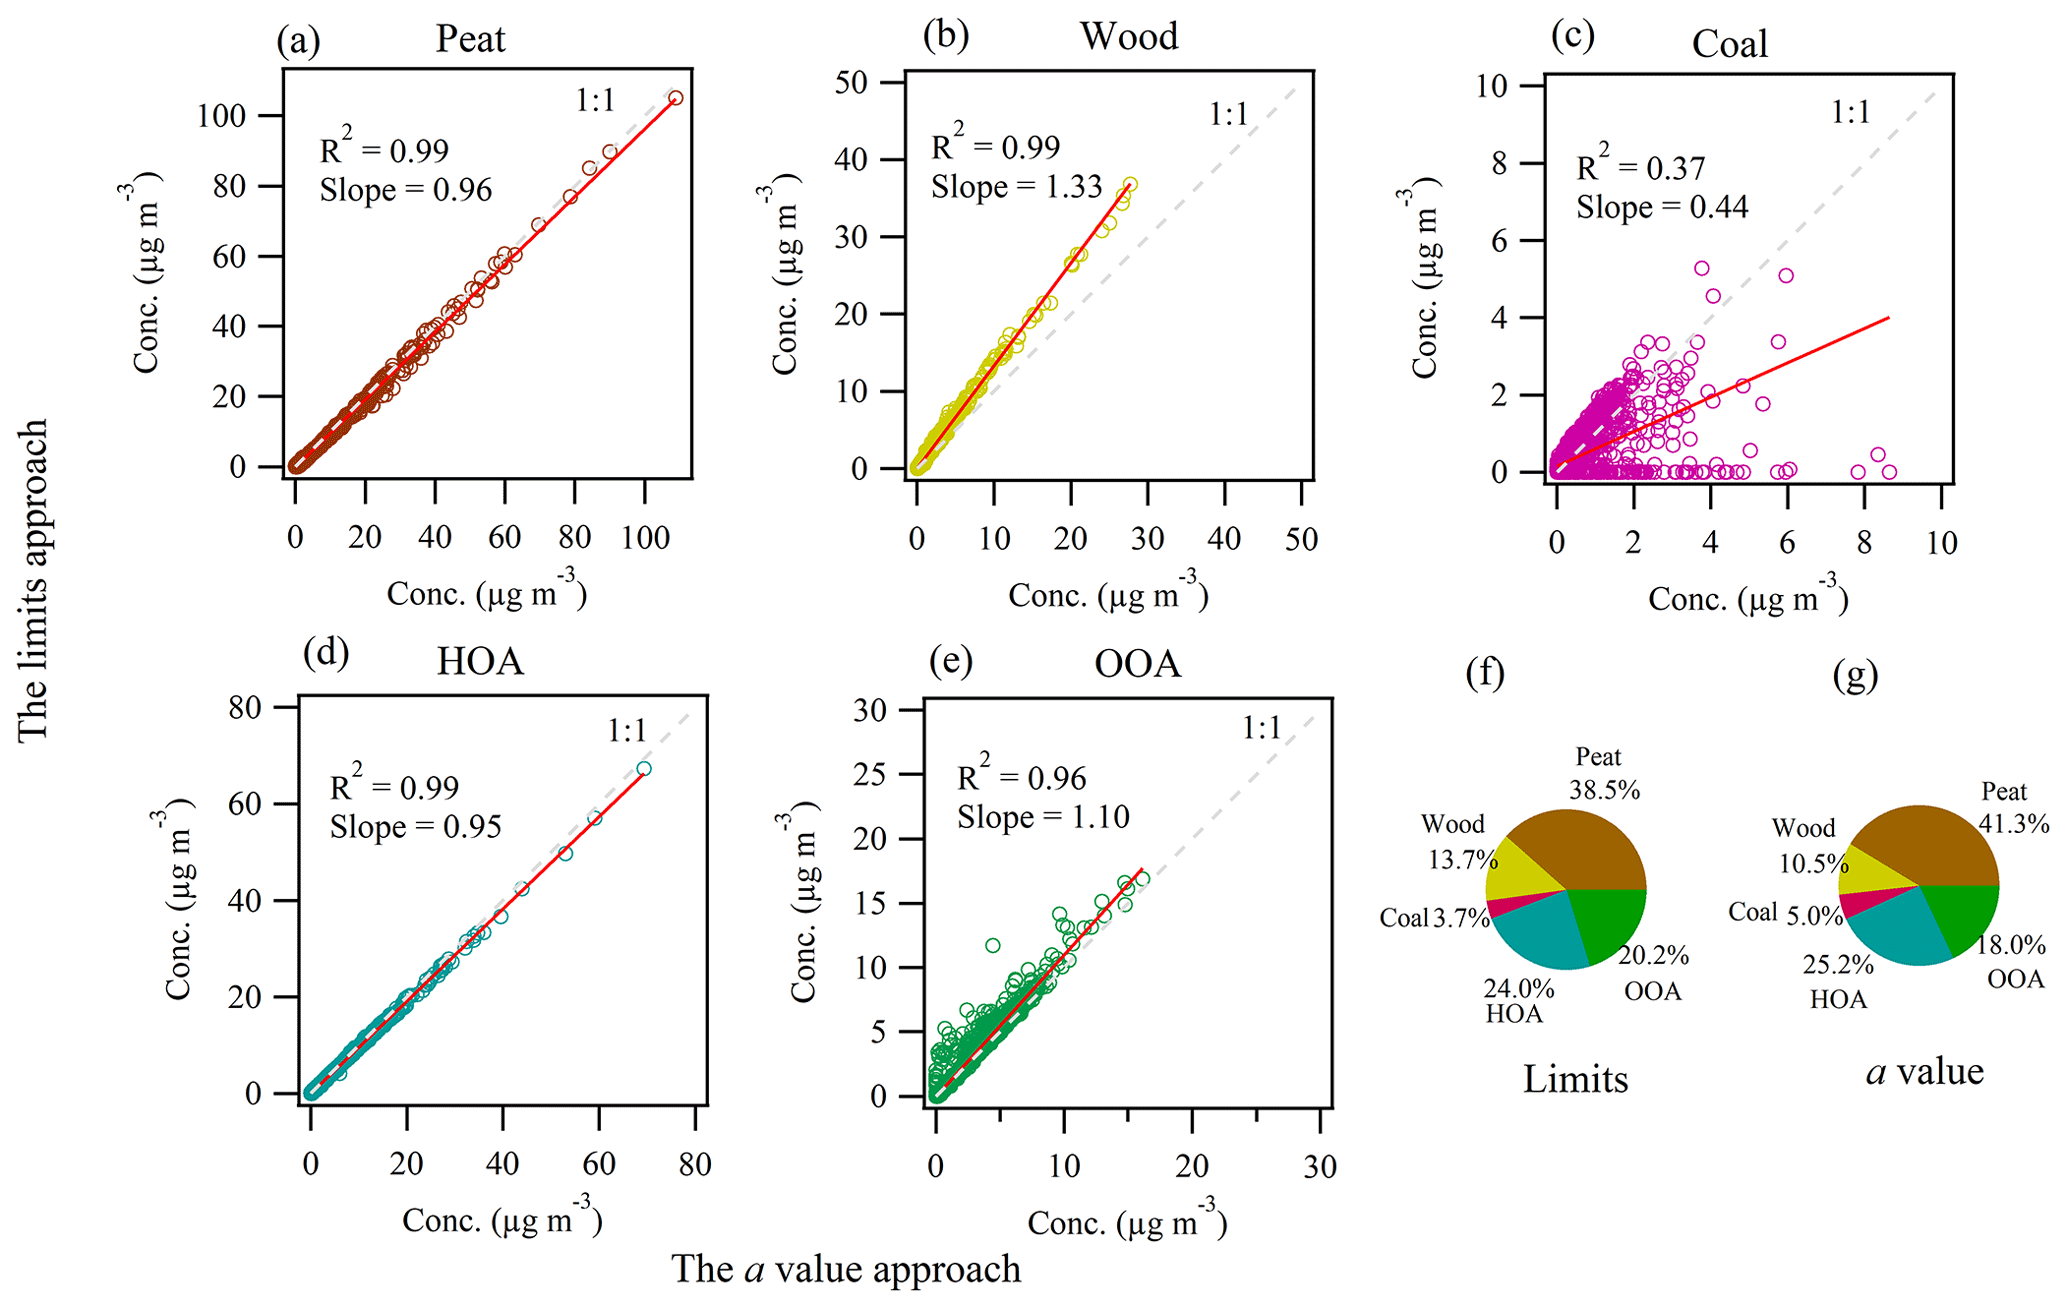
Figure 5Scatter plot of the time series of OA factors of (a) peat, (b) wood, (c) coal, (d) HOA, and (e) OOA resolved by the limits approach versus the conventional a-value approach; averaged relative contribution of the resolved factors during the evening hours (20:00–23:00) by (f) the limits approach and (g) the a-value approach. The dashed grey line in the scatter plot is the 1:1 reference line, while the red line is the linear regression with R2 and slope values shown on top.
3.2.3 Comparison of OA source apportionment using the limits approach versus the a-value approach
Figure 5 shows the comparison of the time series of OA factors resolved by the limits approach and the conventional a-value approach (Lin et al., 2018), while Table 2 shows the corresponding uncertainties. The statistical uncertainty of the limits approach was evaluated through the bootstrap-based resampling strategy (See Sect. 2), while the model uncertainties for the a-value approach was the variation (1 standard deviation) of the accepted ME-2 solutions with the combination of different a values (Lin et al., 2018). The model uncertainty for the limits approach was in the range of 2 %–7 %, considerably lower than 8 %–29 % for the a-value approach. The low uncertainty for the limits approach suggested that the solution was relatively stable. In contrast, the relatively large uncertainty for the a-value approach suggested that the degree of variation from the anchoring profiles could cause uncertainties in the solution of up to 29 %. In addition to the model uncertainties, the dilution and cooling of the aerosol samples after mixing in the ambient atmosphere, as well as atmospheric processes (e.g., night-time chemistry with NO3 radical; Kiendler-Scharr et al., 2016) are also important sources of uncertainties in OA source apportionment since these factors could also cause variation in the mass spectra. In this study, our combustion experiment deployed a Dekati diluter (See Sect. 2) to simulate the dilution and cooling of the raw flue gas samples through mixing with compressed clean air.
Overall, the time series of the OA factors for peat, HOA, and OOA were well correlated with R2 > 0.95 and slopes in the range of 0.95–1.10 (Fig. 5), suggesting excellent agreement between the two approaches despite the difference in uncertainties (Table 2). Although the wood-burning factor time series from the two approaches had a high correlation coefficient (R2 of 0.99), a slope of 1.33 indicated the quantification of the OA factor of wood burning varied to a larger extent (i.e., 33 %). In contrast, the OA factor for coal burning showed the poorest correlation with an R2 of 0.37 and a slope of 0.44. The poor correlation for the coal burning factor was likely due to the low contribution to the total OA (< 10 %; Fig. 5c) and the large uncertainty from the a-value approach (29 %; Table 2). Nevertheless, both approaches pointed to an important source of solid-fuel burning in wintertime Dublin, with the sum of peat, wood, and coal factors, on average, contributing over 50 % of the total OA during the evening hours (20:00–23:00). Specifically, both approaches showed peat burning being the largest OA factor (39 %, Fig. 5f vs. 41 %, Fig. 5g), followed by HOA (24 % vs. 25 %), OOA (20 % vs. 18 %), wood (14 % vs. 11 %), and coal (4 % vs. 5 %) during the evening hours (20:00–23:00) when stove emissions dominate. Therefore, high variations in specific contributions to OA mass spectra from different fuel and stove types do not translate into high source apportionment uncertainties owing to the robust ME-2 approach. Moreover, the time series of OOA showed spikes concurrent with primary factors (Fig. S8) during the evening and night-time, suggesting that OOA was probably associated with the condensation of semi-volatile species and/or ageing of primary emissions in the real atmosphere (Tiitta et al., 2016). As a result, the contribution from solid-fuel burning could be higher than solely represented by the POA fraction given that OOA, on average, accounted for approximately 20 % of the OA in the evening (Fig. 4b).
3.3 Atmospheric implications
Our results indicate that the emission profiles, in terms of the specific values in the organic mass spectra, varied significantly even for the same type of solid fuel burnt in different types of stoves. Taking into account such variations, the uncertainties in the source apportionment of ambient organic aerosol were reduced. This study provides better constraints on the contribution of solid-fuel burning to the ambient organic aerosol and is of importance for public health and policymakers considering that it is often the case that different batches of solid fuels are often burnt in different stoves in real-world applications. In particular, solid fuels of peat and wood, both of biomass nature, were found to contribute to a considerable fraction (> 50 %) of the total organic matter. However, according to the Central Statistical Office in Ireland (CSO, 2016), only a small number (< 10 %) of households use peat and wood as the primary heating source, with the majority (> 90 %) using the relatively clean energy of gas and electricity. Trubetskaya et al. (2021) showed peat (38–92 g GJ−1) and wood (44–179 g GJ−1) had higher emission factors than smoky coal (17–29 g GJ−1), smokeless coal (5–18 g GJ−1), and biomass briquettes (7–28 g GJ−1). Therefore, despite the small use of peat and wood, their high emission factors make these fuels important factors driving the pollution events observed during the heating season. Moreover, the good correlation between the time series of PM1 and PM2.5, despite the distance of 3 km between the two measurements, suggests that the pollution events covered a large area in Dublin with a spatial scale of at least 3 km in radius. In other words, the air quality for those using the clean energy sources of gas and electricity was also impaired by the small group of people using peat and wood.
Biomass burning is a carbon-neutral energy source given that biomass captures almost the same amount of carbon dioxide (CO2) through photosynthesis during growing as is released when biomass is burnt (Marland, 2010). This makes biomass an alternative to fossil fuels to combat climate change. Replacing fossil fuels with biomass may result in lower CO2 emissions overall. However, in terms of particulate emission, burning biomass can cause serious air pollution as shown in this study. In other European sites, biomass burning has also been reported to be an important source of particulate pollution (Alfarra et al., 2007; Allan et al., 2010; Crippa et al., 2014). Therefore, rather than promoting the use of biomass burning, new emission controls on residential biomass burning, e.g., through the introduction of a more energy-efficient and low-emission stove (Trubetskaya et al., 2021), are needed to improve the overall air quality. In 1990, the Irish government introduced a ban on the marketing, sale, and distribution of bituminous (smoky) coal in Dublin. This led to a 70 % reduction in the average black smoke levels during the post-ban period compared to the pre-ban period (Goodman et al., 2009). Consistently, our results showed coal combustion accounted for a small fraction (< 5 %) of the organic mass. These results suggest that appropriate intervention can be effective at reducing particulate pollution. Therefore, extending the ban to the use of peat and wood is expected to further improve the air quality in Ireland.
This study has provided a detailed characterization and comparison of organic aerosol mass spectra produced from burning a range of solid fuels in several stoves. Key ions (e.g., 60) remain important markers for identifying solid-fuel emissions using ACSM data. However, the intensities at different values, including the marker ions, varied significantly from < 5 % to > 100 %, and are an important source of uncertainties when using their respective mass spectra as anchoring profiles in the conventional a-value approach in ME-2 modelling. Using the limits approach in ME-2 analysis, the contributions of peat, wood, and coal to the ambient OA were evaluated and compared with this conventional a-value approach. The ME-2 solution was stable for the limits approach with uncertainties in the range of 2 %–7 %, while relatively large uncertainties (8 %–29 %) were found for the a-value approach. The peat-burning factor was subject to fewer uncertainties and showed a good agreement between the two approaches (R2 of 0.99 and a slope of 0.96), while wood and coal OA factors showed a relatively larger variation with a slope of 1.33 and 0.44, respectively. Both approaches showed that coal burning was contributing < 10 % of the ambient OA, while peat and wood contributed substantially (> 50 %) to the ambient OA in the evening hours of the heating season despite their small uses. The results from this study suggest that locally obtained reference source profiles, in combination with robust ME-2 approach, can reduce the uncertainty and, therefore, are better for quantitative source apportionment of primary emissions from solid-fuel burning. The finding from this study holds important implications for public health and policymakers considering that it is often the case that different batches of solid fuels are often burnt in different stoves in real-world applications.
All data needed to evaluate the conclusions in the paper are present in the paper and/or the Supplement. Also, all data used in the study are available from the corresponding authors upon request.
The supplement related to this article is available online at: https://doi.org/10.5194/amt-14-6905-2021-supplement.
JO and CL conceived and designed the experiments; CL, JO, DC, WS, and AT performed the measurements; CL, DC, WX, and JO analysed the data; and CL prepared the article with input from all co-authors.
The contact author has declared that neither they nor their co-authors have any competing interests.
Publisher's note: Copernicus Publications remains neutral with regard to jurisdictional claims in published maps and institutional affiliations.
This work was supported by EPA Ireland (AEROSOURCE, 2016-CCRP-MS-31) and the Department of the Environment, Climate and Communications. Chunshui Lin acknowledges the support from the Strategic Priority Research Program of the Chinese Academy of Sciences (grant no. XDB40030202), the National Natural Science Foundation of China (NSFC) (under grant no. 42107126), and the Institute of Earth Environment, Chinese Academy of Sciences (grant no. E051QB2837). The authors would also like to acknowledge the contribution of the COST Action CA16109 (COLOSSAL) and MaREI, the SFI Research Centre for Energy, Climate and Marine.
This research has been supported by the Irish Environmental Protection Agency (grant no. 2016-CCRP-MS-31).
This paper was edited by Pierre Herckes and reviewed by two anonymous referees.
Alfarra, M. R., Prevot, A. S. H., Szidat, S., Sandradewi, J., Weimer, S., Lanz, V. A., Schreiber, D., Mohr, M., and Baltensperger, U.: Identification of the mass spectral signature of organic aerosols from wood burning emissions, Environ. Sci. Technol., 41, 5770–5777, 2007.
Allan, J. D., Williams, P. I., Morgan, W. T., Martin, C. L., Flynn, M. J., Lee, J., Nemitz, E., Phillips, G. J., Gallagher, M. W., and Coe, H.: Contributions from transport, solid fuel burning and cooking to primary organic aerosols in two UK cities, Atmos. Chem. Phys., 10, 647–668, https://doi.org/10.5194/acp-10-647-2010, 2010.
An, Z., Huang, R.-J., Zhang, R., Tie, X., Li, G., Cao, J., Zhou, W., Shi, Z., Han, Y., Gu, Z., and Ji, Y.: Severe haze in northern China: A synergy of anthropogenic emissions and atmospheric processes, P. Natl. Acad. Sci. USA, 116, 8657–8666, 2019.
Andreae, M. O.: Emission of trace gases and aerosols from biomass burning – an updated assessment, Atmos. Chem. Phys., 19, 8523–8546, https://doi.org/10.5194/acp-19-8523-2019, 2019.
Brown, A., KAURI, T., Kushner, D., and Mathur, S.: Measurement and significance of cellulose in peat soils, Can. J. Soil Sci., 68, 681–685, 1988.
Canonaco, F., Crippa, M., Slowik, J. G., Baltensperger, U., and Prévôt, A. S. H.: SoFi, an IGOR-based interface for the efficient use of the generalized multilinear engine (ME-2) for the source apportionment: ME-2 application to aerosol mass spectrometer data, Atmos. Meas. Tech., 6, 3649–3661, https://doi.org/10.5194/amt-6-3649-2013, 2013.
Canonaco, F., Slowik, J. G., Baltensperger, U., and Prévôt, A. S. H.: Seasonal differences in oxygenated organic aerosol composition: implications for emissions sources and factor analysis, Atmos. Chem. Phys., 15, 6993–7002, https://doi.org/10.5194/acp-15-6993-2015, 2015.
Canonaco, F., Tobler, A., Chen, G., Sosedova, Y., Slowik, J. G., Bozzetti, C., Daellenbach, K. R., El Haddad, I., Crippa, M., Huang, R.-J., Furger, M., Baltensperger, U., and Prévôt, A. S. H.: A new method for long-term source apportionment with time-dependent factor profiles and uncertainty assessment using SoFi Pro: application to 1 year of organic aerosol data, Atmos. Meas. Tech., 14, 923–943, https://doi.org/10.5194/amt-14-923-2021, 2021.
Crippa, M., Canonaco, F., Lanz, V. A., Äijälä, M., Allan, J. D., Carbone, S., Capes, G., Ceburnis, D., Dall'Osto, M., Day, D. A., DeCarlo, P. F., Ehn, M., Eriksson, A., Freney, E., Hildebrandt Ruiz, L., Hillamo, R., Jimenez, J. L., Junninen, H., Kiendler-Scharr, A., Kortelainen, A.-M., Kulmala, M., Laaksonen, A., Mensah, A. A., Mohr, C., Nemitz, E., O'Dowd, C., Ovadnevaite, J., Pandis, S. N., Petäjä, T., Poulain, L., Saarikoski, S., Sellegri, K., Swietlicki, E., Tiitta, P., Worsnop, D. R., Baltensperger, U., and Prévôt, A. S. H.: Organic aerosol components derived from 25 AMS data sets across Europe using a consistent ME-2 based source apportionment approach, Atmos. Chem. Phys., 14, 6159–6176, https://doi.org/10.5194/acp-14-6159-2014, 2014.
CSO (Central Statistics Office): Private Households in Permanent Housing Units, available at: https://www.cso.ie/px/pxeirestat/Statire/SelectVarVal/Define.asp?maintable=E4015&PLanguage=0 (last access: 1 September 2021), 2016.
Cubison, M. J., Ortega, A. M., Hayes, P. L., Farmer, D. K., Day, D., Lechner, M. J., Brune, W. H., Apel, E., Diskin, G. S., Fisher, J. A., Fuelberg, H. E., Hecobian, A., Knapp, D. J., Mikoviny, T., Riemer, D., Sachse, G. W., Sessions, W., Weber, R. J., Weinheimer, A. J., Wisthaler, A., and Jimenez, J. L.: Effects of aging on organic aerosol from open biomass burning smoke in aircraft and laboratory studies, Atmos. Chem. Phys., 11, 12049–12064, https://doi.org/10.5194/acp-11-12049-2011, 2011.
Drinovec, L., Močnik, G., Zotter, P., Prévôt, A. S. H., Ruckstuhl, C., Coz, E., Rupakheti, M., Sciare, J., Müller, T., Wiedensohler, A., and Hansen, A. D. A.: The “dual-spot” Aethalometer: an improved measurement of aerosol black carbon with real-time loading compensation, Atmos. Meas. Tech., 8, 1965–1979, https://doi.org/10.5194/amt-8-1965-2015, 2015.
Fuzzi, S., Baltensperger, U., Carslaw, K., Decesari, S., Denier van der Gon, H., Facchini, M. C., Fowler, D., Koren, I., Langford, B., Lohmann, U., Nemitz, E., Pandis, S., Riipinen, I., Rudich, Y., Schaap, M., Slowik, J. G., Spracklen, D. V., Vignati, E., Wild, M., Williams, M., and Gilardoni, S.: Particulate matter, air quality and climate: lessons learned and future needs, Atmos. Chem. Phys., 15, 8217–8299, https://doi.org/10.5194/acp-15-8217-2015, 2015.
Goodman, P. G., Rich, D. Q., Zeka, A., Clancy, L., and Dockery, D. W.: Effect of air pollution controls on black smoke and sulfur dioxide concentrations across Ireland, J. Air Waste Manage., 59, 207–213, 2009.
Hallquist, M., Wenger, J. C., Baltensperger, U., Rudich, Y., Simpson, D., Claeys, M., Dommen, J., Donahue, N. M., George, C., Goldstein, A. H., Hamilton, J. F., Herrmann, H., Hoffmann, T., Iinuma, Y., Jang, M., Jenkin, M. E., Jimenez, J. L., Kiendler-Scharr, A., Maenhaut, W., McFiggans, G., Mentel, Th. F., Monod, A., Prévôt, A. S. H., Seinfeld, J. H., Surratt, J. D., Szmigielski, R., and Wildt, J.: The formation, properties and impact of secondary organic aerosol: current and emerging issues, Atmos. Chem. Phys., 9, 5155–5236, https://doi.org/10.5194/acp-9-5155-2009, 2009.
Höök, M.: Coal and Peat: global resources and future supply, In: Encyclopedia of Sustainability Science and Technology, edited by: Meyers, R. A., Springer New York, New York, NY, 2012.
Hopke, P. K.: Review of receptor modeling methods for source apportionment, J. Air Waste Manage., 66, 237–259, 2016.
Kiendler-Scharr, A., Mensah, A. A., Friese, E., Topping, D., Nemitz, E., Prevot, A. S. H., Äijälä, M., Allan, J., Canonaco, F., Canagaratna, M., Carbone, S., Crippa, M., Dall Osto, M., Day, D. A., De Carlo, P., Di Marco, C. F., Elbern, H., Eriksson, A., Freney, E., Hao, L., Herrmann, H., Hildebrandt, L., Hillamo, R., Jimenez, J. L., Laaksonen, A., McFiggans, G., Mohr, C., O'Dowd, C., Otjes, R., Ovadnevaite, J., Pandis, S. N., Poulain, L., Schlag, P., Sellegri, K., Swietlicki, E., Tiitta, P., Vermeulen, A., Wahner, A., Worsnop, D., and Wu, H.-C.: Ubiquity of organic nitrates from nighttime chemistry in the European submicron aerosol, Geophys. Res. Lett., 43, 7735–7744, 2016.
Lanz, V. A., Alfarra, M. R., Baltensperger, U., Buchmann, B., Hueglin, C., Szidat, S., Wehrli, M. N., Wacker, L., Weimer, S., Caseiro, A., Puxbaum, H., and Prevot, A. S. H.: Source attribution of submicron organic aerosols during wintertime inversions by advanced factor analysis of aerosol mass spectra, Environ. Sci. Technol., 42, 214–220, 2008.
Lee, T., Sullivan, A. P., Mack, L., Jimenez, J. L., Kreidenweis, S. M., Onasch, T. B., Worsnop, D. R., Malm, W., Wold, C. E., Hao, W. M., and Collett, J. L.: Chemical Smoke Marker Emissions During Flaming and Smoldering Phases of Laboratory Open Burning of Wildland Fuels, Aerosol Sci. Tech., 44, i–v, 2010.
Li, Y. J., Sun, Y., Zhang, Q., Li, X., Li, M., Zhou, Z., and Chan, C. K.: Real-time chemical characterization of atmospheric particulate matter in China: A review, Atmos. Environ., 158, 270–304, 2017.
Lin, C., Ceburnis, D., Hellebust, S., Buckley, P., Wenger, J., Canonaco, F., Prévôt, A. S. H., Huang, R.-J., O'Dowd, C., and Ovadnevaite, J.: Characterization of primary organic aerosol from domestic wood, peat, and coal burning in Ireland, Environ. Sci. Technol., 51, 10624–10632, 2017.
Lin, C., Ceburnis, D., Huang, R.-J., Xu, W., Spohn, T., Martin, D., Buckley, P., Wenger, J., Hellebust, S., Rinaldi, M., Facchini, M. C., O'Dowd, C., and Ovadnevaite, J.: Wintertime aerosol dominated by solid-fuel-burning emissions across Ireland: insight into the spatial and chemical variation in submicron aerosol, Atmos. Chem. Phys., 19, 14091–14106, https://doi.org/10.5194/acp-19-14091-2019, 2019.
Lin, C., Huang, R.-J., Ceburnis, D., Buckley, P., Preissler, J., Wenger, J., Rinaldi, M., Facchini, M. C., O'Dowd, C., and Ovadnevaite, J.: Extreme air pollution from residential solid fuel burning, Nature Sustainability, 1, 512–517, 2018.
Lin, C., Ceburnis, D., Xu, W., Heffernan, E., Hellebust, S., Gallagher, J., Huang, R.-J., O'Dowd, C., and Ovadnevaite, J.: The impact of traffic on air quality in Ireland: insights from the simultaneous kerbside and suburban monitoring of submicron aerosols, Atmos. Chem. Phys., 20, 10513–10529, https://doi.org/10.5194/acp-20-10513-2020, 2020.
Marland, G.: Accounting for Carbon Dioxide Emissions from Bioenergy Systems, J. Ind Ecol., 14, 866–869, 2010.
Mikucioniene, D., Cepukone, L., Salmeia, K. A., and Gaan, S.: Comparative Analysis of Peat Fibre Properties and Peat Fibre-Based Knits Flammability, Autex Res. J., 19, 157–164, https://doi.org/10.1515/aut-2018-0033, 2019.
Ng, N. L., Canagaratna, M. R., Jimenez, J. L., Chhabra, P. S., Seinfeld, J. H., and Worsnop, D. R.: Changes in organic aerosol composition with aging inferred from aerosol mass spectra, Atmos. Chem. Phys., 11, 6465–6474, https://doi.org/10.5194/acp-11-6465-2011, 2011a.
Ng, N. L., Herndon, S. C., Trimborn, A., Canagaratna, M. R., Croteau, P. L., Onasch, T. B., Sueper, D., Worsnop, D. R., Zhang, Q., Sun, Y. L., and Jayne, J. T.: An Aerosol Chemical Speciation Monitor (ACSM) for routine monitoring of the composition and mass concentrations of ambient aerosol, Aerosol Sci. Technol., 45, 780–794, 2011b.
Paatero, P.: Least squares formulation of robust non-negative factor analysis, Chemometr. Intell. Lab., 37, 23–35, 1997.
Paatero, P.: The multilinear engine-a table-driven, least squares program for solving multilinear problems, including the n-way parallel factor analysis model, J. Comput. Graph. Stat., 8, 854–888, 1999.
Paatero, P., Eberly, S., Brown, S. G., and Norris, G. A.: Methods for estimating uncertainty in factor analytic solutions, Atmos. Meas. Tech., 7, 781–797, https://doi.org/10.5194/amt-7-781-2014, 2014.
Shrivastava, M., Cappa, C. D., Fan, J., Goldstein, A. H., Guenther, A. B., Jimenez, J. L., Kuang, C., Laskin, A., Martin, S. T., and Ng, N. L.: Recent advances in understanding secondary organic aerosol: Implications for global climate forcing, Rev. Geophys., 55, 509–559, 2017.
Tiitta, P., Leskinen, A., Hao, L., Yli-Pirilä, P., Kortelainen, M., Grigonyte, J., Tissari, J., Lamberg, H., Hartikainen, A., Kuuspalo, K., Kortelainen, A.-M., Virtanen, A., Lehtinen, K. E. J., Komppula, M., Pieber, S., Prévôt, A. S. H., Onasch, T. B., Worsnop, D. R., Czech, H., Zimmermann, R., Jokiniemi, J., and Sippula, O.: Transformation of logwood combustion emissions in a smog chamber: formation of secondary organic aerosol and changes in the primary organic aerosol upon daytime and nighttime aging, Atmos. Chem. Phys., 16, 13251–13269, https://doi.org/10.5194/acp-16-13251-2016, 2016.
Trubetskaya, A., Lin, C., Ovadnevaite, J., Ceburnis, D., O'Dowd, C., Leahy, J. J., Monaghan, R. F. D., Johnson, R., Layden, P., and Smith, W.: Study of Emissions from Domestic Solid-Fuel Stove Combustion in Ireland, Energ. Fuel., 35, 4966–4978, https://doi.org/10.1021/acs.energyfuels.0c04148, 2021. 2021.
Ulbrich, I. M., Canagaratna, M. R., Zhang, Q., Worsnop, D. R., and Jimenez, J. L.: Interpretation of organic components from Positive Matrix Factorization of aerosol mass spectrometric data, Atmos. Chem. Phys., 9, 2891–2918, https://doi.org/10.5194/acp-9-2891-2009, 2009.
Weimer, S., Alfarra, M. R., Schreiber, D., Mohr, M., Prévôt, A. S. H., and Baltensperger, U.: Organic aerosol mass spectral signatures from wood-burning emissions: Influence of burning conditions and type, J. Geophys. Res.-Atmos., 113, D10304, https://doi.org/10.1029/2007JD009309, 2008.
Zhang, R., Wang, G., Guo, S., Zamora, M. L., Ying, Q., Lin, Y., Wang, W., Hu, M., and Wang, Y.: Formation of Urban Fine Particulate Matter, Chem. Rev., 115, 3803–3855, 2015.