the Creative Commons Attribution 4.0 License.
the Creative Commons Attribution 4.0 License.
 | 22 Nov 2021
An improved TROPOMI tropospheric NO2 research product over Europe
Song Liu
Pieter Valks
Gaia Pinardi
Ka Lok Chan
Athina Argyrouli
Ronny Lutz
Steffen Beirle
Ehsan Khorsandi
Frank Baier
Vincent Huijnen
Alkiviadis Bais
Sebastian Donner
Steffen Dörner
Myrto Gratsea
François Hendrick
Dimitris Karagkiozidis
Kezia Lange
Ankie J. M. Piters
Julia Remmers
Andreas Richter
Michel Van Roozendael
Thomas Wagner
Mark Wenig
Diego G. Loyola
Launched in October 2017, the TROPOspheric Monitoring Instrument (TROPOMI) aboard Sentinel-5 Precursor provides the potential to monitor air quality over point sources across the globe with a spatial resolution as high as 5.5 km × 3.5 km (7 km × 3.5 km before 6 August 2019). The DLR nitrogen dioxide (NO2) retrieval algorithm for the TROPOMI instrument consists of three steps: the spectral fitting of the slant column, the separation of stratospheric and tropospheric contributions, and the conversion of the slant column to a vertical column using an air mass factor (AMF) calculation. In this work, an improved DLR tropospheric NO2 retrieval algorithm from TROPOMI measurements over Europe is presented. The stratospheric estimation is implemented using the STRatospheric Estimation Algorithm from Mainz (STREAM), which was developed as a verification algorithm for TROPOMI and does not require chemistry transport model data as input. A directionally dependent STREAM (DSTREAM) is developed to correct for the dependency of the stratospheric NO2 on the viewing geometry by up to 2×10¹⁴ molec./cm2. Applied to synthetic TROPOMI data, the uncertainty in the stratospheric column is 3.5×10¹⁴ molec./cm2 in the case of significant tropospheric sources. Applied to actual measurements, the smooth variation of stratospheric NO2 at low latitudes is conserved, and stronger stratospheric variation at higher latitudes is captured.
For AMF calculation, the climatological surface albedo data are replaced by geometry-dependent effective Lambertian equivalent reflectivity (GE_LER) obtained directly from TROPOMI measurements with a high spatial resolution. Mesoscale-resolution a priori NO2 profiles are obtained from the regional POLYPHEMUS/DLR chemistry transport model with the TNO-MACC emission inventory. Based on the latest TROPOMI operational cloud parameters, a more realistic cloud treatment is provided by a Clouds-As-Layers (CAL) model, which treats the clouds as uniform layers of water droplets, instead of the Clouds-As-Reflecting-Boundaries (CRB) model, in which clouds are simplified as Lambertian reflectors.
For the error analysis, the tropospheric AMF uncertainty, which is the largest source of NO2 uncertainty for polluted scenarios, ranges between 20 % and 50 %, leading to a total uncertainty in the tropospheric NO2 column in the 30 %–60 % range. From a validation performed with ground-based multi-axis differential optical absorption spectroscopy (MAX-DOAS) measurements, the new DLR tropospheric NO2 data show good correlations for nine European urban/suburban stations, with an average correlation coefficient of 0.78. The implementation of the algorithm improvements leads to a decrease of the relative difference from −55.3 % to −34.7 % on average in comparison with the DLR reference retrieval. When the satellite averaging kernels are used to remove the contribution of a priori profile shape, the relative difference decreases further to ∼ −20 %.
- Article
(7831 KB) - Full-text XML
-
Supplement
(3215 KB) - BibTeX
- EndNote


Tropospheric nitrogen dioxide (NO2) is an important atmospheric trace gas because of its contribution to the formation of tropospheric ozone, urban haze, and acid deposition (Charlson and Ahlquist, 1969; Crutzen, 1970; McCormick, 2013). NO2 is a prominent air pollutant affecting the human respiratory system (World Health Organization, 2006). Substantial amounts of NO2 are produced in the boundary layer from combustion processes. In Europe, cities regularly exceed the air quality standards for NO2 (European Commission, 2017), with road transport as the largest contributor, ahead of the energy and industry sectors (Crippa et al., 2018).
To monitor and quantify the NO2 column, NO2 measurements have been provided for more than a decade on a global scale and daily basis by European satellite instruments, such as Global Ozone Monitoring Experiment (GOME) (Burrows et al., 1999), SCanning Imaging Absorption SpectroMeter for Atmospheric CHartographY (SCIAMACHY) (Bovensmann et al., 1999), Ozone Monitoring Instrument (OMI) (Levelt et al., 2006, 2018), and Global Ozone Monitoring Experiment-2 (GOME-2) (Callies et al., 2000; Munro et al., 2006, 2016), complementary to sparse measurements by ground-based instruments. The satellite-based NO2 dataset has been extended by the new-generation TROPOspheric Monitoring Instrument (TROPOMI) (Veefkind et al., 2012), with an unprecedented spatial resolution of 5.5 km in the along-track direction (7 km before 6 August 2019) and 3.5 km in the across-track direction.
TROPOMI is a nadir-viewing push-broom imaging spectrometer aboard the European Space Agency (ESA) Sentinel-5 Precursor satellite, launched on 13 October 2017. The TROPOMI instrument measures the Earth's backscattered radiance and extraterrestrial solar irradiance in the spectral range between the ultraviolet and the shortwave infrared. The spectral resolution and sampling are 0.54 and 0.20 nm in the visible channel (400–496 nm) used for the detection of NO2. From a sun-synchronous polar orbit, TROPOMI provides trace gas measurements as well as cloud and aerosol properties, with an ascending node equatorial crossing at ∼13:30 local time. The swath width is ∼2600 km in the direction across the track of the satellite, allowing daily global coverage.
NO2 measurements from TROPOMI have been widely used for ground-level concentration estimates (e.g. Cooper et al., 2020; Li et al., 2020) and emission estimates (e.g. Lorente et al., 2019; Beirle et al., 2019; van der A et al., 2020; Huber et al., 2020). The high spatial resolution and good data quality allow for a detailed analysis of local distribution and evolution of NO2 (e.g. Stavrakou et al., 2020; Goldberg et al., 2021; Georgoulias et al., 2020), which have been particularly important and helpful during the COVID-19 pandemic (e.g. Bauwens et al., 2020; Liu et al., 2020a; Goldberg et al., 2020; Huang and Sun, 2020; Ding et al., 2020; Biswal et al., 2020; Koukouli et al., 2021; Liu et al., 2021).
Independent from the operational processing, the NO2 retrieval algorithm for the TROPOMI instrument developed at DLR starts with the calculation of the slant column (the concentration integrated along the total light path through the atmosphere along the way from the sun to the satellite) from the TROPOMI reflectance spectra using the differential optical absorption spectroscopy (DOAS) method (Platt and Stutz, 2008). To determine the tropospheric NO2 slant column, the stratospheric contribution is estimated and removed from the total slant column, after which both total and tropospheric slant columns are converted to vertical columns by the application of air mass factors (AMFs).
The retrieval of tropospheric NO2 columns from total column data requires an accurate stratospheric estimation, a procedure referred to as stratosphere–troposphere separation (e.g. Leue et al., 2001; Bucsela et al., 2006). One typical stratosphere–troposphere separation algorithm is the modified reference sector method, which uses measurements over regions with negligible tropospheric NO2 abundance to estimate the stratospheric NO2 columns based on the assumption of longitudinally homogeneous stratospheric NO2 fields. A more sophisticated approach used by the operational TROPOMI NO2 retrieval relying on a chemistry transport model is data assimilation (Eskes et al., 2003; Dirksen et al., 2011), in which the three-dimensional distributions of NO2 are regularly updated such that the modelled stratospheric NO2 concentrations are in close agreement with satellite measurements for low-tropospheric contributions. Advantages of the data assimilation approach include a realistic error estimation and the capture of small-scale dynamical and chemical variability of stratospheric NO2. Compared to data assimilation, the modified reference sector method is in general simple and requires no additional model input. Therefore, the STRatospheric Estimation Algorithm from Mainz (STREAM) method (Beirle et al., 2016), which belongs to the modified reference sector methods, has been developed as a verification algorithm for TROPOMI, as a complement to the operational stratospheric correction based on data assimilation.
The quality of satellite tropospheric NO2 measurements is strongly related to the tropospheric AMFs, which are determined with a radiative transfer model and depend on ancillary information such as surface albedo, vertical shape of the a priori NO2 profile, cloud, and aerosol. The importance of these parameters in NO2 retrievals has been recognized for OMI (e.g. Heckel et al., 2011; Lin et al., 2014; Laughner et al., 2018; Qin et al., 2019), GOME-2 (e.g. Valks et al., 2011; Lorente et al., 2018; Liu et al., 2019b, 2020c), and TROPOMI (e.g. Griffin et al., 2019; Liu et al., 2020b; Zhao et al., 2020; Ialongo et al., 2020; Tack et al., 2021).
The surface albedo has implications for satellite retrievals of aerosols, clouds, and trace gases including NO2. Most current satellite NO2 retrievals (Boersma et al., 2011; Liu et al., 2019b, 2020c; van Geffen et al., 2020b) rely on monthly Lambertian-equivalent reflectivity (LER) climatologies derived from satellite measurements such as OMI (Kleipool et al., 2008) and GOME-2 (Tilstra et al., 2017, 2019). However, this simple assumption of isotropic surface reflection can introduce a bias by up to 35 % in the NO2 AMF calculation (Lorente et al., 2018). To account for the geometry-dependent surface scattering characteristics, previous works have applied measurements from the MODerate resolution Imaging Spectroradiometer (MODIS) dataset (e.g. Vasilkov et al., 2017; Qin et al., 2019). In this study we use a new algorithm developed at DLR to retrieve geometry-dependent effective LER (GE_LER) in the Vis based on the full-physics inverse learning machine (FP_ILM) technique (Loyola et al., 2020b). Compared to the typical climatological LER or the directionally dependent (DLER) data (Tilstra et al., 2021), the GE_LER data represent the actual surface conditions better such as snow/ice scenarios based on each single TROPOMI measurement with a high spatial resolution. GE_LER has been successfully applied in the retrievals of TROPOMI total ozone columns in the UV (Loyola et al., 2020b) and cloud parameters in the NIR (Loyola et al., 2020a) and is being used in the corresponding operational version 2.1 cloud products (see further down in the Introduction).
The varying sensitivity of the satellite to NO2 at different altitudes is considered in the tropospheric AMF calculation using vertically resolved box-AMFs and a priori NO2 profiles. Typically prescribed by a chemistry transport model, the importance of applying a priori NO2 profiles with sufficiently detailed resolution has been addressed (e.g. Russell et al., 2011; McLinden et al., 2014; Kuhlmann et al., 2015; Boersma et al., 2016; Laughner et al., 2016), particularly for TROPOMI with a small pixel size (Griffin et al., 2019; Liu et al., 2020b; Ialongo et al., 2020; Tack et al., 2021). Routine simulations of tropospheric trace gases and aerosols have been provided by POLYPHEMUS/DLR since 2014 with a spatial resolution of 0.2∘ × 0.3∘ (latitude, longitude) covering Europe and parts of North Africa. POLYPHEMUS/DLR is an air quality modelling platform operated at DLR based on the POLYPHEMUS chemistry transport model (Mallet et al., 2007) coupled to the Weather Research and Forecasting (WRF) model (Skamarock et al., 2008) with the TNO-MACC emission inventory (Denier van der Gon et al., 2010). It has been further developed within the PASODOBLE project for sensitivity studies of the mountainous Black Forest region (Bergemann et al., 2012) and to cover urban areas in southern Bavaria (Khorsandi et al., 2018). It uses the TNO-MACC emission inventory (Kuenen et al., 2014). Daily model forecasts are freely available via DLR Geospatial Web Services (https://wdc.dlr.de/data_products/, last access: 1 November 2021).
The NO2 retrieval is affected by the presence of clouds because high clouds shield underlying parts of the atmosphere, and low clouds can enhance the NO2 absorption due to cloud albedo and multiple scattering if they are below or at the same height as the NO2 layer (Martin et al., 2002; Kokhanovsky and Rozanov, 2008). The operational cloud retrieval for TROPOMI is implemented using the Optical Cloud Recognition Algorithm (OCRA) and the Retrieval Of Cloud Information using Neural Networks (ROCINN). In addition to the retrieval product based on the assumption that clouds are simple Lambertian reflecting surfaces, referred to as the Clouds-As-Reflecting-Boundaries (CRB) model, a more sophisticated set of cloud products is provided by OCRA/ROCINN, which considers clouds to be optically uniform layers of scattering liquid water spherical particles, referred to as the Clouds-As-Layers (CAL) model. The more realistic CAL model is regarded as the preferred method, particularly for small TROPOMI ground pixels and for low clouds (Compernolle et al., 2021). With an updated version 2.1 processor for OCRA/ROCINN in operation since August 2020, new features such as the application of GE_LER to describe the surface albedo have been added in OCRA/ROCINN (Loyola et al., 2020a).
The satellite NO2 data have been widely validated by comparison with correlative ground-based multi-axis differential optical absorption spectroscopy (MAX-DOAS) measurements (e.g. Celarier et al., 2008; Irie et al., 2008; Ma et al., 2013; Pinardi et al., 2014, 2015; Drosoglou et al., 2017, 2018; Chan et al., 2020; Pinardi et al., 2020). MAX-DOAS measures the vertically resolved abundances of atmospheric trace species in the lowermost troposphere (Hönninger et al., 2004; Wagner et al., 2004; Wittrock et al., 2004; Heckel et al., 2005). Based on the scattered sky light under different viewing directions, high NO2 sensitivity close to the surface is obtained for the smallest elevation angles, whereas measurements at higher elevations provide information on the rest of the column.
In this paper, a number of improvements to the tropospheric NO2 retrieval over Europe are introduced for the DLR product. To estimate and remove the stratospheric contribution, an improved STREAM algorithm is developed and evaluated by applying it to synthetic TROPOMI data and actual satellite observations. To calculate the tropospheric AMFs, the surface albedo is described by the GE_LER data consistently in both NO2 and cloud retrievals; a priori NO2 profiles are obtained from the regional POLYPHEMUS/DLR chemistry transport model, and the OCRA/ROCINN_CAL cloud model from the new version 2.1 processor is used for cloud correction.
In Sect. 2, we introduce the reference algorithm at DLR for the TROPOMI NO2 retrieval, which is based on an improved algorithm originally designed for GOME-2 (Liu et al., 2019b) and adapted for TROPOMI measurements with optimization related to the specific instrumental aspects. In Sects. 3 and 4, we improve the stratosphere–troposphere separation and the tropospheric AMF calculation, respectively. In Sect. 5, examples of applying the retrieval algorithm to TROPOMI measurements are shown, and the error estimate is discussed. In Sect. 6, we show a comprehensive validation of the TROPOMI NO2 data using ground-based MAX-DOAS observations in Europe.
2.1 DOAS slant column retrieval
Applied to the backscattered spectra measured by TROPOMI, the DOAS fit (Platt and Stutz, 2008) is a least-squares inversion to isolate the trace gas absorption from the background processes, which are approximated by a fifth-order polynomial P(λ) at wavelength λ:
The measurement-based term is defined as the natural logarithm of the measured earthshine radiance spectrum I(λ) divided by the daily solar irradiance spectrum I0(λ). The DOAS fit is performed in the 405–465 nm wavelength range for consistency with other NO2 retrievals from TROPOMI (van Geffen et al., 2020a) and the heritage instrument OMI (van Geffen et al., 2015; Zara et al., 2018).
The spectral effect from the absorption of a species g is determined by the fitted slant column density Sg and associated absorption cross-section σg(λ):
-
NO2 absorption at 220 K from Vandaele et al. (2002);
-
ozone (O3) absorption at 228 K from Brion et al. (1998);
-
water vapour (H2Ovap) absorption at 293 K from Rothman et al. (2010), rescaled as in Lampel et al. (2015);
-
oxygen dimer (O4) absorption at 293 K from Thalman and Volkamer (2013);
-
liquid water (H2Oliq) absorption at 297 K from Pope and Fry (1997), smoothed as in Peters et al. (2014).
The contribution of the rotational Raman scattering to the measured spectrum, namely the Ring effect (Grainger and Ring, 1962; Solomon et al., 1987), is treated as a pseudo absorber, by means of an additive Ring reference spectrum R(λ) and a scaling coefficient αR as fitting parameter. A linear intensity offset correction offset(λ) is fitted as an additional effective cross-section to correct for the stray light in the spectrometer, the inelastic scattering in the ocean, and remaining calibration issues in the level 1 data (Liu et al., 2019b). See additional discussions regarding the intensity offset in van Geffen et al. (2020a). The TROPOMI level 1b version 1 spectra are analysed using the QDOAS software developed at BIRA-IASB (Fayt et al., 2011; Danckaert et al., 2017). Figure 1 shows examples of the TROPOMI NO2 slant columns over Europe in February and August 2019, where large NO2 hotspots can be identified. Note that the slant columns are scaled by geometric AMFs to correct for the angular dependencies of TROPOMI measurements.
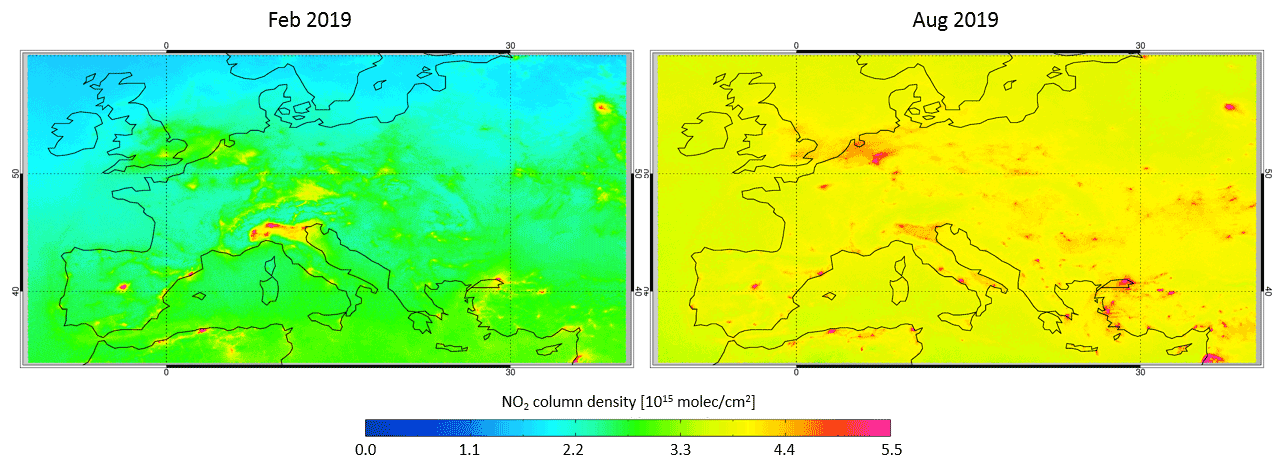
Figure 1TROPOMI NO2 slant columns (scaled by geometric AMFs) over Europe in February and August 2019.
The NO2 slant columns from single orbits show an across-track striping pattern, a well-known feature of observations of push-broom spectrometers such as OMI (Boersma et al., 2011) and TROPOMI (van Geffen et al., 2020a), which is likely caused by the viewing zenith angle (VZA) dependency of the spectral calibration and detector sensitivity (Boersma et al., 2018). To reduce the systematic stripes, a de-striping correction is applied to the TROPOMI NO2 slant columns, which is calculated empirically (Boersma et al., 2011) based on the daily averaged across-track variability of NO2 slant columns over clean regions between 20∘ S and 20∘ N. The magnitude of the NO2 de-striping correction is up to 1×10¹⁴ molec./cm2 and is stable over time (not shown), in agreement with the operational TROPOMI de-striping that relies on the chemistry transport model data (van Geffen et al., 2020a).
2.2 Stratosphere–troposphere separation
The stratospheric NO2 component is estimated using the STREAM method (Beirle et al., 2016). Belonging to the modified reference sector methods, STREAM uses total NO2 column measurements over clean and remote regions as well as over clouded scenes with negligible tropospheric columns. STREAM calculates weighting factors for each satellite pixel to define the contribution of total columns to the stratospheric estimation: potentially polluted pixels are weighted low, cloudy observations with medium cloud heights are weighted high, and the weights are further adjusted in the case of large biases in the tropospheric residues. Depending on these weighting factors, stratospheric NO2 fields are derived by a weighted convolution of the total columns using convolution kernels, which are wider at lower latitudes to account for the low longitudinal variability assumption of stratospheric NO2 and narrower at higher latitudes to reflect the stronger natural variations.
STREAM was developed as a verification algorithm for the TROPOMI instrument, as a complement to the operational stratospheric correction based on data assimilation (van Geffen et al., 2020b). STREAM has been successfully applied to the NO2 measurements from GOME, SCIAMACHY, OMI, and GOME-2 (Beirle et al., 2016; Liu et al., 2019b) with the advantage of requiring no model input. In contrast to previous modified reference sector methods which normally apply a conservative masking approach (flagging pixels as either clean or polluted and skipping the latter for stratospheric estimation) and hardly use information over continents, STREAM introduces an improved treatment of polluted and cloudy pixels by defining weighting factors for each satellite pixel. Due to the use of cloudy pixels, which directly reflect the actual stratospheric column as the tropospheric column is mostly shielded, STREAM reduces the bias caused by the free-tropospheric contamination or tropospheric background in the reference region, in comparison with other modified reference sector methods (Beirle et al., 2016). However, the broad-scale free-tropospheric diffuse NO2 might not be fully separated from the stratospheric NO2, which is a general limitation of the modified reference sector methods.
Stratospheric NO2 columns from STREAM differ by up to 3×10¹⁴ molec./cm2 as compared to results from data assimilation and other modified reference sector methods, within the general uncertainties of stratosphere–troposphere separation (Beirle et al., 2016; Boersma et al., 2018). The STREAM stratospheric NO2 columns show an average bias of molec./cm2 with respect to the ground-based zenith-scattered light differential optical absorption spectroscopy (ZSL-DOAS) measurements (Compernolle et al., 2020).
2.3 AMF calculation
The conversion between the slant column S and the vertical column V is implemented by division with an AMF M:
Given the small optical depth of NO2, M can be derived as
where ml denotes the box-AMFs in layer l, xl is the partial column from the a priori NO2 profile, and cl is a correction coefficient to correct for the temperature dependency of the NO2 cross-section (Boersma et al., 2004; Nüß et al., 2006; Bucsela et al., 2013). ml is a function of model inputs b, which include TROPOMI measurement geometries, surface albedo, and surface pressure. The box-AMF ml values are calculated at 437.5 nm (near the mid-point wavelength of fitting window 405–465 nm), as recommended by Boersma et al. (2018), using the linearized vector code VLIDORT version 2.7 (Spurr, 2006). The light path in the troposphere is affected by scattering on air molecules as well as cloud and aerosol particles, and therefore the tropospheric AMF calculation depends on surface albedo, a priori NO2 profiles, and cloud properties. Table 1 summarizes the parameters used in the AMF calculation in several research products and the operational product. Figure 2 shows the tropospheric NO2 columns retrieved from the reference algorithm over Europe in February and August 2019. A large amount of NO2 is located in the troposphere for industrialized and urbanized areas (see Fig. 1).
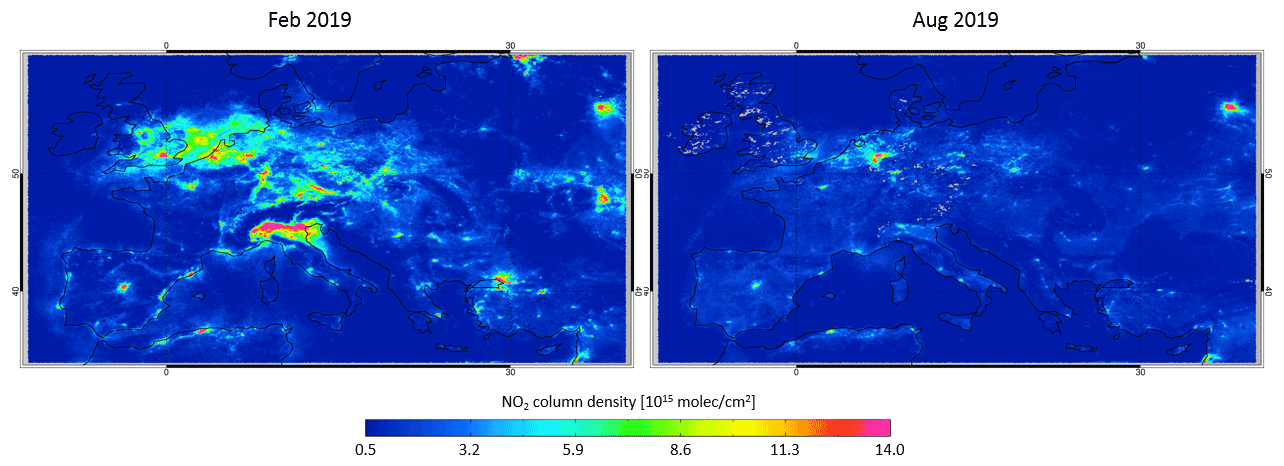
Figure 2Tropospheric NO2 columns from the reference algorithm over Europe in February and August 2019. Only measurements with a cloud radiance fraction less than 0.5 are included.
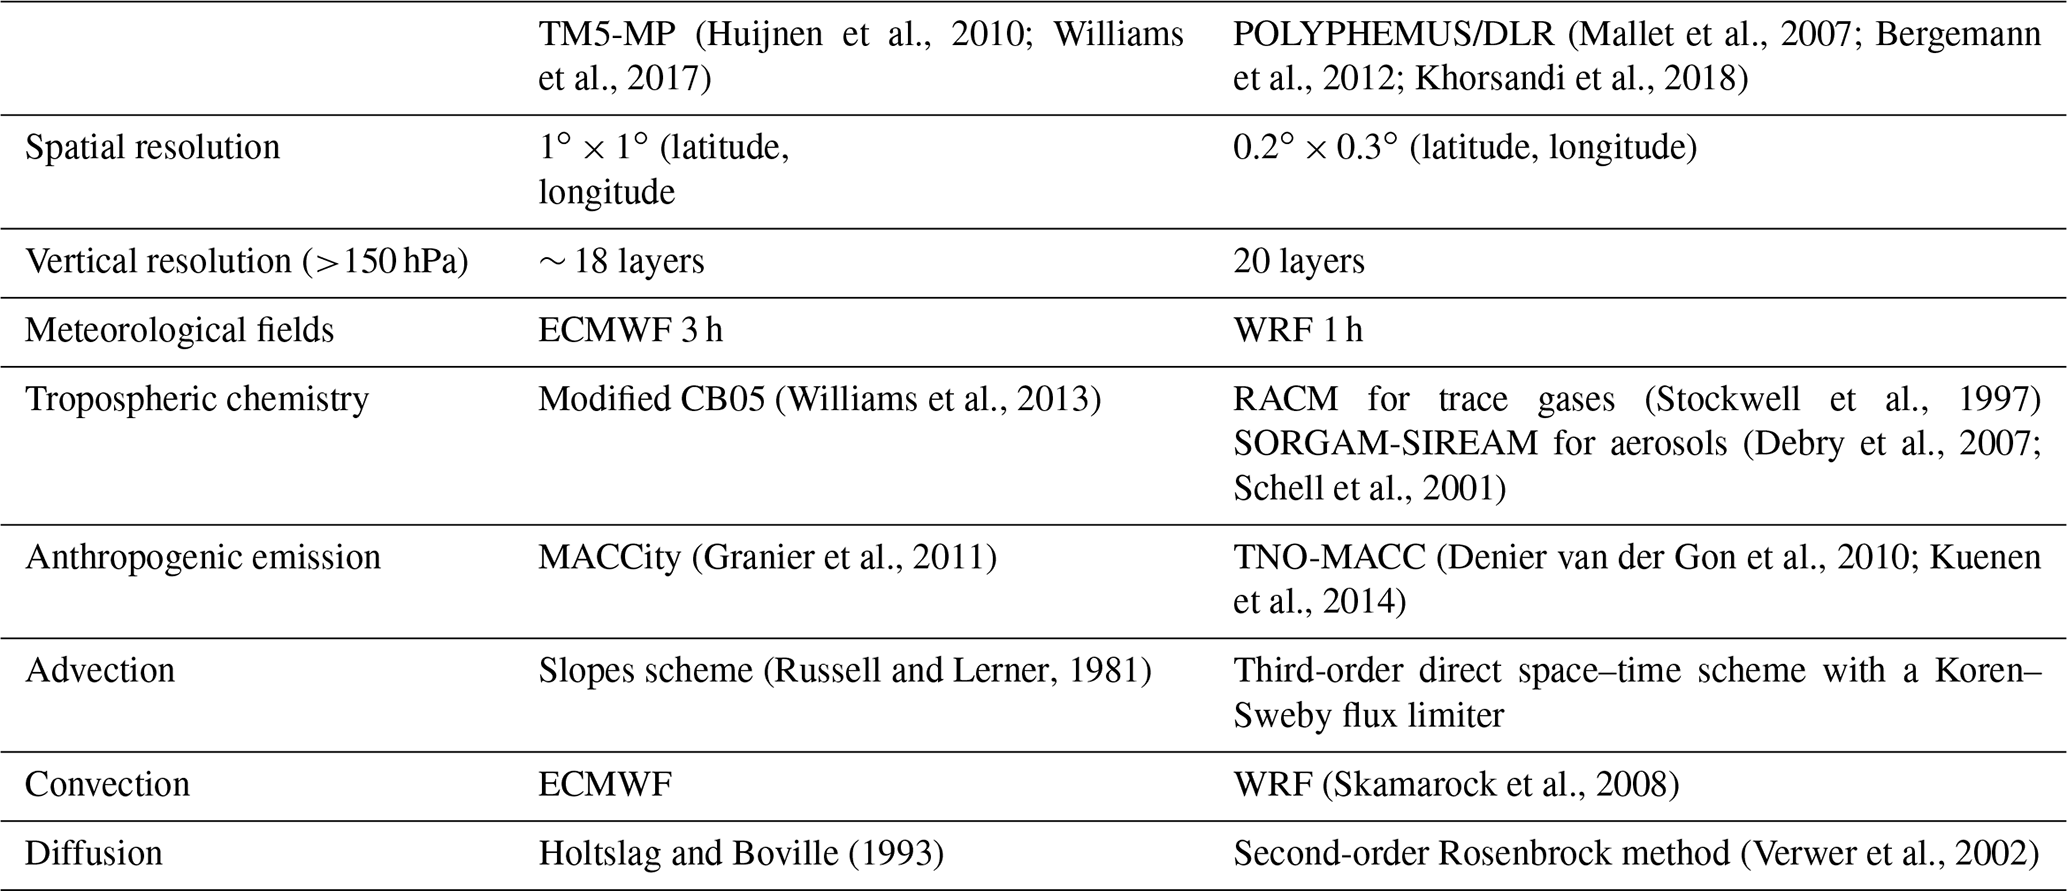
Table 1Overview of tropospheric NO2 column retrievals. See Table 2 for details of the chemistry transport models used to obtain the a priori NO2 profiles for the DLR improved retrieval in this work.

In the reference algorithm, the surface albedo is described by a monthly climatology based on 4 years (2004–2007) of OMI LER measurements at 440 nm (Kleipool et al., 2008), with a similar overpass time and viewing conditions as TROPOMI. The surface albedo for each TROPOMI pixel is calculated by an area-weighted tessellation of the OMI monthly averaged surface albedo maps (0.5∘ × 0.5∘) and a linear interpolation in time to the measurement day.
Daily TM5-MP vertical NO2 profiles (Williams et al., 2017) simulated at a global 1∘ × 1∘ resolution are used as a priori NO2 vertical profiles due to the operational advantage, as summarized in Table 2. The a priori profiles are determined for the satellite overpass time and interpolated to the centre of the TROPOMI pixel based on four nearest-neighbour TM5-MP cell centres.
(Huijnen et al., 2010; Williams et al., 2017)(Mallet et al., 2007; Bergemann et al., 2012; Khorsandi et al., 2018)(Williams et al., 2013)(Stockwell et al., 1997)(Debry et al., 2007; Schell et al., 2001)(Granier et al., 2011)(Denier van der Gon et al., 2010; Kuenen et al., 2014)(Russell and Lerner, 1981)(Skamarock et al., 2008)Holtslag and Boville (1993)(Verwer et al., 2002)Table 2Summary of the chemistry transport model specifications.
In the presence of clouds, the AMF calculation adopts the independent pixel approximation (Cahalan et al., 1994):
where Mcl represents the AMF for completely cloudy sky and Mcr for completely clear sky. Mcl and Mcr are derived with Eq. (3), with Mcl mainly relying on the cloud pressure (height) and the cloud albedo (optical depth). The cloud radiance fraction ω is derived from the TROPOMI cloud fraction cf:
with Icl and Icr representing the radiances for cloudy and clear scenes, respectively. Icl and Icr are calculated using the LIDORT version 3.6 model (Spurr et al., 2001), depending mostly on TROPOMI viewing geometries, surface albedo, and cloud albedo.
The operational TROPOMI cloud parameters from the OCRA/ROCINN algorithms (Lutz et al., 2016; Loyola et al., 2018) with clouds treated as opaque Lambertian surfaces (CRB model) are applied for the cloud correction. OCRA derives the cloud fraction by separating a spectral scene into a cloudy contribution and a cloud-free background. With the OCRA cloud fraction and the surface albedo from the MERIS black-sky climatology (Popp et al., 2011) as inputs, ROCINN calculates the cloud pressure and cloud albedo by comparing the measured and simulated sun-normalized radiances in and around the O2 A band in the NIR.
The original OCRA takes the spectral information from the UV–Vis–NIR part (320–800 nm) and transforms the radiances of three predefined spectral ranges to three-colour reflectances (RGB – red, green, and blue – region of the spectrum). The cloud-free background maps are calculated for each of these three colours. For the TROPOMI application, the OCRA colour space approach is applied, with two colours (GB) using the UV–Vis (350–495 nm) spectra to avoid the spatial misalignment between the UV–Vis and NIR footprints.
Based on the Lambertian cloud assumption, OCRA/ROCINN_CRB tends to retrieve a cloud height (at the optical centroid of the cloud rather than the cloud top) close to the surface altitude for the low cloud fraction (Compernolle et al., 2021). The Lambertian cloud assumption is also applied in the Fast Retrieval Scheme for Clouds from the O2 A band (FRESCO) algorithm (Koelemeijer et al., 2001; Wang et al., 2008). FRESCO for Sentinel (FRESCO-S) (Wang and Sneep, 2019) is implemented as a support product for the TROPOMI operational NO2 processing (van Geffen et al., 2020b). FRESCO-S retrieves the cloud fraction and cloud pressure from the reflectance in and around the O2 A band. The cloud albedo is assumed to be 0.8, as opposed to OCRA/ROCINN, where cloud albedo is retrieved.
STREAM was originally designed for TROPOMI and optimized for OMI within TROPOMI verification activities (Beirle et al., 2016). STREAM consists basically of two steps: the definition of weighting factors for each satellite pixel and the application of weighted convolution. To identify potentially polluted areas, a climatology of tropospheric NO2 columns is derived in this study using TROPOMI NO2 measurements from 2018–2019, instead of using SCIAMACHY NO2 measurements from 2003-2011 as in the original STREAM. Based on the pollution weight, as well as the cloud weight and tropospheric residue weight, STREAM estimates stratospheric fields for individual orbits using a weighted convolution on 0.5∘ × 0.5∘ grid pixels.
As a result of wide swath (∼2600 km), local time differences across a TROPOMI swath are considerable at high latitudes, and the NO2 measurements show dependency on VZA (directly related to local time) due to the diurnal variation of stratospheric NO2 (Dirksen et al., 2011; Belmonte Rivas et al., 2014). Figure 3 shows the total NO2 columns measured by TROPOMI in January 2019 for different latitudes as a function of VZA. The impact of local time changes across the orbit is up to 2×10¹⁴ molec./cm2 at the swath edge for latitudes higher than 50∘, in agreement with estimations for OMI measurements (Beirle et al., 2016). The de-striping correction is implemented before STREAM, but only small-scale variation is removed.
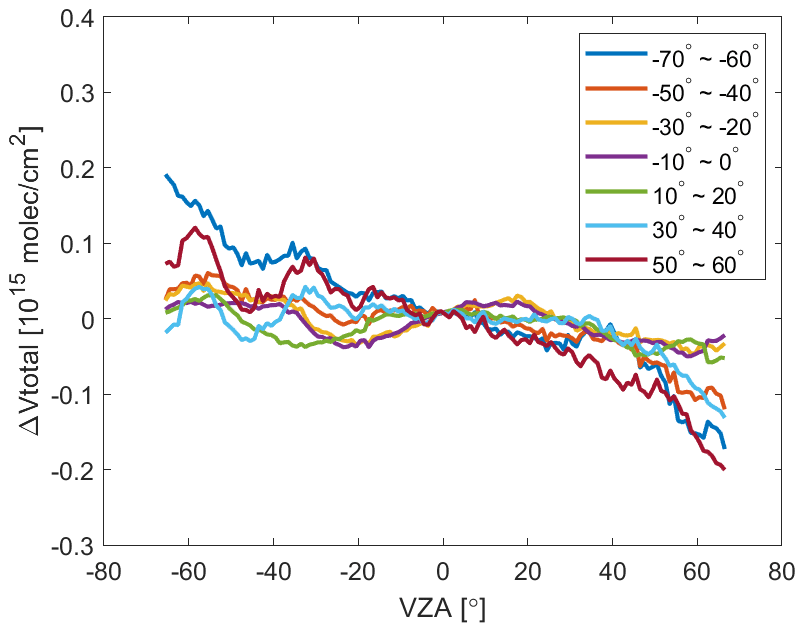
Figure 3VZA dependency of TROPOMI total NO2 columns (compared to nadir) at different latitudes in January 2019. The VZA is defined negative for observations on the west side of the orbit swath. The de-striping is implemented here.
In the following, the concept of a directionally dependent STREAM (DSTREAM) is introduced to estimate the stratospheric NO2 column (Sect. 3.1). The performance of STREAM and DSTREAM is analysed using synthetic TROPOMI NO2 data (Sect. 3.2), and both algorithms are applied to TROPOMI measurements (Sect. 3.3).
3.1 DSTREAM
To correct for the VZA dependency of stratospheric NO2, the DSTREAM is developed, which divides the orbit swath into western (VZA from ∼ −66 to ∼ −30∘), central (VZA from ∼ −30 to ∼ 30∘), and eastern (VZA from ∼ 30 to ∼ 66∘) segments. Note that the VZA is defined negative for observations on the west side of the orbit swath throughout the study. For each of the orbit swath containers, the original STREAM is applied based on data from the respective orbit swath segment.
For each individual satellite pixel with a VZA, a directionally dependent stratospheric NO2 column is parameterized using a linear interpolation on the DSTREAM grid results estimated using the eastern, central, and western segments of the orbit swath. As the VZA dependency is negligible for low latitudes (from Fig. 3), and the interpolation error may increase for due to less orbital overlap, the final stratospheric NO2 column Vs is calculated as the weighted mean in dependence on latitude θ:
By this method, the stratospheric NO2 from the original STREAM is applied for the Equator, and the VZA dependency is captured for polar regions with significant orbital overlap.
3.2 Application to synthetic data
The performance of the original STREAM and the improved DSTREAM for TROPOMI is evaluated with simulated NO2 fields from the IFS(CB05BASCOE) experiment (Huijnen et al., 2016). Particularly advantageous for stratospheric studies, the tropospheric chemistry module in the Integrated Forecast System (IFS) is extended with the stratospheric chemistry from the Belgian Assimilation System for Chemical ObsErvations (BASCOE) system. The STREAM and DSTREAM are applied to the synthetic TROPOMI total NO2 columns, and the estimated stratospheric NO2 columns are compared with the a priori truth (stratospheric fields from model). See Liu et al. (2019b) for more details on constructing synthetic total and stratospheric NO2 columns.
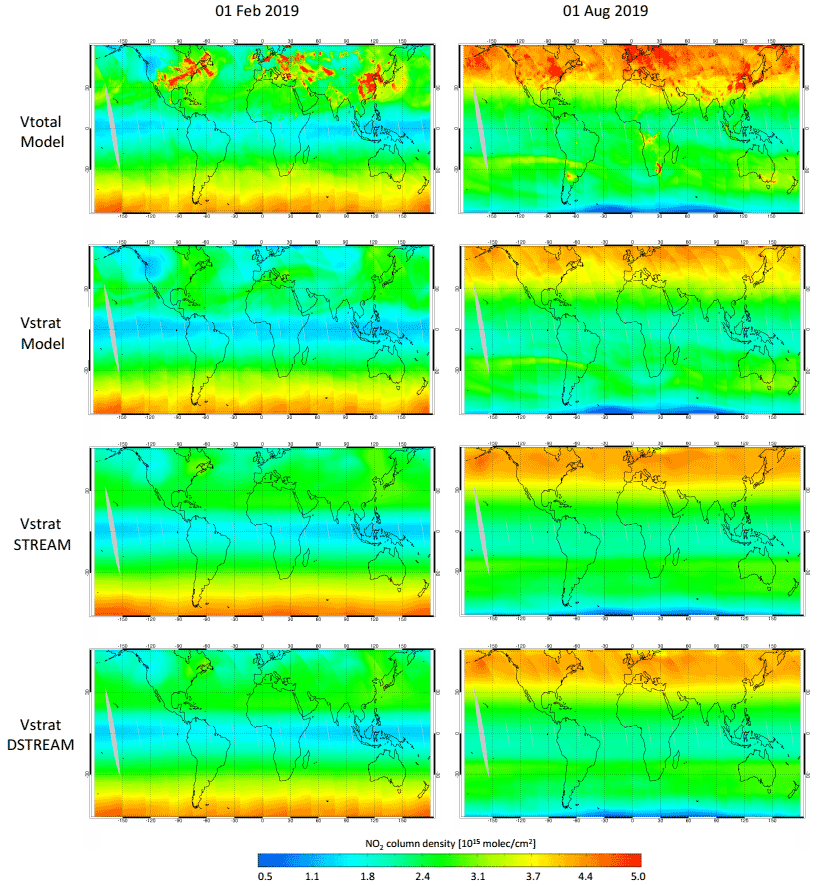
Figure 4Synthetic total NO2 columns, a priori stratospheric NO2 columns from IFS(CB05BASCOE), and estimated stratospheric NO2 columns from STREAM and DSTREAM on 1 February and 1 August 2019.
Figure 4 displays the synthetic total NO2 columns from IFS(CB05BASCOE), the modelled stratospheric columns, and the estimated stratospheric columns from STREAM and DSTREAM on 1 January and 1 August 2019. The overall latitudinal and seasonal dependencies are reflected in the stratospheric fields from STREAM and DSTREAM. Smaller structures in the synthetic total columns and the modelled stratospheric columns at high latitudes, caused by the diurnal variation of stratospheric NO2 across the orbital swath, are aliased into the troposphere by STREAM but captured by DSTREAM. The average difference between the estimated and a priori results is 4×10¹⁴ molec./cm2 for STREAM and 3.5×10¹⁴ molec./cm2 for DSTREAM, with improvements mainly for latitudes higher than 50∘.
3.3 Application to TROPOMI measurements
Applying STREAM and DSTREAM to TROPOMI data, Fig. 5 shows the total columns from TROPOMI and the estimated stratospheric fields on 1 February and 1 August 2019. For both months, the STREAM and DSTREAM show similar global patterns of stratospheric NO2. The stratospheric and tropospheric contributions over polluted regions are successfully separated due to the use of clean and cloudy measurements at the same latitude where the tropospheric column is shielded. The smooth background at low latitudes is conserved, and the stronger variations of stratospheric NO2 at higher latitudes are captured, for example, in the polar vortex on 1 February.
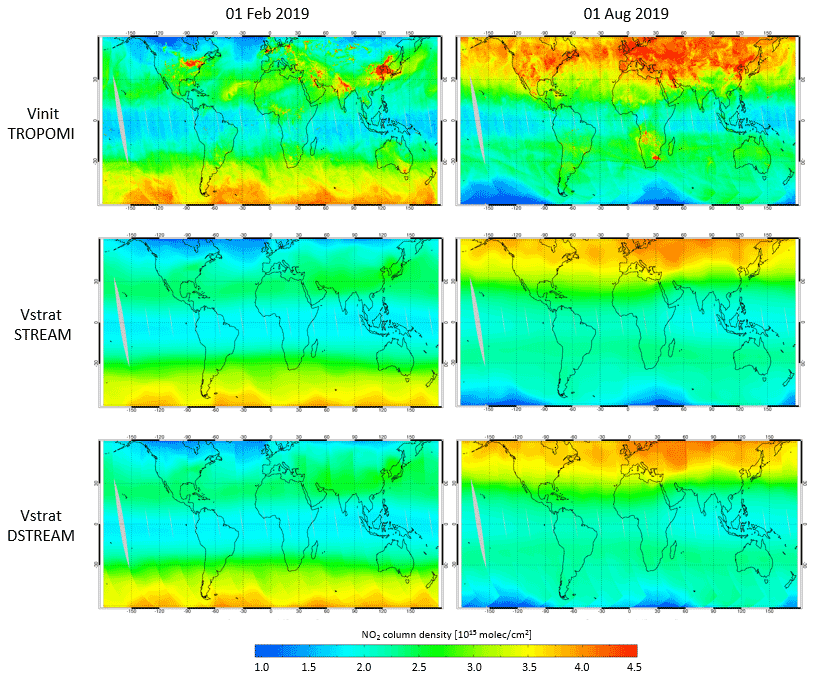
Figure 5Total NO2 columns and stratospheric NO2 columns estimated using STREAM and DSTREAM, as measured by TROPOMI on 1 February and 1 August 2019.
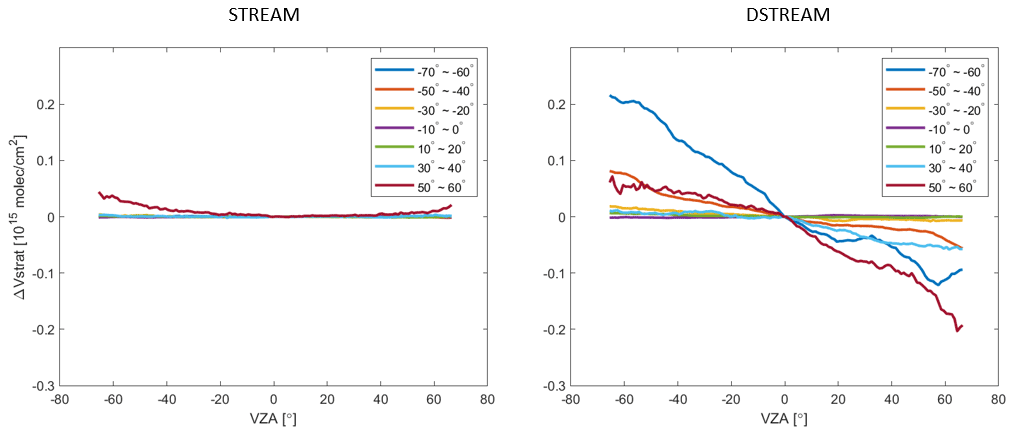
Figure 6VZA dependency of TROPOMI stratospheric NO2 columns estimated using STREAM and DSTREAM (compared to nadir) at different latitudes in January 2019. The VZA is defined negative for observations on the west side of the orbit swath.
Figure 6 shows the TROPOMI stratospheric columns estimated using STREAM and DSTREAM for different latitudes as a function of VZA in January 2019. The VZA dependency by up to 2×10¹⁴ molec./cm2 caused by the local time difference in Fig. 3 is captured by DSTREAM, particularly for high latitudes. The overestimation on the west side of swath edge and the underestimation on the east side in the STREAM results are corrected in DSTREAM.
4.1 Surface albedo
Surface albedo is an important parameter for an accurate retrieval of trace gas columns and cloud properties. The sensitivity of backscattered radiance to the boundary layer NO2 is strongly related to the surface albedo, especially over polluted areas. In this study, the surface albedo is described using GE_LER retrieved by the FP_ILM algorithm (Loyola et al., 2020b). Unlike conventional approaches (Rodgers, 2000; Doicu et al., 2010), FP_ILM is a machine-learning-based approach consisting of a training phase, wherein an inverse function is derived from synthetic data generated with a radiative transfer model, and an operational phase, wherein the inverse function is applied to measured spectra. The FP_ILM algorithm has been employed to retrieve ozone profile shapes and sulfur dioxide layer heights from GOME-2 and TROPOMI (Xu et al., 2017; Efremenko et al., 2017; Hedelt et al., 2019).
Combining the DOAS equation in Eq. (1) and the conventional forward model, our forward problem can be formulated as an approximation of the DOAS-fitted slant column density (SCD) and the DOAS polynomial (P) using the forward model (F) with the solar/satellite viewing geometry (Θ), effective scene pressure (pe), and surface albedo (As):
During the training phase, synthetic TROPOMI spectra in the 405–465 nm range are simulated by LIDORT version 3.6 (Spurr et al., 2001) in conjunction with the smart sampling technique (Loyola et al., 2016). The cloud impact is considered in the simulations with the use of the effective scene pressure pe, which is provided in the new version 2.1 processor for OCRA/ROCINN (see Sect. 4.3.1). The aerosol influence is not considered. The DOAS fitting is applied to the simulated spectra using the consistent DOAS settings as introduced in Sect. 2.1. The simulation results from Eq. (7) are grouped as inputs to a multi-layer neural network, and the neural network is trained to learn the inverse function. In the operational phase, GE_LER is generated using the trained neural network and the DOAS results from the measured spectra. An additional polynomial fitting is subsequently included to account for the bidirectional reflectance distribution function (BRDF) effect.
For consistency with the NO2 retrieval, the GE_LER retrieval is performed for every single ground pixel using the same TROPOMI spectrum and DOAS configurations. Global maps are generated from the GE_LER retrievals under clear-sky conditions (OCRA cloud fraction small than 0.05) and updated on a daily basis on a time window between 1 and 4 weeks depending on cloudiness. In contrast to the OMI LER climatology, the GE_LER data rely on the measurements from the TROPOMI instrument itself with a higher spatial resolution (0.1∘ × 0.1∘) and better characterize the actual surface conditions, particularly for snow/ice scenarios.
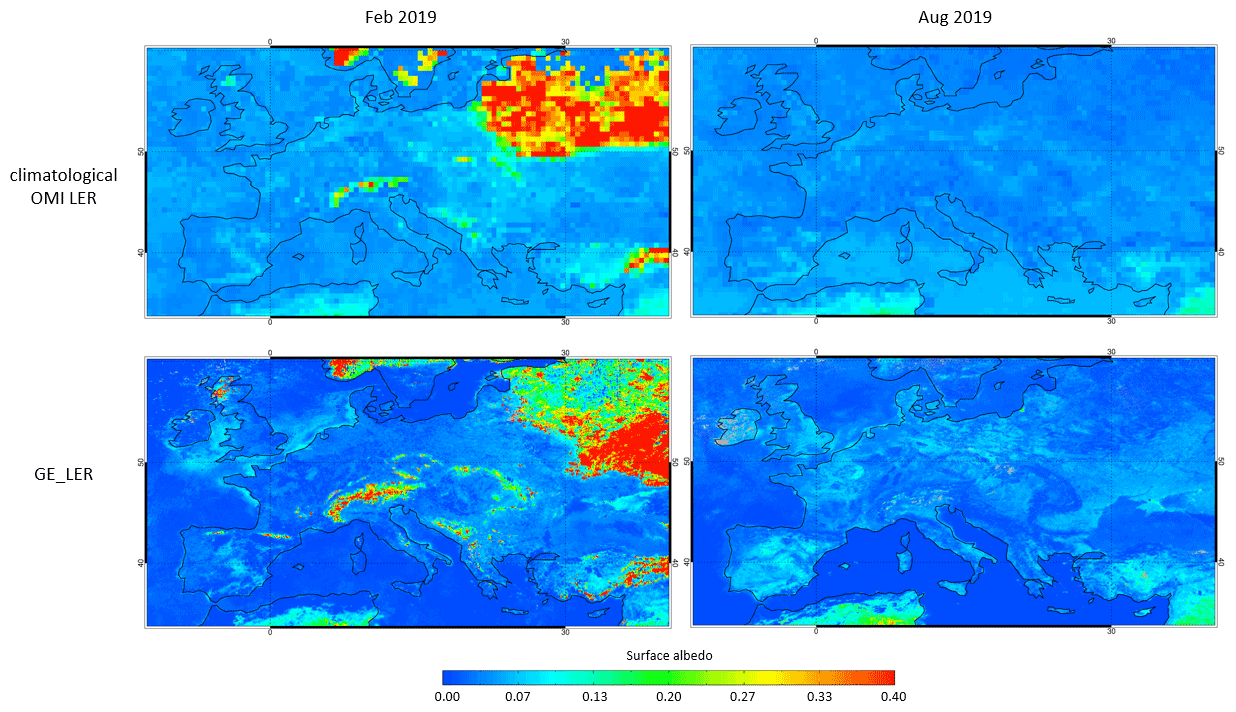
Figure 7OMI surface LER climatology at 440 nm (Kleipool et al., 2008) and GE_LER retrieved from TROPOMI data in the NO2 retrieval window (405–465 nm) over Europe in February and August 2019.
Figure 7 compares the climatological OMI LER data and GE_LER data for February and August 2019. The mean differences between the surface LER values from GE_LER and OMI climatological values are lower than 0.03. The improved spatial resolution for GE_LER enables a better representation of surface features. Larger differences by more than 0.2 are found in winter over snow/ice regions such as Russia and the Alps because GE_LER captures the actual snow/ice conditions. The GE_LER values are higher by up to 0.05 over the North Sea, due to the use of only 1 month of TROPOMI data compared to the multiple years for OMI climatology, which makes GE_LER more likely to be affected by aerosol contamination or outliers in the input data. In the near future, an improved aerosol screening based on TROPOMI aerosol index data will be implemented in the GE_LER algorithm. An independent neural network will be trained and implemented for error estimation.
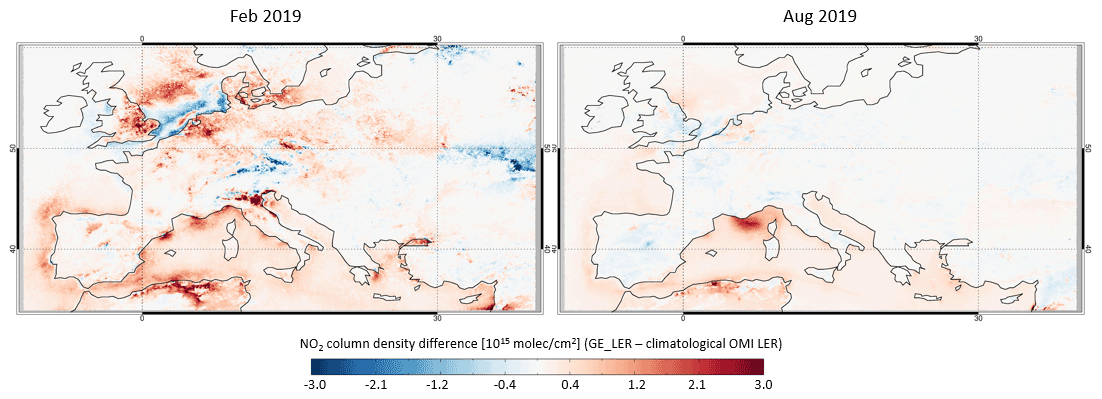
Figure 8Differences in the tropospheric NO2 columns retrieved using the climatological OMI LER and GE_LER over Europe in February and August 2019. Only measurements with a cloud radiance fraction less than 0.5 are included.
Figure 8 shows the monthly average differences in the tropospheric NO2 columns retrieved using the climatological OMI LER and the TROPOMI GE_LER in February and August 2019. An effect is noticed mainly in winter under polluted conditions. Consistent with the LER changes in Fig. 7, the general reduced surface LER from GE_LER results in a decrease in the tropospheric AMF and thus an increase in the calculated tropospheric NO2 column by up to 3×10¹⁵ molec./cm2. A reduction by up to 1×10¹⁵ molec./cm2 is found for snow/ice coverages and aerosol scenes.
4.2 A priori NO2 profiles
To account for the varying sensitivity of the satellite to NO2 at different altitudes, the POLYPHEMUS/DLR simulations (Mallet et al., 2007) with a spatial resolution of 0.2∘ × 0.3∘ (latitude, longitude) and a temporal resolution of 1 h are applied for Europe (34.0–60.4∘ N, 12.0∘ W–40.2∘ E) in this study. Compared to the reference algorithm using TM5-MP a priori NO2 profiles, it can be expected that the improved resolution of POLYPHEMUS/DLR is more able to capture the local NO2 distribution accurately, particularly for regions with large heterogeneity and variability. An additional increase of the spatial resolution from 0.2∘ × 0.3∘ to 0.1∘ × 0.1∘ affects the tropospheric NO2 columns moderately by up to 5×10¹⁴ molec./cm2 or 11 % for polluted regions.
As summarized in Table 2, the meteorological parameters are provided by Weather Research and Forecasting (WRF) Version 3.5 daily forecasts with a 30 km × 30 km spatial resolution, initialized by daily Global Forecast System (GFS) global forecast from the National Oceanic and Atmospheric Administration (NOAA). The original POLYPHEMUS model is an assembly of several Eulerian and Gaussian models for handling passive tracers, photochemistry, and aerosol dynamics (Mallet et al., 2007) and is developed based on the chemistry transport model Polair3D (Boutahar et al., 2004). In this study, the Regional Atmospheric Chemistry Modeling (RACM) chemical mechanism (Stockwell et al., 1997) is applied along with the Size-REsolved Aerosol Model (SIREAM) and Secondary ORGanic Aerosol Model (SORGAM) size-resolved aerosol model (Debry et al., 2007; Schell et al., 2001). The anthropogenic emissions are extracted from the European TNO-MACC (from 2011 with base year 2005) emission inventory (Denier van der Gon et al., 2010; Kuenen et al., 2014). With a spatial resolution of 7 km × 7 km, TNO-MACC defines 10 source categories including road transport and shipping and uses source-sector-specific data in a harmonized way. Biogenic emissions from soils are computed as proposed in Simpson et al. (1999). Lightning emissions are not considered.
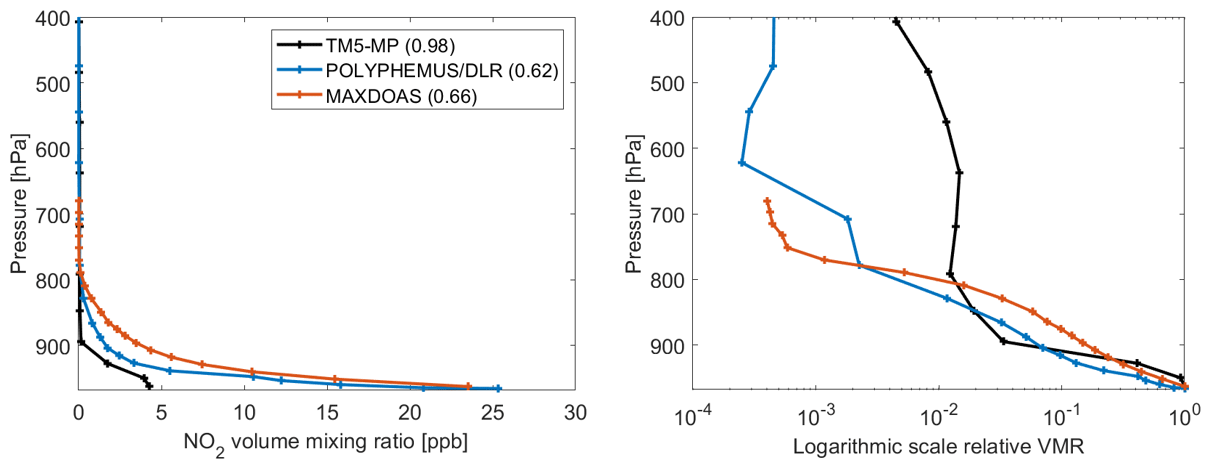
Figure 9A priori NO2 profiles from the chemistry transport models TM5-MP and POLYPHEMUS/DLR and the low-tropospheric NO2 profile derived from the ground-based MAX-DOAS measurements over Munich in Germany (48.15∘ N, 11.57∘ E) on 5 February 2019. The calculated clear-sky tropospheric AMF is given in brackets next to each label in the legend. Normalized profiles (to the lowest values) are also shown on a logarithmic scale.
Figure 9 shows the TM5-MP and POLYPHEMUS/DLR a priori NO2 profiles over Munich in Germany (48.15∘ N, 11.57∘ E) on 5 February 2019, with the calculated clear-sky tropospheric AMFs also reported. POLYPHEMUS/DLR shows a higher surface layer NO2 concentration and yields a tropospheric AMF that is reduced by 0.36 (36.7 %). Figure 9 additionally shows the low-tropospheric NO2 profile derived from the ground-based MAX-DOAS data (Chan et al., 2020) and the tropospheric AMF calculated using the MAX-DOAS NO2 profile as a priori information (assuming a constant profile shape for the high troposphere). With a typical horizontal sensitivity of a few kilometres, the MAX-DOAS profile shows large amounts of NO2 in the lower troposphere (Irie et al., 2011; Wagner et al., 2011). In comparison with the tropospheric AMF calculated using the MAX-DOAS NO2 profile, the bias reduces from 0.32 (48.5 %) for TM5-MP to −0.04 (−6.0 %) for POLYPHEMUS/DLR.
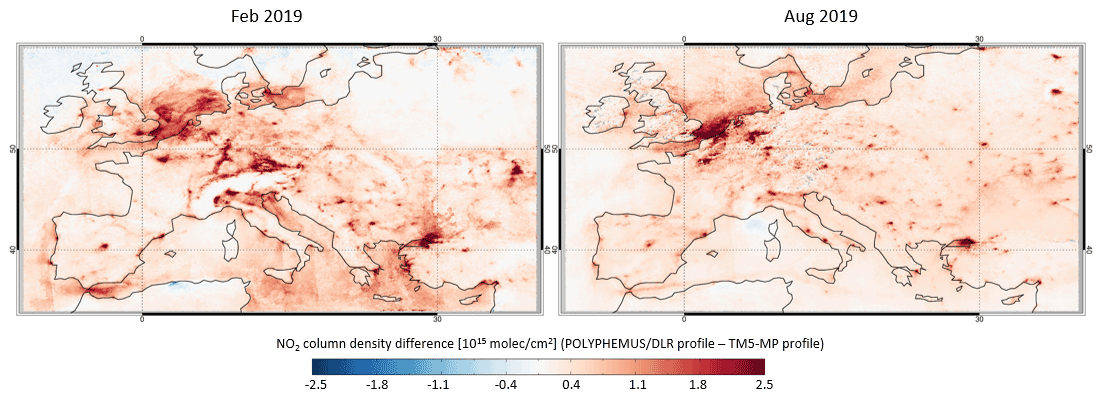
Figure 10Differences in the tropospheric NO2 columns retrieved using the TM5-MP and POLYPHEMUS/DLR a priori NO2 profiles over Europe in February and August 2019. Only measurements with a cloud radiance fraction less than 0.5 are included.
Figure 10 shows the monthly average differences in the tropospheric NO2 columns retrieved using TM5-MP and POLYPHEMUS/DLR a priori NO2 profiles in February and August 2019. POLYPHEMUS/DLR uses the TNO-MACC emission database, which generally shows higher total NO2 emissions at much higher spatial resolution in comparison with the global MACCity inventory. Further tests to investigate the sensitivity of model NO2 profiles have concluded that the horizontal resolution and the representation of the tropospheric boundary layer have the largest influence (not shown). The generally steeper profile shape from POLYPHEMUS/DLR (see Fig. 9) increases the retrieved tropospheric NO2 columns by more than 2×10¹⁵ molec./cm2 for pollution hotspots, for example, regions with large population or heavy industry in the Benelux, northern Italy, and western Turkey, as well as highways with intense road traffic in northern Spain, southern France, and western Germany.
Figure 11 compares the tropospheric NO2 columns from TROPOMI measurements and POLYPHEMUS/DLR simulations. The satellite averaging kernel, which describes the vertical sensitivity of measurements of NO2 concentrations, is applied to reduce the systematic biases caused by unrealistic a priori profile information. From Fig. 11, it is shown that POLYPHEMUS/DLR NO2 columns are generally higher than satellite measurements, which can be partly related to the use of the TNO-MACC emission dataset (Denier van der Gon et al., 2010). Sections S1 and S2 in the Supplement compare the POLYPHEMUS/DLR NO2 results with data from ground-based stations as well as the regional chemistry transfer model LOTOS-EUROS, indicating that POLYPHEMUS/DLR is in general reliable. An update of the POLYPHEMUS/DLR model using the more recent TNO-MACC_II emission is planned for the near future, which reduces the overestimations of tropospheric NO2 columns by up to 50 %. We note here that the profile shape is of far more importance than the column bias for the interpretation of satellite retrievals.
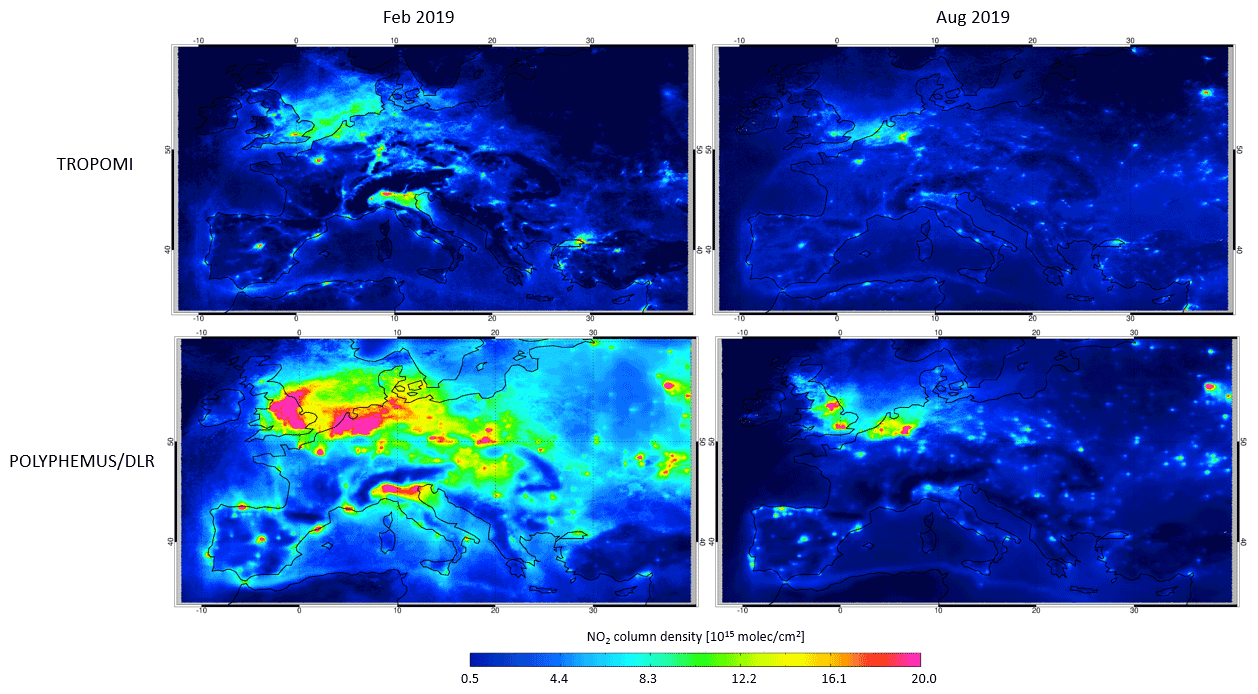
Figure 11Tropospheric NO2 columns from TROPOMI measurements (retrieved with the POLYPHEMUS/DLR a priori NO2 profiles) and POLYPHEMUS/DLR simulations (using the satellite averaging kernel) over Europe in February and August 2019. Only TROPOMI measurements with a cloud radiance fraction less than 0.5 are included.
4.3 Cloud correction
4.3.1 New processor for OCRA/ROCINN
With a new version 2.1 processor in operation since August 2020 (Loyola et al., 2020a), improvements have been introduced to the OCRA/ROCINN retrievals. The background maps used in the OCRA cloud fraction determination are calculated based on 1 year of TROPOMI data (April 2018–March 2019) instead of the previously used OMI measurements, and the spatial resolution improves from 0.2∘ × 0.4∘ to 0.1∘ × 0.1∘. In the preprocessing step, a TROPOMI-based VZA dependency correction is applied instead of using the OMI measurements.
For ROCINN, the static MERIS surface albedo climatology (Popp et al., 2011) is replaced with the dynamic online GE_LER retrieval in the ROCINN fitting window, which derives the surface properties directly from TROPOMI itself on a daily basis (see Sect. 4.1). The co-registration between the UV–Vis band (used by OCRA) and the NIR band (used by ROCINN) is optimized with a lookup table containing the fraction of overlapping area between the target and source pixels, and the cloud properties are provided in both spectral bands. Over snow/ice surfaces indicated by the European Centre for Medium-Range Weather Forecasts (ECMWF) dataset, the effective scene pressure and scene albedo values, which are added in the version 2.1 processor, are applied in the NO2 AMF calculation when the difference between the scene pressure and the surface pressure is less than 2 % and the observation is considered to be nearly cloud-free (van der A et al., 2020).
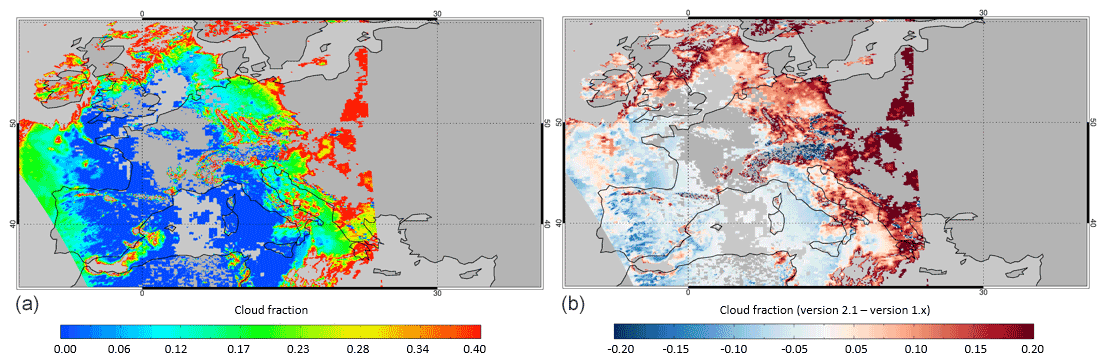
Figure 12OCRA cloud fractions from the version 2.1 processor (left) and comparisons with version 1.x (right) over Europe for orbit 6939 on 14 February 2019. Only measurements with 0 < cloud fraction are included.
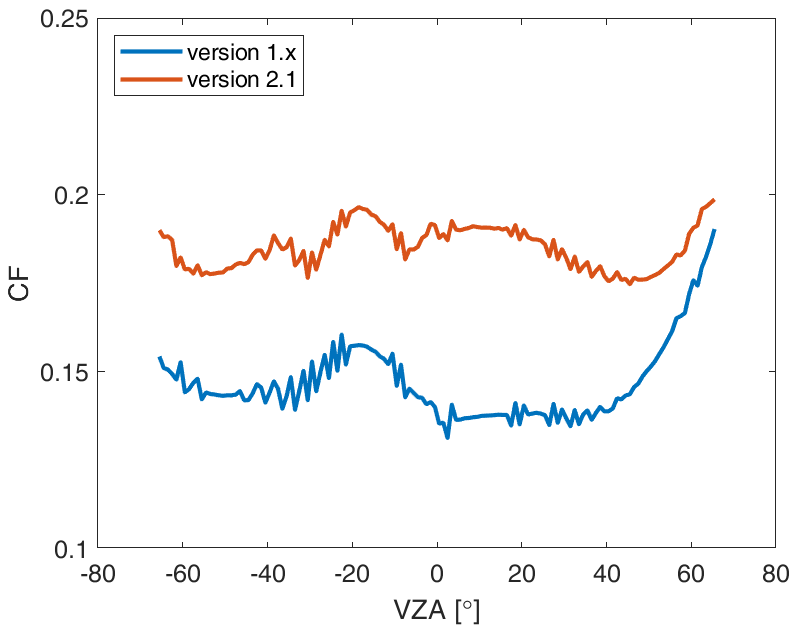
Figure 13OCRA cloud fractions from the version 1.x and 2.1 processors in February 2019. Only measurements with 0< cloud fraction are included. The VZA is defined negative for observations on the west side of the orbit swath.
Figure 12 compares the OCRA cloud fractions from the version 1.x (1.0 and 1.1) and 2.1 processors for orbit 6939 on 14 February 2019. The update of cloud-free background maps increases the cloud fractions by more than 0.1 for large cloud fraction values and reduces the values by more than 0.1 for snow/ice cover, for example, over the Alps and the Ore Mountains. Figure 13 shows the OCRA cloud fractions as a function of VZA. Mainly due to the updated VZA correction, the overestimation of cloud fractions, particularly at the east side of the orbit swath, are corrected by more than 0.03 for the new version 2.1 processor.

Figure 14ROCINN_CRB cloud pressures from the version 2.1 processor (a) and comparisons with version 1.x (b) over Europe for orbit 6939 on 14 February 2019. Only measurements with 0< cloud fraction are included.
Figure 14 compares the ROCINN_CRB cloud pressures from the version 1.x and 2.1 processors for orbit 6939 on 14 February 2019. The cloud pressure differences are generally small for optically thin clouds with small cloud fractions. Due to the enlarged OCRA cloud fractions for relatively thick clouds in Fig. 12, the new ROCINN shows increased cloud pressures for large cloud fractions. The decreased cloud pressures, for example, over the Adriatic Sea are related to the reduction of surface albedo. Similar variations are observed for ROCINN_CAL cloud top and base pressures.
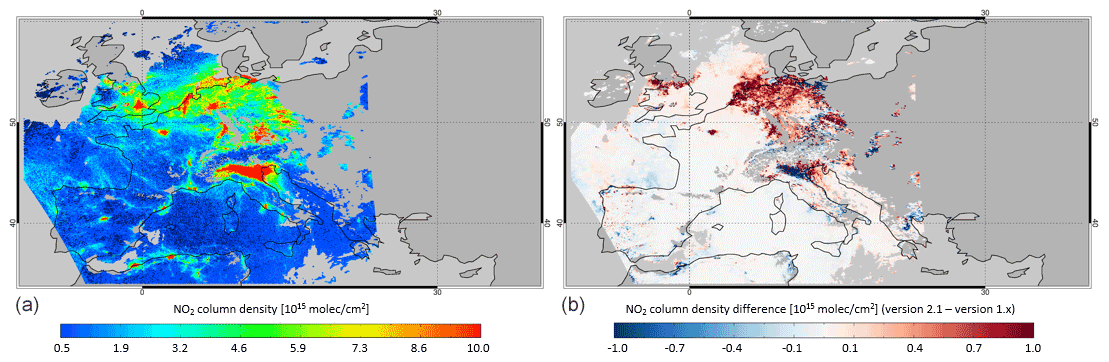
Figure 15Tropospheric NO2 columns retrieved using the OCRA/ROCINN cloud parameters from the version 2.1 processor (a) and differences with version 1.x (b) over Europe for orbit 6939 on 14 February 2019. Only measurements with a cloud radiance fraction less than 0.5 are included.
Figure 15 shows the tropospheric NO2 columns for orbit 6939 on 14 February 2019 and the effect of upgrading the processor for OCRA/ROCINN from version 1.x to version 2.1. The tropospheric NO2 columns reduce by more than 5×10¹⁴ molec./cm2 for the edge of the swath, such as Rome and Naples in Italy, and reduce by up to 3.5×10¹⁴ molec./cm2 for snow/ice scenarios, for instance the Ore Mountains. For polluted areas with optically thicker clouds (cloud fraction larger than 0.15 and cloud pressure larger than 700 hPa), for example, northern Germany and the Benelux, the tropospheric NO2 columns increase by more than 1×10¹⁵ molec./cm2 because the increase in cloud fraction (and thus cloud radiance fraction) makes the retrieval less sensitive to the NO2 below the cloud. The NO2 reductions over the Po Valley are related to an additional check implemented in the version 2.1 processor: the pixel is assumed to be cloud-free for the almost clear-sky condition (cloud fraction <0.1) with the retrieved cloud height very close to the surface height (difference <100 m). This correction improves the data yield of the TROPOMI cloud products compared with other satellite cloud products; the performance of this correction under different surface conditions (dark, bright, snow, ice) or under presence of different types of low-level aerosols (fog, smoke, dust, ash) is under investigation.
4.3.2 CAL cloud model
The cloud correction in our TROPOMI NO2 retrieval is improved using the CAL model from the ROCINN cloud algorithm (Loyola et al., 2018). The CAL model, which regards the clouds as optically uniform layers of light-scattering water droplets, is more representative of the real situation than the CRB model, which treats the clouds as idealized Lambertian reflectors with zero transmittance.
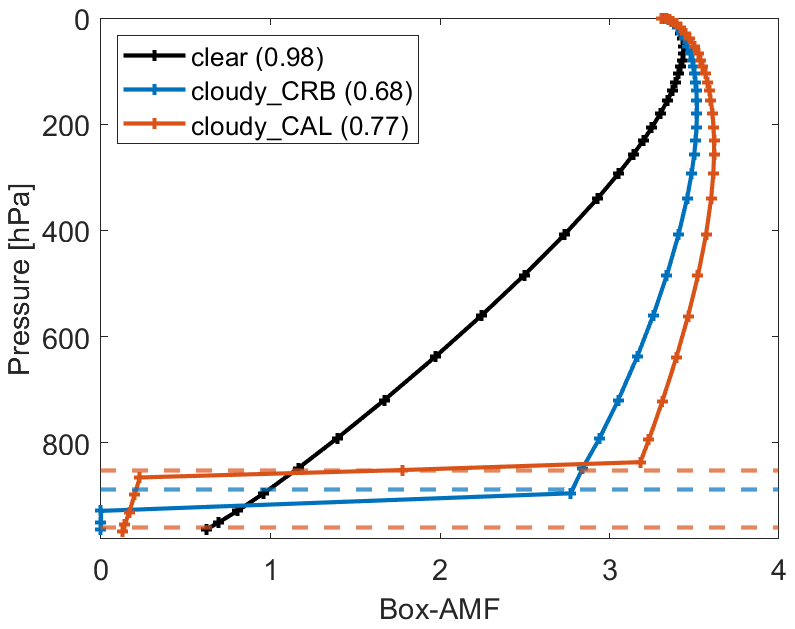
Figure 16Box-AMFs for clear and cloudy sky using the ROCINN_CRB and ROCINN_CAL cloud models over Munich in Germany (48.15∘ N, 11.57∘ E) on 5 February 2019. The calculated tropospheric AMF is given in brackets next to each label in the legend. The ROCINN_CRB cloud top pressure is shown as a horizontal dotted blue line, and the ROCINN_CAL cloud top and base pressures are shown as horizontal dotted brown lines.
Figure 16 presents the box-AMFs for clear and cloudy sky calculated using the CRB and CAL cloud models over Munich in Germany (48.15∘ N, 11.57∘ E) on 5 February 2019. The cloud pressures and the calculated tropospheric AMFs are also reported. Compared to the clear-sky box-AMFs, the cloudy-sky values increase above the cloud layer (albedo effect) and decrease below the cloud layer (shielding effect). The CRB-based cloud retrieval generally shows a cloud height (pressure) close to the altitude of the middle (Ferlay et al., 2010; Richter et al., 2015) because CRB neglects the oxygen absorption within a cloud layer (Vasilkov et al., 2008) and misinterprets the smaller top-of-atmosphere reflectance as a lower cloud layer (Saiedy et al., 1967). Compared to the CRB-based cloud correction, the use of the CAL model considers the sensitivities inside and below the cloud layers and increases the tropospheric AMFs by 0.09 (13.2 %) for Munich.
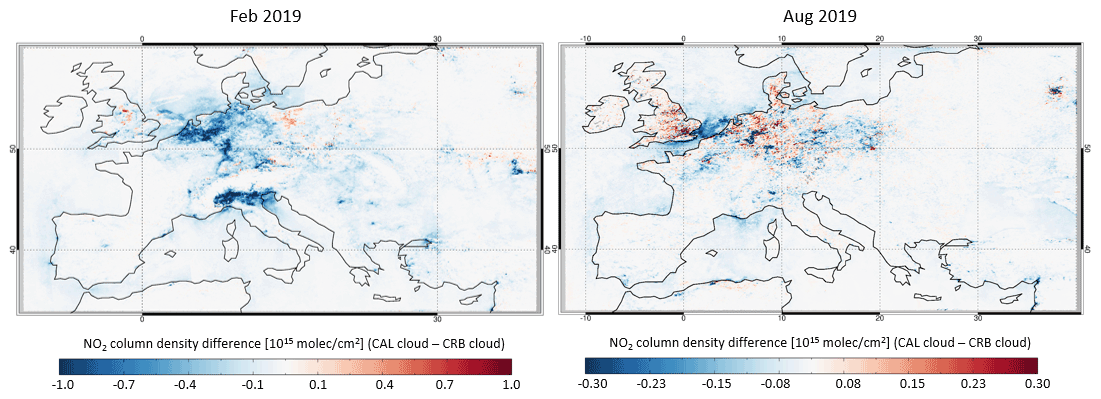
Figure 17Differences in the tropospheric NO2 columns retrieved using the ROCINN_CRB and ROCINN_CAL cloud models over Europe in February and August 2019. Only measurements with a cloud radiance fraction less than 0.5 are included.
Figure 17 presents the monthly average differences in the tropospheric NO2 columns retrieved using the ROCINN_CRB and ROCINN_CAL cloud models in February and August 2019. The use of CAL cloud correction decreases the tropospheric NO2 columns by more than 1×10¹⁵ molec./cm2 (18 %) for polluted regions in winter, when most of the NO2 concentrations are located at the surface (as shown in Fig. 9) and the cloud fractions are generally larger due to the seasonal variation of clouds. The effect is less than 5×10¹⁴ molec./cm2 (10 %) for summer.
5.1 Examples of TROPOMI tropospheric NO2 measurements
Table 3Main settings for the step-by-step improvements and results of the tropospheric NO2 retrievals for the different steps of the updates for Munich (48.15∘ N, 11.57∘ E). The tropospheric NO2 columns (VCDtrop) are given in absolute values (molec./cm2), and the percentage numbers in brackets are changes relative to the reference case. The uncertainties in the tropospheric NO2 columns (VCDtropErr) are given in relative numbers.
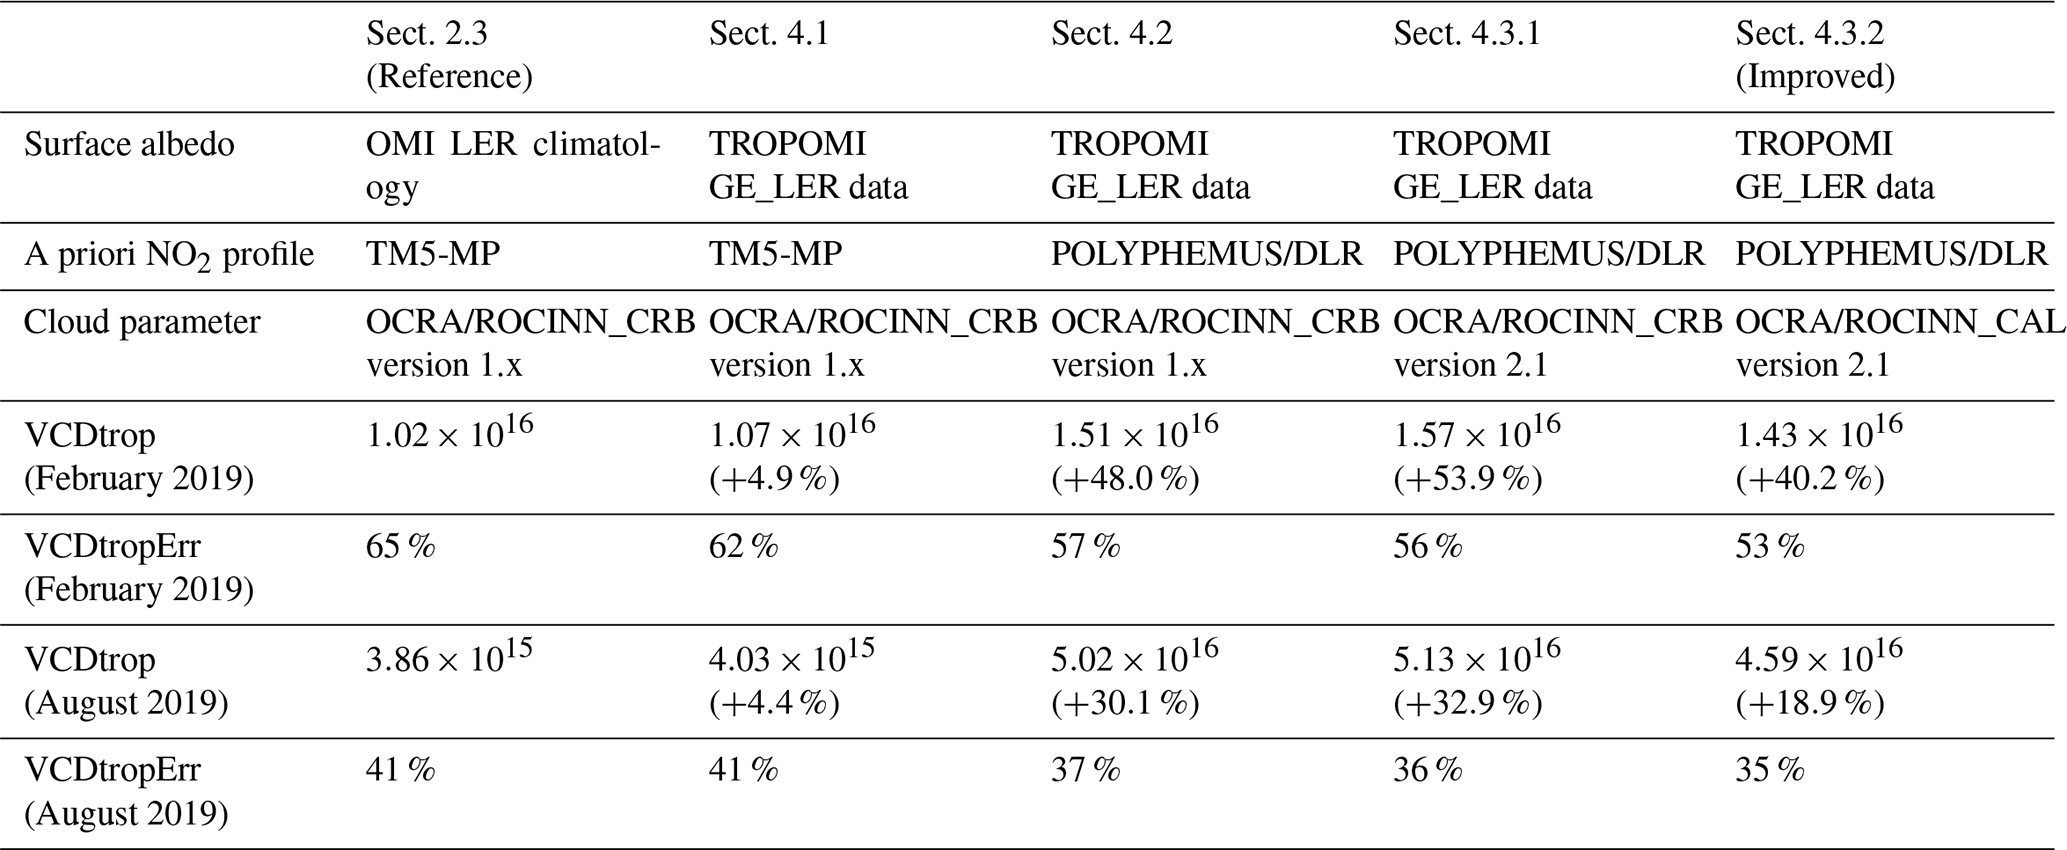

Figure 18Tropospheric NO2 columns from the improved algorithm over Europe in February and August 2019. Only measurements with a cloud radiance fraction less than 0.5 are included.
Table 3 summarizes the tropospheric NO2 retrieval results for the step-by-step updates listed above. Figure 18 shows the tropospheric NO2 columns over Europe retrieved using the improved algorithm in February and August 2019. The tropospheric NO2 columns are higher than 5×10¹⁵ molec./cm2 over urban and industrial areas in winter, such as the Po Valley, Germany's Ruhr region, the Benelux, south-east England, and Turkey's Marmara region. City-size polluted regions, for example, around Paris, Madrid, Rome, Athens, and Moscow, are captured by the TROPOMI NO2 measurements. NO2 emissions over the shipping routes, for example, the maritime connection between the Iberian Peninsula and North Africa, as well as emissions over the highways, for example, the main east–west thoroughfare in Austria, are also detected.
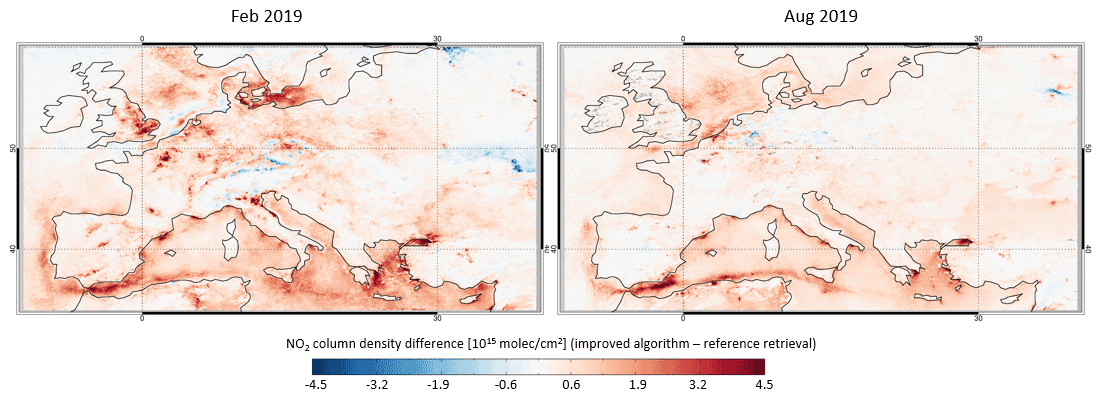
Figure 19Differences in the tropospheric NO2 columns retrieved using the reference algorithm and improved algorithm over Europe in February and August 2019. Only measurements with a cloud radiance fraction less than 0.5 are included.
Figure 19 compares the tropospheric NO2 columns retrieved using the reference algorithm and the improved algorithm over Europe in February and August 2019. The tropospheric NO2 columns are on average enhanced by 2×10¹⁵ molec./cm2 (37 %) in winter and 8×10¹⁴ molec./cm2 (15 %) in summer, mainly due to the combined effect of the improvements in the AMF calculation. Larger differences by more than 3×10¹⁵ molec./cm2 are noticed in polluted regions, such as London, Paris, and the Po Valley, as well as shipping lanes, for example, in the Mediterranean Sea.
5.2 Uncertainty estimates
Derived by uncertainty propagation (Boersma et al., 2004), the overall uncertainty on the tropospheric NO2 column is directly related to the main retrieval steps, which are performed independently and assumed to be uncorrelated. The slant column uncertainty, estimated following a statistical method (Boersma et al., 2007) based on the spatial variability in the slant columns over the Pacific Ocean (20∘ S–20∘ N, 160–180∘ E), is on average 4.5×10¹⁴ molec./cm2, in agreement with van Geffen et al. (2020a). The uncertainty in the stratospheric columns is 3.5×10¹⁴ molec./cm2 for polluted conditions based on the daily synthetic data (see Sect. 3.2) and 1×10¹⁴ molec./cm2 for monthly averages (the values can be regarded as a lower limit due to the use of the finite resolution for the synthetic data).
The tropospheric AMF calculation, which is the largest source of NO2 uncertainty for polluted scenarios (Lorente et al., 2017), is mainly dependent on surface albedo, a priori NO2 profile, cloud fraction, and cloud pressure, as introduced in Sect. 2.3 and 4. The tropospheric AMF uncertainties are calculated based on uncertainty propagation (Boersma et al., 2004) and typical uncertainties of each parameter. The uncertainty contribution from the a priori NO2 profile is practically described by a parameter referred to as profile height, defined as the altitude (pressure) below which 75 % of the integrated NO2 profile resides (De Smedt et al., 2018). The estimated parameter uncertainties considered in the AMF uncertainty budget include 0.0016 for GE_LER albedo (Loyola et al., 2020b), 75 hPa for the POLYPHEMUS/DLR profile (estimated from the profile height standard deviation), 0.05 for the OCRA cloud fraction, and 50 hPa ROCINN cloud pressure (Loyola et al., 2020a).
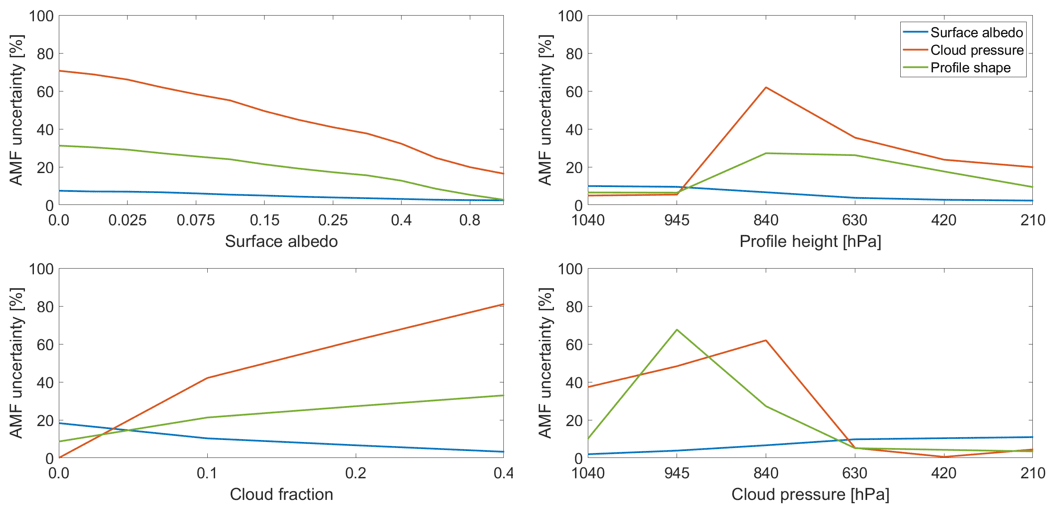
Figure 20Tropospheric AMF uncertainties related to the surface albedo, cloud pressure, and a priori NO2 profile errors. By default, the surface pressure is 1050 hPa, the surface albedo is 0.05, the profile height is 840 hPa, the cloud pressure is 840 hPa, and the cloud fraction is 0.2. The definition of profile height is given in the text.
Figure 20 shows the estimated tropospheric AMF uncertainties due to the errors in the surface albedo, cloud pressure, and a priori NO2 profile. As the satellite measurements are normally filtered for a cloud radiance fraction smaller than 0.5 or a cloud fraction smaller than ∼ 0.2, the uncertainties related to the cloud fraction are generally smaller than 15 % (not shown). From Fig. 20, larger uncertainties are found for small albedo values and for scenarios with large albedo biases, such as new snow/ice coverage. The uncertainties due to the cloud pressure and a priori NO2 profile can be up to 70 % when the cloud is located below or within the NO2 layer, particularly for thick clouds at low altitudes and for polluted situations (large profile heights).
The presence of aerosols can affect the sensitivity to tropospheric NO2, depending on the particle properties and the NO2 and aerosol vertical distribution (Martin et al., 2003; Leitão et al., 2010). The aerosol effect is not explicitly corrected in this study, assuming that the effective cloud parameters from OCRA/ROCINN have partly accounted for the effect of aerosols on the light paths (Boersma et al., 2004, 2011). In comparison to the simple CRB-based cloud correction, which can not fully describe the effects inherent to aerosol particles (Chimot et al., 2019), the use of CAL cloud correction considers the sensitivities inside and below the cloud/aerosol layers and reduces the AMF errors by more than 10 % (Liu et al., 2020c).
Note that the use of averaging kernel can remove the uncertainty contributed by the a priori NO2 profile for applications such as data assimilation and validation study (Eskes and Boersma, 2003). Therefore, for a typical polluted scene, the tropospheric AMF uncertainty is estimated to be 20 % for mostly clear sky and 50 % in the presence of clouds, leading to a total uncertainty in the tropospheric NO2 columns in the 30 %–60 % range.
The validation of the improved TROPOMI tropospheric NO2 columns is based on ground-based MAX-DOAS measurements from nine stations in Europe. Table 4 provides the information about the stations, most of which are characterized by urban or suburban polluted conditions with heavy traffic and industrial emissions. For the validation of TROPOMI measurements, the satellite data from January 2018–June 2020 are filtered for clouds (cloud radiance fraction less than 0.5), and the closest valid pixel within 20 km of the stations is compared to the ground-based MAX-DOAS data, which are linearly interpolated to the TROPOMI overpass time if original data exist within 1 h.
Vlemmix et al. (2010)Vlemmix et al. (2010)Chan et al. (2020)Drosoglou et al. (2017)Drosoglou et al. (2017)Gielen et al. (2014)Hendrick et al. (2014)Dimitropoulou et al. (2020)Table 4An overview of MAX-DOAS stations contributing to the TROPOMI tropospheric NO2 validation in this study. More details on the QA4ECV datasets can be found at http://www.qa4ecv.eu/ecvs (last access: 1 November 2021).
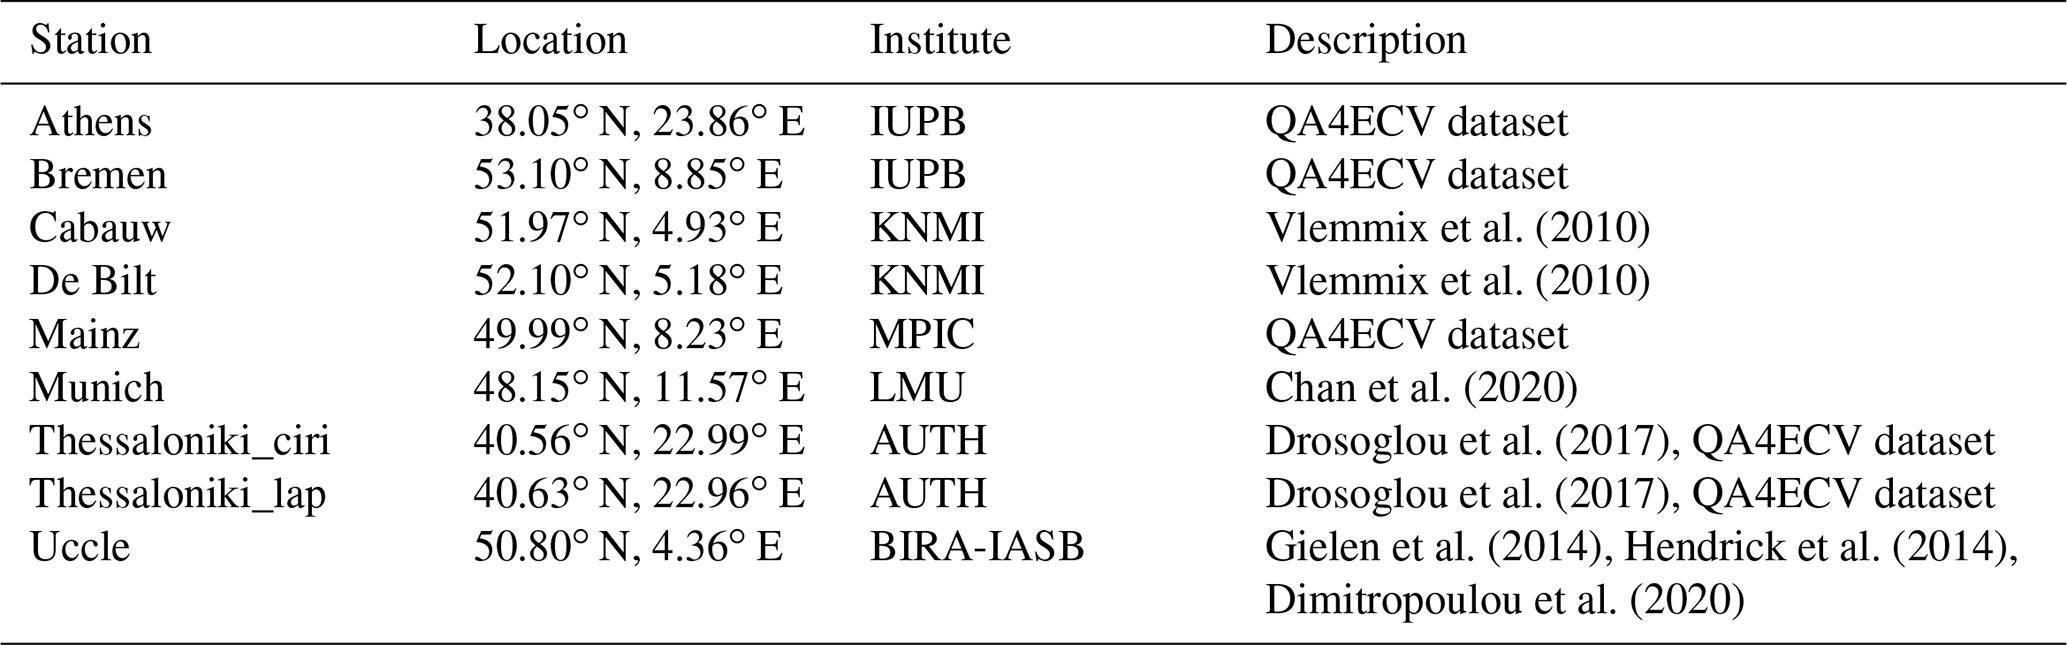
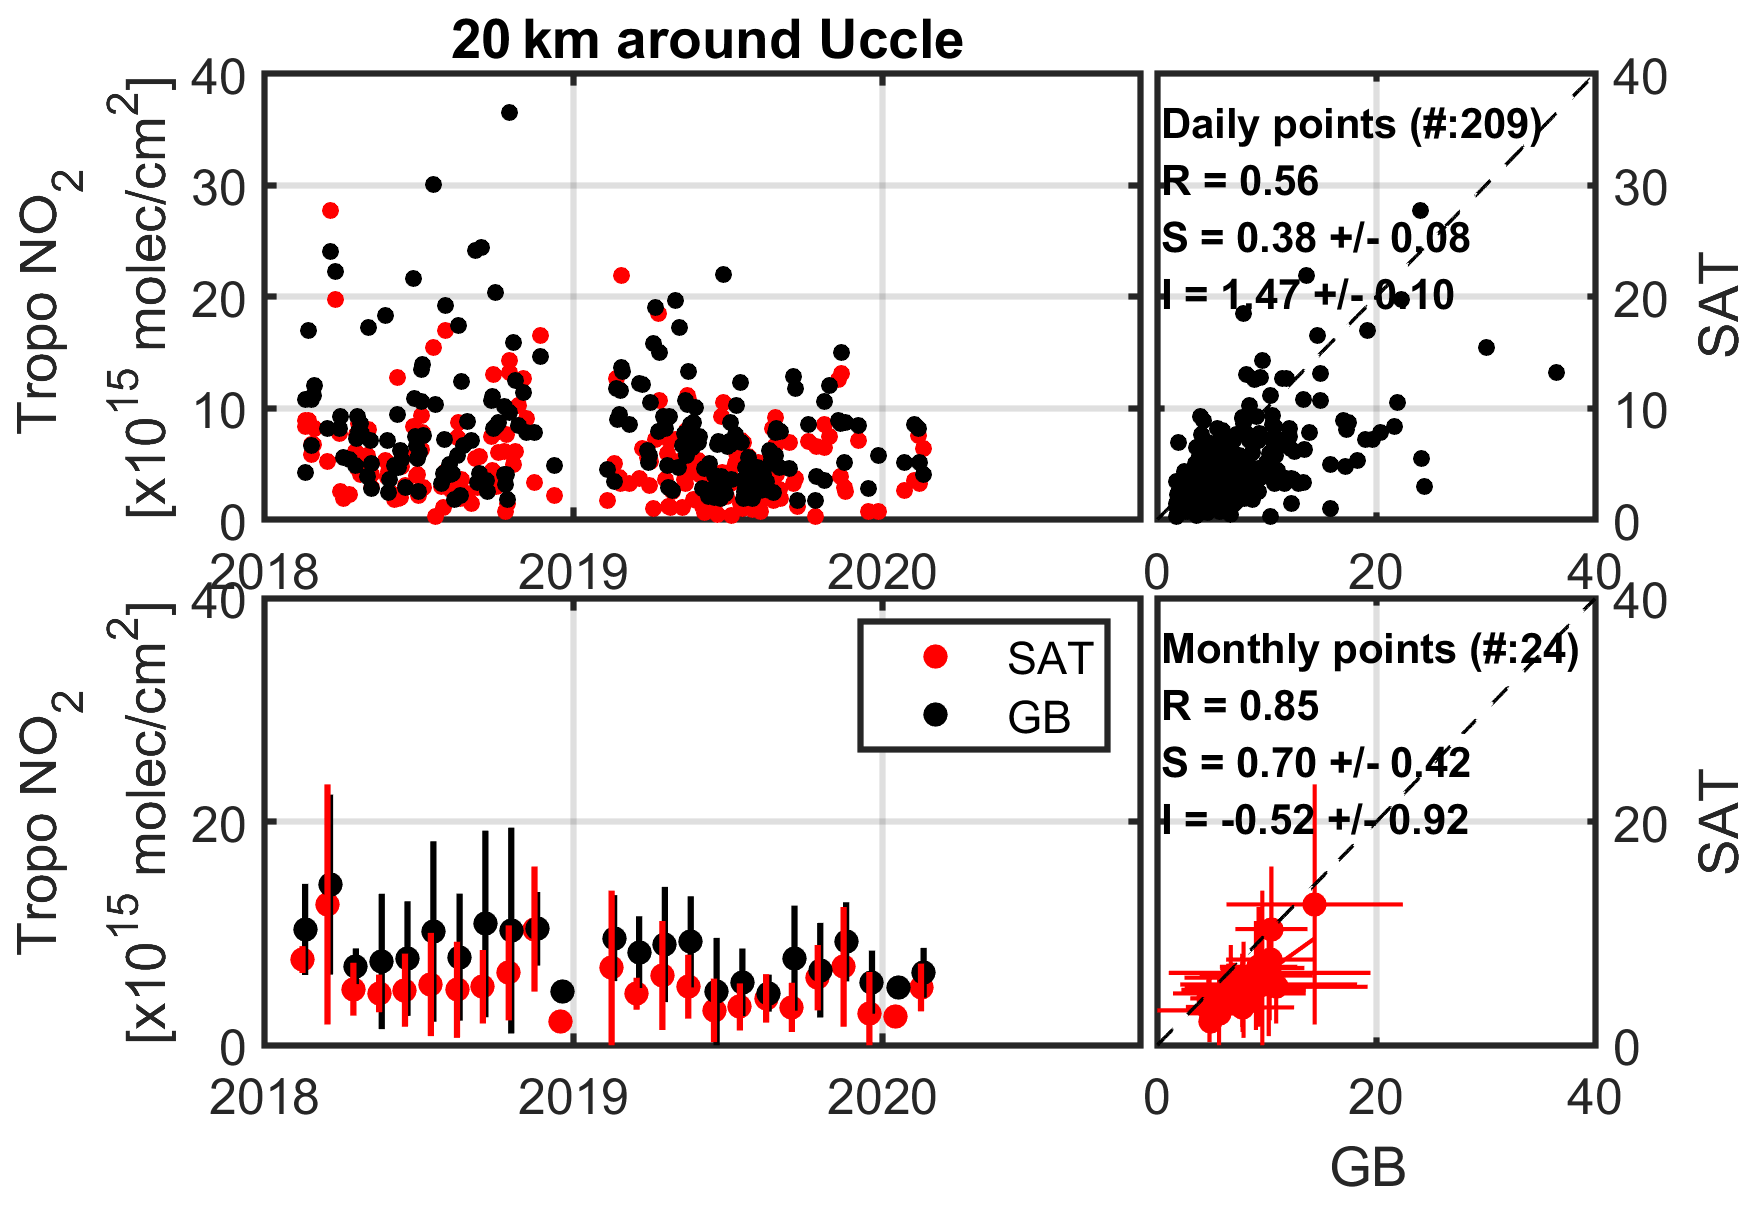
Figure 21Daily and monthly mean time series and scatter plot of TROPOMI (SAT) and MAX-DOAS (GB) tropospheric NO2 columns (closest valid pixel within 20 km of Uccle). Results are shown for the improved satellite retrieval algorithm.
Figure 21 shows the time series and scatter plot of the comparison of the daily and monthly means between the new TROPOMI tropospheric NO2 columns and the ground-based MAX-DOAS measurements in Uccle. The monthly mean values from the TROPOMI and MAX-DOAS measurements show similar seasonal variations in the tropospheric NO2 column. Figure 21 includes the statistical information on the Pearson correlation coefficient as well as the slope and intercept obtained with the robust Theil–Sen estimator (Sen, 1968; Vigouroux et al., 2020). A correlation coefficient of 0.85, a slope of 0.70, and an intercept of molec./cm2 are derived when comparing the monthly mean values.
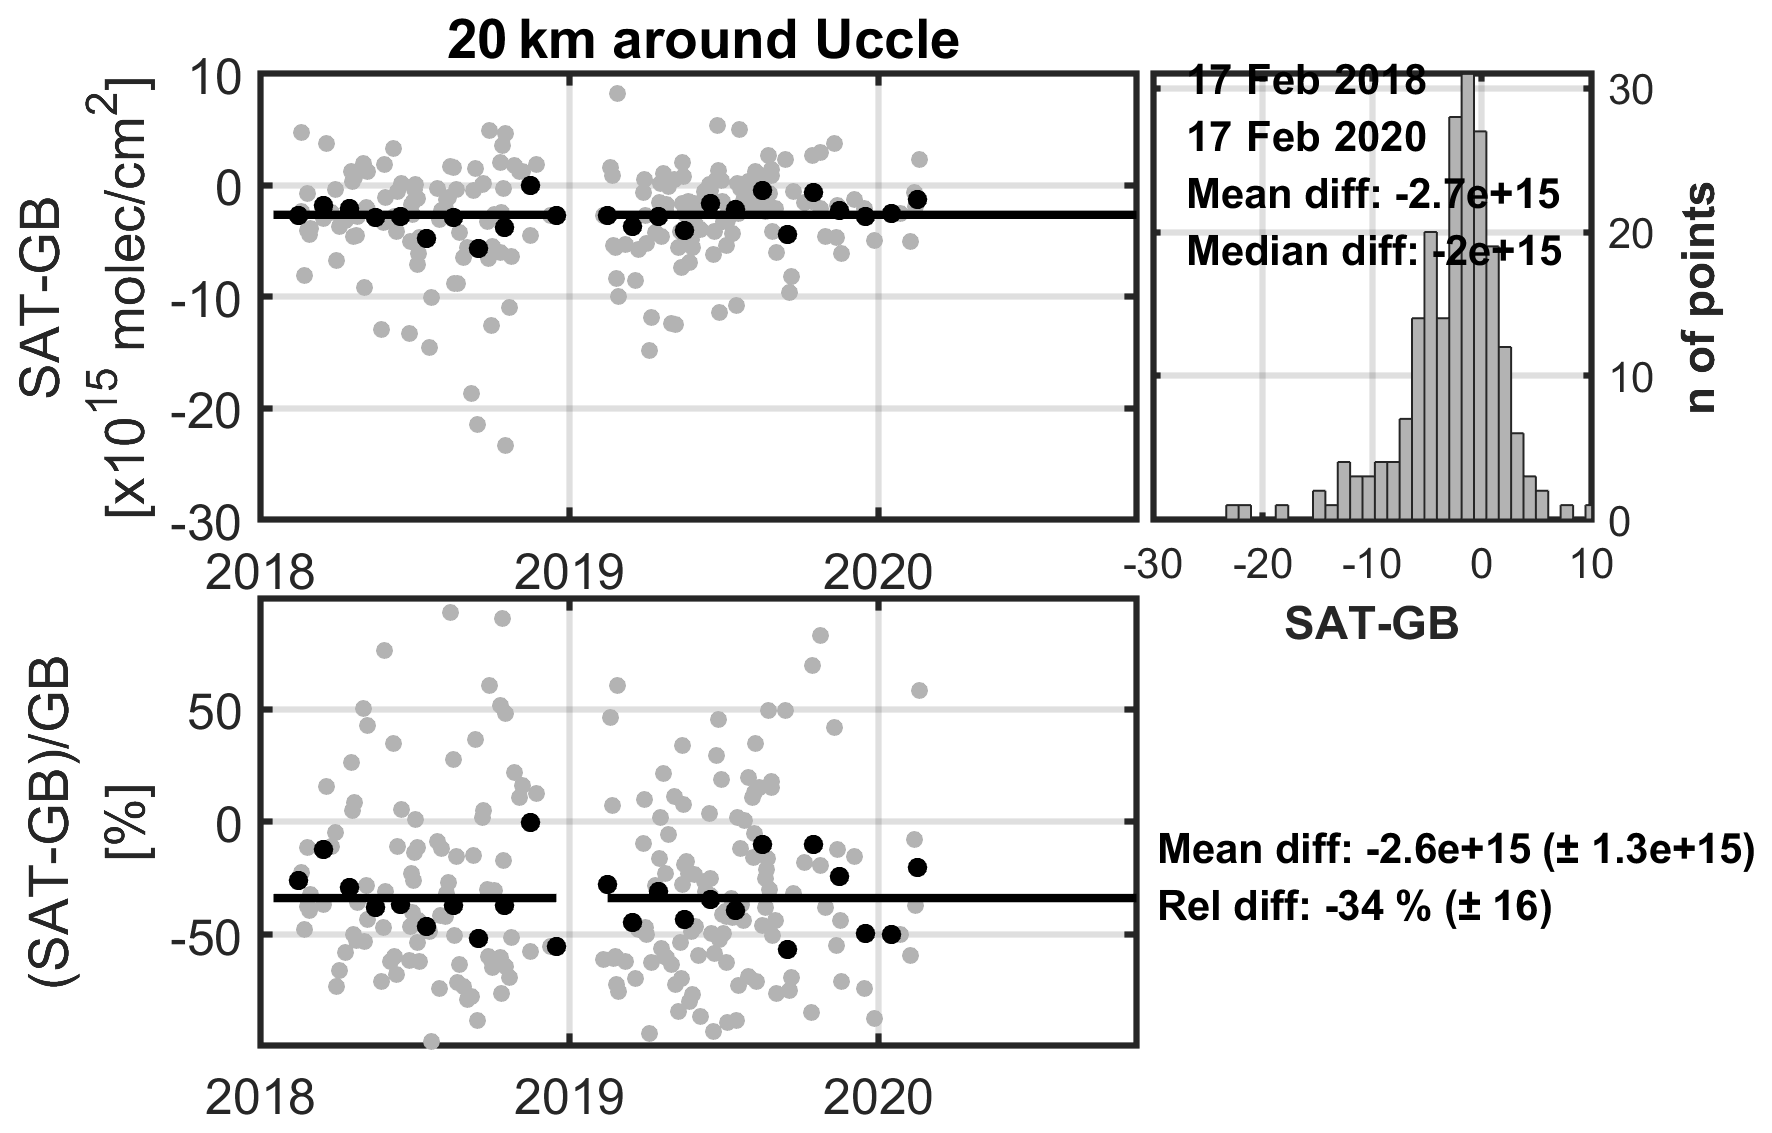
Figure 22Daily (grey dots) and monthly mean (black dots) absolute and relative TROPOMI (SAT) and MAX-DOAS (GB) time series differences for the Uccle station. Results are shown for the improved satellite retrieval algorithm. The histogram of the daily differences is also given, showing the mean and median difference. The total mean values of absolute and relative monthly differences are given in the bottom-right panel.
Figure 22 presents the daily and monthly mean absolute and relative differences of TROPOMI and MAX-DOAS measurements in Uccle. The differences are generally within 1×10¹⁶ molec./cm2, with a mean difference of molec./cm2. The NO2 levels are underestimated by 34 % by TROPOMI, with a standard deviation of 16 %, which is likely explained by comparison errors (such as the gradient smoothing effect, the comparison choices, and the inherent difference in sensitivity), partly by the remaining impact of structural uncertainties (Boersma et al. (2016), such as the impact of the choice of the a priori NO2 profiles and/or the albedo database assumed for the satellite AMF calculations), and by the different measurement types or the specific conditions of the validation sites.
To analyse the gradient smoothing effect for Uccle, TROPOMI measurements for 2018–2020 are aggregated based on an area-weighted tessellation to a resolution of 0.01∘ × 0.01∘, and the systematic variation in tropospheric NO2 columns between the satellite pixel location and the ground-based station position is shown in Fig. 23, following the method from Chen et al. (2009), Ma et al. (2013), and Pinardi et al. (2020). From Fig. 23, the smoothing effect is largest for summer (up to 19 %), as the NO2 gradients are large due to the shorter lifetime, in agreement with Ma et al. (2013). For the Uccle site, which is located south of Brussels at a distance of ∼ 6 km from the city centre, the tropospheric NO2 columns increase by up to 4 % outwards until 6 km due to the influence of the surrounding emission sources during summer and autumn. This effect is additionally influenced by the seasonal wind pattern, particularly for winter, when the wind is blowing in the direction of the site from north (Dimitropoulou et al., 2020).
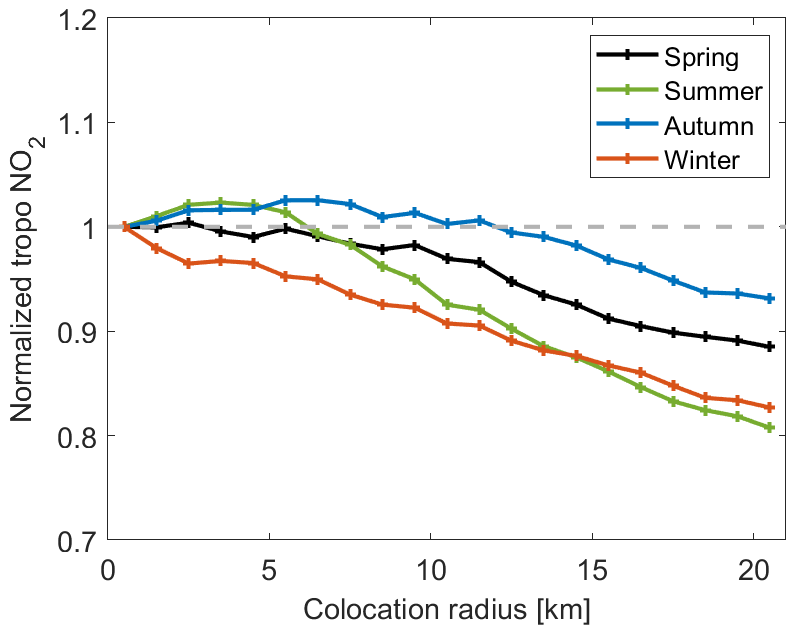
Figure 23Normalized tropospheric NO2 columns at increasing colocation radii for the Uccle station, estimated using seasonal mean TROPOMI data in 2018–2020.
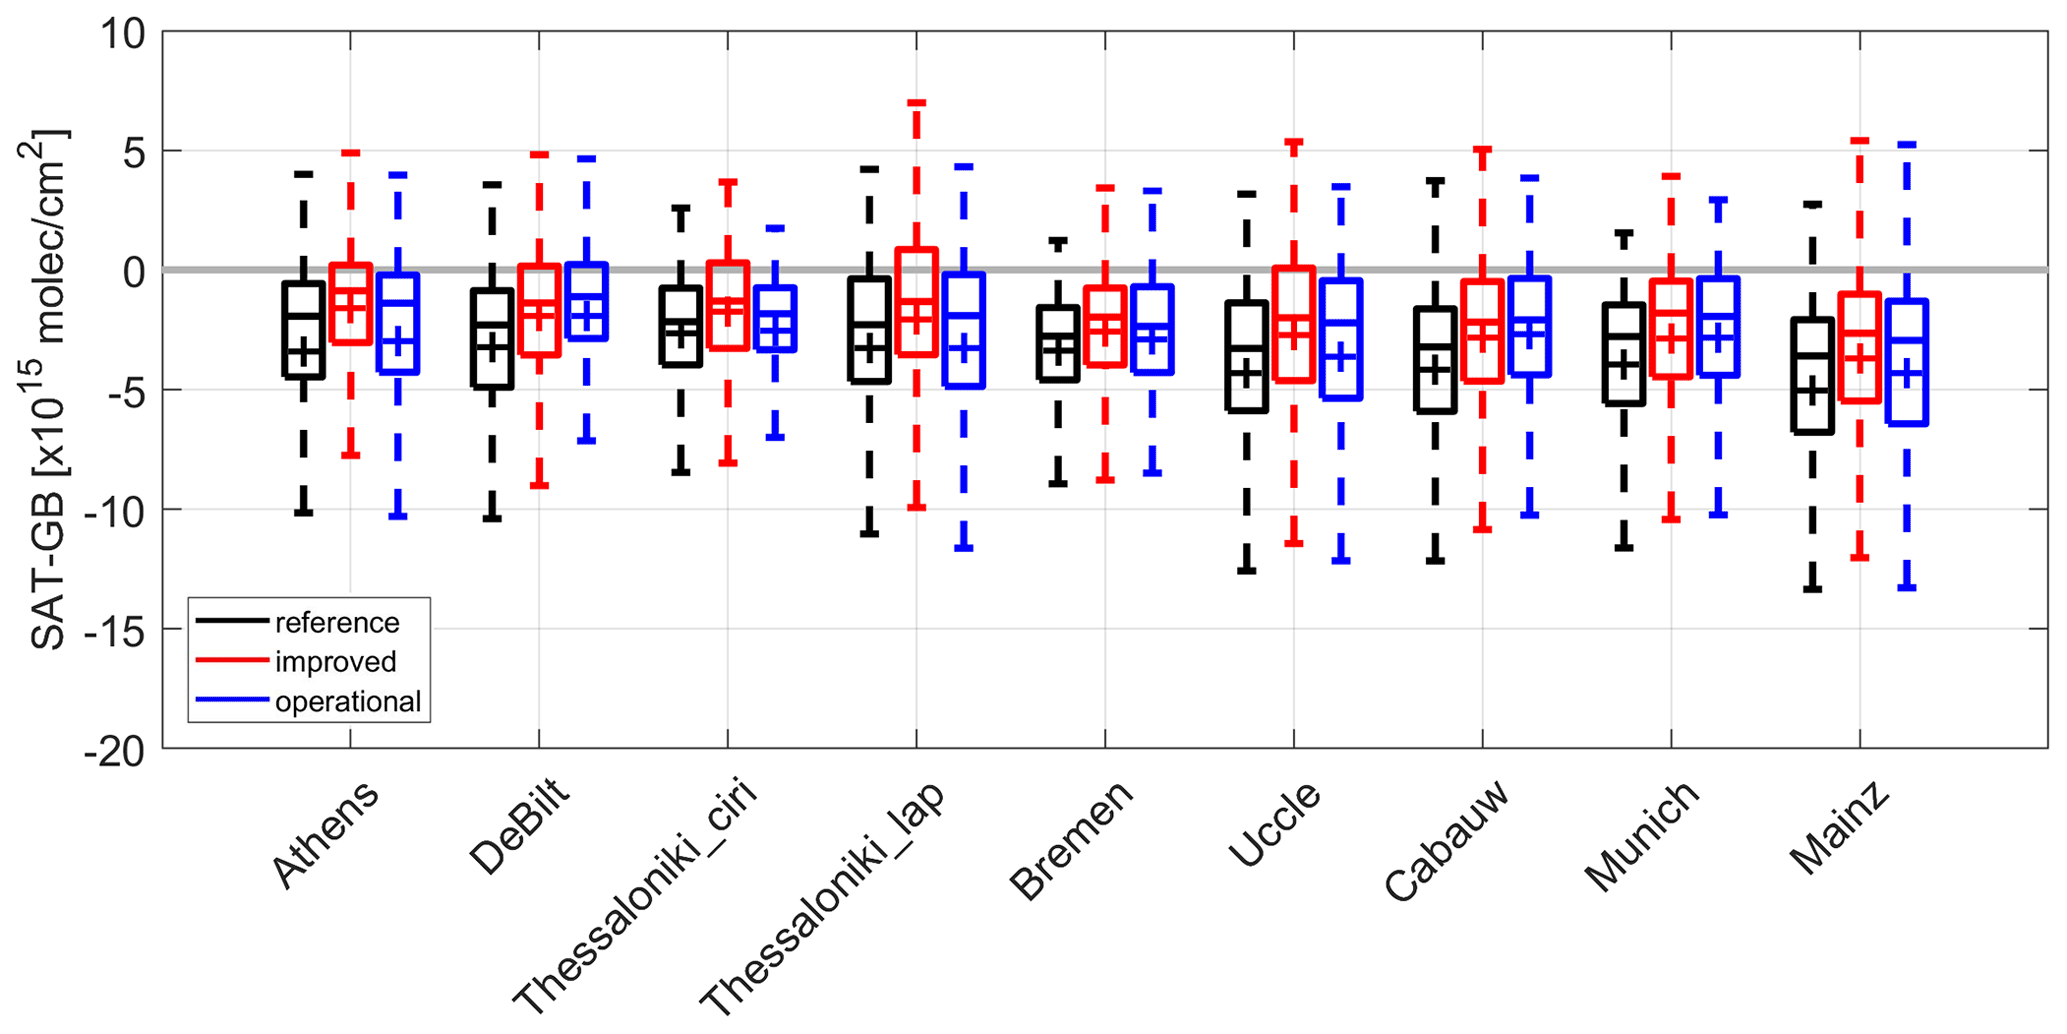
Figure 24Box-and-whisker plot of the daily biases and spread of the differences between the TROPOMI (SAT) and MAX-DOAS (GB) data. Results for the reference algorithm, the improved algorithm, and the operational product are compared. Stations are ordered by increasing mean difference. The mean differences are represented by crosses. The median differences are represented by vertical solid lines inside the boxes, which mark the 25 % and 75 % quantiles. The whiskers cover the 9 %–91 % range of the differences.
Table 5The Pearson correlation coefficient R, as well as the slope S and intercept I (in 1×10¹⁵ molec./cm2) obtained with the robust Theil–Sen estimator for the monthly TROPOMI tropospheric NO2 product compared to MAX-DOAS data. Stations are ordered by increasing mean difference. Values for the DLR improved algorithm (DLRimp) are given, and the values for the DLR reference algorithm (DLRref) and the KNMI operational product (KNMIop) are reported for comparison.
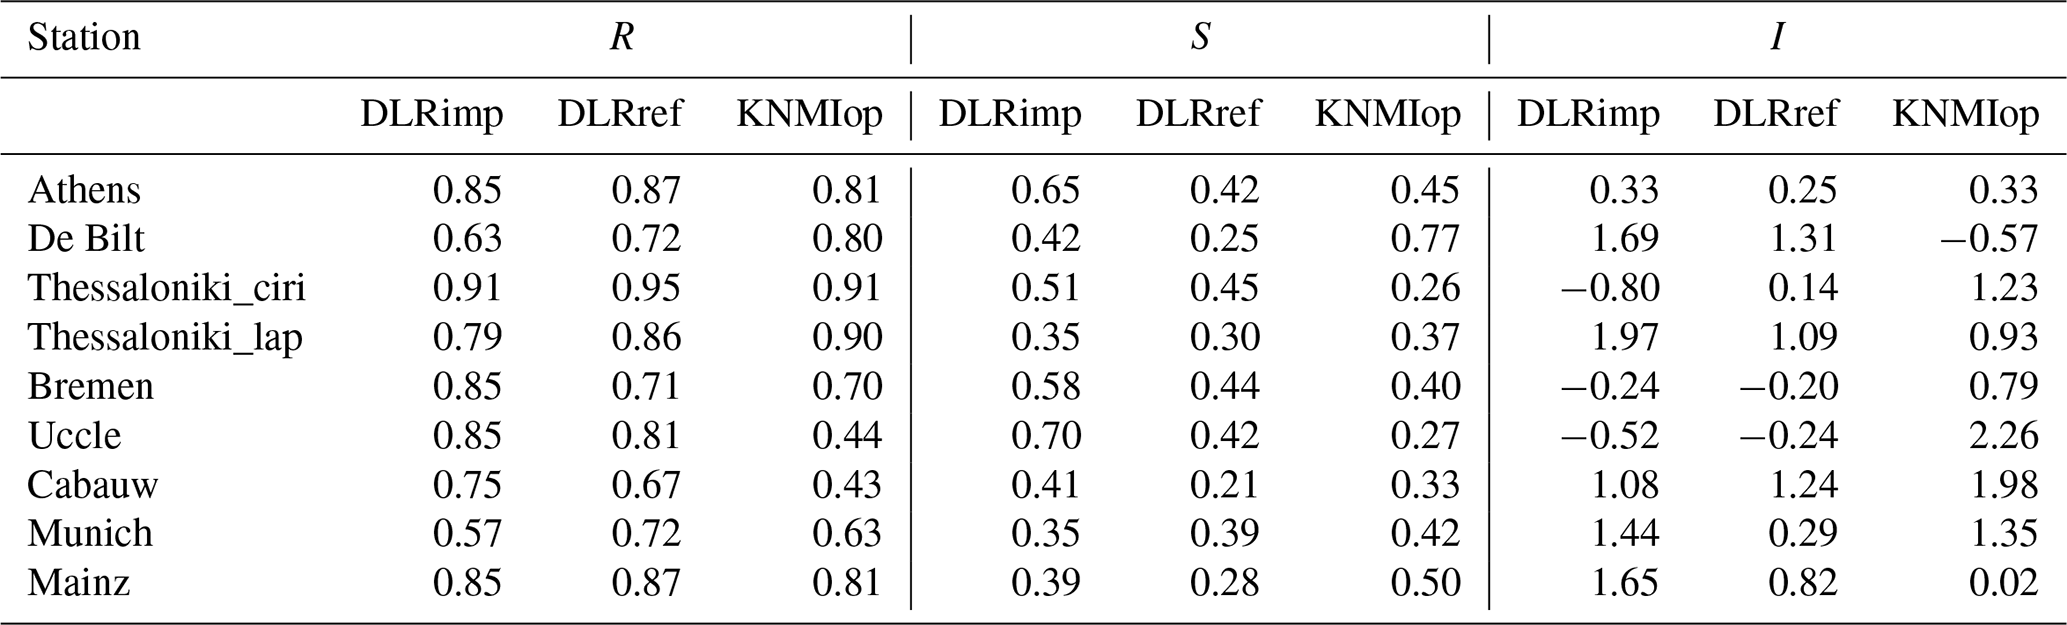
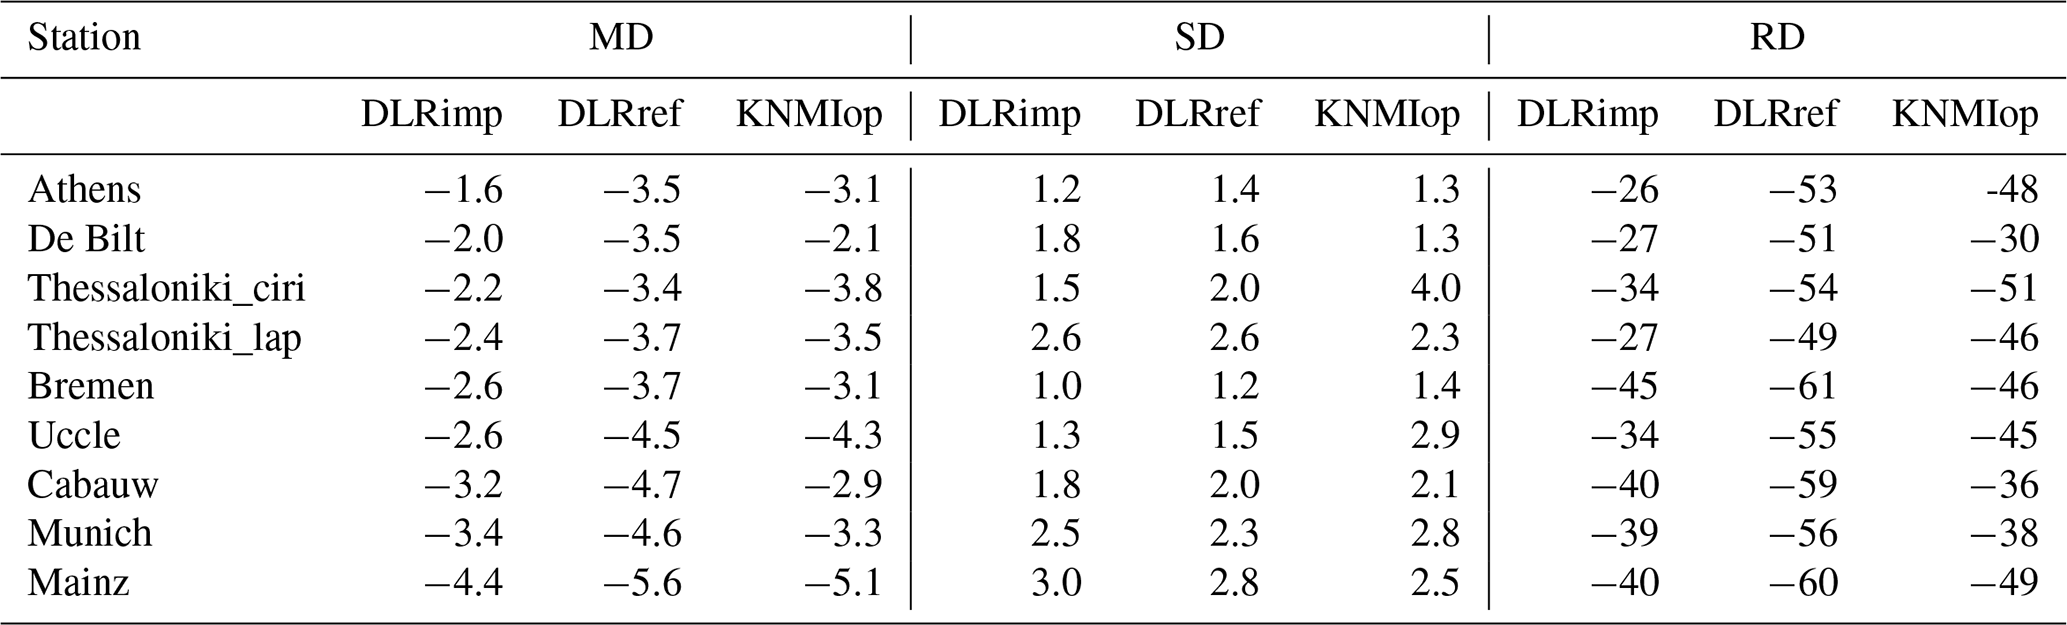
Table 6Similar to Table 5 but for the mean difference (MD, SAT-GB in 1×10¹⁵ molec./cm2), standard deviation (SD, in 1×10¹⁵ molec./cm2), and relative difference (RD, in %) for the monthly TROPOMI tropospheric NO2 product compared to MAX-DOAS data.
Similar figures to Figs. 21 and 22 for the improved and reference algorithms are gathered in Figs. S4–S7 in the Supplement for all the stations. Figure 24 shows an overview of the daily differences between satellite and ground-based data for the improved and reference algorithms. Tables 5 and 6 summarize the monthly comparisons of TROPOMI and MAX-DOAS measurements. High correlations are observed for the improved algorithm for all the stations, with an average correlation coefficient of 0.78. The impact of the algorithm improvements leads to a decrease of the mean absolute difference in urban/suburban conditions from molec./cm2 to molec./cm2 and a relative difference from −55.3 % to −34.7 %. The largest absolute bias ( molec./cm2 in Mainz) is reduced to molec./cm2 (relative bias from −60 % to −40 %), while the smaller absolute bias ( molec./cm2 in Thessaloniki_ciri) is reduced to molec./cm2 (relative bias from −54 % to −34 %). The largest reduction is found for Athens (−27 % reduction from the reference to improved algorithm).
Smaller biases are found for the improved algorithm, not only in comparison with the reference algorithm, but also compared to the operational product in Fig. 24 and Table 6, particularly for Athens, Thessaloniki_ciri, Thessaloniki_lap, Uccle, and Mainz. The relative biases ranging from −26 % to −45 % in Table 6 are lower than those reported by validation exercises for the operational TROPOMI product, where the NO2 levels are normally found to be underestimated by the TROPOMI instrument by 30 % to 50 % for polluted conditions (Dimitropoulou et al., 2020; Verhoelst et al., 2020; Wang et al., 2020). These results are not directly comparable to results, for example, obtained by Dimitropoulou et al. (2020), as they use a more elaborated ground-based dataset with several pointing directions and specific area-weighted pixel selections in the MAX-DOAS line of sight. Note that the operational tropospheric NO2 columns have been increased with an upgrade of the NO2 processor (version 01.04.00) since 29 November 2020 due to the improved handling of cloud pressures (Eskes et al., 2020).
To investigate the impact of satellite a priori NO2 profiles on the comparison, the satellite averaging kernel is used to relate the MAX-DOAS-retrieved NO2 profiles to satellite column measurements by calculating the smoothed MAX-DOAS columns as
The smoothed MAX-DOAS NO2 columns VGB,smoothed are derived by convolving the layer (l)-dependent daily profile xGB,l (expressed in partial columns and interpolated to the satellite overpass time) with the satellite averaging kernel AKSAT,l.
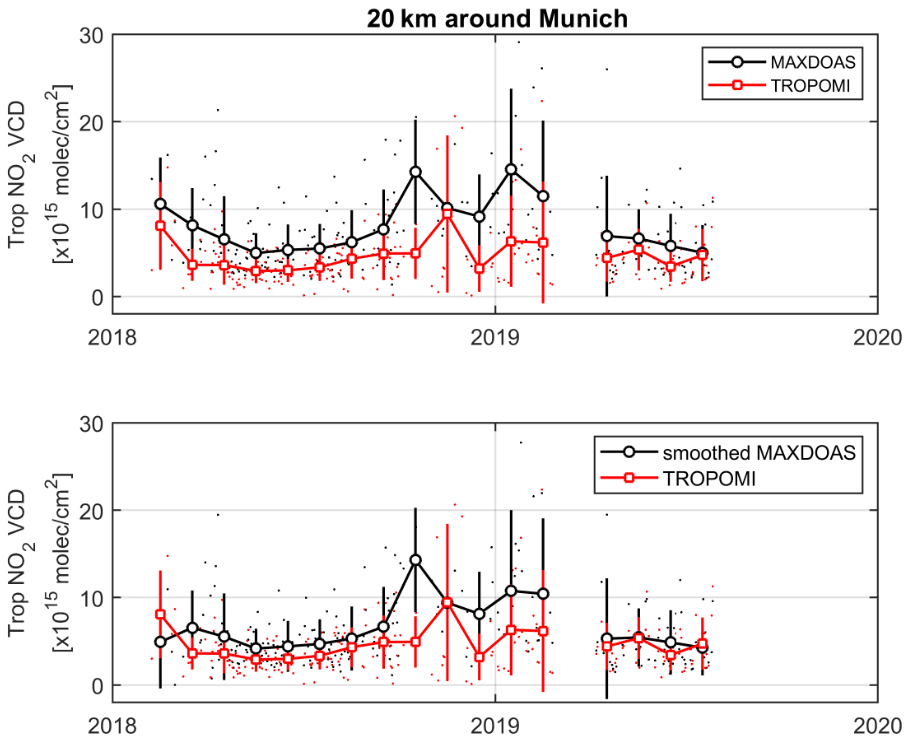
Figure 25Daily (dots) and monthly mean (circles) time series of TROPOMI and MAX-DOAS tropospheric NO2 columns for the Munich station. Results for the original comparisons and the smoothed comparisons are reported.
Figure 25 shows the original and smoothed comparisons of satellite and MAX-DOAS data for the Munich station. The use of the averaging kernel smoothing reduces the MAX-DOAS columns and thus improves the agreement between the satellite and MAX-DOAS columns. When the satellite averaging kernels are used to remove the contribution of the a priori NO2 profile shape, the mean absolute difference reduces from molec./cm2 to molec./cm2, and the relative difference reduces from −39 % to −23 %.
The DLR retrieval algorithm developed for TROPOMI NO2 measurements follows a three-step scheme. To calculate the NO2 slant columns, a 405–465 nm fitting window is applied in the DOAS fit for consistency with other NO2 retrievals from OMI and TROPOMI. Absorption cross-sections of interfering species and a linear intensity offset correction are applied. The striping pattern of slant columns is corrected using an empirical method based on the daily averaged across-track variability of NO2 slant columns over clean regions.
The stratospheric NO2 component is estimated using the STREAM method, which requires no chemistry transport model data as used in data assimilation and provides an improved treatment of polluted and cloudy pixels compared to other modified reference sector methods. An improved DSTREAM method is used to correct for the VZA dependency of stratospheric NO2 for high latitudes, which is related to the local time changes across the orbit. DSTREAM divides the orbit swath into three segments, applies the original STREAM to data from each of the segments, and calculates the stratospheric NO2 column based on VZA and latitude from the satellite measurement. Applied to synthetic TROPOMI data, constructed using the IFS(CB05BASCOE) model fields, the estimated stratospheric NO2 columns from the original STREAM and the improved DSTREAM show good consistency with the a priori truth. Applied to actual TROPOMI measurements, STREAM and DSTREAM successfully separate the stratospheric and tropospheric fields for polluted regions. The VZA dependency of stratospheric NO2 which amounts up to 2×10¹⁴ molec./cm2 at high latitudes is captured by DSTREAM.
In the tropospheric AMF calculation, the surface albedo from the monthly OMI LER climatology is replaced by the TROPOMI GE_LER data, which are consistently applied in both NO2 and cloud retrievals. GE_LER in the NO2 fitting window is retrieved using the machine-learning-based approach FP_ILM with inputs from the DOAS fitting. In comparison with the climatological LER values from previous satellite missions, the GE_LER data rely on the real-time measurements from the TROPOMI instrument itself, with an improved spatial resolution of 0.1∘ × 0.1∘. Therefore, GE_LER better characterizes the actual surface conditions with an impact on the tropospheric NO2 columns by up to 3×10¹⁵ molec./cm2 under polluted conditions.
Mesoscale-resolution a priori profiles (0.2∘ × 0.3∘), obtained from the regional POLYPHEMUS/DLR chemistry transport model based on the European TNO-MACC emission inventory, provide a better description of the spatial variability in the NO2 fields for Europe. Compared to the currently used TM5-MP profiles, the POLYPHEMUS/DLR profiles generally show higher surface NO2 concentrations, which reduce the tropospheric AMFs and thus enhance the tropospheric NO2 columns by more than 2×10¹⁵ molec./cm2 for polluted regions.
The presence of clouds is considered using the TROPOMI operational cloud retrieval algorithms OCRA/ROCINN. In a new version 2.1 processor, OCRA separates a spectral scene (in the UV–Vis wavelength range) into a cloudy contribution and a cloud-free background using TROPOMI-based background maps (0.1∘ × 0.1∘) instead of OMI-based ones, and ROCINN applies the surface albedo from the GE_LER data in the TROPOMI NIR instead of a static climatology. The overestimation of cloud fractions at the swath edge is corrected. Larger differences in cloud fractions and cloud pressures are found for relatively thick clouds, which affect the tropospheric NO2 columns by more than 1×10¹⁵ molec./cm2. In the tropospheric AMF calculation, the CRB model from ROCINN, in which clouds are idealized Lambertian reflectors, is replaced with the CAL model, in which clouds are represented by uniform layers of water droplets. CAL is more representative of the real situation and preferred for small TROPOMI ground pixels and for low clouds. The application of CAL cloud parameters considers the sensitivities inside and below the cloud layers and reduces the tropospheric NO2 columns by more than 1×10¹⁵ molec./cm2 for polluted regions.
The uncertainty in the NO2 slant columns is 4.5×10¹⁴ molec./cm2, derived from the spatial variability over the Pacific Ocean. The uncertainty in the stratospheric columns is 3.5×10¹⁴ molec./cm2 for polluted regions based on daily synthetic TROPOMI data. The tropospheric AMF uncertainty is estimated to be 20 % for mostly clear sky and 50 % in the presence of clouds, leading to a total uncertainty in the tropospheric NO2 column in the 30 %–60 % range.
Validation of the improved TROPOMI tropospheric NO2 columns is performed by comparisons with ground-based MAX-DOAS measurements. The validation is illustrated for nine European stations with urban/suburban conditions. The improved data show a similar seasonal variation in the tropospheric NO2 columns to the MAX-DOAS measurements, with an average correlation coefficient of 0.78. Compared to the reference data, the improved algorithm shows a significant improvement, with absolute differences decreasing from molec./cm2 to molec./cm2 on average and relative differences from −55.3 % to −34.7 %. When the satellite averaging kernels are used to remove the contribution of a priori NO2 profile shape, the absolute difference at the Munich station reduces from molec./cm2 to molec./cm2, and the relative difference reduces from −39 % to −23 %.
The TROPOMI NO2 research product from DLR is a complement to the operational product due to the use of independent approaches for stratosphere–troposphere separation and AMF calculation. Compared to the other regional TROPOMI NO2 product listed in Table 1, the DLR European retrieval reduces the potential biases introduced by using inputs from different instruments or climatologies and confirms the importance of applying more realistic input parameters with better resolution for AMF calculation.
In the future, the spectral effect of extending the fitting window to 490 nm will be analysed, when the pixel blooming is better treated in a future update of the TROPOMI level 0-1b processor. An update of the POLYPHEMUS/DLR model using more recent TNO-MACC emissions is planned. The operational OCRA/ROCINN cloud parameters will be compared with other cloud products such as FRESCO-S and MICRU. The interpretation of the cloud product for aerosol-dominated scenes and the impact on the NO2 retrieval algorithm will be further investigated. Aerosol contamination will be removed in the GE_LER retrieval using TROPOMI aerosol index data. An independent neural network will be trained and implemented for error estimation.
The NO2 data quality will be further analysed using data from additional ground stations covering different pollution conditions and data from validation campaigns with independent instruments. Further improvements in the ground-based validation include using the full MAX-DOAS line-of-sight sensitivity and the intersection with the TROPOMI pixel(s) or having more ground-based instruments located within a TROPOMI pixel. More frequent ground-based measurements and measurements in more than one direction might better sample the temporal and spatial variability around the measurement sites (Richter and Lange, 2021; Dimitropoulou et al., 2020).
The NO2 retrieval algorithm can be adapted for new instruments and missions, such as the polar-orbiting Sentinel-5 and geostationary Sentinel-4 missions, which offer new perspectives for monitoring NO2 with a fast revisiting time and a high spatial resolution and provide information on atmospheric variables in support of European policies.
The TROPOMI NO2 datasets used in the study are available upon request. The DLR TROPOMI NO2 product is published as HDF version 5 files. For each ground pixel, the TROPOMI data product provides the retrieval results (e.g., the slant column, stratospheric column, and tropospheric column of NO2), input information (such as the GE_LER surface albedo (Loyola et al., 2020b), POLYPHEMUS/DLR a priori NO2 profiles, and OCRA/ROCINN cloud parameters (Lutz et al., 2016; Loyola et al., 2018)), uncertainty estimates, processing quality flags, and averaging kernels.
The supplement related to this article is available online at: https://doi.org/10.5194/amt-14-7297-2021-supplement.
SL and PV developed the retrieval framework. SL processed the data, analysed the results, and contributed to the GE_LER processing and MAX-DOAS validation. SL and GP analysed the MAX-DOAS validation results. JX processed the GE_LER data. AA and RL provided expertise regarding the OCRA/ROCINN-based cloud correction. KLC contributed to uncertainty analysis. SB contributes to the STREAM development and improvement. EK and FB provided the POLYPHEMUS/DLR model data. VH provided the IFS(CB05BASCOE) model data. AB, KLC, SD, SD, MG, FH, DK, KL, AP, JR, AR, MVR, TW, and MW provided the MAX-DOAS measurements. DL is the main developer of the TROPOMI cloud products based on the CAL model and the GE_LER retrievals used in this study. SL, PV, JX, and GP wrote the paper with comments from all authors.
The authors declare that they have no conflict of interest.
Publisher’s note: Copernicus Publications remains neutral with regard to jurisdictional claims in published maps and institutional affiliations.
This work is funded by the DLR/DAAD Research Fellowships – Postdocs programme (57478192). The TROPOMI NO2 data generated at DLR are used in the S-VELD project, which is financed by the Federal Ministry of Transport and Digital Infrastructure to analyse the effect of traffic emission on air quality in Germany (grant no. 19F2065). Part of the results discussed in this paper were achieved within the JOSEFINA project funded by the Bavarian State Ministry for Environment and Consumer Protection. The POLYPHEMUS/DLR model was developed with support from the 7th EU Framework Programme (PASODOBLE project grant 241557). We acknowledge the Belgian Science Policy Office (BELSPO) for supporting part of this work through the PRODEX programme B-ACSAF project. Part of this work is carried out in the framework of the S5P Validation Team (S5PVT) AO projects NIDFORVAL (ID no. 28607, PI Gaia Pinardi, BIRA-IASB). Part of this work is supported by the DFG Major Research Instrumentation Programme (grant no. INST 86/1499-1 FUGG). We are grateful to QA4ECV for the generation of harmonized MAX-DOAS datasets. We thank EU/ESA/KNMI/DLR for the provision of the TROPOMI/S5P level 1 products. We thank DLR colleagues for developing the Universal Processor for UV/Vis Atmospheric Spectrometers (UPAS) system used for generating level 2 products from TROPOMI. This paper contains modified Copernicus Sentinel data processed by DLR.
This research has been supported by the DLR-DAAD Research Fellowships -Postdocs programme (57478192), which is organised by the German Academic Exchange Service (DAAD) and the German Aerospace Center (DLR).
This paper was edited by Folkert Boersma and reviewed by Henk Eskes and one anonymous referee.
Bauwens, M., Compernolle, S., Stavrakou, T., Müller, J.-F., van Gent, J., Eskes, H., Levelt, P. F., van der A, R., Veefkind, J. P., Vlietinck, J., Yu, H., and Zehner, C.: Impact of coronavirus outbreak on NO2 pollution assessed using TROPOMI and OMI observations, Geophys. Res. Lett., 47, e2020GL087978, https://doi.org/10.1029/2020GL087978, 2020. a
Beirle, S., Hörmann, C., Jöckel, P., Liu, S., Penning de Vries, M., Pozzer, A., Sihler, H., Valks, P., and Wagner, T.: The STRatospheric Estimation Algorithm from Mainz (STREAM): estimating stratospheric NO2 from nadir-viewing satellites by weighted convolution, 9, 2753–2779, https://doi.org/10.1126/sciadv.aax9800, 2016. a, b, c, d, e, f, g
Beirle, S., Borger, C., Dörner, S., Li, A., Hu, Z., Liu, F., Wang, Y., and Wagner, T.: Pinpointing nitrogen oxide emissions from space, Sci. Adv., 5, eaax9800, https://doi.org/10.1126/sciadv.aax9800, 2019. a
Belmonte Rivas, M., Veefkind, P., Boersma, F., Levelt, P., Eskes, H., and Gille, J.: Intercomparison of daytime stratospheric NO2 satellite retrievals and model simulations, Atmos. Meas. Tech., 7, 2203–2225, https://doi.org/10.5194/amt-7-2203-2014, 2014. a
Bergemann, C., Meyer-Arnek, J., and Baier, F.: Estimation and causes of uncertainty of air quality forecasts for the Blackforest region, in: Wiss. Mitteil. Inst. f. Meteorol. Univ. Leipzig Band 49(2012), Tagungsband der METTOOLS VIII, Leipzig, Germany, 2012. a, b
Biswal, A., Singh, V., Singh, S., Kesarkar, A. P., Ravindra, K., Sokhi, R. S., Chipperfield, M. P., Dhomse, S. S., Pope, R. J., Singh, T., and Mor, S.: COVID-19 lockdown-induced changes in NO2 levels across India observed by multi-satellite and surface observations, Atmos. Chem. Phys., 21, 5235–5251, https://doi.org/10.5194/acp-21-5235-2021, 2021. a
Boersma, K. F., Eskes, H. J., and Brinksma, E. J.: Error analysis for tropospheric NO2 retrieval from space, J. Geophys. Res.-Atmos., 109, D04311, https://doi.org/10.1029/2003JD003962, 2004. a, b, c, d
Boersma, K. F., Eskes, H. J., Veefkind, J. P., Brinksma, E. J., van der A, R. J., Sneep, M., van den Oord, G. H. J., Levelt, P. F., Stammes, P., Gleason, J. F., and Bucsela, E. J.: Near-real time retrieval of tropospheric NO2 from OMI, Atmos. Chem. Phys., 7, 2103–2118, https://doi.org/10.5194/acp-7-2103-2007, 2007. a
Boersma, K. F., Eskes, H. J., Dirksen, R. J., van der A, R. J., Veefkind, J. P., Stammes, P., Huijnen, V., Kleipool, Q. L., Sneep, M., Claas, J., Leitão, J., Richter, A., Zhou, Y., and Brunner, D.: An improved tropospheric NO2 column retrieval algorithm for the Ozone Monitoring Instrument, Atmos. Meas. Tech., 4, 1905–1928, https://doi.org/10.5194/amt-4-1905-2011, 2011. a, b, c, d
Boersma, K. F., Vinken, G. C. M., and Eskes, H. J.: Representativeness errors in comparing chemistry transport and chemistry climate models with satellite UV–Vis tropospheric column retrievals, J. Geophys. Res.-Atmos., 9, 875, https://doi.org/10.1029/2003JD003962, 2016. a, b
Boersma, K. F., Eskes, H. J., Richter, A., De Smedt, I., Lorente, A., Beirle, S., van Geffen, J. H. G. M., Zara, M., Peters, E., Van Roozendael, M., Wagner, T., Maasakkers, J. D., van der A, R. J., Nightingale, J., De Rudder, A., Irie, H., Pinardi, G., Lambert, J.-C., and Compernolle, S. C.: Improving algorithms and uncertainty estimates for satellite NO2 retrievals: results from the quality assurance for the essential climate variables (QA4ECV) project, Atmos. Meas. Tech., 11, 6651–6678, https://doi.org/10.5194/amt-11-6651-2018, 2018. a, b, c
Boutahar, J., Lacour, S., Mallet, V., Quélo, D., Roustan, Y., and Sportisse, B.: Development and validation of a fully modular platform for numerical modelling of air pollution: POLAIR, Int. J. Environ. Pollut., 22, 17–28, 2004. a
Bovensmann, H., Burrows, J. P., Buchwitz, M., Frerick, J., Rozanov, V. V., Chance, K. V., and Goede, A. P. H.: SCIAMACHY: Mission objectives and measurement modes, J. Atmos. Sci., 56, 127–150, 1999. a
Brion, J., Chakir, A., Charbonnier, J., Daumont, D., Parisse, C., and Malicet, J.: Absorption spectra measurements for the ozone molecule in the 350–830 nm region, J. Atmos. Chem., 30, 291–299, 1998. a
Bucsela, E. J., Celarier, E. A., Wenig, M. O., Gleason, J. F., Veefkind, J. P., Boersma, K. F., and Brinksma, E. J.: Algorithm for NO2 vertical column retrieval from the ozone monitoring instrument, IEEE Trans. Geosci. Remote Sens., 44, 1245–1258, 2006. a
Bucsela, E. J., Krotkov, N. A., Celarier, E. A., Lamsal, L. N., Swartz, W. H., Bhartia, P. K., Boersma, K. F., Veefkind, J. P., Gleason, J. F., and Pickering, K. E.: A new stratospheric and tropospheric NO2 retrieval algorithm for nadir-viewing satellite instruments: applications to OMI, Atmos. Meas. Tech., 6, 2607–2626, https://doi.org/10.5194/amt-6-2607-2013, 2013. a
Burrows, J. P., Weber, M., Buchwitz, M., Rozanov, V., Ladstätter-Weißenmayer, A., Richter, A., DeBeek, R., Hoogen, R., Bramstedt, K., Eichmann, K.-U., Eisinger, M., and Perner, D.: The global ozone monitoring experiment (GOME): Mission concept and first scientific results, J. Atmos. Sci., 56, 151–175, 1999. a
Cahalan, R. F., Ridgway, W., Wiscombe, W. J., Bell, T. L., and Snider, J. B.: The albedo of fractal stratocumulus clouds, J. Atmos. Sci., 51, 2434–2455, 1994. a
Callies, J., Corpaccioli, E., Eisinger, M., Hahne, A., and Lefebvre, A.: GOME-2-Metop's second-generation sensor for operational ozone monitoring, ESA Bulletin, 102, 28–36, 2000. a
Celarier, E. A., Brinksma, E. J., Gleason, J. F., Veefkind, J. P., Cede, A., Herman, J. R., Ionov, D., Goutail, F., Pommereau, J.-P., Lambert, J.-C., van Roozendael, M., Pinardi, G., Wittrock, F., Schönhardt, A., Richter, A., Ibrahim, O. W., Wagner, T., Bojkov, B., Mount, G., Spinei, E., Chen, C. M., Pongetti, T. J., Sander, S. P., Bucsela, E. J., Wenig, M. O., Swart, D. P. J., Volten, H., Kroon, M., and Levelt, P. F.: Validation of Ozone Monitoring Instrument nitrogen dioxide columns, J. Geophys. Res.-Atmos., 113, D15S15, https://doi.org/10.1029/2007JD008908, 2008. a
Chan, K. L., Wiegner, M., van Geffen, J., De Smedt, I., Alberti, C., Cheng, Z., Ye, S., and Wenig, M.: MAX-DOAS measurements of tropospheric NO2 and HCHO in Munich and the comparison to OMI and TROPOMI satellite observations, Atmos. Meas. Tech., 13, 4499–4520, https://doi.org/10.5194/amt-13-4499-2020, 2020. a, b, c
Charlson, R. J. and Ahlquist, N. C.: Brown haze: NO2 or aerosol?, Atmos. Environ., 3, 653–656, 1969. a
Chen, D., Zhou, B., Beirle, S., Chen, L. M., and Wagner, T.: Tropospheric NO2 column densities deduced from zenith-sky DOAS measurements in Shanghai, China, and their application to satellite validation, Atmos. Chem. Phys., 9, 3641–3662, https://doi.org/10.5194/acp-9-3641-2009, 2009. a
Chimot, J., Veefkind, J. P., de Haan, J. F., Stammes, P., and Levelt, P. F.: Minimizing aerosol effects on the OMI tropospheric NO2 retrieval – An improved use of the 477 nm O2-O2 band and an estimation of the aerosol correction uncertainty, Atmos. Meas. Tech., 12, 491–516, https://doi.org/10.5194/amt-12-491-2019, 2019. a
Compernolle, S., Verhoelst, T., Pinardi, G., Granville, J., Hubert, D., Keppens, A., Niemeijer, S., Rino, B., Bais, A., Beirle, S., Boersma, F., Burrows, J. P., De Smedt, I., Eskes, H., Goutail, F., Hendrick, F., Lorente, A., Pazmino, A., Piters, A., Peters, E., Pommereau, J.-P., Remmers, J., Richter, A., van Geffen, J., Van Roozendael, M., Wagner, T., and Lambert, J.-C.: Validation of Aura-OMI QA4ECV NO2 climate data records with ground-based DOAS networks: the role of measurement and comparison uncertainties, Atmos. Chem. Phys., 20, 8017–8045, https://doi.org/10.5194/acp-20-8017-2020, 2020. a
Compernolle, S., Argyrouli, A., Lutz, R., Sneep, M., Lambert, J.-C., Fjæraa, A. M., Hubert, D., Keppens, A., Loyola, D., O'Connor, E., Romahn, F., Stammes, P., Verhoelst, T., and Wang, P.: Validation of the Sentinel-5 Precursor TROPOMI cloud data with Cloudnet, Aura OMI O2-O2, MODIS, and Suomi-NPP VIIRS, Atmos. Meas. Tech., 14, 2451–2476, https://doi.org/10.5194/amt-14-2451-2021, 2021. a, b
Cooper, M. J., Martin, R. V., McLinden, C. A., and Brook, J. R.: Inferring ground-level nitrogen dioxide concentrations at fine spatial resolution applied to the TROPOMI satellite instrument, Environ. Res. Lett., 15, 104013, https://doi.org/10.1088/1748-9326/aba3a5, 2020. a
Crippa, M., Guizzardi, D., Muntean, M., Schaaf, E., Dentener, F., van Aardenne, J. A., Monni, S., Doering, U., Olivier, J. G. J., Pagliari, V., and Janssens-Maenhout, G.: Gridded emissions of air pollutants for the period 1970–2012 within EDGAR v4.3.2, Earth Syst. Sci. Data, 10, 1987–2013, https://doi.org/10.5194/essd-10-1987-2018, 2018. a
Crutzen, P. J.: The influence of nitrogen oxides on the atmospheric ozone content, Quart. J. Roy. Meteorol. Soc., 96, 320–325, 1970. a
Danckaert, T., Fayt, C., Van Roozendael, M., De Smedt, I., Letocart, V., Merlaud, A., and Pinardi, G.: QDOAS software user manual, 2017. a
De Smedt, I., Theys, N., Yu, H., Danckaert, T., Lerot, C., Compernolle, S., Van Roozendael, M., Richter, A., Hilboll, A., Peters, E., Pedergnana, M., Loyola, D., Beirle, S., Wagner, T., Eskes, H., van Geffen, J., Boersma, K. F., and Veefkind, P.: Algorithm theoretical baseline for formaldehyde retrievals from S5P TROPOMI and from the QA4ECV project, 11, 2395–2426, 2018. a
Debry, E., Fahey, K., Sartelet, K., Sportisse, B., and Tombette, M.: Technical Note: A new SIze REsolved Aerosol Model (SIREAM), Atmos. Chem. Phys., 7, 1537–1547, https://doi.org/10.5194/acp-7-1537-2007, 2007. a, b
Denier van der Gon, H. A. C., Visschedijk, A., Van der Brugh, H., and Dröge, R.: A high resolution European emission data base for the year 2005, a contribution to UBA-Projekt PAREST: Particle Reduction Strategies, TNO-report TNO-034-UT-2010-01895 RPTML, Utrecht, 2010. a, b, c, d
Dimitropoulou, E., Hendrick, F., Pinardi, G., Friedrich, M. M., Merlaud, A., Tack, F., De Longueville, H., Fayt, C., Hermans, C., Laffineur, Q., Fierens, F., and Van Roozendael, M.: Validation of TROPOMI tropospheric NO2 columns using dual-scan multi-axis differential optical absorption spectroscopy (MAX-DOAS) measurements in Uccle, Brussels, Atmos. Meas. Tech., 13, 5165–5191, https://doi.org/10.5194/amt-13-5165-2020, 2020. a, b, c, d, e
Ding, J., van der A, R. J., Eskes, H., Mijling, B., Stavrakou, T., Van Geffen, J., and Veefkind, J. P.: NOx emissions reduction and rebound in China due to the COVID-19 crisis, Geophys. Res. Lett., 47, e2020GL089912, https://doi.org/10.1029/2020GL089912, 2020. a
Dirksen, R. J., Boersma, K. F., Eskes, H. J., Ionov, D. V., Bucsela, E. J., Levelt, P. F., and Kelder, H. M.: Evaluation of stratospheric NO2 retrieved from the Ozone Monitoring Instrument: Intercomparison, diurnal cycle, and trending, J. Geophys. Res.-Atmos., 116, D8, https://doi.org/10.1029/2010JD014943, 2011. a, b
Doicu, A., Trautmann, T., and Schreier, F.: Numerical regularization for atmospheric inverse problems, Springer Science & Business Media, 2010. a
Drosoglou, T., Bais, A. F., Zyrichidou, I., Kouremeti, N., Poupkou, A., Liora, N., Giannaros, C., Koukouli, M. E., Balis, D., and Melas, D.: Comparisons of ground-based tropospheric NO2 MAX-DOAS measurements to satellite observations with the aid of an air quality model over the Thessaloniki area, Greece, Atmos. Chem. Phys., 17, 5829–5849, https://doi.org/10.5194/acp-17-5829-2017, 2017. a, b, c
Drosoglou, T., Koukouli, M. E., Kouremeti, N., Bais, A. F., Zyrichidou, I., Balis, D., van der A, R. J., Xu, J., and Li, A.: MAX-DOAS NO2 observations over Guangzhou, China; ground-based and satellite comparisons, Atmos. Meas. Tech., 11, 2239–2255, https://doi.org/10.5194/amt-11-2239-2018, 2018. a
Efremenko, D. S., Loyola, D. G., Hedelt, P., and Spurr, R. J. D.: Volcanic SO2 plume height retrieval from UV sensors using a full-physics inverse learning machine algorithm, Int. J. Remote Sens., 38, 1–27, 2017. a
Eskes, H. J. and Boersma, K. F.: Averaging kernels for DOAS total-column satellite retrievals, Atmos. Chem. Phys., 3, 1285–1291, https://doi.org/10.5194/acp-3-1285-2003, 2003. a
Eskes, H. J., Velthoven, P. F. J. V., Valks, P. J. M., and Kelder, H. M.: Assimilation of GOME total-ozone satellite observations in a three-dimensional tracer-transport model, Q. J. Roy. Meteor. Soc., 129, 1663–1681, 2003. a
Eskes, H. J., Eichmann, K.-U., Lambert, J. C., Loyola, D., Veefkind, J. P., Dehn, A., and Zehner, C.: S5P Mission Performance Centre Nitrogen Dioxide, Tech. rep., S5P-MPC-KNMI-PRF-NO2 issue 1.6, 2020. a
European Commission: The EU Environmental Implementation Review: Common challenges and how to combine efforts to deliver better results, Tech. rep., Ref.: SWD(2017)33-60 fina, 2017. a
Fayt, C., De Smedt, I., Letocart, V., Merlaud, A., Pinardi, G., and Van Roozendael, M.: QDOAS Software user manual, Tech. rep., IASB/BIRA, Uccle, Belgium, available at: http://uv-vis.aeronomie.be/software/QDOAS (last access: 1 November 2021), 2011. a
Ferlay, N., Thieuleux, F., Cornet, C., Davis, A. B., Dubuisson, P., Ducos, F., Parol, F., Riédi, J., and Vanbauce, C.: Toward new inferences about cloud structures from multidirectional measurements in the oxygen A band: Middle-of-cloud pressure and cloud geometrical thickness from POLDER-3/PARASOL, J. Appl. Meteorol. Climatol., 49, 2492–2507, 2010. a
Georgoulias, A. K., Boersma, K. F., van Vliet, J., Zhang, X., van der A, R. J., Zanis, P., and de Laat, J.: Detection of NO2 pollution plumes from individual ships with the TROPOMI/S5P satellite sensor, Environ. Res. Lett., 15, 124037, https://doi.org/10.1088/1748-9326/abc445, 2020. a
Gielen, C., Van Roozendael, M., Hendrick, F., Pinardi, G., Vlemmix, T., De Bock, V., De Backer, H., Fayt, C., Hermans, C., Gillotay, D., and Wang, P.: A simple and versatile cloud-screening method for MAX-DOAS retrievals, Atmos. Meas. Tech., 7, 3509–3527, https://doi.org/10.5194/amt-7-3509-2014, 2014. a
Goldberg, D. L., Anenberg, S. C., Griffin, D., McLinden, C. A., Lu, Z., and Streets, D. G.: Disentangling the impact of the COVID-19 lockdowns on urban NO2 from natural variability, Geophys. Res. Lett., 47, e2020GL089269, https://doi.org/10.1029/2020GL089269, 2020. a
Goldberg, D. L., Anenberg, S., Mohegh, A., Lu, Z., and Streets, D. G.: TROPOMI NO2 in the United States: A detailed look at the annual averages, weekly cycles, effects of temperature, and correlation with surface NO2 concentrations, Earth's Future, 9, e2020EF001665, https://doi.org/10.1029/2020EF001665, 2021. a
Grainger, J. F. and Ring, J.: Anomalous Fraunhofer line profiles, Nature, 193, 762,, 1962. a
Granier, C., Bessagnet, B., Bond, T., D’Angiola, A., van Der Gon, H. D., Frost, G. J., Heil, A., Kaiser, J. W., Kinne, S., Klimont, Z., Kloster, S., Lamarque, J.-F., Liousse, C., Masui, T., Meleux, F., Mieville, A., Ohara, T., Raut, J.-C., Riahi, K., Schultz, M. G., Smith, S. J., Thompson, A., van Aardenne, J., van der Werf, G. R., and van Vuuren, D. P.: Evolution of anthropogenic and biomass burning emissions of air pollutants at global and regional scales during the 1980–2010 period, Nature, 109, 163, https://doi.org/10.1038/193762a0, 2011. a
Griffin, D., Zhao, X., McLinden, C. A., Boersma, F., Bourassa, A., Dammers, E., Degenstein, D., Eskes, H. J., Fehr, L., Fioletov, V., Hayden, K., Kharol, S. K., Li, S.-M., Makar, P., Martin, R. V., Mihele, C., Mittermeier, R. L., Krotkov, N., Sneep, M., Lamsal, L. N., Linden, M. t., Geffen, J. v., Veefkind, P., and Wolde, M.: High-resolution mapping of nitrogen dioxide with TROPOMI: First results and validation over the Canadian oil sands, Geophys. Res. Lett., 46, 1049–1060, 2019. a, b, c
Heckel, A., Richter, A., Tarsu, T., Wittrock, F., Hak, C., Pundt, I., Junkermann, W., and Burrows, J. P.: MAX-DOAS measurements of formaldehyde in the Po-Valley, Atmos. Chem. Phys., 5, 909–918, https://doi.org/10.5194/acp-5-909-2005, 2005. a
Heckel, A., Kim, S.-W., Frost, G. J., Richter, A., Trainer, M., and Burrows, J. P.: Influence of low spatial resolution a priori data on tropospheric NO2 satellite retrievals, 4, 1805–1820, 2011. a
Hedelt, P., Efremenko, D. S., Loyola, D. G., Spurr, R., and Clarisse, L.: Sulfur dioxide layer height retrieval from Sentinel-5 Precursor/TROPOMI using FP_ILM, Atmos. Meas. Tech., 12, 5503–5517, https://doi.org/10.5194/amt-12-5503-2019, 2019. a
Hendrick, F., Müller, J.-F., Clémer, K., Wang, P., De Mazière, M., Fayt, C., Gielen, C., Hermans, C., Ma, J. Z., Pinardi, G., Stavrakou, T., Vlemmix, T., and Van Roozendael, M.: Four years of ground-based MAX-DOAS observations of HONO and NO2 in the Beijing area, Atmos. Chem. Phys., 14, 765–781, https://doi.org/10.5194/acp-14-765-2014, 2014. a
Holtslag, A. A. M. and Boville, B. A.: Local versus nonlocal boundary-layer diffusion in a global climate model, 6, 1825–1842, 1993. a
Hönninger, G., von Friedeburg, C., and Platt, U.: Multi axis differential optical absorption spectroscopy (MAX-DOAS), Atmos. Chem. Phys., 4, 231–254, https://doi.org/10.5194/acp-4-231-2004, 2004. a
Huang, G. and Sun, K.: Non-negligible impacts of clean air regulations on the reduction of tropospheric NO2 over East China during the COVID-19 pandemic observed by OMI and TROPOMI, Sci. Tot. Environ., 745, 141023, https://doi.org/10.1016/j.scitotenv.2020.141023, 2020. a
Huber, D. E., Steiner, A. L., and Kort, E. A.: Daily Cropland Soil NOx Emissions Identified by TROPOMI and SMAP, Geophys. Res. Lett., 47, e2020GL089949, https://doi.org/10.1029/2020GL089949, 2020. a
Huijnen, V., Williams, J., van Weele, M., van Noije, T., Krol, M., Dentener, F., Segers, A., Houweling, S., Peters, W., de Laat, J., Boersma, F., Bergamaschi, P., van Velthoven, P., Le Sager, P., Eskes, H., Alkemade, F., Scheele, R., Nédélec, P., and Pätz, H.-W.: The global chemistry transport model TM5: description and evaluation of the tropospheric chemistry version 3.0, Geosci. Model Dev., 3, 445–473, https://doi.org/10.5194/gmd-3-445-2010, 2010. a
Flemming, J., Huijnen, V., Arteta, J., Bechtold, P., Beljaars, A., Blechschmidt, A.-M., Diamantakis, M., Engelen, R. J., Gaudel, A., Inness, A., Jones, L., Josse, B., Katragkou, E., Marecal, V., Peuch, V.-H., Richter, A., Schultz, M. G., Stein, O., and Tsikerdekis, A.: Tropospheric chemistry in the Integrated Forecasting System of ECMWF, Geosci. Model Dev., 8, 975–1003, https://doi.org/10.5194/gmd-8-975-2015, 2015. a
Ialongo, I., Virta, H., Eskes, H., Hovila, J., and Douros, J.: Comparison of TROPOMI/Sentinel-5 Precursor NO2 observations with ground-based measurements in Helsinki, Atmos. Meas. Tech., 13, 205–218, https://doi.org/10.5194/amt-13-205-2020, 2020. a, b
Irie, H., Kanaya, Y., Akimoto, H., Tanimoto, H., Wang, Z., Gleason, J. F., and Bucsela, E. J.: Validation of OMI tropospheric NO2 column data using MAX-DOAS measurements deep inside the North China Plain in June 2006: Mount Tai Experiment 2006, Atmos. Chem. Phys., 8, 6577–6586, https://doi.org/10.5194/acp-8-6577-2008, 2008. a
Irie, H., Takashima, H., Kanaya, Y., Boersma, K. F., Gast, L., Wittrock, F., Brunner, D., Zhou, Y., and Van Roozendael, M.: Eight-component retrievals from ground-based MAX-DOAS observations, Atmos. Meas. Tech., 4, 1027–1044, https://doi.org/10.5194/amt-4-1027-2011, 2011. a
Khorsandi, E., Baier, F., Erbertseder, T., and Bittner, M.: Air quality monitoring and simulation on urban scale over Munich, in: Remote Sensing Technologies and Applications in Urban Environments III, vol. 10793, p. 1079303, International Society for Optics and Photonics, 2018. a, b
Kleipool, Q. L., Dobber, M. R., de Haan, J. F., and Levelt, P. F.: Earth surface reflectance climatology from 3 years of OMI data, J. Geophys. Res.-Atmos., 113, D18308, https://doi.org/10.1029/2008JD010290, 2008. a, b, c
Koelemeijer, R. B. A., Stammes, P., Hovenier, J. W., and De Haan, J. F.: A fast method for retrieval of cloud parameters using oxygen A band measurements from the Global Ozone Monitoring Experiment, J. Geophys. Res.-Atmos., 106, 3475–3490, 2001. a
Kokhanovsky, A. A. and Rozanov, V. V.: The uncertainties of satellite DOAS total ozone retrieval for a cloudy sky, Atmos. Environ., 87, 27–36, 2008. a
Koukouli, M.-E., Skoulidou, I., Karavias, A., Parcharidis, I., Balis, D., Manders, A., Segers, A., Eskes, H., and van Geffen, J.: Sudden changes in nitrogen dioxide emissions over Greece due to lockdown after the outbreak of COVID-19, Atmos. Chem. Phys., 21, 1759–1774, https://doi.org/10.5194/acp-21-1759-2021, 2021. a
Kuenen, J. J. P., Visschedijk, A. J. H., Jozwicka, M., and Denier van der Gon, H. A. C.: TNO-MACC_II emission inventory; a multi-year (2003–2009) consistent high-resolution European emission inventory for air quality modelling, Atmos. Chem. Phys., 14, 10963–10976, https://doi.org/10.5194/acp-14-10963-2014, 2014. a, b
Kuhlmann, G., Lam, Y. F., Cheung, H. M., Hartl, A., Fung, J. C. H., Chan, P. W., and Wenig, M. O.: Development of a custom OMI NO2 data product for evaluating biases in a regional chemistry transport model, Atmos. Chem. Phys., 15, 5627–5644, https://doi.org/10.5194/acp-15-5627-2015, 2015. a
Lampel, J., Pöhler, D., Tschritter, J., Frieß, U., and Platt, U.: On the relative absorption strengths of water vapour in the blue wavelength range, Atmos. Meas. Tech., 8, 4329–4346, https://doi.org/10.5194/amt-8-4329-2015, 2015. a
Laughner, J. L., Zare, A., and Cohen, R. C.: Effects of daily meteorology on the interpretation of space-based remote sensing of NO2, Atmos. Chem. Phys., 16, 15247–15264, https://doi.org/10.5194/acp-16-15247-2016, 2016. a
Laughner, J. L., Zhu, Q., and Cohen, R. C.: The Berkeley High Resolution Tropospheric NO2 product, Earth Syst. Sci. Data, 10, 2069–2095, https://doi.org/10.5194/essd-10-2069-2018, 2018. a
Leitão, J., Richter, A., Vrekoussis, M., Kokhanovsky, A., Zhang, Q. J., Beekmann, M., and Burrows, J. P.: On the improvement of NO2 satellite retrievals – aerosol impact on the airmass factors, Atmos. Meas. Tech., 3, 475–493, https://doi.org/10.5194/amt-3-475-2010, 2010. a
Leue, C., Wenig, M., Wagner, T., Klimm, O., Platt, U., and Jähne, B.: Quantitative analysis of NOx emissions from Global Ozone Monitoring Experiment satellite image sequences, J. Geophys. Res.-Atmos., 106, 5493–5505, 2001. a
Levelt, P. F., Van den Oord, G. H. J., Dobber, M. R., Malkki, A., Visser, H., de Vries, J., Stammes, P., Lundell, J., and Saari, H.: The Ozone Monitoring Instrument, IEEE T. Geosci. Remote Sens., 44, 1093–1101, 2006. a
Levelt, P. F., Joiner, J., Tamminen, J., Veefkind, J. P., Bhartia, P. K., Stein Zweers, D. C., Duncan, B. N., Streets, D. G., Eskes, H., van der A, R., McLinden, C., Fioletov, V., Carn, S., de Laat, J., DeLand, M., Marchenko, S., McPeters, R., Ziemke, J., Fu, D., Liu, X., Pickering, K., Apituley, A., González Abad, G., Arola, A., Boersma, F., Chan Miller, C., Chance, K., de Graaf, M., Hakkarainen, J., Hassinen, S., Ialongo, I., Kleipool, Q., Krotkov, N., Li, C., Lamsal, L., Newman, P., Nowlan, C., Suleiman, R., Tilstra, L. G., Torres, O., Wang, H., and Wargan, K.: The Ozone Monitoring Instrument: overview of 14 years in space, Atmos. Chem. Phys., 18, 5699–5745, https://doi.org/10.5194/acp-18-5699-2018, 2018. a
Li, T., Wang, Y., and Yuan, Q.: Remote Sensing Estimation of Regional NO2 via Space-Time Neural Networks, Remote Sens., 12, 2514, https://doi.org/10.3390/rs12162514, 2020. a
Lin, J.-T., Martin, R. V., Boersma, K. F., Sneep, M., Stammes, P., Spurr, R., Wang, P., Van Roozendael, M., Clémer, K., and Irie, H.: Retrieving tropospheric nitrogen dioxide from the Ozone Monitoring Instrument: effects of aerosols, surface reflectance anisotropy, and vertical profile of nitrogen dioxide, Atmos. Chem. Phys., 14, 1441–1461, https://doi.org/10.5194/acp-14-1441-2014, 2014. a, b
Liu, F., Page, A., Strode, S. A., Yoshida, Y., Choi, S., Zheng, B., Lamsal, L. N., Li, C., Krotkov, N. A., Eskes, H., van der A, R. J., Veefkind, P., Levelt, P. F., Hauser, O. P., and Joiner, J.: Abrupt decline in tropospheric nitrogen dioxide over China after the outbreak of COVID-19, Sci. Adv., 6, eabc2992, https://doi.org/10.1126/sciadv.abc2992, 2020a. a
Liu, M., Lin, J., Boersma, K. F., Pinardi, G., Wang, Y., Chimot, J., Wagner, T., Xie, P., Eskes, H., Van Roozendael, M., Hendrick, F., Wang, P., Wang, T., Yan, Y., Chen, L., and Ni, R.: Improved aerosol correction for OMI tropospheric NO2 retrieval over East Asia: constraint from CALIOP aerosol vertical profile, Atmos. Meas. Tech., 12, 1–21, https://doi.org/10.5194/amt-12-1-2019, 2019a. a
Liu, M., Lin, J., Kong, H., Boersma, K. F., Eskes, H. J., Kanaya, Y., He, Q., Tian, X., Qin, K., Xie, P., Spurr, R., Ni, R., Yan, Y., Weng, H., and Wang, J.: A new TROPOMI product for tropospheric NO2 columns over East Asia with explicit aerosol corrections, 13, 4247–4259, https://doi.org/10.5194/amt-13-4247-2020, 2020b. a, b
Liu, S., Valks, P., Pinardi, G., De Smedt, I., Yu, H., Beirle, S., and Richter, A.: An improved total and tropospheric NO2 column retrieval for GOME-2, Atmos. Meas. Tech., 12, 1029–1057, https://doi.org/10.5194/amt-12-1029-2019, 2019b. a, b, c, d, e, f
Liu, S., Valks, P., Pinardi, G., Xu, J., Argyrouli, A., Lutz, R., Tilstra, L. G., Huijnen, V., Hendrick, F., and Van Roozendael, M.: An improved air mass factor calculation for nitrogen dioxide measurements from the Global Ozone Monitoring Experiment-2 (GOME-2), Atmos. Meas. Tech., 13, 755–787, https://doi.org/10.5194/amt-13-755-2020, 2020c. a, b, c
Liu, S., Valks, P., Beirle, S., Loyola, D.: Nitrogen dioxide decline and rebound observed by GOME-2 and TROPOMI during COVID-19 pandemic, Air Qual. Atmos. Health, 14, pages 1737–1755, https://doi.org/10.1007/s11869-021-01046-2, 2021. a
Lorente, A., Folkert Boersma, K., Yu, H., Dörner, S., Hilboll, A., Richter, A., Liu, M., Lamsal, L. N., Barkley, M., De Smedt, I., Van Roozendael, M., Wang, Y., Wagner, T., Beirle, S., Lin, J.-T., Krotkov, N., Stammes, P., Wang, P., Eskes, H. J., and Krol, M.: Structural uncertainty in air mass factor calculation for NO2 and HCHO satellite retrievals, Atmos. Meas. Tech., 10, 759–782, https://doi.org/10.5194/amt-10-759-2017, 2017. a
Lorente, A., Boersma, K. F., Stammes, P., Tilstra, L. G., Richter, A., Yu, H., Kharbouche, S., and Muller, J.-P.: The importance of surface reflectance anisotropy for cloud and NO2 retrievals from GOME-2 and OMI, Atmos. Meas. Tech., 11, 4509–4529, https://doi.org/10.5194/amt-11-4509-2018, 2018. a, b
Lorente, A., Boersma, K. F., Eskes, H. J., Veefkind, J. P., Van Geffen, J., de Zeeuw, M. B., van der Gon, H. A. C. D., Beirle, S., and Krol, M. C.: Quantification of nitrogen oxides emissions from build-up of pollution over Paris with TROPOMI, Sci. Rep., 9, 20033, https://doi.org/10.1038/s41598-019-56428-5, 2019. a
Loyola, D., Pedergnana, M., and García, S. G.: Smart sampling and incremental function learning for very large high dimensional data, Neural Netw., 78, 75–87, 2016. a
Loyola, D. G., Gimeno García, S., Lutz, R., Argyrouli, A., Romahn, F., Spurr, R. J. D., Pedergnana, M., Doicu, A., Molina García, V., and Schüssler, O.: The operational cloud retrieval algorithms from TROPOMI on board Sentinel-5 Precursor, Atmos. Meas. Tech., 11, 409–427, https://doi.org/10.5194/amt-11-409-2018, 2018. a, b, c
Loyola, D., Lutz, R., Argyrouli, A., and Spurr, R.: S5P/TROPOMI ATBD Cloud Products, Tech. rep., S5P-DLR-L2-ATBD-400I issue 2.2, 2020a. a, b, c, d
Loyola, D. G., Xu, J., Heue, K.-P., and Zimmer, W.: Applying FP_ILM to the retrieval of geometry-dependent effective Lambertian equivalent reflectivity (GE_LER) daily maps from UVN satellite measurements, [data set], Atmos. Meas. Tech., 13, 985–999, https://doi.org/10.5194/amt-13-985-2020, 2020b. a, b, c, d, e
Lutz, R., Loyola, D., Gimeno García, S., and Romahn, F.: OCRA radiometric cloud fractions for GOME-2 on MetOp-A/B, [data set], Atmos. Meas. Tech., 9, 2357–2379, https://doi.org/10.5194/amt-9-2357-2016, 2016. a, b
Ma, J. Z., Beirle, S., Jin, J. L., Shaiganfar, R., Yan, P., and Wagner, T.: Tropospheric NO2 vertical column densities over Beijing: results of the first three years of ground-based MAX-DOAS measurements (2008–2011) and satellite validation, Atmos. Chem. Phys., 13, 1547–1567, https://doi.org/10.5194/acp-13-1547-2013, 2013. a, b, c
Mallet, V., Quélo, D., Sportisse, B., Ahmed de Biasi, M., Debry, E., Korsakissok, I., Wu, L., Roustan, Y., Sartelet, K., Tombette, M., and Foudhil, H.: The air quality modeling system Polyphemus, Atmos. Chem. Phys., 7, 5479–5487, 2007. a, b, c, d
Martin, R. V., Chance, K., Jacob, D. J., Kurosu, T. P., Spurr, R. J., Bucsela, E., Gleason, J. F., Palmer, P. I., Bey, I., Fiore, A. M., et al.: An improved retrieval of tropospheric nitrogen dioxide from GOME, J. Geophys. Res.-Atmos., 107, 4437, https://doi.org/10.1029/2001JD001027, 2002. a
Martin, R. V., Jacob, D. J., Chance, K., Kurosu, T. P., Palmer, P. I., and Evans, M. J.: Global inventory of nitrogen oxide emissions constrained by space-based observations of NO2 columns, J. Geophys. Res.-Atmos., 108, 4537, https://doi.org/10.1029/2003JD003453, 2003. a
McCormick, J.: Acid Earth: the global threat of acid pollution, Routledge, 2013. a
McLinden, C. A., Fioletov, V., Boersma, K. F., Kharol, S. K., Krotkov, N., Lamsal, L., Makar, P. A., Martin, R. V., Veefkind, J. P., and Yang, K.: Improved satellite retrievals of NO2 and SO2 over the Canadian oil sands and comparisons with surface measurements, Atmos. Chem. Phys., 14, 3637–3656, https://doi.org/10.5194/acp-14-3637-2014, 2014. a
Munro, R., Eisinger, M., Anderson, C., Callies, J., Corpaccioli, E., Lang, R., Lefebvre, A., Livschitz, Y., and Albinana, A. P.: GOME-2 on MetOp, in: Proc. of The 2006 EUMETSAT Meteorological Satellite Conference, Helsinki, Finland, 1216, 48, ISBN 92-9110-076-5, 2006. a
Munro, R., Lang, R., Klaes, D., Poli, G., Retscher, C., Lindstrot, R., Huckle, R., Lacan, A., Grzegorski, M., Holdak, A., Kokhanovsky, A., Livschitz, J., and Eisinger, M.: The GOME-2 instrument on the Metop series of satellites: instrument design, calibration, and level 1 data processing – an overview, Atmos. Meas. Tech., 9, 1279–1301, https://doi.org/10.5194/amt-9-1279-2016, 2016. a
Nüß, H., Richter, A., Valks, P., and Burrows, J.: Improvement of the NO2 total column retrieval for GOME-2, O3M SAF Visiting Scientist Activity, Final Report, IUP University of Bremen, 2006. a
Peters, E., Wittrock, F., Richter, A., Alvarado, L. M. A., Rozanov, V. V., and Burrows, J. P.: Liquid water absorption and scattering effects in DOAS retrievals over oceans, Atmos. Meas. Tech., 7, 4203–4221, https://doi.org/10.5194/amt-7-4203-2014, 2014. a
Pinardi, G., Van Roozendael, M., Lambert, J.-C., Granville, J., Hendrick, F., Tack, F., Yu, H., Cede, A., Kanaya, Y., Irie, I., Goutail, F., Pommereau, J.-P., Pazmino, A., Wittrock, F., Richter, A., Wagner, T., Gu, M., Remmers, J., Friess, U., Vlemmix, T., Piters, A., Hao, N., Tiefengraber, M., Herman, J., Abuhassan, N., Bais, A., Kouremeti, N., Hovila, J., Holla, R., Chong, J., Postylyakov, O., and Ma, J.: GOME-2 total and tropospheric NO2 validation based on zenith-sky, direct-sun and multi-axis DOAS network observations, in: Proc. of the 2014 EUMETSAT Meteorological Satellite Conference, Geneva, Swizerland, EUMETSAT, 2014. a
Pinardi, G., Lambert, J.-C., Granville, J., Yu, H., De Smedt, I., van Roozendael, M., and Valks, P.: O3M-SAF validation report, Tech. rep., SAF/O3M/IASB/VR/NO2/TN-IASB-GOME2-O3MSAF-NO2-2015, Issue 1/1, 2015. a
Pinardi, G., Van Roozendael, M., Hendrick, F., Theys, N., Abuhassan, N., Bais, A., Boersma, F., Cede, A., Chong, J., Donner, S., Drosoglou, T., Dzhola, A., Eskes, H., Frieß, U., Granville, J., Herman, J. R., Holla, R., Hovila, J., Irie, H., Kanaya, Y., Karagkiozidis, D., Kouremeti, N., Lambert, J.-C., Ma, J., Peters, E., Piters, A., Postylyakov, O., Richter, A., Remmers, J., Takashima, H., Tiefengraber, M., Valks, P., Vlemmix, T., Wagner, T., and Wittrock, F.: Validation of tropospheric NO2 column measurements of GOME-2A and OMI using MAX-DOAS and direct sun network observations, Atmos. Meas. Tech., 13, 6141–6174, https://doi.org/10.5194/amt-13-6141-2020, 2020. a, b
Platt, U. and Stutz, J.: Differential Optical Absorption Spectroscopy, Springer, 2008. a, b
Pope, R. M. and Fry, E. S.: Absorption spectrum (380–700 nm) of pure water. II. Integrating cavity measurements, Appl. Opt., 36, 8710–8723, 1997. a
Popp, C., Wang, P., Brunner, D., Stammes, P., Zhou, Y., and Grzegorski, M.: MERIS albedo climatology for FRESCO+ O2 A-band cloud retrieval, Atmos. Meas. Tech., 4, 463–483, https://doi.org/10.5194/amt-4-463-2011, 2011. a, b
Qin, W., Fasnacht, Z., Haffner, D., Vasilkov, A., Joiner, J., Krotkov, N., Fisher, B., and Spurr, R.: A geometry-dependent surface Lambertian-equivalent reflectivity product for UV–Vis retrievals – Part 1: Evaluation over land surfaces using measurements from OMI at 466 nm, Atmos. Meas. Tech., 12, 3997–4017, https://doi.org/10.5194/amt-12-3997-2019, 2019. a, b
Richter, A. and Lange, K.: What is the short-term variability of NO2 in the atmosphere?, in: MAX-DOAS Workshop, Bremen, Germany, 2021. a
Richter, A. et al.: S5P/TROPOMI Science Verification Report, Tech. rep., S5P-IUP-L2-ScVR-RP issue 2.1, 2015. a
Rodgers, C. D.: Inverse methods for atmospheric sounding: theory and practice, vol. 2, World scientific, 2000. a
Rothman, L. S., Gordon, I. E., Barber, R. J., Dothe, H., Gamache, R. R., Goldman, A., Perevalov, V. I., Tashkun, S. A., and Tennyson, J.: HITEMP, the high-temperature molecular spectroscopic database, J. Quant. Spectrosc. Radiat. Transf., 111, 2139–2150, 2010. a
Russell, A. R., Perring, A. E., Valin, L. C., Bucsela, E. J., Browne, E. C., Wooldridge, P. J., and Cohen, R. C.: A high spatial resolution retrieval of NO2 column densities from OMI: method and evaluation, Atmos. Chem. Phys., 11, 8543–8554, https://doi.org/10.5194/acp-11-8543-2011, 2011. a
Russell, G. L. and Lerner, J. A.: A new finite-differencing scheme for the tracer transport equation, J. Appl. Meteorol., 20, 1483–1498, 1981. a
Saiedy, F., Jacobowitz, H., and Wark, D.: On cloud-top determination from Gemini-5, J. Atmos. Sci., 24, 63–69, 1967. a
Schell, B., Ackermann, I. J., Hass, H., Binkowski, F. S., and Ebel, A.: Modeling the formation of secondary organic aerosol within a comprehensive air quality model system, J. Geophys. Res.-Atmos., 106, 28275–28293, 2001. a, b
Sen, P. K.: Estimates of the regression coefficient based on Kendall's tau, J. Acoust. Soc. America, 63, 1379–1389, 1968. a
Simpson, D., Winiwarter, W., Börjesson, G., Cinderby, S., Ferreiro, A., Guenther, A., Hewitt, C. N., Janson, R., Khalil, M. A. K., Owen, S., Pierce, T. E., Puxbaum, H., Shearer, M., Skiba, U., Steinbrecher, R., Tarrasón, L., and Öquist, M. G.: Inventorying emissions from nature in Europe, J. Geophys. Res.-Atmos., 104, 8113–8152, 1999. a
Skamarock, W. C., Klemp, J. B., Dudhia, J., Gill, D. O., Barker, D. M., Duda, M. G., Huang, X.-Y., Wang, W., , and Powers, J. G.: A Description of the Advanced Research WRF Version 3, Tech. rep., NCAR Tech. Note NCAR/TN-475+STR, 2008. a, b
Solomon, S., Schmeltekopf, A. L., and Sanders, R. W.: On the interpretation of zenith sky absorption measurements, J. Geophys. Res.-Atmos., 92, 8311–8319, 1987. a
Spurr, R. J.: VLIDORT: A linearized pseudo-spherical vector discrete ordinate radiative transfer code for forward model and retrieval studies in multilayer multiple scattering media, J. Quant. Spectrosc. Radiat. Transf., 102, 316–342, 2006. a
Spurr, R. J. D., Kurosu, T. P., and Chance, K. V.: A linearized discrete ordinate radiative transfer model for atmospheric remote-sensing retrieval, J. Quant. Spectrosc. Radiat. Transf., 68, 689–735, 2001. a, b
Stavrakou, T., Müller, J.-F., Bauwens, M., Boersma, K. F., and van Geffen, J.: Satellite evidence for changes in the NO2 weekly cycle over large cities, Sci. Rep., 10, 1–9, 2020. a
Stockwell, W. R., Kirchner, F., Kuhn, M., and Seefeld, S.: A new mechanism for regional atmospheric chemistry modeling, J. Geophys. Res.-Atmos., 102, 25847–25879, 1997. a, b
Tack, F., Merlaud, A., Iordache, M.-D., Pinardi, G., Dimitropoulou, E., Eskes, H., Bomans, B., Veefkind, P., and Van Roozendael, M.: Assessment of the TROPOMI tropospheric NO2 product based on airborne APEX observations, Atmos. Meas. Tech., 14, 615–646, https://doi.org/10.5194/amt-14-615-2021, 2021. a, b
Thalman, R. and Volkamer, R.: Temperature dependent absorption cross-sections of O2-O2 collision pairs between 340 and 630 nm and at atmospherically relevant pressure, Phys. Chem. Chem. Phys., 15, 15371–15381, 2013. a
Tilstra, L. G., Tuinder, O. N. E., Wang, P., and Stammes, P.: Surface reflectivity climatologies from UV to NIR determined from Earth observations by GOME-2 and SCIAMACHY, J. Geophys. Res.-Atmos., 122, 4084–4111, 2017. a
Tilstra, L. G., Tuinder, O. N. E., and Stammes, P.: GOME-2 surface LER product – Algorithm Theoretical Basis Document, Tech. rep., KNMI Report SAF/AC/KNMI/ATBD/003, Issue 3.1, 2019. a
Tilstra, L. G., Tuinder, O. N. E., Wang, P., and Stammes, P.: Directionally dependent Lambertian-equivalent reflectivity (DLER) of the Earth's surface measured by the GOME-2 satellite instruments, J. Geophys. Res.-Atmos., 14, 4219–4238, 2021. a
Valks, P., Pinardi, G., Richter, A., Lambert, J.-C., Hao, N., Loyola, D., Van Roozendael, M., and Emmadi, S.: Operational total and tropospheric NO2 column retrieval for GOME-2, Atmos. Meas. Tech., 4, 1491–1514, https://doi.org/10.5194/amt-4-1491-2011, 2011. a
van der A, R. J., de Laat, A. T. J., Ding, J., and Eskes, H.: Connecting the dots: NOx emissions along a West Siberian natural gas pipeline, npj Clim. Atmos. Sci., 3, 1–7, 2020. a, b
van Geffen, J., Boersma, K. F., Eskes, H., Sneep, M., ter Linden, M., Zara, M., and Veefkind, J. P.: S5P TROPOMI NO2 slant column retrieval: method, stability, uncertainties and comparisons with OMI, Atmos. Meas. Tech., 13, 1315–1335, https://doi.org/10.5194/amt-13-1315-2020, 2020. a, b, c, d, e, f
van Geffen, J. H. G. M., Boersma, K. F., Van Roozendael, M., Hendrick, F., Mahieu, E., De Smedt, I., Sneep, M., and Veefkind, J. P.: Improved spectral fitting of nitrogen dioxide from OMI in the 405–465 nm window, Atmos. Meas. Tech., 8, 1685–1699, https://doi.org/10.5194/amt-8-1685-2015, 2015. a
van Geffen, J. H. G. M., Boersma, K. F., Eskes, H., Maasakkers, J. D., and Veefkind, J. P.: TROPOMI ATBD of the total and tropospheric NO2 data products, Tech. rep., S5P-KNMI-L2-0005-RP issue 1.4.0., 2020b. a, b, c, d
Vandaele, A. C., Hermans, C., Fally, S., Carleer, M., Colin, R., Merienne, M.-F., Jenouvrier, A., and Coquart, B.: High-resolution Fourier transform measurement of the NO2 visible and near-infrared absorption cross sections: Temperature and pressure effects, J. Geophys. Res.-Atmos., 107, 4348, 2002. a
Vasilkov, A., Joiner, J., Spurr, R., Bhartia, P. K., Levelt, P., and Stephens, G.: Evaluation of the OMI cloud pressures derived from rotational Raman scattering by comparisons with other satellite data and radiative transfer simulations, J. Geophys. Res.-Atmos., 113, D15S19, https://doi.org/10.1029/2007JD008689, 2008. a
Vasilkov, A., Qin, W., Krotkov, N., Lamsal, L., Spurr, R., Haffner, D., Joiner, J., Yang, E.-S., and Marchenko, S.: Accounting for the effects of surface BRDF on satellite cloud and trace-gas retrievals: a new approach based on geometry-dependent Lambertian equivalent reflectivity applied to OMI algorithms, Atmos. Meas. Tech., 10, 333–349, https://doi.org/10.5194/amt-10-333-2017, 2017. a
Veefkind, J., Aben, I., McMullan, K., Förster, H., De Vries, J., Otter, G., Claas, J., Eskes, H., De Haan, J., Kleipool, Q., van Weele, M., Hasekamp, O., Hoogeveen, R., Landgraf, J., Snel, R., Tol, P., Ingmann, P., Voors, R., Kruizinga, B., Vink, R., Visser, H., and Levelt, P.: TROPOMI on the ESA Sentinel-5 Precursor: A GMES mission for global observations of the atmospheric composition for climate, air quality and ozone layer applications, Remote Sens. Environ., 120, 70–83, 2012. a
Verhoelst, T., Compernolle, S., Pinardi, G., Lambert, J.-C., Eskes, H. J., Eichmann, K.-U., Fjæraa, A. M., Granville, J., Niemeijer, S., Cede, A., Tiefengraber, M., Hendrick, F., Pazmiño, A., Bais, A., Bazureau, A., Boersma, K. F., Bognar, K., Dehn, A., Donner, S., Elokhov, A., Gebetsberger, M., Goutail, F., Grutter de la Mora, M., Gruzdev, A., Gratsea, M., Hansen, G. H., Irie, H., Jepsen, N., Kanaya, Y., Karagkiozidis, D., Kivi, R., Kreher, K., Levelt, P. F., Liu, C., Müller, M., Navarro Comas, M., Piters, A. J. M., Pommereau, J.-P., Portafaix, T., Prados-Roman, C., Puentedura, O., Querel, R., Remmers, J., Richter, A., Rimmer, J., Rivera Cárdenas, C., Saavedra de Miguel, L., Sinyakov, V. P., Stremme, W., Strong, K., Van Roozendael, M., Veefkind, J. P., Wagner, T., Wittrock, F., Yela González, M., and Zehner, C.: Ground-based validation of the Copernicus Sentinel-5P TROPOMI NO2 measurements with the NDACC ZSL-DOAS, MAX-DOAS and Pandonia global networks, Atmos. Meas. Tech., 14, 481–510, https://doi.org/10.5194/amt-14-481-2021, 2021. a
Verwer, J. G., Hundsdorfer, W., and Blom, J. G.: Numerical time integration for air pollution problems, Surveys on Math. for Indus., 10, 107–174, 2002. a
Vigouroux, C., Langerock, B., Bauer Aquino, C. A., Blumenstock, T., Cheng, Z., De Mazière, M., De Smedt, I., Grutter, M., Hannigan, J. W., Jones, N., Kivi, R., Loyola, D., Lutsch, E., Mahieu, E., Makarova, M., Metzger, J.-M., Morino, I., Murata, I., Nagahama, T., Notholt, J., Ortega, I., Palm, M., Pinardi, G., Röhling, A., Smale, D., Stremme, W., Strong, K., Sussmann, R., Té, Y., van Roozendael, M., Wang, P., and Winkler, H.: TROPOMI–Sentinel-5 Precursor formaldehyde validation using an extensive network of ground-based Fourier-transform infrared stations, Atmos. Meas. Tech., 13, 3751–3767, https://doi.org/10.5194/amt-13-3751-2020, 2020. a
Vlemmix, T., Piters, A. J. M., Stammes, P., Wang, P., and Levelt, P. F.: Retrieval of tropospheric NO2 using the MAX-DOAS method combined with relative intensity measurements for aerosol correction, Atmos. Meas. Tech., 3, 1287–1305, https://doi.org/10.5194/amt-3-1287-2010, 2010. a, b
Wagner, T., Dix, B. v., Friedeburg, C. v., Frieß, U., Sanghavi, S., Sinreich, R., and Platt, U.: MAX-DOAS O4 measurements: A new technique to derive information on atmospheric aerosols—Principles and information content, J. Geophys. Res.-Atmos., 109, D22205, https://doi.org/10.1029/2004JD004904, 2004. a
Wagner, T., Beirle, S., Brauers, T., Deutschmann, T., Frieß, U., Hak, C., Halla, J. D., Heue, K. P., Junkermann, W., Li, X., Platt, U., and Pundt-Gruber, I.: Inversion of tropospheric profiles of aerosol extinction and HCHO and NO2 mixing ratios from MAX-DOAS observations in Milano during the summer of 2003 and comparison with independent data sets, Atmos. Meas. Tech., 4, 2685–2715, https://doi.org/10.5194/amt-4-2685-2011, 2011. a
Wang, C., Wang, T., Wang, P., and Rakitin, V.: Comparison and validation of TROPOMI and OMI NO2 Observations over China, Atmosphere, 11, 636, https://doi.org/10.3390/atmos11060636, 2020. a
Wang, P. and Sneep, M.: Sentinel-5 L2 Prototype Processor – Algorithm Theoretical Baseline Document for Cloud, Tech. rep., KNMI-ESA-S5L2PP-ATBD-005 issue 3.1, 2019. a
Wang, P., Stammes, P., van der A, R., Pinardi, G., and van Roozendael, M.: FRESCO+: an improved O2 A-band cloud retrieval algorithm for tropospheric trace gas retrievals, Atmos. Chem. Phys., 8, 6565–6576, https://doi.org/10.5194/acp-8-6565-2008, 2008. a
Williams, J. E., van Velthoven, P. F. J., and Brenninkmeijer, C. A. M.: Quantifying the uncertainty in simulating global tropospheric composition due to the variability in global emission estimates of Biogenic Volatile Organic Compounds, Atmos. Chem. Phys., 13, 2857–2891, https://doi.org/10.5194/acp-13-2857-2013, 2013. a
Williams, J. E., Boersma, K. F., Le Sager, P., and Verstraeten, W. W.: The high-resolution version of TM5-MP for optimized satellite retrievals: description and validation, Geosci. Model Dev., 10, 721–750, https://doi.org/10.5194/gmd-10-721-2017, 2017. a, b
Wittrock, F., Oetjen, H., Richter, A., Fietkau, S., Medeke, T., Rozanov, A., and Burrows, J. P.: MAX-DOAS measurements of atmospheric trace gases in Ny-Ålesund – Radiative transfer studies and their application, Atmos. Chem. Phys., 4, 955–966, https://doi.org/10.5194/acp-4-955-2004, 2004. a
World Health Organization: WHO Air quality guidelines for particulate matter, ozone, nitrogen dioxide and sulfur dioxide: global update 2005: summary of risk assessment, Tech. rep., World Health Organization, 2006. a
Xu, J., Schüssler, O., Rodriguez, D. G. L., Romahn, F., and Doicu, A.: A novel ozone profile shape retrieval using full-physics inverse learning machine (FP-ILM), IEEE J. Sel. Top. Appl. Earth Observ. Remote Sens., 10, 5442–5457, 2017. a
Zara, M., Boersma, K. F., De Smedt, I., Richter, A., Peters, E., van Geffen, J. H. G. M., Beirle, S., Wagner, T., Van Roozendael, M., Marchenko, S., Lamsal, L. N., and Eskes, H. J.: Improved slant column density retrieval of nitrogen dioxide and formaldehyde for OMI and GOME-2A from QA4ECV: intercomparison, uncertainty characterisation, and trends, Atmos. Meas. Tech., 11, 4033–4058, https://doi.org/10.5194/amt-11-4033-2018, 2018. a
Zhao, X., Griffin, D., Fioletov, V., McLinden, C., Cede, A., Tiefengraber, M., Müller, M., Bognar, K., Strong, K., Boersma, F., Eskes, H., Davies, J., Ogyu, A., and Lee, S. C.: Assessment of the quality of TROPOMI high-spatial-resolution NO2 data products in the Greater Toronto Area, Atmos. Meas. Tech., 13, 2131–2159, https://doi.org/10.5194/amt-13-2131-2020, 2020. a
- Abstract
- Introduction
- DLR reference retrieval for TROPOMI NO2 measurement
- New stratosphere–troposphere separation
- Improved AMF calculation
- TROPOMI tropospheric NO2 measurements
- TROPOMI tropospheric NO2 validation
- Conclusions
- Data availability
- Author contributions
- Competing interests
- Disclaimer
- Acknowledgements
- Financial support
- Review statement
- References
- Supplement