the Creative Commons Attribution 4.0 License.
the Creative Commons Attribution 4.0 License.
 | 29 Jan 2021
Retrieval and evaluation of tropospheric-aerosol extinction profiles using multi-axis differential optical absorption spectroscopy (MAX-DOAS) measurements over Athens, Greece
Myrto Gratsea
Tim Bösch
Panagiotis Kokkalis
Andreas Richter
Mihalis Vrekoussis
Stelios Kazadzis
Alexandra Tsekeri
Alexandros Papayannis
Maria Mylonaki
Vassilis Amiridis
Nikos Mihalopoulos
In this study, we report on the retrieval of aerosol extinction profiles from ground-based scattered sunlight multi-axis differential optical absorption spectroscopy (MAX-DOAS) measurements, carried out at Athens, Greece. It is the first time that aerosol profiles are retrieved from MAX-DOAS measurements in Athens. The reported aerosol vertical distributions at 477 nm are derived from the oxygen dimer (O4) differential-slant-column-density observations at different elevation angles by applying the BRemen Optimal estimation REtrieval for Aerosol and trace gaseS (BOREAS) retrieval algorithm. Four case studies have been selected for validation purposes; the retrieved aerosol profiles and the corresponding aerosol optical depths (AODs) from the MAX-DOAS are compared with lidar extinction profiles and with sun-photometric measurements (Aerosol Robotic Network, AERONET, observations), respectively. Despite the different approach of each method regarding the retrieval of the aerosol information, the comparison with the lidar measurements at 532 nm reveals a very good agreement in terms of vertical distribution, with r>0.90 in all cases. The AODs from the MAX-DOAS and the sun photometer (the latter at 500 nm) show a satisfactory correlation (with 0.45 < r < 0.7 in three out of the four cases). The comparison indicates that the MAX-DOAS systematically underestimates the AOD in the cases of large particles (small Ångström exponent) and for measurements at small relative azimuthal angles between the viewing direction and the sun. Better agreement is achieved in the morning, at large relative azimuthal angles. Overall, the aerosol profiles retrieved from MAX-DOAS measurements are of good quality; thus, new perspectives are opened up for assessing urban aerosol pollution on a long-term basis in Athens from continuous and uninterrupted MAX-DOAS measurements.
- Article
(5633 KB) - Full-text XML
- BibTeX
- EndNote


Tropospheric aerosols originate from both natural and anthropogenic sources. The lifetime of aerosols in the troposphere ranges from a few days to a few weeks, depending on their size and meteorology (e.g. Pandis et al., 1995). They take part in atmospheric processes through (i) nucleation and interaction with clouds (e.g. Twomey et al., 1977; Rosenfeld et al., 2014); (ii) participation in chemical and photochemical reactions by providing the required surface for heterogeneous reactions to take place (Andreae and Crutzen, 1997); and (iii) absorption and scattering of incoming solar and earth's IR radiation, affecting atmospheric dynamics and stability (e.g. Dubovik et al., 2002) and the earth's climate (IPCC, 2001). Significant decrease in UV–vis irradiance reaching the ground due to urban aerosol pollution has been reported in various cases (e.g. Zerefos et al., 2009; Chubarova et al., 2011).
According to a survey conducted in 25 large European cities, Athens occupies the third position on a European level in exceedances of particle pollution regulations (Pascal et al., 2013). Saharan dust transported from the African continent is the main natural source of tropospheric aerosols in Athens (e.g. Kanakidou et al., 2007; Gerasopoulos et al., 2011; Raptis et al., 2020), while common anthropogenic sources are traffic emission and domestic heating (Markakis et al., 2010; Gratsea et al., 2017). Wildfires also contribute to the aerosol mixture in the area occasionally, either from local events (Amiridis et al., 2012) or by long-range transport (Papayannis et al., 2009, Amiridis et al., 2011; Mona et al., 2012). Whereas emissions of most air pollutants, such as SO2, are expected to decrease by more than 80 % by the end of the 21st century, the decrease in aerosol emissions is projected to be small (IPCC, 2007), and thus aerosols may play an even more critical role in air quality in the future. Therefore, long-term continuous measurements, providing information on the spatial and temporal distribution of aerosols, are of great importance to urban air pollution assessment and to the understanding of the aerosol contribution to earth's climate. The knowledge of the vertical distribution of aerosols is necessary for understanding the mechanisms underlying the formation and development of urban smog.
Satellite, airborne and ground-based measurements are widely used to derive aerosol vertical profiles (e.g. Papayannis et al., 2005; Schmid et al., 2006; DeCarlo et al., 2008; Solanki and Singh, 2014); satellite measurements sometimes fail to be accurate in the lower atmosphere, while airborne measurements, although accurate in the lower atmosphere, are temporally restricted. In contrast, ground-based measurements can provide both a very good record of the lower troposphere and a satisfactory temporal resolution. However, since the ground-based profile measurements are mainly relying on lidar systems (e.g. the European Aerosol Research Lidar Network – EARLINET – within the European Research Infrastructure for the observation of Aerosol, Clouds and Trace Gases Research Infrastructure – ACTRIS), they are costly in terms of set-up and operation. An additional option for ground-based observations is the multi-axis differential optical absorption spectroscopy (MAX-DOAS) technique, which has been gaining ground over the last years (e.g. Wittrock et al., 2004; Heckel et al., 2005; Ma et al., 2013; Schreier et al., 2020) since it can provide low-cost, continuous and uninterrupted measurements without the need for absolute radiometric calibration. The MAX-DOAS technique has also been shown to be very promising for the retrieval of aerosols' vertical distribution (e.g. Sinreich et al., 2005; Lee et al., 2009; Clémer et al., 2010; Wagner et al., 2011). However, its sensitivity at higher altitudes is low, and compared to the lidar technique, it provides profiles with much coarser vertical resolution. It also performs only daylight measurements, which can be considered to be a limitation of this technique. In some studies, the retrieved aerosol extinction profiles from MAX-DOAS measurements are compared to the corresponding profiles derived from lidar (e.g. Irie et al., 2008; Zieger et al., 2011; Bösch et al., 2018) or Aerosol Robotic Network (AERONET)-based measurements (e.g. Wang et al., 2016). For the Athens area, although several studies have been published on aerosol extinction profiles from lidar measurements (e.g. Papayannis et al., 1998, 2005; Matthias et al., 2004), vertical trace gas and aerosol profile retrievals from MAX-DOAS have not been published so far.
In the scope of this paper, a retrieval algorithm, recently developed by the Institute of Environmental Physics and Remote Sensing of University of Bremen (Bösch et al., 2018), is employed in order to obtain vertical distributions of aerosol extinction from O4 MAX-DOAS measurements over the urban environment of Athens. O4 is an atmospheric absorber with a known concentration profile; therefore measurements of the O4 column can be used to retrieve the aerosol-induced light path changes (Wagner et al., 2004).
For validation purposes the outcomes of our calculations are compared to established techniques; the retrieved profiles are compared to profiles from ground-based lidar measurements (EARLINET station) and the aerosol optical depth (AOD) to sun photometer measurements (AERONET station).
A description of the instruments used in this study (location, instrumentation and data retrieval) along with a brief description of the profile retrieval algorithm is given in Sect. 2. In Sect. 3, we present the derived aerosol vertical distributions for four selected case studies, and we compare the MAX-DOAS aerosol extinction coefficient profiles and the AOD with lidar and sun-photometric measurements, respectively. The findings are summarised in Sect. 4, where the conclusions of this study are also provided.
2.1 Location
Four mountains surround the city of Athens, forming a basin that is open to the south and south-west. This special topography plays an essential role in the accumulation of atmospheric pollutants over the city under certain meteorological conditions (Kassomenos et al., 1995). Moreover, dust transport episodes from North Africa also contribute to the aerosol load of the city (e.g. Gerasopoulos et al., 2009; Kosmopoulos et al., 2017). In general, the Athens area can be considered to be an example of various aerosol types such as dust, local pollution, marine, biomass combustion and their mixtures (Soupiona et al., 2019).
Figure 1 shows the greater Athens area and the location of each instrument used in this study. The MAX-DOAS instrument is located at the premises of the National Observatory of Athens (NOA; 38.05∘ N, 23.86∘ E; 527 ) to the north of the city. No strong emission sources are present around the measurement area, which is considered to be suburban background. The lidar system performs measurements at the National and Technical University of Athens (NTUA; 37.97∘ N, 23.79∘ E; 212 ), and the site is considered to be suburban background. The CIMEL sun photometer is installed at the premises of NOA at Thissio hill (37∘58′ N, 23∘43′ E; 150 ), which, despite being located in the city centre, is considered to be urban background (Paraskevopoulou et al., 2015). Information about the instruments is provided in Table 1.
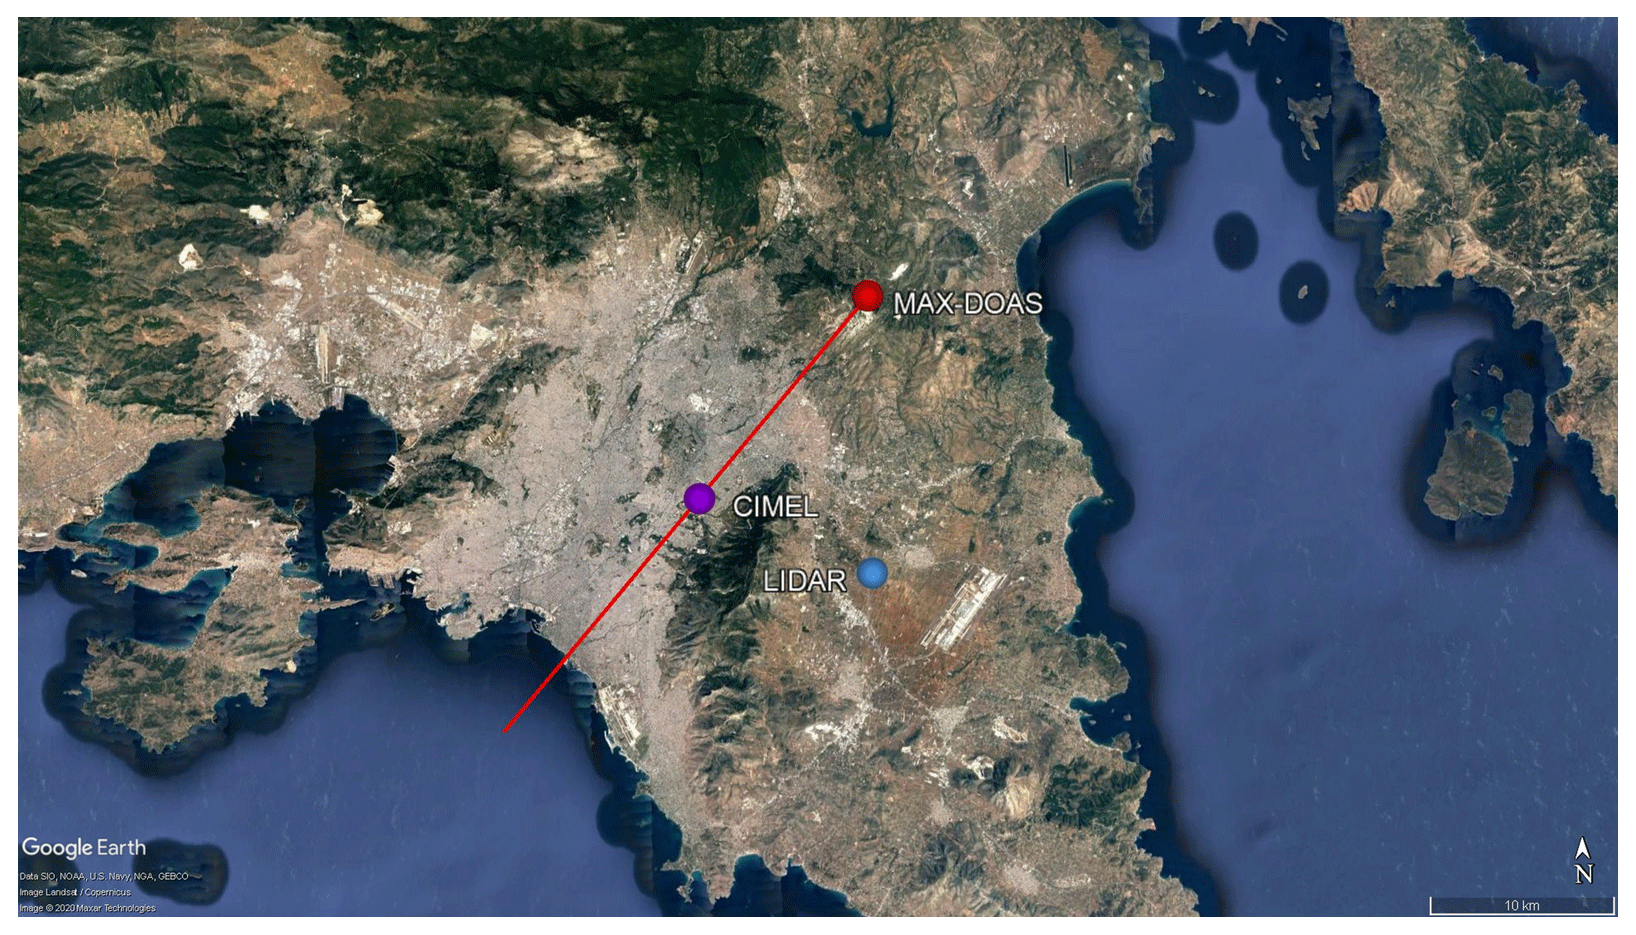
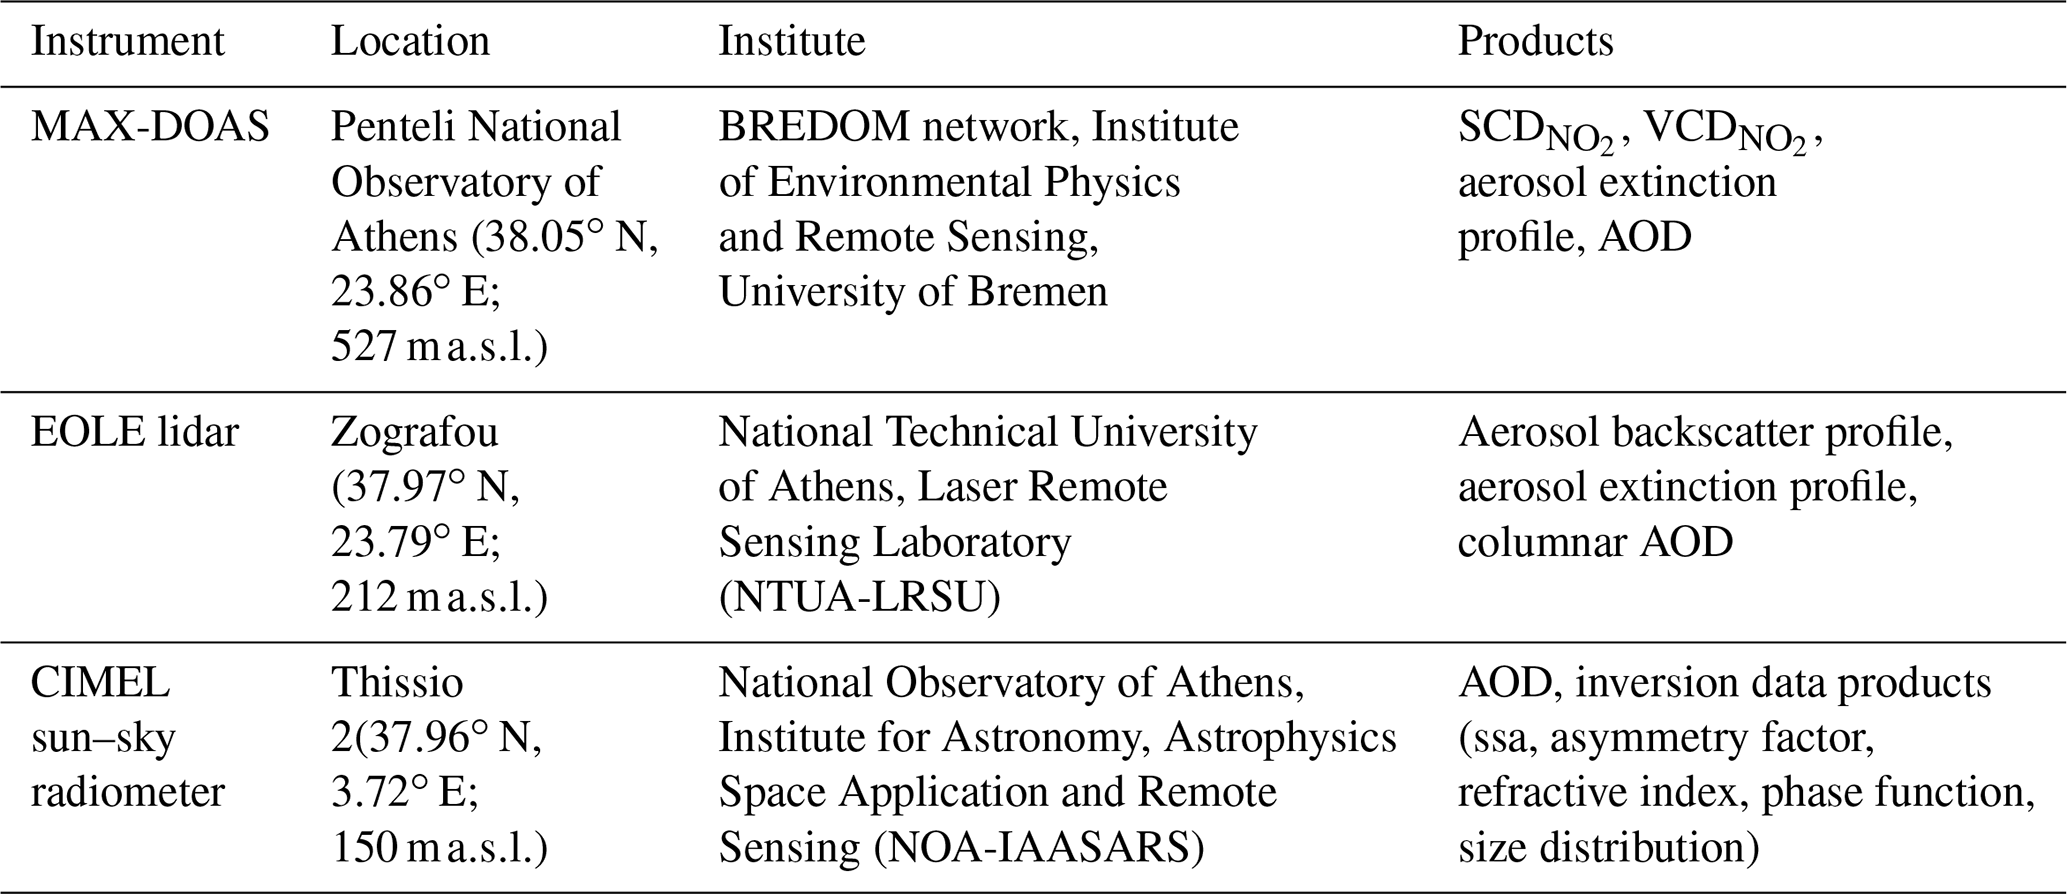
Figure 1Measurement sites and MAX-DOAS viewing direction (S). The distances between instruments are 16 km between MAX-DOAS and the sun photometer (CIMEL) and 13 km between MAX-DOAS and the lidar. © Google Earth
Table 1Instruments and data products used in the present study.
2.2 Instrumentation and data retrieval
2.2.1 MAX-DOAS
The MAX-DOAS instrument employed in this study is part of the BREDOM network (Bremian DOAS Network for Atmospheric Measurements; http://www.iup.uni-bremen.de/doas/groundbased_data.htm, last access: 14 February 2020) and has been operating continuously since October 2012. It comprises a grating spectrometer (LOT 260S, 600 L mm−1 ruled grating) connected via an optical-fibre bundle to a computer-controlled telescope unit. The spectrometer covers a spectral range from 330 to 500 nm with a spectral resolution of approximately 0.7 nm. The detector used is a CCD (charge-coupled device) by Andor Technology, with 2048 pixel × 512 pixel resolution, cooled to −40 ∘C.
The telescope performs intensity measurements at eight elevation angles (−1, 0, 1, 2, 4, 8, 15, 30∘) as well as to the zenith. However, the current retrieval algorithm only considers upward viewing directions, excluding −1 and 0∘. With this choice, little information is available for the profile retrieval below the station altitude; therefore profiles are retrieved and presented only for altitudes above 500 Measurements in eight azimuthal directions are performed, but in this study, only the S direction – pointing at 52.5∘ (with respect to south) and associated with the urban atmospheric conditions of the city (Gratsea et al., 2016) – is considered (Fig. 1). The S direction also covers the sun photometer's location and points close to the lidar's measurement site. The duration of one full scanning cycle (azimuthal and elevation scanning) is about 15 min; thus about 30 measurement cycles per day are available in winter and 45 in summer.
The spectral measurements are analysed using the DOAS technique; the Beer–Lambert law is considered to be the solution of the radiative transfer equation (Platt and Stutz, 2008), and the absorption spectrum is separated into broad and narrow spectral features that show low- and high-frequency variations, respectively, as a function of wavelength. The narrow spectral features correspond to the unique narrow-band absorption structures of the trace gases, while the broad ones represent the attenuation of solar radiation by scattering processes in the atmosphere as well as the continuum absorption by trace gases and the instrument. For the derivation of the slant column density (SCD; defined as the concentration of the absorber integrated along the light path), a polynomial accounting for the broad spectral features and the laboratory cross sections of the retrieved species are fitted to the measured optical depth. To determine the optical depth, the logarithm of the ratio of the current horizon measurement (I) and the reference intensity (Io) is taken.
The SCD of the oxygen dimer (O4), i.e. the slant optical thickness of the absorber divided by the absorption cross section, measured at different elevations is used as input to the retrieval algorithm for the calculation of the aerosol distribution. The slant column of the O4, a weak molecular absorber with a well-known vertical profile (the O4 concentration is proportional to the square of the O2), is almost linearly dependent on the average photon path lengths (Pfeilsticker et al., 1997) and thus can be used as an indicator of the presence of clouds or aerosols in the atmosphere. The is calculated by fitting to the measured optical depth the laboratory spectrum of O4 (Hermans et al., 2003), NO2 (Vandaele et al., 1998) and of O3 (Bogumil et al., 2000) and a polynomial of degree 4 which accounts for the broad spectral features. The fitting spectral window used is 425–490 nm. In order to retrieve the tropospheric , the zenith observation, corresponding to each measurement cycle, is used as the reference measurement Io, cancelling in this way the Fraunhofer lines in the solar spectrum and the stratospheric contributions to the SCD.
Tropospheric vertical column densities (VCDs) of NO2, shown in Sect. 3.1, can be derived by using air mass factors (AMFs) calculated with the SCIATRAN radiative transfer model (Rozanov et al., 2000). To convert the differential tropospheric SCD to the corresponding tropospheric VCD, the differential AMF () is required, namely the difference between the AMF at the same elevation α as the SCD measurement and the AMF at the zenith (Eq. 1).
The AMF describes the weighting of the absorption as a function of the relative azimuth and the solar zenith angle (SZA) for a given atmospheric profile and at a specific wavelength.
2.2.2 EOLE lidar system
The six-wavelength Raman-backscatter lidar system (EOLE) has been operating in Athens since February 2000 as part of the EARLINET network (Pappalardo et al., 2014). The system is designed following the optical set-up of a typical member station (Kokkalis, 2017), meeting all the quality assurance requirements of the network. The emission unit is based on a pulsed Nd:YAG laser, emitting high-energy pulses at 355, 532 and 1064 nm with a repetition rate of 10 Hz. The optical receiver is based on a Cassegrainian telescope (600 mm focal length and a clear aperture diameter of 300 mm), directly coupled with an optical fibre to the wavelength separation unit, detecting signals at 355, 387 (N2 Raman line of 355 nm), 407 (H2O Raman line of 355 nm), 532, 607 (N2 Raman line of the 532 nm) and 1064 nm. For every measuring cycle 1000 lidar signal returns are stored (every ∼ 1.66). For each case presented in this study, we used hourly averaged profiles, which correspond to approximately 34 individual signal acquisitions (Kokkalis et al., 2012).
During daytime operation, the system is capable of providing aerosol backscatter profiles (βaer) at 355, 532 and 1064 nm, based on the standard backscatter lidar technique and employing the Klett inversion method (Klett, 1981). This technique assumes the existence of an aerosol-free region (e.g. upper troposphere) and requires an a priori assumption of the lidar ratio value (the ratio of the extinction to backscatter coefficient, Saer). A variety of studies revealed a wide range for the lidar ratios, covering values from 20 to 100 sr (Ackermann, 1998; Mattis et al., 2004; Amiridis et al., 2005; Müller et al., 2007; Papayannis et al., 2008; Groß et al., 2011; Giannakaki et al., 2015). When the elastic backscatter lidar technique is used, the assumption of a constant lidar ratio value throughout the laser sounding range becomes very critical when solving the lidar equation; in this case, the overall uncertainty, including both statistical and systematic errors, on the retrieved βaer values, is of the order of 20 %–30 % (e.g. Rocadenbosch et al., 2010). In this study, the aerosol extinction profiles have been retrieved under the assumption of three lidar ratio values: 30, 50 and 70 (i.e. 50 ± 20 sr). This range is realistic for pollution and dust cases presented herein (Groß et al., 2013), and it is also in accordance with columnar lidar ratio values (interpolated to 532 nm) obtained by AERONET for the cases of this study, which vary from 48.8 ± 7.5 to 59.9 ± 12.1 sr. As a result of this variability (i.e. 50 ± 20 sr), the uncertainties introduced to the aerosol extinction profiles vary from 10 %–40 %; the higher uncertainties appear at the upper atmospheric layers, where the signal-to-noise ratio of the system decreases. The corresponding uncertainties of the lidar-derived AOD values due to this assumption were estimated to be up to 11 %. All the lidar profiles were obtained with the Single Calculus Chain (SCC) processing platform (D'Amico et al., 2016; Mattis et al., 2016), which is developed in the framework of EARLINET to ensure the high-quality products of the network, by implementing quality checks on both raw lidar data and final optical products.
One of the lidar's main limitations is the distance of full overlap between the laser beam and the receiver's field of view, which makes it difficult for the instrument to obtain useful and accurate aerosol-related information below that height. Wandinger and Ansmann (2002) demonstrated that when not applying overlap correction in lidar signals, the retrieved aerosol extinction coefficient may take even non-physical negative values for heights up to the full overlap. The incomplete overlap effect can be solved by using Raman measurements under nighttime conditions. In this study, only daytime measurements are used, and therefore no overlap correction is applied on the signals. The geometrical configuration of EOLE results in full overlap distance of 500–800 (Kokkalis, 2017). The aerosol extinction values below the 1000 height are considered to be inside the overlap region and therefore were omitted from the extinction profile comparison. Nevertheless, in order to calculate the AOD from the lidar profiles, the lowermost trustworthy value of the extinction coefficient was assumed constant (height-independent). During daytime, the upper limit of the planetary boundary layer over Athens ranges between 1500 and 2100 (Kokkalis et al., 2020); thus the minimum height of lidar profiles at 1000 is well within the planetary boundary layer (PBL). Our assumption of a well-mixed atmosphere below 1000 – which means that a constant lidar ratio value is considered for this part of the atmosphere (Wandinger and Ansmann, 2002) – may lead to an underestimation of the AOD at the lowest troposphere since the city is most probably an additional source of particles. This underestimation cannot be estimated because of the lidar overlap issue.
2.2.3 CIMEL sun photometer
The reported columnar aerosol optical properties have been retrieved by a CIMEL sun photometer (Holben et al., 1998). The instrument is part of NASA's global sun-photometric network, AERONET, and performs automatic measurements of the direct solar radiance at the common wavelengths of 340, 380, 440, 500, 675, 870, 940 and 1020 nm every 15 min and diffuse sky radiance at 440, 675, 870 and 1020 nm. These measurements are further used to provide both optical and microphysical aerosol properties in the atmospheric column (Dubovik et al., 2006). The CIMEL data used in this study are the cloud-screened and quality-assured level 2.0 data products, providing information about the columnar AOD and the Ångström exponent. The AOD uncertainty is < ± 0.02 for UV wavelengths and < ± 0.01 for wavelengths larger than 440 nm (Eck et al., 1999).
2.3 BOREAS profile retrieval algorithm
The BRemen Optimal estimation REtrieval for Aerosol and trace gaseS (BOREAS) is an optimal estimation-based profile retrieval algorithm developed at the Institute of Environmental Physics, University of Bremen (Bösch et al., 2018). It applies the optimal estimation technique for the retrieval of trace gas concentration profiles, while for our case – the aerosol retrievals – it uses an iterative Tikhonov regularisation approach. The main concept of the algorithm for the aerosol retrieval is to minimise the difference between modelled and measured O4 slant optical depths by applying the iterative Tikhonov technique to varied aerosol extinction profiles. This method uses the difference in the slant optical depth from an a priori state to obtain information on the aerosol concentration that caused this difference through multiple iterations. Slant column densities of trace gases and O4 from MAX-DOAS measurements at different line-of-sight (LOS) directions as well as climatology profile files are used as inputs. The BOREAS algorithm is based on the SCIATRAN radiative transfer model (Rozanov et al., 2005), which is used to calculate box air mass factors (BAMFs) and weighting functions needed for the profile inversion. The BAMF – in contrast to the total AMF – is a function of altitude describing the sensitivity of measurements to the profile at different atmospheric height layers. The aerosol weighting function matrices express the sensitivity of the O4 measurements to changes in the aerosol extinction coefficient profile. For the radiative transfer model (RTM) calculations, scattered light in a spherical atmosphere (multiple-scattering) and atmospheric profiles of pressure and temperature for Athens from the Atmospheric Science Radiosonde Archive of the University of Wyoming (http://weather.uwyo.edu/upperair/bufrraob.shtml, last access: 21 July 2020) are considered. The instrument was set to the station's altitude, and the surface was set at sea level. The aerosol inversion problem is expressed through the minimisation of Eq. (2):
where Δτ denotes the measured O4 differential slant optical thickness; the simulated differential slant optical thickness; Ω the measurement geometry (LOS, SZA, relative azimuth); Nα(z) the a priori aerosol number concentration profile, which is used as a starting point for the iterations; and P a polynomial of lower order, which accounts for the attenuation due to scattering processes. Since the relationship between the concentration profile and the O4 differential slant optical depth is not linear, the iterative Tikhonov regularisation technique, along with weighting function matrices, is used for the solution of the minimisation problem (Bösch et al., 2018).
The uncertainty associated with each retrieved profile is computed by the algorithm. It is the sum of the noise and smoothing errors, which represent the impact of the measurements and of the a priori profile on the retrieved profile, respectively. These two errors have been calculated for each of our case studies separately and are presented in Sect. 3.2.
The temporal resolution of the measurements is about 15 min, which corresponds to the duration of one full scanning cycle through all directions over the city. The vertical sampling of the retrieved profile is 0.05 km, with the bottom layer considered at the sea level and the top layer at 4 The AOD is calculated by integrating the BOREAS-retrieved aerosol extinction coefficient vertically. More details about the values assigned to each parameter are given in Sect. 3.2.
3.1 Selected case studies
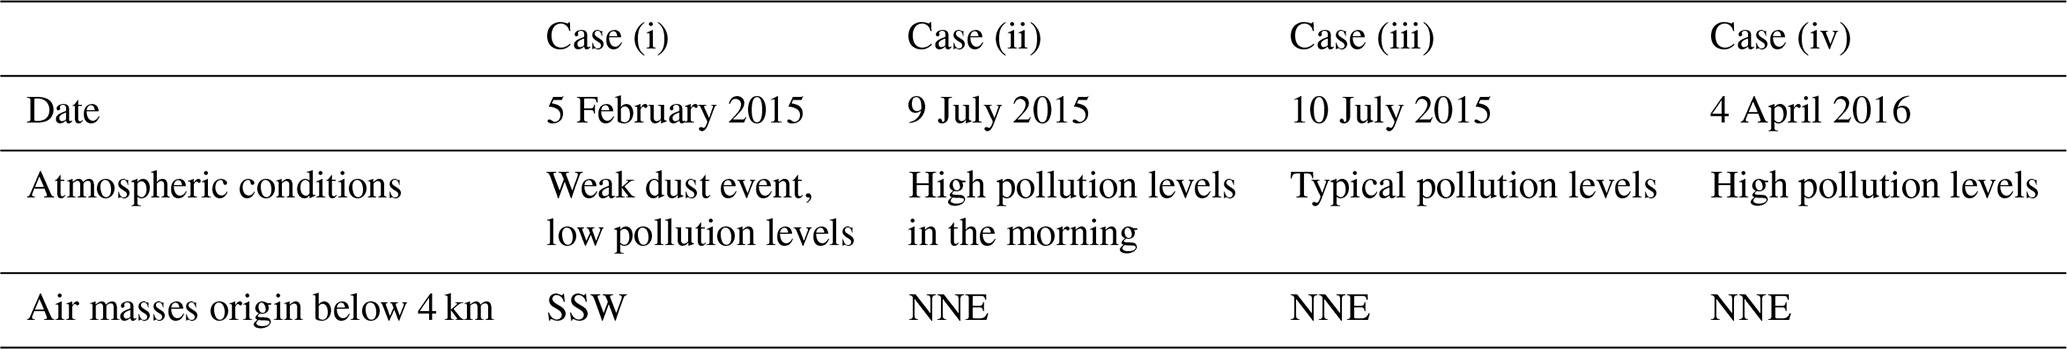
The main objective of this study is to assess the retrieved aerosol profiles from MAX-DOAS measurements by comparing them with well-established sun-photometric measurements (CIMEL) and lidar retrievals. Therefore, certain cases had to be selected with available and valid data from all three instruments. Additionally, the selected cases had to coincide with cloud-free days as all of the used measurement techniques have more substantial uncertainties in the presence of clouds. During the period from January 2015 to June 2016, four cases were found to meet the above conditions, covering winter, summer and spring: (i) 5 February 2015 under the influence of a weak dust event, (ii) 9 July 2015 with enhanced morning levels of NO2 for this season (Gratsea et al., 2016), (iii) 10 July 2015 with typical levels of pollution and (iv) 4 April 2016 with enhanced levels of NO2. In order to identify the sources of air masses reaching Athens on the specific dates, 4 d air mass back trajectories at different altitudes, calculated using the NOAA HYSPLIT (Hybrid Single-Particle Lagrangian-Integrated Trajectory) model (Draxler and Hess, 1997), were used. Potential for Saharan-dust transport below 4 km, which is the highest point of our retrievals, was identified only for case (i) (Fig. 2). In the rest of the cases, the air masses below 4 km originate from NNE directions and are thus not associated with dust aerosols. The NO2 levels, measured by MAX-DOAS and presented in Fig. 3, are used as an indicator for the pollution levels over the city. The mean diurnal course of NO2 differential SCDs for winter and summer months, as reported by Gratsea et al. (2016), range from 6 × 10¹⁶ to 9 × 10¹⁶ and 5 × 10¹⁶ to 11 × 1016 molec cm−2, respectively. Thus, enhanced pollution levels are observed during the morning hours in cases (ii) and (iv). The absence of clouds is established using in situ empirical meteorological observations from the monitoring station of the National Observatory of Athens at the centre of the city and is also verified by the MAX-DOAS-retrieved O4 slant columns throughout the day. The above-mentioned cases are henceforth referred to as cases (i), (ii), (iii) and (iv), respectively, and information about each case is summarised in Table 2.
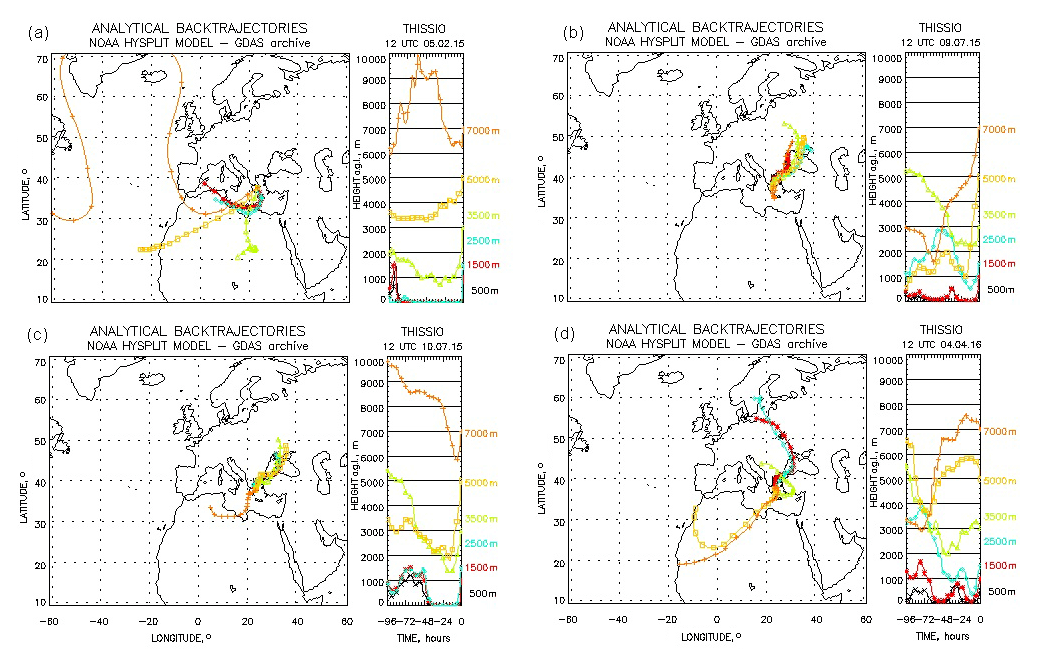
Figure 2Analytical back trajectories for Athens as derived from the NOAA HYSPLIT model for the case studies (i) 5 February 2015 (a), (ii) 9 July 2015 (b), (iii) 10 July 2015 (c) and (iv) 4 April 2016 (d).

Figure 3Tropospheric retrievals of diurnal SCD (elevation angle +1∘) from MAX-DOAS measurements for the four selected case studies. The blue and the black curves correspond to the remote (W) and the urban (S) viewing direction, respectively. In the internal panels the corresponding tropospheric VCD is also shown. Please consider the different scale used in case (i).
3.2 Aerosol extinction vertical profile retrievals
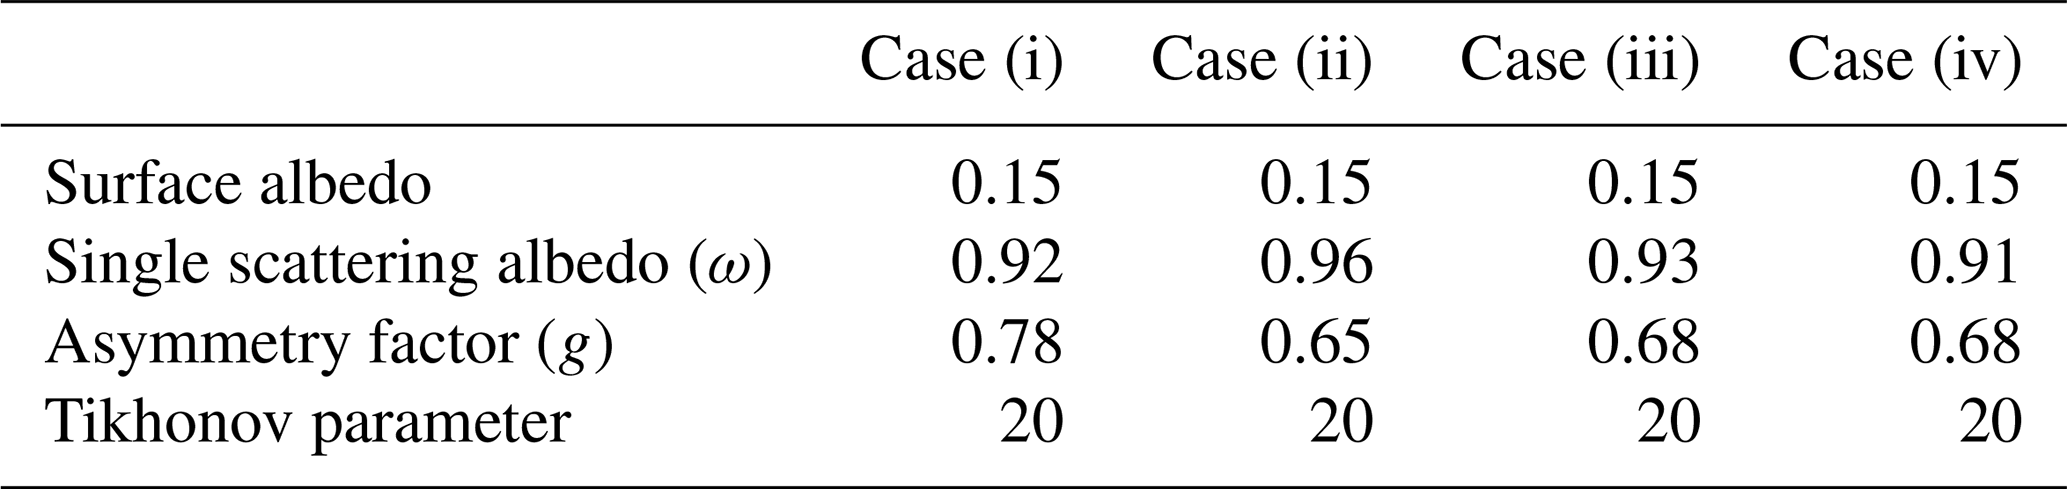
MAX-DOAS measurements and the BOREAS retrieval algorithm were used for the calculation of the diurnal aerosol extinction vertical distribution over the urban (S) area (Fig. 4) for the selected case studies and for altitudes 0.5–4 Single scattering albedo (SSA) and phase functions are not retrieved in BOREAS and have to be prescribed. Therefore AERONET measurements are used for specifying SSA (ω) and asymmetry factor (g) values. However, ω and g were not available in AERONET data for case (iv); therefore in this case the algorithm was run using the Henyey–Greenstein phase function with the monthly mean of SSA (ω = 0.91) and asymmetry factor (g = 0.68) from the following year, as derived from the AERONET data (Table 3). Specifically for this case, sensitivity tests with varying ω and g were carried out. It was found that the variability due to asymmetry factor is small and the impact of SSA negligible. A fixed surface albedo (α = 0.15), based on a previous study for Athens (Psiloglou et al., 2009), was used in all cases. Table 3 summarises the parameter settings used for the BOREAS retrieval.
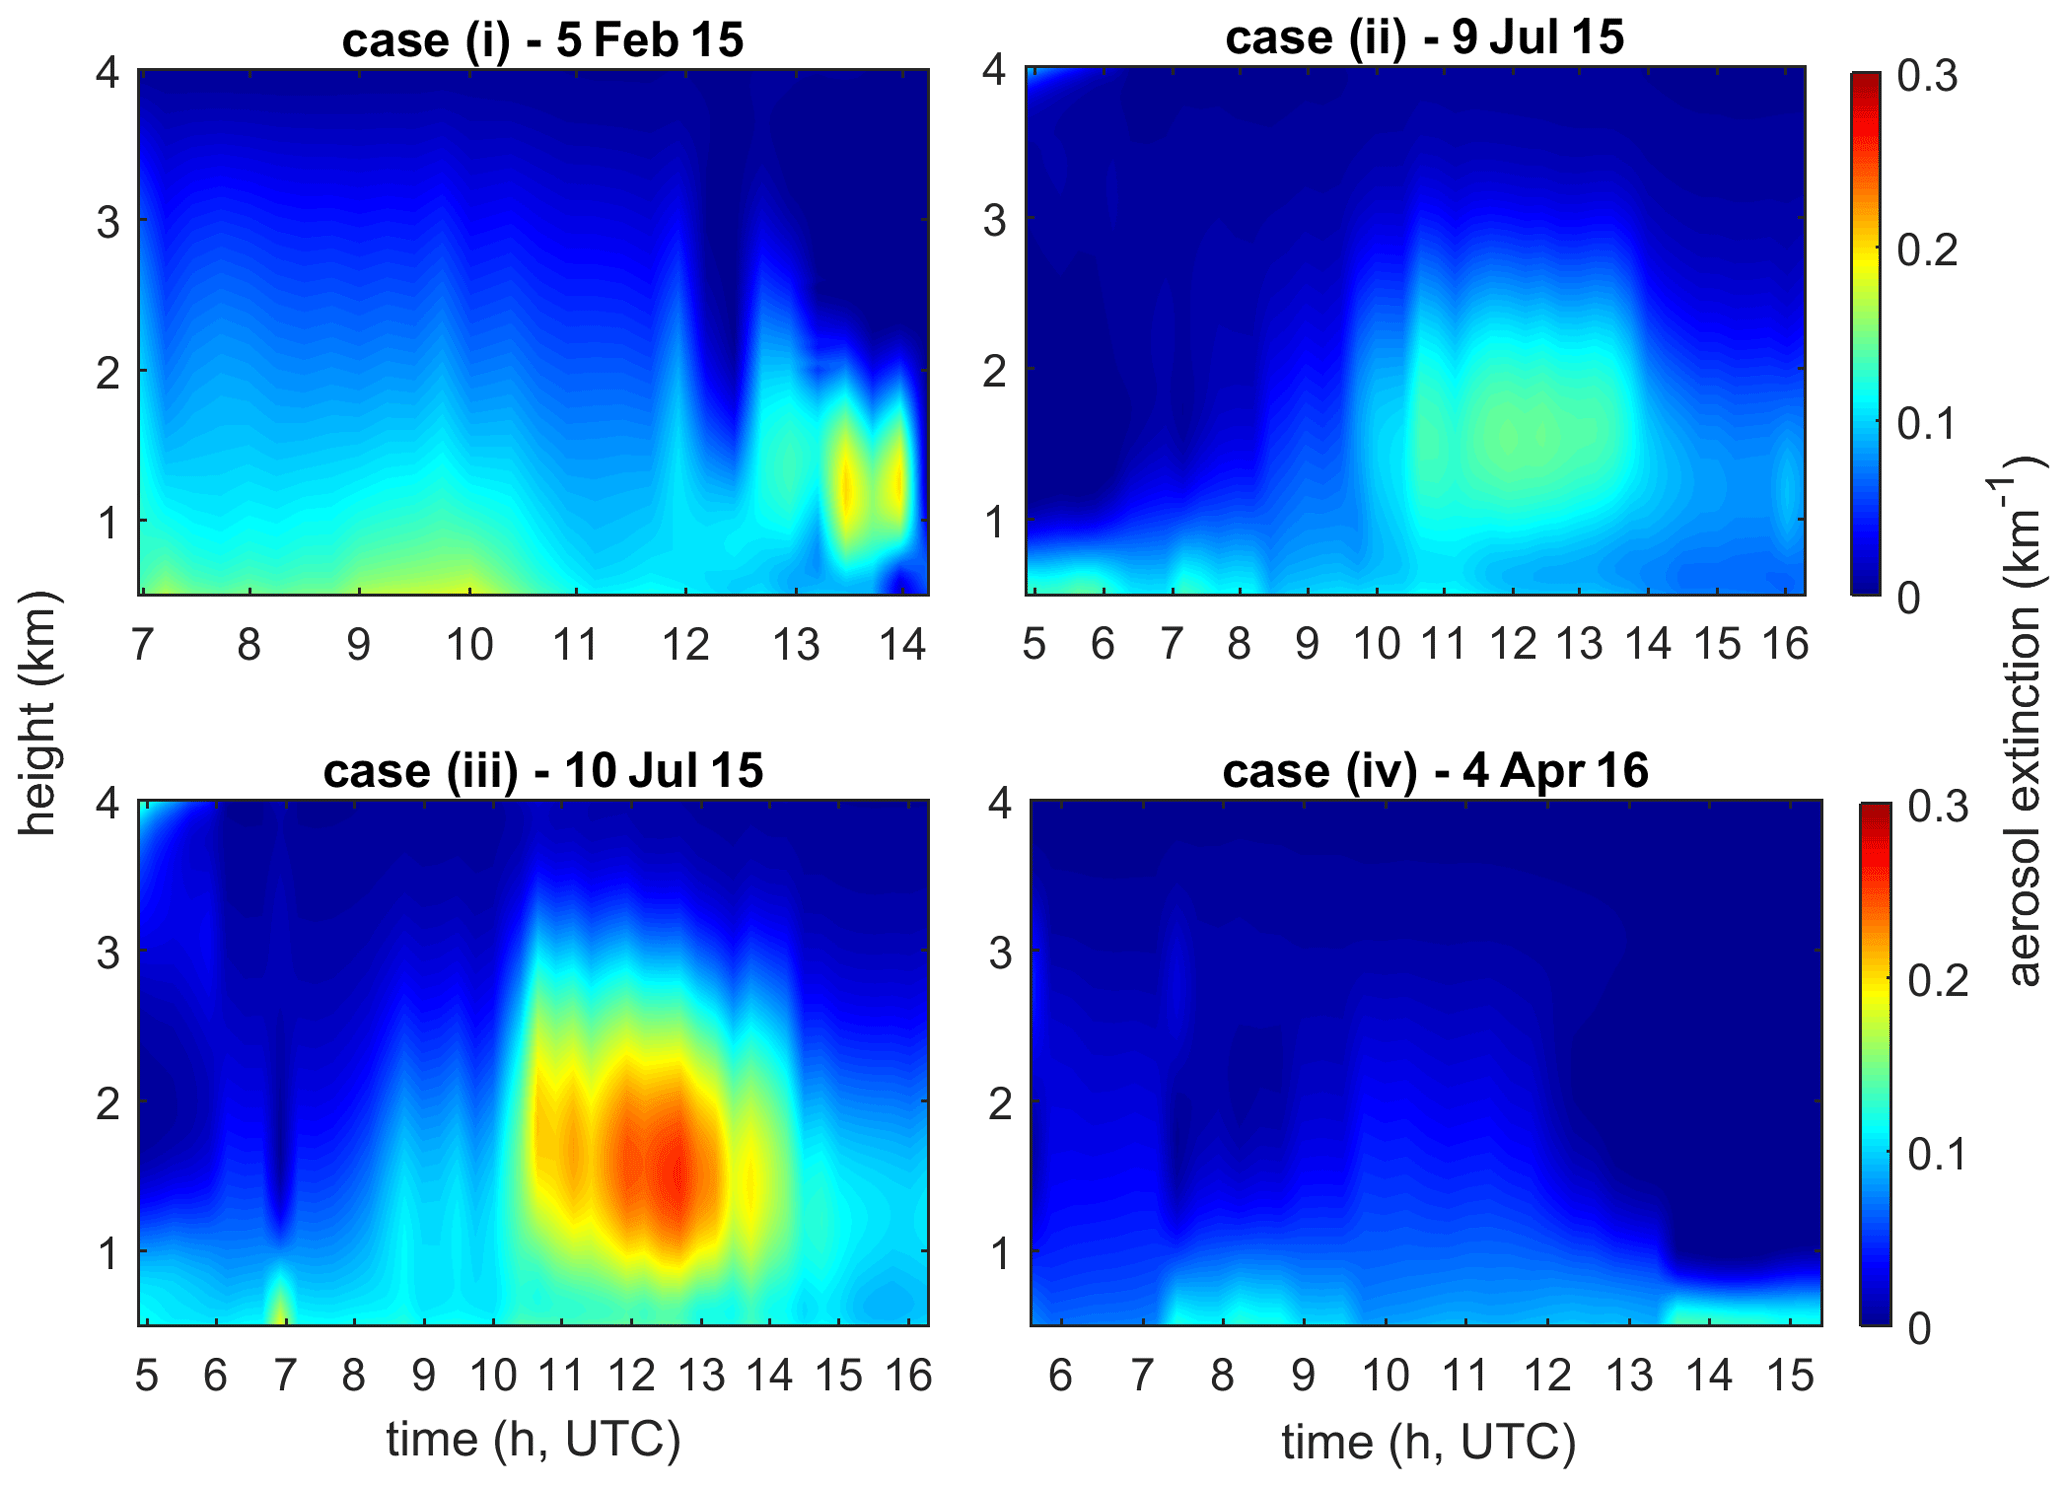
Figure 4MAX-DOAS-retrieved aerosol extinction vertical distributions (from instrument's height up to 4 ) for the four case studies over the urban area (S). The spatial and vertical resolution of the retrievals is 50 m and 15 min, respectively.
Table 3Settings used for the BOREAS retrieval. The mean daily value of each parameter (ω and g retrieved from AERONET) is mentioned for cases (i), (ii) and (iii). The mean monthly values of ω and g (provided from AERONET for April 2017) were used for case (iv) due to unavailable AERONET daily data around this date.
The results for case (i) reveal a significant variation in the aerosol distribution in the vertical direction. Although the maximum retrieved extinction values in this case reach almost 0.2 km−1 at 1.5 km height in the afternoon, persistent high values are displayed until around local noon (Fig. 4). The temporal variation in the vertical distribution can be attributed to changes in the prevailing wind speed and direction throughout the day; as recorded by the NOA's meteorological monitoring station at Thissio, the prevailing wind direction from 07:00 UTC until 10:00 UTC (LT = UTC+2 winter time and UTC+3 summer time) was from the south with speed from 1 to 4 m s−1, while easterly winds with speed reaching 10 m s−1 started blowing at 11:00 UTC, efficiently ventilating the Athens basin and removing the dust and atmospheric pollutants. As shown in previous works conducted in the area (e.g Fourtziou et al., 2017), wind speed below 3 m s−1 favours the accumulation of pollutants.
The two cases, (ii) and (iii), present an elevated aerosol layer extending up to 3 km between 10:00 and 14:00 UTC. Lidar retrievals also show an elevated extinction layer in both cases, as discussed in Sect. 3.3. However, the separation of the two layers could be an artefact which arises from the fact that the MAX-DOAS retrieval's response to a box-like distribution (e.g. a well-developed planetary boundary layer – PBL) leads to slight oscillations around this box due to the a priori smoothing. Both cases are related to weak prevailing winds (< 4 m s−1), which favour the development of a vertically extended aerosol layer. The higher aerosol load in case (iii) is also corroborated by sun-photometric measurements, which are presented and discussed in Sect. 3.4.
Low levels of aerosol extinction (less than 0.1 km−1) are present over the urban area throughout the whole day in case (iv). The highest values of the day (almost 0.14 km−1) are displayed up to 800 Given that the NO2 level, characteristic of anthropogenic pollution, is high during this day (Fig. 3), higher particle pollution levels would be expected.
3.3 MAX-DOAS aerosol extinction profile evaluation
The BOREAS-retrieved aerosol extinction profiles from the MAX-DOAS measurements at 477 nm, between 0.5 km (station's elevation) and 4 km height, are compared with the lidar aerosol extinction coefficient measurements at 532 nm, between 1 and 4 km height, for the selected case studies (Fig. 6). Representative morning and afternoon snapshots during each day have been chosen to be presented and discussed. The lack of morning profiles for some days is due to the absence of lidar data; thus, both morning (mor) and evening (aft) data are available only for cases (i) and (ii). The lidar profile presented in each figure is the result of the mean lidar signal, averaged between the starting and the ending time of the corresponding MAX-DOAS profiles. The uncertainty in the lidar extinction profiles increases substantially for altitudes below 1000 due to the loss of overlap between the telescope field of view and the laser beam (Wandinger and Ansmann, 2002; Kim et al., 2008; Papayiannis et al., 2008); hence the lidar data for altitudes below 1000 are not presented, and only measurements above 1000 are considered for the calculation of the correlation between the two instruments. Another point that has to be considered when comparing the results from the two instruments is that the lidar profiles are characterised by high vertical and temporal resolution, and degradation to the sensitivity of the MAX-DOAS profiles is necessary in order to have a meaningful comparison to the MAX-DOAS data. According to the method described by Rodgers and Connor (2003), the degraded lidar profile xf can be estimated by applying the equation
with xa being the a priori profile used in the algorithm calculations, x the initial lidar profile and AK the averaging kernel from the BOREAS retrieval. The averaging kernel (Fig. 5) denotes the sensitivity of the retrieved profile to the true atmospheric profile for each layer, and in fact it represents the smoothing of the true profile in the retrieval. The lidar profile, degraded to 50 m vertical resolution, represents the MAX-DOAS profile that would have been retrieved if the true extinction profile were x. Last but not least, the horizontal distance (13 km) between the two measurement sites and the different operation principles of the two instruments should be noted. The lidar system retrieves information from the air mass right above the measurement site, while MAX-DOAS probes air masses along the line of sight of the telescope pointing from the top of a hill towards the city centre; hence the retrieved aerosol profiles from the two instruments correspond to different air masses and are not expected to fully agree, especially when the aerosol pollution is not horizontally homogeneous over the Athens basin. Thus, the comparison is mainly focused on a qualitative basis.
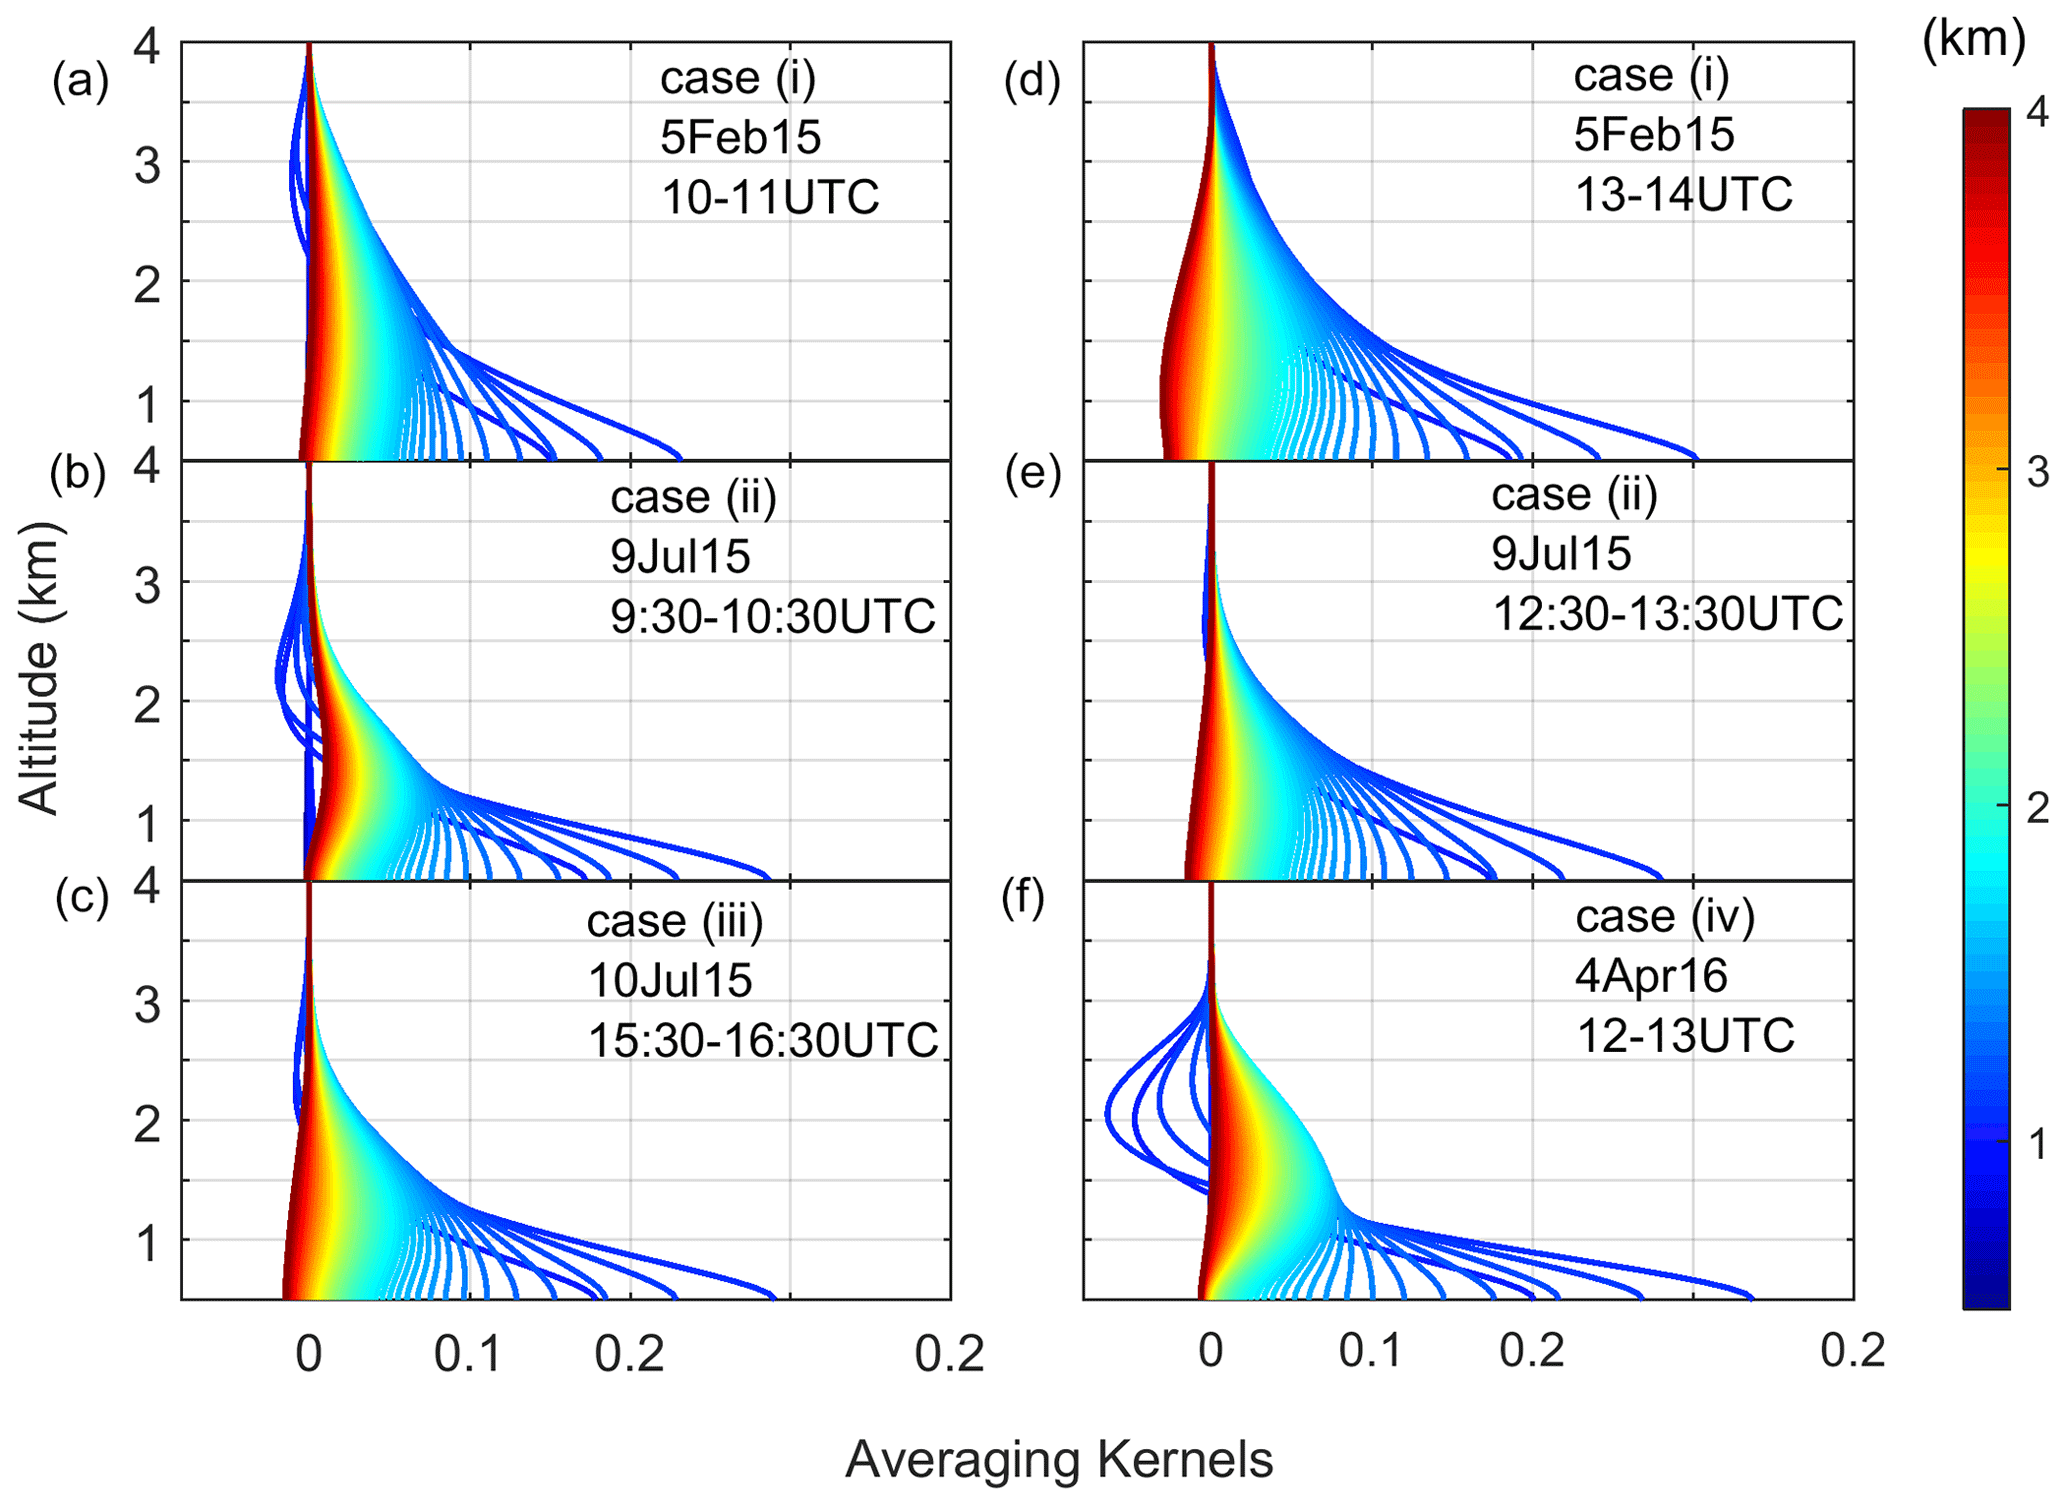
Figure 5Averaging kernels of the aerosol retrievals for the four case studies. For cases (i) and (ii), the left and right panels correspond to the morning and afternoon profiles, respectively. The colour bar represents the height of the atmospheric layers.
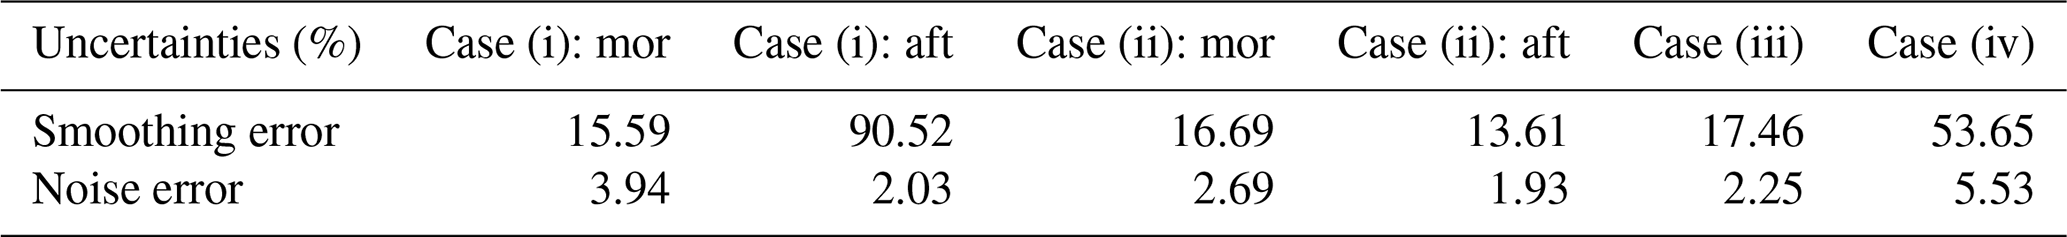
Each case is examined separately. Comparison information is given in the form of performance statistics – correlation coefficient (r), median lidar ∕ MAX-DOAS ratio, root mean square error (RMSE) and fractional gross error (FGE) – and is shown in Table 4. This set of statistics has been chosen as suitable to provide a detailed view of the algorithm performance; it has been proposed (Morris et al., 2005) that an FGE less than or equal to 0.75 is a criterion to evaluate good performance of an algorithm; therefore, any FGE > 0.75 is used as an indicator of a relatively poor performance in this study. In order to perform the statistical calculations we averaged the four MAX-DOAS profiles comprising each case. Thus, all performance statistics have been calculated using the temporally averaged MAX-DOAS profile for each case and the corresponding degraded lidar profile so that both profiles are of the same temporal and vertical resolution. In all cases, 61 data points are used for the derivation of the statistics. The average smoothing and noise errors for the MAX-DOAS retrievals are given for each case study separately in Table 5. In all cases, the noise error ranges between about 1 % and 5 %. In cases (i) (mor), (ii) and (iii), the smoothing error is about 15 %. The large smoothing errors in cases (i) (aft) and (iv) are due to the very small extinction values at higher altitudes.
Table 4Quantitative performance statistics of MAX-DOAS aerosol extinction calculations (BOREAS algorithm) compared to lidar measurements.
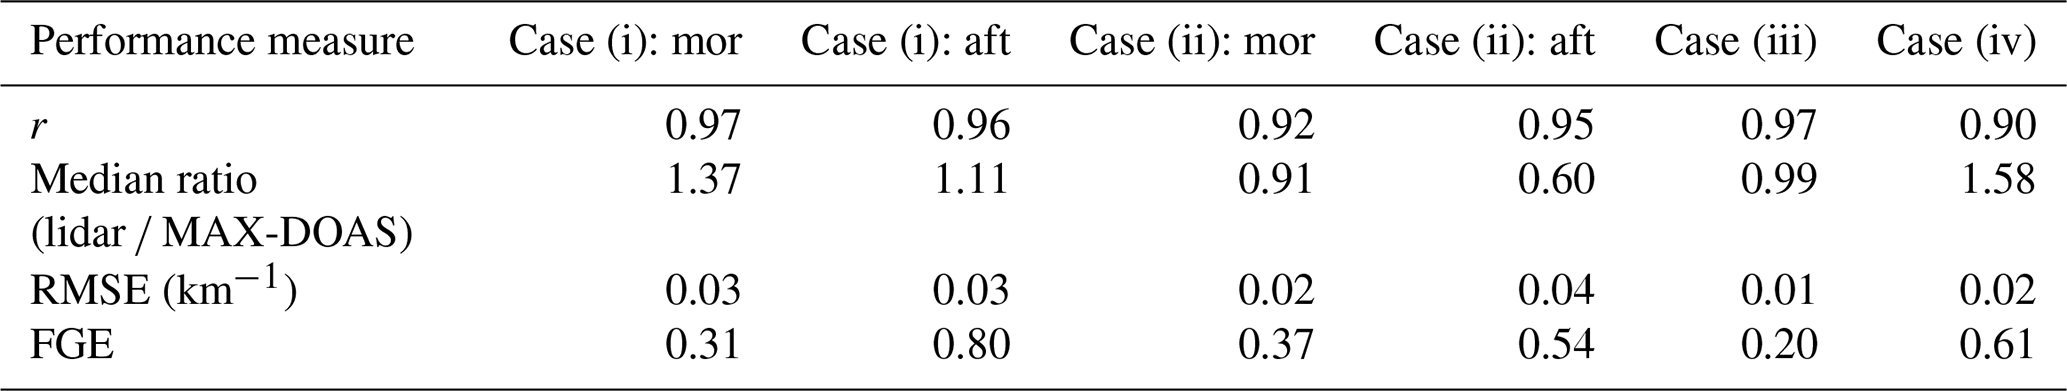
Table 5The MAX-DOAS average smoothing and noise errors (%) for each case study.
3.3.1 Case study (i) – 5 February 2015
In case (i), the two instruments seem to be in excellent agreement in terms of correlation, with a very high correlation coefficient (r>0.95). In the afternoon, a peak in aerosol extinction (∼ 0.15 km−1) between 1 and 1.5 km is captured by both instruments. The large discrepancy between the original and the degraded lidar profile is attributed to the fact that the AKs of the afternoon retrievals illustrate low sensitivity of the retrieved profile to the true atmospheric profile for altitudes up to 2.5 km (Fig. 5).
It should be mentioned that this is the only case in the present study where high aerosol load is found in the upper levels (free troposphere) in the original lidar profiles due to transboundary transport of aerosols at higher altitudes. The fact that, at these altitudes, the MAX-DOAS only agrees with the degraded lidar profiles (which means after including the AK information) suggests more significant errors in the a priori aerosol profiles and the reduced capacity of the MAX-DOAS to capture the characteristic inhomogeneity at higher atmospheric layers during aerosol transport episodes. Nevertheless, an overall satisfactory performance of the algorithm is indicated for the morning measurements by the FGE (0.31).
3.3.2 Case study (ii) – 9 July 2015
The retrieved MAX-DOAS profiles agree quite well with the degraded lidar profiles; they both show an aerosol layer extending up to about 2.5 km, and the correlation coefficient is very high (r≈0.95) during both morning and afternoon measurements. In the afternoon, however, the MAX-DOAS measurements result in higher extinction levels by almost 65 % compared to the degraded lidar profile. As shown in Fig. 6 (middle row panels), in this case MAX-DOAS tends to overestimate the lidar extinction levels mainly at higher altitudes, a fact that can be attributed to the smoothing effect of the retrieval procedure on the true profile; given that a MAX-DOAS profile algorithm cannot retrieve sharp edges, the underlying narrow high-altitude enhancement in the afternoon propagates through the retrieval into a smoother and broader aerosol peak. The FGE, ranging from 0.35 to 0.55, indicates a good performance of the algorithm.

Figure 6Comparison of retrieved MAX-DOAS aerosol extinction profiles at 477 nm (multicoloured curves), lidar aerosol extinction coefficient vertical profile at 532 nm (black curve) and the corresponding degraded lidar profile (dashed black curve) for the selected case studies. The lidar profile used in each case is the average profile retrieved between the starting and the ending time of the MAX-DOAS retrievals, and the light dashed black curves are the lidar-derived aerosol extinction uncertainty obtained by the lidar assumption of 50 ± 20 sr. The grey shaded area represents the corresponding MAX-DOAS uncertainty.
3.3.3 Case study (iii) – 10 July 2015
The two instruments seem to correlate very well (r=0.97). The MAX-DOAS coincides well with the aerosol extinction levels from the degraded lidar profile; the lidar-to-MAX-DOAS ratio is equal to 0.99. Nevertheless, when the original lidar profile is considered, a clear discrepancy in the extinction levels is present; the lidar peak value (0.16 km−1) is enhanced by a factor of 2. The discrepancy between the original and the degraded lidar profile results from the low sensitivity of the averaging kernels for heights up to about 2 km (Fig. 5, case iii), which plays significant role in the degradation (smoothing) of the lidar retrieval. The RMSE is small (0.01 km−1), and the low FGE (0.20) indicates good performance of the algorithm.
3.3.4 Case study (iv) – 4 April 2016
The profiles resulting from both instruments display an aerosol layer extending from the lower atmospheric layers up to 1.5 km height. The MAX-DOAS and degraded lidar profile shapes are very similar and highly correlated (r=0.90). However, the MAX-DOAS underestimates by almost 30 % the lidar aerosol extinction (median lidar ∕ MAX-DOAS ratio = 1.58). Although the correlation is high, and the RMSE is small (0.02), the FGE (0.61) indicates a moderate performance of the algorithm for the specific case. This FGE value, however, results from the high median ratio of the two profiles, which in turn results from the low extinction levels since the absolute difference between the two profiles is not that large.
Overall, the correlation between lidar and MAX-DOAS measurements is very good (0.90 < r < 0.97) in all cases, and a good agreement in the profile shape and altitude of the peak extinction level is also observed. The failure of the MAX-DOAS to capture clearly distinguished aerosol layers is attributed to the smoothing effect due to the presence of a priori constraints during the retrieval procedure. The RMSE ranges from 0.01 to 0.04 km−1 in all cases. A high FGE (0.80) has been calculated only in the case of measurements at small relative azimuthal angles between the viewing direction and the sun and in parallel presence of large particles. Due to the different operation principles of each instrument (active and passive remote sensing), the different wavelengths and the different air masses probed by each instrument, a full agreement in the derived profiles would not be expected. In particular, the lidar profiles represent the aerosols which are directly over the measurement site, whereas the MAX-DOAS profiles are representative of the atmosphere at a distance of several kilometres along the line of sight of the instrument. Another conclusion arising from these four cases is that the MAX-DOAS fails to detect part of the urban aerosol pollution when the pollution levels are low (e.g. case iv) and also fails to capture the inhomogeneity at higher altitudes in case of aerosol transport episodes.
3.4 AOD evaluation
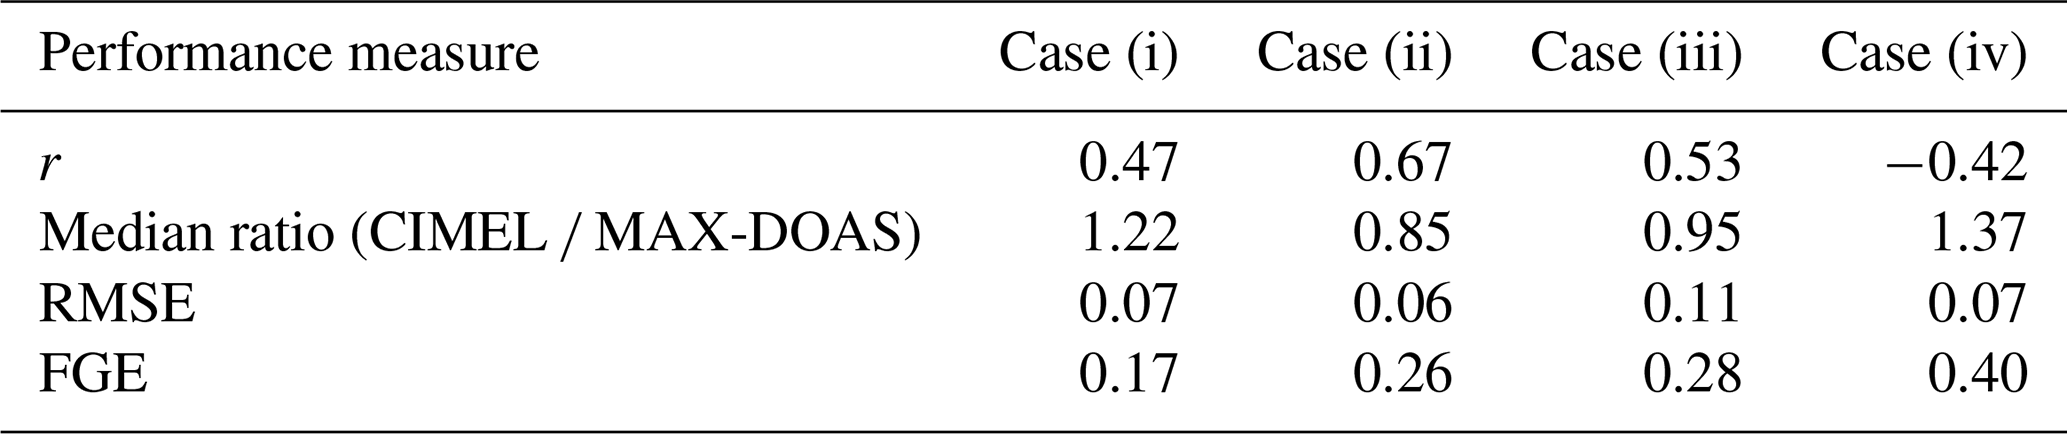
In the previous section, lidar measurements were used for the evaluation of the aerosol extinction profiles obtained from MAX-DOAS. However, a conclusive evaluation of MAX-DOAS aerosol optical depth (AOD) cannot be done strictly with lidar-derived AOD values mainly due to the lidar blind range (overlap height), resulting in AOD underestimation. Therefore, in this section, we focus on the comparison between the retrieved AOD from MAX-DOAS measurements at 477 nm and from CIMEL measurements at two wavelengths (440 and 500 nm) during the aforementioned case studies (Fig. 7). For the MAX-DOAS AOD calculation, the missing values in the extinction coefficient profiles below 500 m are set to a constant value (equal to the retrieved value at 500 m). This assumes that the atmosphere is well mixed below 500 m, which probably results in an underestimation of the calculated AOD in case of enhanced surface aerosol layer. When looking at the figures, one should consider that the CIMEL AOD uncertainty is estimated to be approximately 0.01 for wavelengths > 400 nm (Eck et al., 1999). The MAX-DOAS AOD uncertainties are shown in the figures. The Ångström exponent, derived from the CIMEL measurements (400–870 nm), is also taken into account as a qualitative indicator of aerosol particle size in order to investigate the origin of the aerosols (natural-dust or anthropogenic sources) and the performance of the MAX-DOAS retrievals for different aerosol types and sizes. An overview of the comparison statistics (described in Sect. 3.3), representative of the degree of agreement between MAX-DOAS and CIMEL measurements at 500 nm, is presented in Table 6. The calculations were made on an hourly basis to achieve uniform results regarding the air masses. Although this section is focused on the comparison with the AOD from CIMEL, the AOD from lidar measurements (calculated by integrating the aerosol extinction coefficient from ground up to the identified reference height of 4 ) is also presented indicatively. Nevertheless, as a complementary analysis, the comparison between lidar and MAX-DOAS AOD for the common altitude (1–4 km) – along with the corresponding uncertainties – is presented in Table 7.
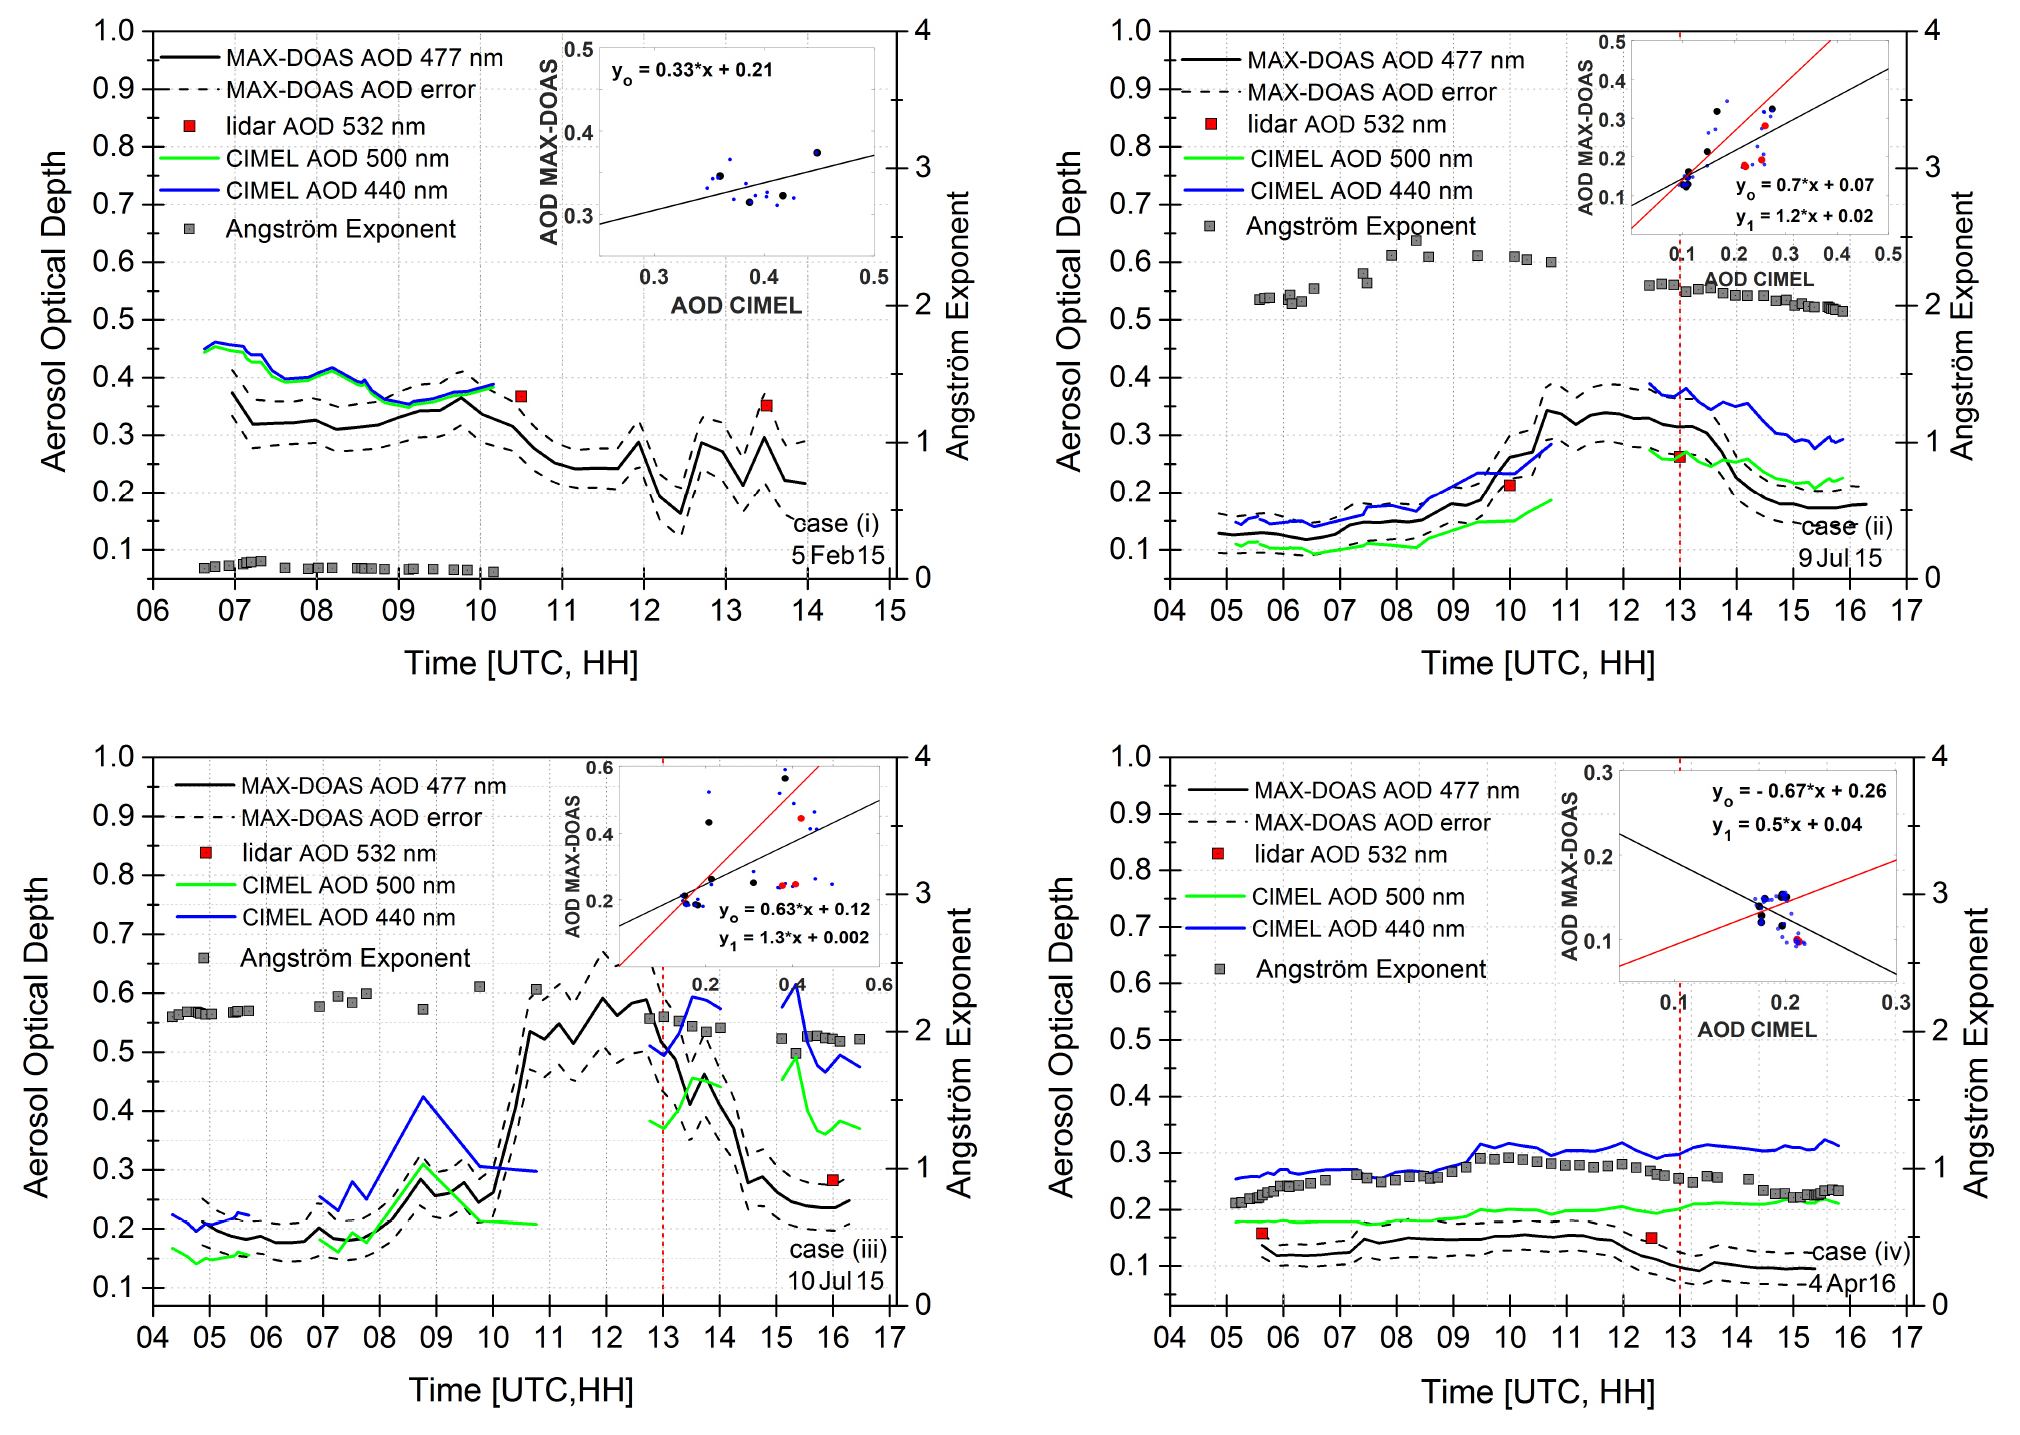
Figure 7AOD as derived from MAX-DOAS (black curve) and CIMEL at 440 nm and 500 nm (green and blue curve, respectively). The grey and the red square markers represent the Ångström exponent derived from 400 and 870 nm and the lidar-derived AOD, respectively. The dashed black curves represent the MAX-DOAS AOD uncertainties. The scatterplots between hourly AOD calculated from MAX-DOAS measurements and hourly AOD from CIMEL at 500 nm are shown in the internal panels; the red points correspond to measurements after 13:00 UTC. Accordingly, y0 is the linear-regression equation with all the data points included, and y1 is the linear-regression equation when the data points after 13:00 UTC have been excluded. The smaller blue points are the raw data points. The vertical dashed red line separates the measurement data before and after 13:00 UTC.
Table 6Quantitative performance statistics of MAX-DOAS AOD calculations (BOREAS algorithm) at 477 nm compared to CIMEL measurements at 500 nm.
3.4.1 Case study (i) – 5 February 2015
The very small Ångström exponent, ranging between 0.05 and 0.13 throughout the day, indicates the dominance of coarse particles in the aerosol distribution. Given the cloud-free sky conditions and the potential for dust transport found for this day by the NOAA HYSPLIT (Fig. 2), these particles are probably associated with the presence of dust in the atmosphere. The correlation between the two instruments is moderate (r=0.47), and the calculated AOD levels from the MAX-DOAS measurements underestimate by about 20 % the CIMEL measurements (median ratio CIMEL ∕ MAX-DOAS = 1.22). The daily averaged AOD values are 0.33 (± 0.02) and 0.39 (± 0.03) for MAX-DOAS and CIMEL, respectively, and are much higher than the climatological monthly average value (0.27 ± 0.03) for February in Athens, as reported in Gerasopoulos et al. (2011). The RMSE is 0.07; however the FGE, which is small (0.17), implies excellent performance of the algorithm. The moderate correlation results may arise from the fact that CIMEL performs direct sun measurements, whereas MAX-DOAS measurements – and the subsequent AOD retrieval – are performed at a fixed azimuthal direction. Thus, the CIMEL measurements are highly affected by variations in the temporal and spatial distribution of the aerosols. The AOD from the lidar measurements at 10:00 and 13:00 UTC (0.37 and 0.35, respectively) coincides well both with CIMEL and MAX-DOAS measurements.
3.4.2 Case study (ii) – 9 July 2015
In this case, the large values of the Ångström exponent (α≥2) are indicative of the presence of fine-mode aerosols that are associated with urban pollution (Westphal and Toon, 1991; Eck et al., 1999; Gerasopoulos et al., 2011). The considerable levels of NO2 measured during this day (Fig. 3) indicate the presence of anthropogenic pollution. The two instruments are again moderately correlated (r=0.67); however if the afternoon measurements – after 16:00 LT – are excluded, the correlation becomes very good (r=0.87). The median ratio (0.85) indicates that the MAX-DOAS overestimates the AOD levels measured by the CIMEL. However, the overestimation is more profound during the morning, while in the afternoon the MAX-DOAS slightly underestimates the measured AOD by about 20 %, a fact that can be attributed to inaccuracies in the radiative transfer calculation for the forward-scattering geometry. The daily averaged AOD values are 0.20 and 0.19 for MAX-DOAS and CIMEL, respectively. The small values of both the RMSE (0.07) and the FGE (0.26) are indicators of very good performance of the algorithm. The gaps in the CIMEL data in this case, as well as in case (iii), are probably due to saturation of the instrument. The lidar AOD in this case (0.21 at 10:00 UTC and 0.26 at 13:00 UTC) agrees well with the CIMEL measurements at 500 nm but is lower than the AOD from the MAX-DOAS; the difference is more considerable in the afternoon.
3.4.3 Case study (iii) – 10 July 2015
In the third case study, the measurements from the two instruments seem to be in better agreement during morning hours. Overall, the MAX-DOAS AOD levels coincide well with CIMEL (median CIMEL ∕ MAX-DOAS ratio is 0.95); however the underestimation due to light-scattering geometry after 13:00 UTC is about 35 %. The moderate results with respect to correlation (r=0.53) are due to the large discrepancy between the two instruments during the afternoon. If only the measurements until 13:00 UTC are considered, the correlation is considerably improved (r=0.75). Despite the non-satisfactory correlation, the calculated FGE (0.28) indicates a very good performance of the algorithm. The lidar-derived AOD in the afternoon is higher than the MAX-DOAS measurement. Unfortunately, no CIMEL or lidar data are available around noon in order to validate the aerosol plume captured by MAX-DOAS. It should be noted, though, that case studies (ii) and (iii) (both summer days in July) exhibit the same diurnal pattern: lower values in the morning, steadily increasing throughout the day and then slightly declining in the afternoon. A similar diurnal AOD pattern was found for summer in Athens by Gerasopoulos et al. (2011), and this pattern has been associated with local urban or industrial sources (Smirnov et al., 2002).
3.4.4 Case study (iv) – 4 April 2016
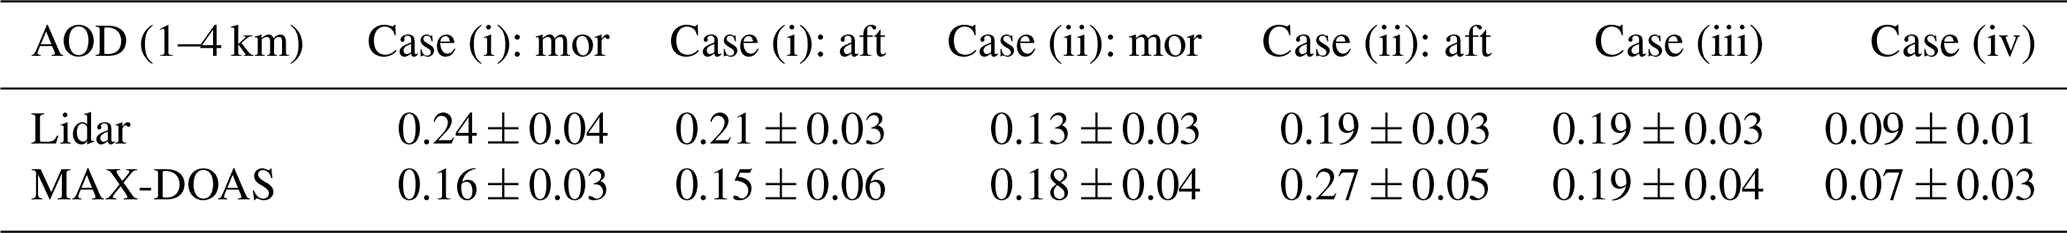
The Ångström exponent in this case (α≈1) indicates the presence of coarse aerosols (radii ≥ 0.5 µm) in the atmosphere (Westphal and Toon, 1991; Eck et al., 1999). The NOAA HYSPLIT back trajectories show the potential for African dust transport to Athens, however, at higher altitudes of up to 5 km. Nevertheless, despite the presence of coarse particles, the AOD levels are low; the daily averaged AOD values are 0.13 and 0.19 for MAX-DOAS and CIMEL, respectively. The MAX-DOAS underestimates the AOD with respect to CIMEL by about 25 % (and by 50 % if only the afternoon measurements are considered), the RMSE is 0.07, and the FGE is 0.40, yet it seems that the two measurement techniques are not correlated (r= −0.42). However, the comparison in terms of correlation results in better outputs if only the morning measurements are considered; in this case the correlation coefficient is 0.75. It seems that MAX-DOAS, in this case, fails to detect the accumulation of coarse particles. Nevertheless, the AOD lidar measurements agree very well with the MAX-DOAS measurements (Table 7).
Table 7MAX-DOAS (477 nm) and lidar (532 nm) AOD calculations for the atmospheric layer 1–4 km.
Overall, a systematic underestimation of the AOD, by 20 % to 35 %, by the MAX-DOAS is observed in the afternoon measurements, when the relative azimuthal angle between the MAX-DOAS viewing direction and the sun is small. Better agreement is achieved at large relative azimuthal angles in the morning. This finding has also been reported by Frieß et al. (2016) when comparing different retrieval algorithms with sun photometer measurements. Considering that (i) the sun photometer is located downtown (150 ), at lower altitude than the MAX-DOAS (527 ) and thus more sensitive to aerosols in the lower troposphere, and taking into account (ii) the absence of real measurements from MAX-DOAS for altitudes below 500 , an underestimation of the contribution of the urban pollution to the AOD retrieved by MAX-DOAS would be expected. Nevertheless, the MAX-DOAS seems to detect well the typical urban aerosols in the boundary layer; the mean AOD difference (CIMEL minus MAX-DOAS) of all the measurements is 0.03 with SD 0.08. Furthermore, CIMEL is a direct sun photometer, which means that in each measurement different air masses are detected, while the MAX-DOAS always points at the same direction; this operational difference is reflected in the non-satisfactory correlation. When fixed values of SSA and asymmetry factor (instead of AERONET data) are used by BOREAS, it seems that MAX-DOAS fails to detect accumulated coarse particles (e.g. case iv), leading to underestimation in case of small Ångström exponent values (< 1). Frieß et al. (2016) have also come to this conclusion during the CINDI-2 campaign. However, the underestimation could also be attributed to the high-altitude aerosol layer detected by the lidar (Fig. 6); the MAX-DOAS' sensitivity at higher altitudes is low, and the calculated AOD is limited up to 4 km, while the AOD from CIMEL refers to the total atmospheric column. In addition, the presence of aerosol layers above 4 km that could contribute to the AOD was examined by using the lidar signals, and no significant aerosol load was observed above this height. It should also be noted that the standard AERONET version 2 algorithm uses an NO2 climatology with a spatial resolution much coarser than the area of the city of Athens (Giles et al., 2019); hence in certain cases the difference between the MAX-DOAS and the higher CIMEL AOD levels at 440 nm could result from additional NO2 content in the atmosphere, which is the case of highly polluted days. The lidar-derived AOD levels coincide well with the MAX-DOAS measurements.
An assessment of the retrieval of aerosol extinction profiles and AOD from MAX-DOAS measurements is presented for the first time for the urban environment of Athens. The profiling results are compared to lidar extinction profiles and to AODs obtained from sun-photometric measurements. The intercomparison results are very promising, showing that the MAX-DOAS measurements provide a good estimation of the aerosol vertical profile over Athens. Although this intercomparison is of great importance for the validation of the MAX-DOAS retrieval, the different operation, characteristics and measurement principles of each instrument, in addition to some comparison restrictions, have to be considered.
Regarding the spatial characteristics, (i) the measurements with the MAX-DOAS technique represent an area that includes the AERONET and the lidar locations, but it is not limited to them. Regarding the vertical aerosol information, (ii) the MAX-DOAS retrievals are representative of 500–4000 , while the lidar profiles are valid for altitudes higher than 1000 m above the station, and finally (iii) the AOD AERONET measurements describe the columnar aerosol properties representative of an area ranging from a radius of a few kilometres up to 10 km above the Athens area, depending on solar elevation. Also, (iv) the sun photometer AOD observations probe the extinction in the full atmospheric column, while MAX-DOAS retrievals are sensitive only to the lowest kilometres, leading to differences in the presence of aerosol layers at altitudes above 4 km. Nevertheless, despite the comparison restrictions and the differences in the three instruments, the comparison of the retrieved profiles and the AODs shows that the MAX-DOAS measurements bode well for the future of aerosol measurements, and they are able to provide a good estimation of the aerosol vertical distribution over Athens.
The vertical profiles retrieved by the BOREAS profiling algorithm applied to the MAX-DOAS measurements are qualitatively in good agreement with the lidar profiles smoothed with the MAX-DOAS averaging kernels; there is good agreement in aerosol layer shape and aerosol extinction levels, except in cases of inhomogeneity at higher altitudes, characteristic of aerosol dust transport episodes. Very good correlation (r>0.90) was found in all cases. A satisfactory fractional gross error (0.20 < FGE < 0.54) has been calculated in all cases with fine aerosol particles (urban pollution), indicating a good performance of the BOREAS profiling algorithm in these cases. In some cases, the observed underestimation of the aerosol extinction (by 20 % to 35 %) by the MAX-DOAS at small relative azimuth angles can be attributed to the geometry of Mie scattering in relation to the location and viewing geometry of MAX-DOAS, resulting in MAX-DOAS' failure to detect part of the urban aerosol pollution. Overall, the agreement between the two instruments is encouraging, especially when considering the different nature of each technique and the different instrument locations, suggesting that the MAX-DOAS can accurately enough represent the aerosol vertical distribution.
The MAX-DOAS-retrieved AODs show satisfactory agreement with the sun-photometric measurements in terms of AOD levels. The MAX-DOAS underestimates the AOD in the presence of coarse particles; CIMEL ∕ MAX-DOAS ratio > 1 coincides with Ångström exponent values < 1. A systematic underestimation by MAX-DOAS is observed in the afternoon measurements due to MAX-DOAS' viewing geometry. Overall, the MAX-DOAS can be considered to be an effective means for measuring the aerosol levels in Athens; the average AOD difference in all measurements between the two instruments is 0.03. It is important to note that in Athens, a highly populated and polluted area, horizontal gradients, especially in anthropogenic aerosols, are very likely to occur, resulting in different air masses detected by each instrument and subsequently in discrepancies between MAX-DOAS and CIMEL measurements.
This intercomparison is of great importance for the validation of the MAX-DOAS retrieval. Despite the already-mentioned limitations due to different operation, characteristics and measurement principles of each instrument, this work demonstrates that the MAX-DOAS measurements in Athens and the BOREAS algorithm can provide a good estimation of the aerosol vertical structure of the urban atmosphere on a continuous and long-term basis, offering a reliable data set for scientific studies. There is certainly more work to be conducted in future studies in order to understand the sensitivity of the MAX-DOAS aerosol measurements based on different aspects of urban-pollution evolution and long-range-transported aerosols.
All data sets used and produced for the purposes of this work are freely available and can be requested from the corresponding author.
MG, PK and AR conceived the presented idea. MG performed the analysis and prepared the manuscript. TB developed the profile retrieval algorithm and provided guidance to MG on the algorithm calculations and parameterisation. AR provided guidance to MG on MAX-DOAS data retrieval and profile calculations. MG designed the figures with support from PK and TB. AR and SK advised MG on the results interpretation. PK, AP and MM provided the lidar data. VA provided the sun photometer measurements. AT made comments on the comparison between the sun photometer and MAX-DOAS. AR, EG, SK, NM and MV provided critical feedback. All authors provided comments that helped shape the manuscript.
Andreas Richter and Vassilis Amiridis are members of the editorial board of the journal.
We acknowledge support of this work by the project “PANhellenic infrastructure for Atmospheric Composition and climatE change” (MIS 5021516), which is implemented under the action “Reinforcement of the Research and Innovation Infrastructure”.
This research has been supported by the operational programme “Competitiveness, Entrepreneurship and Innovation” (grant no. NSRF 2014-2020).
This paper was edited by Omar Torres and reviewed by two anonymous referees.
Ackermann, J.: The extinction-to-backscatter ratio of tropospheric aerosol: A numerical study, J. Atmos. Ocean. Tech., 15, 1043–1050, 1998.
Amiridis, V., Balis, D. S., Kazadzis, S., Bais, A., Giannakaki, E., Papayannis, A., and Zerefos, C.: Four-year aerosol observations with a Raman lidar at Thessaloniki, Greece, in the framework of European Aerosol Research Lidar Network (EARLINET), J. Geophys. Res., 110, D21203, https://doi.org/10.1029/2005JD006190, 2005.
Amiridis, V., Balis, D., Giannakaki, E., Kazadzis, S., Arola, A., and Gerasopoulos, E.: Characterization of the aerosol type using simultaneous measurements of the lidar ratio and estimations of the single scattering albedo, Atmos. Res., 101, 46–53, 2011.
Amiridis, V., Zerefos, C., Kazadzis, S., Gerasopoulos, E., Eleftheratos, K., Vrekoussis, M., Stohl, A., Mamouri, R. E., Kokkalis, P., Papayannis, A., and Eleftheriadis, K.: Impact of the 2009 Attica wild fires on the air quality in urban Athens, Atmos. Environ., 46, 536–544, 2012.
Andreae, M. O. and Crutzen, P. J.: Atmospheric aerosols: Biogeochemical sources and their role in atmospheric chemistry, Science, 276, 1052–1058, 1997.
Bogumil, K., Orphal, J., and Burrows, J. P.: Temperature dependent absorption cross sections of O3, NO2, and other atmospheric trace gases measured with the SCIAMACHY spectrometer, Proc. ERS-Envisat Symposium Gothenburg, 16–20 October 2000, Abstract ID 99, 2000.
Bösch, T., Rozanov, V., Richter, A., Peters, E., Rozanov, A., Wittrock, F., Merlaud, A., Lampel, J., Schmitt, S., de Haij, M., Berkhout, S., Henzing, B., Apituley, A., den Hoed, M., Vonk, J., Tiefengraber, M., Müller, M., and Burrows, J. P.: BOREAS – a new MAX-DOAS profile retrieval algorithm for aerosols and trace gases, Atmos. Meas. Tech., 11, 6833–6859, https://doi.org/10.5194/amt-11-6833-2018, 2018.
Chubarova, N. Y., Sviridenkov, M. A., Smirnov, A., and Holben, B. N.: Assessments of urban aerosol pollution in Moscow and its radiative effects, Atmos. Meas. Tech., 4, 367–378, https://doi.org/10.5194/amt-4-367-2011, 2011.
Clémer, K., Van Roozendael, M., Fayt, C., Hendrick, F., Hermans, C., Pinardi, G., Spurr, R., Wang, P., and De Mazière, M.: Multiple wavelength retrieval of tropospheric aerosol optical properties from MAXDOAS measurements in Beijing, Atmos. Meas. Tech., 3, 863–878, https://doi.org/10.5194/amt-3-863-2010, 2010.
D'Amico, G., Amodeo, A., Mattis, I., Freudenthaler, V., and Pappalardo, G.: EARLINET Single Calculus Chain – technical – Part 1: Pre-processing of raw lidar data, Atmos. Meas. Tech., 9, 491–507, https://doi.org/10.5194/amt-9-491-2016, 2016.
DeCarlo, P. F., Dunlea, E. J., Kimmel, J. R., Aiken, A. C., Sueper, D., Crounse, J., Wennberg, P. O., Emmons, L., Shinozuka, Y., Clarke, A., Zhou, J., Tomlinson, J., Collins, D. R., Knapp, D., Weinheimer, A. J., Montzka, D. D., Campos, T., and Jimenez, J. L.: Fast airborne aerosol size and chemistry measurements above Mexico City and Central Mexico during the MILAGRO campaign, Atmos. Chem. Phys., 8, 4027–4048, https://doi.org/10.5194/acp-8-4027-2008, 2008.
Draxler, R. R. and Hess, G. D.: Description of the HYSPLIT_4 modeling system, NOAA Tech. Memo ERL ARL-224, 24 pp., NOAA, Silver Spring, Md, 1997.
Dubovik, O., Holben, B., Eck, T. F., Smirnov, A., Kaufman, Y. J., King, M. D., Tantré, D., and Slutsker, I.: Variability of absorption and optical properties of key aerosol types observed in worldwide locations, J. Atmos. Sci., 59, 590–608, https://doi.org/10.1175/1520-0469(2002)059<0590:VOAAOP>2.0.CO;2, 2002.
Dubovik, O., Sinyuk, A., Lapyonok, T., Holben, B. N., Mishchenko, M., Yang, P., Eck, T. F., Volten, H., Muñoz, O., Veihelmann, B., van der Zande, W. J., Leon, J.-F., Sorokin, M., and Slutsker, I.: Application of spheroid models to account for aerosol particle nonsphericity in remote sensing of desert dust, J. Geophys. Res., 111, D11208, https://doi.org/10.1029/2005JD006619, 2006.
Eck, T. F., Holben, B. N., Reid, J. S., Dubovik, O., Smirnov, A., O'Neill, N. T., Slutsker, I., and Kinne, S.: Wavelength dependence of the optical depth of biomass burning, urban, and desert dust aerosols, J. Geophys. Res., 104, 31333–31349, https://doi.org/10.1029/1999JD900923, 1999.
Fourtziou, L., Liakakou, E., Stavroulas, I., Theodosi, C., Zarbas, P., Psiloglou, B., Sciare, J., Maggos, T., Bairachtari, K., Bougiatioti, A., Gerasopoulos, E., Sarda, R., Bonnaire, N., and Mihalopoulos, N.: Multi-tracer approach to characterize domestic wood burning in Athens (Greece) during wintertime, Atmos. Environ., 148, 89–101, https://doi.org/10.1016/j.atmosenv.2016.10.011, 2017.
Frieß, U., Klein Baltink, H., Beirle, S., Clémer, K., Hendrick, F., Henzing, B., Irie, H., de Leeuw, G., Li, A., Moerman, M. M., van Roozendael, M., Shaiganfar, R., Wagner, T., Wang, Y., Xie, P., Yilmaz, S., and Zieger, P.: Intercomparison of aerosol extinction profiles retrieved from MAX-DOAS measurements, Atmos. Meas. Tech., 9, 3205–3222, https://doi.org/10.5194/amt-9-3205-2016, 2016.
Gerasopoulos, E., Kokkalis, P., Amiridis, V., Liakakou, E., Perez, C., Haustein, K., Eleftheratos, K., Andreae, M. O., Andreae, T. W., and Zerefos, C. S.: Dust specific extinction cross-sections over the Eastern Mediterranean using the BSC-DREAM model and sun photometer data: the case of urban environments, Ann. Geophys., 27, 2903–2912, https://doi.org/10.5194/angeo-27-2903-2009, 2009.
Gerasopoulos, E., Amiridis, V., Kazadzis, S., Kokkalis, P., Eleftheratos, K., Andreae, M. O., Andreae, T. W., El-Askary, H., and Zerefos, C. S.: Three-year ground based measurements of aerosol optical depth over the Eastern Mediterranean: the urban environment of Athens, Atmos. Chem. Phys., 11, 2145–2159, https://doi.org/10.5194/acp-11-2145-2011, 2011.
Giannakaki, E., Pfüller, A., Korhonen, K., Mielonen, T., Laakso, L., Vakkari, V., Baars, H., Engelmann, R., Beukes, J. P., Van Zyl, P. G., Josipovic, M., Tiitta, P., Chiloane, K., Piketh, S., Lihavainen, H., Lehtinen, K. E. J., and Komppula, M.: One year of Raman lidar observations of free-tropospheric aerosol layers over South Africa, Atmos. Chem. Phys., 15, 5429–5442, https://doi.org/10.5194/acp-15-5429-2015, 2015.
Giles, D. M., Sinyuk, A., Sorokin, M. G., Schafer, J. S., Smirnov, A., Slutsker, I., Eck, T. F., Holben, B. N., Lewis, J. R., Campbell, J. R., Welton, E. J., Korkin, S. V., and Lyapustin, A. I.: Advancements in the Aerosol Robotic Network (AERONET) Version 3 database – automated near-real-time quality control algorithm with improved cloud screening for Sun photometer aerosol optical depth (AOD) measurements, Atmos. Meas. Tech., 12, 169–209, https://doi.org/10.5194/amt-12-169-2019, 2019.
Gratsea, M., Vrekoussis, M., Richter, A., Wittrock, F., Schönhardt, A., Burrows, J., Kazadzis, S., Mihalopoulos, N., and Gerasopoulos E.: Slant column MAX-DOAS measurements of nitrogen dioxide, formaldehyde, glyoxal and oxygen dimer in the urban environment of Athens, Atmos. Environ., 135, 118–131, https://doi.org/10.1016/j.atmosenv.2016.03.048, 2016.
Gratsea, M., Liakakou, E., Mihalopoulos, N., Adamopoulos, A., Tsilibari, E., and Gerasopoulos, E.: The combined effect of reduced fossil fuel consumption and increasing biomass combustion on Athens' air quality, as inferred from long term CO measurements, Sci. Total Environ., 592, 115–123, https://doi.org/10.1016/j.scitotenv.2017.03.045, 2017.
Groß, S., Tesche, M., Freudenthaler, V., Toledano, C., Wiegner, M., Ansmann, A., Althausen, D., and Seefeldner, M.: Characterization of Saharan dust, marine aerosols and mixtures of biomass-burning aerosols and dust by means of multi-wavelength depolarization and Raman lidar measurements during SAMUM 2, Tellus B, 63, 706–724, https://doi.org/10.3402/tellusb.v63i4.16369, 2011.
Groß, S., Esselborn, M., Weinzierl, B., Wirth, M., Fix, A., and Petzold, A.: Aerosol classification by airborne high spectral resolution lidar observations, Atmos. Chem. Phys., 13, 2487–2505, https://doi.org/10.5194/acp-13-2487-2013, 2013.
Heckel, A., Richter, A., Tarsu, T., Wittrock, F., Hak, C., Pundt, I., Junkermann, W., and Burrows, J. P.: MAX-DOAS measurements of formaldehyde in the Po-Valley, Atmos. Chem. Phys., 5, 909–918, https://doi.org/10.5194/acp-5-909-2005, 2005.
Hermans, C., Vandaele, A. C., Fally, S., Carleer, M., Colin, R., Coquart, B., Jenouvrier, A., and Merienne, M. F.: Absorption cross-section of the collision-induced bands of oxygen from the UV to the NIR, in: Proceedings of the NATO Advanced Research Workshop, Weakly Interacting Molecular Pairs: Unconventional Absorbers of Radiation in the Atmoshere, Fontevraud, France, 24 April–2 May 2002, edited by: Camy-Peyret, C. and Vigasin, A. A., Kluwer Academic Publishers, Boston, NATO Science Series IV Earth and Envirnmental Sciences, 27, 193–202, 2003.
Holben, B. N., Eck, T. F., Slutsker, I., Tanré, D., Buis, J. P., Setzer, A., Vermote, E., Reagan, J. A., Kaufman, Y. J., Nakajima, T., Lavenu, F., Jankowiak, I., and Smirnov, A.: AERONET – A Federated Instrument Network and Data Archive for Aerosol Characterization, Remote Sens. Environ., 66, 1–16, https://doi.org/10.1016/S0034-4257(98)00031-5, 1998.
Intergovernmental Panel on Climate Change (IPCC): Climate Change 2001: The Science of Climate Change, Technical Summary of the Working Group I Report, Cambridge Univ. Press, New York, 2001.
IPCC: Climate Change 2007: The Phsycal Science Basis. Contribution of working group I to the Fourth Assesment Reportof the Intergovernmental Panel on Climate Change, edited by: Solomon, S., Qin, D., Manning, M., Chen, Z., Marquis, M., Averyt, K. B., Tignor, M., and Miller, H. L., Cambridge University Press, Cambridge, UK and New York, NY, USA, 2007.
Irie, H., Kanaya, Y., Akimoto, H., Iwabuchi, H., Shimizu, A., and Aoki, K.: First retrieval of tropospheric aerosol profiles using MAX-DOAS and comparison with lidar and sky radiometer measurements, Atmos. Chem. Phys., 8, 341–350, https://doi.org/10.5194/acp-8-341-2008, 2008.
Kanakidou, M., Mihalopoulos, N., Kalivitis, N., Tsigaridis, K., Kouvarakis, G., Koulouri, E., Gerasopoulos, E., Vrekoussis, M., and Myriokefalitakis, S.: Natural contributions to particulate matter levels over Europe – the experience from Greece, in: CEST2007, Cos, Greece, 5–7 September 2007, A-585–592, 2007.
Kassomenos, P., Kotroni, V., and Kallos, G.: Analysis of climatological and air quality observations from greater Athens area, Atmos. Environ., 29, 3671–3688, 1995.
Kim, S.-W., Berthier, S., Raut, J.-C., Chazette, P., Dulac, F., and Yoon, S.-C.: Validation of aerosol and cloud layer structures from the space-borne lidar CALIOP using a ground-based lidar in Seoul, Korea, Atmos. Chem. Phys., 8, 3705–3720, https://doi.org/10.5194/acp-8-3705-2008, 2008.
Klett, J. D.: Stable analytical inversion solution for processing lidar returns, Appl. Optics, 20, 211–220, https://doi.org/10.1364/AO.20.000211, 1981.
Kokkalis, P.: Using paraxial approximation to describe the optical setup of a typical EARLINET lidar system, Atmos. Meas. Tech., 10, 3103–3115, https://doi.org/10.5194/amt-10-3103-2017, 2017.
Kokkalis, P., Papayannis, A., Mamouri, R. E., Tsaknakis, G., and Amiridis, V.: The EOLE lidar system of the National Technical University of Athens, in: Reviewed and revised papers presented at the 26th International Laser Radar Conference, Porto Heli, Greece, 25–29 June 2012.
Kokkalis, P., Alexiou, D., Papayannis, A., Rocadenbosch, F., Soupiona, O., Raptis, P. I., Mylonaki, M., Tzanis, C. G., and Christodoulakis, J.: Application and Testing of the Extended-Kalman-Filtering Technique for Determining the Planetary Boundary-Layer Height over Athens, Greece, Bound.-Lay. Meteorol., 176, 125–147, https://doi.org/10.1007/s10546-020-00514-z, 2020.
Kosmopoulos, P. G., Kazadzis, S., Taylor, M., Athanasopoulou, E., Speyer, O., Raptis, P. I., Marinou, E., Proestakis, E., Solomos, S., Gerasopoulos, E., Amiridis, V., Bais, A., and Kontoes, C.: Dust impact on surface solar irradiance assessed with model simulations, satellite observations and ground-based measurements, Atmos. Meas. Tech., 10, 2435–2453, https://doi.org/10.5194/amt-10-2435-2017, 2017.
Lee, H., Irie, H., Kim, Y., Noh, Y., Lee, C., Kim, Y., and Chun, K.: Retrieval of Aerosol Extinction in the Lower Troposphere Based on UV MAX-DOAS Measurements, Aerosol. Sci. Tech., 43, 502–509, https://doi.org/10.1080/02786820902769691, 2009.
Ma, J. Z., Beirle, S., Jin, J. L., Shaiganfar, R., Yan, P., and Wagner, T.: Tropospheric NO2 vertical column densities over Beijing: results of the first three years of ground-based MAX-DOAS measurements (2008–2011) and satellite validation, Atmos. Chem. Phys., 13, 1547–1567, https://doi.org/10.5194/acp-13-1547-2013, 2013.
Markakis, K., Poupkou, A., Melas, D., Tzoumaka, P., and Petrakakis, M.: A computational approach based on GIS technology for the development of an athropogenis emission inventory for air quality applications in Greece, Water Air Soil Poll., 207, 157–180, https://doi.org/10.1007/s11270-009-0126-5, 2010.
Matthias, V., Balis, D., Bösenberg, J., Eixmann, R., Iarlori, M., Komguem, L., Mattis, I., Papayannis, A., Pappalardo, G., Perrone, M. R., and Wang, X.: Vertical aerosol distribution over Europe: Statistical analysis of Raman lidar data from 10 European Aerosol Research Lidar Network (EARLINET) stations, J. Geophys. Res., 109, D18201, https://doi.org/10.1029/2004JD004638, 2004.
Mattis, I., Ansmann, A., Müller, D., Wandinger, U., and Althausen, D.: Multiyear aerosol observations with dual-wavelength Raman lidar in the framework of EARLINET: MULTIYEAR AEROSOL PROFILING IN EUROPE, J. Geophys. Res.-Atmos., 109, D13203, https://doi.org/10.1029/2004JD004600, 2004.
Mattis, I., D'Amico, G., Baars, H., Amodeo, A., Madonna, F., and Iarlori, M.: EARLINET Single Calculus Chain – technical – Part 2: Calculation of optical products, Atmos. Meas. Tech., 9, 3009–3029, https://doi.org/10.5194/amt-9-3009-2016, 2016.
Mona, L., Müller, D., Omar, A., Papayannis, A., Pappalardo, G., Sugimoto, N., and Vaughan, M.: Lidar measurements for desert dust characterization: A Review, Adv. Meteorol., 2012, 356265, https://doi.org/10.1155/2012/356265, 2012.
Morris, R., Koo, B., McNally, D., Tesche, T. W., and Tonnesen, G.: Application of Multiple Models to Simulation Fine Particulate in the Southeastern U.S., Presented at the National Regional Planning Organizations Modeling Meeting, Denver, CO, 2005.
Müller, D., Ansmann, A., Mattis, I., Tesche, M., Wandinger, U., Althausen, D., and Pisani, G.: Aerosol-type-dependent lidar ratios observed with Raman lidar, J. Geophys. Res., 112, D16202, https://doi.org/10.1029/2006JD008292, 2007.
Pandis, S., Wexler, A., and Seinfeld, J.: Dynamics of tropospheric aerosol, J. Phys. Chem., 99, 9646–9659, 1995.
Papayannis, A., Balis, D., Bais, A., Van Der Bergh, H., Calpini, B., Durieux, E., Fiorani, L., Jaquet, L., Ziomas, I., and Zerefos, C. S.: Role of urban and suburban aerosols on solar UV radiation over Athens, Greece, Atmos. Environ., 32, 2193–2201, 1998.
Papayannis, A., Balis, D., Amiridis, V., Chourdakis, G., Tsaknakis, G., Zerefos, C., Castanho, A. D. A., Nickovic, S., Kazadzis, S., and Grabowski, J.: Measurements of Saharan dust aerosols over the Eastern Mediterranean using elastic backscatter-Raman lidar, spectrophotometric and satellite observations in the frame of the EARLINET project, Atmos. Chem. Phys., 5, 2065–2079, https://doi.org/10.5194/acp-5-2065-2005, 2005.
Papayannis, A., Amiridis, V., Mona, L., Tsaknakis, G., Balis, D., Bösenberg, J., Chaikovski, A., De Tomasi, F., Grigorov, I., Mattis, I., Mitev, V., Müller, D., Nickovic, S., Pérez, C., Pietruczuk, A., Pisani, G., Ravetta, F., Rizi, V., Sicard, M., Trickl, T., Wiegner, M., Gerding, M., Mamouri, R. E., D'Amico, G., and Pappalardo, G.: Systematic lidar observations of Saharan dust over Europe in the frame of EARLINET (2000–2002), J. Geophys. Res.-Atmos., 113, D10204, https://doi.org/10.1029/2007JD009028, 2008.
Papayannis, A., Mamouri, R. E., Amiridis, V., Kazadzis, S., Pérez, C., Tsaknakis, G., and Kokkalis, P.: Systematic lidar observations of Saharan dust layers over Athens, Greece in the frame of EARLINET project (2004–2006), Annalesgeophysicae, 27, 3611–3620, 2009.
Pappalardo, G., Amodeo, A., Apituley, A., Comeron, A., Freudenthaler, V., Linné, H., Ansmann, A., Bösenberg, J., D'Amico, G., Mattis, I., Mona, L., Wandinger, U., Amiridis, V., Alados-Arboledas, L., Nicolae, D., and Wiegner, M.: EARLINET: towards an advanced sustainable European aerosol lidar network, Atmos. Meas. Tech., 7, 2389–2409, https://doi.org/10.5194/amt-7-2389-2014, 2014.
Paraskevopoulou, D., Liakakou, E., Gerasopoulos, E., and Mihalopoulos, N.: Sources of atmospheric aerosol from long-term measurements (5 years) of chemical composition in Athens, Greece, Sci. Total Environ., 527, 528–165, https://doi.org/10.1016/j.scitotenv.2015.04.022, 2015.
Pascal, M., Corso, M., Chanel, O., Declerq, C., Bandaloni, C., Cesaroni, G., Henschel, S., Meister, K., Haluza, D., Martin-Olmedo, P., and Medina, S.: Assessing the public health impacts of urban air pollution in 25 European cities: Results of the Aphekom project, Sci. Total Environ., 449, 390–400, 2013.
Pfeilsticker, K., Erle, F., and Platt, U.: Absorption of solar radiation by atmospheric O4, J. Atmos. Sci., 54, 933–939, 1997.
Platt, U. and Stutz J.: Differential optical absorption spectroscopy-principles and applications, Springer Nature, Switzerland, ISBN978-3-642-05946-9, 568 pp., 2008.
Psiloglou, B. E. and Kambezidis, H. D.: Estimation of the ground albedo for the Athens area, Greece, J. Atmos. Sol.-Terr. Phy., 71, 943–954, https://doi.org/10.1016/j.jastp.2009.03.017, 2009.
Raptis, I.-P., Kazadzis, S., Amiridis, V., Gkikas, A., Gerasopoulos, E., and Mihalopoulos, N.: A Decade of Aerosol Optical Properties Measurements over Athens, Greece, Atmosphere, 11, 154, https://doi.org/10.3390/atmos11020154, 2020.
Rocadenbosch, F., Reba, M. N. M., Sicard, M., and Comerón, A.: Practical analytical backscatter error bars for elastic one-component lidar inversion algorithm, Appl. Optics, 49, 3380–3393, 2010.
Rodgers, C. and Connor, B.: Intercomparison of remote sounding instruments, J. Geophys. Res., 108, 4116–4229, https://doi.org/10.1029/2002JD002299, 2003.
Rosenfeld, D., Sherwood, S., Wood, R., and Donner, L.: Climate effects of aerosol-cloud interactions, Science, 343, 379–380, https://doi.org/10.1126/science.1247490, 2014.
Rozanov, A., Rozanov, V., and Burrows, J. P.: Combined differential-integral approach for the radiation field computation in a sherical shell atmosphere: Nonlimb geometry, J. Geophys. Res., 105, 22937–22942, 2000.
Rozanov, A., Rozanov, V., Buchwitz, M., Kokhanovsky, A., and Burrows, J. P.: SCIATRAN 2.0 – A new radiative transfer model for geophysical applications in the 175–2400 nm spectral region, Adv. Space Res., 36, 1015–1019, 2005.
Schmid, B., Ferrare, R., Flynn, C., Elleman, R., Covert, D., Strawa, A., Welton, E., Turner, D., Jonsoon, H., Redemann, J., Eilers, J., Ricci, K., Hallar, A. G., Clayton, M., Michalsky, J. Smirnov, A., Holben, B., and Barnard, J.: How well do state-of-the-art techniques measuring the vertical profile of troposheric aerosol extinction compare?, J. Geophy. Res., 111, D05S07, https://doi.org/10.1029/2005JD005837, 2006.
Schreier, F. S., Richter, A., Peters, E., Ostendorf, M., Schmalwieser, A. W., Weihs, P., and Burrows, J. P.: Dual ground-based MAX-DOAS observations in Vienna, Austria: Evaluation of horizontal and temporal NO2, HCHO and CHOCHO distributions and comparison with independent data sets, Atmospheric Environment: X, 5, 100059, https://doi.org/10.1016/j.aeaoa.2019.100059, 2020.
Sinreich, R., Frieb, U., Wagner, T., and Platt, U.: Multi axis differential optical absorption spectroscopy (MAX-DOAS) of gas and aerosol distributions, Faraday Discuss., 130, 153–164, https://doi.org/10.1039/B419274P, 2005.
Smirnov, A., Holben, B. N., Eck, T. F., Slutsker, I., Chatenet, B., and Pinker, R. T.: Diurnal variability of aerosol optical depth observed at AERONET (Aerosol Robotic Network) sites, Geophys. Res. Lett., 29, 2115, https://doi.org/10.1029/2002GL016305, 2002.
Solanki, R. and Singh, N.: LiDAR observations of the vertical distribution of aerosols in free troposphere: Comparison with CALIPSO level-2 data over the central Himalayas, Atmos. Environ., 99, 227–238, https://doi.org/10.1016/j.atmosenv.2014.09.083, 2014.
Soupiona, O., Samaras, S., Ortiz-Amezcua, P., Böckmann, C., Papayannis, A., Moreira, G. A., Benavent-Oltra, J. A., Guerrero-Rascado, J. L., Bedoya-Velásquez, A. E., Olmo, F. J., Román, R., Kokkalis, P., Mylonaki, M., Alados-Arboledas, L., Papanikolaou, C. A., and Foskinis, R.: Retrieval of optical and microphysical properties of transported Saharan dust over Athens and Granada based on multi-wavelength Raman lidar measurements: Study of the mixing processes, Atmos. Environ., 214, 116824, https://doi.org/10.1016/j.atmosenv.2019.116824, 2019.
Twomey, S.: Influence of pollution on the short-wave albedo of clouds, J. Atmos. Sci., 34, 1149–1152, 1977.
Vandaele, A. C., Hermans, C., Simon, P. C., Carleer, M., Colin, R., Fally, S., Merienne, M., Jenouvrier, F., and Coquart, B.: Measurements of the NO2 absorption cross section from 42,000 cm−1 to 10,000 cm−1 (238–1000 nm) at 220 K and 294 K, J. Quant. Spectrosc. Ra., 52, 171–184, 1998.
Wagner, T., Dix, B., Friedeburg, C., Frieb, U., Sanghavi, S., Sinreich, R., and Platt, U.: MAX-DOAS O4 measurements: A new technique to derive information on atmospheric aerosols-Principles and information content, J. Geophys. Res., 109, D22205, https://doi.org/10.1029/2004JD004904, 2004.
Wagner, T., Beirle, S., Brauers, T., Deutschmann, T., Frieß, U., Hak, C., Halla, J. D., Heue, K. P., Junkermann, W., Li, X., Platt, U., and Pundt-Gruber, I.: Inversion of tropospheric profiles of aerosol extinction and HCHO and NO2 mixing ratios from MAX-DOAS observations in Milano during the summer of 2003 and comparison with independent data sets, Atmos. Meas. Tech., 4, 2685–2715, https://doi.org/10.5194/amt-4-2685-2011, 2011.
Wandinger, U. and Ansmann, A.: Experimental determination of the lidar overlap profile with Raman lidar, Appl. Optics, 41, 511–514, https://doi.org/10.1364/AO.41.000511, 2002.
Wang, S., Cuevas, C. A., Frieß, U., and Saiz-Lopez, A.: MAX-DOAS retrieval of aerosol extinction properties in Madrid, Spain, Atmos. Meas. Tech., 9, 5089–5101, https://doi.org/10.5194/amt-9-5089-2016, 2016.
Westphal, D. and Toon, O.: Simulations of microphysical, radiative and dynamical processes in a continental-scale forest fire smoke plume, J. Geophys. Res., 96, 22379–22400, 1991.
Wittrock, F., Oetjen, H., Richter, A., Fietkau, S., Medeke, T., Rozanov, A., and Burrows, J. P.: MAX-DOAS measurements of atmospheric trace gases in Ny-Ålesund - Radiative transfer studies and their application, Atmos. Chem. Phys., 4, 955–966, https://doi.org/10.5194/acp-4-955-2004, 2004.
Zerefos, C. S., Meleti, C., Eleftheratos, K., Kazadzis, S., Romanou, A., Bais, A., and Ichoku, C.: Solar brightening over Thessaloniki, Greece, dimming over Beijing, China, Tellus B, 61, 657–665, https://doi.org/10.1111/j.1600-0889.2009.00425.x, 2009.
Zieger, P., Weingartner, E., Henzing, J., Moerman, M., de Leeuw, G., Mikkilä, J., Ehn, M., Petäjä, T., Clémer, K., van Roozendael, M., Yilmaz, S., Frieß, U., Irie, H., Wagner, T., Shaiganfar, R., Beirle, S., Apituley, A., Wilson, K., and Baltensperger, U.: Comparison of ambient aerosol extinction coefficients obtained from in-situ, MAX-DOAS and LIDAR measurements at Cabauw, Atmos. Chem. Phys., 11, 2603–2624, https://doi.org/10.5194/acp-11-2603-2011, 2011.