the Creative Commons Attribution 4.0 License.
the Creative Commons Attribution 4.0 License.
 | 06 Dec 2021
Utilizing an electrical low-pressure impactor to indirectly probe water uptake via particle bounce measurements
Kevin B. Fischer
Giuseppe A. Petrucci
Secondary organic aerosol (SOA), formed through oxidation of volatile organic compounds (VOCs), displays complex viscosity and phase behaviors influenced by temperature, relative humidity (RH), and chemical composition. Here, the efficacy of a multi-stage electrical low-pressure impactor (ELPI) for indirect water uptake measurements was studied for ammonium sulfate (AS) aerosol, sucrose aerosol, and α-pinene-derived SOA. All three aerosol systems were subjected to greater than 90 % chamber relative humidity, with subsequent analysis indicating persistence of particle bounce for sucrose aerosol of 70 nm (initial dry diameter) and α-pinene-derived SOA of number geometric mean diameters between 39 and 136 nm (initial dry diameter). On the other hand, sucrose aerosol of 190 nm (initial dry diameter) and AS aerosol down to 70 nm (initial dry diameter) exhibited no particle bounce at elevated RH. Partial drying of aerosol within the lower diameter ELPI impaction stages, where inherent and significant RH reductions occur, is proposed as one explanation for particle bounce persistence.
- Article
(1607 KB) - Full-text XML
-
Supplement
(384 KB) - BibTeX
- EndNote


Secondary organic aerosol (SOA) is formed via oxidation of volatile organic compounds (VOCs) to produce semi-, low-, and very low-volatility products that can nucleate to form new particles or partition/condense into/onto existing particles, adding to the overall aerosol mass burden (Hallquist et al., 2009; Jimenez et al., 2009). SOA constitutes a significant portion of ambient fine aerosol and accounts for a large fraction of the organic aerosol burden, which itself makes up a sizeable portion (20 %–90 %) of submicron particulate mass (Kourtchev et al., 2016; Jimenez et al., 2009; Kanakidou et al., 2005; Hallquist et al., 2009). Understanding the viscosity of atmospheric SOA is important to improving the predictive capabilities of their atmospheric impacts (Koop et al., 2011; Bateman et al., 2016; Shiraiwa et al., 2017; Li et al., 2020). Water vapor, a key and ubiquitous component of the troposphere (Sherwood et al., 2010), can act as a plasticizer when taken up by SOA, subsequently lowering particle viscosity (Koop et al., 2011; Zobrist et al., 2008). SOA water uptake in the air is largely dependent on the particle hygroscopicity (Jimenez et al., 2009; Tang et al., 2019; Chu et al., 2014), which impacts the SOA's aerodynamic and optical properties as well as heterogeneous chemical reactions (with gas phase reactants), and cloud droplet activation (cloud condensation nuclei activity) (Cappa et al., 2011; Michel Flores et al., 2012; Michaud et al., 2009; Heintzenberg et al., 2001; Chu et al., 2014; Wu et al., 2020; Zhao et al., 2016; Burgos et al., 2019). RH over 90 % is common, especially in the vicinity of clouds (Hamed et al., 2011), and recent work has expanded the focus to uptake of water by SOA under subsaturation levels, where relative humidity (RH) is below 100 %, and the resulting changes in viscosity (Pajunoja et al., 2016; Berkemeier et al., 2014; Reid et al., 2018). Uptake of enough water can solubilize a particle if RH becomes high enough, facilitating its response to changes in gas phase composition. Thus, RH, along with chemical composition and temperature, has been deemed a controlling factor of aerosol phase state (Koop et al., 2011; Krieger et al., 2012; Martin, 2000; Reid et al., 2018).
A fully deliquesced particle can be viewed as a solute in an aqueous solution, and this solution can experience evaporation and allow for nucleation of crystals or the formation of amorphous particles (Gregson et al., 2019b). This is a complex phenomenon important to not just the atmospheric science community, but also for the pharmaceutical and food product industries, and it is difficult to probe in situ (Fu et al., 2012). Gregson et al. (2020) recently investigated the water evaporation rates and crystallization for sodium chloride and sodium nitrate aerosol droplets and were able to observe nucleation and crystallization while also studying how drying temperature, RH, and solute concentration affect nucleation time. However, a minimum of 25 µm particle diameter was required, well beyond both atmospheric relevance and ELPI (and other impactors) capabilities. Other recent work by Gregson et al. (2019a) involved studying competing evaporation rates of multiple component aerosol droplets (minimum 25 µm) in water, ethanol mixtures. Archer et al. (2020) recently probed the drying kinetics and particle formation for silica aerosol droplets and found that gas phase drying conditions, temperature, and RH impact solvent evaporation rate. A minimum of 25 µm particle diameter was required as well. Robinson et al. (2020) recently studied drying kinetics and nucleation in evaporating sodium chloride and sodium nitrate aerosols and concluded that sodium chloride recrystallizes upon drying, but not sodium nitrate, indicating differences in the competition between drying rate and nucleation kinetics between the two systems. Once again, minimum droplet sizes of 20–25 µm were required. Therefore, while novel advancements have been made recently, there remains the need to carry out experimental in situ studies probing drying, evaporation, crystallization, and nucleation processes for submicron organic and inorganic particles of atmospheric relevance.
While several methods for investigating particle hygroscopicity and viscosity under subsaturated conditions have been reported (see Tang et al., 2019, for a recent review on the topic), it is difficult to extrapolate from these methods to understand how RH might influence the reactivity of chemically complex SOA at atmospherically relevant mass loadings, particle sizes, and timescales. Often, existing methods require large particles (several µm), unrealistically high SOA mass loading (CSOA) in the hundreds to thousands of micrograms per cubic meter (µg m−3), specific particle size selection via a differential mobility analyzer (therefore inherently excluding much of the SOA population), and aerosol collection times of hours to days (Grayson et al., 2016; Renbaum-Wolff et al., 2013; You et al., 2012; Tang et al., 2019; Bateman et al., 2014; Bateman et al., 2015). For example, Grayson et al. (2016) used the poke-and-flow technique to measure the viscosity of α-pinene-derived SOA at CSOA between 120 and 14 000 µg m−3. Maclean et al. (2021) recently completed a similar poke-and-flow study with β-caryophyllene-derived SOA. Kidd et al. (2014) found similar results by studying SOA impaction patterns onto a germanium crystal, which also permitted Fourier-transform infrared (FTIR) spectroscopic analysis of chemical composition. Furthermore, particle sizes studied were limited to tens of micrometers by the measurement methods. Jarvinen et al. (2016) reported on the use of an in situ, real-time optical method to detect the viscous state of α-pinene SOA particles and measured their transition from the amorphous highly viscous state to states of lower viscosity. Their method is based on the depolarizing properties of laboratory-produced non-spherical SOA particles and their transformation to non-depolarizing spherical particles at RH values near the deliquescence point (where sufficient water is absorbed to form an effectively aqueous solution). Particles of at least 600 nm geometric mean diameter (GMD) were needed to obtain measurable scatter signals. From reported parameters for a typical number size distribution of their SOA (GMD = 600 nm, geometric standard deviation (GSD = 1.15), and total number density N = 10 000 cm−3), we can estimate a total CSOA of 1570 µg m−3.
Thus, there is a need to estimate particle viscosity for SOA subjected to different RH that is measured in situ, in real time, and at atmospherically relevant mass loadings and particles sizes. Our previously developed method of inferring particle viscosity through quantification of particle bounce from an impaction surface using an electrical low-pressure impactor (ELPI+) (Jain and Petrucci, 2015) is in principle analogous to similar methods developed previously (Bateman et al., 2014; Saukko et al., 2012a; Virtanen et al., 2011). However, the ELPI method differs significantly in its application and output as it takes advantage of the smooth and sintered impaction surface characteristics to calculate bounce factor (BF) with high temporal resolution to infer viscosity changes in a continuously evolving SOA population, while simultaneously eliminating the need for additional instrumentation to independently measure size distributions (Jain and Petrucci, 2015).
Here, our ELPI setup was utilized to probe particle bounce for aerosol that was subjected to high-RH (> 90 %) conditions to determine the viability of indirect measurements of water uptake. Ammonium sulfate (AS) aerosol, sucrose aerosol, and SOA derived from the ozonolysis of α-pinene were injected or generated in a batch type 775 L Teflon reaction chamber fitted with a humidifier and RH sensor. Particle bounce data were collected and compared with previous literature reports to probe the efficacy of the ELPI for the measurement of humidified particles.
All experiments were conducted in a 775 L Teflon batch type reaction chamber under ambient temperature and atmospheric pressure. For chamber humidification, dry, particle-free air was humidified by passage through two, 4 L glass containers containing deionized water. The first container was maintained at 35 ∘C water temperature via a hot plate, while the second (immediately before injection into the chamber) was held at room temperature. RH inside the chamber was monitored using a humidity sensor (HMT 130, Vaisala Corp., Helsinki, Finland). Prior to all experiments, dry, zero air was used for chamber flushing (after H2O2 passivation with UV lamps) until background aerosol mass and number concentrations were well below 0.01 µg m−3 and 10 particles cm−3, respectively. Particle mass and number concentrations as well as size distributions were measured using a scanning mobility particle sizer (SMPS 3082, TSI Inc., Shoreview, MN, USA) operating with sheath and aerosol flows of 4.0 and 0.4 L min−1, respectively. For α-pinene-derived SOA experiments, SMPS flows of 10 and 1.0 L min−1, respectively, were used.
2.1 Ammonium sulfate, sucrose aerosol deliquescence, and efflorescence
Ammonium sulfate (AS) and sucrose were purchased from Fisher Scientific and used without further purification. AS and sucrose aerosol were produced by pneumatic nebulization of an aqueous solution (7.35 ) using a V-groove nebulizer (J.E. Meinhard Associates, Santa Ana, CA, USA) and dried by passage through a diffusion drier packed with silica gel. The RH of aerosol at the exit of the diffusion dryer was < 10 %. Following the diffusion dryer, the dried aerosol was injected into a 775 L Teflon chamber held at an initial RH of either < 20 % (for deliquescence experiments) or > 90 % (for efflorescence experiments) for polydisperse populations. For monodisperse populations, size selection was carried out after the diffusion dryer using a differential mobility analyzer (DMA), after which the monodisperse aerosol was led through an x-ray-based neutralizer and then into the chamber. For preparation of a high-RH chamber or measurement of the deliquescence curve, the RH was increased by the introduction of air saturated with water vapor (as described above) either before or following aerosol injection, respectively. For measurement of the efflorescence curve, initial RH was > 90 % before aerosol injection. The RH was then continuously decreased by an influx of dry, particle-free air.
2.2 α-Pinene-derived SOA generation and subsequent humidification
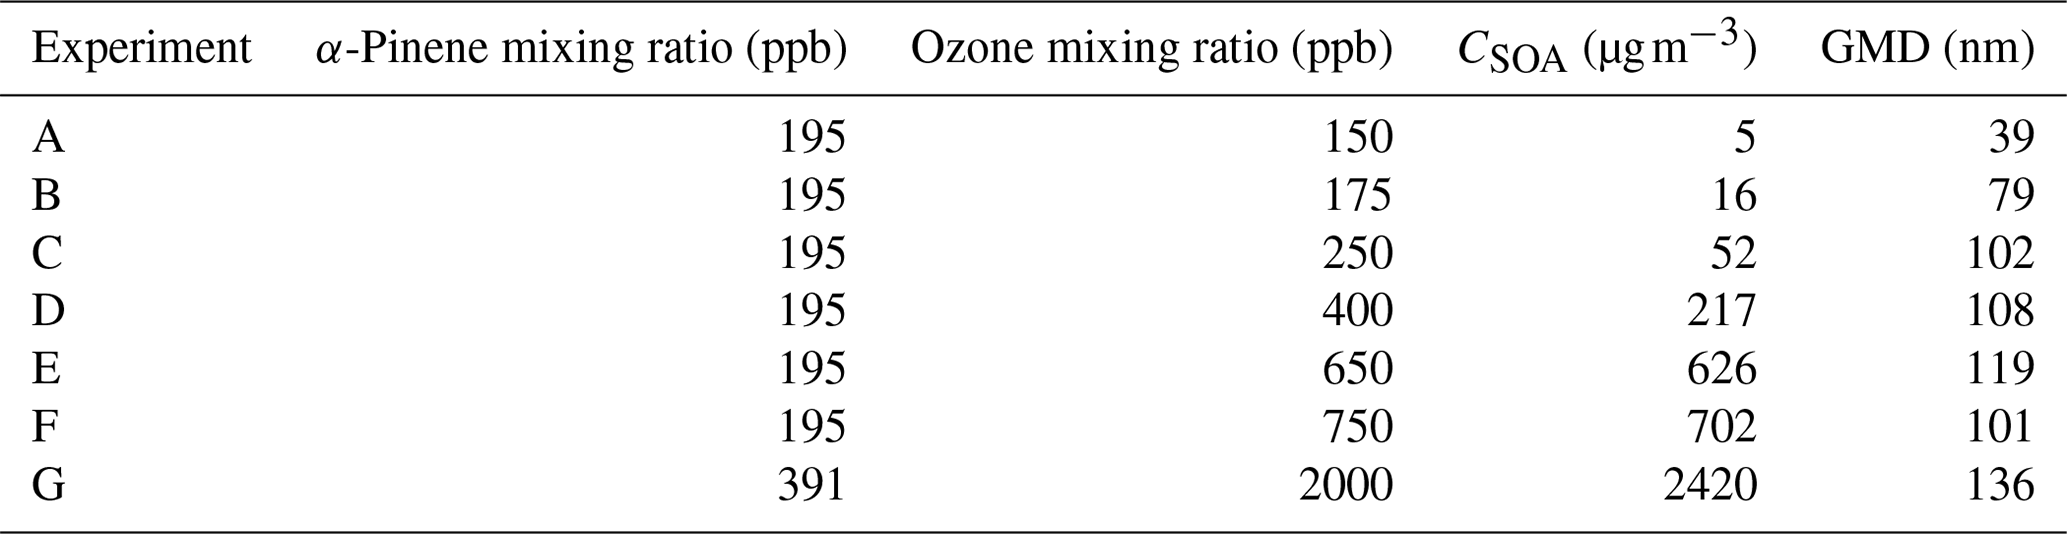
α-Pinene was purchased from Sigma-Aldrich and used without further purification. A glass micro-syringe was used to quantitatively transfer α-pinene aliquots into a glass three-neck flask that was placed in a hot water bath. The liquid phase α-pinene content within the flask was visually monitored as a flow of dry zero air carried the volatilized α-pinene into the 775 L Teflon reaction chamber. Once all gaseous α-pinene was introduced, the dry zero air flow was shut off (typically after 10–20 min). The three-neck flask was sealed except for the dry zero air inlet and an outlet leading directly to the reaction chamber. To initiate ozonolysis, ozone was produced with a commercial generator (1KNT, Enaly, Shanghai, China) using dry, particle-free air. Ozone was injected by diverting the output flow of the generator first through an airflow splitter to dilute the ozone concentration and subsequently to the chamber for a pre-determined time pulse to yield the desired ozone concentration. Typical injection pulses were in the range of 5–15 s. A summary of the α-pinene-derived SOA experiments is provided in Table 1. RH was subsequently increased by the introduction of air saturated with water vapor (as described above).
Table 1Mixing ratios used for each α-pinene-derived SOA experiment. Both SOA mass loading (CSOA) and number geometric mean diameter (GMD; from SMPS instrument) were observed immediately prior to initiation of humidification.
2.3 Electrical low-pressure impactor
An electrical low-pressure impactor (ELPI+, Dekati, Kangasala, Finland) was operated at a constant flow rate of 10 L min−1, and sampling was done directly from the Teflon reaction chamber. The ELPI+ (Fig. 1) consists of 15 stages (13 active impaction stages, 1 active filter stage) with sequentially smaller cutoff impaction diameters (D50; particle size with a 50 % collection efficiency) ranging from 10 µm (stage 15) to 6 nm (stage 1/filter stage). Stage 15 is not measured electrically. The ELPI classifies particles based on their aerodynamic diameter. Operation of the ELPI can be divided into three main sections: (1) unipolar charging of the aerosols, (2) size classification of these charged aerosols in a Berner-type low-pressure cascade impactor, and (3) electrical measurement of collected particles by a series of electrometers (one for each stage). Further operational and calibration details, including corrections for diffusion and space charger losses, can be found elsewhere (Keskinen et al., 1999; Virtanen et al., 2001; Järvinen et al., 2014; Jain and Petrucci, 2015). In the modified method utilized here, contrary to the previously published method (see Fig. S1 in the Supplement) (Jain and Petrucci, 2015), only the smooth impaction stages were utilized, which allow for particle bounce to occur.
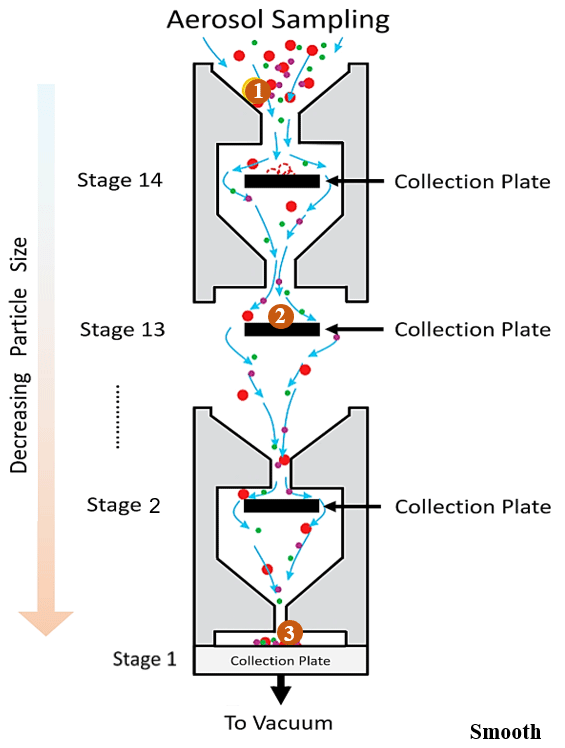
Figure 1Schematic (not to scale) of ELPI stages with smooth aluminum surfaces showing the 14 active collection/impaction plates corresponding to decreasing particle sizes starting from the top where aerosols first enter the impactor. The collection plate is also referred to as the filter stage (stage 1). The large circle labeled with “1” is a solid particle entering the ELPI. It moves through the ELPI and impacts at position “2” but rebounds and continues onward and rebounds off subsequent stages until detected at position “3” on the lowest stage. Not shown: unipolar charging of aerosols, which occurs immediately after aerosols enter the instrument.
To qualitatively assess relative changes in aerosol viscosity, the fractional current of the filter stage, channel 1 (Δifractional,t), at any time point (t) was determined by calculating changes in the measured current of channel 1 () as compared to the total current summed across all channels :
Because particles are accelerated to greater velocities in subsequent stages, it is assumed that all particles that bounce from any preceding stage will also have sufficient kinetic energy to bounce from all subsequent stages and terminate on the filter stage. As particles become less viscous due to processes such as adsorption/absorption of water, the Δifractional,t will decrease as a result. Note that this is not a measure of the absolute particle bounce, which can be calibrated to provide a quantitative estimate of the viscosity, but rather a relative change in particle bounce as a function of changing environmental conditions within the chamber. A comparison to the bounce factor method (Jain and Petrucci, 2015) is shown in Fig. S2 in the Supplement.
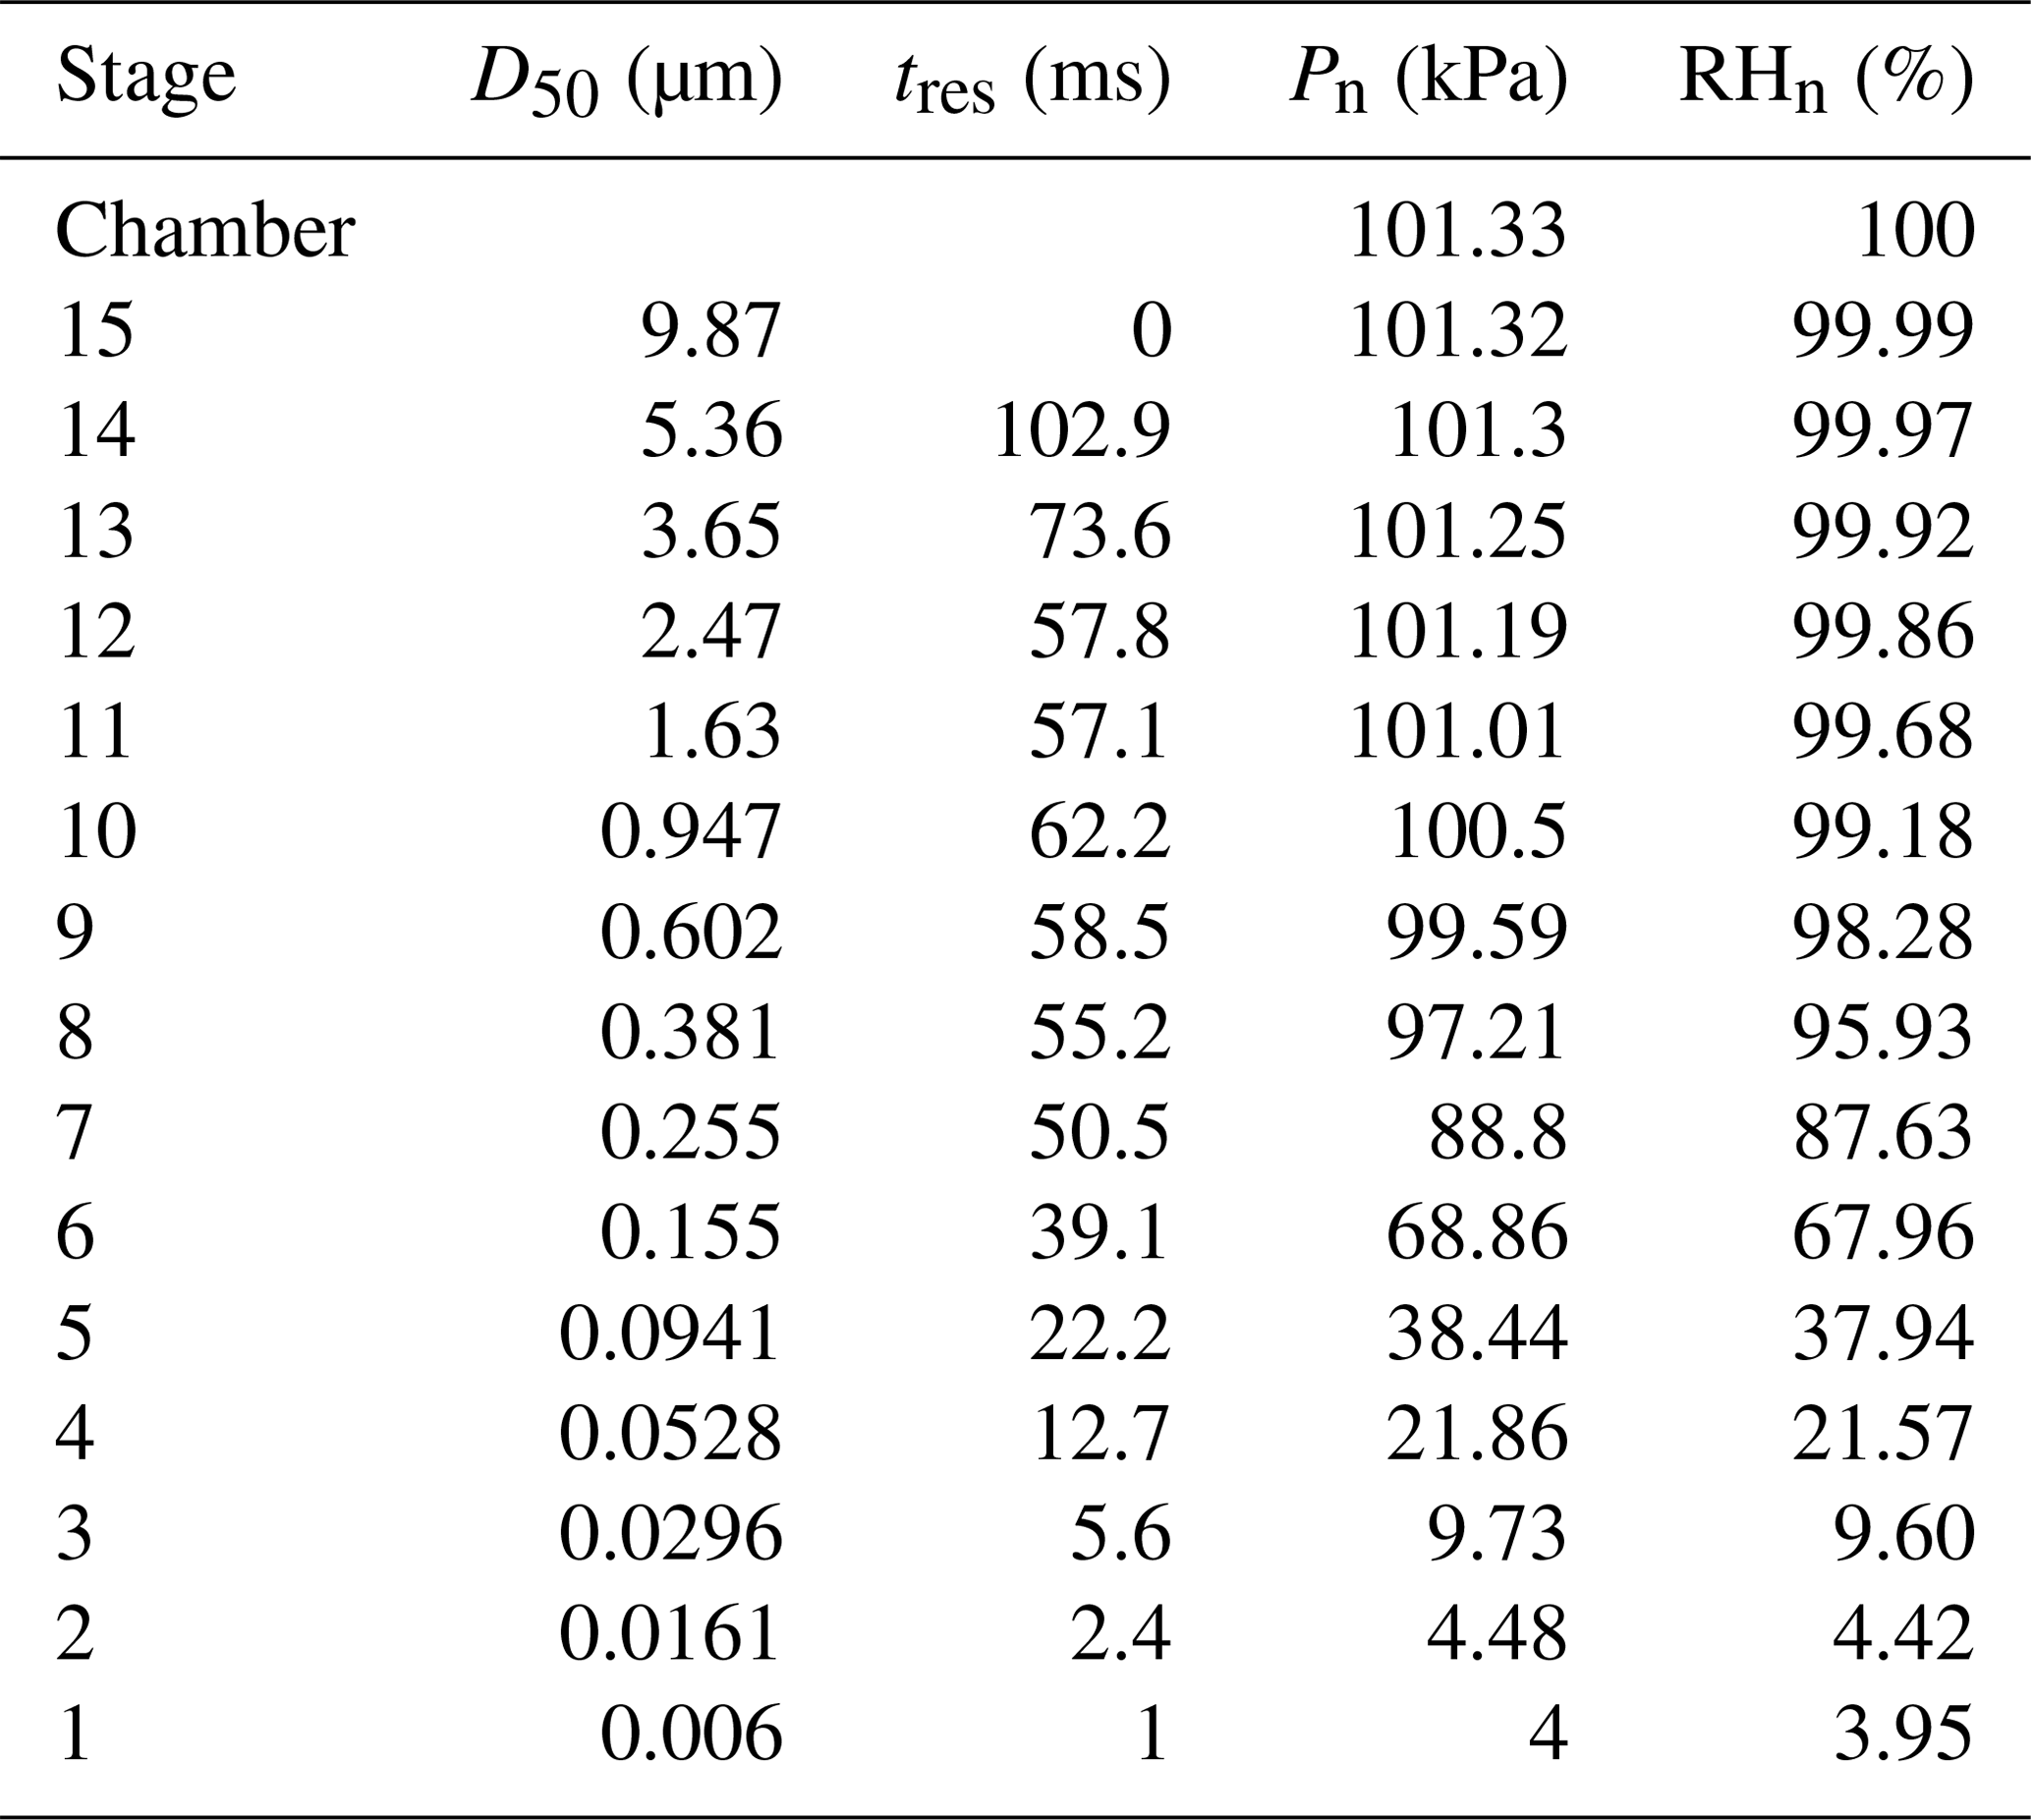
Importantly, a RH drop occurs within the lower impaction stages due to the low-pressure condition needed to avoid shifts in flow rates that would cause changes to the set point aerodynamic diameters. This RH drop is proportional to the pressure drop and becomes significant at stage 7 (D50 = 255 nm) and below (Table 2). As discussed below, this impactor RH drop can affect the bounce of those particles that possess an efflorescence relative humidity (ERH) or equivalent drying RH above the impactor stage RH, even though the particle residence time in these low-pressure impaction stages is 50.5 ms and below for each stage.
Table 2ELPI cut point diameter (D50; µm), residence time (ms), pressure (kPa), and calculated relative humidity (%) for each stage, assuming 100 % RH and 101.33 kPa in reaction chamber.
As the most abundant monoterpene in the troposphere, α-pinene SOA formation via ozonolysis has become an established SOA system in the atmospheric sciences community (Zhang et al., 2015a). The SOA produced under dry conditions is best described as a viscous, amorphous semi-solid with reported viscosities ranging from 104–109 Pa s that can undergo moisture-induced phase transitions, given sufficiently high RH, resulting in significant viscosity changes (Zhang et al., 2015b; Grayson et al., 2016; Petters et al., 2019; Shiraiwa et al., 2011). Ammonium sulfate and sucrose have been heavily studied and are often used as surrogates for inorganic and organic aerosol components, respectively, and are both also found in the atmosphere as well (ammonium sulfate more ubiquitously than sucrose) (Ruprecht and Sigg, 1990; Theodosi et al., 2018; Froyd et al., 2019; Ott et al., 2020). Given sufficiently high RH, both engage in water uptake to undergo deliquescence (formation of an aqueous solution) (Mauer and Taylor, 2010). Conversely, water loss can occur to the point of particle drying and/or efflorescence (recrystallization at low RH) (Davis et al., 2015).
3.1 Ammonium sulfate aerosol
Efflorescence relative humidity (ERH) and deliquescence relative humidity (DRH) curves for AS aerosol (number GMD = 90 nm, initial dry diameter) were generated following typical procedures (see above). Figure 2 displays efflorescence and deliquescence behavior in terms of changes in the fractional current on channel 1, Δifractional,t, as a function of chamber RH. As given in Eq. (1), a value closer to 0 indicates liquid-like (less viscous) particles, and values closer to 1 indicate solid-like (more viscous) particles. Since the D50 of channel 1 (filter stage) is 6 nm and the number GMD of the ammonium sulfate aerosol distribution was 90 nm (Fig. S3 in the Supplement), only particles experiencing bounce were expected to reach the filter stage (as opposed to reaching the filter stage due to their aerodynamic diameter). Therefore, values of Δifractional,t approaching 1 indicate that all particles have reached the filter stage resulting from particle bounce from preceding stages (suggesting solid particles), while values of Δifractional,t approaching 0 suggest that all particles adhered to their intended impaction stages based on their aerodynamic diameter (suggesting liquid particles).
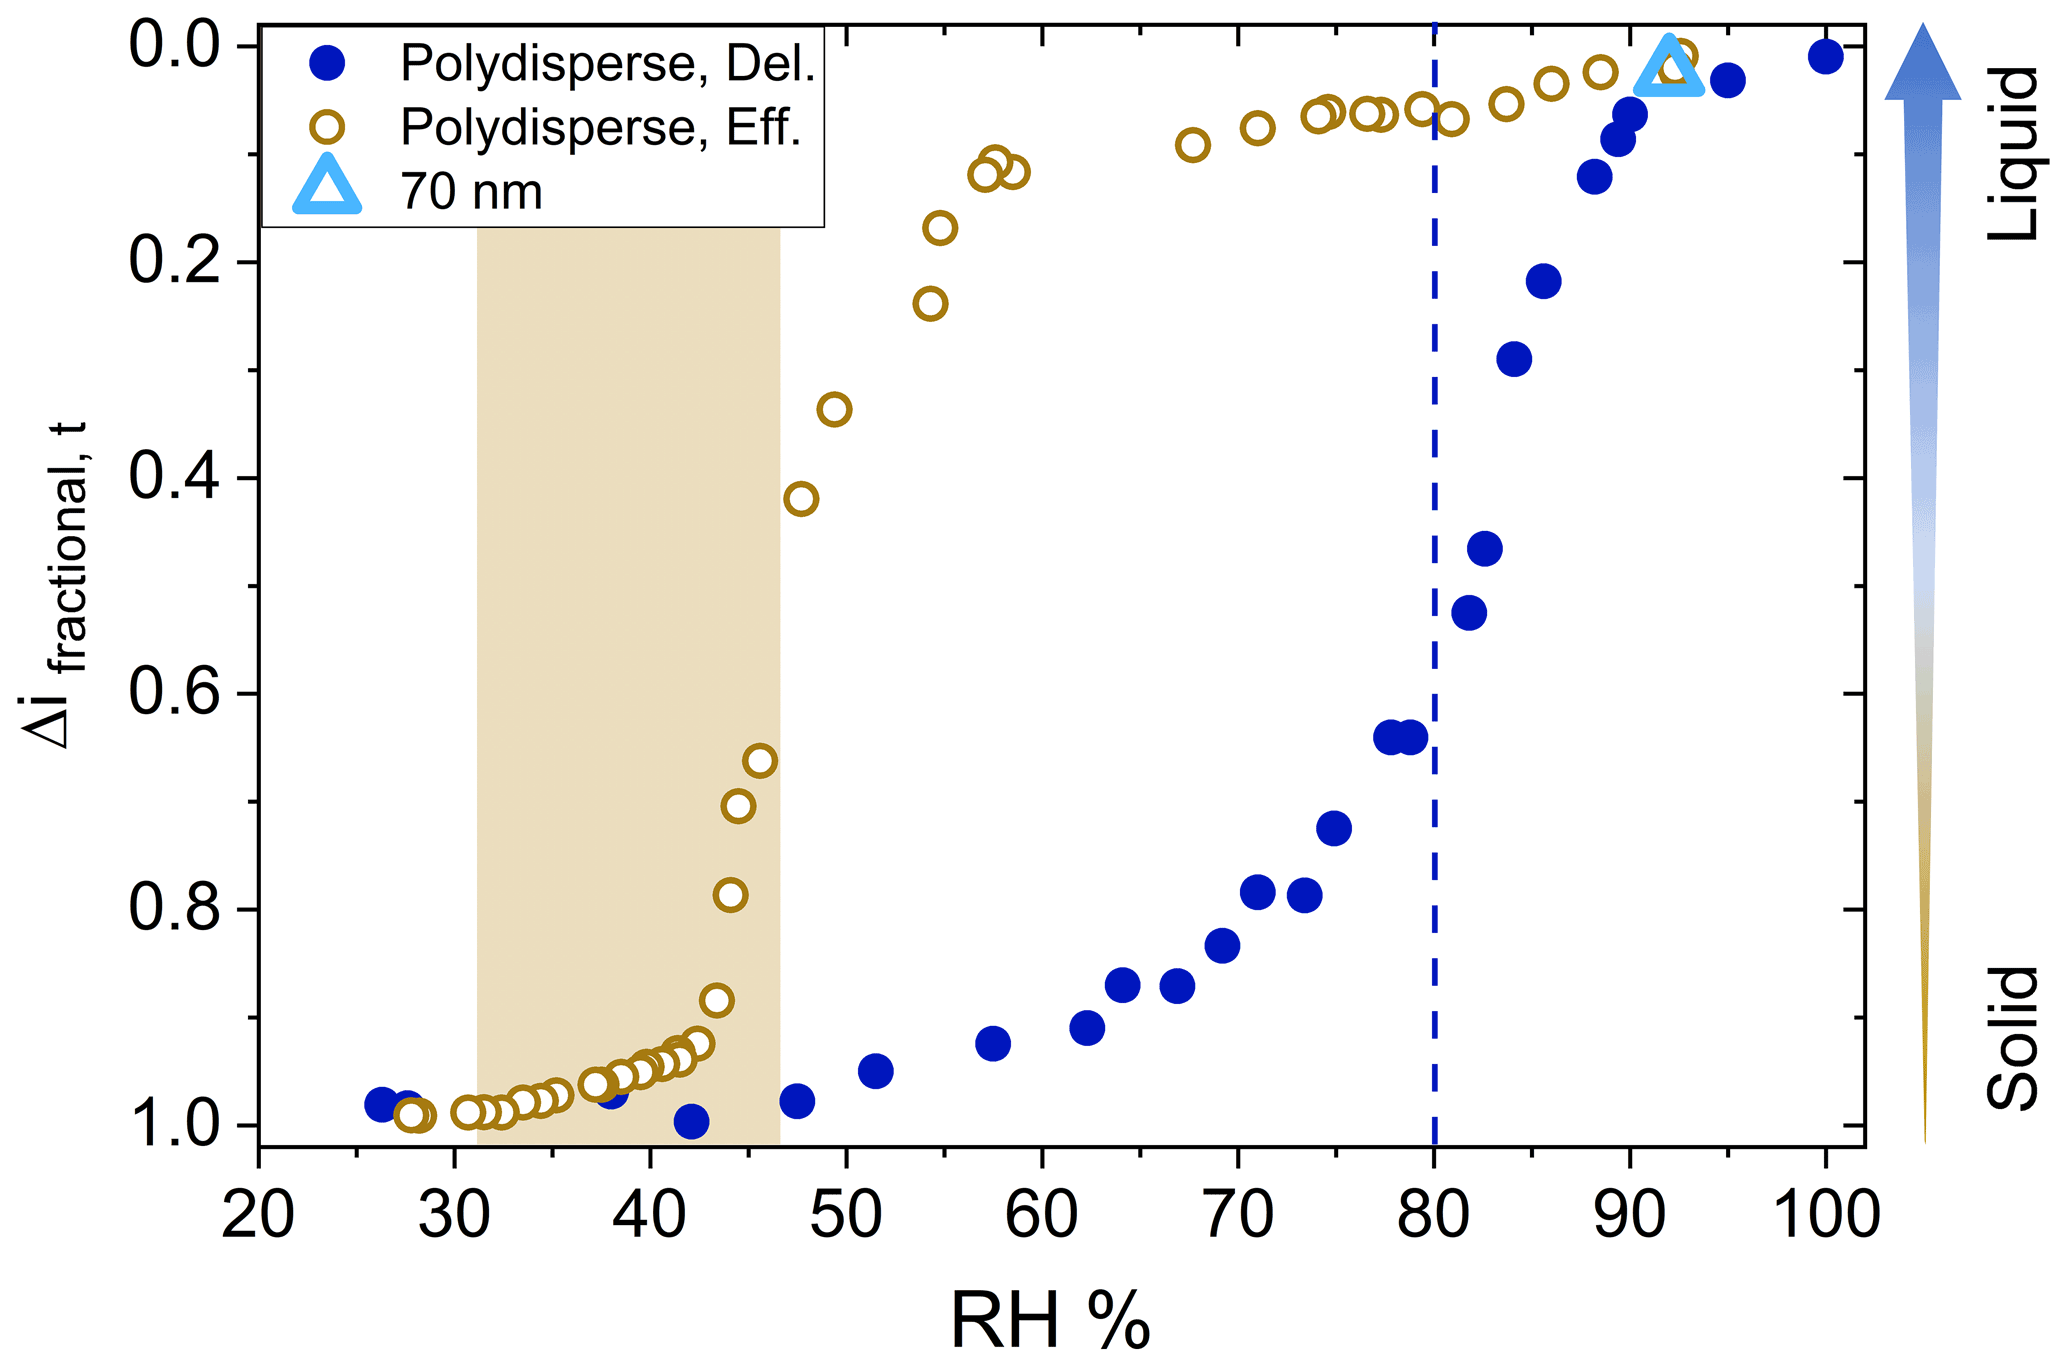
Figure 2Efflorescence relative humidity (o) and deliquescence relative humidity (•) curves for polydisperse (initial dry diameter number GMD = 90 nm, geometric standard deviation 1.7) ammonium sulfate (AS) aerosol. Shaded area and dashed line indicate literature values for efflorescence and deliquescence, respectively. Particle bounce for monodisperse 70 nm (initial dry diameter) AS (Δ) at 95 % chamber RH also shown.
The measured ERH and DRH values for the AS particles were 43 % and 87 % chamber RH, respectively, in good agreement with reported values of 80 %–82 % RH for DRH and 31 %–48 % RH for ERH (Ciobanu et al., 2010; Gao et al., 2006; Brooks et al., 2002). The decreased impactor RHs (relative to the chamber RH) played a negligible role here given the reported GMD of this AS particle size distribution and the relatively low ERH of AS. As a note, during experiments the chamber RH was increased or decreased at a rate of 1 % min−1 and it was not confirmed if equilibrium was established in the chamber after each RH increment, and the exact crystalline or amorphous character of the specific AS aerosol used here was not determined. Our ERH and DRH values are slightly higher compared to published literature values likely due to the relatively higher rate of RH increase (during deliquescence) and decrease (during efflorescence), which has been shown to shift measured glass transition relative humidity values for glassy solids (Mikhailov et al., 2009). Also, a homogenous RH within the chamber could not be guaranteed considering the relatively high rate of RH increase or decrease and the single location of the RH probe. Nevertheless, full and clear deliquescence and efflorescence transitions of the AS aerosol were observed utilizing this modified method.
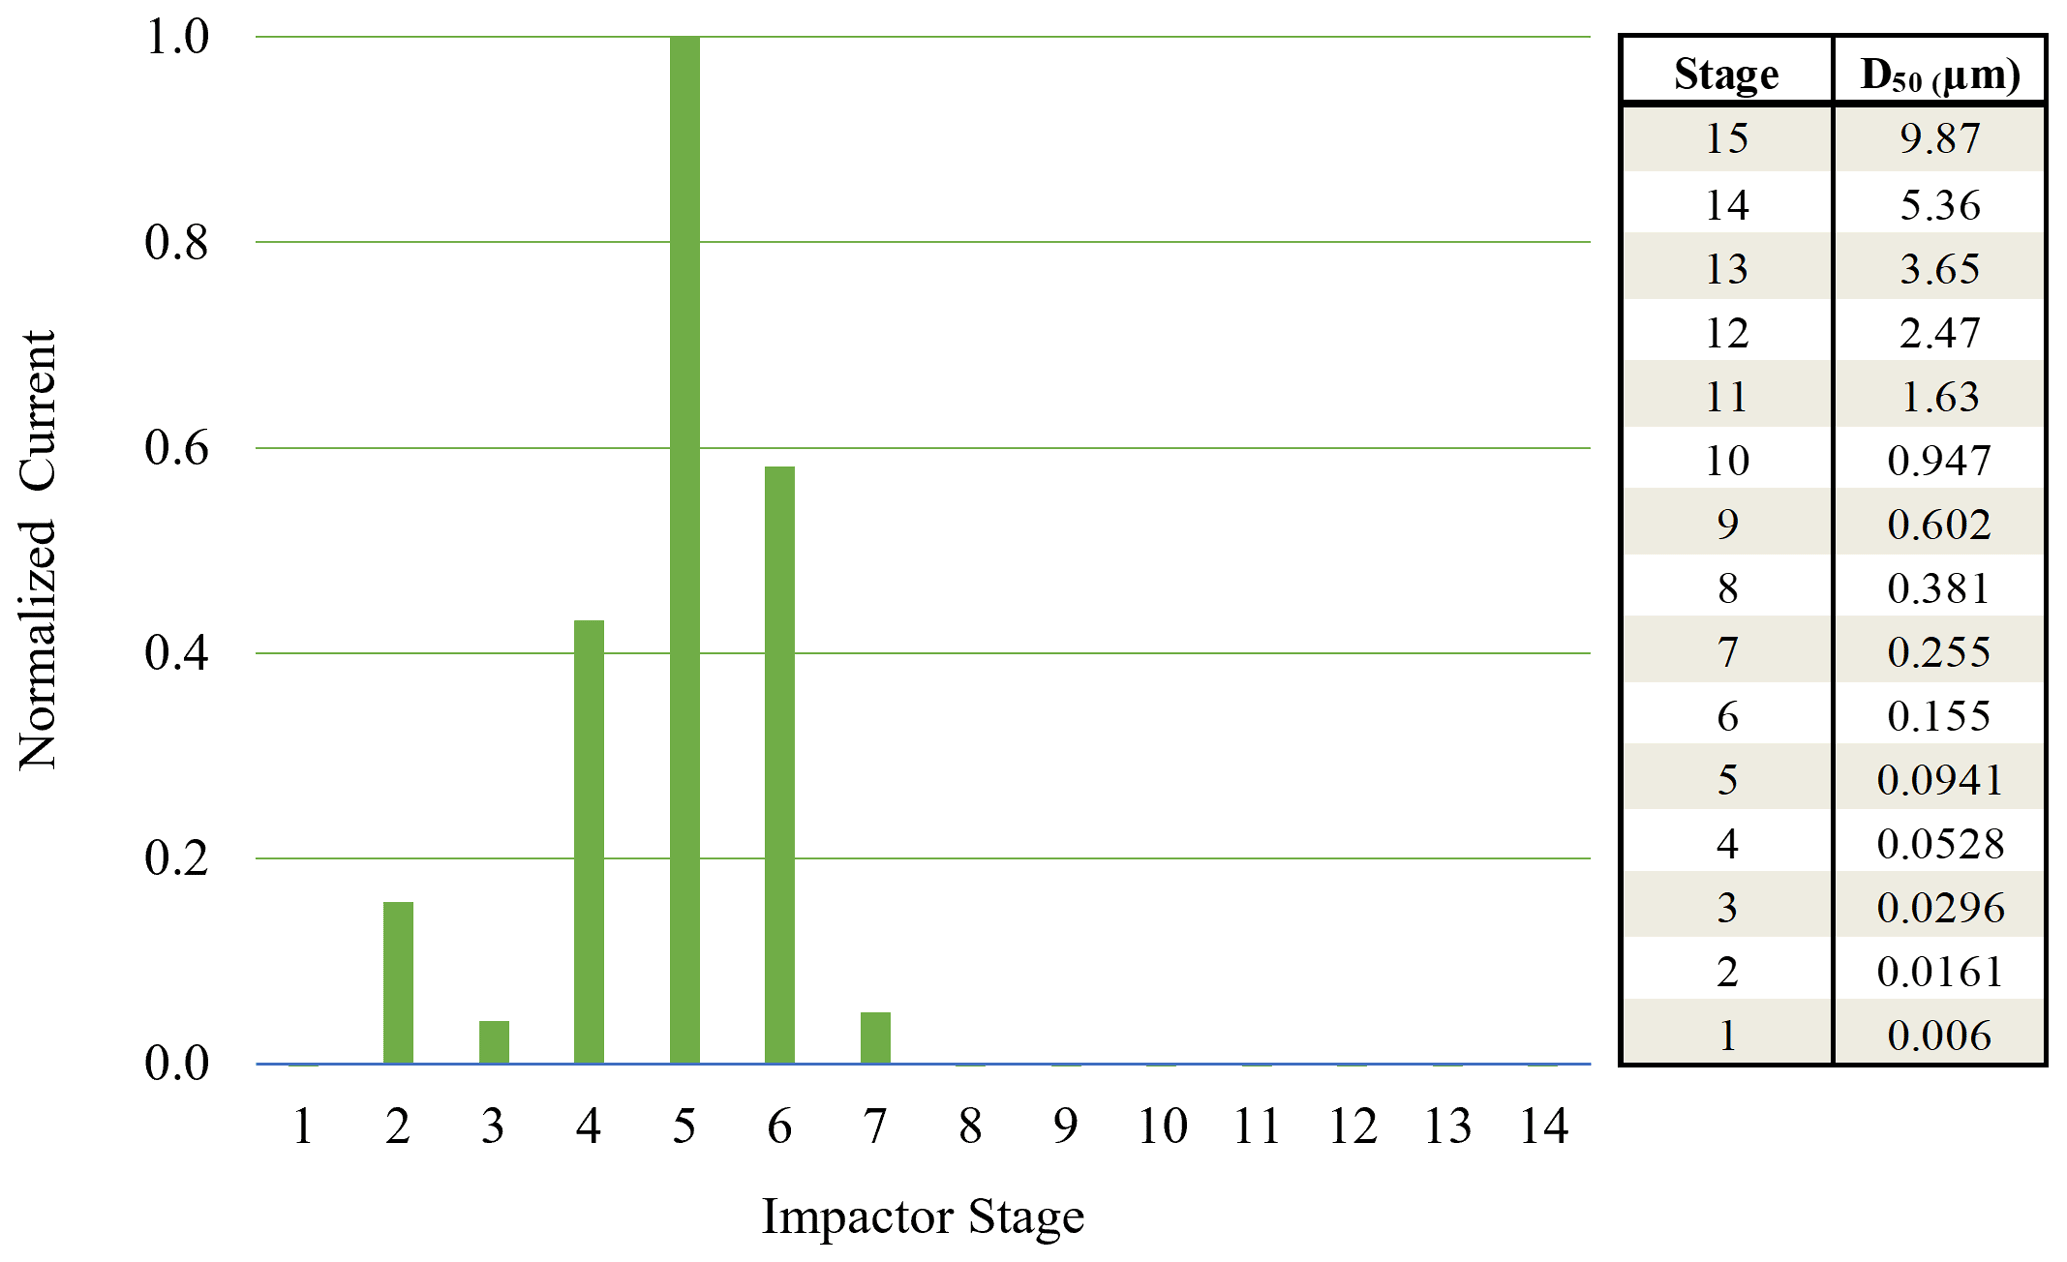
Figure 3Normalized ELPI current values observed for each impactor stage for 70 nm AS particles (initial dry diameter) sampled from 92 % chamber RH.
When using monodisperse AS particles of 70 nm (initial dry diameter prior to injection into humid chamber), particle bounce was also eliminated at a chamber RH > 90 %. To verify which ELPI impaction stages were impacted by the monodisperse AS particles, currents generated over the course of 6 min by each impaction stage were examined. Average currents from each stage were normalized to allow for easy comparison (Fig. 3). Due to the inherently lower concentrations of monodisperse AS aerosol, we were not able to measure a DRH curve before particle numbers within the chamber fell (due to dilution) below ELPI measurement limits. Interestingly, stage 5 (D50 = 94.1 nm) experienced the highest current values, likely due to significant growth of the AS particles in the humid chamber, followed by stages 6 and 4. The maximum impactor stage RHs for stages 4 and 5 are 22 % and 38 %, respectively (Table 2). While the stage 5 RH is nominally at or below the ERH, stage 4 RH is well below this, yet particle bounce was still eliminated (Δifractional,t < 0.05). This suggests the residence time within the lower 6 stages, where large RH drops occur, is not enough to allow for AS aerosol efflorescence. Therefore, AS aerosol of 70 nm (initial dry diameter) and greater yields ELPI results consistent with AS water uptake and deliquescence, suggesting the validity of this modified approach to measure particle bounce down to at least 70 nm (initial dry diameter).
3.2 Sucrose aerosol
While the particle bounce of AS aerosol behaved as expected as a function of RH, the same was not observed for sucrose aerosol. For sucrose, a DRH of approximately 85 % is well established, and measurable water uptake starting at 30 %–40 % RH has been observed (Robinson et al., 2014), but the ERH has proven difficult to determine (Zobrist et al., 2011; Samain et al., 2017). Unlike AS, Δifractional,t for polydisperse sucrose particles (initial dry number GMD = 65 nm, Fig. S4 in the Supplement) did not approach zero past the DRH (Fig. 4), which is in direct contrast to other investigators who observed an elimination of sucrose aerosol bounce at high RH using different methods (Tang et al., 2019; Bateman et al., 2015). However, these methods involved monodisperse (190 and 240 nm) sucrose aerosol and single impactors (as opposed to the ELPI with its cascade impactor setup) with no impactor pressure drop and hence no RH decrease. As a result, chamber RH and impactor RH remained the same.
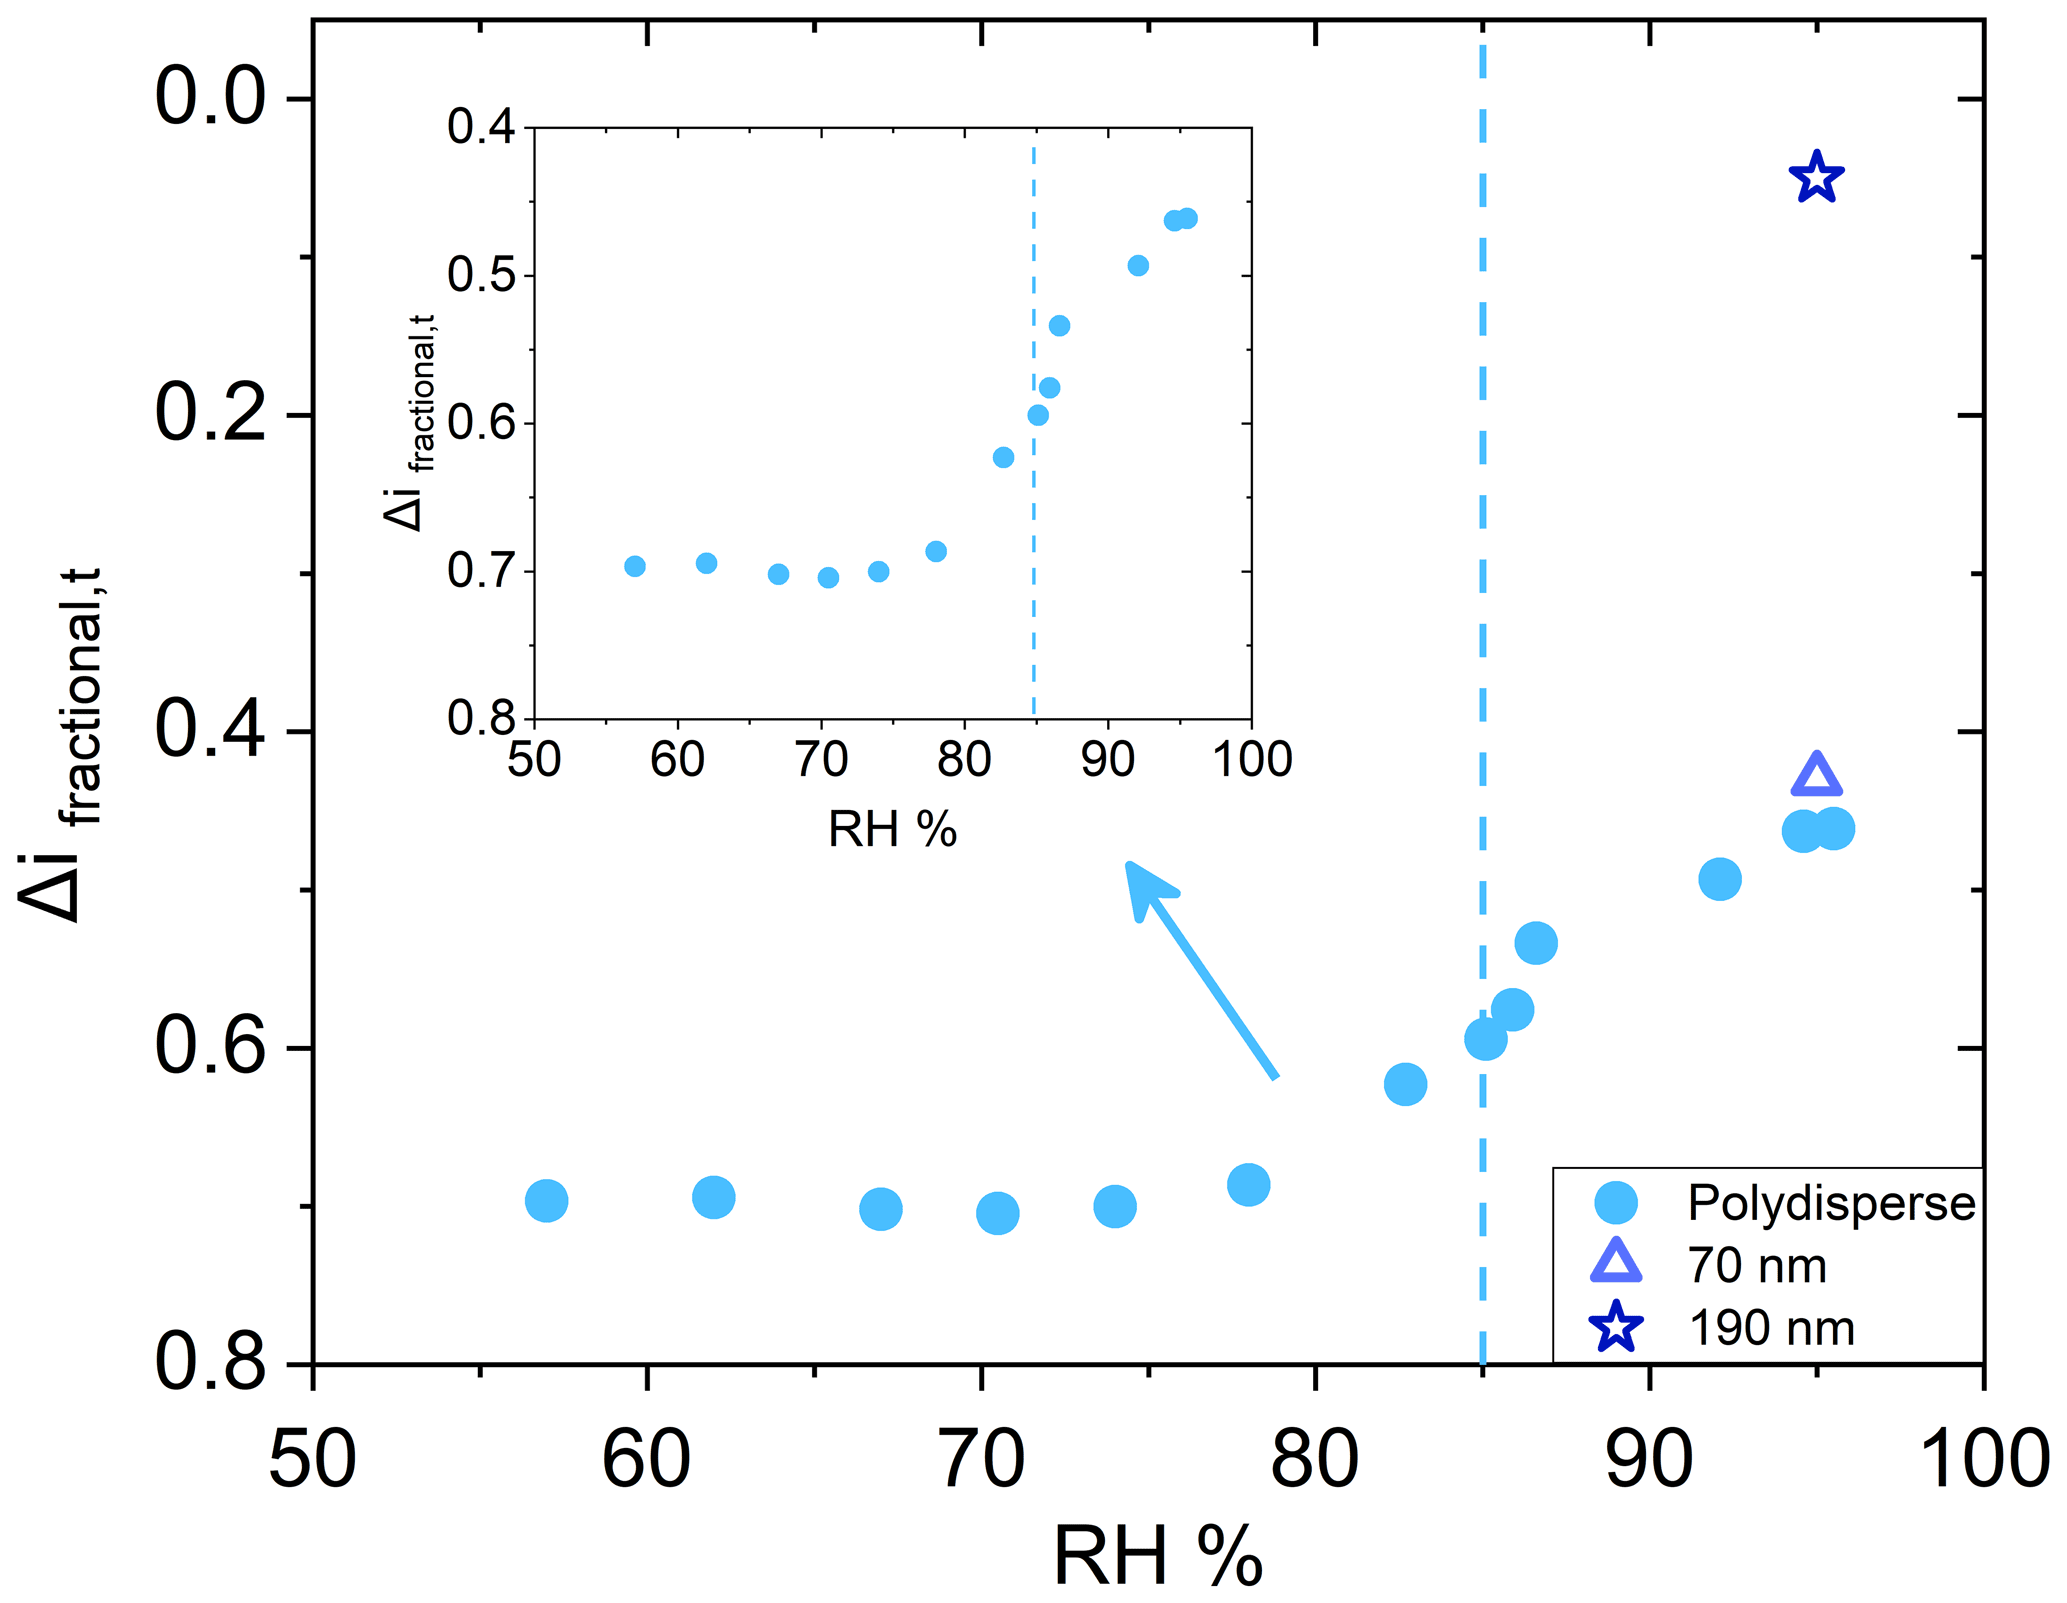
Figure 4Deliquescence relative humidity curve for polydisperse (initial dry number GMD = 65 nm, geometric standard deviation 1.7) sucrose (•). Dashed line indicates literature value for deliquescence. Inset for polydisperse sucrose shown for clarity. Particle bounce for monodisperse 70 nm (Δ) and 190 nm (![]() ) (both initial dry diameter) AS at 95 % chamber RH also shown.
) (both initial dry diameter) AS at 95 % chamber RH also shown.
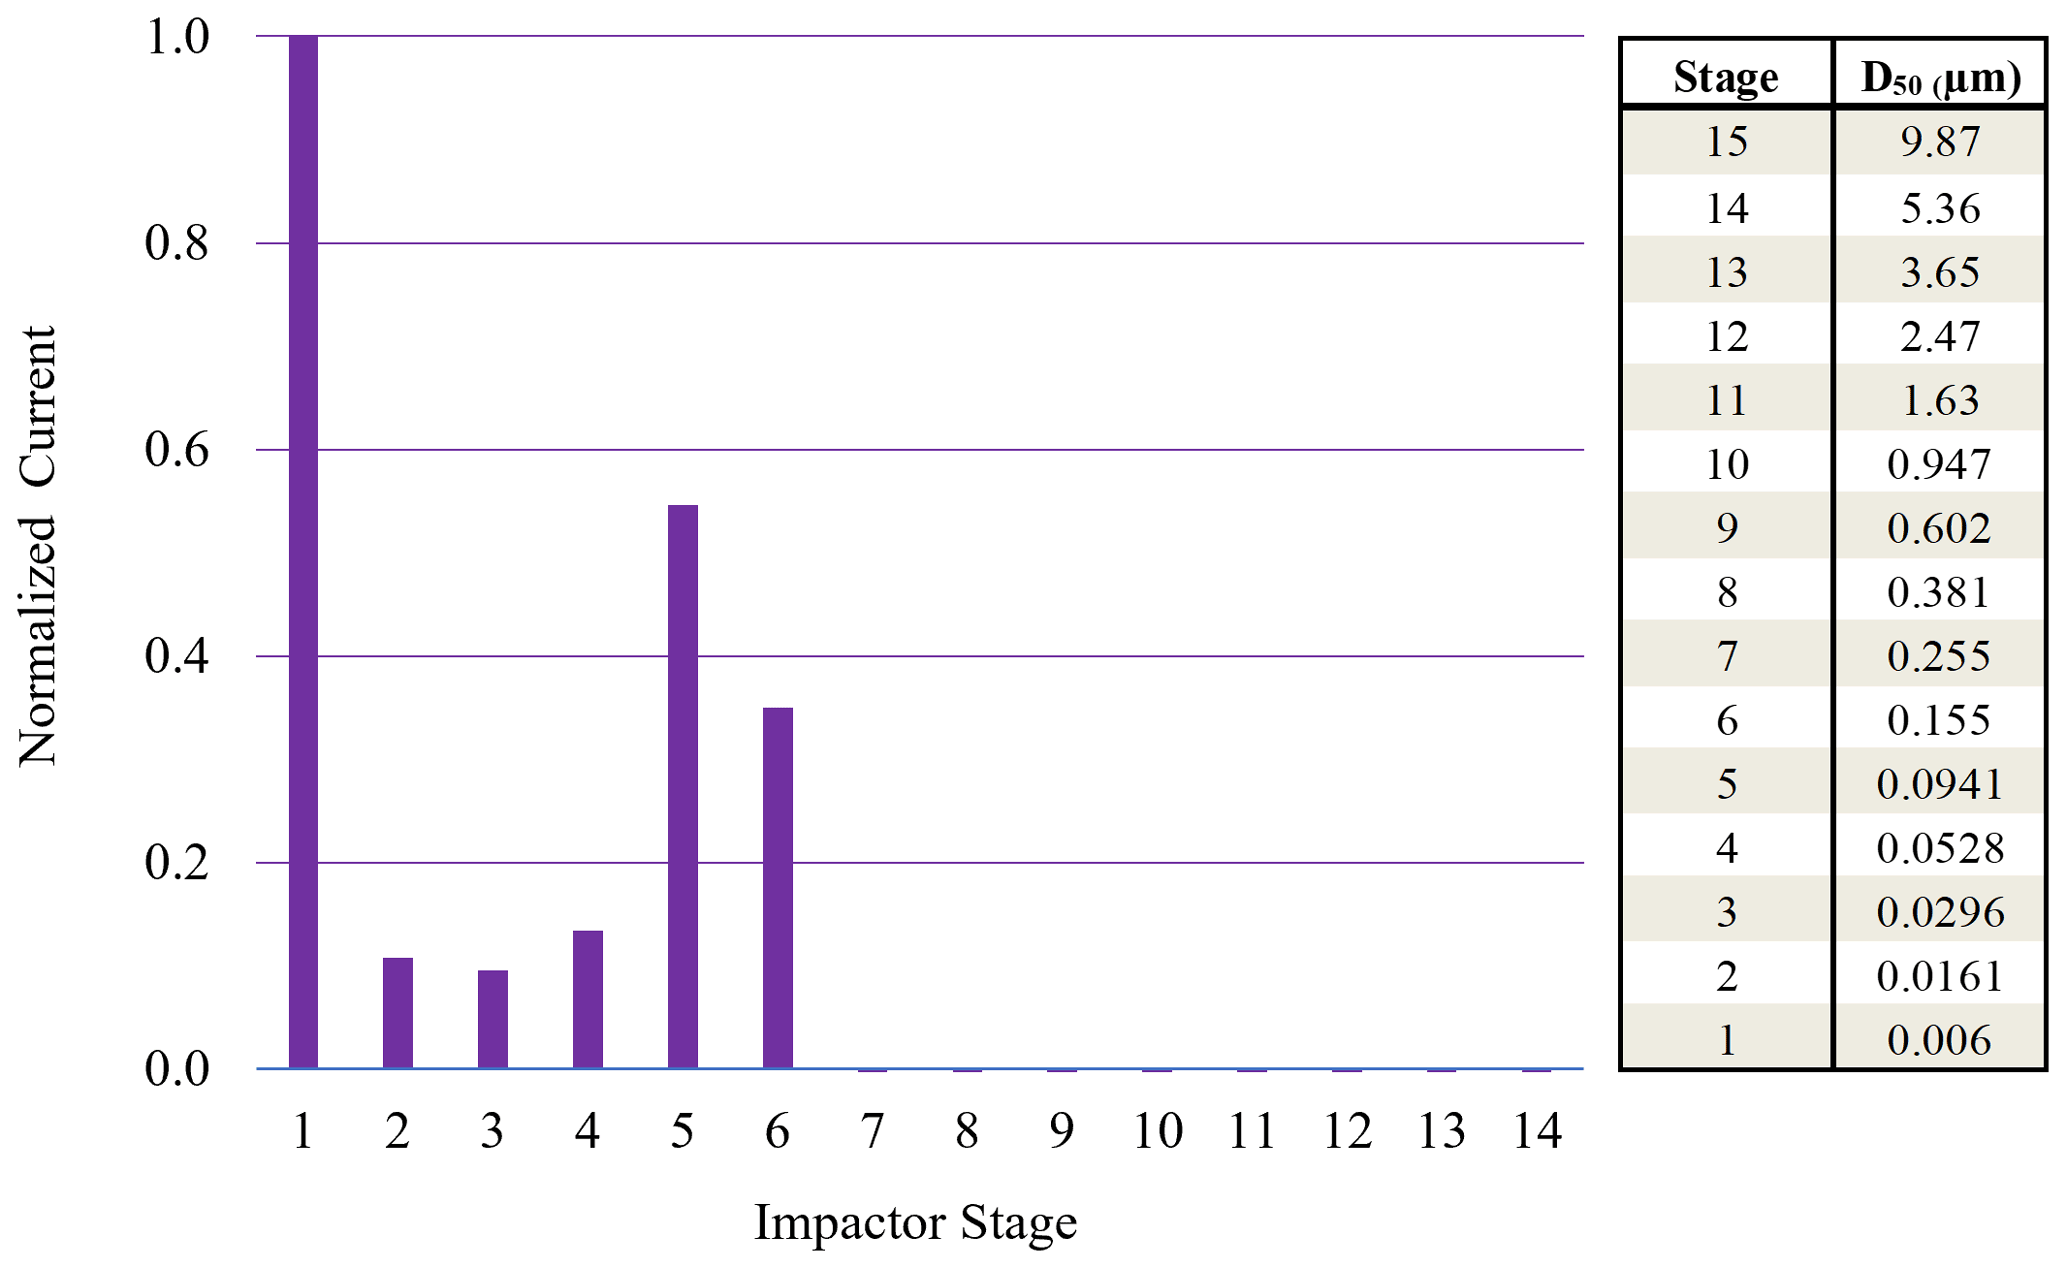
Figure 5Normalized ELPI current values observed for each impaction stage for 70 nm (initial dry diameter) sucrose particles sampled from 95 % chamber RH. High stage 1 current indicative of particle bounce.
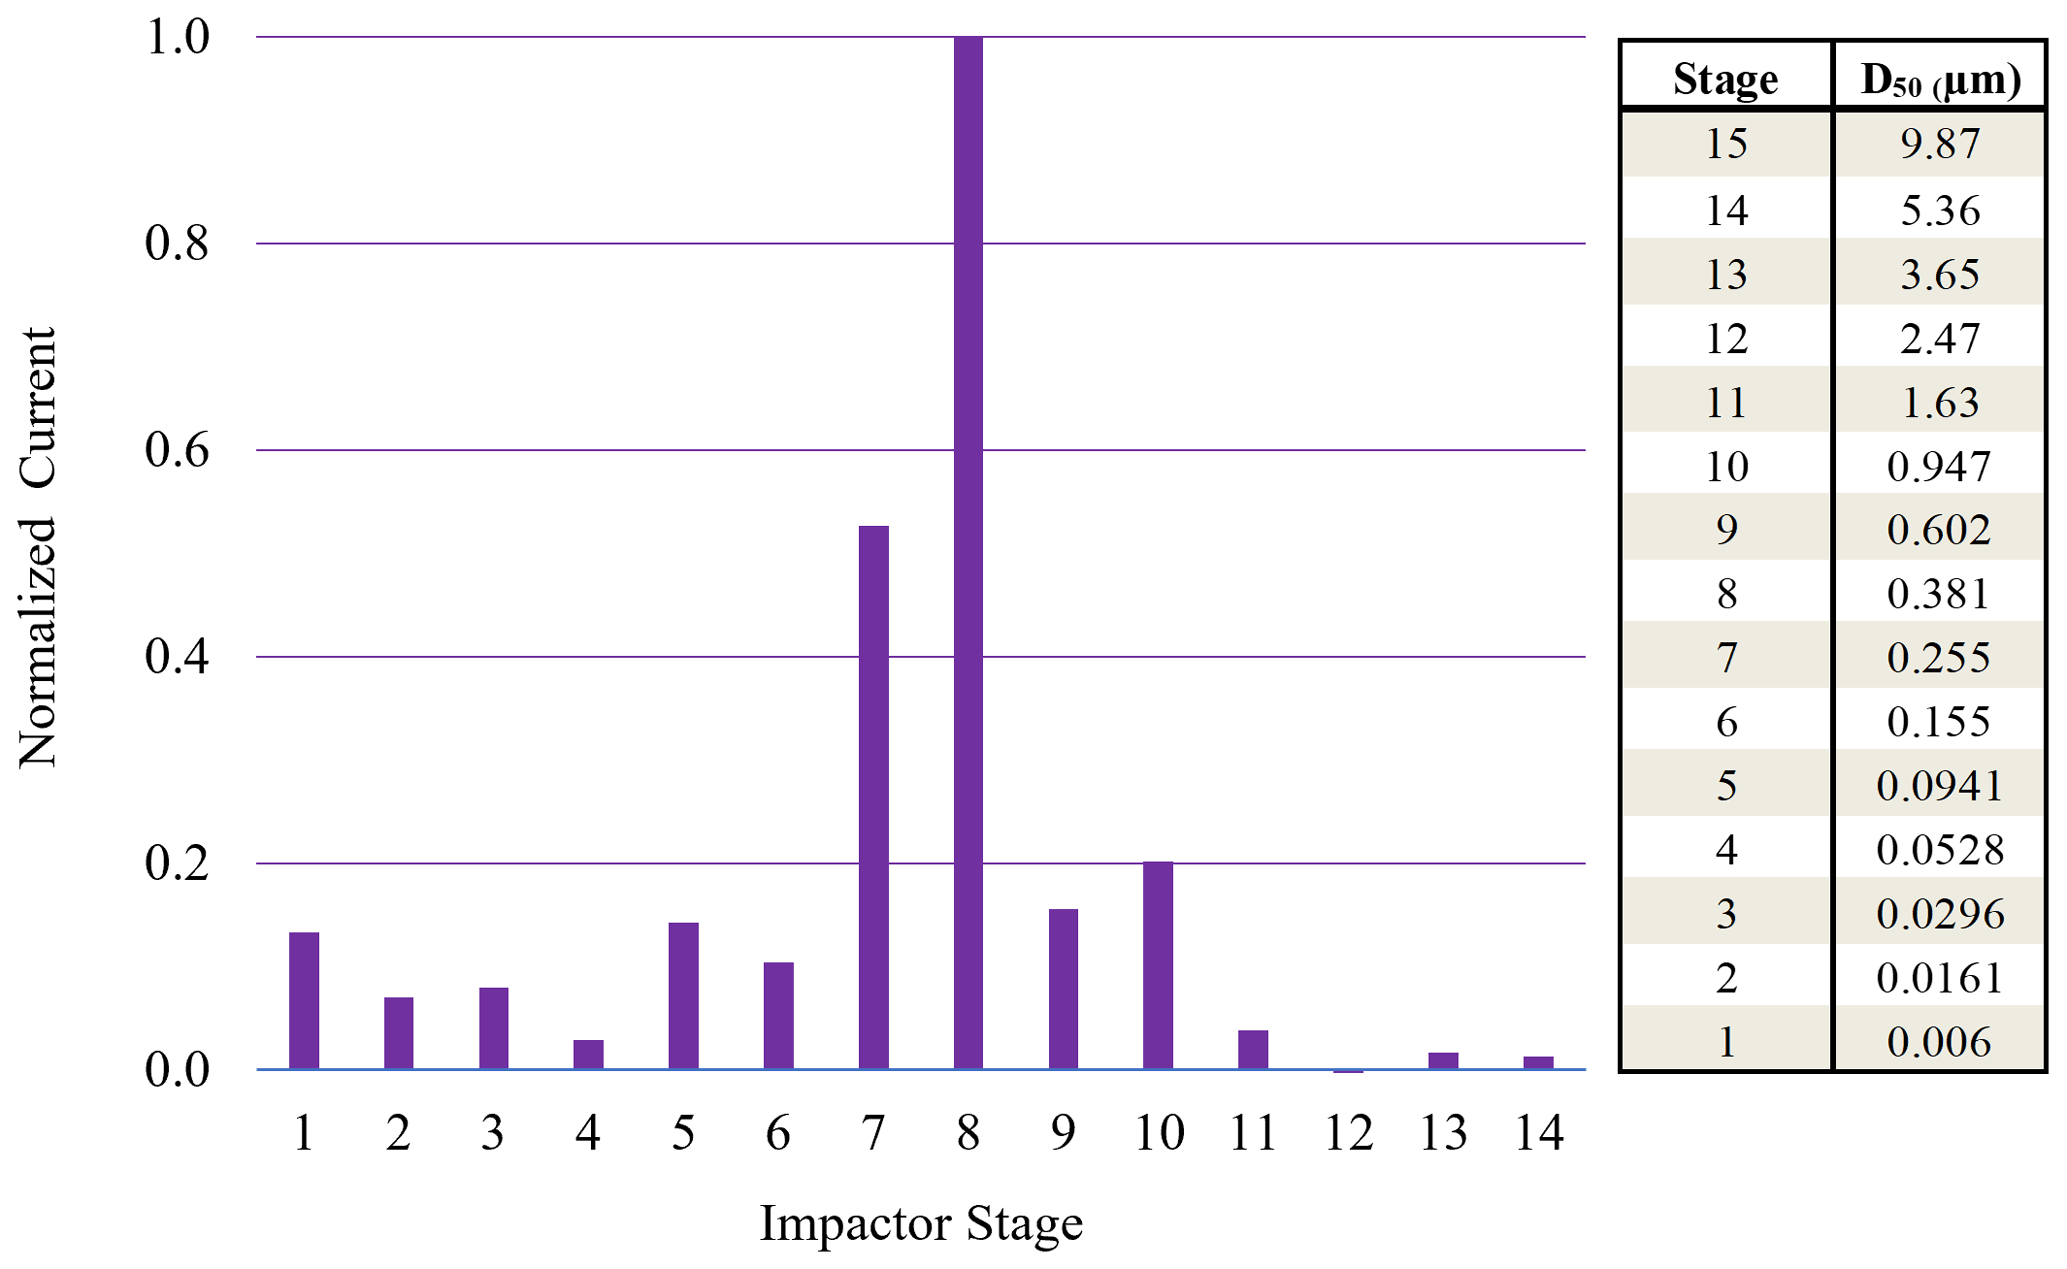
Figure 6Normalized ELPI current values observed for each impaction stage for 190 nm (initial dry diameter) sucrose particles sampled from 95 % chamber RH.
Monodisperse sucrose aerosol (70 and 190 nm, initial dry diameter) was generated and subjected to 95 % RH (Fig. 4), well beyond the reported DRH. Due to the inherently lower concentrations of monodisperse sucrose aerosol, a DRH curve was not possible. This monodisperse investigation revealed that Δifractional,t for 190 nm sucrose particles was very close to zero, indicating that particle bounce was almost entirely eliminated at chamber RH > DRH, in contrast to polydisperse (initial dry number GMD = 65 nm) and 70 nm (initial dry diameter) sucrose aerosol. To verify which ELPI impaction stages were impacted by sucrose particles for both the 70 and 190 nm experiments, currents generated over the course of 6 min by each impaction stage were examined. Average currents from each stage were normalized to allow for easy comparison (Figs. 5 and 6). For the 70 nm (initial dry diameter) sucrose particles (Fig. 5), stage 1 (filter stage) recorded the highest current, followed by stages 5 and 6. The high stage 1 current is indicative of particle bounce, indicating sucrose particles from higher impaction stages proceeded to bounce following contact with their intended impaction stage. Examining the impaction stage RH for stages 5 and 6 (Table 2) shows a maximum of 68 % RH for stage 6 and a maximum of 38 % RH for stage 5, assuming 100 % chamber RH. Thus, it stands to reason that 70 nm (initial dry diameter) sucrose particles took on water in the humid (95 % RH) chamber, then proceeded to travel through the ELPI, and were able to dry sufficiently in the vicinity of stage 5 to subsequently engage in particle bounce. Hence, Δifractional,t was observed to remain above zero (0.45) even at high chamber RH.
On the other hand, ELPI current data for the 190 nm (initial dry diameter) sucrose aerosol (Fig. 6) indicate minimal current recorded on stage 1, with most current recorded on stages 7 and 8. These stages have a maximum RH of 88 % and 96 %, respectively, which is above the DRH. Therefore, the larger 190 nm (initial dry diameter) particles, which have grown in the high-chamber-RH environment, impact on stages with higher RH closer to that of the chamber and upstream RH. At these higher impaction stage RHs, the sucrose aerosol did not dry prior to impaction, and a Δifractional,t close to zero was observed (0.05) at high chamber RH.
3.3 α-Pinene-derived secondary organic aerosol
Similar observations were made for polydisperse α-pinene-derived SOA at CSOA ranging from 5 to 2420 µg m−3 (Fig. 7). A typical particle size distribution for experiment E is shown in Fig. S5 in the Supplement. Here, Δifractional,t never reached 0 under any conditions studied, even at chamber RH close to 100 %. SMPS measurements indicate that the dry particle size distribution stayed well above the D50 diameter (6.0 nm) of the filter stage (stage 1), indicating that particles were reaching the filter stage only as a result of particle bounce and not due to their aerodynamic diameter. Partial drying of the SOA due to decreased impactor RH under lower pressure likely caused an incomplete shutdown of α-pinene-derived SOA bounce. Incomplete shutdown of α-pinene-derived SOA bounce at high RH is in accord with other investigators who utilized an impactor setup that featured a drop in RH due to low pressures (Kidd et al., 2014; Saukko et al., 2012b, 2015; Slade et al., 2019). Reports that focused on either mobility selected aerosol (monodisperse SOA) (Pajunoja et al., 2015; Bateman et al., 2014) or on single, relatively large D50 impactors without a pressure drop show that α-pinene-derived SOA ceases to bounce at high RH. For example, Bateman et al. (2015) reported on polydisperse measurements, though these were limited to particle sizes greater than the D50 of their β-impactor (∼ 278 nm).
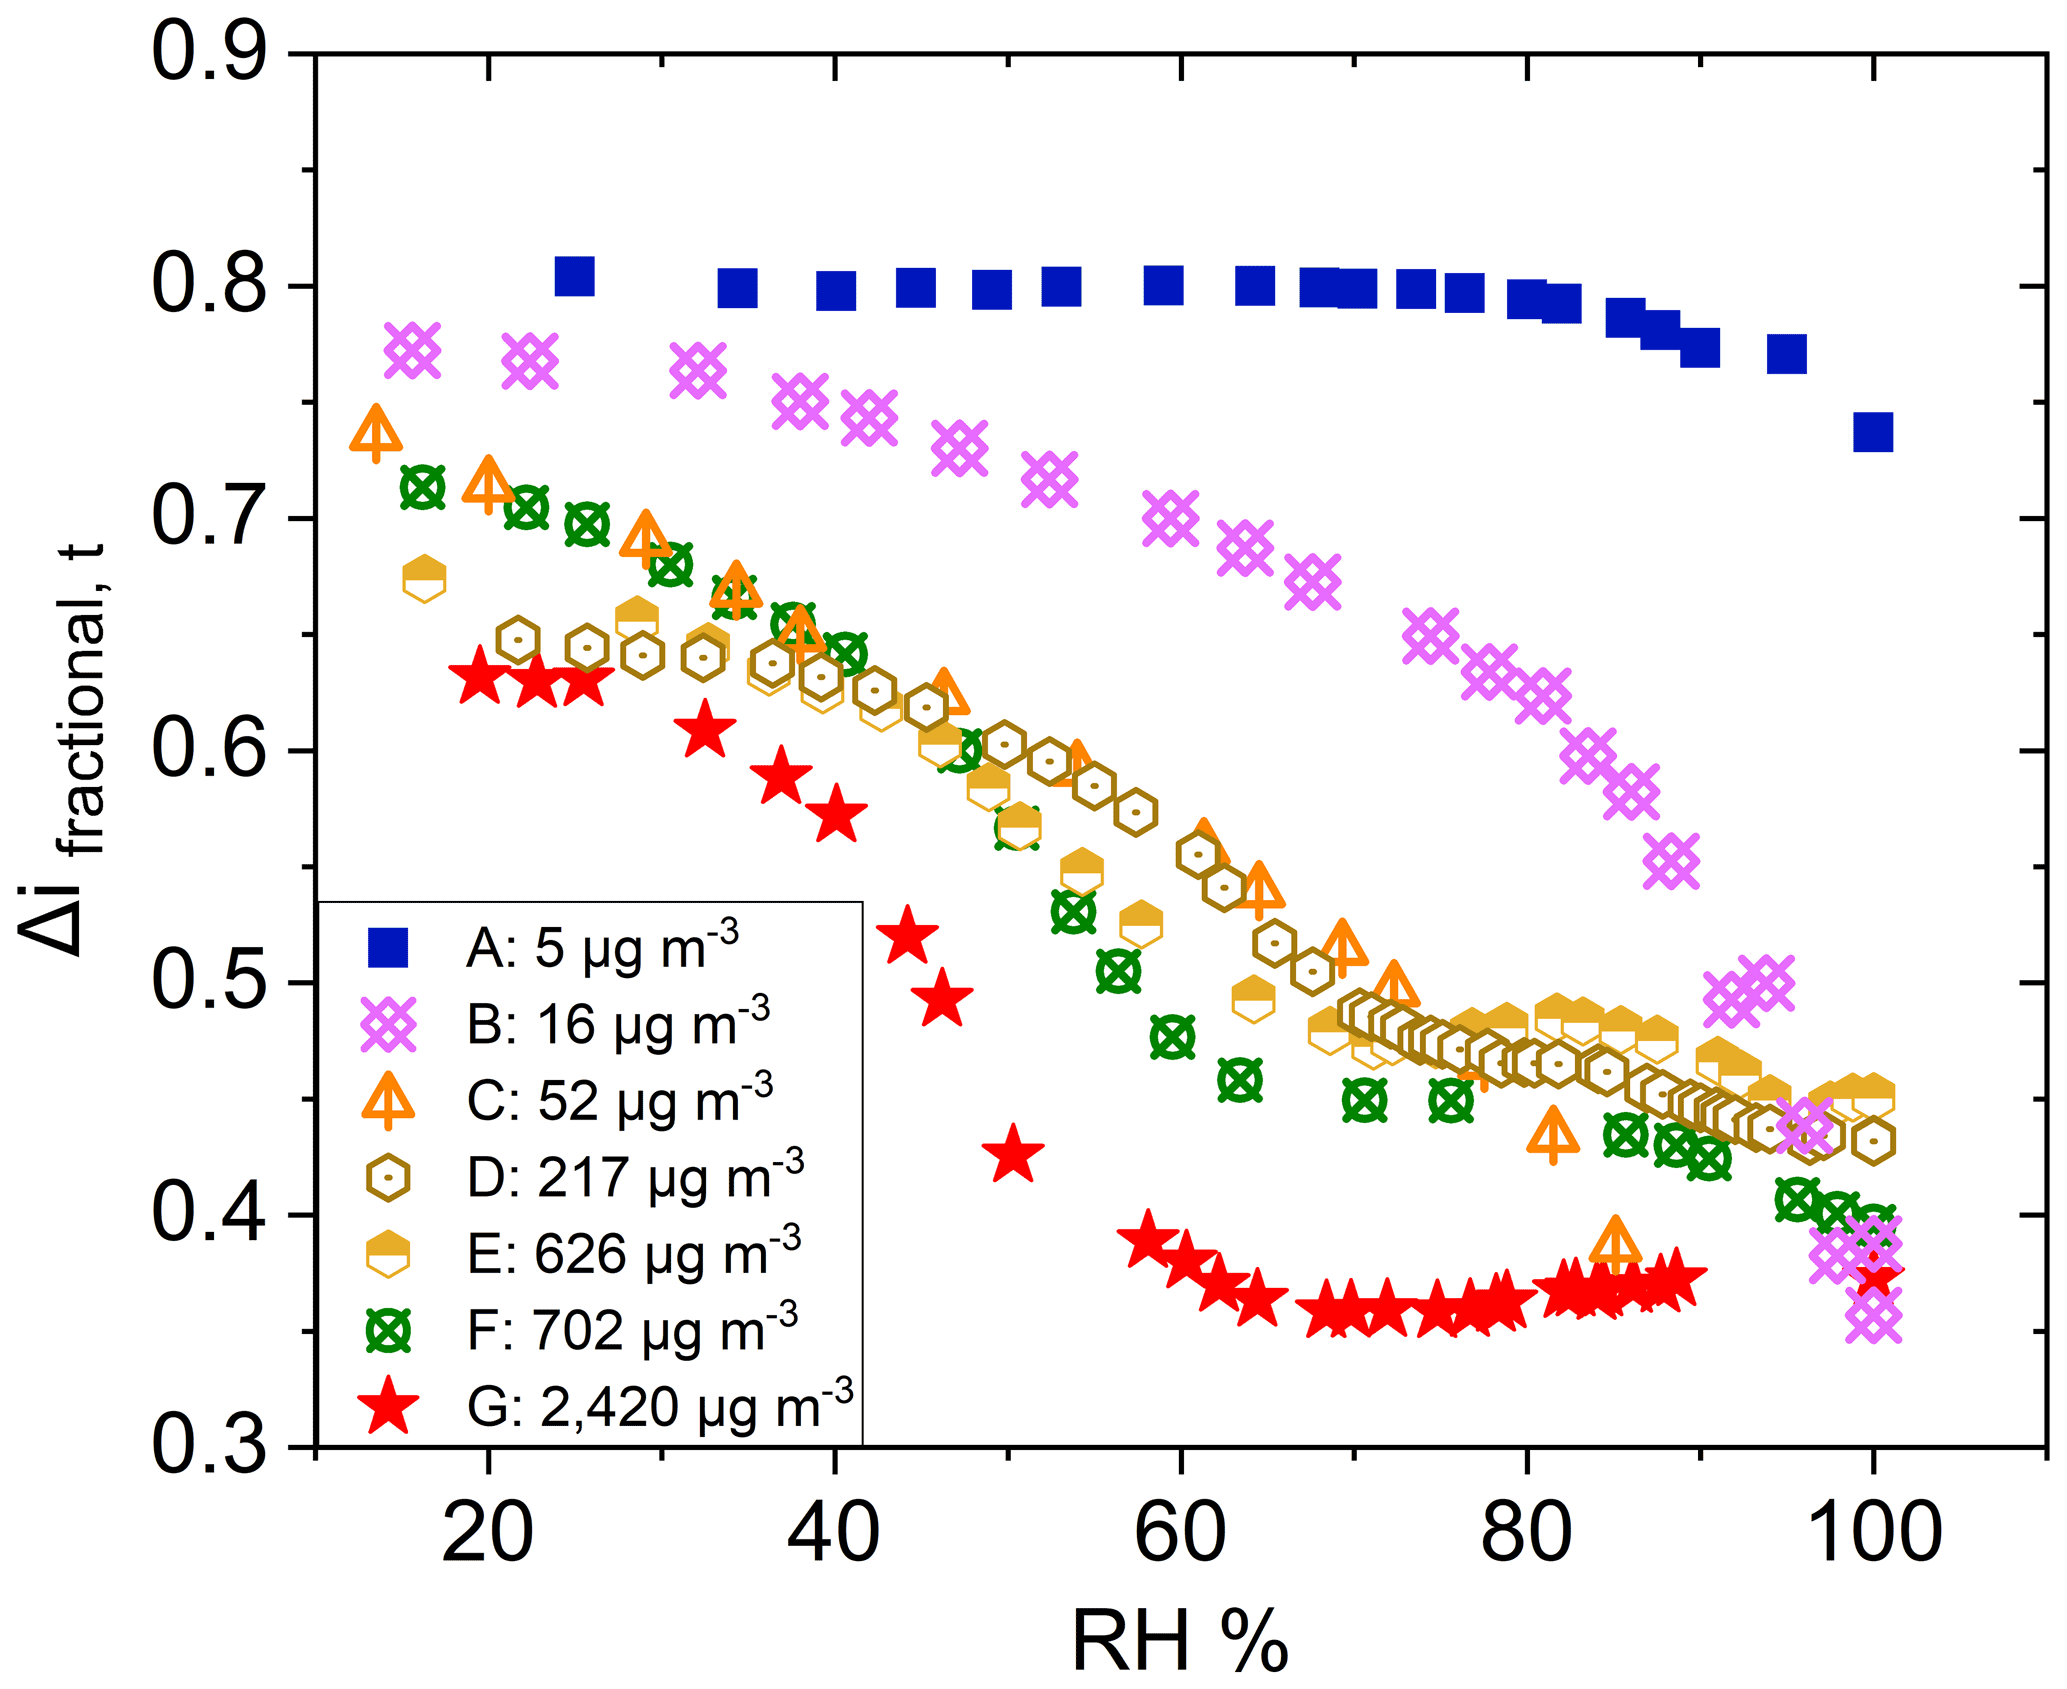
Figure 7Δifractional,t for α-pinene-derived SOA at various CSOA, from 5 to 2420 µg m−3, as a function of chamber RH.
SOAs derived from α-pinene and other VOC precursors do not exhibit clear deliquescence and efflorescence steps or hysteresis due to their amorphous character (Saukko et al., 2015). Still, further investigating the approximate inflection point RH of each α-pinene-derived SOA experimental run (Fig. 8) and graphing it as a function of the respective CSOA and GMD values yields a clear dependence of both CSOA and GMD on the Δifractional,t inflection point RH (Fig. 8; same color scheme used as Fig. 7). The approximate inflection point RH serves as an indicator as to when a significant change in relative particle bounce was observed; though, as previously discussed, particle bounce was never eliminated for any α-pinene-derived SOA runs.
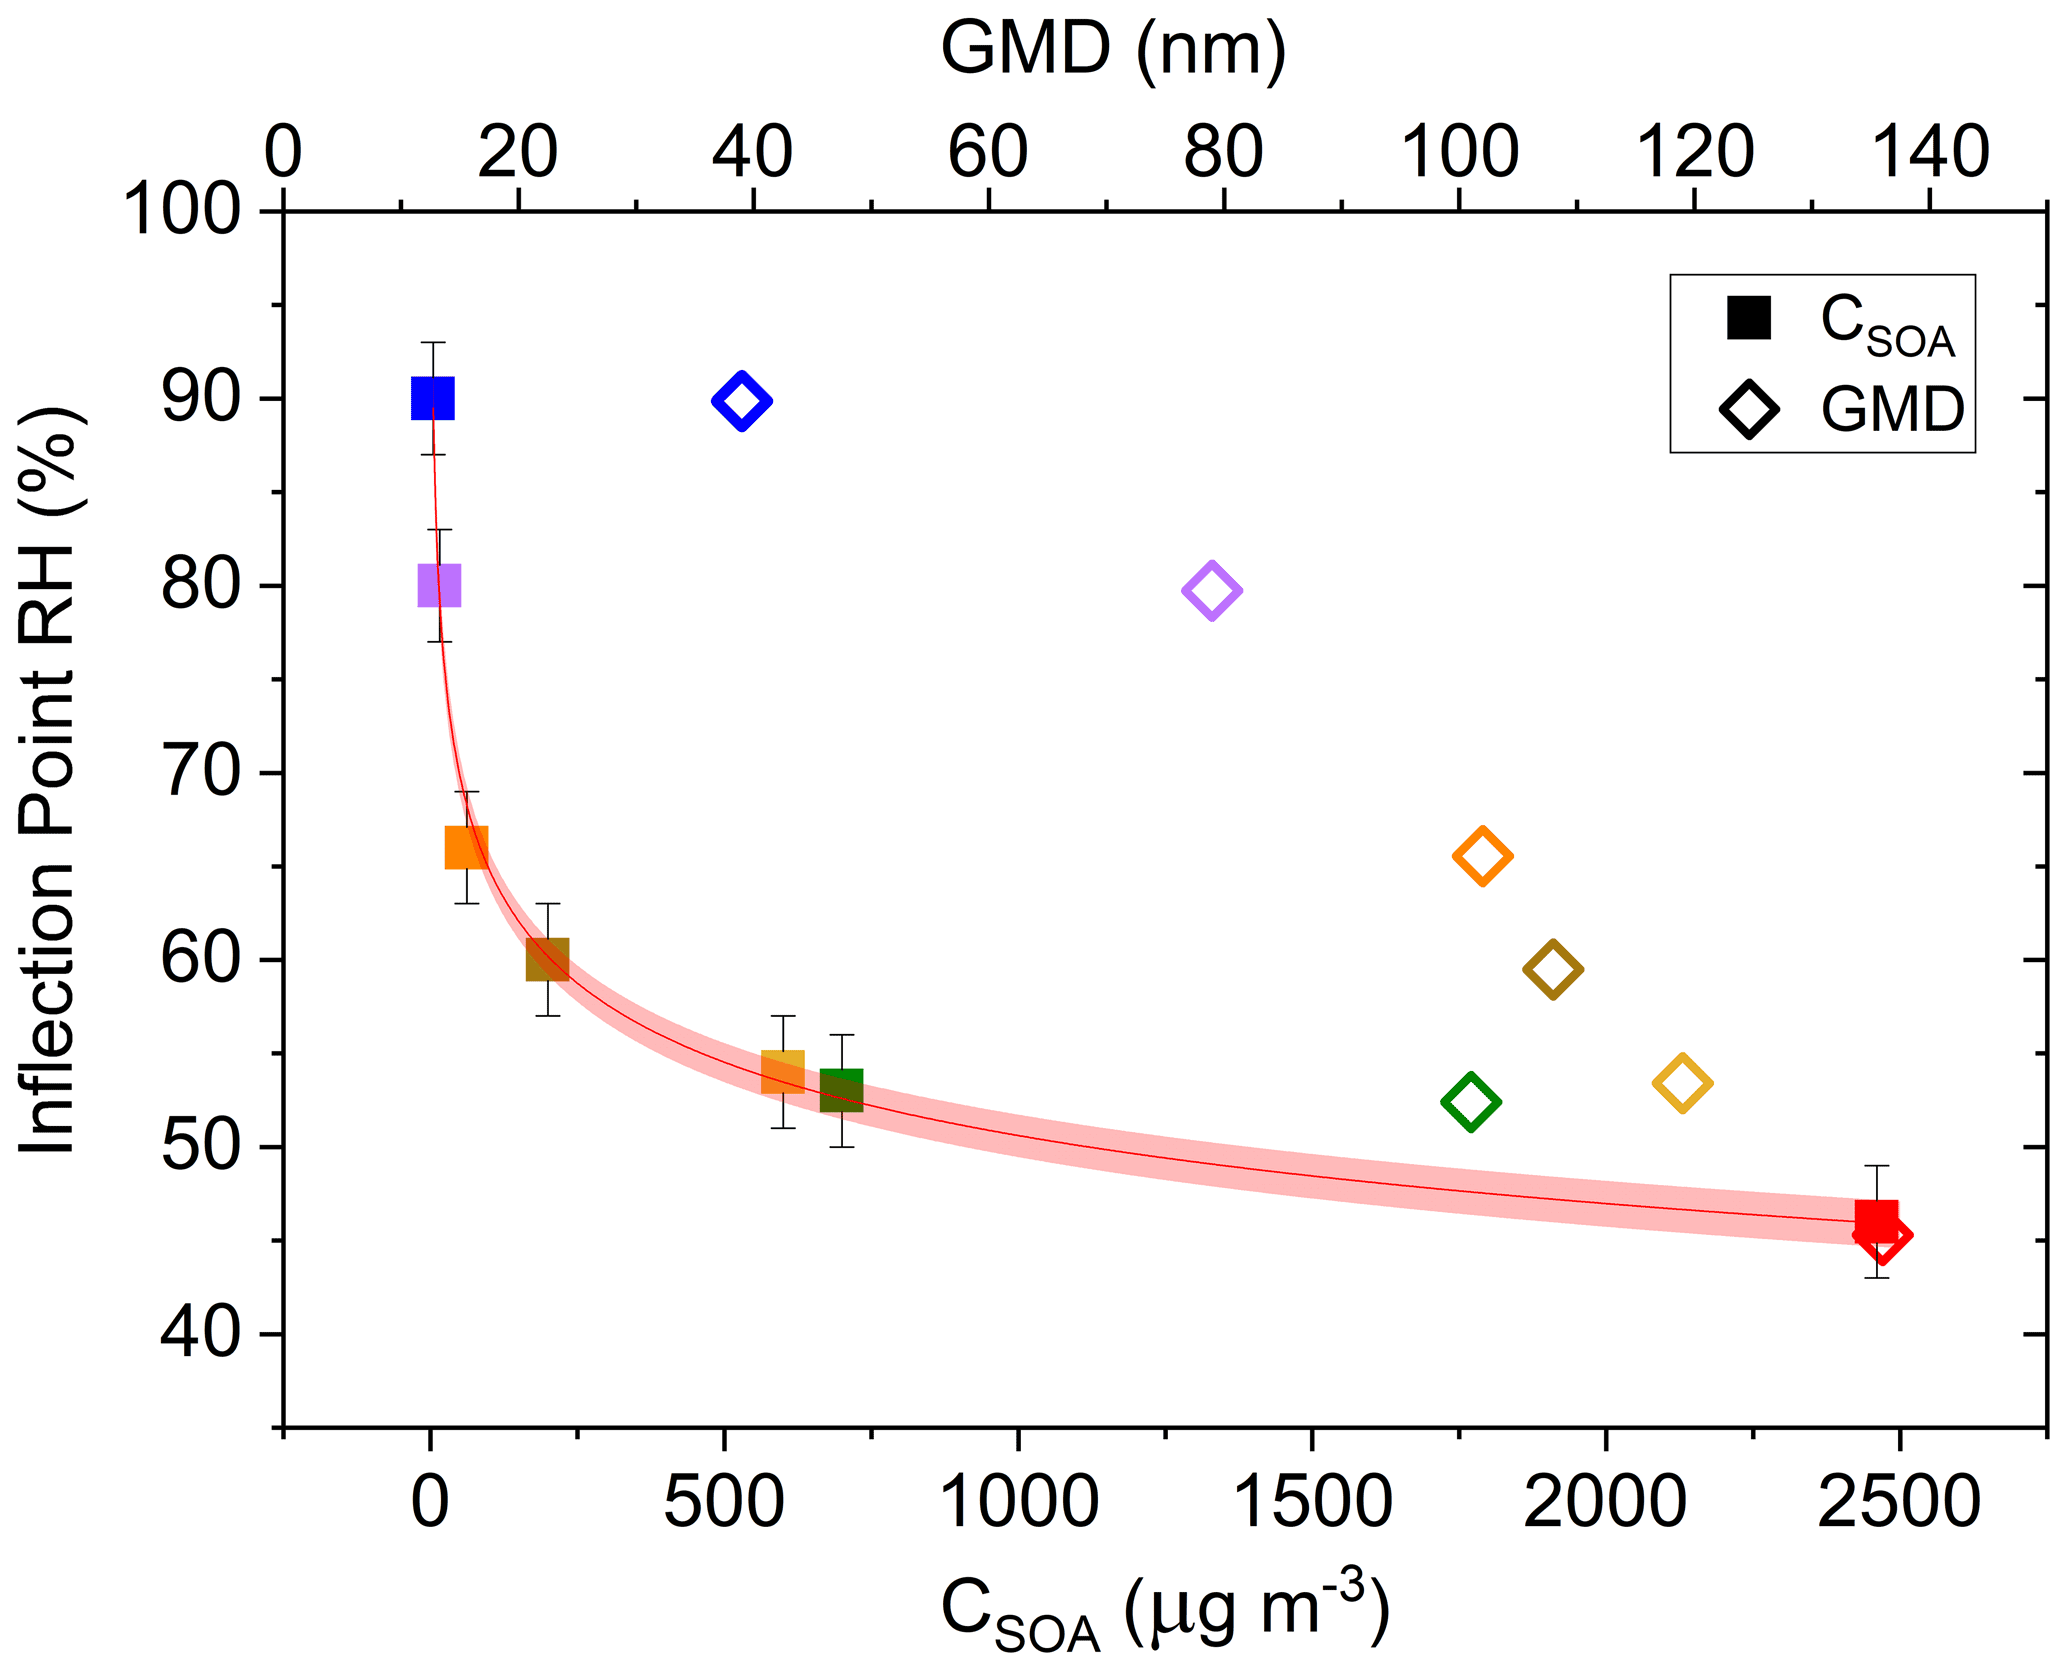
Figure 8Δifractional,t inflection point RH (%) as a function of SOA mass loading (CSOA; µg m−3) (▪) and number geometric mean diameter (GMD; dry diameter; nm) (◇) of SOA distribution. Both CSOA and GMD observed immediately prior to start of humidification. Error bars represent ± 3 %, and the red band indicates the 95 % confidence band. Color scheme matches Fig. 7.
The apparent CSOA and GMD trends (Fig. 8) can be explained by examining ELPI current values for all experimental runs (A–G) at the approximate Δifractional,t inflection point RH (Fig. 9; same color scheme as Fig. 7). Here, the current values of each impactor stage at the approximate inflection point RH are shown for each experimental run. Due to persistence of particle bounce, stage 1 (filter stage) exhibited the highest relative current. Ignoring stage 1 and examining the stage with the next highest relative current is indicative of which stage α-pinene-derived SOAs are initially impacting on (which is dependent on CSOA and GMD). This initial impaction stage also corresponds to a specific aerodynamic D50 diameter and impactor RH (Table 2). With the exception of A (which maintained a relatively constant Δifractional,t even at < 90 % RH), the inflection point RH (which references chamber RH) for each experimental run corresponded to an impactor RH of 37 %–44 %. Therefore, the inflection point RH and the associated drop in Δifractional,t observed for each experimental run occurred when the initial impactor stage RH reached 37 %–44 %, regardless of CSOA and chamber RH. As chamber RH continued to increase, Δifractional,t decreased until it became constant (at 0.35–0.45), at which point the relevant initial impactor stage RH began to reach its maximum RH (Table 2). With an impactor stage RH significantly below the chamber RH, SOA was likely able to dry, leading to a persistence of particle bounce (represented by the Δifractional,t of 0.35–0.45). Experiment A, with its low CSOA and an initial dry GMD of 39 nm, consisted of particles impacting on stage 4, which has a maximum impactor RH of 22 %. As a result, drying was likely more pronounced, and Δifractional,t remained much higher compared to the other experimental runs. As a consequence, reliable particle bounce measurements for α-pinene-derived SOA at atmospherically relevant CSOA (5 µg m−3 initial dry CSOA) and size distributions (GMD = 39 nm initial dry) and greater, sampled from high chamber RH, are not possible with this ELPI setup.
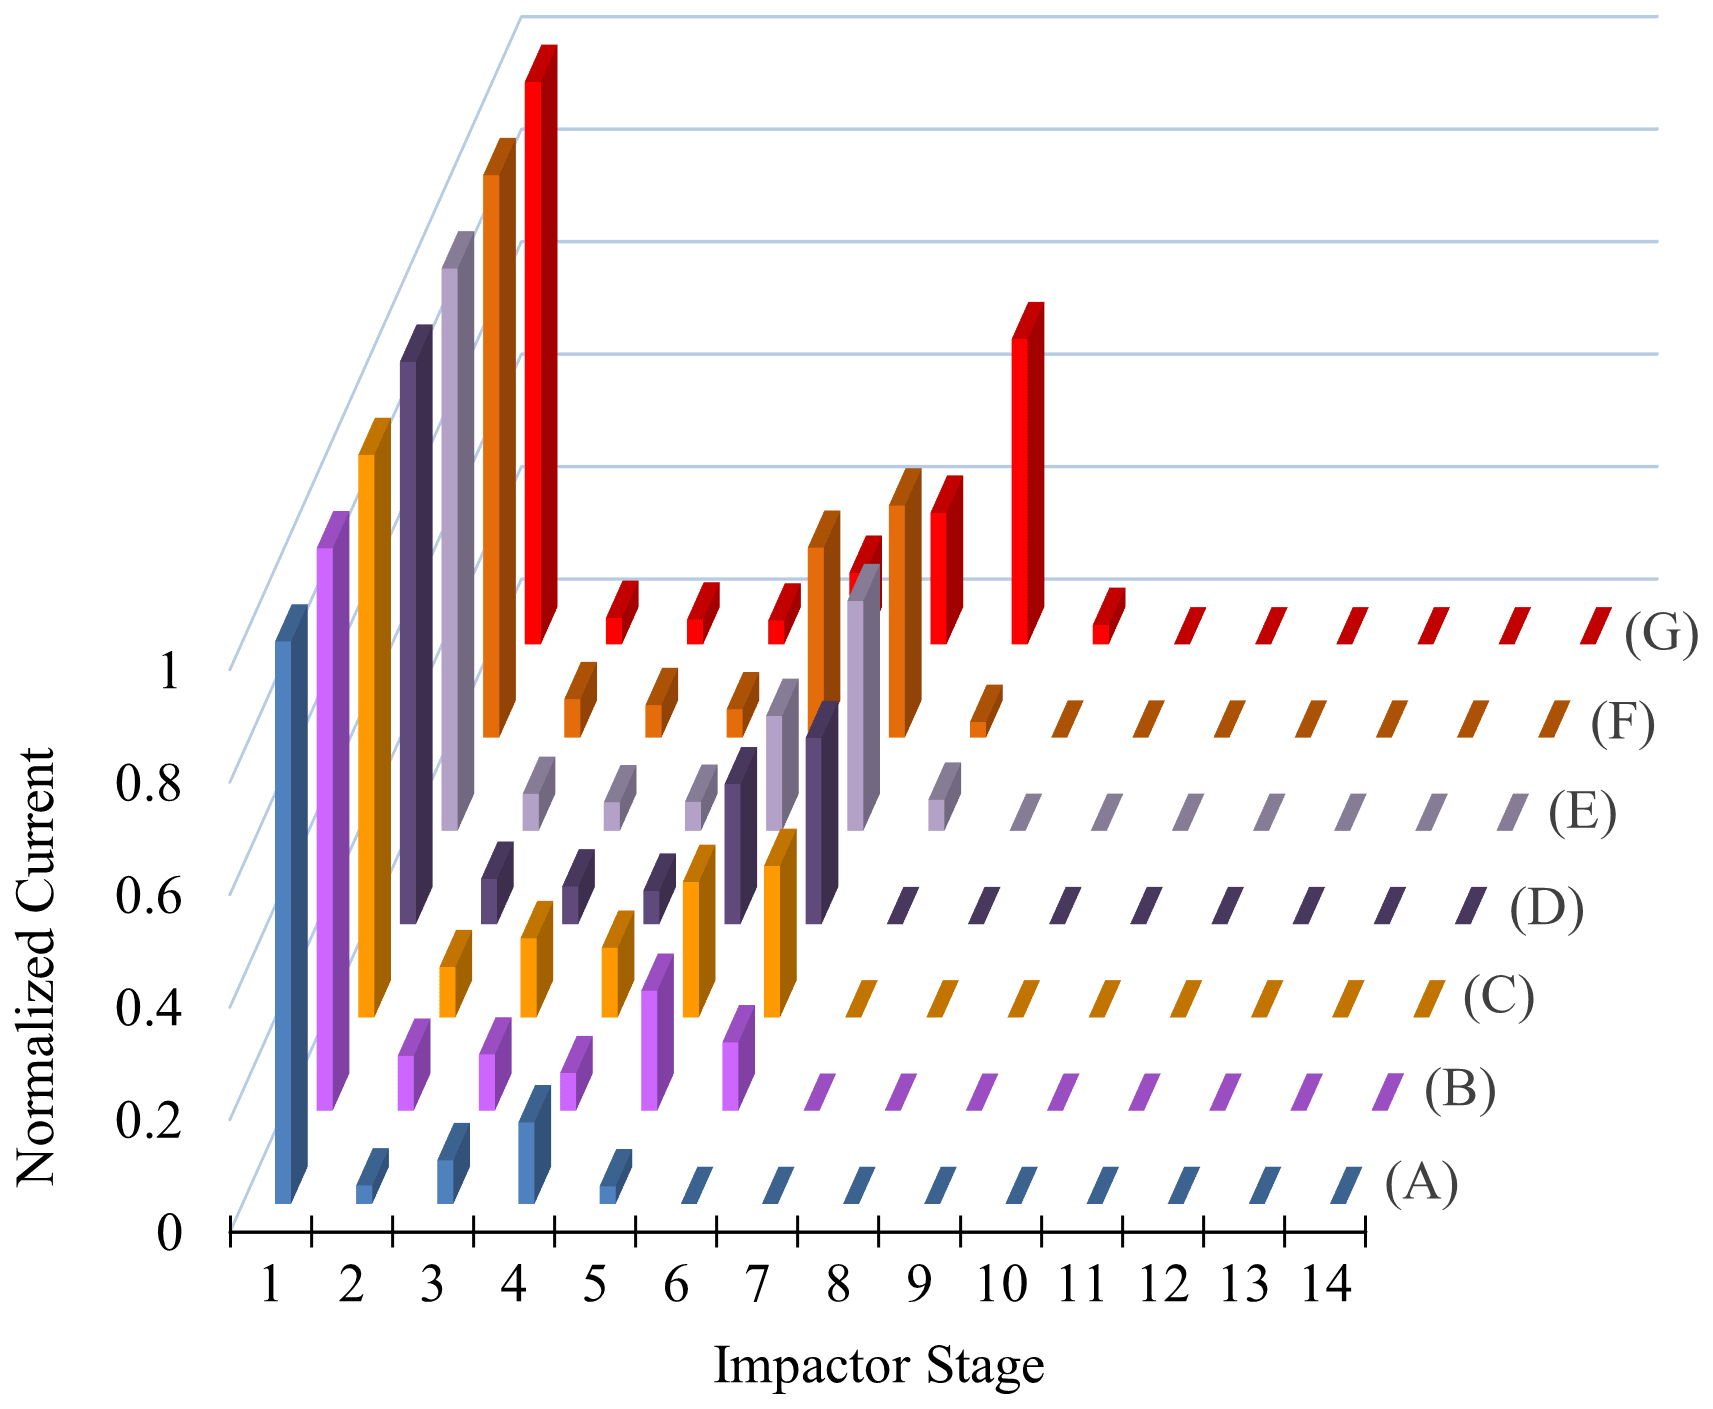
Figure 9Normalized ELPI current values observed for each impactor stage, for each α-pinene-derived SOA experiment (A–G) at the approximate Δifractional,t inflection point RH. Stage 1 remained highest due to persistence of particle bounce. Color scheme matches Fig. 7.
3.4 Aerosol Kelvin effect
Measurements presented here also include particle sizes where the Kelvin effect (increased equilibrium vapor pressure above a curved surface relative to a flat surface) may be significant in delaying water condensation onto the smaller particles. The Kelvin effect increases in importance as particle diameter decreases (Saxena et al., 1986), especially below approximately 50 nm (Park and Lee, 2000). This may be of special importance for low CSOA (approximately 5 µg m−3 based on α-pinene-derived SOA results herein) situations, where the dry number GMD was approximately 39 nm. This implies a large share of particles at diameters expected to be significantly impacted by the Kelvin effect. A more appropriate review therefore could be made for the higher CSOA, where GMD was above 150 nm. However, even for the case of the highest CSOA studied here (2420 µg m−3), there was no appreciable particle concentration (< 2 % of total particle number density) below a diameter of 50 nm. Therefore, the persistence of bounce cannot be attributed to the Kelvin effect. Furthermore, no correlation between minimum Δifractional,t achieved and percentage of the number concentration of particles below 100 nm was observed (Fig. 10). This is in agreement with the results of Pajunoja et al. (2015), who showed little difference in water uptake behavior between particles of 50 and 100 nm.
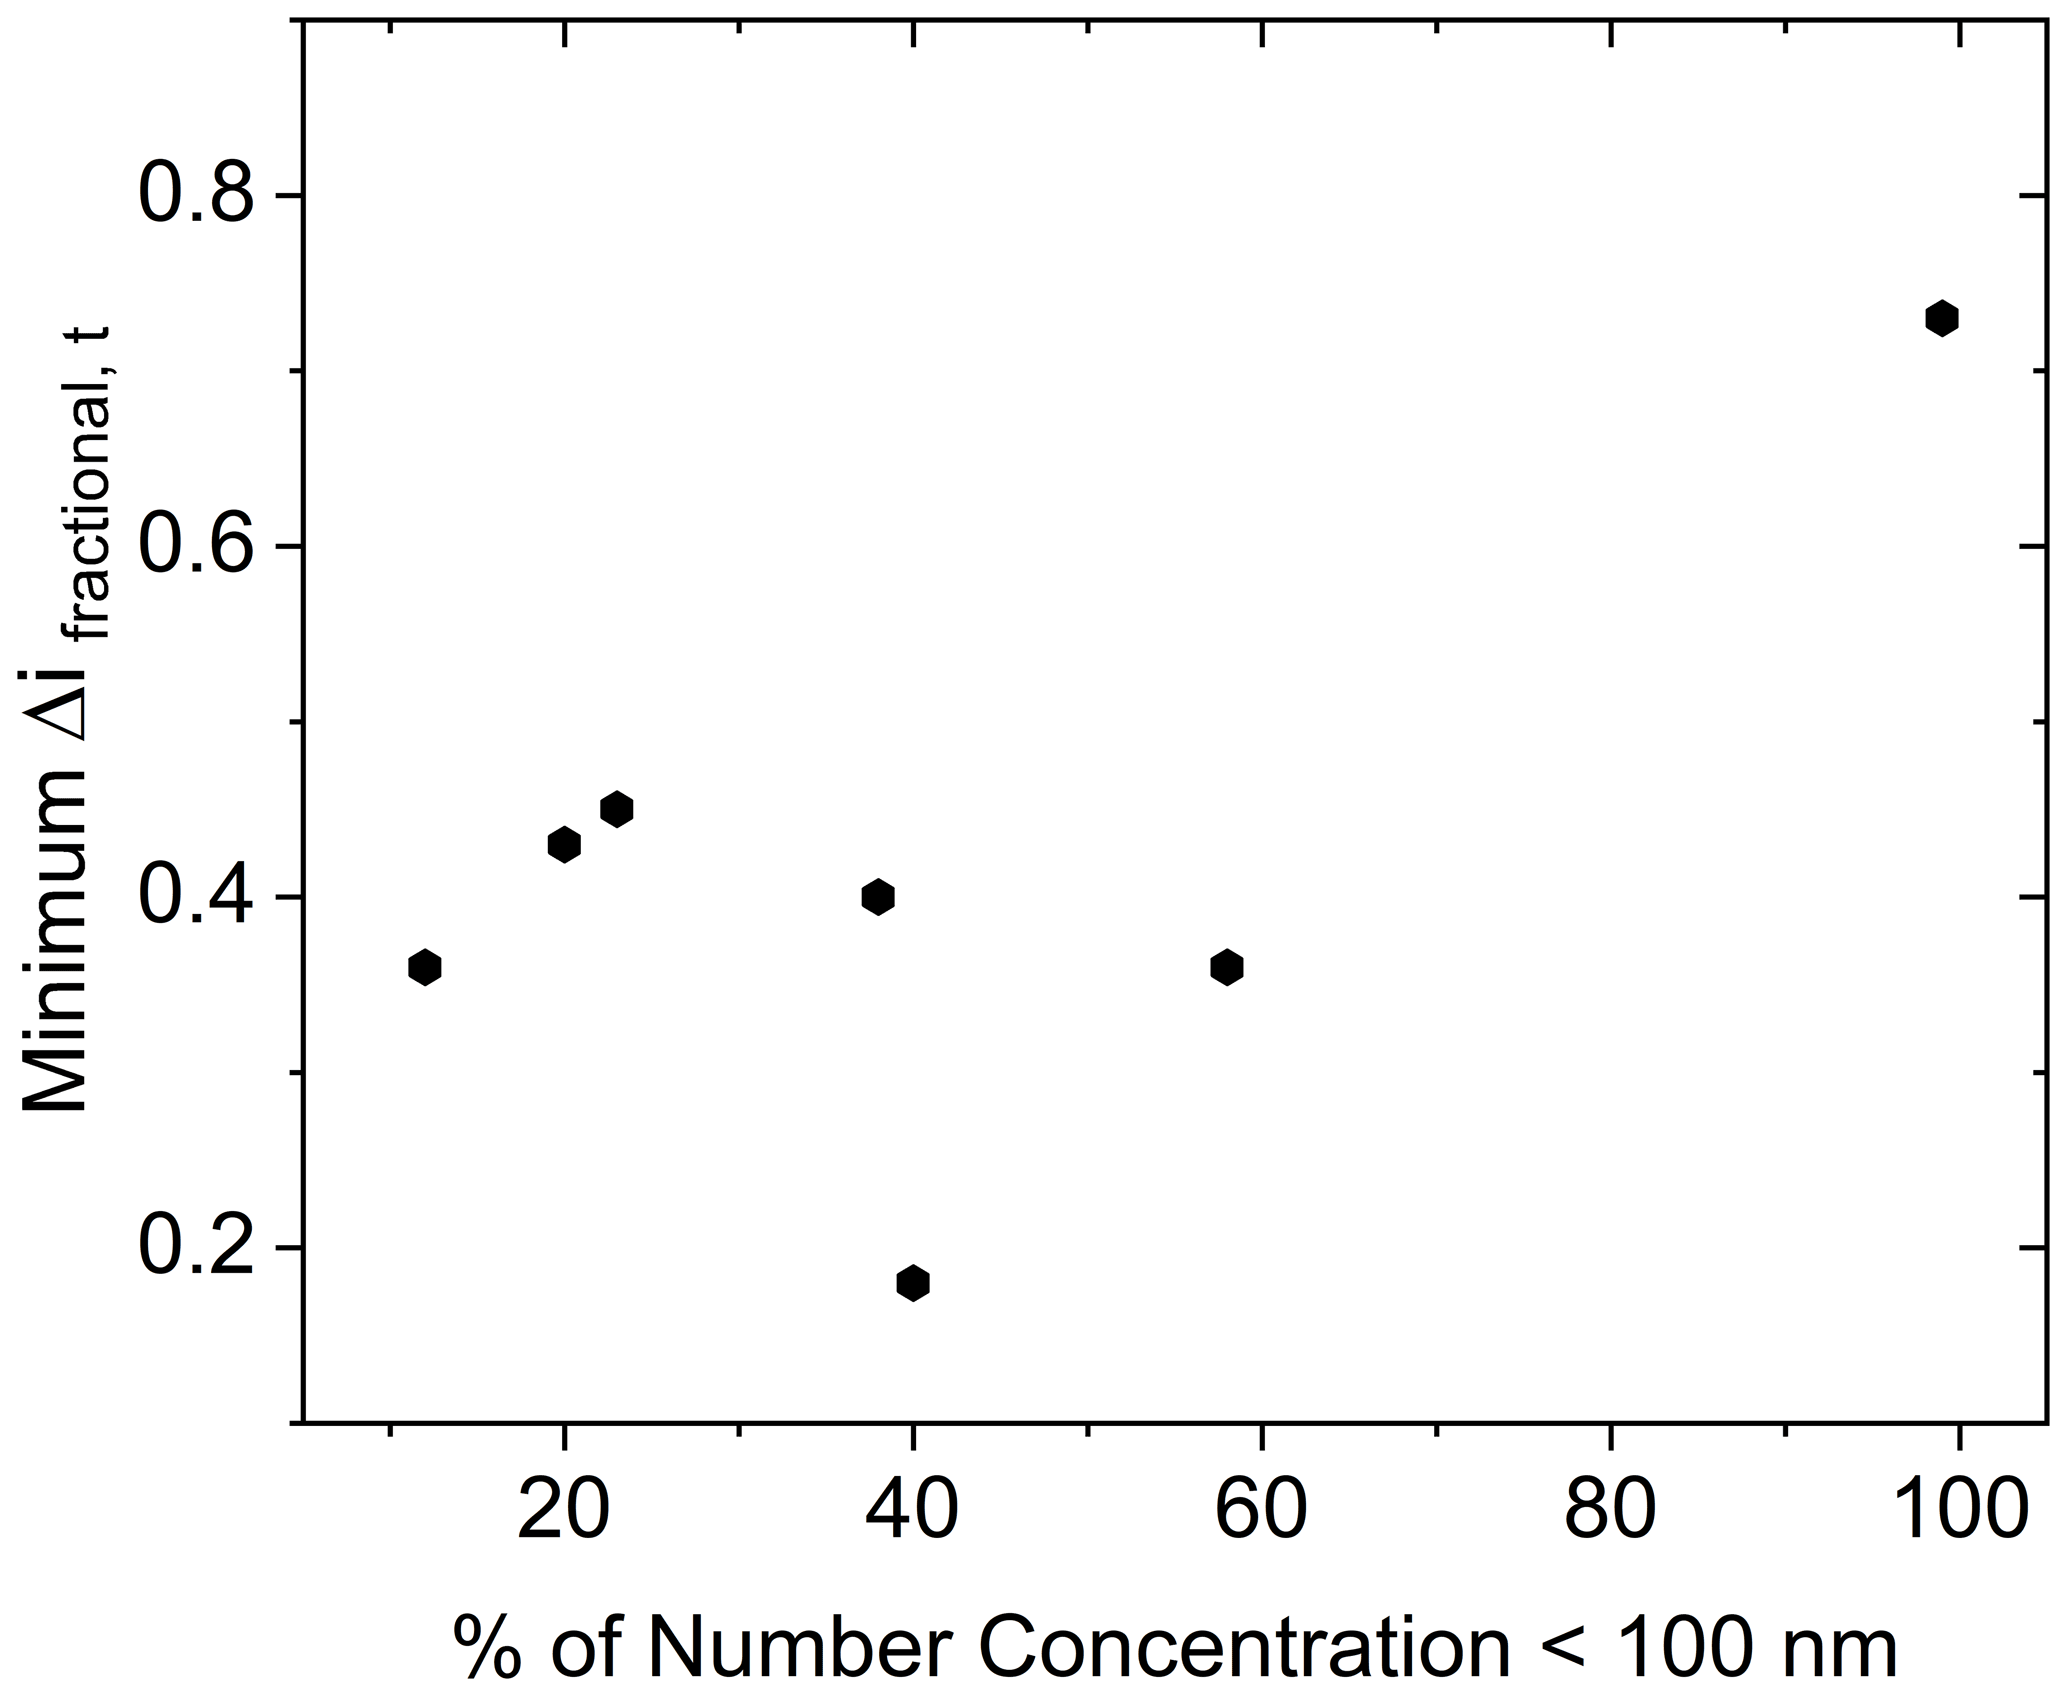
Figure 10Minimum Δifractional,t as a function of percentage of number concentration of particles (within a distribution) below 100 nm in aerodynamic diameter.
We demonstrate that technical specifications inherent in the current ELPI design, which relies on a set of cascade impactors with both decreasing downstream pressure and impaction stage RH, can prevent accurate particle bounce measurements for aerosol sampled from a high-RH (> 90 %) environment. Specifically, sucrose aerosol below 190 nm (initial dry diameter) and α-pinene-derived SOA populations of atmospheric relevant CSOA (5 µg m−3 initial dry CSOA) and size distributions (number GMD = 39 nm initial dry) and greater exhibited persistent particle bounce when sampled from a RH > 90 % Teflon reaction chamber. For AS aerosol, this limit was 70 nm (initial dry diameter). More generally, for sucrose aerosol and α-pinene-derived SOA, reliable particle bounce measurements cannot be made with the ELPI setup if the ERH or equivalent drying RH is above the initial impaction stage RH. The residence times within the lower impaction stages, where RH decreases, likely allowed for sufficient drying to occur to allow particle bounce to persist. For AS aerosol, this residence time is likely too short to allow for sufficient drying, which may be due to differing drying, evaporation, crystallization (if applicable), and nucleation processes. Varying aerosol drying kinetics, which are dependent on aerosol composition (Archer et al., 2020), likely contributed to the particle bounce results discussed here. A more in-depth understanding of these processes at the submicron scale for individual aerosol systems would aid in better understanding the reasons for the differing particle bounce behaviors observed for AS aerosol, sucrose aerosol, and α-pinene-derived SOA and permit developing corrections in order to be able to apply this revised bounce method. Thus, additional experimental work is needed to determine the viability and improve the accuracy of indirect measurements of water uptake of other atmospherically relevant aerosol populations.
Data are recorded in a proprietary format of the instrument manufacturer. Raw data are not available in a usable format by others.
The supplement related to this article is available online at: https://doi.org/10.5194/amt-14-7565-2021-supplement.
KBF and GAP designed experiments. KBF carried out experiments. KBF and GAP prepared the manuscript.
The contact author has declared that neither they nor their co-author has any competing interests.
Publisher's note: Copernicus Publications remains neutral with regard to jurisdictional claims in published maps and institutional affiliations.
This research has been supported by the National Science Foundation (grant no. CHE-1709751).
This paper was edited by Mingjin Tang and reviewed by five anonymous referees.
Archer, J., Walker, J. S., Gregson, F. K. A., Hardy, D. A., and Reid, J. P.: Drying Kinetics and Particle Formation from Dilute Colloidal Suspensions in Aerosol Droplets, Langmuir, 36, 12481–12493, https://doi.org/10.1021/acs.langmuir.0c01830, 2020.
Bateman, A. P., Belassein, H., and Martin, S. T.: Impactor Apparatus for the Study of Particle Rebound: Relative Humidity and Capillary Forces, Aerosol. Sci. Tech., 48, 42–52, https://doi.org/10.1080/02786826.2013.853866, 2014.
Bateman, A. P., Bertram, A. K., and Martin, S. T.: Hygroscopic Influence on the Semisolid-to-Liquid Transition of Secondary Organic Materials, J. Phys. Chem. A, 119, 4386–4395, https://doi.org/10.1021/jp508521c, 2015.
Bateman, A. P., Gong, Z. H., Liu, P. F., Sato, B., Cirino, G., Zhang, Y., Artaxo, P., Bertram, A. K., Manzi, A. O., Rizzo, L. V., Souza, R. A. F., Zaveri, R. A., and Martin, S. T.: Sub-micrometre particulate matter is primarily in liquid form over Amazon rainforest, Nat. Geosci., 9, 34–37, 2016.
Berkemeier, T., Shiraiwa, M., Pöschl, U., and Koop, T.: Competition between water uptake and ice nucleation by glassy organic aerosol particles, Atmos. Chem. Phys., 14, 12513–12531, https://doi.org/10.5194/acp-14-12513-2014, 2014.
Brooks, S. D., Wise, M. E., Cushing, M., and Tolbert, M. A.: Deliquescence behavior of organic/ammonium sulfate aerosol, Geophys. Res. Lett., 29, 23-21–23-24, https://doi.org/10.1029/2002gl014733, 2002.
Burgos, M. A., Andrews, E., Titos, G., Alados-Arboledas, L., Baltensperger, U., Day, D., Jefferson, A., Kalivitis, N., Mihalopoulos, N., Sherman, J., Sun, J., Weingartner, E., and Zieger, P.: A global view on the effect of water uptake on aerosol particle light scattering, Scientific Data, 6, 157, https://doi.org/10.1038/s41597-019-0158-7, 2019.
Cappa, C. D., Che, D. L., Kessler, S. H., Kroll, J. H., and Wilson, K. R.: Variations in organic aerosol optical and hygroscopic properties upon heterogeneous OH oxidation, J. Geophys. Res.-Atmos., 116, D15204, https://doi.org/10.1029/2011jd015918, 2011.
Chu, B., Wang, K., Takekawa, H., Li, J., Zhou, W., Jiang, J., Ma, Q., He, H., and Hao, J.: Hygroscopicity of particles generated from photooxidation of α-pinene under different oxidation conditions in the presence of sulfate seed aerosols, J. Environ. Sci., 26, 129–139, https://doi.org/10.1016/S1001-0742(13)60402-7, 2014.
Ciobanu, V. G., Marcolli, C., Krieger, U. K., Zuend, A., and Peter, T.: Efflorescence of Ammonium Sulfate and Coated Ammonium Sulfate Particles: Evidence for Surface Nucleation, J. Phys. Chem. A, 114, 9486–9495, https://doi.org/10.1021/jp103541w, 2010.
Davis, R. D., Lance, S., Gordon, J. A., Ushijima, S. B., and Tolbert, M. A.: Contact efflorescence as a pathway for crystallization of atmospherically relevant particles, P. Natl. Acad. Sci. USA, 112, 15815–15820, https://doi.org/10.1073/pnas.1522860113, 2015.
Froyd, K. D., Murphy, D. M., Brock, C. A., Campuzano-Jost, P., Dibb, J. E., Jimenez, J.-L., Kupc, A., Middlebrook, A. M., Schill, G. P., Thornhill, K. L., Williamson, C. J., Wilson, J. C., and Ziemba, L. D.: A new method to quantify mineral dust and other aerosol species from aircraft platforms using single-particle mass spectrometry, Atmos. Meas. Tech., 12, 6209–6239, https://doi.org/10.5194/amt-12-6209-2019, 2019.
Fu, N., Woo, M. W., and Chen, X. D.: Single Droplet Drying Technique to Study Drying Kinetics Measurement and Particle Functionality: A Review, Dry. Technol., 30, 1771–1785, https://doi.org/10.1080/07373937.2012.708002, 2012.
Gao, Y. G., Chen, S. B., and Yu, L. E.: Efflorescence relative humidity for ammonium sulfate particles, J. Phys. Chem. A, 110, 7602–7608, 2006.
Grayson, J. W., Zhang, Y., Mutzel, A., Renbaum-Wolff, L., Böge, O., Kamal, S., Herrmann, H., Martin, S. T., and Bertram, A. K.: Effect of varying experimental conditions on the viscosity of α-pinene derived secondary organic material, Atmos. Chem. Phys., 16, 6027–6040, https://doi.org/10.5194/acp-16-6027-2016, 2016.
Gregson, F. K. A., Ordoubadi, M., Miles, R. E. H., Haddrell, A. E., Barona, D., Lewis, D., Church, T., Vehring, R., and Reid, J. P.: Studies of competing evaporation rates of multiple volatile components from a single binary-component aerosol droplet, Phys. Chem. Chem. Phys., 21, 9709–9719, https://doi.org/10.1039/C9CP01158G, 2019a.
Gregson, F. K. A., Robinson, J. F., Miles, R. E. H., Royall, C. P., and Reid, J. P.: Drying Kinetics of Salt Solution Droplets: Water Evaporation Rates and Crystallization, J. Phys. Chem. B, 123, 266–276, 2019b.
Gregson, F. K. A., Robinson, J. F., Miles, R. E. H., Royall, C. P., and Reid, J. P.: Drying and Crystallization of Evaporating Sodium Nitrate Aerosol Droplets, J. Phys. Chem. B, 124, 6024–6036, https://doi.org/10.1021/acs.jpcb.0c04079, 2020.
Hallquist, M., Wenger, J. C., Baltensperger, U., Rudich, Y., Simpson, D., Claeys, M., Dommen, J., Donahue, N. M., George, C., Goldstein, A. H., Hamilton, J. F., Herrmann, H., Hoffmann, T., Iinuma, Y., Jang, M., Jenkin, M. E., Jimenez, J. L., Kiendler-Scharr, A., Maenhaut, W., McFiggans, G., Mentel, Th. F., Monod, A., Prévôt, A. S. H., Seinfeld, J. H., Surratt, J. D., Szmigielski, R., and Wildt, J.: The formation, properties and impact of secondary organic aerosol: current and emerging issues, Atmos. Chem. Phys., 9, 5155–5236, https://doi.org/10.5194/acp-9-5155-2009, 2009.
Hamed, A., Korhonen, H., Sihto, S.-L., Joutsensaari, J., Järvinen, H., Petäjä, T., Arnold, F., Nieminen, T., Kulmala, M., Smith, J. N., Lehtinen, K. E. J., and Laaksonen, A.: The role of relative humidity in continental new particle formation, J. Geophys. Res.-Atmos., 116, D03202, https://doi.org/10.1029/2010JD014186, 2011.
Heintzenberg, J., Maßling, A., and Birmili, W.: The connection between hygroscopic and optical particle properties in the atmospheric aerosol, Geophys. Res. Lett., 28, 3649–3651, https://doi.org/10.1029/2001gl012971, 2001.
Jain, S. and Petrucci, G. A.: A New Method to Measure Aerosol Particle Bounce Using a Cascade Electrical Low Pressure Impactor, Aerosol Sci. Technol., 49, 390–399, https://doi.org/10.1080/02786826.2015.1036393, 2015.
Järvinen, A., Aitomaa, M., Rostedt, A., Keskinen, J., and Yli-Ojanperä, J.: Calibration of the new electrical low pressure impactor (ELPI+), J. Aerosol Sci., 69, 150–159, https://doi.org/10.1016/j.jaerosci.2013.12.006, 2014.
Järvinen, E., Ignatius, K., Nichman, L., Kristensen, T. B., Fuchs, C., Hoyle, C. R., Höppel, N., Corbin, J. C., Craven, J., Duplissy, J., Ehrhart, S., El Haddad, I., Frege, C., Gordon, H., Jokinen, T., Kallinger, P., Kirkby, J., Kiselev, A., Naumann, K.-H., Petäjä, T., Pinterich, T., Prevot, A. S. H., Saathoff, H., Schiebel, T., Sengupta, K., Simon, M., Slowik, J. G., Tröstl, J., Virtanen, A., Vochezer, P., Vogt, S., Wagner, A. C., Wagner, R., Williamson, C., Winkler, P. M., Yan, C., Baltensperger, U., Donahue, N. M., Flagan, R. C., Gallagher, M., Hansel, A., Kulmala, M., Stratmann, F., Worsnop, D. R., Möhler, O., Leisner, T., and Schnaiter, M.: Observation of viscosity transition in alpha-pinene secondary organic aerosol, Atmos. Chem. Phys., 16, 4423–4438, https://doi.org/10.5194/acp-16-4423-2016, 2016.
Jimenez, J. L., Canagaratna, M. R., Donahue, N. M., Prevot, A. S. H., Zhang, Q., Kroll, J. H., DeCarlo, P. F., Allan, J. D., Coe, H., Ng, N. L., Aiken, A. C., Docherty, K. S., Ulbrich, I. M., Grieshop, A. P., Robinson, A. L., Duplissy, J., Smith, J. D., Wilson, K. R., Lanz, V. A., Hueglin, C., Sun, Y. L., Tian, J., Laaksonen, A., Raatikainen, T., Rautiainen, J., Vaattovaara, P., Ehn, M., Kulmala, M., Tomlinson, J. M., Collins, D. R., Cubison, M. J., Dunlea, J., Huffman, J. A., Onasch, T. B., Alfarra, M. R., Williams, P. I., Bower, K., Kondo, Y., Schneider, J., Drewnick, F., Borrmann, S., Weimer, S., Demerjian, K., Salcedo, D., Cottrell, L., Griffin, R., Takami, A., Miyoshi, T., Hatakeyama, S., Shimono, A., Sun, J. Y., Zhang, Y. M., Dzepina, K., Kimmel, J. R., Sueper, D., Jayne, J. T., Herndon, S. C., Trimborn, A. M., Williams, L. R., Wood, E. C., Middlebrook, A. M., Kolb, C. E., Baltensperger, U., and Worsnop, D. R.: Evolution of Organic Aerosols in the Atmosphere, Science, 326, 1525–1529, https://doi.org/10.1126/science.1180353, 2009.
Kanakidou, M., Seinfeld, J. H., Pandis, S. N., Barnes, I., Dentener, F. J., Facchini, M. C., Van Dingenen, R., Ervens, B., Nenes, A., Nielsen, C. J., Swietlicki, E., Putaud, J. P., Balkanski, Y., Fuzzi, S., Horth, J., Moortgat, G. K., Winterhalter, R., Myhre, C. E. L., Tsigaridis, K., Vignati, E., Stephanou, E. G., and Wilson, J.: Organic aerosol and global climate modelling: a review, Atmos. Chem. Phys., 5, 1053–1123, https://doi.org/10.5194/acp-5-1053-2005, 2005.
Keskinen, J., Marjamäki, M., Virtanen, A., Mäkelä, T., and Hillamo, R.: Electrical calibration method for cascade impactors, J. Aerosol Sci., 30, 111–116, https://doi.org/10.1016/S0021-8502(98)00026-3, 1999.
Kidd, C., Perraud, V., Wingen, L. M., and Finlayson-Pitts, B. J.: Integrating phase and composition of secondary organic aerosol from the ozonolysis of alpha-pinene, P. Natl. Acad. Sci. USA, 111, 7552–7557, 2014.
Koop, T., Bookhold, J., Shiraiwa, M., and Poschl, U.: Glass transition and phase state of organic compounds: dependency on molecular properties and implications for secondary organic aerosols in the atmosphere, Phys. Chem. Chem. Phys., 13, 19238–19255, 2011.
Kourtchev, I., Giorio, C., Manninen, A., Wilson, E., Mahon, B., Aalto, J., Kajos, M., Venables, D., Ruuskanen, T., Levula, J., Loponen, M., Connors, S., Harris, N., Zhao, D., Kiendler-Scharr, A., Mentel, T., Rudich, Y., Hallquist, M., Doussin, J.-F., Maenhaut, W., Bäck, J., Petäjä, T., Wenger, J., Kulmala, M., and Kalberer, M.: Enhanced Volatile Organic Compounds emissions and organic aerosol mass increase the oligomer content of atmospheric aerosols, Sci. Rep.-UK, 6, 35038, https://doi.org/10.1038/srep35038, 2016.
Krieger, U. K., Marcolli, C., and Reid, J. P.: Exploring the complexity of aerosol particle properties and processes using single particle techniques, Chem. Soc. Rev., 41, 6631–6662, 2012.
Li, Y., Day, D. A., Stark, H., Jimenez, J. L., and Shiraiwa, M.: Predictions of the glass transition temperature and viscosity of organic aerosols from volatility distributions, Atmos. Chem. Phys., 20, 8103–8122, https://doi.org/10.5194/acp-20-8103-2020, 2020.
Maclean, A. M., Smith, N. R., Li, Y., Huang, Y., Hettiyadura, A. P. S., Crescenzo, G. V., Shiraiwa, M., Laskin, A., Nizkorodov, S. A., and Bertram, A. K.: Humidity-Dependent Viscosity of Secondary Organic Aerosol from Ozonolysis of β-Caryophyllene: Measurements, Predictions, and Implications, ACS Earth and Space Chemistry, 5, 305–318, https://doi.org/10.1021/acsearthspacechem.0c00296, 2021.
Martin, S. T.: Phase transitions of aqueous atmospheric particles, Chem. Rev., 100, 3403–3453, 2000.
Mauer, L. J. and Taylor, L. S.: Water-Solids Interactions: Deliquescence, Annu. Rev. Food Sci. T., 1, 41–63, https://doi.org/10.1146/annurev.food.080708.100915, 2010.
Michaud, V., El Haddad, I., Yao Liu, Sellegri, K., Laj, P., Villani, P., Picard, D., Marchand, N., and Monod, A.: In-cloud processes of methacrolein under simulated conditions – Part 3: Hygroscopic and volatility properties of the formed secondary organic aerosol, Atmos. Chem. Phys., 9, 5119–5130, https://doi.org/10.5194/acp-9-5119-2009, 2009.
Michel Flores, J., Bar-Or, R. Z., Bluvshtein, N., Abo-Riziq, A., Kostinski, A., Borrmann, S., Koren, I., Koren, I., and Rudich, Y.: Absorbing aerosols at high relative humidity: linking hygroscopic growth to optical properties, Atmos. Chem. Phys., 12, 5511–5521, https://doi.org/10.5194/acp-12-5511-2012, 2012.
Mikhailov, E., Vlasenko, S., Martin, S. T., Koop, T., and Pöschl, U.: Amorphous and crystalline aerosol particles interacting with water vapor: conceptual framework and experimental evidence for restructuring, phase transitions and kinetic limitations, Atmos. Chem. Phys., 9, 9491–9522, https://doi.org/10.5194/acp-9-9491-2009, 2009.
Ott, E.-J. E., Tackman, E. C., and Freedman, M. A.: Effects of Sucrose on Phase Transitions of Organic/Inorganic Aerosols, ACS Earth and Space Chemistry, 4, 591–601, https://doi.org/10.1021/acsearthspacechem.0c00006, 2020.
Pajunoja, A., Lambe, A. T., Hakala, J., Rastak, N., Cummings, M. J., Brogan, J. F., Hao, L., Paramonov, M., Hong, J., Prisle, N. L., Malila, J., Romakkaniemi, S., Lehtinen, K. E. J., Laaksonen, A., Kulmala, M., Massoli, P., Onasch, T. B., Donahue, N. M., Riipinen, I., Davidovits, P., Worsnop, D. R., Petäjä, T., and Virtanen, A.: Adsorptive uptake of water by semisolid secondary organic aerosols, Geophys. Res. Lett., 42, 3063–3068, https://doi.org/10.1002/2015GL063142, 2015.
Pajunoja, A., Hu, W., Leong, Y. J., Taylor, N. F., Miettinen, P., Palm, B. B., Mikkonen, S., Collins, D. R., Jimenez, J. L., and Virtanen, A.: Phase state of ambient aerosol linked with water uptake and chemical aging in the southeastern US, Atmos. Chem. Phys., 16, 11163–11176, https://doi.org/10.5194/acp-16-11163-2016, 2016.
Park, S. H. and Lee, K. W.: Condensational Growth of Polydisperse Aerosol for the Entire Particle Size Range, Aerosol Sci. Tech., 33, 222–227, https://doi.org/10.1080/027868200416213, 2000.
Petters, S. S., Kreidenweis, S. M., Grieshop, A. P., Ziemann, P. J., and Petters, M. D.: Temperature- and Humidity-Dependent Phase States of Secondary Organic Aerosols, Geophys. Res. Lett., 46, 1005–1013, 2019.
Reid, J. P., Bertram, A. K., Topping, D. O., Laskin, A., Martin, S. T., Petters, M. D., Pope, F. D., and Rovelli, G.: The viscosity of atmospherically relevant organic particles, Nat. Commun., 9, 956, https://doi.org/10.1038/s41467-018-03027-z, 2018.
Renbaum-Wolff, L., Grayson, J. W., Bateman, A. P., Kuwata, M., Sellier, M., Murray, B. J., Shilling, J. E., Martin, S. T., and Bertram, A. K.: Viscosity of α-pinene secondary organic material and implications for particle growth and reactivity, P. Natl. Acad. Sci. USA, 110, 8014–8019, https://doi.org/10.1073/pnas.1219548110, 2013.
Robinson, C. B., Schill, G. P., and Tolbert, M. A.: Optical growth of highly viscous organic/sulfate particles, J. Atmos. Chem., 71, 145–156, https://doi.org/10.1007/s10874-014-9287-8, 2014.
Robinson, J. F., Gregson, F. K. A., Miles, R. E. H., Reid, J. P., and Royall, C. P.: Drying kinetics and nucleation in evaporating sodium nitrate aerosols, J. Chem. Phys., 152, 074503, https://doi.org/10.1063/1.5139106, 2020.
Ruprecht, H. and Sigg, L.: Interactions of aerosols (ammonium sulfate, ammonium nitrate and ammonium chloride) and of gases (HCl, HNO3) with fogwater, Atmos. Environ. A-Gen., 24, 573–584, https://doi.org/10.1016/0960-1686(90)90012-C, 1990.
Samain, S., Dupas-Langlet, M., Leturia, M., Benali, M., and Saleh, K.: Caking of sucrose: Elucidation of the drying kinetics according to the relative humidity by considering external and internal mass transfer, J. Food Eng., 212, 298–308, https://doi.org/10.1016/j.jfoodeng.2017.05.020, 2017.
Saukko, E., Kuuluvainen, H., and Virtanen, A.: A method to resolve the phase state of aerosol particles, Atmos. Meas. Tech., 5, 259–265, https://doi.org/10.5194/amt-5-259-2012, 2012a.
Saukko, E., Lambe, A. T., Massoli, P., Koop, T., Wright, J. P., Croasdale, D. R., Pedernera, D. A., Onasch, T. B., Laaksonen, A., Davidovits, P., Worsnop, D. R., and Virtanen, A.: Humidity-dependent phase state of SOA particles from biogenic and anthropogenic precursors, Atmos. Chem. Phys., 12, 7517–7529, https://doi.org/10.5194/acp-12-7517-2012, 2012b.
Saukko, E., Zorn, S., Kuwata, M., Keskinen, J., and Virtanen, A.: Phase State and Deliquescence Hysteresis of Ammonium-Sulfate-Seeded Secondary Organic Aerosol, Aerosol Sci. Tech., 49, 531–537, 2015.
Saxena, P., Belle Hudischewskyj, A., Seigneur, C., and Seinfeld, J. H.: A comparative study of equilibrium approaches to the chemical characterization of secondary aerosols, Atmos. Environ., 20, 1471–1483, https://doi.org/10.1016/0004-6981(86)90019-3, 1986.
Sherwood, S. C., Roca, R., Weckwerth, T. M., and Andronova, N. G.: Tropospheric water vapor, convection, and climate, Rev. Geophys., 48, RG2001, https://doi.org/10.1029/2009rg000301, 2010.
Shiraiwa, M., Ammann, M., Koop, T., and Poschl, U.: Gas uptake and chemical aging of semisolid organic aerosol particles, P. Natl. Acad. Sci. USA, 108, 11003–11008, DOI https://doi.org/10.1073/pnas.1103045108, 2011.
Shiraiwa, M., Li, Y., Tsimpidi, A. P., Karydis, V. A., Berkemeier, T., Pandis, S. N., Lelieveld, J., Koop, T., and Poschl, U.: Global distribution of particle phase state in atmospheric secondary organic aerosols, Nat. Commun., 8, 15002, https://doi.org/10.1038/ncomms15002, 2017.
Slade, J. H., Ault, A. P., Bui, A. T., Ditto, J. C., Lei, Z., Bondy, A. L., Olson, N. E., Cook, R. D., Desrochers, S. J., Harvey, R. M., Erickson, M. H., Wallace, H. W., Alvarez, S. L., Flynn, J. H., Boor, B. E., Petrucci, G. A., Gentner, D. R., Griffin, R. J., and Shepson, P. B.: Bouncier Particles at Night: Biogenic Secondary Organic Aerosol Chemistry and Sulfate Drive Diel Variations in the Aerosol Phase in a Mixed Forest, Environ. Sci. Technol., 53, 4977–4987, https://doi.org/10.1021/acs.est.8b07319, 2019.
Tang, M., Chan, C. K., Li, Y. J., Su, H., Ma, Q., Wu, Z., Zhang, G., Wang, Z., Ge, M., Hu, M., He, H., and Wang, X.: A review of experimental techniques for aerosol hygroscopicity studies, Atmos. Chem. Phys., 19, 12631–12686, https://doi.org/10.5194/acp-19-12631-2019, 2019.
Theodosi, C., Panagiotopoulos, C., Nouara, A., Zarmpas, P., Nicolaou, P., Violaki, K., Kanakidou, M., Sempéré, R., and Mihalopoulos, N.: Sugars in atmospheric aerosols over the Eastern Mediterranean, Prog. Oceanogr., 163, 70–81, https://doi.org/10.1016/j.pocean.2017.09.001, 2018.
Virtanen, A., Marjamäki, M., Ristimäki, J., and Keskinen, J.: Fine particle losses in electrical low-pressure impactor, J. Aerosol Sci., 32, 389–401, https://doi.org/10.1016/S0021-8502(00)00087-2, 2001.
Virtanen, A., Kannosto, J., Kuuluvainen, H., Arffman, A., Joutsensaari, J., Saukko, E., Hao, L., Yli-Pirilä, P., Tiitta, P., Holopainen, J. K., Keskinen, J., Worsnop, D. R., Smith, J. N., and Laaksonen, A.: Bounce behavior of freshly nucleated biogenic secondary organic aerosol particles, Atmos. Chem. Phys., 11, 8759–8766, https://doi.org/10.5194/acp-11-8759-2011, 2011.
Wu, L., Becote, C., Sobanska, S., Flaud, P.-M., Perraudin, E., Villenave, E., Song, Y.-C., and Ro, C.-U.: Hygroscopic behavior of aerosols generated from solutions of 3-methyl-1,2,3-butanetricarboxylic acid, its sodium salts, and its mixtures with NaCl, Atmos. Chem. Phys., 20, 14103–14122, https://doi.org/10.5194/acp-20-14103-2020, 2020.
You, Y., Renbaum-Wolff, L., Carreras-Sospedra, M., Hanna, S. J., Hiranuma, N., Kamal, S., Smith, M. L., Zhang, X., Weber, R. J., Shilling, J. E., Dabdub, D., Martin, S. T., and Bertram, A. K.: Images reveal that atmospheric particles can undergo liquid–liquid phase separations, P. Natl. Acad. Sci. USA, 109, 13188–13193, https://doi.org/10.1073/pnas.1206414109, 2012.
Zhang, X., McVay, R. C., Huang, D. D., Dalleska, N. F., Aumont, B., Flagan, R. C., and Seinfeld, J. H.: Formation and evolution of molecular products in α-pinene secondary organic aerosol, P. Natl. Acad. Sci. USA, 112, 14168–14173, https://doi.org/10.1073/pnas.1517742112, 2015a.
Zhang, Y., Sanchez, M. S., Douet, C., Wang, Y., Bateman, A. P., Gong, Z., Kuwata, M., Renbaum-Wolff, L., Sato, B. B., Liu, P. F., Bertram, A. K., Geiger, F. M., and Martin, S. T.: Changing shapes and implied viscosities of suspended submicron particles, Atmos. Chem. Phys., 15, 7819–7829, https://doi.org/10.5194/acp-15-7819-2015, 2015b.
Zhao, D. F., Buchholz, A., Kortner, B., Schlag, P., Rubach, F., Fuchs, H., Kiendler-Scharr, A., Tillmann, R., Wahner, A., Watne, Å. K., Hallquist, M., Flores, J. M., Rudich, Y., Kristensen, K., Hansen, A. M. K., Glasius, M., Kourtchev, I., Kalberer, M., and Mentel, Th. F.: Cloud condensation nuclei activity, droplet growth kinetics, and hygroscopicity of biogenic and anthropogenic secondary organic aerosol (SOA), Atmos. Chem. Phys., 16, 1105–1121, https://doi.org/10.5194/acp-16-1105-2016, 2016.
Zobrist, B., Marcolli, C., Pedernera, D. A., and Koop, T.: Do atmospheric aerosols form glasses?, Atmos. Chem. Phys., 8, 5221–5244, https://doi.org/10.5194/acp-8-5221-2008, 2008.
Zobrist, B., Soonsin, V., Luo, B. P., Krieger, U. K., Marcolli, C., Peter, T., and Koop, T.: Ultra-slow water diffusion in aqueous sucrose glasses, Phys. Chem. Chem. Phys., 13, 3514–3526, 2011.