the Creative Commons Attribution 4.0 License.
the Creative Commons Attribution 4.0 License.
 | 10 Dec 2021
Glyoxal tropospheric column retrievals from TROPOMI – multi-satellite intercomparison and ground-based validation
Christophe Lerot
François Hendrick
Michel Van Roozendael
Leonardo M. A. Alvarado
Andreas Richter
Isabelle De Smedt
Nicolas Theys
Jonas Vlietinck
Jeroen Van Gent
Trissevgeni Stavrakou
Jean-François Müller
Pieter Valks
Diego Loyola
Hitoshi Irie
Vinod Kumar
Thomas Wagner
Stefan F. Schreier
Vinayak Sinha
Ting Wang
Pucai Wang
Christian Retscher
We present the first global glyoxal (CHOCHO) tropospheric column product derived from the TROPOspheric Monitoring Instrument (TROPOMI) on board the Sentinel-5 Precursor satellite. Atmospheric glyoxal results from the oxidation of other non-methane volatile organic compounds (NMVOCs) and from direct emissions caused by combustion processes. Therefore, this product is a useful indicator of VOC emissions. It is generated with an improved version of the BIRA-IASB scientific retrieval algorithm relying on the differential optical absorption spectroscopy (DOAS) approach. Among the algorithmic updates, the DOAS fit now includes corrections to mitigate the impact of spectral misfits caused by scene brightness inhomogeneity and strong NO2 absorption. The product comes along with a full error characterization, which allows for providing random and systematic error estimates for every observation. Systematic errors are typically in the range of 1 ×10¹⁴–3 ×10¹⁴ molec. cm−2 (∼30 %–70 % in emission regimes) and originate mostly from a priori data uncertainties and spectral interferences with other absorbing species. The latter may be at the origin, at least partly, of an enhanced glyoxal signal over equatorial oceans, and further investigation is needed to mitigate them. Random errors are large ( molec. cm−2) but can be reduced by averaging observations in space and/or time. Benefiting from a high signal-to-noise ratio and a large number of small-size observations, TROPOMI provides glyoxal tropospheric column fields with an unprecedented level of detail.
Using the same retrieval algorithmic baseline, glyoxal column data sets are also generated from the Ozone Monitoring Instrument (OMI) on Aura and from the Global Ozone Monitoring Experiment-2 (GOME-2) on board Metop-A and Metop-B. Those four data sets are intercompared over large-scale regions worldwide and show a high level of consistency. The satellite glyoxal columns are also compared to glyoxal columns retrieved from ground-based Multi-AXis DOAS (MAX-DOAS) instruments at nine stations in Asia and Europe. In general, the satellite and MAX-DOAS instruments provide consistent glyoxal columns both in terms of absolute values and variability. Correlation coefficients between TROPOMI and MAX-DOAS glyoxal columns range between 0.61 and 0.87. The correlation is only poorer at one mid-latitude station, where satellite data appear to be biased low during wintertime. The mean absolute glyoxal columns from satellite and MAX-DOAS generally agree well for low/moderate columns with differences of less than 1×10¹⁴ molec. cm−2. A larger bias is identified at two sites where the MAX-DOAS columns are very large. Despite this systematic bias, the consistency of the satellite and MAX-DOAS glyoxal seasonal variability is high.
- Article
(26916 KB) - Full-text XML
-
Supplement
(1394 KB) - BibTeX
- EndNote


Exposure to poor air quality kills millions of people annually (e.g. Vohra et al., 2021; World Health Organization, 2016) due to natural and human emissions of a large range of particulate matter and gases, including among others nitrous oxides (NOx), sulfur dioxide, carbon monoxide, methane and volatile organic compounds (VOCs). VOCs, in combination with NOx, play a significant role in the secondary production of tropospheric ozone (Jacob, 2000), which is highly toxic for the respiratory system and also contributes to global warming because of its absorption in the thermal infrared. Global measurements of atmospheric concentrations of the ozone precursors are therefore crucial. The number of VOCs that can be found in the atmosphere is substantial, but only a few of them can be probed using remote sensing techniques. For example, formaldehyde (HCHO) measurements have been used in many studies as a proxy for probing emissions of non-methane VOCs of biogenic, pyrogenic and anthropogenic origin (e.g. Abbot et al., 2003; Barkley et al., 2013; Bauwens et al., 2016; Beekmann and Vautard, 2010; Curci et al., 2010; Jin et al., 2020; Marais et al., 2012; Palmer et al., 2006; Stavrakou et al., 2016; Wells et al., 2020).
With a lifetime of a few hours, glyoxal (CHOCHO) is another short-lived VOC that can be detected remotely, offering the potential to provide information on non-methane VOC (NMVOC) emissions. Over the past few years, an increasing number of studies (e.g. Cao et al., 2018; Chan Miller et al., 2017; Fu et al., 2008; Li et al., 2016; Liu et al., 2012; Stavrakou et al., 2009b, 2016; Wittrock et al., 2006) have exploited glyoxal measurements from space, often in combination with formaldehyde. Being produced from similar sources, those two species are complementary as they have different production yields. For example, the oxidation of aromatics produces glyoxal with a much higher yield than formaldehyde (Cao et al., 2018). Although both are mostly produced via the oxidation of other VOCs, direct emissions from anthropogenic and fire activities also occur and contribute more to the glyoxal global budget than to the formaldehyde one (Stavrakou et al., 2009a, b). This motivated many studies to investigate the ratio of glyoxal to formaldehyde concentrations or columns as a possible metric to discriminate between different types of VOC emissions (e.g. Chan Miller et al., 2014; DiGangi et al., 2012; Hoque et al., 2018; Kaiser et al., 2015; Vrekoussis et al., 2010). Glyoxal measurements are also essential for establishing the global budget of secondary organic aerosols (SOAs). Indeed, with a high solubility in water, glyoxal undergoes heterogeneous uptake on aerosols and cloud droplets where the subsequent aqueous-phase chemistry forms SOA (Chan et al., 2010; Fu et al., 2008; Hallquist et al., 2009; Knote et al., 2014; Li et al., 2016; Volkamer et al., 2007).
Glyoxal has three absorption bands in the visible spectral range that have been exploited to remotely retrieve information on its atmospheric abundance using the differential optical absorption spectroscopy method (DOAS; Platt and Stutz, 2008) applied to ground-based (e.g. Benavent et al., 2019; Hoque et al., 2018; Javed et al., 2019; Schreier et al., 2020), airborne (e.g. Kluge et al., 2020; Volkamer et al., 2015), shipborne (e.g. Behrens et al., 2019; Sinreich et al., 2010) and spaceborne instruments. The first global glyoxal tropospheric column observations from space were realized by Wittrock et al. (2006) using nadir measurements from the SCIAMACHY (SCanning Imaging Absorption spectroMeter for Atmospheric CHartographY) instrument. Based on this pioneering work, different glyoxal data products were derived from the Global Ozone Monitoring Experiment-2 (GOME-2) (Lerot et al., 2010; Vrekoussis et al., 2009) and from the Ozone Monitoring Instrument (OMI) (Alvarado et al., 2014; Chan Miller et al., 2014). All those different products rely on a similar DOAS approach but generally differ from each other by the choice of the fit settings and of the auxiliary input data.
In general, the glyoxal optical depth is very low (), typically 1 order of magnitude smaller than the NO2 optical depth in the same spectral range. This results in prone-to-noise retrievals, requiring users to average many of them to extract meaningful glyoxal signals. With an enhanced spatial resolution resulting in a number of observations more than 10 times larger than provided by its predecessor OMI, the TROPOspheric Monitoring Instrument (TROPOMI), operating since 2017, allows for observing weak atmospheric absorbers with an unprecedented level of spatio-temporal detail. This has been illustrated by Alvarado et al. (2020a), who investigated the large amounts of formaldehyde and glyoxal emitted by the intense North American wildfires in August 2018 as observed by TROPOMI for several days and over long distances. Theys et al. (2020) have evaluated the respective contributions to the hydroxyl radical production in fresh fire plumes from nitrous acid, VOCs and other sources with the support of different TROPOMI data sets, including the glyoxal data product described here.
This work presents the latest version of the BIRA-IASB scientific glyoxal tropospheric column retrieval algorithm that has been applied to 3 years of TROPOMI measurements and also to data from the predecessor nadir instruments OMI and GOME-2A/2B. The quality of the TROPOMI glyoxal retrievals is investigated with (1) a global intercomparison of the satellite glyoxal data products generated with a common algorithm and (2) comparisons with independent glyoxal measurements from a series of Multi-AXis DOAS (MAX-DOAS) instruments located at nine stations in Asia and Europe.
After a brief introduction of the satellite instruments used in this study in Sect. 2, the retrieval algorithm and its different steps are described in Sect. 3, with emphasis on the updated and innovative aspects compared to older studies. This section also presents the typical random and systematic errors associated with the retrievals and how they are estimated for each individual measurement. Section 4 presents the evaluation of the inter-satellite consistency by comparing both seasonal global spatial patterns as seen from different instruments as well as monthly mean time series and seasonal cycles in a series of selected large-scale regions. Finally, Sect. 5 presents validation results based on MAX-DOAS data.
TROPOMI was launched on 13 October 2017 on board the Sentinel-5 Precursor platform. It flies on a sun-synchronous low earth orbit (LEO) with an ascending node crossing the Equator at the local time of 13:30 LT. In the series of Sentinel missions from the European Union Copernicus programme, it is the first one dedicated to atmospheric composition. The instrument operates in a nadir-viewing mode and measures earthshine radiances and solar irradiances in the ultraviolet (UV), visible, near infrared and short-wavelength infrared spectral bands. It aims at providing column amounts of a number of key pollutants, such as ozone (O3), NO2, SO2, HCHO, CO and CH4 as well as cloud and aerosol parameters. TROPOMI offers a quasi-daily global coverage at the unprecedented spatial resolution of 3.5×5.5 km2 (3.5×7 km2 before August 2019) in the UV–visible spectral range. It is an imager-type instrument using a two-dimensional charge coupled device (CCD) for the light measurements, with the detector columns being used for the spectral resolution while the rows are binned to spatially resolve the 2600 km across-track swath into 450 individual ground pixels. The spectral resolution of the instrument is about 0.5 nm, and it offers a remarkably high signal-to-noise ratio of about 1500 in band 4 (405–500 nm) used in this study. More details on the instrument and its performance can be found in the literature (Kleipool et al., 2018; Ludewig et al., 2020; Schenkeveld et al., 2017; Veefkind et al., 2012). The TROPOMI measurements allow us to derive the vertical columns of multiple species, with some of them not included among the operational products listed above. Glyoxal is one of them, and the details on how its column quantities are retrieved will be described in the next section.
The TROPOMI design strongly inherits from past nadir-viewing sensors and in particular from the Ozone Monitoring Instrument (OMI) that we use to evaluate the TROPOMI glyoxal product presented in this work. OMI (Levelt et al., 2006) is also an imager instrument and flies on an early afternoon orbit since October 2004. The OMI swath, divided into 60 across-track pixels with a size varying from 13×24 km2 (at nadir) to 13×150 km2 (at the edges), allowed for a daily global coverage before being limited in 2008 by the so-called row anomaly. The latter consists of a modification of the signal recorded by OMI at specific rows, due to a mechanical obstruction of the field of view, and leads to lower quality spectral measurements (Torres et al., 2018). We also exploit spectral measurements from the Global Ozone Monitoring Experiment-2 (GOME-2) instruments on board the Metop-A and Metop-B platforms. In contrast to OMI and TROPOMI, the GOME-2 instruments (Munro et al., 2016) fly on early morning LEOs with local Equator crossing times around 09:30 LT and are scanning spectrometers, meaning that across-track pixels are successively sounded. The scan is divided into 24 pixels for a total swath of 1920 km, providing global coverage in 1.5 d. Each pixel has a size of 80×40 km2. After the launch of Metop-B, the GOME-2A swath was reduced to 960 km in July 2013, leading to ground pixel size being 2 times smaller.
The algorithm for retrieving tropospheric vertical columns of glyoxal relies on a classical DOAS approach (Platt and Stutz, 2008). This approach consists first of fitting measured optical depths in an optimized spectral window to derive the so-called slant column densities (SCDs, atmospheric concentration integrated along the effective light path) of the absorbers. The latter are thereafter converted into vertical column densities VCDs (concentration vertically integrated from the satellite ground pixel up to the top of the atmosphere) with air mass factors (AMFs) obtained by modelling the radiative transfer through the atmosphere. An additional background correction procedure is often applied for weak absorbers such as glyoxal in order to reduce as much as possible the presence of systematic biases caused by spectral interferences.
The glyoxal algorithm presented here largely inherits from past developments for predecessor nadir-viewing satellite sensors (Alvarado et al., 2014, 2020a; Chan Miller et al., 2014; Lerot et al., 2010; Vrekoussis et al., 2009; Wittrock et al., 2006). Figure 1 illustrates for 1 full day of TROPOMI data the resulting main output of every algorithmic component, which we further describe in the following sections, with emphasis on their specificities. The retrievals are provided with estimates for the random and systematic errors, which are discussed in Sect. 3.4.
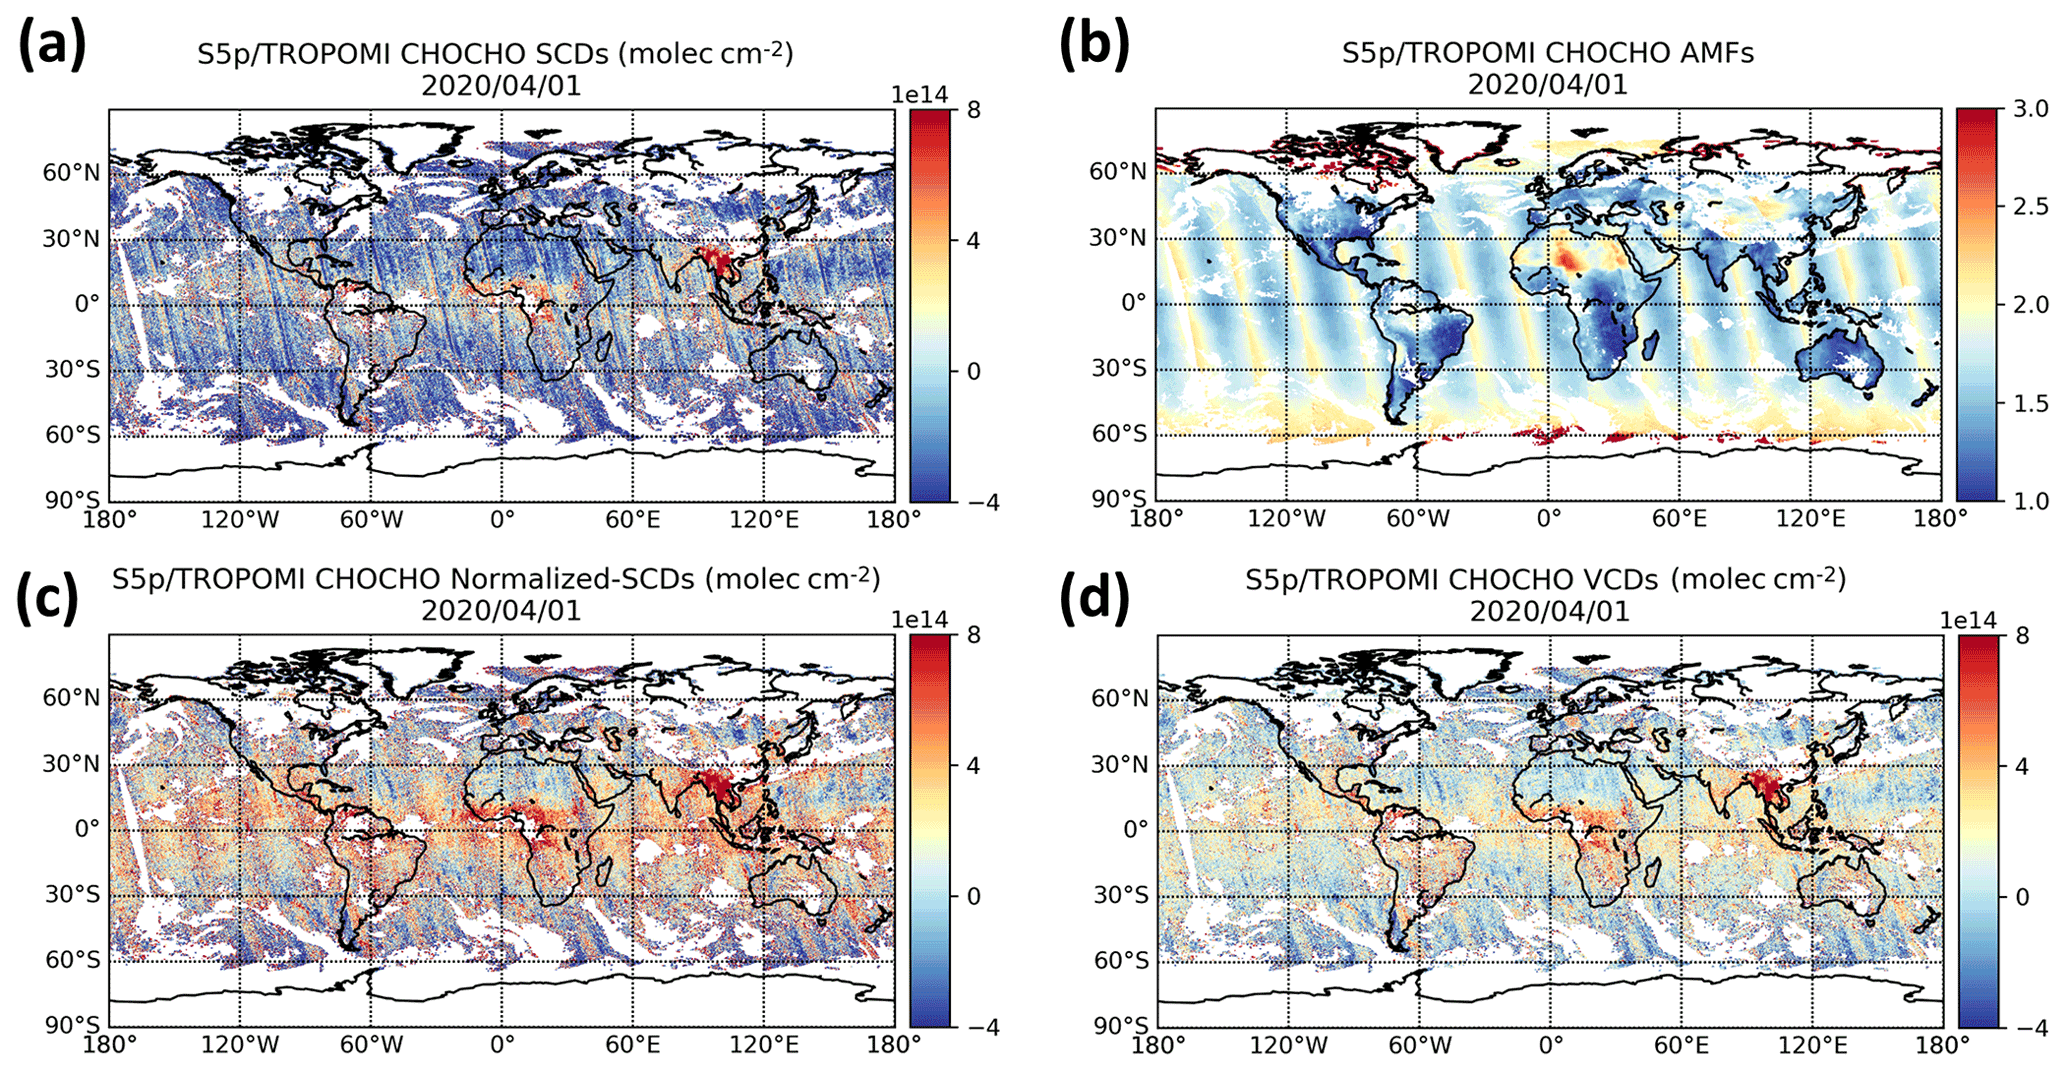
Figure 1Illustration of the different glyoxal algorithmic steps for 1 full day of TROPOMI data (1 April 2020). (a) Glyoxal SCDs retrieved from the DOAS spectral fits; (b) glyoxal AMFs; (c) glyoxal normalized SCDs resulting from the background correction procedure; (d) final retrieved glyoxal VCDs. The data have been gridded at the spatial resolution of 0.25∘.
3.1 DOAS fit
To exploit the glyoxal absorption bands, we use a fitting window from 435 to 460 nm encompassing the two most intense bands, which has shown in the past to provide reliable results (Barkley et al., 2017; Lerot et al., 2010). This has been confirmed by sensitivity tests carried out by Alvarado et al. (2014) and Chan Miller et al. (2014). Owing to its low optical depth (), any poorly fitted feature in the radiance measurements may affect the retrieved glyoxal SCD. It is therefore crucial to account for any physical or instrumental effect in order to optimize the fit quality as much as possible. Different aspects of the algorithm contribute to achieve this.
The wavelength grids of the measured spectra are recalibrated before the actual DOAS fits with a cross-correlation procedure (Danckaert et al., 2017; De Smedt et al., 2018) during which the position of the lines in the measured irradiance spectrum is fitted to an external solar atlas (Chance and Kurucz, 2010), convolved to the satellite spectral resolution. This recalibration procedure is done once per orbit and separately for every detector row of the instrument.
Although the DOAS fit generally uses an irradiance as the reference spectrum, it is common practice, in the case of weak tropospheric absorbers, to replace it by a mean radiance spectrum recorded in a remote region where the concentration of the gas of interest is low (e.g. De Smedt et al., 2018). This allows for reducing the presence of systematic biases caused by spectral interferences and/or instrumental limitations. In particular, the use of one separate mean radiance spectrum per detector row minimizes the presence of so-called stripes in the product typical of imager-type instruments such as OMI or TROPOMI. Here we compute those mean radiance spectra on a daily basis by averaging for each row all spectra located within the equatorial Pacific Ocean (15∘ S–15∘ N, 120–180∘ W).
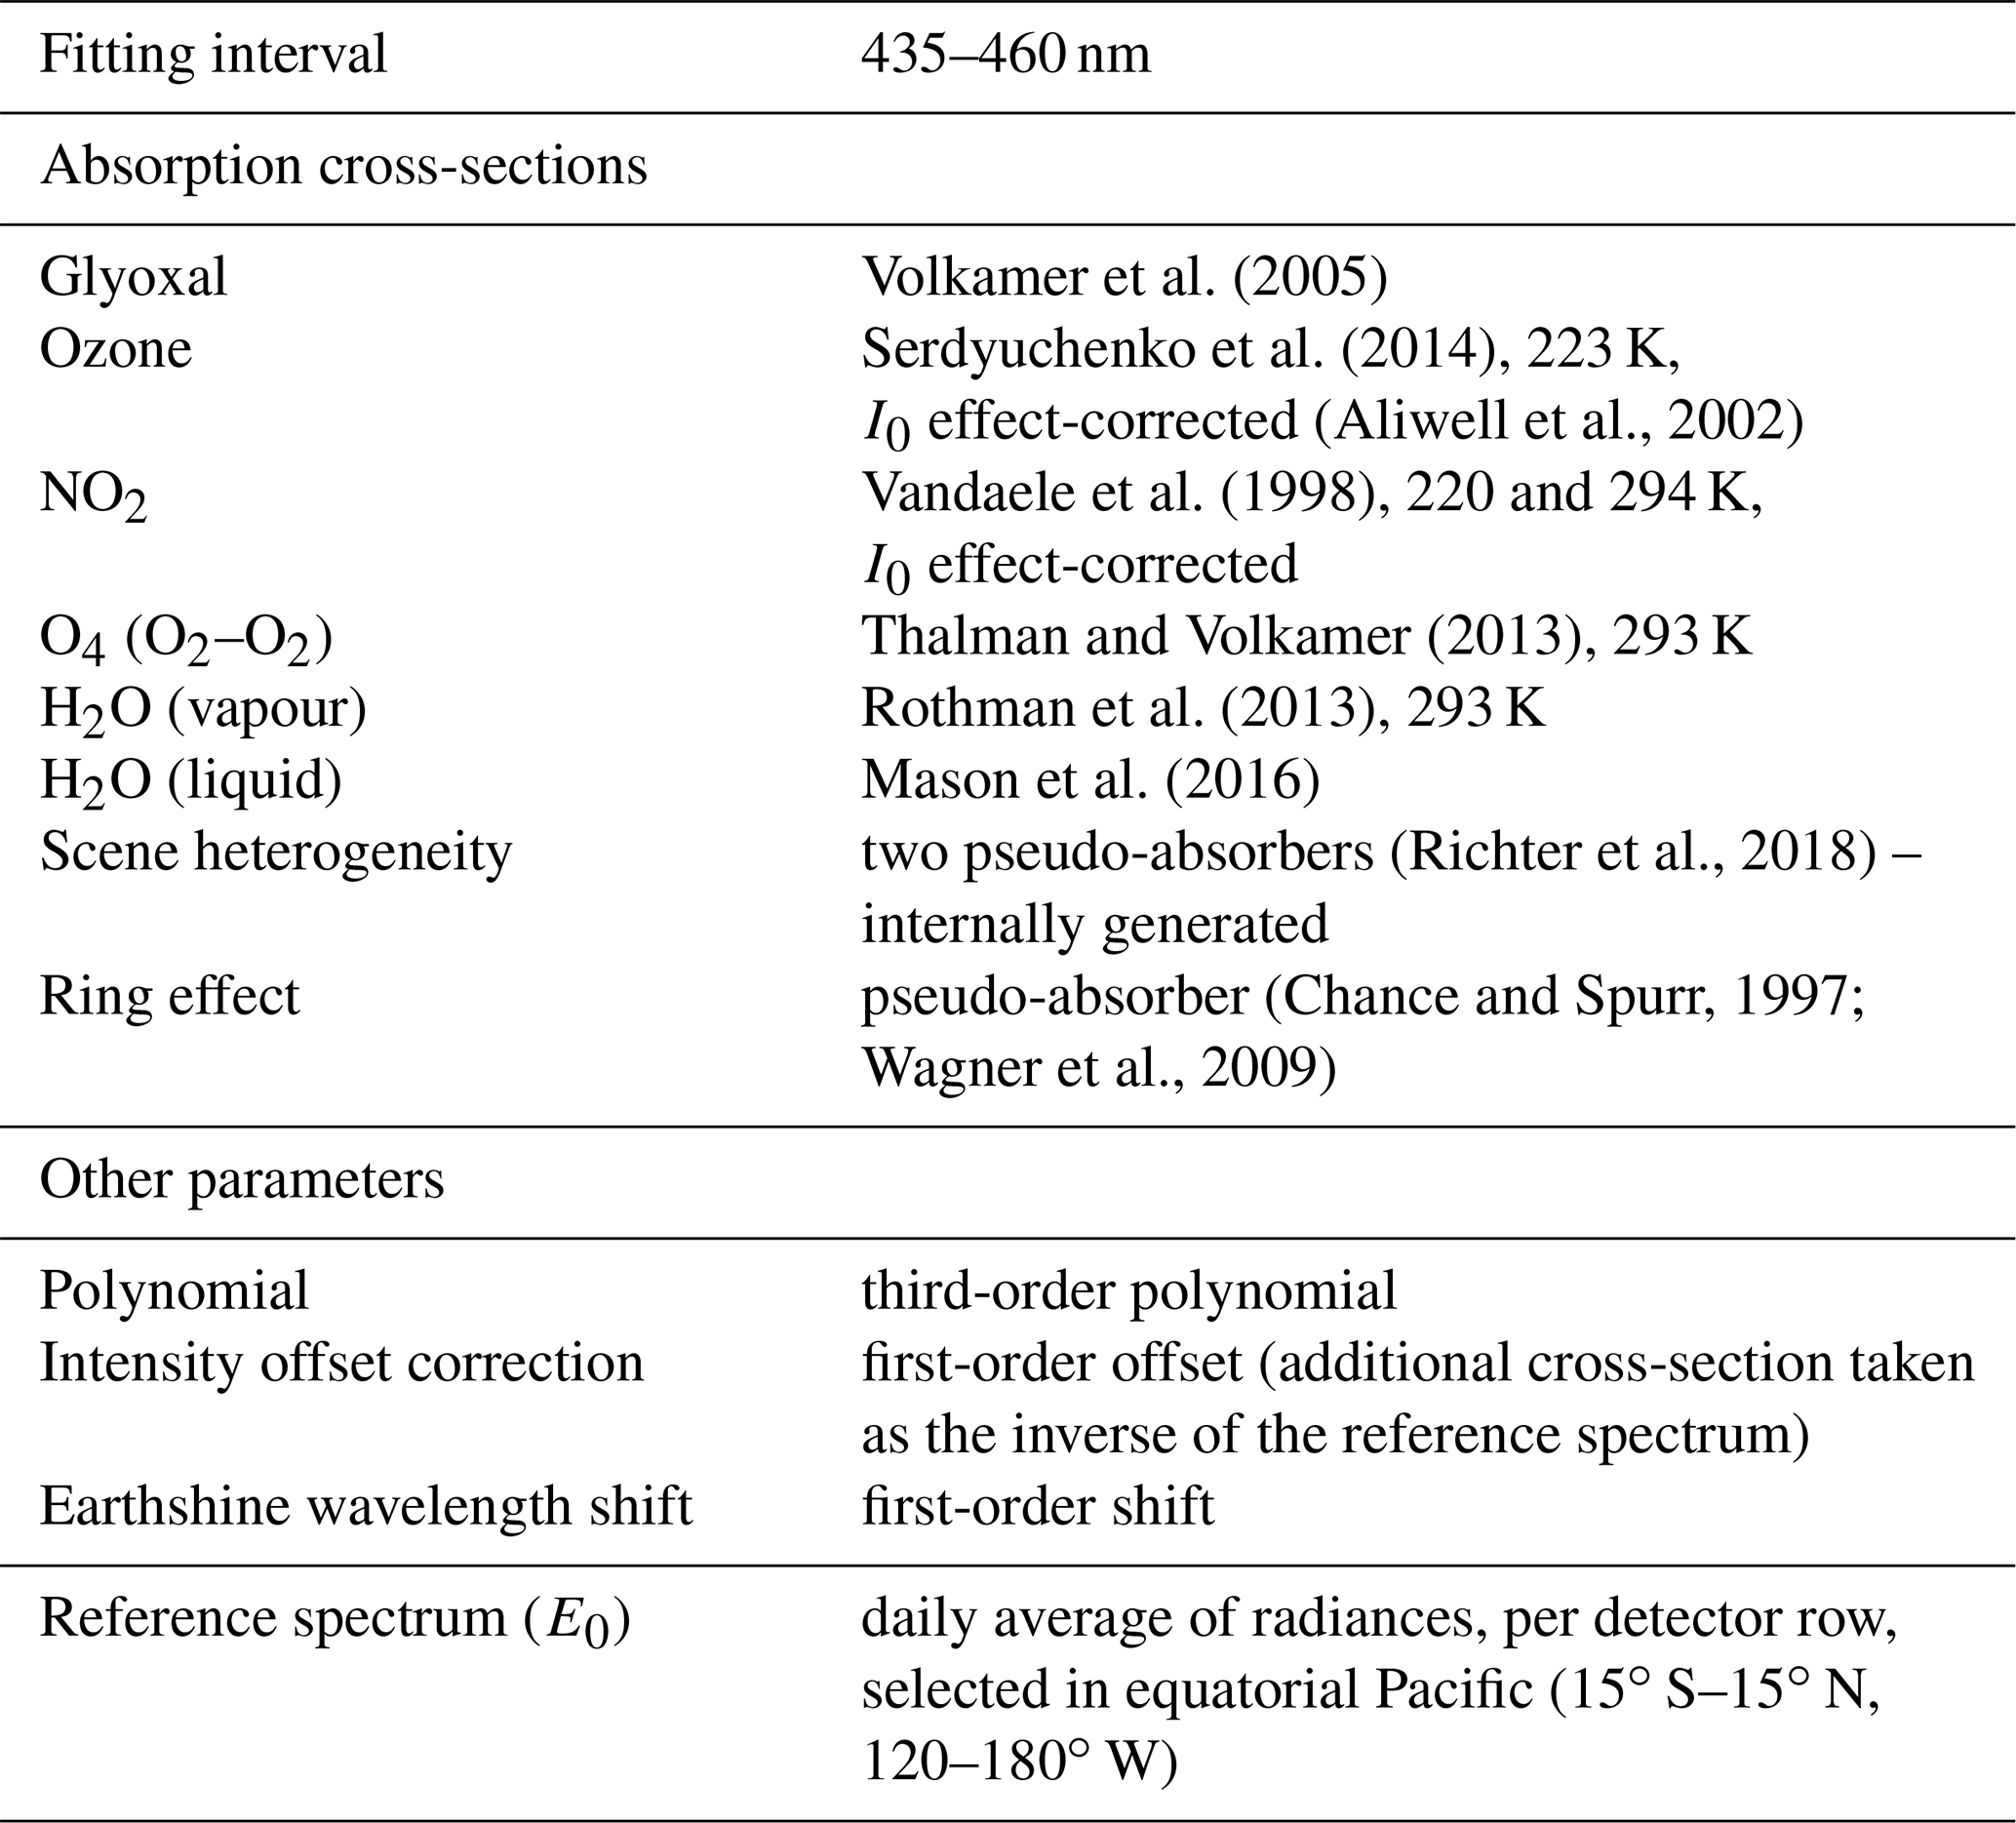
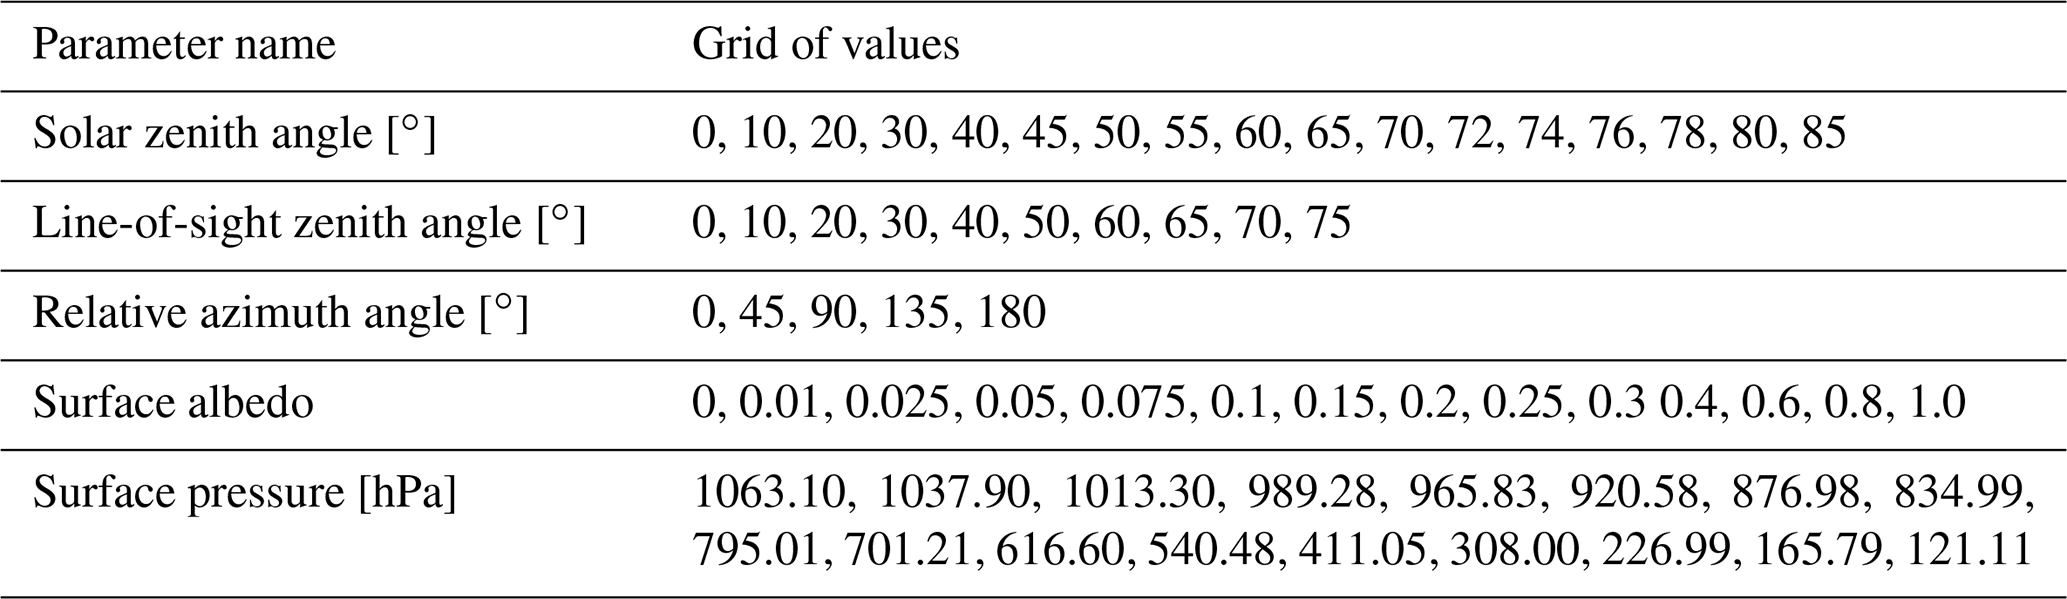
The selected settings for the DOAS fits rely on the aforementioned past studies and are summarized in Table 1. The latest available cross-sections for species absorbing in the selected fitting window are included in the fit, i.e. O3, NO2, O2–O2, water vapour and liquid water in addition to glyoxal. Note that the water vapour cross-section has been generated for a temperature of 293 K and a pressure of 1013 hPa using the HITRAN2012 database (Rothman et al., 2013) as we found that the latest HITRAN2016 version (Gordon et al., 2017) led to poorer fit quality. Sensitivity tests have shown that the retrieved glyoxal SCDs are significantly impacted by the choice of the H2O cross-section but also by its temperature. Effective water vapour temperatures (computed as the mean of temperature profiles weighted by typical H2O concentration profiles) are generally close to our selected value in regions with high water vapour content. This high sensitivity nevertheless points to the importance of having an accurate water vapour cross-section, especially in regards to its possible influence on glyoxal fields over oceans (Chan Miller et al., 2014) (see Sect. 4.2.3). The temperature dependence of the NO2 absorption is taken into account by including a second cross-section, taken as the difference between NO2 cross-sections reported at two temperatures (220 and 294 K) as proposed by Alvarado et al. (2014) and Chan Miller et al. (2014) for their respective OMI glyoxal products. Consistent with Alvarado et al. (2014), we found that fitting the liquid water optical depth in the glyoxal fitting window performs as well as fixing it to a value previously determined in a larger spectral interval as proposed in the past (Lerot et al., 2010) with a limited presence of systematically negative glyoxal columns over remote oceans. Vibrational Raman scattering on remote ocean water also introduces some spectral structures caused by the filling-in of Fraunhofer lines. However, Peters et al. (2014) have shown that the simultaneous fit of the liquid water cross-section and of an intensity offset (see below) efficiently considers all remote-ocean-related structures. A number of additional cross-sections are included in the fit to consider that (1) inelastic scattering (Ring effect) introduces high-frequency structures that are treated as a pseudo-absorber (Chance and Spurr, 1997); (2) intensity offsets in the spectra, caused, for example, by residual stray light, are corrected for by fitting the inverse of the reference spectrum (Danckaert et al., 2017); and (3) heterogeneity of the scene brightness may also introduce high-frequency structures, which are considered with pseudo-cross-sections (more details hereafter). All those cross-sections are generated at the instrumental spectral resolution by using the key data instrumental spectral response functions provided for all individual detector rows. During the DOAS procedure, the earthshine radiance spectrum is further aligned with the reference, by allowing it to be shifted and stretched in wavelength. In addition, the DOAS fit procedure includes a spike removal scheme as described in Richter et al. (2011), enabling us to filter out from the fit individual corrupted radiance measurements and hence to reduce the noise in the product.
Table 1Absorption cross-sections and settings used for the retrieval of glyoxal slant columns.
3.1.1 Scene heterogeneity
Any intensity variation within the probed scene taking place perpendicularly to the instrumental slit (i.e. along track) leads to perturbations of the instrumental spectral response function (ISRF) (Noël et al., 2012; Voors et al., 2006). Richter et al. (2018) have shown that those perturbations lead to a degradation of the NO2 DOAS spectral fit quality and to systematic biases on the retrieved slant columns. Such abrupt intensity changes occur, for example, along the coasts, mountains or cloud edges. Glyoxal retrievals are also affected by such scene heterogeneity as illustrated in Fig. 2 over the Horn of Africa and the Middle East. This figure shows in panel (a) that the root mean square (rms) values of the DOAS fit residuals are systematically higher along the coasts but also over land where contamination by broken clouds or abrupt elevation changes cause discontinuities in brightness fields. The stripes visible in this figure are due to the smaller pixel size (and hence lower signal-to-noise ratio) on the edges of the across-track field of view. Panel (c) shows that there are some co-located artificial patterns (positive/negative biases) in the mean retrieved glyoxal slant column field. The latter result from spectral interferences with the signature introduced by the ISRF distortion. Richter et al. (2018) showed that those spectral interferences can be significantly reduced with additional cross-sections in the DOAS fit scaling the possible scene heterogeneity signature. Those cross-sections are generated with a statistical analysis of the fit residuals for many observations in the Pacific Ocean as a function of the level of scene heterogeneity. The latter can be computed using radiance measurements at higher spatial resolution available in the TROPOMI level-1 data at a limited number of wavelengths. It ranges between −1 and +1 and is close to or deviates from 0 for homogeneous or heterogeneous scenes, the sign indicating the part of the ground pixel that dominates the scene brightness. Following this approach, two additional cross-sections corresponding to the systematic residuals of scenes with a heterogeneity factor larger/smaller than ±0.08 have been added to the DOAS baseline, and both the fit residuals and the identified glyoxal biases have been reduced as illustrated in panels (b) and (d) of Fig. 2. This effect is particularly visible along coasts and mountains but also over lands where some pseudo-noise caused by persistent broken clouds is also largely reduced. Although significantly correlated, including the two heterogeneity cross-sections leads to a further improvement in the fit quality, likely due to a slit function perturbation that depends on the radiance distribution within the nominal ground pixel. Note that a third cross-section derived from the mean residuals of homogeneous scenes is also added, which explains why the fit rms values are also reduced (but less drastically) in homogeneous scenes. This cross-section has no impact on the retrieved glyoxal SCDs and mostly allowed for isolating systematic residuals due to scene heterogeneity only for the pseudo-cross-section creation.
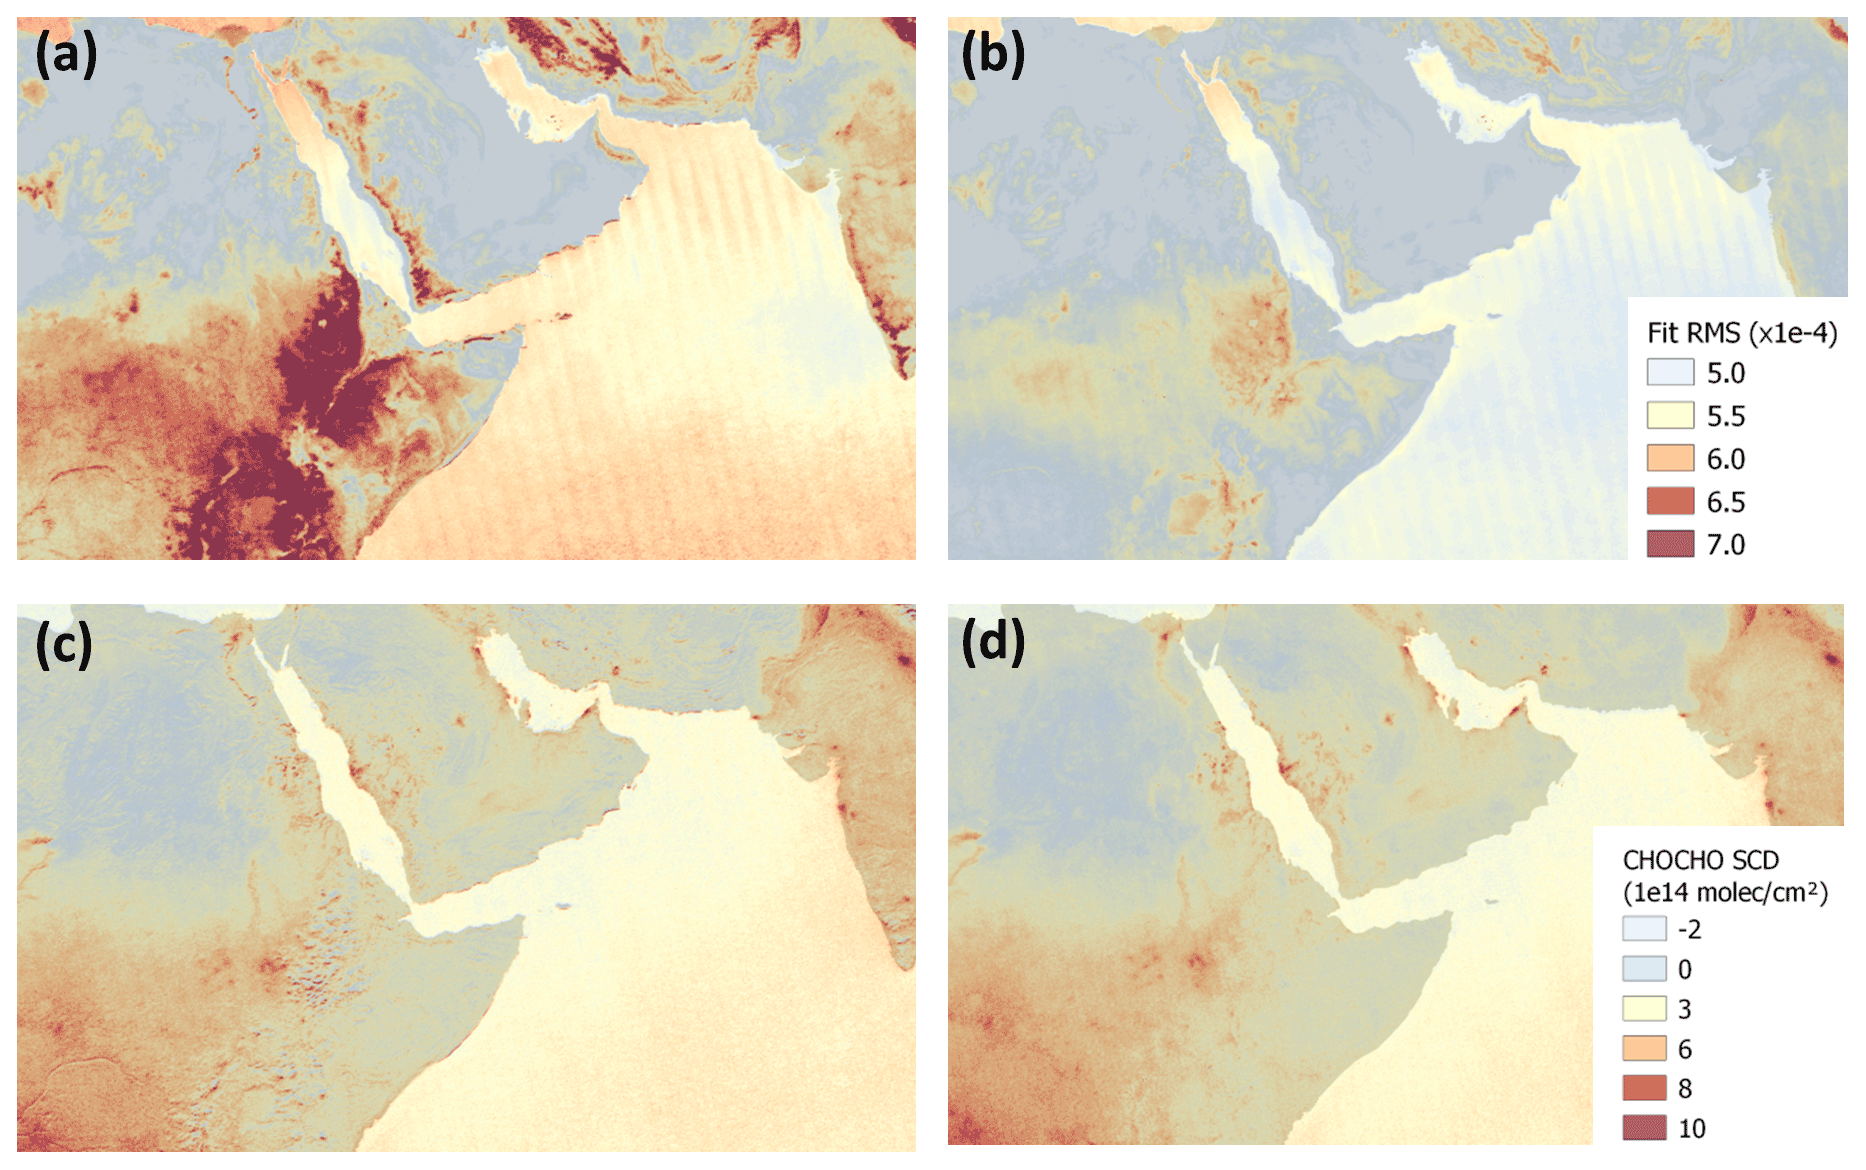
Figure 2Impact of scene brightness heterogeneity on glyoxal retrievals in the fitting window 435–460 nm over the Horn of Africa and the Middle East. Panels (a) and (b) show mean fit residual rms values for the year 2019 without and with (left and right) pseudo-cross-sections to correct for spectral signatures introduced by scene heterogeneity. Panels (c) and (d) show the corresponding mean glyoxal slant column densities. Only observations with cloud fractions less than 20 % are considered.
3.1.2 Empirical correction for strong NO2 absorption
The DOAS approach assumes that the wavelength dependence of the effective light path within the fit interval can be neglected. Although this assumption is generally reasonable, it may fail in the case of strong absorption by one (or more) species, of which the slant column density becomes dependent on the wavelength (Puķīte et al., 2010). In that case, fitting the optical depth of that species by a simple scaling of its cross-section is inaccurate, and the fit quality is degraded. Puķīte et al. (2010) have shown that fitting additional cross-sections resulting from a Taylor expansion of the wavelength-dependent slant column corrects for its variability within the fit window. As mentioned before, the high sensitivity of glyoxal retrievals to potential sources of misfit was a motivation to further investigate its sensitivity to extreme NO2 concentration levels.
For this purpose, synthetic spectra were generated at a spectral resolution of 0.5 nm with the radiative transfer model SCIATRAN (Rozanov et al., 2005) for a satellite nadir-viewing geometry and two different solar zenith angles. In those simulations, inelastic scattering was neglected, and a large range of tropospheric NO2 columns was covered by scaling the NO2 a priori profile. The TROPOMI DOAS baseline described above was then applied to those simulated spectra in order to retrieve CHOCHO SCDs and evaluate the error as a function of the NO2 SCD as illustrated in Fig. 3. Results clearly point to a CHOCHO SCD error increasing with the NO2 SCD. Note that the exact error magnitude may change slightly depending on the NO2 vertical distribution and on the actual atmospheric content. On the other hand, adding two so-called Pukite cross-sections (Puķīte et al., 2010) resulting from a first-order expansion of the NO2 slant column around the wavelength and the vertical optical depth significantly reduces the errors.
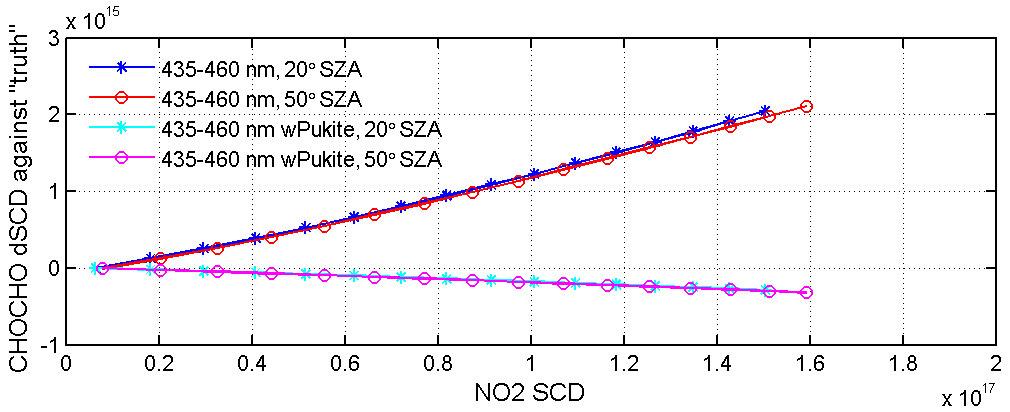
Figure 3Absolute error (in molec. cm−2) in the retrieved CHOCHO SCD as a function of the NO2 SCD for simulated spectra in a nadir-viewing satellite geometry and for two solar zenith angles. The reference “truth” CHOCHO SCD is taken as the value retrieved for the lowest NO2 SCD scenario. The error increases with the NO2 SCD when Pukite cross-sections are not included in the fit, but it remains small otherwise.
On this basis, the impact of adding the Pukite cross-sections to the DOAS baseline has been investigated using 1 month of TROPOMI data. A wintertime period was chosen (December 2019) to favour the number of observations with large NO2 concentrations, in particular in China but also in other megacities in the Northern Hemisphere. Figure 4 (upper panel) displays the monthly mean NO2 SCDs in December 2019 and (middle panel) the mean impact on the retrieved CHOCHO SCDs when introducing the Pukite terms in the DOAS spectral fit baseline. The CHOCHO SCD differences caused by the Pukite terms are also plotted as a function of the NO2 SCDs to better visualize the correlation (lower panel). For regions with enhanced NO2 concentrations ( molec. cm−2) (e.g. China, India, Teheran), the Pukite cross-sections lead to a systematic reduction of the CHOCHO SCDs, consistent with the closed-loop tests described above. A small improvement in the fit quality is found (not shown). Unexpectedly, the impact of those additional cross-sections on the CHOCHO SCDs can also be non-negligible in regions with low NO2 columns: positive differences are, for example, observed over equatorial oceans but also over South America and Africa. The correlation plot of Fig. 4 clearly shows these two regimes. While the impact of the Pukite cross-sections on the glyoxal retrievals is understood and reliable for large NO2 SCDs, their influence at low NO2 SCD is more questionable and likely results from spectral interferences occurring between the different fitted spectra (e.g. with the Ring signature), which introduces additional noise in the product.
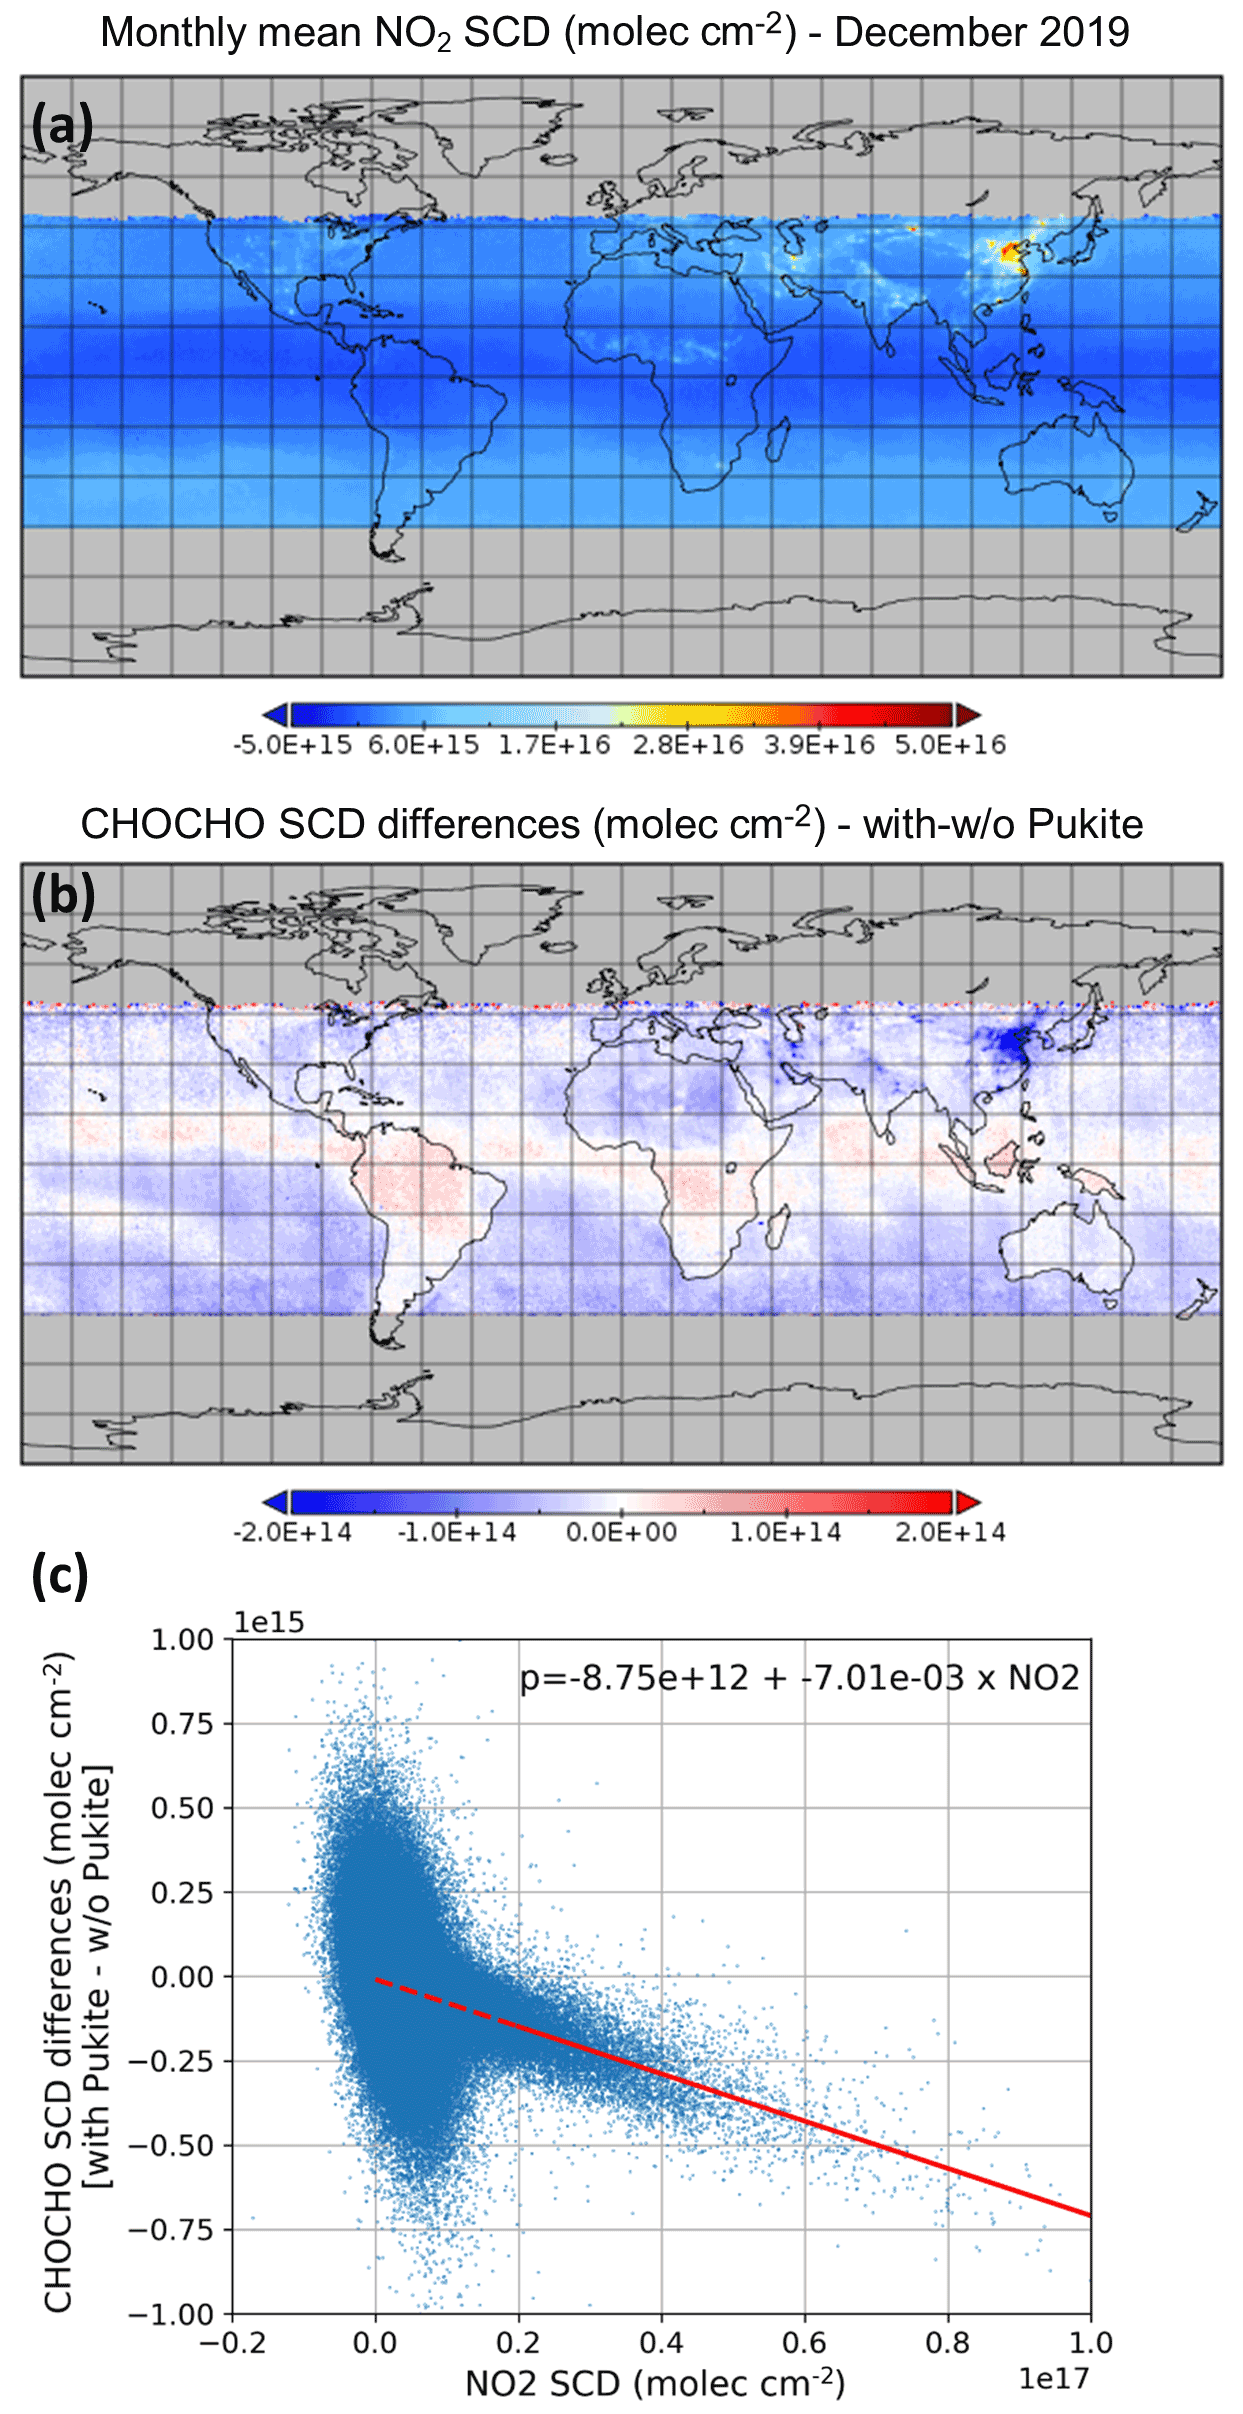
Figure 4(a) Monthly mean NO2 SCDs retrieved from TROPOMI data in December 2019. Panel (b) illustrates the CHOCHO SCD absolute differences (molec. cm−2) due to the incorporation of the Puķīte et al. (2010) cross-sections in the DOAS spectral fit, and panel (c) shows the correlation between those differences and the NO2 SCDs. The red line corresponds to a linear regression fit through all points with NO2 SCD larger than 2×10¹⁶ molec. cm−2.
To avoid this, rather than fitting additional cross-sections, we introduce an empirical correction applied to the glyoxal SCDs. This correction consists of subtracting from the glyoxal SCD a NO2-SCD-dependent value, directly prescribed from the linear regression fit through the sensitivity test results for all observations worldwide from December 2019, with NO2 SCDs larger than 2×10¹⁶ molec. cm−2 as illustrated in Fig. 4c. It is worth noting that the regression fit results agree well with the glyoxal SCD errors estimated from the simulations presented above (Fig. 3). For extreme pollution conditions such as what can be found in China during wintertime, this correction may lead to glyoxal column reduction up to 30 %.
3.2 Air mass factor computation
The computation of the air mass factor (AMF) used to convert the retrieved glyoxal slant column density (SCD) to vertical column density (VCD) relies on the formulation by Palmer et al. (2001), which decouples the radiative transfer through the atmosphere from the vertical distribution of the gas of interest. Radiative transfer simulations are performed with the vector model VLIDORT (Spurr and Christi, 2019) at the middle of the fitting window (448 nm) to compute so-called altitude-dependent air mass factors or box AMFs representing the sensitivity of the slant column to a small concentration change at any altitude. The AMF is obtained as the weighted mean of those box AMFs using as weights the vertical distribution of the glyoxal concentration.
Typically, the sensitivity of nadir-viewing UV–visible instruments is reduced in the lowermost atmospheric layers because of Rayleigh scattering. However, this sensitivity depends strongly on the observation geometry, on the surface reflectivity and altitude, and on the presence of clouds. For example, the sensitivity is generally further reduced for low sun elevation. For this reason, retrievals with solar zenith angles higher than 70∘ are filtered out. We use a precomputed five-dimensional look-up table of box AMFs spanning all observation conditions (see Table 2) and from which appropriate values are linearly interpolated for every TROPOMI observation. This interpolation uses as input the observation angles provided in the level-1 data, surface elevation taken from the GMTED2010 topography (Danielson and Gesch, 2011) and surface albedo extracted from the OMI minimum Lambertian-equivalent reflectivity climatology (Kleipool et al., 2008). The spatial resolution of the latter database () is coarse compared to the TROPOMI footprint and neglects anisotropy, which may introduce significant errors (Lorente et al., 2018). However, at the time of writing, it is the only database available at the S5p overpass time, although new Lambertian-equivalent reflectivity climatologies relying on past studies (e.g. Loyola et al., 2020; Tilstra et al., 2021, 2017) are currently being prepared. On the other hand, the level of noise in glyoxal retrievals generally requires averaging in space and/or time, which in turn will reduce part of those error sources. We also neglect the impact of clouds and aerosols on the radiative transfer. Instead we apply a stringent cloud filtering approach: only observations with an effective cloud fraction (as retrieved in the same spectral range and provided in the TROPOMI operational NO2 product; van Geffen et al., 2019) lower than 20 % are conserved. This approach is motivated by the fact that glyoxal slant columns tend to be biased high over bright scenes because of poorly understood residual spectral interferences (e.g. with the Ring signature). Similarly, scenes covered by snow and ice are also discarded.
Typical monthly-dependent a priori glyoxal vertical profile shapes necessary to perform the AMF computations have been calculated at the different satellite overpass times with the global chemical transport model MAGRITTE developed at BIRA-IASB, which inherits from the IMAGES model (Bauwens et al., 2016; Müller and Brasseur, 1995; Stavrakou et al., 2009b, 2013). This model runs at resolution and calculates the distribution of 182 chemical compounds, of which 141 species undergo transport. The modelled troposphere is vertically divided into 40 levels between the surface and the lower stratosphere and meteorological fields are provided by the ECMWF ERA-5 analyses. The chemical mechanism and deposition scheme have been recently updated (Müller et al., 2018, 2019). Anthropogenic NMVOC emissions are provided by the EDGAR 4.3.2 inventory (Huang et al., 2017) for the year 2012. Biomass burning emissions are obtained from the Global Fire Emission Database version 4 (GFED4s) (van der Werf et al., 2017). The emissions of isoprene and monoterpenes are calculated using the MEGAN-MOHYCAN model (Guenther et al., 2012; Müller et al., 2008). The model also incorporates biogenic emissions of methanol, methyl-butenol, ethylene, ethanol, acetaldehyde, formaldehyde and acetone, as well as oceanic emissions of methanol, acetone, acetaldehyde and alkyl nitrates (Müller et al., 2019). The global source of glyoxal in the model amounts to 47 Tg yr−1 (in 2013), of which about 4 Tg yr−1 is due to direct biomass burning emissions and 18, 6, 9 and 9 Tg yr−1 are due to the atmospheric degradation of isoprene, acetylene, aromatics and monoterpenes, respectively (Müller et al., 2019).
To account for the difference in spatial resolution between the model and the observations, a priori profiles are rescaled to the effective satellite pixel surface elevation using the formulation proposed by Zhou et al. (2009). Enhanced glyoxal concentrations have been detected over oceans in several studies (Coburn et al., 2014; Lerot et al., 2010; Sinreich et al., 2010), but current models cannot reproduce this. For this reason, over oceans, we use an a priori glyoxal concentration profile measured with an airborne MAX-DOAS instrument over the Pacific Ocean during the TORERO campaign (Volkamer et al., 2015).
3.3 Background correction
As already mentioned, systematic (row-dependent) biases in the retrieved SCDs often remain due to small residual interferences with spectral signatures from other absorbers or due to instrumental effects. In the particular case of push-broom imaging instruments such as OMI/TROPOMI, across-track row-dependent biases (so-called stripes) often occur due to the imperfect calibration of the different CCD detector rows. To reduce those biases, a background correction using observations in a remote reference sector is generally applied as part of the retrieval algorithm (e.g. Alvarado et al., 2014; Chan Miller et al., 2014; Lerot et al., 2010; Richter and Burrows, 2002; De Smedt et al., 2018). The principle of this background correction is to add offset values to the retrieved SCDs to ensure that the resulting mean VCD in a clean remote region match an a priori known tropospheric glyoxal column. Here we use the Pacific Ocean as reference sector with a constant reference VCD of 1×10¹⁴ molec. cm−2. This value was chosen according to independent measurements performed in this region (Sinreich et al., 2010) since current global models fail to reproduce remote sensing glyoxal levels observed over oceans (Fu et al., 2008; Myriokefalitakis et al., 2008; Stavrakou et al., 2009b). There is nevertheless an uncertainty related to this reference value, which impacts the overall level of the product. This error component is further discussed in Sect. 3.4.3 and is taken into account to estimate the total glyoxal VCD error. As all intermediate variables (SCD, corrected-SCD, AMF) are provided in the product, a user could recompute glyoxal VCDs using a different reference Pacific value.
The background correction is applied on a daily basis in different steps:
-
First, a destriping procedure such as proposed in Boersma et al. (2007) is applied, consisting of an offset correction determined separately for each instrumental row and relying on clear-sky observations from the equatorial Pacific Ocean (15∘ S–15∘ N, 165–220∘ E). The offset corrections are added to all glyoxal SCDs worldwide, considering their respective row.
-
Additionally to the high-frequency stripes, a broadband row-dependent structure, of which the shape also depends on the latitude, was identified as illustrated in Fig. 5a. This figure compares the row dependence of mean uncorrected VCDs in the Pacific Ocean at equatorial and northern mid-latitudes. The two curves are somehow anti-correlated, meaning that the destriping correction based on equatorial latitudes only as applied in step 1 is not sufficient and even reinforces the mid-latitude structure. The second step of the background correction thus aims at reducing this broadband row-dependent structure at all latitudes while maintaining the mean latitudinal distribution of the measured background glyoxal columns. For this, Pacific Ocean measurements (40∘ S–40∘ N, 165–220∘ E) are binned per 20∘ in latitude and in groups of 15 rows in a two-dimensional matrix. For this step, we use reference VCDs depending on the latitude and resulting from the averaging of the binned VCDs along the row dimension. A corresponding two-dimensional matrix of SCD offset corrections is then computed in order; once applied to the binned VCDs, the corrected values match the reference VCDs. Interpolation through this correction matrix provides offsets to be applied to all SCDs retrieved worldwide. For satellite pixels out of the latitude range, no extrapolation is performed, but instead the nearest-neighbour correction values are taken.
-
Finally, the overall level of the product is adjusted with a single offset correction to ensure that the mean of all clear-sky VCDs within the full reference sector (40∘ S–40∘ N, 165–220∘ E) is equal to 1×10¹⁴ molec. cm−2. Figure 5b shows how the identified row dependence in the VCDs at different latitudes has been reduced. The general level of the columns has also been adjusted.
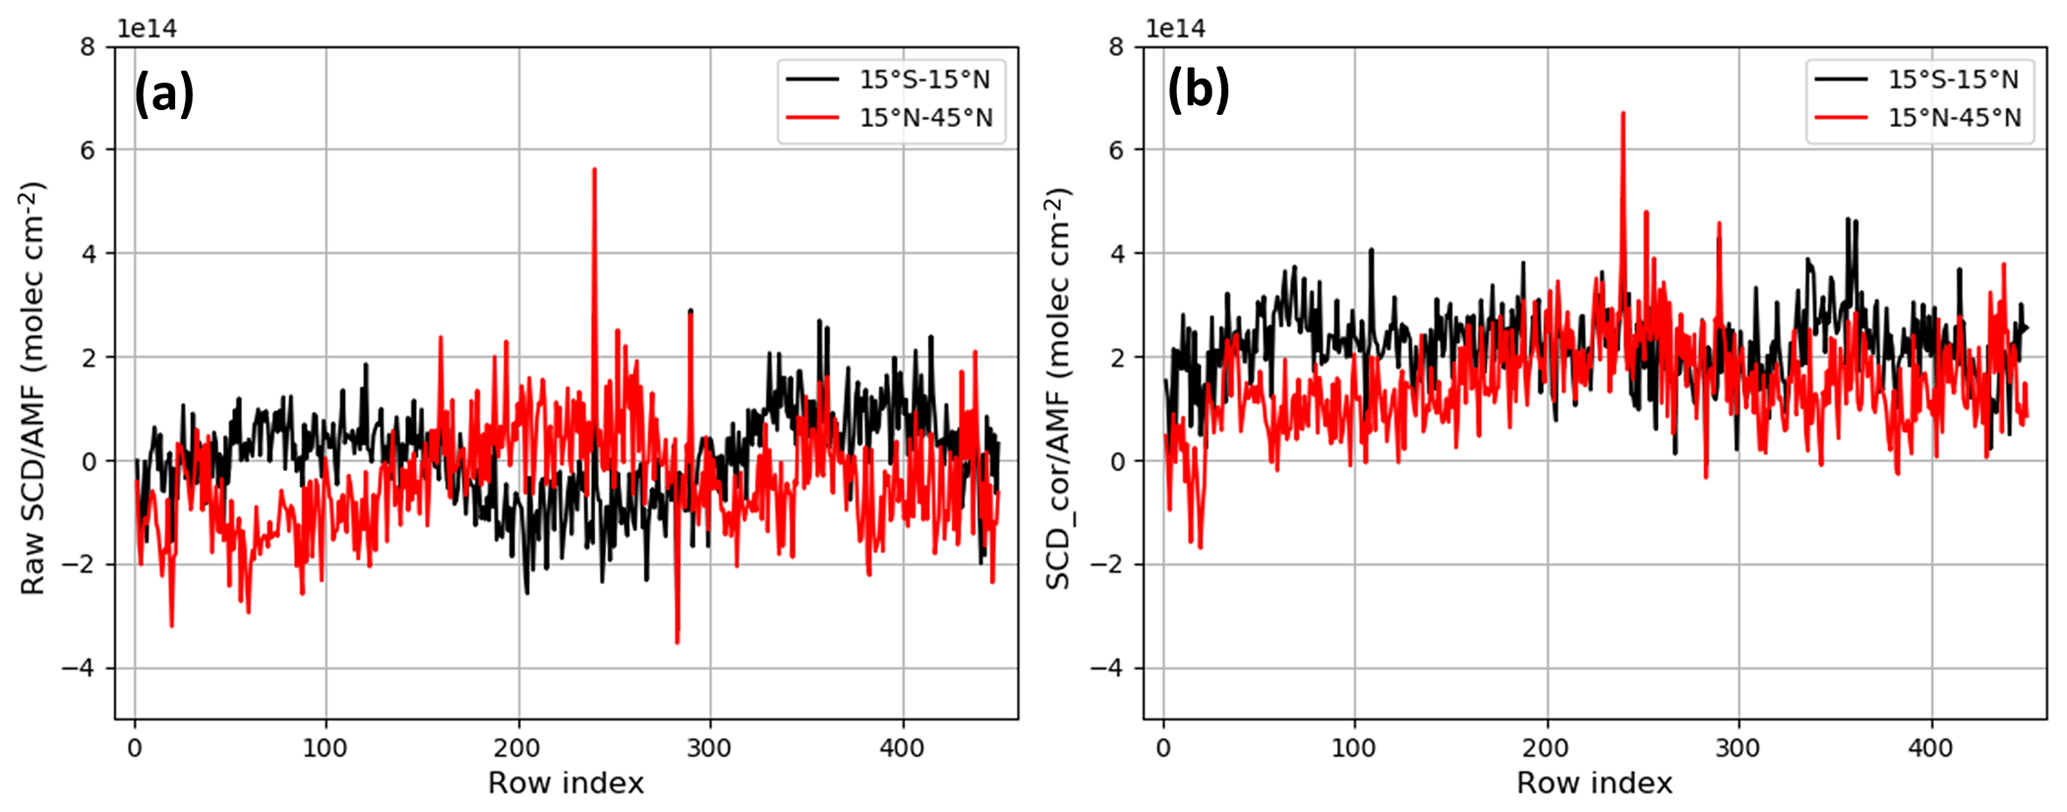
Figure 5Row dependence of the glyoxal vertical columns of S5p orbit no. 5877 (1 December 2018) averaged in an equatorial latitude band and in a northern mid-latitude band. (a) No background correction is applied; (b) a latitude-dependent background correction is applied.
3.4 Uncertainty estimates
Glyoxal tropospheric column retrievals are affected by many sources of uncertainties in the different components of the algorithm. The low glyoxal optical depth makes its retrieval highly sensitive to measurement noise and to spectral interferences with strong absorption signatures of other species or with instrumental features. Although the measurement noise can be reduced by averaging column retrievals from individual observations, spectral interferences generally lead to residual systematic errors (biases), which cannot be easily eliminated. The background correction described above aims at reducing those biases, but it has its own limitations. For example, the reference glyoxal tropospheric column within the reference sector is poorly known. In addition to spectral fit errors, there are also significant errors associated with the air mass factor calculations, mostly originating from input parameter uncertainties. For estimating the total glyoxal column error, we assume that the different error components are uncorrelated and can be summed quadratically as in (Boersma et al., 2011; Lerot et al., 2010; De Smedt et al., 2008, 2018). If the glyoxal vertical column Nv is expressed as
with NS being the retrieved slant column; M the AMF; and the background correction term where NS,0, M0, and are the slant columns, AMF, and the reference vertical column within the reference sector, respectively; then the total glyoxal vertical column error can be written as
where , σM and are the errors in the slant column, the air mass factor and the reference value used in the background correction, respectively. In the following subsections, we discuss the different contributions to each of those terms. Errors can affect the retrievals randomly or systematically (biases). While the main random error is caused by the propagation of the instrumental photon detector shot noise on the measured radiances, the other error components are considered as being systematic. It has however to be noted that the latter assumption may lead to conservative systematic error estimates and to an underestimation of the product scatter, depending on the time and spatial resolution of interest. In particular, uncertainties associated with the input parameters needed for the AMF calculation are directly related to the resolution of the used databases and may appear as random at coarser resolution. This has been discussed by Vigouroux et al. (2020), who attributed part of the scatter in formaldehyde vertical column TROPOMI/MAX-DOAS differences to a random component of the AMF errors.
3.4.1 Slant column uncertainties
As mentioned above, the radiance measurement noise directly propagates into the glyoxal slant column retrieval and leads to large random errors (or precision) due to the low glyoxal optical depth. Those are easily estimated using the fit residual rms values and the covariance matrix of the cross-sections included in the fit (Danckaert et al., 2017). In the visible spectral range, the TROPOMI signal-to-noise ratio is about 1600 over dark scenes. This leads to a glyoxal VCD precision (i.e. /AMF) in the range of 6 ×10¹⁴–10 ×1014 molec. cm−2 as illustrated in Fig. 6d. This range of values is consistent with the scatter observed in the retrieved glyoxal SCDs in regions without any significant glyoxal source. Over bright scenes, e.g. covered by clouds or snow, those errors significantly drop because of the increased signal-to-noise ratio. For individual observations, random errors dominate and averaging is needed to extract meaningful glyoxal signals.
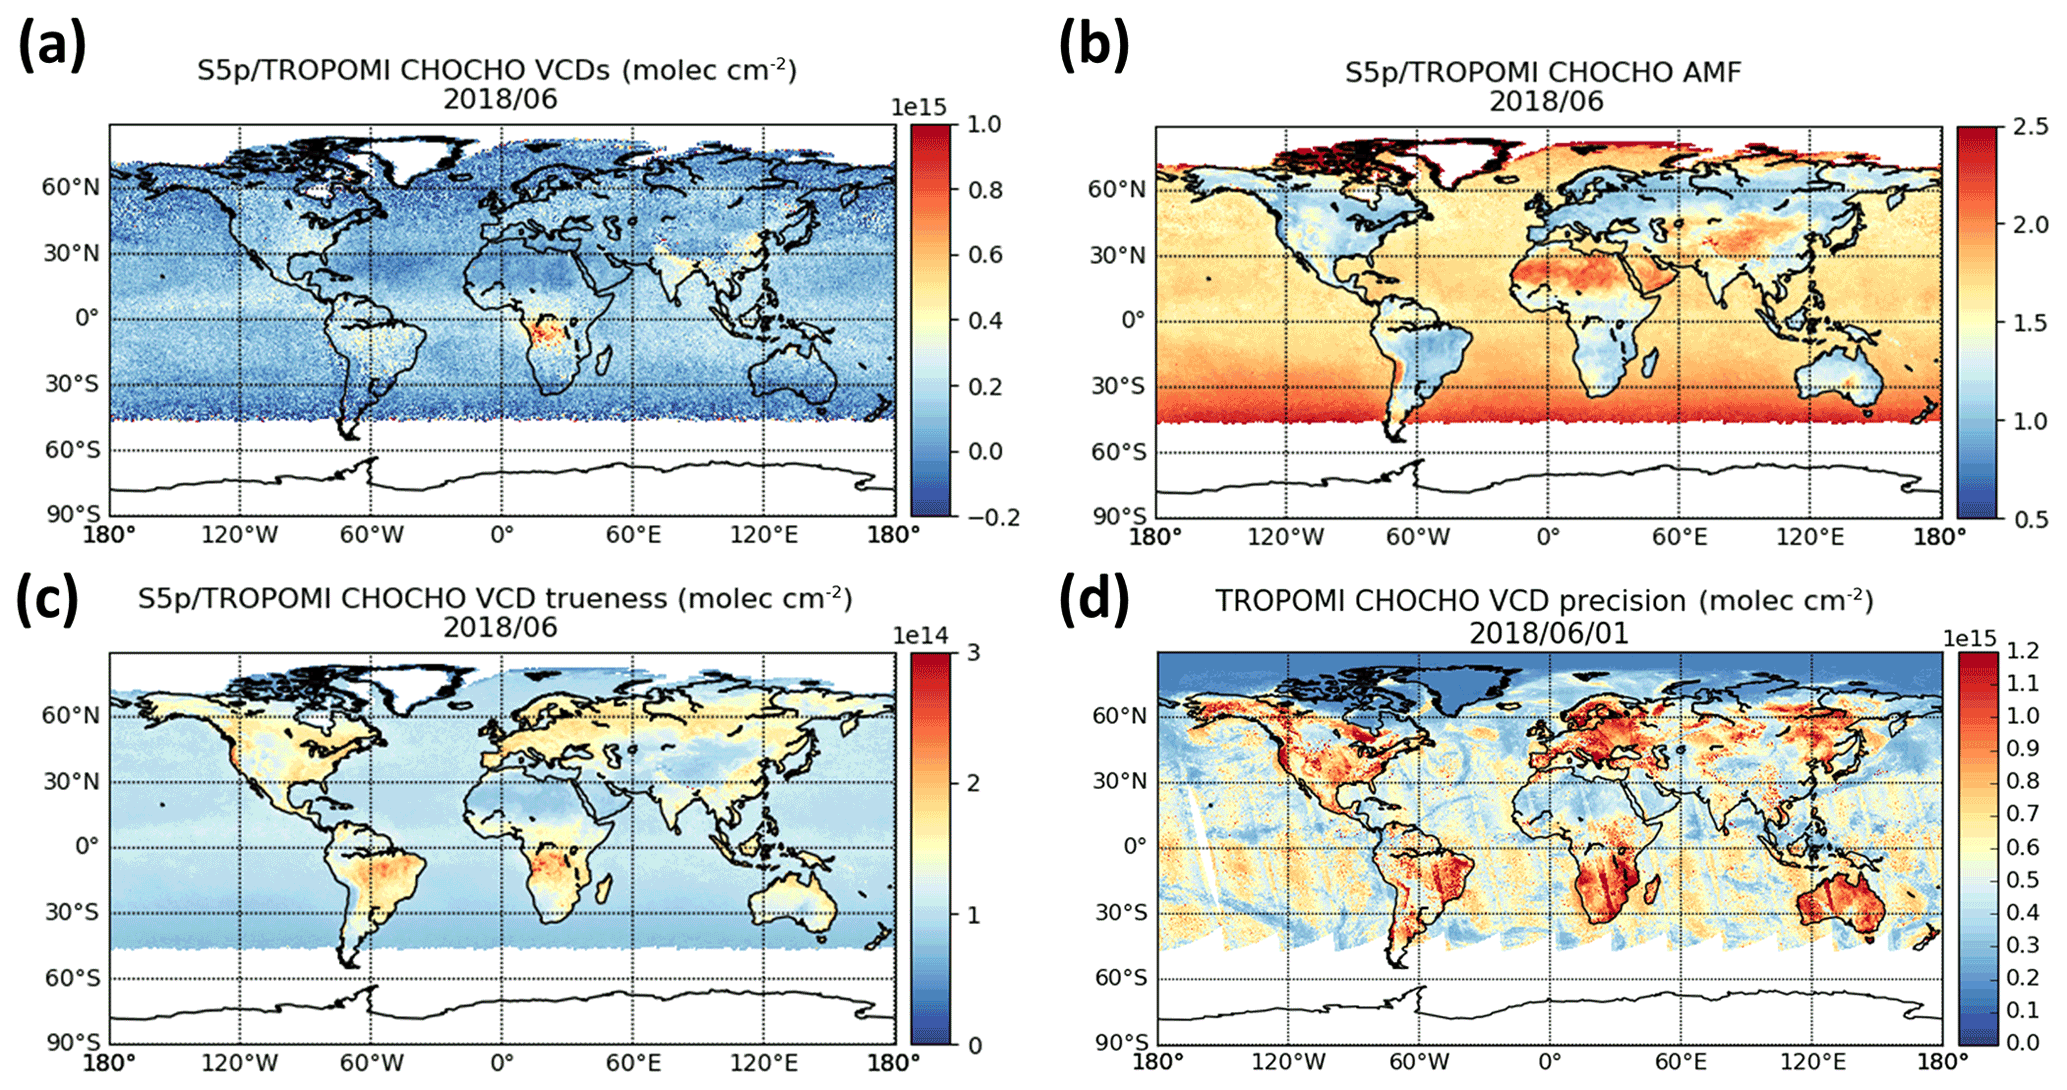
Figure 6(a) TROPOMI June 2018 monthly means of glyoxal tropospheric columns, glyoxal air mass factors (panel b) and glyoxal tropospheric column systematic errors (panel c). Scenes contaminated by clouds or ice/snow have been filtered out. Panel (d) shows glyoxal tropospheric column random errors for 1 single day, in which all observations have been kept to illustrate the impact of the scene brightness.
There are also systematic errors associated with the DOAS spectral fit that are mainly dominated by absorption cross-section uncertainties, by interferences with other species (O4, liquid water, Ring, etc.) or by other effects such as residual stray light. Those contributions are difficult to assess and can only be estimated from sensitivity tests (Lerot et al., 2010). In general, this error term can be as high as 2 ×10¹⁴–3 ×10¹⁴ molec. cm−2. However, the use of a radiance as reference in the DOAS fit and the application of a background correction removes a large part of the systematic error in the slant column fit (see Sect. 3). As those corrections are not always sufficient to eliminate completely the SCD systematic errors due to local conditions (local pollution, residual clouds, etc.), we set to 1×10¹⁴ molec. cm−2.
3.4.2 AMF uncertainties
The errors in the air mass factor depend on the input parameter uncertainties and on the sensitivity of the air mass factor to each of them. This contribution can be broken down into the squared sum (Boersma et al., 2011; Lerot et al., 2010; De Smedt et al., 2018) as
where and σS are typical uncertainties on the surface albedo and profile shape, respectively.
The contribution of each parameter to the total air mass factor error depends on the observation conditions. Therefore, a small table of air mass factor derivatives spanning all observation conditions was computed using VLIDORT, considering glyoxal box profile shapes with different effective heights.
The AMF error component related to the surface reflectivity (first term of Eq. 3) is calculated using an estimated uncertainty on the albedo of 0.02 (Kleipool et al., 2008). Note that this uncertainty can be occasionally larger, in particular at high latitudes where snowfall may cause abrupt changes in scene albedo. The uncertainty associated with the a priori profile shapes (the smoothing error) used in the retrieval is more difficult to assess, especially due to the scarcity of independent glyoxal profile measurements. For every observation, an effective height corresponding to the a priori glyoxal profile used in the AMF calculation is derived and used to extract the appropriate AMF derivative, and σS is taken equal to 50 hPa. The latter value corresponds to the typical standard deviation of the model profile shape effective heights over polluted regions.
Formulation (3) is valid for clear-sky pixels and the stringent cloud filtering we use. However, residual clouds undoubtedly impact the radiative transfer and generally shield the lowermost atmospheric layers. Therefore, we anticipate that the clear-sky assumption generally leads to a low bias on the retrieved glyoxal columns in the case of residual clouds. On the other hand, the spectral interferences over bright (cloudy) scenes as discussed in Sect. 3.2 impact the retrievals the other way round. The third term in Eq. (3) accounts for possible errors in the AMF model itself, including the neglect of aerosols and clouds, wavelength dependence, etc.; it is estimated to be 15 % of the air mass factor (Lorente et al., 2017).
3.4.3 Background correction uncertainties
Although the background correction is designed to overcome systematic features/deficiencies of the slant column fitting, some errors are also associated with this procedure. In particular, systematic errors in the reference slant columns and their air mass factors are propagated into the computed correction values. Also, there is an uncertainty related to the reference glyoxal vertical column value in the reference sector as mentioned in Sect. 3.3. The three last terms of Eq. (2) represent the total background correction uncertainty in which is the systematic slant column error fixed to 1×10¹⁴ molec. cm−2 (see above Sect. 3.4.1), and M0 and represent the air mass factors and their associated errors within the reference sector. In practice, those quantities are treated similarly as the reference slant columns (i.e. binned in latitude and row bins – see Sect. 3.3). represents the error associated with the reference value and is fixed to 5×10¹³ molec. cm−2. Using a different reference value would directly impact the overall level of glyoxal VCDs worldwide, with some small modulations related to the ratio of the AMFs over the Pacific and in other regions following Eq. (1).
3.4.4 Total systematic uncertainties
Figure 6c shows the estimated mean VCD systematic errors for the month of June 2018 when all systematic error sources are combined together using Eq. (2). Note that the conversion of the AMF error into an absolute vertical column error (second term of the equation) requires this error to be multiplied by the corresponding vertical column. Because of the high level of noise in the product, using the retrieved column for this would lead to a strong overestimation of the systematic error. To circumvent this, we use instead precomputed climatological glyoxal noise-free VCDs.
Total glyoxal VCD systematic errors are generally in the range 1 ×10¹⁴–3 ×10¹⁴ molec. cm−2, corresponding to about 30 %–70 % for emission regimes (columns larger than 2×10¹⁴ molec. cm−2). Figure 7 shows the zonally averaged total systematic error along with its different components for one S5p orbit passing over Africa. In general, the three components contribute similarly to the total error for emission conditions. On the contrary, the AMF error becomes smaller in background conditions while the two other terms dominate. Note that pixels strongly contaminated by clouds (cloud fraction >20 %) or covered by snow/ice are discarded. Systematic errors are expected to be large for those pixels mainly due to spectral interference effects (see Sect. 3.2) and also because the information content on glyoxal is reduced in the case of cloud shielding. Figure 6b shows monthly mean AMFs for the same month. Small AMFs are generally caused by a priori profiles peaking near the surface, which makes the retrieval more sensitive to albedo uncertainties and to a lesser extent to the a priori profile shape uncertainties. This explains the anti-correlation between the AMFs and the systematic errors. In contrast, large AMFs are caused either by bright surface or by background a priori profiles. For such cases, systematic errors are smaller. Note that satellite column averaging kernels, defined as the box AMF divided by the total AMF (Eskes and Boersma, 2003), are provided for every observation. They can be used to remove the smoothing error component when comparing the satellite data to any other external data.
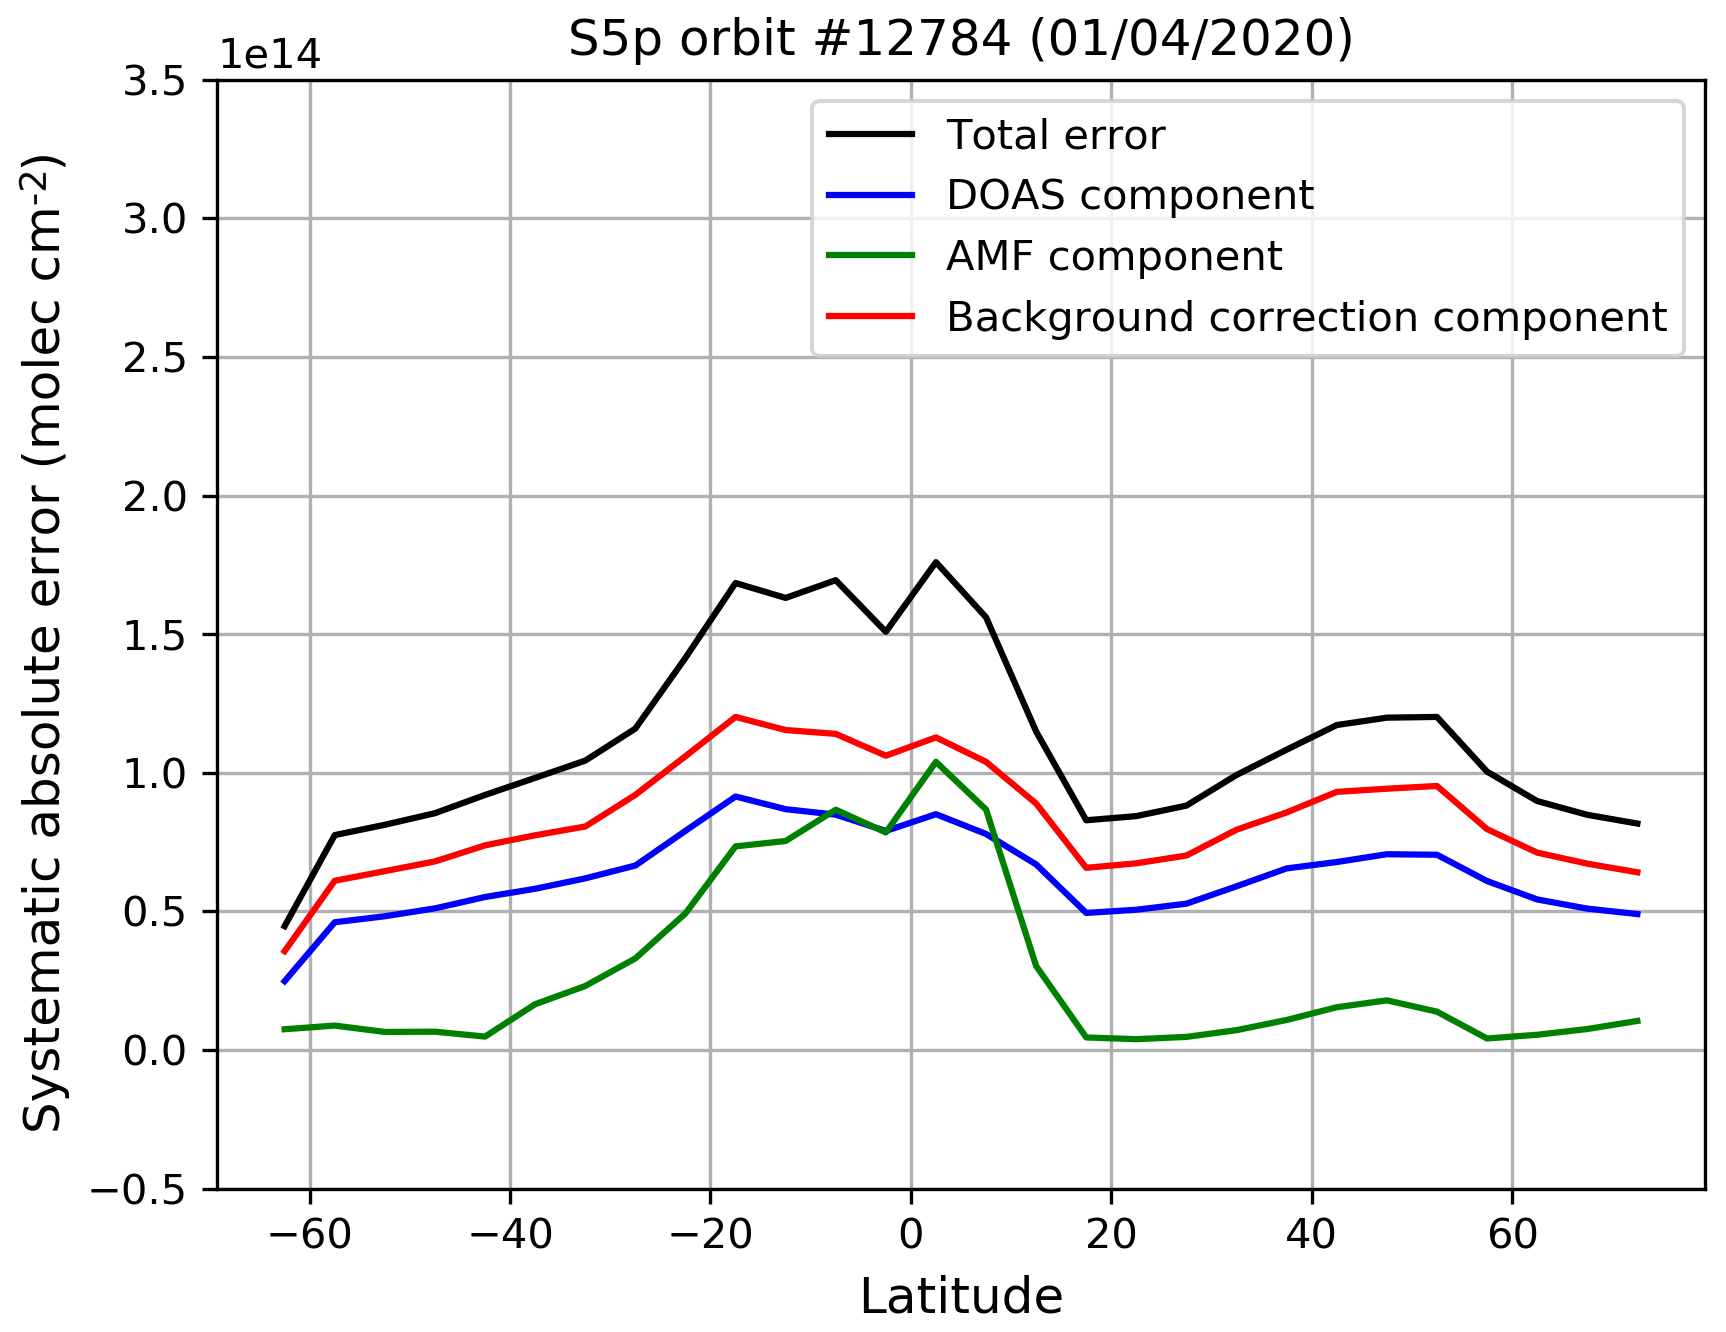
Figure 7Zonal mean of the total glyoxal VCD systematic error along with its different components for one single S5p orbit passing over Africa on 1 April 2020.
4.1 Algorithmic differences for GOME-2A/2B and OMI glyoxal retrievals
Glyoxal tropospheric columns have also been retrieved from other satellite instruments, namely GOME-2 on board the platforms Metop-A and Metop-B and OMI on board Aura. Retrieval settings very similar to those described in the previous section were applied. For GOME-2A and GOME-2B, we use data records recently produced within the operational environment of the EUMETSAT AC SAF (Valks et al., 2020). We list here the remaining differences with respect to the TROPOMI algorithmic baseline and the specificities for each instrument.
All data sets essentially share the same DOAS fit settings (reference cross-sections, fit window, polynomial degree, etc.). The heterogeneity cross-sections are omitted for the GOME-2 and OMI retrievals. While the instrumental design of GOME-2 makes it weakly sensitive to scene heterogeneity, it would be beneficial for OMI to include similar cross-sections but that would imply a reprocessing of the complete slant column data set data with limited added-value for the large-scale comparison with TROPOMI that we present in the next subsection. For the GOME-2 instruments, we also fit two additional cross-sections representative of the instrumental sensitivity to light polarization as provided from the level-1 key data (EUMETSAT, 2011) as well as one pseudo-cross-section to account for an along-track spectral resolution change occurring due to instrumental temperature change (Azam et al., 2015). Note that for GOME-2 the cross-sections are convolved with an instrumental slit function optimized as part of the wavelength calibration for every measured irradiance (De Smedt et al., 2015), which allows for accounting for the known long-term drift of the GOME-2 instrument spectral response function.
Differences in air mass factor calculations consist of only using, over land, a priori profiles provided by IMAGESv2, the chemical transport model predecessor of MAGRITTE, at the coarser resolution of . For the GOME-2 instruments, we use the directionally dependent Lambertian-equivalent reflectivity database produced by Tilstra et al. (2021) instead of the OMI database.
A background correction procedure is applied consistently with the one used for TROPOMI. With the GOME-2 instruments being whisk-broom scanners, there is no destriping procedure as such but instead a viewing-zenith-angle-dependent correction is applied, also relying on the slant columns retrieved in the equatorial Pacific sector. For example, this correction may account for remaining biases related to the instrumental polarization sensitivity. For both OMI and GOME-2, the row or viewing zenith angle (VZA) dependence does not show any obvious change along the orbit, and the corresponding correction thus relies only on the low-latitude measurements.
Note that the OMI and GOME-2 glyoxal products are filtered for cloudy scenes using cloud fraction lower than 20 % as taken from the O2–O2 (Veefkind et al., 2016) and OCRA (Lutz et al., 2016) cloud products, respectively. The empirical correction for strong NO2 absorption signature described in Sect. 3.1 has been applied to those instruments as well. In the following section, we compare the TROPOMI glyoxal retrievals with the OMI and GOME-2A/2B data sets. The OMI record covers the period 2005–2018, while GOME-2A and GOME-2B span the periods 2007–2017 and 2013–2020, respectively. OMI and GOME-2A records were interrupted when their respective quality was degraded too severely and other instruments were available to continue the morning and afternoon time series.
4.2 Glyoxal satellite intercomparison
4.2.1 Comparison of the noise level
As mentioned before, the level of noise in the satellite glyoxal tropospheric column products is large compared to the real signal. This is illustrated in the upper panel of Fig. 8, which shows all individual clear-sky TROPOMI glyoxal columns retrieved in the Pacific Ocean on 1 June 2018 and plotted as a function of their latitude. The scatter is significant (σ≈5 ×10¹⁴–7 ×10¹⁴ molec. cm−2) with respect to the small glyoxal VCDs averaged in 5∘ latitude bins in this sector. The lower panel compares the standard deviation of the retrievals from TROPOMI, OMI, GOME-2A and 2B in the same remote sector for 1 June of their respective first year of operation. The scatter in the retrievals is directly linked to the instrumental signal-to-noise ratio, which is documented to be around 500 for OMI (Schenkeveld et al., 2017), 1000 for GOME-2 (Zara et al., 2018) and 1500 for TROPOMI (Kleipool et al., 2018). In practice, we see that the CHOCHO observation noise is indeed slightly larger for OMI and that GOME-2B retrievals are noisier than those from GOME-2A, which have a level of noise similar to TROPOMI. Considering the very small footprint size of TROPOMI (3×7.5 and 3×5.5 km2 after August 2019) compared to the other instruments (GOME-2: 80×40 km2; OMI: 13×24 km2 at nadir), the TROPOMI observation noise is remarkably low. More importantly, the much larger amount of TROPOMI data compared to OMI () and GOME-2 () allows for maintaining a better time or spatial resolution for a given target noise level. For example, the random error associated with the daily glyoxal column averaged in an area defined by a circle with a radius of 50 km will be less than 0.5×10¹⁴ molec. cm−2 for TROPOMI, while it will remain larger than 2.5×10¹⁴ and 4.0×10¹⁴ molec. cm−2 for OMI and GOME-2, respectively.
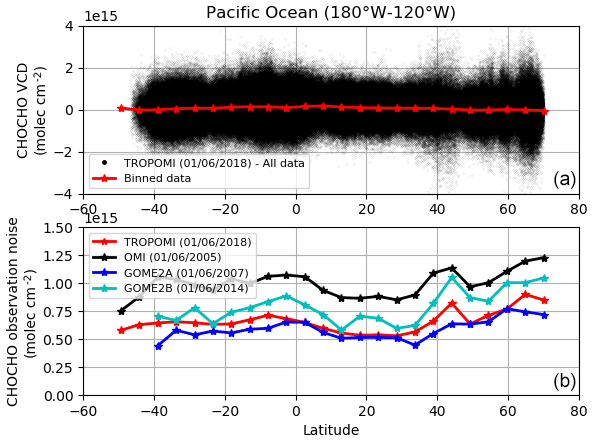
Figure 8Illustration of the level of noise in satellite CHOCHO VCD retrievals. Panel (a) shows all clear-sky individual glyoxal VCDs retrieved in the Pacific Ocean from TROPOMI observations on 1 June 2018. The scatter is very large compared to the low, real signal as illustrated by the data binned in 5∘ latitude bands. Panel (b) compares the standard deviation of the retrievals in the same sector from TROPOMI, OMI and GOME2A/2B on 1 June of their respective first years of operation.
This is illustrated in Fig. 9, which compares January monthly mean glyoxal VCD fields over Asia at the resolution of 0.05∘ for TROPOMI and OMI (upper panels) and 0.25∘ for GOME-2A and OMI (lower panels) after 1 year of their respective operation. At the resolution of 0.05∘, the level of noise in the TROPOMI glyoxal map is very low, and many details can be distinguished in the glyoxal spatial distribution. In particular, hot spots of glyoxal over many megacities are clearly identified (e.g. over Bangkok, New Delhi, Ho Chi Minh City, Shenzhen) and also over Cambodia where large fires occur every year from January to March. At this resolution of 0.05∘, the level of noise in the OMI map remains high and prevents us from distinguishing such details. At the coarser spatial resolution of 0.25∘, the reduction of the noise in the OMI and GOME-2 monthly glyoxal fields appears to be sufficient to better distinguish the glyoxal spatial distribution but at the cost of a significant smoothing. In the next section, we will intercompare the four satellite products at low temporal and spatial resolution in order to minimize the impact of the noise and to identify possible systematic discrepancies.
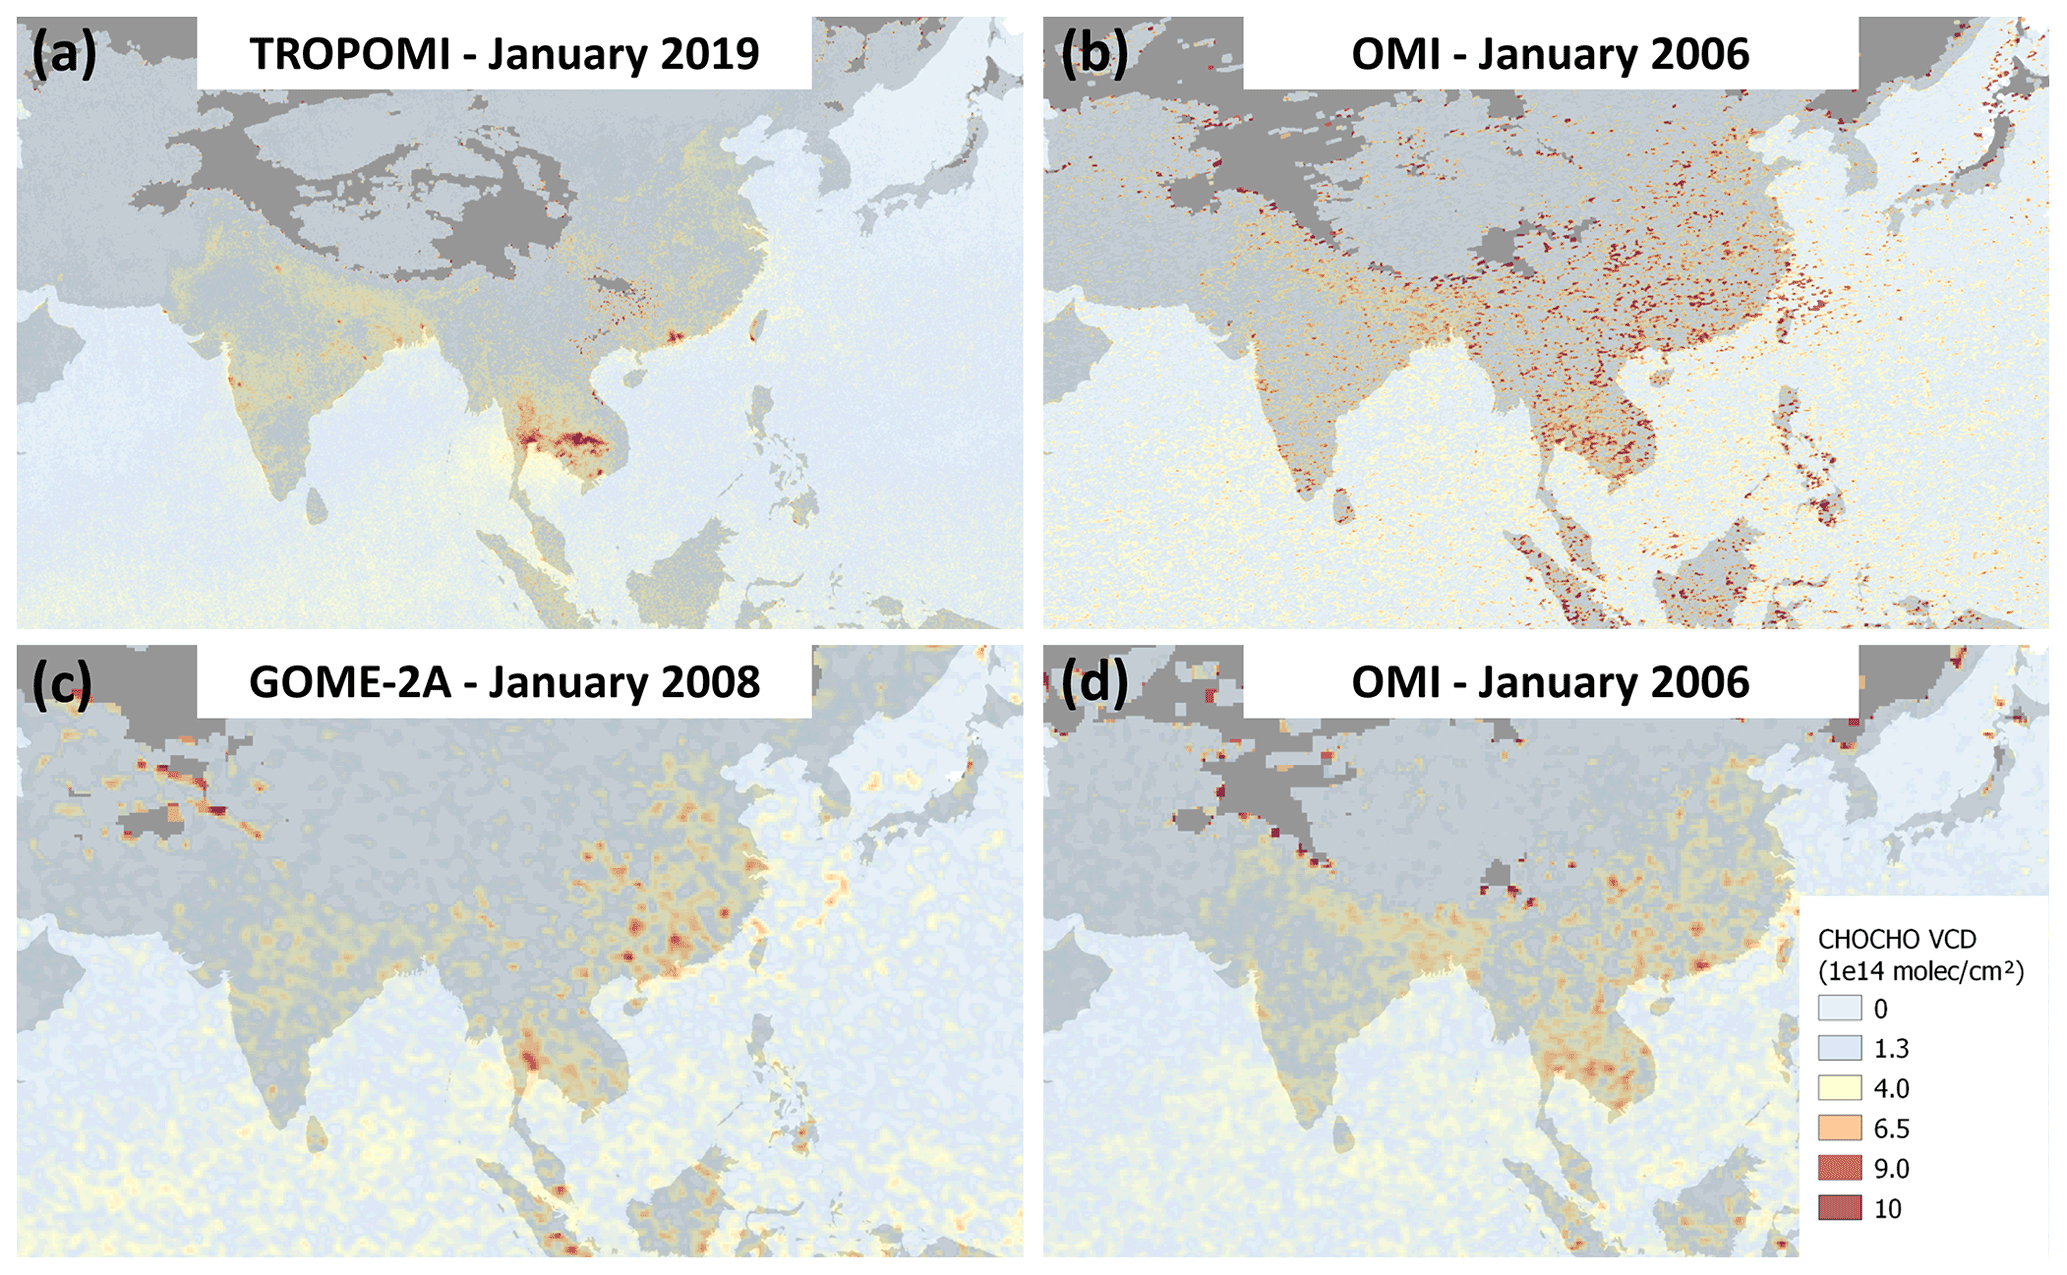
Figure 9Illustration of the impact of the instrumental signal-to-noise and available amount of data on monthly mean glyoxal VCD fields retrieved from different satellite instruments. (a) TROPOMI data for January 2019 gridded at a resolution of 0.05∘, (b) OMI data for January 2006 gridded at a resolution of 0.05∘, (c) GOME-2A data for January 2008 gridded at a resolution of 0.25∘, and (d) OMI data for January 2006 gridded at a resolution of 0.25∘. Cloudy scenes have been filtered out and a smoothing filter has been applied on the four presented fields based on a spatial mean with the nearest neighbouring grid cells.
4.2.2 Comparison of mean glyoxal fields
First, Figs. 10 and 11 compare seasonal maps of glyoxal VCDs generated from TROPOMI, OMI and GOME-2A/2B data products. In order to reduce the data scatter for each instrument, those maps are based on long time series as indicated in the figures. Therefore, a one-to-one match is not expected. As can be seen, the consistency between the four instruments is excellent. Glyoxal patterns are captured similarly for all seasons in terms of both spatial distribution and VCD values. The largest glyoxal columns are observed in tropical regions, where biogenic emissions are important, and in regions with important fire events (e.g. Amazonia and northern Africa in SON, Thailand/Southeast Asia in MAM, western USA in August). At mid-latitudes, the glyoxal columns follow the seasonal cycle of biogenic activity with maximum values during summertime. Localized hot spots of glyoxal are visible over megacities corresponding to strong anthropogenic emissions (e.g. North China Plain, Bangkok, Teheran, New Delhi, São Paulo).

Figure 10Comparison of long-term averaged global CHOCHO VCDs (in 1014 molec. cm−2) derived from GOME-2A, GOME-2B, OMI and TROPOMI sensors, for the March–April–May period (left panels) and the June–July–August period (right panels).
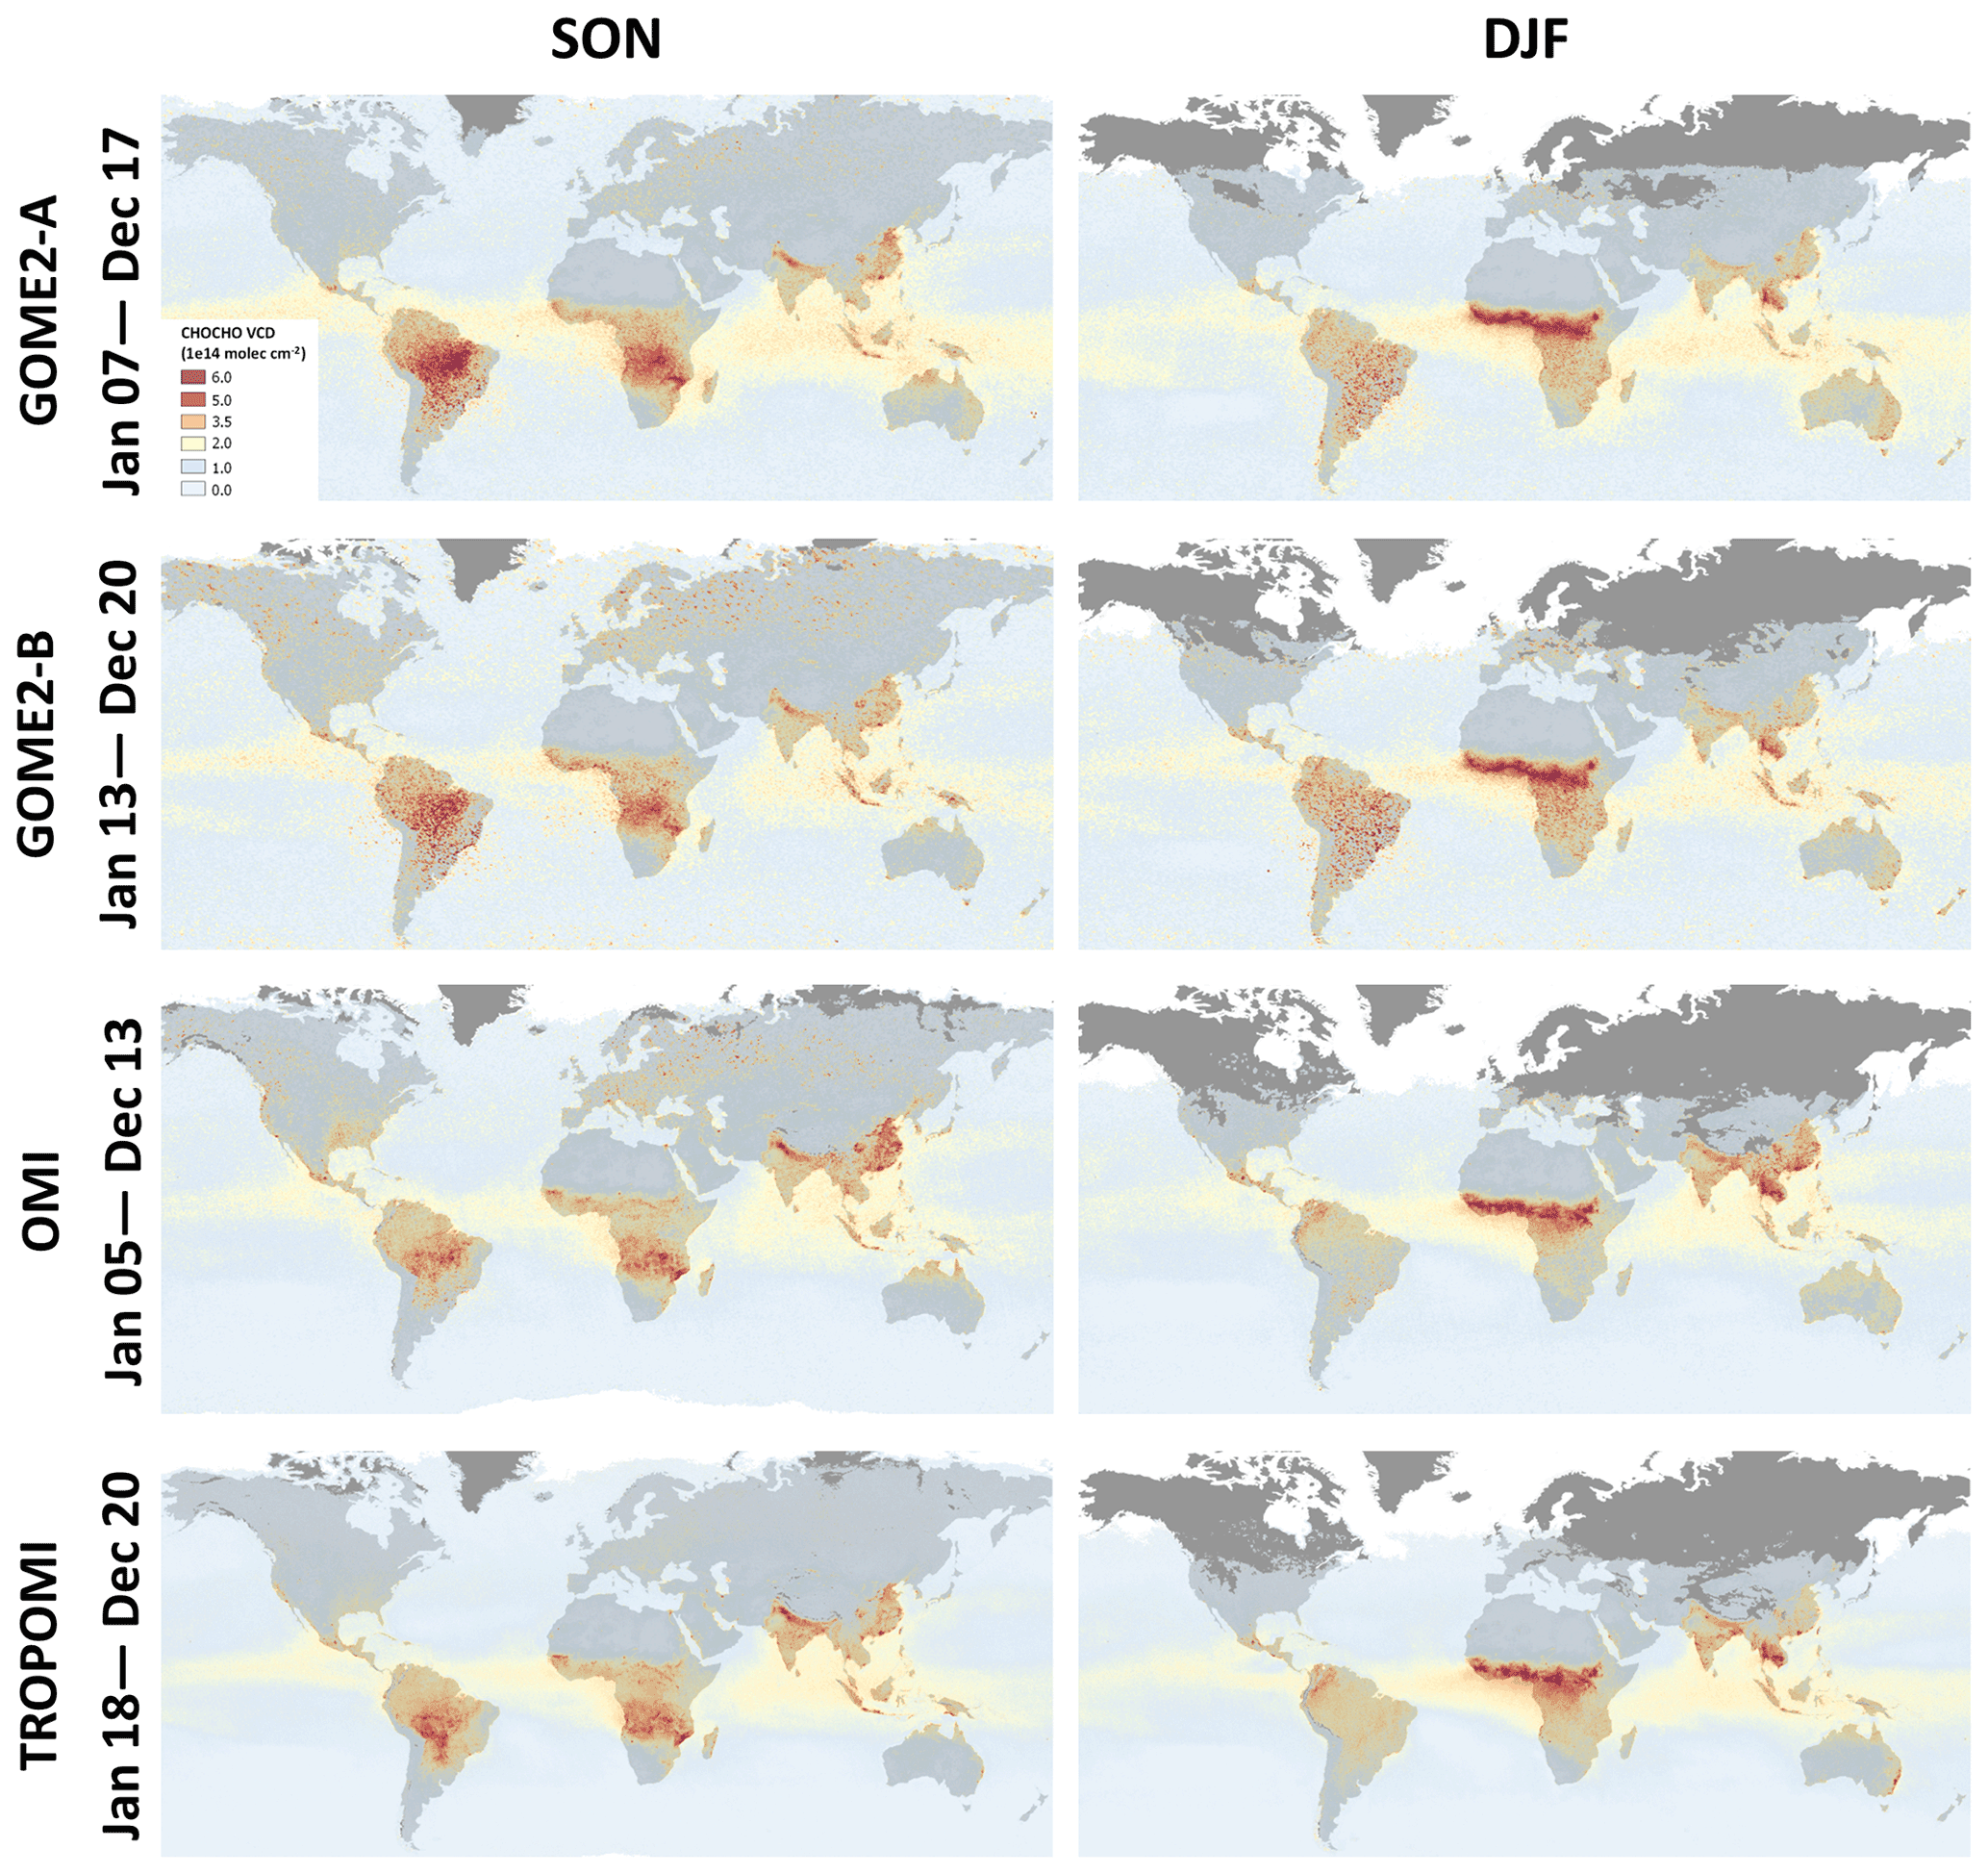
Figure 11Comparison of long-term averaged global CHOCHO VCDs (in 1014 molec. cm−2) derived from GOME-2A, GOME-2B, OMI and TROPOMI sensors, for the September–October–November period (left panels) and the December–January–February period (right panels).
In contrast to TROPOMI and OMI, the level of noise in the GOME-2 data sets significantly increases over the South Atlantic Anomaly despite the application of a spike-removal procedure (Sect. 3.1). Overall the GOME-2B maps are noisier than those from other sensors due to the lower signal-to-noise ratio of the spectra and a shorter time series. Compared to the UV, the sensitivity to the surface is larger in the visible, which may introduce interferences with the spectral signature of specific ground surfaces and thus may potentially lead to a bias on the retrieved columns. A striking example is over Kara-Bogaz-Gol near the Caspian Sea, which is one of the saltiest lakes in the world and contains large concentrations of sediments (Kosarev et al., 2009). The glyoxal signal detected over that lagoon is unlikely to be physical and likely originates from interferences with the ground reflectance spectral signature.
For a more detailed investigation of the consistency of the TROPOMI data set with OMI and GOME-2A/2B, we compare complete time series of monthly median glyoxal columns in selected regions (shown in Fig. 12). The red rectangles indicate the regions in which we focus in Figs. 13 and 14, while the global statistics for all highlighted regions are given in Fig. 15. Detailed figures are provided for all regions as supplementary material (Figs. S1, S2, S3, S4 in the Supplement). Figure 13 directly compares the four full time series, while Fig. 14 compares the typical climatological seasonal variations as obtained by combining all available years. The error bars in the latter figure represent the interannual variability, and the 2σ standard deviation of the four satellite products is indicated in the inset.
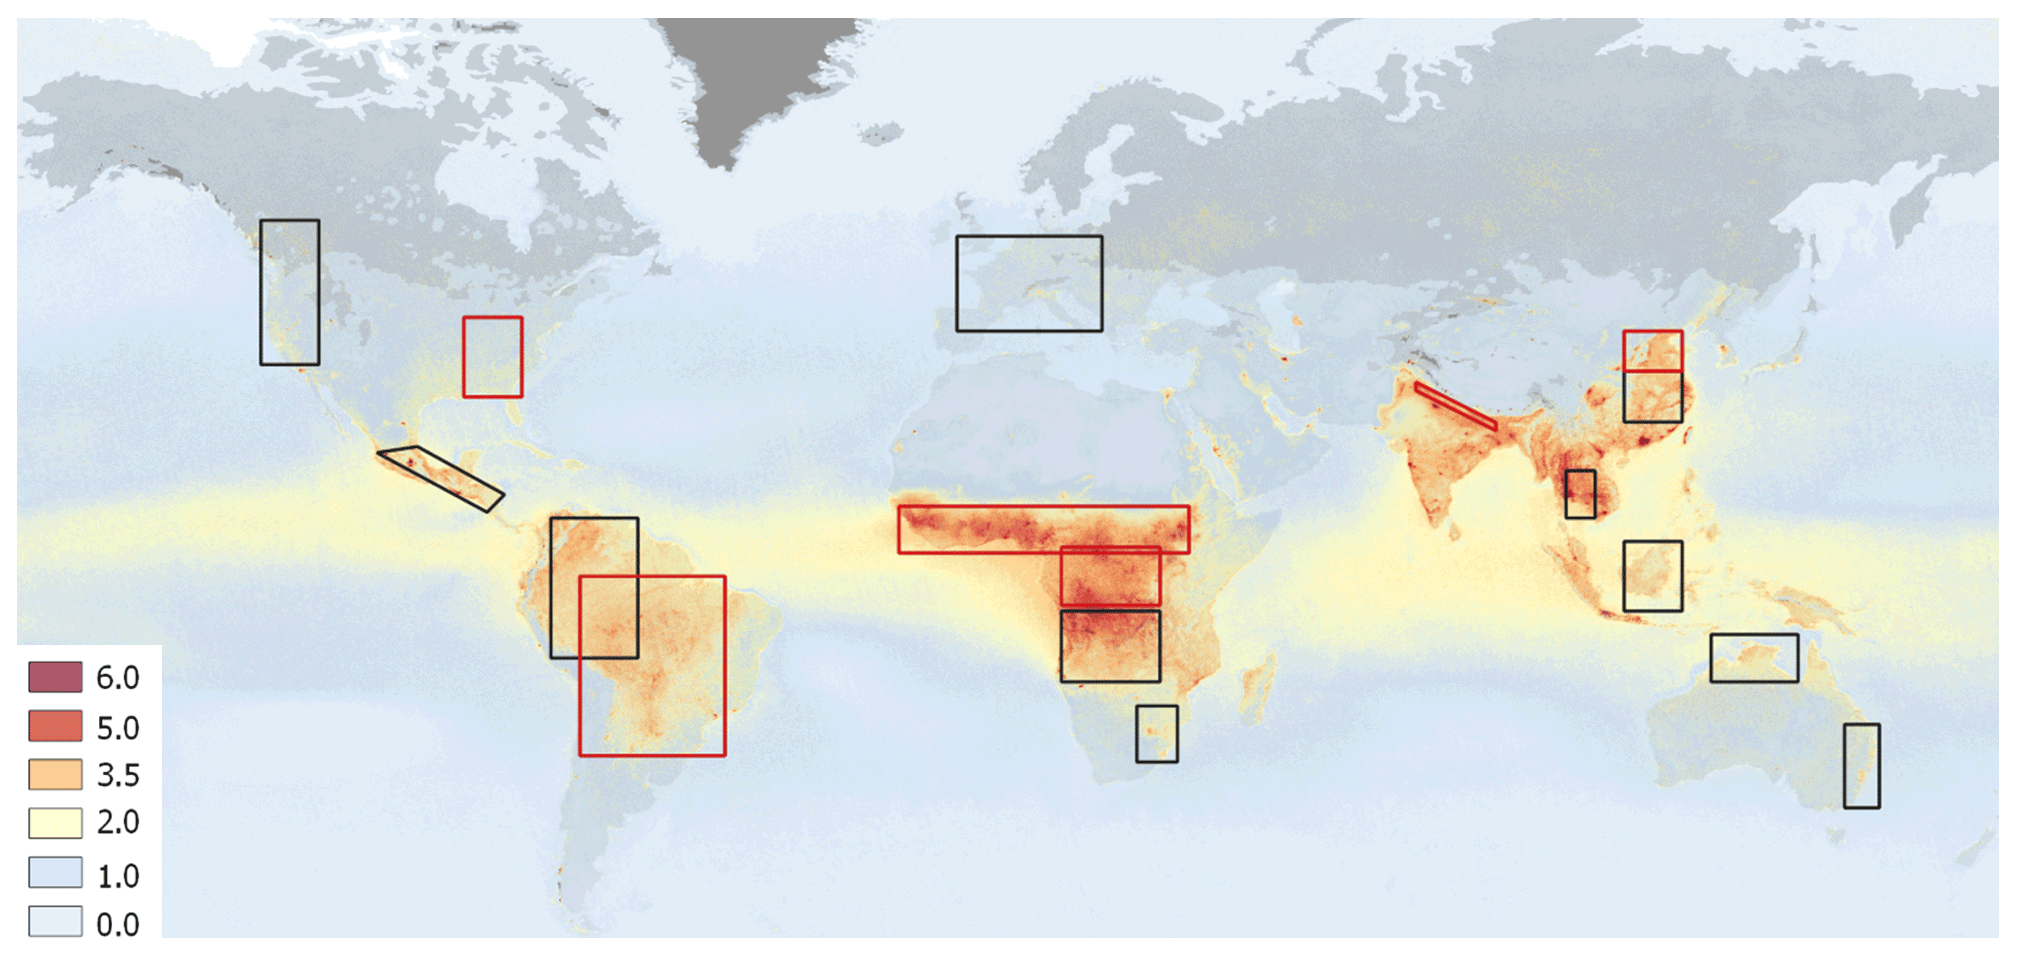
Figure 12TROPOMI glyoxal VCD distribution (in 1×10¹⁴ molec. cm−2) averaged over the period January 2018–December 2020. The rectangles represent the regions where the glyoxal products from different satellites are intercompared with a specific focus on red regions in Figs. 13 and 14.
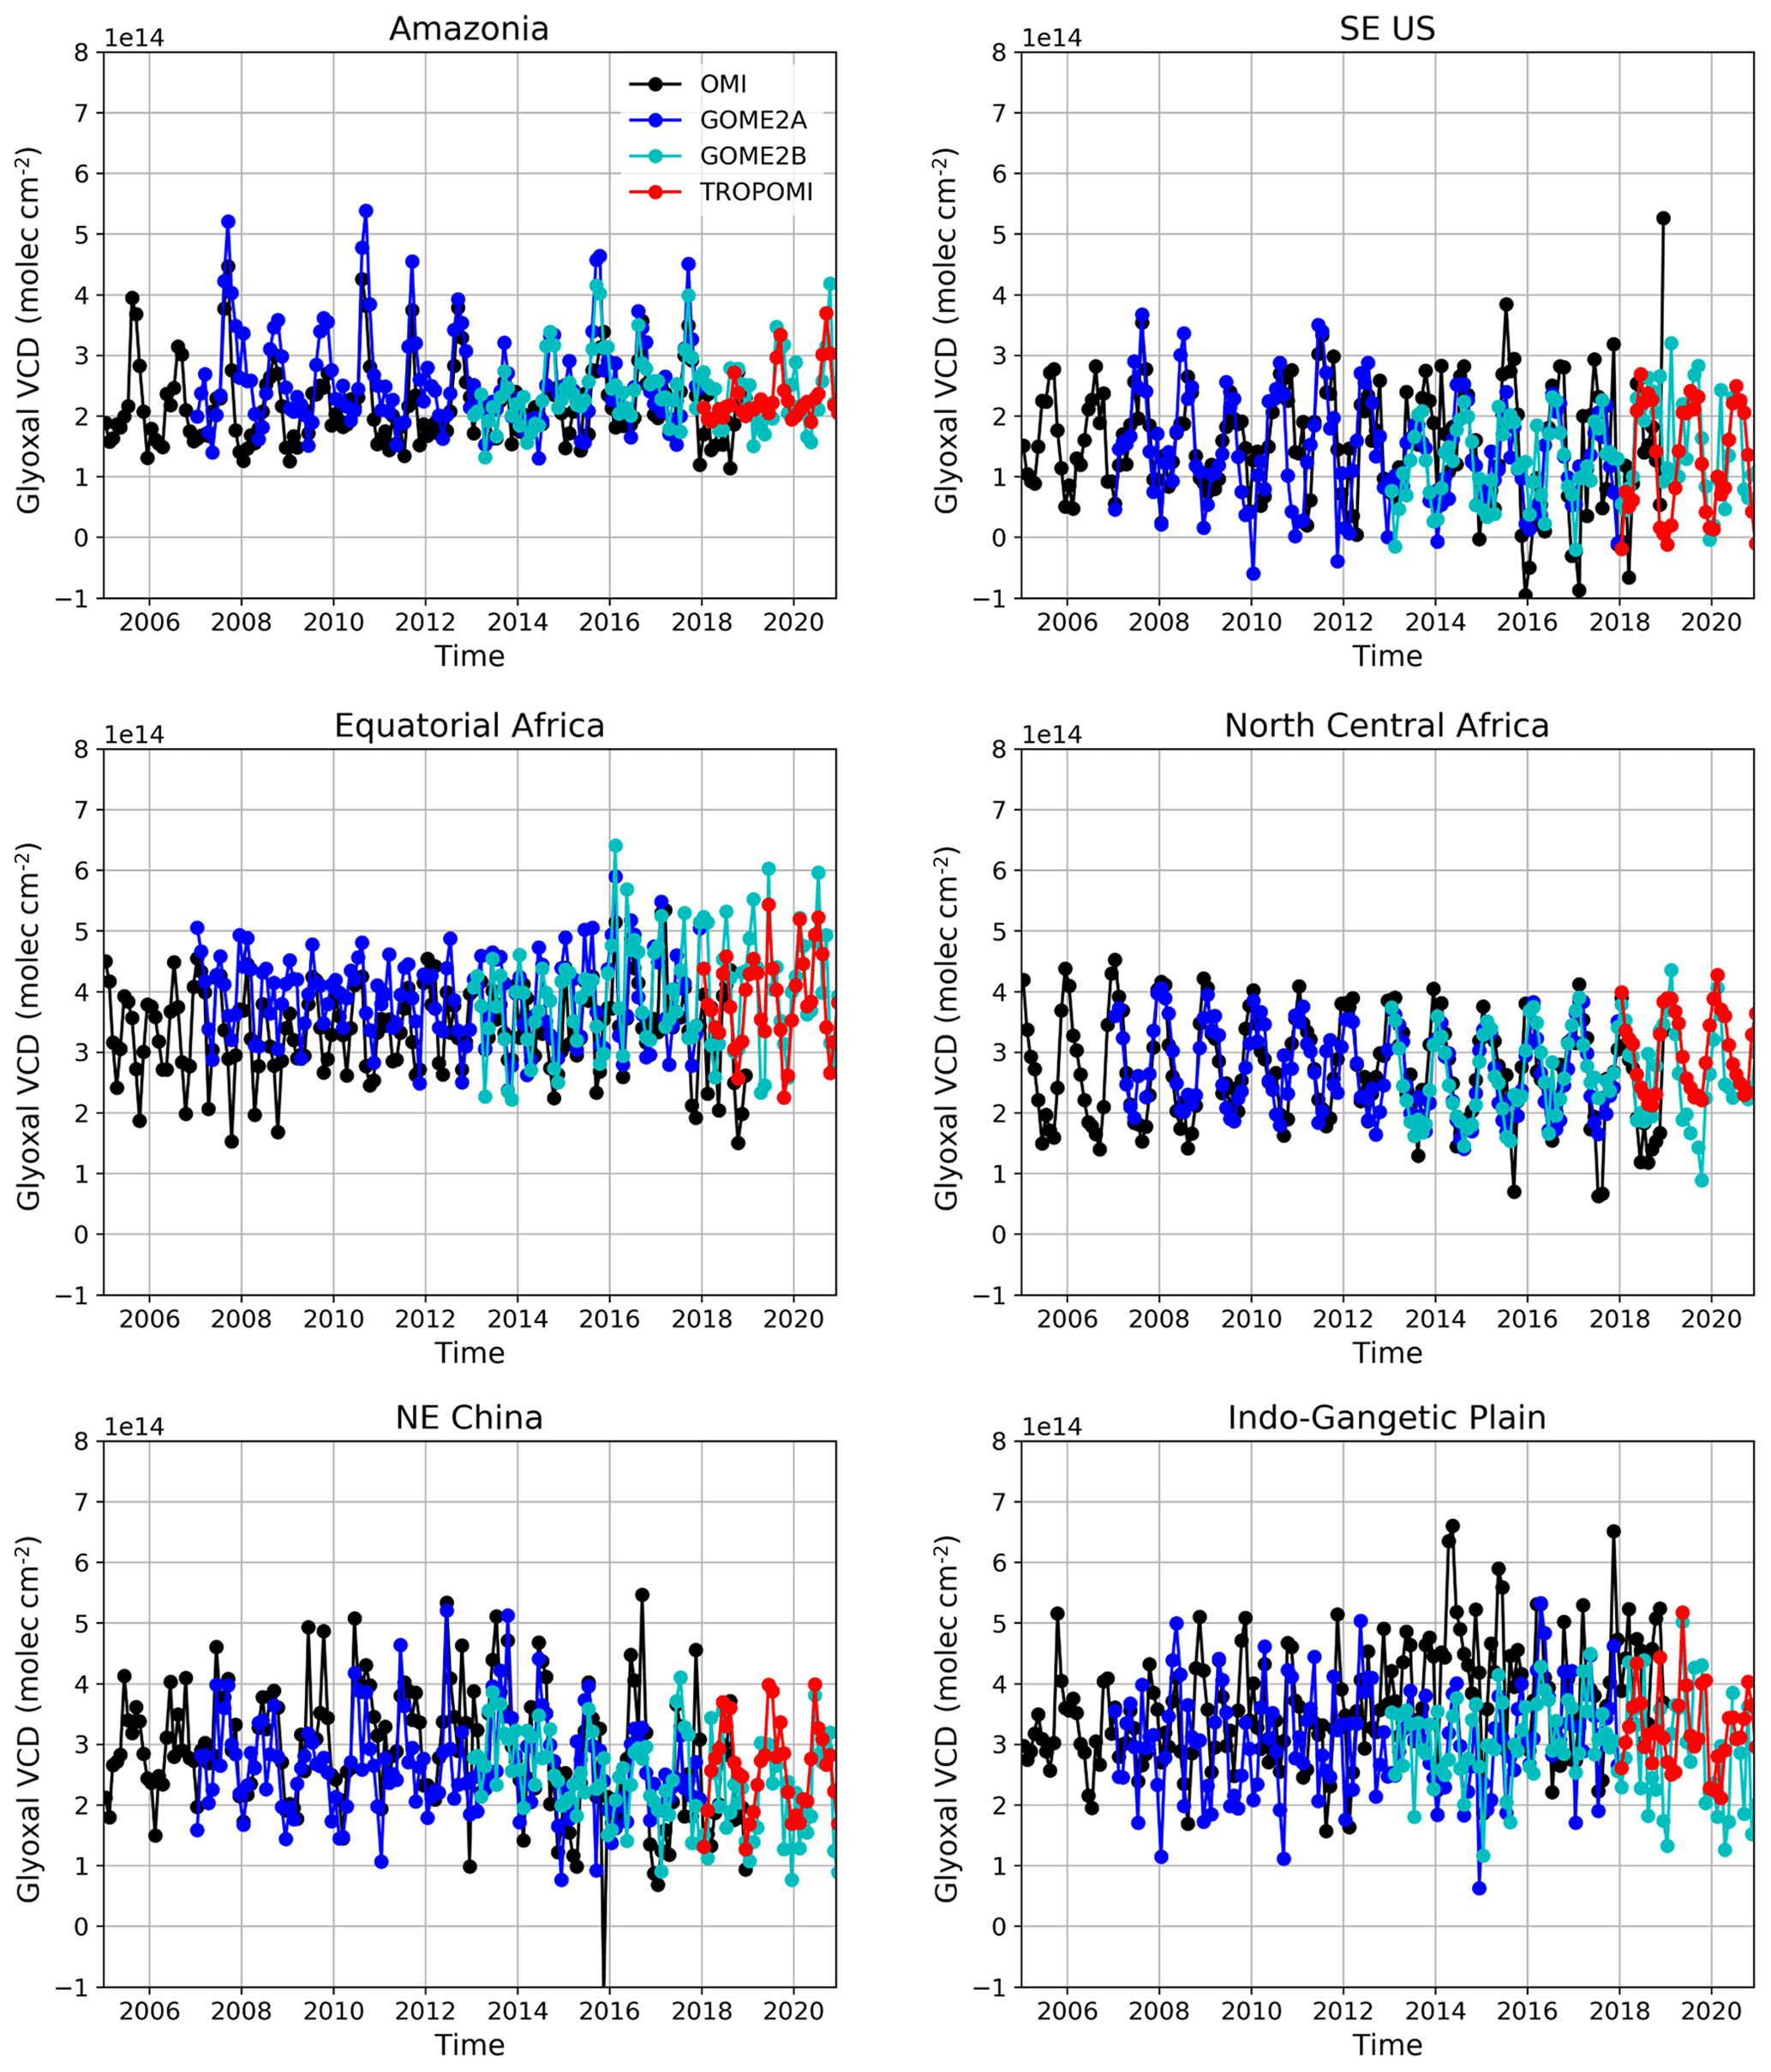
Figure 13Comparison of the monthly median glyoxal VCD time series from GOME-2A/2B, OMI and TROPOMI in a few selected regions worldwide.

Figure 14Comparison of the climatological seasonal variation of the monthly median glyoxal VCDs from GOME-2A/2B, OMI and TROPOMI in a few selected regions worldwide. The error bars represent the interannual variability as derived from the full time series.
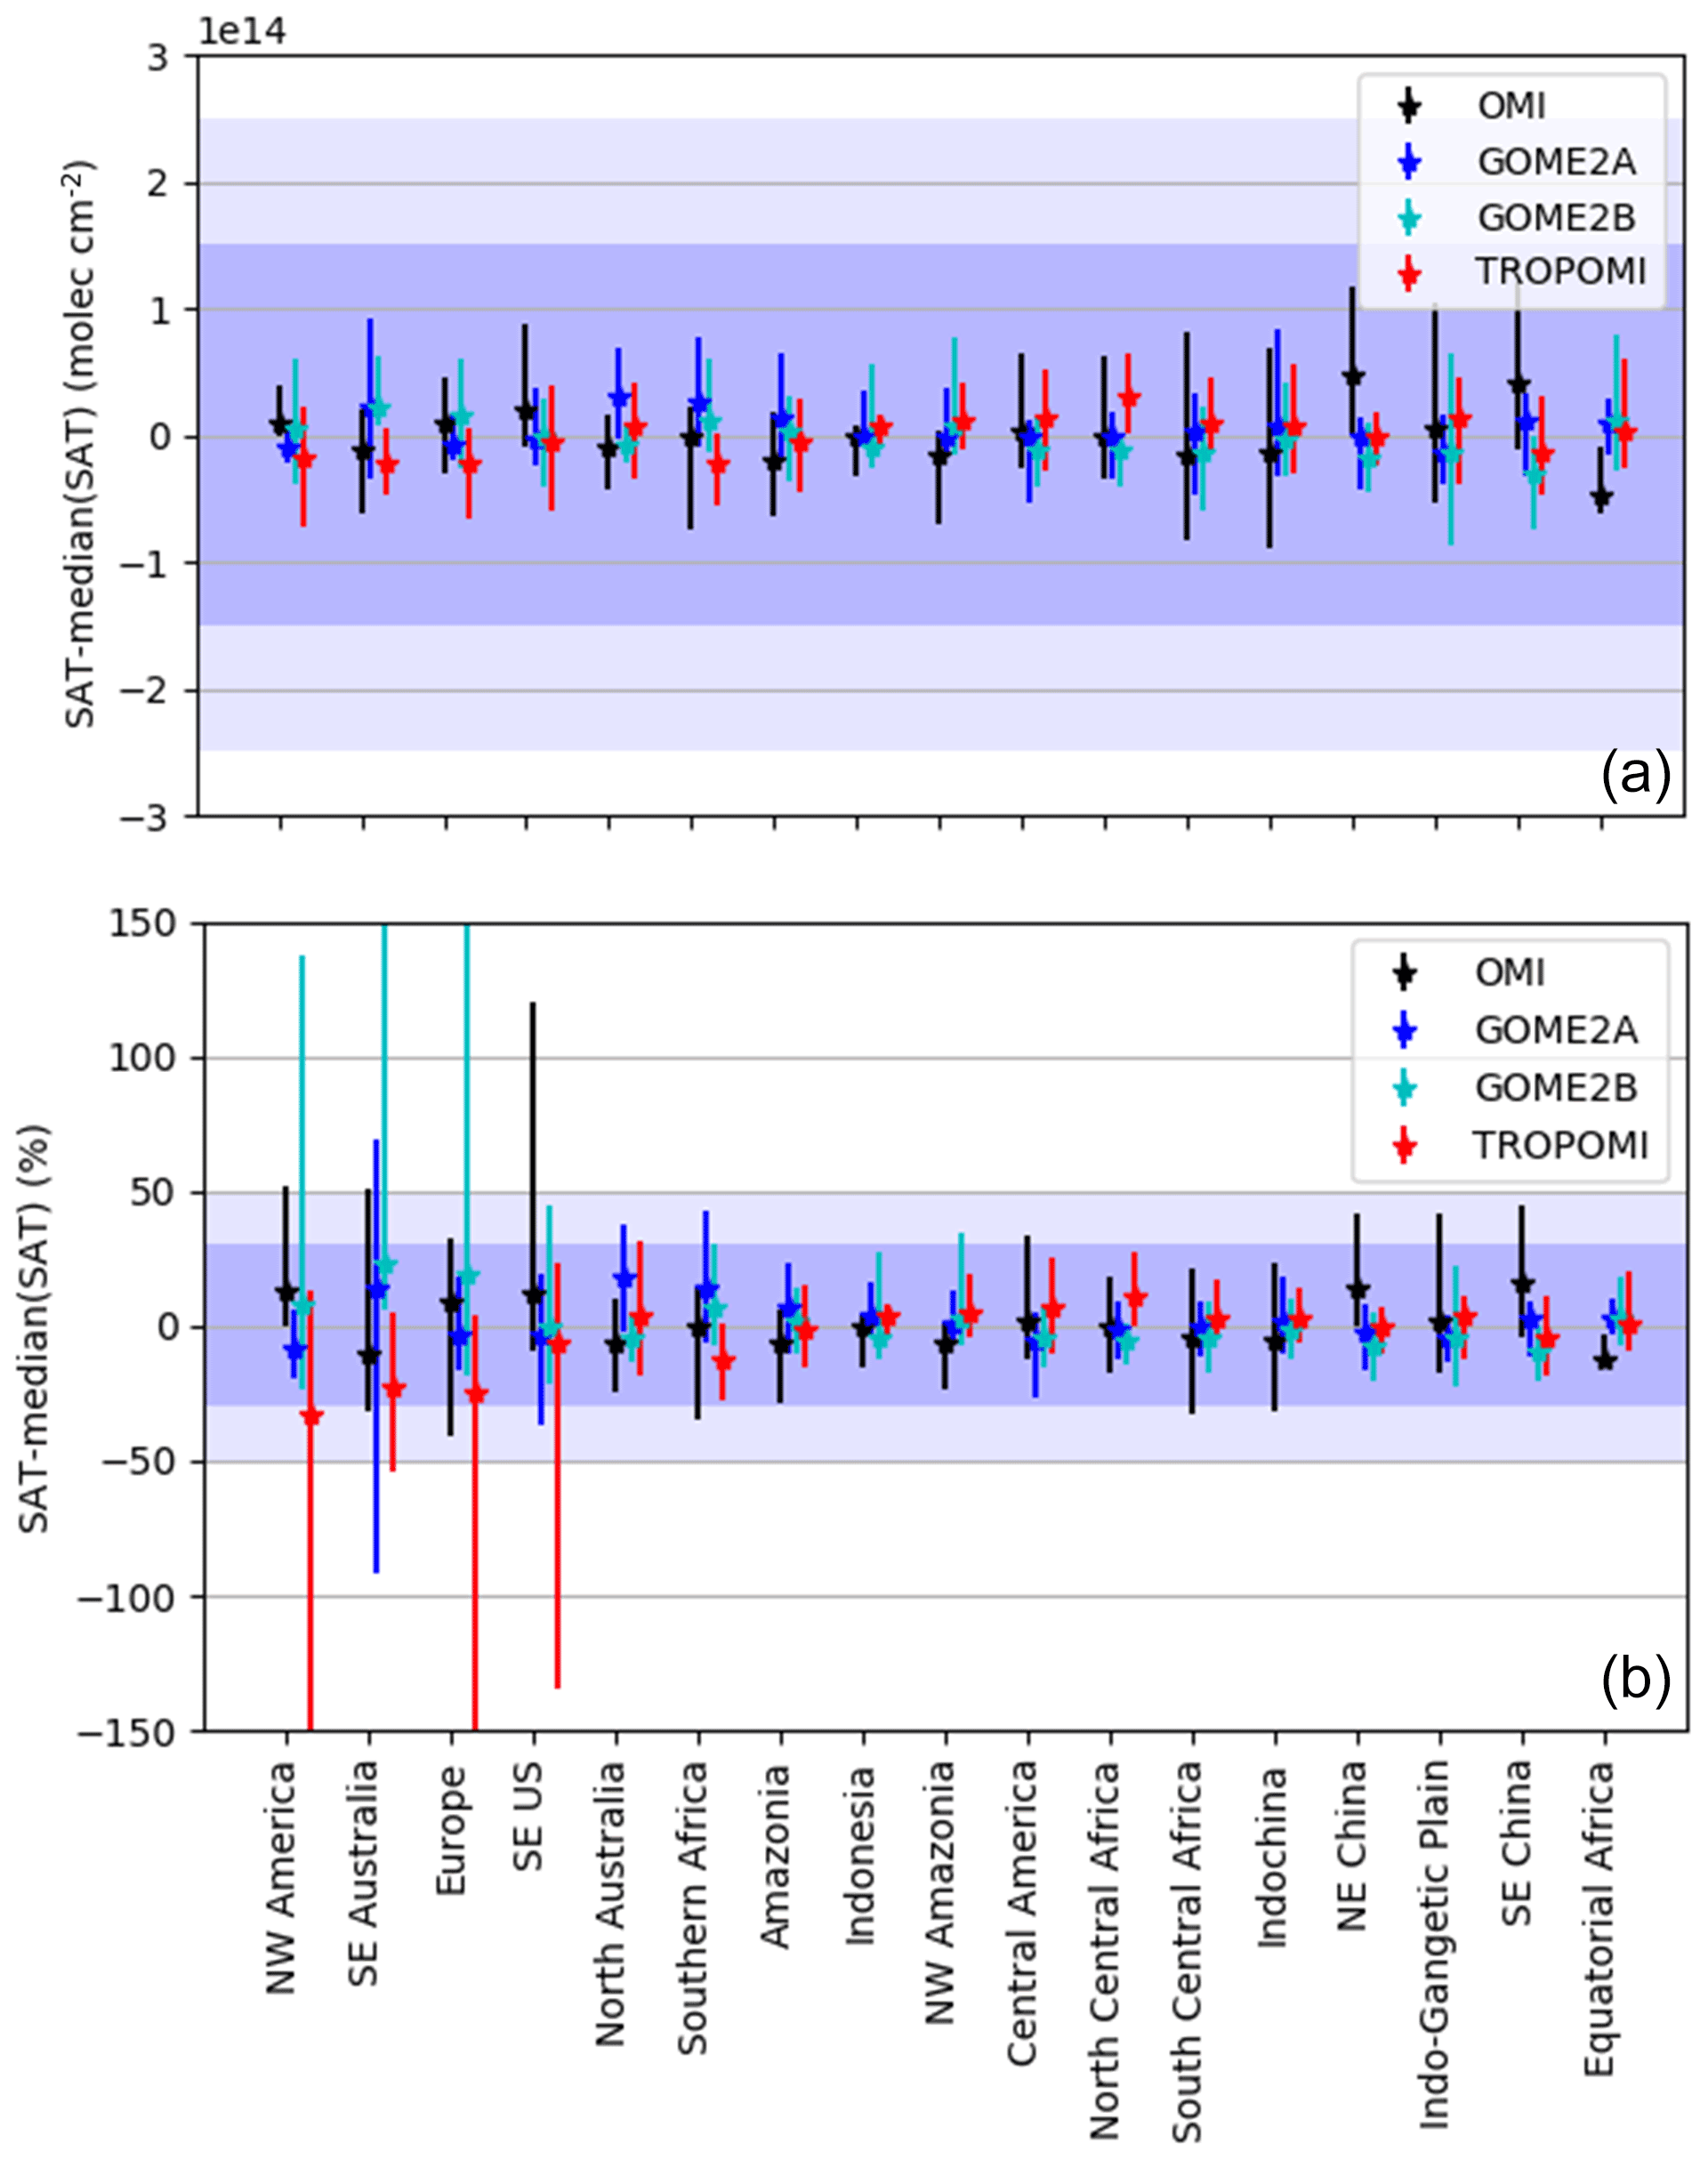
Figure 15Median deviation of the glyoxal VCD differences for TROPOMI, OMI and GOME-2A/2B against the median value of the ensemble of the four data sets in the selected regions worldwide drawn in Fig. 12. Those are plotted in absolute values (molec. cm−2) in (a) and in relative values (%) in (b). The error bars indicate the full range of the deviations considering climatological monthly data. Regions are sorted by increasing median glyoxal VCD value from left to right. The light and dark blue shaded areas indicate differences of 1.5 ×10¹⁴ molec. cm−2 (30 %) and 2.5 ×10¹⁴ molec. cm−2 (50 %).
In the tropics (e.g. Amazonia, equatorial/north central Africa), the four data sets are relatively stable over time. All instruments observe similar seasonal cycles and column values, although OMI appears to be slightly lower than the others, in particular in equatorial Africa. The interannual variability in Amazonia is high compared to other regions worldwide. Glyoxal is produced in that region to a large extent by fire emissions, which are highly variable. There is a direct correlation between years with high glyoxal columns and large fire emissions (e.g. 2007, 2010, 2015, 2019) as derived from the GFED database (van der Werf et al., 2017; https://www.globalfiredata.org/, last access: 6 December 2021). Interestingly, glyoxal columns measured by the morning GOME-2 instruments are larger than the OMI columns in the early afternoon during the fire seasons. This is consistent with the diurnal variation measured in satellite HCHO columns by De Smedt et al. (2015) and would deserve further investigation. Other regions display a more regular seasonal cycle, consistently seen by the four instruments.
In Asia, there are many hot spots, of which the origin is manifold and strongly depends on the region and season. In addition to biogenic activities, large emissions due to fires may significantly contribute to the glyoxal columns. As illustrated in Fig. 14, in the Indo-Gangetic Plain, there are typically two fire seasons in April/May and in October/November (after the monsoon period), related to agricultural burning of wheat residue (Kumar et al., 2016), and leading to two maxima in the glyoxal VCD seasonal cycle with a significant interannual variability. For example, during the COVID-19 Indian lockdown in April/May 2020, fire activity has been reduced, leading to lower emissions (Levelt et al., 2021). This region is also highly populated, causing large emissions due to human activities. This is also true in north-east China where glyoxal columns remain significant in winter, while biogenic emissions are low during that period of the year. Although less variable than fire emissions, anthropogenic emissions may also change over time. Despite those variable emissions, the four data sets spanning different time periods show a high level of consistency. In China, it seems that the glyoxal columns as observed by OMI, GOME-2A and GOME-2B are slightly reduced after 2014. This deserves further investigation. On the other hand, any interpretation based on long time series of OMI data must be treated carefully since the instrument suffers from an evolving row anomaly (Schenkeveld et al., 2017), which impacts the stability of the product and causes an increasing number of outliers, especially at mid-latitudes. For example, over the Indo-Gangetic Plain, the OMI columns deviate regularly from the other instruments after 2014. In general, remnants of noise are also visible in the GOME-2 time series, which show somewhat less smooth time series than TROPOMI.
At mid-latitudes, the lower sun elevation, especially during local wintertime, makes the retrievals more challenging. Nevertheless, a small maximum is consistently observed during the local summertime. During wintertime, TROPOMI columns appear slightly lower than those from the other satellites. As mentioned before, the stronger impact of the row anomaly at mid/high-latitudes leads to a larger number of outliers in the OMI data set and to a low bias in winter after 2013/2014.
Figure 15 summarizes for all regions drawn in Fig. 12 the absolute and relative deviation of each of the four data sets with respect to the median values of the ensemble. The symbols represent the median deviation considering all months of the year, while the error bars represent the full range of the monthly deviations. Regions are sorted by increasing mean glyoxal vertical column amounts and light and dark blue shaded areas indicate 2.5×10¹⁴ molec. cm−2 (50 %) and 1.5×10¹⁴ molec. cm−2 (30 %) differences as guidelines. Inter-satellite deviations are generally less than 5×10¹³ molec. cm−2 (20 %). The large error bars in the relative differences plot for mid-latitude regions are caused by local wintertime months during which the glyoxal content is very low, if not negligible, and are therefore meaningless. Overall, the inter-satellite consistency of the glyoxal VCD products is excellent. In Sect. 5, we will investigate the product quality with comparisons with independent ground-based MAX-DOAS glyoxal observations at a few stations in Asia and Europe.
4.2.3 Glyoxal over equatorial oceans
A persistent equatorial oceanic glyoxal signal is seen consistently by the four sensors. The origin and the magnitude of the enhanced glyoxal concentrations over oceans remains nevertheless unclear. A similar feature has been observed from space in previous studies (Lerot et al., 2010; Vrekoussis et al., 2009; Wittrock et al., 2006), while it was much less pronounced in others (Alvarado et al., 2014; Chan Miller et al., 2014). Over the past years, glyoxal measurements have been realized with shipborne MAX-DOAS. While Sinreich et al. (2010) measured glyoxal concentrations up to 100 ppt in the marine boundary layer of the equatorial Pacific Ocean, most other studies (Behrens et al., 2019b; Lawson et al., 2015; Mahajan et al., 2014; Volkamer et al., 2015) reported lower concentrations that are inconsistent with the satellite-derived elevated glyoxal columns. However, Volkamer et al. (2015) also reported elevated glyoxal concentrations measured with an airborne MAX-DOAS in the free troposphere, which might explain the larger satellite glyoxal signal. Remaining spectral interferences may also contribute, at least partly, to this signal. In particular, its spatial correlation with high water vapour concentration regions and the high sensitivity of glyoxal retrievals to the water vapour cross-section as discussed in Sect. 3.1 and by Chan Miller et al. (2014) call for a careful assessment of any future new data release or for future investigation on fit strategy to mitigate this interference (e.g. Kluge et al., 2020).
5.1 Description of MAX-DOAS data sets and methodology
MAX-DOAS instruments measure scattered solar light in the UV–visible spectral range at different elevation angles above the horizon and allow for retrieving information on trace gases and aerosol extinction in the altitude range below 2–3 km of the atmosphere, where the instrumental sensitivity is the highest. In a first approximation, vertical columns of boundary layer gases can be estimated from MAX-DOAS measurements using a simple geometrical approach (Brinksma et al., 2008; Hönninger et al., 2004). More elaborated approaches exploit a set of different elevation angles to derive information on the vertical distribution of the gas concentration with up to 4 degrees of freedom, resulting in more accurate vertical columns in the 0–4 km altitude range (e.g. Beirle et al., 2019; Clémer et al., 2010; Irie et al., 2011; Friedrich et al., 2019).
Glyoxal concentrations can be derived from MAX-DOAS measurements in the visible range. However, the number of glyoxal MAX-DOAS data sets is very limited, especially those covering a period long enough to allow for the validation of satellite data during entire seasonal cycles. Moreover, MAX-DOAS retrievals are affected by similar difficulties as satellite retrievals (noise, spectral interferences). Here, we collected an ensemble of data sets from nine stations located in Asia and Europe (see Table 3) spanning at least 1 year. Altogether a wide range of glyoxal columns and emission regimes are covered by those stations. Unfortunately, the approach to retrieve glyoxal from MAX-DOAS has not been homogenized so far, and these measurements cannot be considered true fiducial reference measurements. For example, although the same interfering species have been included in the DOAS fits, the reference cross-section data as well as the fitting interval may vary. The design (spectral range, spectral resolution, detector type, etc.) and operation mode of the instruments differ substantially, resulting in different sensitivities to changes in retrieval settings. Finally, the slant-to-vertical column conversion is performed differently from one station to another (see Table 3). Despite those limitations, the comparison of glyoxal tropospheric columns from satellites with nine different MAX-DOAS instruments is unprecedented.
Table 3List of MAX-DOAS stations used in the study and brief description of the approach to generate the glyoxal data.

Among the available MAX-DOAS data sets, three (Xianghe, China; Chiba, Japan; and Phimai, Thailand) are long enough to allow for a comparison with OMI and GOME-2A/2B in addition to TROPOMI. The other ones span shorter, more recent periods and will be used only for comparison with the TROPOMI product. The Xianghe station has the longest stable data record, and it also provides vertical profiles of glyoxal. Therefore we have used this reference station to perform a thorough analysis of the satellite product stability and of the impact of applying satellite averaging kernels. For the other stations, we performed a more qualitative comparison of the seasonal cycles of the glyoxal tropospheric columns. For the data co-location, we select MAX-DOAS data ±1.5 h around the satellite overpass time and satellite data within a radius of 100 km (150 km for Phimai) and 20 km around the station for GOME-2A/2B or OMI and TROPOMI, respectively. Daily median glyoxal columns are computed if both satellite and ground-based data are available, and finally monthly medians of the daily median columns are compared.
5.2 Validation results
Figure 16 focuses on the comparison of monthly median glyoxal tropospheric columns retrieved from TROPOMI, OMI, GOME-2A and GOME-2B with columns from the BIRA-IASB MAX-DOAS instrument in Xianghe (China). The left panels compare the full time series for each satellite sensor with the MAX-DOAS data record. The right panels show the corresponding satellite/MAX-DOAS absolute differences. Note that the MAX-DOAS measurements have been interrupted from mid-2018 to mid-2019 due to an instrumental problem. Overall, all four satellite instruments reproduce quite well the seasonal cycle seen by the MAX-DOAS instrument. However for all of them, except for the recent TROPOMI, a degradation appears after a few years of operation. For OMI, the consistency with the MAX-DOAS is satisfactory before 2013, but the number of outliers increases afterwards, and the columns during wintertime become too low. This is attributed to the evolving row anomaly as discussed in Sect. 4.2. The GOME-2A and GOME-2B data sets also agree quite well with the ground-based data for their first years of operation but then suffer from an increasing number of outliers after 2014 and 2017, respectively. Nonetheless, the quality of the data sets remains very reasonable. The TROPOMI time series also agrees well with the MAX-DOAS data and is characterized by a smooth temporal variability without any outliers on a monthly basis. The absolute differences shown in the right panels also clearly indicates a reduced scatter compared to the other satellites, despite the fact that a smaller overpass radius of 20 km was used instead of 100 km. This is reflected in the standard deviation of the differences given in the titles of each subpanel. The TROPOMI standard deviation is 0.9×10¹⁴ molec. cm−2, while it is larger than 1.7×10¹⁴ molec. cm−2 for other sensors. On average, there are small negative biases with respect to the MAX-DOAS data for the four satellite time series (also given in the panel titles), ranging between molec. cm−2 for TROPOMI and molec. cm−2 for OMI. For this particular station, we investigated the impact of applying the satellite averaging kernels to smooth the MAX-DOAS glyoxal profiles. This process allows for simulating MAX-DOAS columns which would be retrieved from the satellite algorithm, considering its own a priori profile information. The comparison of the satellite columns with the smoothed MAX-DOAS data therefore removes differences due to imperfect satellite a priori profile information. As shown in Fig. 16, smoothing the MAX-DOAS columns reduces the satellite/MAX-DOAS bias to values ranging from (TROPOMI) to molec. cm−2 (OMI).
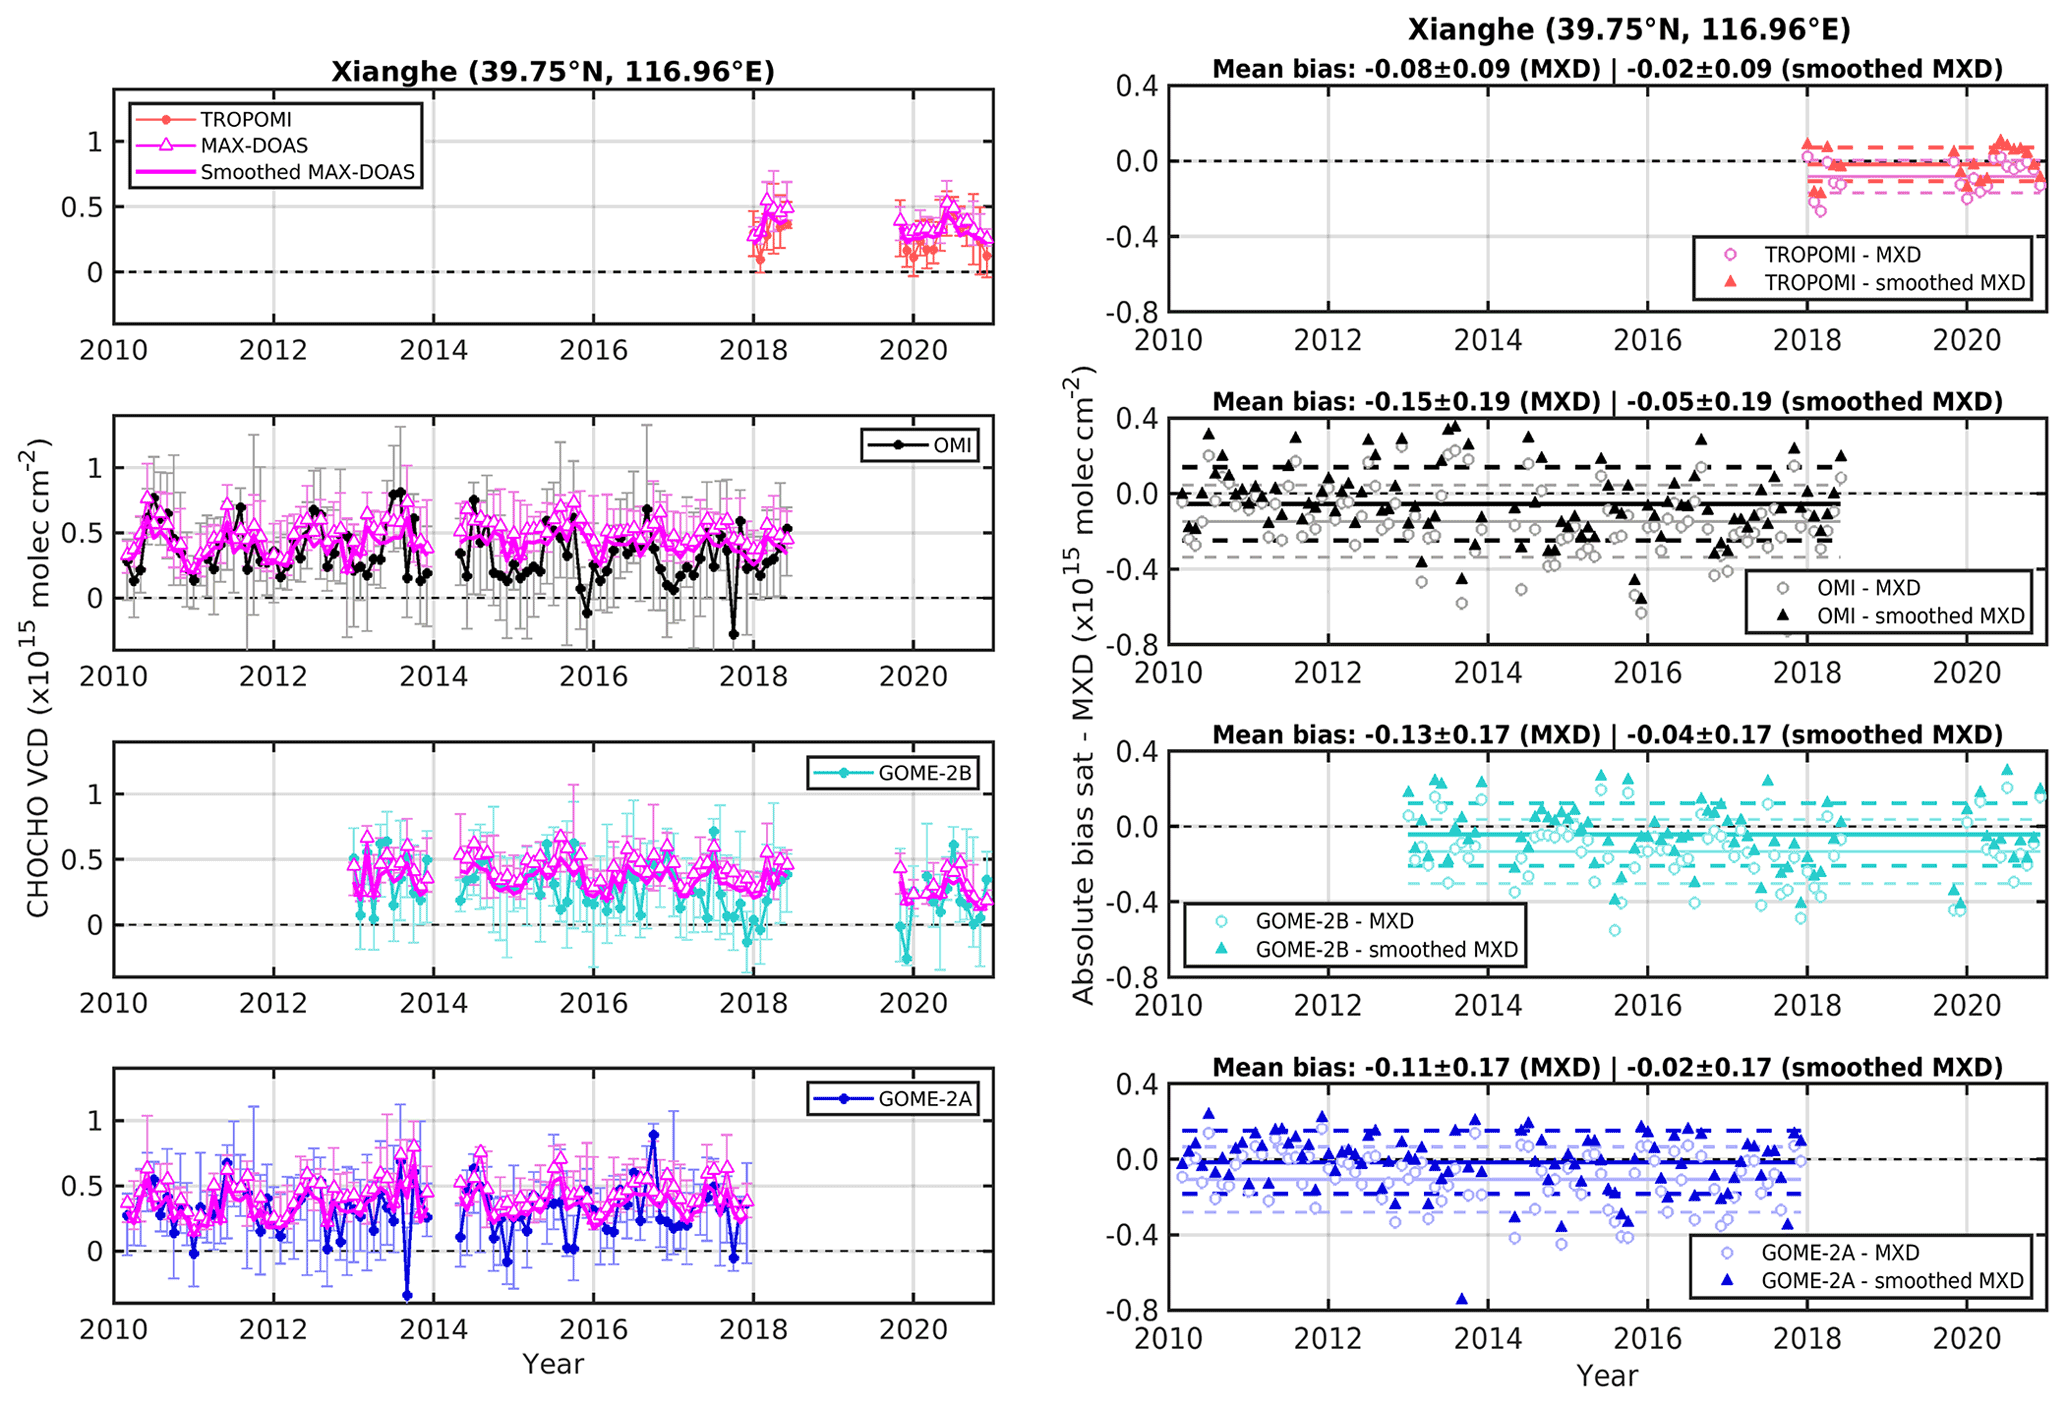
Figure 16Comparison of the monthly median glyoxal tropospheric vertical columns retrieved from satellite and MAX-DOAS (MXD) instruments in Xianghe (China). The four left panels compare the time series from TROPOMI, OMI and GOME-2A/2B with the MXD time series. MXD columns are also shown when smoothed with the satellite averaging kernels. The error bars represent the 25th and 75th percentiles. The four right panels show the corresponding time series of the satellite–MXD absolute differences. Both original and smoothed MXD data are shown. Mean bias and standard deviation of the differences are given (in 1015 molec. cm−2 units) in the panel titles and are also represented in the right panels with the full and dashed coloured lines.
In Fig. 17, we compare the median satellite and MAX-DOAS seasonal cycles of the glyoxal tropospheric columns at three stations (Xianghe, Chiba and Phimai) where the time series present a good overlap with the OMI and GOME-2A and 2B records, in addition to TROPOMI. In Xianghe, the seasonal cycle of the smoothed MAX-DOAS columns is also shown, illustrating again the reduction of the satellite/MAX-DOAS bias when the a priori profile error component is removed. Note that the OMI and GOME-2B seasonal cycles are computed using data until end of 2013 and 2016 to limit the impact of the increasing number of outliers. In each comparison panel, the MAX-DOAS cycle is always computed using the same time range as the satellite instrument. Overall, the seasonal patterns are consistently captured by the satellite and MAX-DOAS instruments. In Xianghe, the GOME-2A and TROPOMI cycles follow closely the MAX-DOAS curves, although TROPOMI slightly underestimates the MAX-DOAS columns during winter months. OMI and GOME-2B also reproduce the general seasonal pattern but show a somewhat more scattered curve, likely due to their slightly less stable time series. In Chiba where the glyoxal signal is mostly driven by biogenic emissions, the agreement between the satellites and the MAX-DOAS measurements is excellent both in terms of variability and absolute values. Again, OMI shows a larger scatter (as also indicated by the larger error bars representing the interannual variability). In Phimai, where pyrogenic emissions are responsible for large glyoxal columns, especially in the first few months of the year, the seasonal variability seen by the satellites and the MAX-DOAS is very consistent. A negative bias larger than for other stations is nevertheless observed. This can be related to other studies that identified larger biases in NO2 or HCHO DOAS products for elevated column conditions (e.g. De Smedt et al., 2021; Verhoelst et al., 2021; Vigouroux et al., 2020). Possible causes for such biases are the different air masses probed by the satellite and ground-based instruments, their different vertical sensitivities, and the a priori vertical profile information used in the retrieval algorithms.
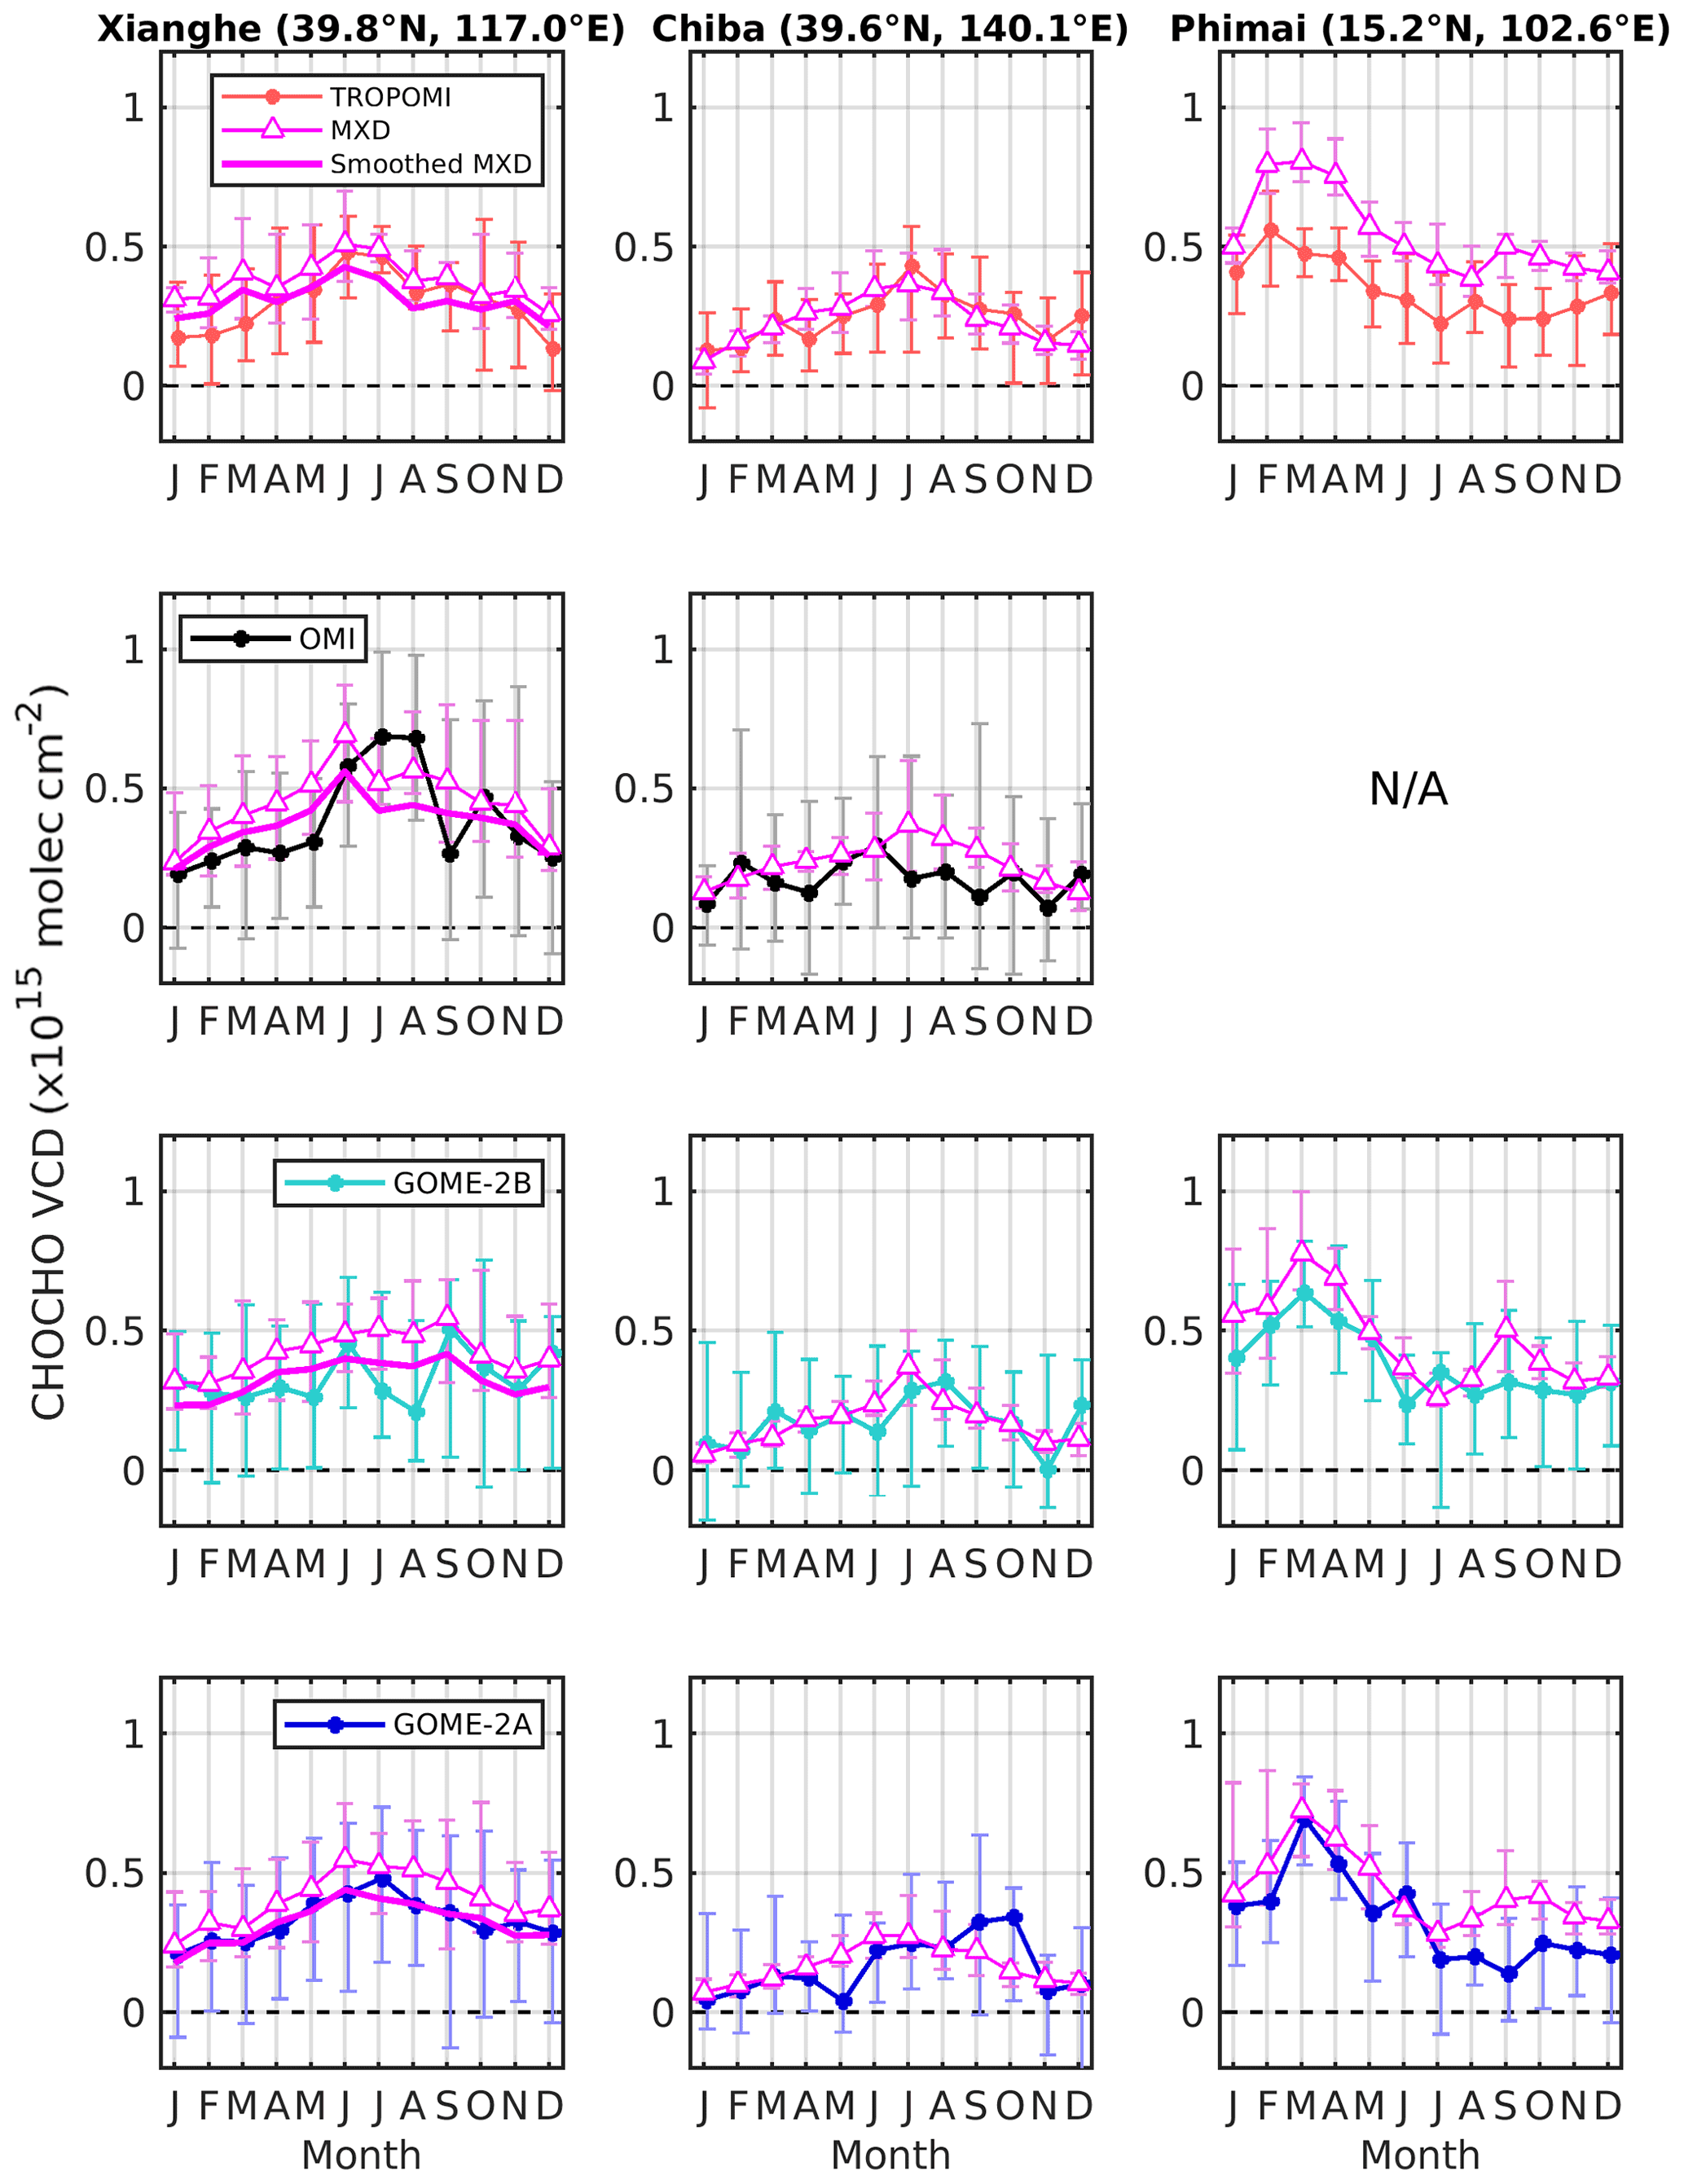
Figure 17Comparison of the monthly median glyoxal tropospheric vertical column seasonal cycle as retrieved from TROPOMI, OMI, GOME-2A/2B and MXD in Xianghe (China), Chiba (Japan) and Phimai (Thailand). The columns correspond to the three stations and the rows to the different satellites. In Xianghe, MXD data smoothed with the satellite averaging kernels are also shown. The error bars represent the interannual variability (25th and 75th percentiles based on the full time series available). Note that the comparison with the MAX-DOAS data in Phimai is not shown as the latter starts in 2014 when OMI is degraded.
In Fig. 18, we compare again the seasonal cycle of glyoxal VCDs retrieved from TROPOMI with that from more recent MAX-DOAS time series at six different stations. Four of them are located at mid-latitudes in Europe and show relatively low glyoxal columns, while larger average values are measured at the two other stations in northern India (Mohali and Pantnagar). In Vienna (Austria) and Athens (Greece), TROPOMI and MAX-DOAS glyoxal columns agree very well and show consistent seasonal dependencies with maximum and minimum values during summertime and wintertime, respectively. On the other hand, at the higher latitude stations of Bremen (Germany) and Uccle (Belgium), the consistency of the seasonal variations seen from space and from the ground is somewhat poorer. While the glyoxal columns agree well during summertime, the satellite columns tend to underestimate MAX-DOAS values in winter, with the latter showing almost no seasonal variation. Satellite glyoxal retrievals at those latitudes are challenging in winter because of the low sun elevation causing a reduced sensitivity to the lowermost atmospheric layers. As mentioned in Sect. 3.2, observations with solar zenith angles larger than 70∘ are filtered for this reason, which explains the gap between November and January at those two stations. In Uccle, we have also tested the impact of smoothing the MAX-DOAS columns with the satellite averaging kernels (similarly as for Xianghe), which turned out to be very small. The absence of any seasonal dependence in the cities of Brussels (Uccle) and Bremen, in contrast to that observed (although limited) in Vienna and Athens, is to some extent puzzling. One should keep in mind, however, that the glyoxal retrievals from MAX-DOAS measurements are also challenging, and it cannot be excluded that errors in ground-based data might also partly contribute to the observed differences.
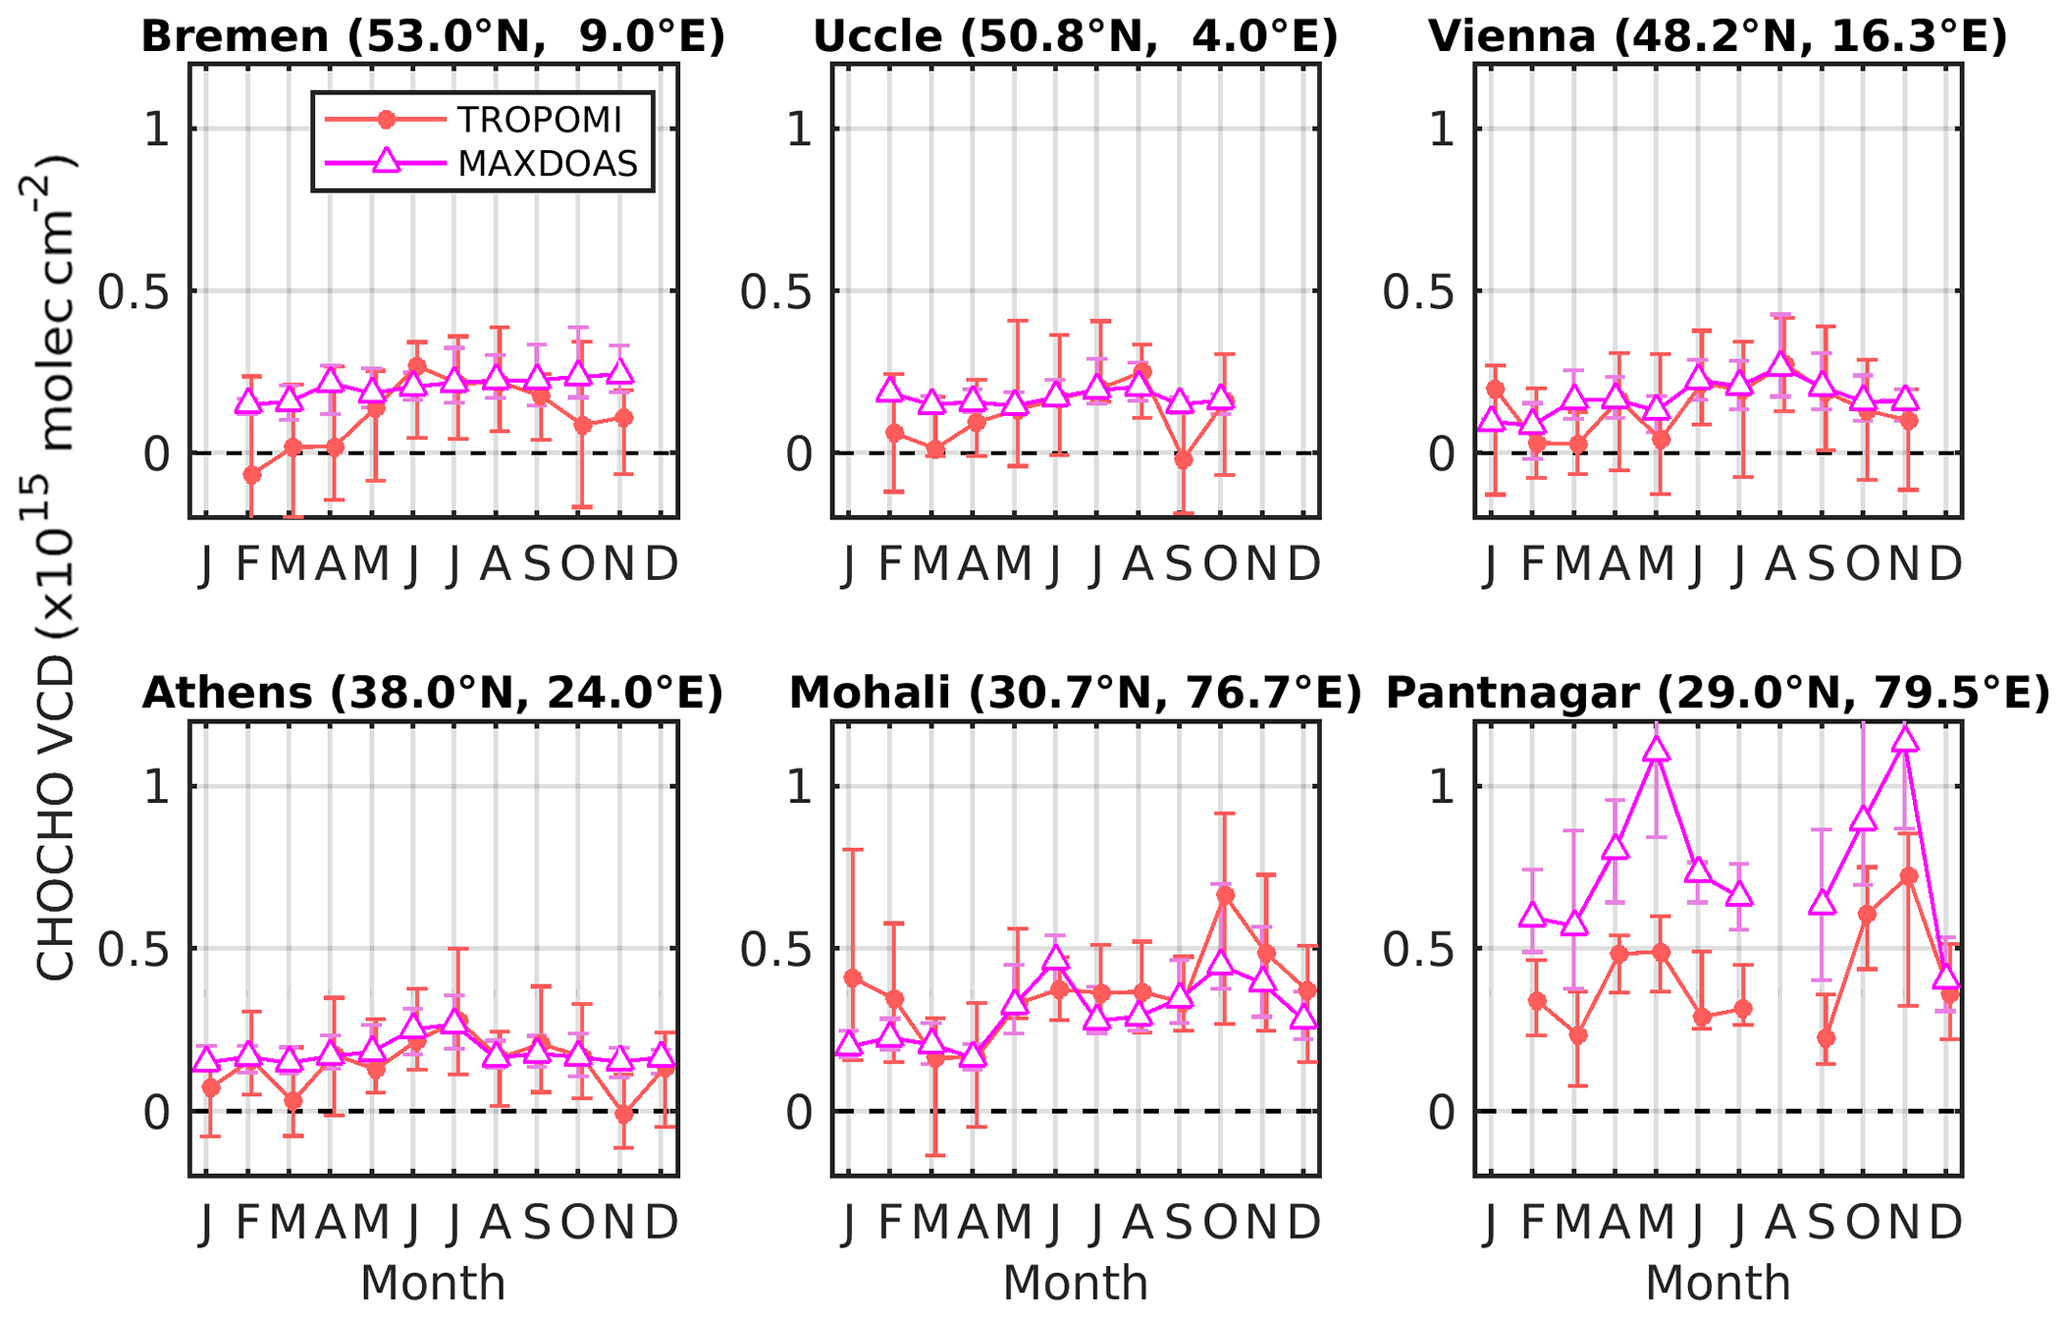
Figure 18Comparison of the monthly median glyoxal tropospheric vertical column seasonal cycle as retrieved from TROPOMI and MXD at four European stations (Bremen, Uccle, Vienna, Athens) and at two Indian stations (Mohali, Pantnagar). The error bars represent the interannual variability (25th and 75th percentiles based on the full time series available).
In Mohali and Pantnagar, glyoxal columns are much larger and the seasonal variability is driven by fire emissions and meteorological factors such as the monsoon. At those two stations, the glyoxal seasonal variability is very well reproduced by TROPOMI. In terms of absolute values, the TROPOMI columns agree reasonably well in Mohali, but they significantly underestimate the (large) MAX-DOAS columns in Pantnagar. The reason why the systematic satellite/ground-based bias is so different between those two stations is unclear. MAX-DOAS columns are clearly higher in Pantnagar than in Mohali, pointing either to possible local differences in air quality not reflected in the satellite data or to inconsistencies in the ground-based data sets. Although the agreement of the absolute columns is reasonable in Mohali, the typical behaviour is an underestimation of the columns by the satellites, as discussed before. Note also that those sites are significantly contaminated by aerosols, which are neglected in the satellite retrievals (apart from the stringent cloud filtering). MAX-DOAS data have also been analysed using very different approaches, which may also cause differences. This calls for a more detailed analysis, which would require a homogenization of the MAX-DOAS data treatment, a more sophisticated approach for the computation of the satellite AMFs (e.g. with an explicit aerosol treatment) and possibly some independent information on the glyoxal vertical distribution. This being said, the nice consistency in the glyoxal column seasonal variability by the different systems is remarkable in itself. Table 4 provides an overview of the correlation coefficient between the satellite and the MAX-DOAS glyoxal columns at all considered stations. For stations where the analysis was possible for all satellite sensors, the correlation coefficient was found to be significantly better for TROPOMI than for the other instruments. It is also clear that correlation coefficients are better for sites characterized by large and highly variable glyoxal columns (e.g. Asian stations). Apart from the Bremen station where the negative bias during winter leads to a low correlation coefficient, all other values are quite reasonable (between 0.61 and 0.87) for TROPOMI. Table 4 also gives the mean bias as derived from the comparison of the satellite and MAX-DOAS glyoxal column seasonal cycle as well as the standard deviation of the differences. As discussed above, the mean differences are generally lower than 1×10¹⁴ molec. cm−2, except for high columns where differences are noticeably higher.
Table 4Correlation coefficients between the satellite and MAX-DOAS monthly median glyoxal tropospheric vertical columns as well as mean absolute difference and associated standard deviation at nine stations.
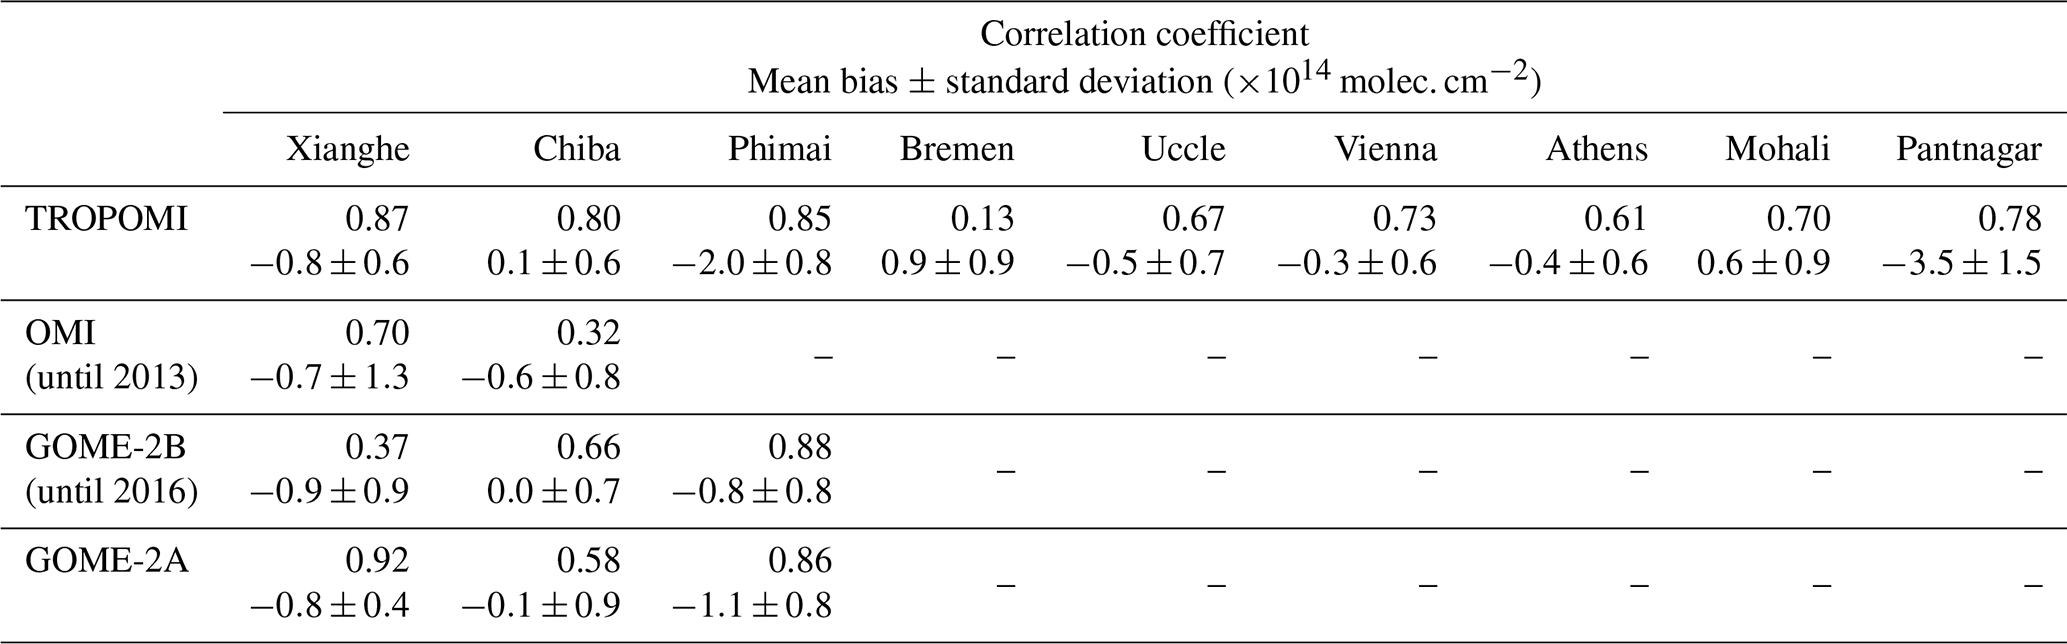
We presented the first global TROPOMI glyoxal tropospheric column product derived from 3 years (2018–2020) of visible radiance measurements. The DOAS-based algorithm, which relies largely on previous developments for heritage satellite nadir-viewing instruments, has been further improved in different aspects. In particular, the use of additional pseudo-cross-sections in the DOAS spectral fit allows for mitigating the effect of the instrumental spectral response function perturbations in the case of scene brightness inhomogeneity, which otherwise would lead to systematic biases in the retrieved glyoxal columns. This helps with removing artefacts along the coasts and reducing pseudo-noise in regions covered by persistent broken clouds. The glyoxal slant columns are also empirically corrected for biases caused by the NO2 misfit in the case of strong absorption. Finally, the background correction procedure has been optimized for the TROPOMI characteristics, and the a priori glyoxal vertical distribution, essential to the AMF computation, is now provided by the chemical transport model MAGRITTE, an updated version of the IMAGES model, running at the higher spatial resolution of . The glyoxal column retrievals have been fully characterized with an error budget considering the different error components introduced in each of the algorithm modules. This allows for extending the glyoxal column data product with total random and systematic error estimates provided for every observation and with corresponding averaging kernels and a priori profiles.
Glyoxal tropospheric columns have also been derived from data of the OMI, GOME-2A and GOME-2B satellite instruments using retrieval baselines similar to the TROPOMI algorithm. An extensive intercomparison of those four data sets emphasized their excellent consistency with absolute mean glyoxal column differences found to be generally lower than 0.5×10¹⁴ molec. cm−2. This demonstrates that glyoxal retrievals respond in the same manner to our selection of settings for all nadir-viewing satellite instruments. Because of the low glyoxal optical depth, the retrievals may be easily impacted by spectral features caused by instrumental degradation. We have shown that the stability of the OMI and GOME-2 data records is somewhat degraded after a few years of operations. Glyoxal retrievals are characterized by a high level of noise, requiring significant spatio-temporal averaging to extract meaningful signals. With both a much larger number of observations and a finer spatial resolution, TROPOMI outperforms by far the previous instruments in its ability to provide high-quality and detailed glyoxal fields. Although consistently identified in our four satellite data sets, the origin of the glyoxal oceanic signal remains unclear. There appears to be an inconsistency between what is measured from space and most glyoxal concentration measurements conducted in marine boundary layer campaigns. Non-negligible glyoxal concentrations in the free troposphere as measured during one campaign (Volkamer et al., 2015) might reconcile the satellite and field data. On the other hand, part of this signal may also be partly caused by remaining spectral interferences (e.g. with water vapour).
Satellite observations have also been compared with a few independent MAX-DOAS data sets from stations located in Asia and Europe. Owing to the scarcity of MAX-DOAS glyoxal data sets, especially covering several seasons, this validation exercise is therefore unprecedented. Based on a thorough analysis at the Xianghe station (China), where a 10-year time series of MAX-DOAS data is available, and on the comparison of seasonal cycles at other stations, we conclude that satellite and MAX-DOAS instruments observe consistent glyoxal signals and have similar intra-annual variations. This is reflected by the strong correlation coefficients, ranging between 0.61 and 0.87 for TROPOMI, with the exception of one mid-latitude station where the correlation is poorer. In general, the satellite and MAX-DOAS columns also agree in absolute values with differences of less than 1×10¹⁴ molec. cm−2, at least for stations with moderate columns. In Xianghe, we showed that the application of the satellite averaging kernels to the MAX-DOAS data further reduces the mean differences. There are, however, two stations (Phimai, Thailand, and Pantnagar, India) where the satellite/MAX-DOAS bias is more significant, despite a reasonable agreement of the measured seasonal variations. Although the origin of this bias is not fully understood, the MAX-DOAS columns at those stations are very high, and it is not uncommon to have such biases in UV–visible satellite retrievals for strongly polluted sites. It cannot be excluded that part of the bias originates from the MAX-DOAS retrieval strategy at those sites. We also have indications that the satellite observations are biased low during wintertime at mid-to-high latitudes where the glyoxal signal is weak and the sensitivity to the boundary layer is reduced. The comparisons of OMI, GOME-2 and MAX-DOAS glyoxal columns also show reasonable agreement and similar intra-annual variability. Both the correlation coefficients and the scatter of the satellite/ground differences were, however, worse than those of TROPOMI. This points again to the better performance of TROPOMI for the detection of glyoxal from space and to its enhanced capability for providing information on VOC emissions. For future work, it would be beneficial to dedicate more efforts in the homogenization of the MAX-DOAS glyoxal retrievals in terms of both spectral analysis and slant-to-vertical column conversion in order to strengthen their potential for the validation of satellite data sets such as the one presented in this work.
Access to TROPOMI glyoxal tropospheric column data is possible via the GLYRETRO website (https://doi.org/10.18758/71021069; Lerot, 2021); OMI glyoxal data can be obtained on request from the authors. Information to download the GOME-2/Metop-A and GOME-2/Metop-B glyoxal data records is provided at https://acsaf.org/datarecord_access.php (Valks, 2021).
The supplement related to this article is available online at: https://doi.org/10.5194/amt-14-7775-2021-supplement.
CL is the main contributor to the study and led the writing of this paper. FH performed the validation exercise, with support from MVR and LMAA. MVR, LMAA, AR, IDS, NT, JV, HY and JVG contributed to algorithm and/or code development. TS and JFM provided the a priori modelled glyoxal profiles. PV and DL are responsible for the production of the GOME-2 glyoxal operational data records. MVR, FH, LMAA, SFS, HI, VK, ThW, VS, TiW and PW contributed to operating the MAX-DOAS instruments and to producing and providing glyoxal data. CR supervised the study. All co-authors have been involved in the discussion of results and the writing of this article.
At least one of the (co-)authors is a member of the editorial board of Atmospheric Measurement Techniques. The peer-review process was guided by an independent editor, and the authors also have no other competing interests to declare.
Publisher’s note: Copernicus Publications remains neutral with regard to jurisdictional claims in published maps and institutional affiliations.
This work contains modified Copernicus Sentinel-5 Precursor satellite data (2018–2020). IISER Mohali Atmospheric Chemistry Facility is gratefully acknowledged for supporting the MAX-DOAS operations in Mohali, India. We thank Caroline Fayt and Christian Herman from BIRA-IASB for maintaining the Uccle and Xianghe MAX-DOAS instruments.
This work has been supported by the European Space Agency via the preparation of the Level-2 Prototype Processor of the future Copernicus Sentinel-5 satellite (contract no. 4000118463/16/NL/AI) and via the GLYRETRO project, part of the Sentinel-5p+Innovation programme (contract no. 4000127610/19/I-NS). EUMETSAT, the Belgian Federal Science Policy Office (BELSPO) and the German Aerospace Center (DLR) financially supported the GOME-2 algorithmic developments through the AC SAF Continuous Development and Operations Phase (CDOP-3) and the ProDEx B-ACSAF contribution to the ACSAF. The Vienna MAX-DOAS instrument is part of the VINDOBONA project, which is funded by the Austrian Science Fund (FWF) (grant no. I 2296-N29), the German Science Foundation (DFG) (grant no. Ri1800/6-1) and A1 Telekom Austria.
This paper was edited by Dominik Brunner and reviewed by two anonymous referees.
Abbot, D. S., Palmer, P. I., Martin, R. V., Chance, K. V., Jacob, D. J., and Guenther, A.: Seasonal and interannual variability of North American isoprene emissions as determined by formaldehyde column measurements from space, Geophys. Res. Lett., 30, 1886, https://doi.org/10.1029/2003GL017336, 2003.
Aliwell, S. R., Van Roozendael, M., Johnston, P. V., Richter, A., Wagner, T., Arlander, D. W., Burrows, J. P., Fish, D. J., Jones, R. L., Tørnkvist, K. K., Lambert, J. C., Pfeilsticker, K., and Pundt, I.: Analysis for BrO in zenith-sky spectra: An intercomparison exercise for analysis improvement, J. Geophys. Res.-Atmos., 107, 4199, https://doi.org/10.1029/2001JD000329, 2002.
Alvarado, L. M. A., Richter, A., Vrekoussis, M., Wittrock, F., Hilboll, A., Schreier, S. F., and Burrows, J. P.: An improved glyoxal retrieval from OMI measurements, Atmos. Meas. Tech., 7, 4133–4150, https://doi.org/10.5194/amt-7-4133-2014, 2014.
Alvarado, L. M. A., Richter, A., Vrekoussis, M., Hilboll, A., Kalisz Hedegaard, A. B., Schneising, O., and Burrows, J. P.: Unexpected long-range transport of glyoxal and formaldehyde observed from the Copernicus Sentinel-5 Precursor satellite during the 2018 Canadian wildfires, Atmos. Chem. Phys., 20, 2057–2072, https://doi.org/10.5194/acp-20-2057-2020, 2020a.
Alvarado L., Richter, A., and Lerot, C.: Sentinel-5p+Innovation: Theme 1; Glyoxal Retrievals from TROPOMI (GLYRETRO): Product Validation Report, v1.1, S5p+I_CHOCHO_BIRA_VR, 19 November 2020, available at: https://glyretro.aeronomie.be/ProjectDir/documents/GLYRETRO_validation_report_v1.1.pdf (last access: 6 December 2021), 2020b.
Azam, F., Richter, A., Weber, M., Noël, S., and Burrows, J. P.: GOME2 on MetOp, Follow-on analysis of GOME2 in orbit degradation, Version 2.1, Final Report, University of Bremen, pages 67, available at: http://www.iup.uni-bremen.de/doas/reports/gome2_degradation_follow_up_final_report.pdf (last access: 6 December 2021), 2015.
Barkley, M. P., De Smedt, I. , Van Roozendael, M., Kurosu, T. P., Chance, K., Arneth, A., Hagberg, D., Guenther, A., Paulot, F., Marais, E., and Mao, J.: Top-down isoprene emissions over tropical South America inferred from SCIAMACHY and OMI formaldehyde columns, J. Geophys. Res.-Atmos., 118, 6849–6868, https://doi.org/10.1002/jgrd.50552, 2013.
Barkley, M. P., González Abad, G., Kurosu, T. P., Spurr, R., Torbatian, S., and Lerot, C.: OMI air-quality monitoring over the Middle East, Atmos. Chem. Phys., 17, 4687–4709, https://doi.org/10.5194/acp-17-4687-2017, 2017.
Bauwens, M., Stavrakou, T., Müller, J.-F., De Smedt, I., Van Roozendael, M., van der Werf, G. R., Wiedinmyer, C., Kaiser, J. W., Sindelarova, K., and Guenther, A.: Nine years of global hydrocarbon emissions based on source inversion of OMI formaldehyde observations, Atmos. Chem. Phys., 16, 10133–10158, https://doi.org/10.5194/acp-16-10133-2016, 2016.
Beekmann, M. and Vautard, R.: A modelling study of photochemical regimes over Europe: robustness and variability, Atmos. Chem. Phys., 10, 10067–10084, https://doi.org/10.5194/acp-10-10067-2010, 2010.
Behrens, L. K., Hilboll, A., Richter, A., Peters, E., Alvarado, L. M. A., Kalisz Hedegaard, A. B., Wittrock, F., Burrows, J. P., and Vrekoussis, M.: Detection of outflow of formaldehyde and glyoxal from the African continent to the Atlantic Ocean with a MAX-DOAS instrument, Atmos. Chem. Phys., 19, 10257–10278, https://doi.org/10.5194/acp-19-10257-2019, 2019.
Beirle, S., Dörner, S., Donner, S., Remmers, J., Wang, Y., and Wagner, T.: The Mainz profile algorithm (MAPA), Atmos. Meas. Tech., 12, 1785–1806, https://doi.org/10.5194/amt-12-1785-2019, 2019.
Benavent, N., Garcia-Nieto, D., Wang, S., and Saiz-Lopez, A.: MAX-DOAS measurements and vertical profiles of glyoxal and formaldehyde in Madrid, Spain, Atmos. Environ., 199, 357–367, https://doi.org/10.1016/j.atmosenv.2018.11.047, 2019.
Boersma, K. F., Eskes, H. J., Veefkind, J. P., Brinksma, E. J., van der A, R. J., Sneep, M., van den Oord, G. H. J., Levelt, P. F., Stammes, P., Gleason, J. F., and Bucsela, E. J.: Near-real time retrieval of tropospheric NO2 from OMI, Atmos. Chem. Phys., 7, 2103–2118, https://doi.org/10.5194/acp-7-2103-2007, 2007.
Boersma, K. F., Eskes, H. J., Dirksen, R. J., van der A, R. J., Veefkind, J. P., Stammes, P., Huijnen, V., Kleipool, Q. L., Sneep, M., Claas, J., Leitão, J., Richter, A., Zhou, Y., and Brunner, D.: An improved tropospheric NO2 column retrieval algorithm for the Ozone Monitoring Instrument, Atmos. Meas. Tech., 4, 1905–1928, https://doi.org/10.5194/amt-4-1905-2011, 2011.
Brinksma, E. J., Pinardi, G., Volten, H., Braak, R., Richter, A., Schönhardt, A., van Roozendael, M., Fayt, C., Hermans, C., Dirksen, R. J., Vlemmix, T., Berkhout, A. J. C., Swart, D. P. J., Oetjen, H., Wittrock, F., Wagner, T., Ibrahim, O. W., de Leeuw, G., Moerman, M., Curier, R. L., Celarier, E. A., Cede, A., Knap, W. H., Veefkind, J. P., Eskes, H. J., Allaart, M., Rothe, R., Piters, A. J. M., and Levelt, P. F.: The 2005 and 2006 DANDELIONS NO2 and aerosol intercomparison campaigns, J. Geophys. Res., 113, D16S46, https://doi.org/10.1029/2007JD008808, 2008.
Cao, H., Fu, T.-M., Zhang, L., Henze, D. K., Miller, C. C., Lerot, C., Abad, G. G., De Smedt, I., Zhang, Q., van Roozendael, M., Hendrick, F., Chance, K., Li, J., Zheng, J., and Zhao, Y.: Adjoint inversion of Chinese non-methane volatile organic compound emissions using space-based observations of formaldehyde and glyoxal, Atmos. Chem. Phys., 18, 15017–15046, https://doi.org/10.5194/acp-18-15017-2018, 2018.
Chan, A. W. H., Chan, M. N., Surratt, J. D., Chhabra, P. S., Loza, C. L., Crounse, J. D., Yee, L. D., Flagan, R. C., Wennberg, P. O., and Seinfeld, J. H.: Role of aldehyde chemistry and NOx concentrations in secondary organic aerosol formation, Atmos. Chem. Phys., 10, 7169–7188, https://doi.org/10.5194/acp-10-7169-2010, 2010.
Chan Miller, C., Gonzalez Abad, G., Wang, H., Liu, X., Kurosu, T., Jacob, D. J., and Chance, K.: Glyoxal retrieval from the Ozone Monitoring Instrument, Atmos. Meas. Tech., 7, 3891–3907, https://doi.org/10.5194/amt-7-3891-2014, 2014.
Chan Miller, C., Jacob, D. J., Marais, E. A., Yu, K., Travis, K. R., Kim, P. S., Fisher, J. A., Zhu, L., Wolfe, G. M., Hanisco, T. F., Keutsch, F. N., Kaiser, J., Min, K.-E., Brown, S. S., Washenfelder, R. A., González Abad, G., and Chance, K.: Glyoxal yield from isoprene oxidation and relation to formaldehyde: chemical mechanism, constraints from SENEX aircraft observations, and interpretation of OMI satellite data, Atmos. Chem. Phys., 17, 8725–8738, https://doi.org/10.5194/acp-17-8725-2017, 2017.
Chance, K. and Kurucz, R. L.: An improved high-resolution solar reference spectrum for earth's atmosphere measurements in the ultraviolet, visible, and near infrared, J. Quant. Spectrosc. Ra., 111, 1289–1295, https://doi.org/10.1016/j.jqsrt.2010.01.036, 2010.
Chance, K. V. and Spurr, R. J. D.: Ring effect studies: Rayleigh scattering, including molecular parameters for rotational Raman scattering, and the Fraunhofer spectrum, Appl. Optics, 36, 5224, https://doi.org/10.1364/ao.36.005224, 1997.
Clémer, K., Van Roozendael, M., Fayt, C., Hendrick, F., Hermans, C., Pinardi, G., Spurr, R., Wang, P., and De Mazière, M.: Multiple wavelength retrieval of tropospheric aerosol optical properties from MAXDOAS measurements in Beijing, Atmos. Meas. Tech., 3, 863–878, https://doi.org/10.5194/amt-3-863-2010, 2010.
Coburn, S., Ortega, I., Thalman, R., Blomquist, B., Fairall, C. W., and Volkamer, R.: Measurements of diurnal variations and eddy covariance (EC) fluxes of glyoxal in the tropical marine boundary layer: description of the Fast LED-CE-DOAS instrument, Atmos. Meas. Tech., 7, 3579–3595, https://doi.org/10.5194/amt-7-3579-2014, 2014.
Curci, G., Palmer, P. I., Kurosu, T. P., Chance, K., and Visconti, G.: Estimating European volatile organic compound emissions using satellite observations of formaldehyde from the Ozone Monitoring Instrument, Atmos. Chem. Phys., 10, 11501–11517, https://doi.org/10.5194/acp-10-11501-2010, 2010.
Danckaert, T., Fayt, C., van Roozendael, M., De Smedt, I., Letocard, V., Merlaud, A., and Pinardi, G.: QDOAS software user manual, available at: http://uv-vis.aeronomie.be/software/QDOAS/QDOAS_manual.pdf (last access: 6 December 2021), 2017.
Danielson, J. J. and Gesch, D. B.: Global multi-resolution terrain elevation data 2010 (GMTED2010), U.S. Department of the Interior, U.S. Geological Survey, available at: https://pubs.usgs.gov/of/2011/1073/pdf/of2011-1073.pdf (last access: 6 December 2021), 2011.
De Smedt, I., Müller, J.-F., Stavrakou, T., van der A, R., Eskes, H., and Van Roozendael, M.: Twelve years of global observations of formaldehyde in the troposphere using GOME and SCIAMACHY sensors, Atmos. Chem. Phys., 8, 4947–4963, https://doi.org/10.5194/acp-8-4947-2008, 2008.
De Smedt, I., Stavrakou, T., Hendrick, F., Danckaert, T., Vlemmix, T., Pinardi, G., Theys, N., Lerot, C., Gielen, C., Vigouroux, C., Hermans, C., Fayt, C., Veefkind, P., Müller, J.-F., and Van Roozendael, M.: Diurnal, seasonal and long-term variations of global formaldehyde columns inferred from combined OMI and GOME-2 observations, Atmos. Chem. Phys., 15, 12519–12545, https://doi.org/10.5194/acp-15-12519-2015, 2015.
De Smedt, I., Theys, N., Yu, H., Danckaert, T., Lerot, C., Compernolle, S., Van Roozendael, M., Richter, A., Hilboll, A., Peters, E., Pedergnana, M., Loyola, D., Beirle, S., Wagner, T., Eskes, H., van Geffen, J., Boersma, K. F., and Veefkind, P.: Algorithm theoretical baseline for formaldehyde retrievals from S5P TROPOMI and from the QA4ECV project, Atmos. Meas. Tech., 11, 2395–2426, https://doi.org/10.5194/amt-11-2395-2018, 2018.
De Smedt, I., Pinardi, G., Vigouroux, C., Compernolle, S., Bais, A., Benavent, N., Boersma, F., Chan, K.-L., Donner, S., Eichmann, K.-U., Hedelt, P., Hendrick, F., Irie, H., Kumar, V., Lambert, J.-C., Langerock, B., Lerot, C., Liu, C., Loyola, D., Piters, A., Richter, A., Rivera Cárdenas, C., Romahn, F., Ryan, R. G., Sinha, V., Theys, N., Vlietinck, J., Wagner, T., Wang, T., Yu, H., and Van Roozendael, M.: Comparative assessment of TROPOMI and OMI formaldehyde observations and validation against MAX-DOAS network column measurements, Atmos. Chem. Phys., 21, 12561–12593, https://doi.org/10.5194/acp-21-12561-2021, 2021.
DiGangi, J. P., Henry, S. B., Kammrath, A., Boyle, E. S., Kaser, L., Schnitzhofer, R., Graus, M., Turnipseed, A., Park, J.-H., Weber, R. J., Hornbrook, R. S., Cantrell, C. A., Maudlin III, R. L., Kim, S., Nakashima, Y., Wolfe, G. M., Kajii, Y., Apel, E. C., Goldstein, A. H., Guenther, A., Karl, T., Hansel, A., and Keutsch, F. N.: Observations of glyoxal and formaldehyde as metrics for the anthropogenic impact on rural photochemistry, Atmos. Chem. Phys., 12, 9529–9543, https://doi.org/10.5194/acp-12-9529-2012, 2012.
Eskes, H. J. and Boersma, K. F.: Averaging kernels for DOAS total-column satellite retrievals, Atmos. Chem. Phys., 3, 1285–1291, https://doi.org/10.5194/acp-3-1285-2003, 2003.
EUMETSAT: GOME-2 Product Guide (EUM/OPS-EPS/MAN/07/0445), available at: https://www.eumetsat.int/gome-2-instrument-status-calibration (last access: 6 December 2021), 2011.
Friedrich, M. M., Rivera, C., Stremme, W., Ojeda, Z., Arellano, J., Bezanilla, A., García-Reynoso, J. A., and Grutter, M.: NO2 vertical profiles and column densities from MAX-DOAS measurements in Mexico City, Atmos. Meas. Tech., 12, 2545–2565, https://doi.org/10.5194/amt-12-2545-2019, 2019.
Fu, T.-M., Jacob, D. J., Wittrock, F., Burrows, J. P., Vrekoussis, M., and Henze, D. K.: Global budgets of atmospheric glyoxal and methylglyoxal, and implications for formation of secondary organic aerosols, J. Geophys. Res., 113, D15303, https://doi.org/10.1029/2007JD009505, 2008.
Gordon, I. E., Rothman, L. S., Hill, C., Kochanov, R. V., Tan, Y., Bernath, P. F., Birk, M., Boudon, V., Campargue, A., Chance, K. V., Drouin, B. J., Flaud, J. M., Gamache, R. R., Hodges, J. T., Jacquemart, D., Perevalov, V. I., Perrin, A., Shine, K. P., Smith, M. A. H., Tennyson, J., Toon, G. C., Tran, H., Tyuterev, V. G., Barbe, A., Császár, A. G., Devi, V. M., Furtenbacher, T., Harrison, J. J., Hartmann, J. M., Jolly, A., Johnson, T. J., Karman, T., Kleiner, I., Kyuberis, A. A., Loos, J., Lyulin, O. M., Massie, S. T., Mikhailenko, S. N., Moazzen-Ahmadi, N., Müller, H. S. P., Naumenko, O. V., Nikitin, A. V., Polyansky, O. L., Rey, M., Rotger, M., Sharpe, S. W., Sung, K., Starikova, E., Tashkun, S. A., Auwera, J. Vander, Wagner, G., Wilzewski, J., Wcisło, P., Yu, S., and Zak, E. J.: The HITRAN2016 molecular spectroscopic database, J. Quant. Spectrosc. Ra., 203, 3–69, https://doi.org/10.1016/j.jqsrt.2017.06.038, 2017.
Gratsea, M., Vrekoussis, M., Richter, A., Wittrock, F., Schönhardt, A., Burrows, J., Kazadzis, S., Mihalopoulos, N., and Gerasopoulos, E.: Slant column MAX-DOAS measurements of nitrogen dioxide, formaldehyde, glyoxal and oxygen dimer in the urban environment of Athens, Atmos. Environ., 135, 118–131, https://doi.org/10.1016/J.ATMOSENV.2016.03.048, 2016.
Guenther, A. B., Jiang, X., Heald, C. L., Sakulyanontvittaya, T., Duhl, T., Emmons, L. K., and Wang, X.: The Model of Emissions of Gases and Aerosols from Nature version 2.1 (MEGAN2.1): an extended and updated framework for modeling biogenic emissions, Geosci. Model Dev., 5, 1471–1492, https://doi.org/10.5194/gmd-5-1471-2012, 2012.
Hallquist, M., Wenger, J. C., Baltensperger, U., Rudich, Y., Simpson, D., Claeys, M., Dommen, J., Donahue, N. M., George, C., Goldstein, A. H., Hamilton, J. F., Herrmann, H., Hoffmann, T., Iinuma, Y., Jang, M., Jenkin, M. E., Jimenez, J. L., Kiendler-Scharr, A., Maenhaut, W., McFiggans, G., Mentel, T. F., Monod, A., Prévôt, A. S. H., Seinfeld, J. H., Surratt, J. D., Szmigielski, R., and Wildt, J.: The formation, properties and impact of secondary organic aerosol: current and emerging issues, Atmos. Chem. Phys., 9, 5155–5236, https://doi.org/10.5194/acp-9-5155-2009, 2009.
Hendrick, F., Müller, J.-F., Clémer, K., Wang, P., De Mazière, M., Fayt, C., Gielen, C., Hermans, C., Ma, J. Z., Pinardi, G., Stavrakou, T., Vlemmix, T., and Van Roozendael, M.: Four years of ground-based MAX-DOAS observations of HONO and NO2 in the Beijing area, Atmos. Chem. Phys., 14, 765–781, https://doi.org/10.5194/acp-14-765-2014, 2014.
Hönninger, G., von Friedeburg, C., and Platt, U.: Multi axis differential optical absorption spectroscopy (MAX-DOAS), Atmos. Chem. Phys., 4, 231–254, https://doi.org/10.5194/acp-4-231-2004, 2004.
Hoque, H. M. S., Irie, H., and Damiani, A.: First MAX-DOAS Observations of Formaldehyde and Glyoxal in Phimai, Thailand, J. Geophys. Res.-Atmos., 123, 9957–9975, https://doi.org/10.1029/2018JD028480, 2018.
Huang, G., Brook, R., Crippa, M., Janssens-Maenhout, G., Schieberle, C., Dore, C., Guizzardi, D., Muntean, M., Schaaf, E., and Friedrich, R.: Speciation of anthropogenic emissions of non-methane volatile organic compounds: a global gridded data set for 1970–2012, Atmos. Chem. Phys., 17, 7683–7701, https://doi.org/10.5194/acp-17-7683-2017, 2017.
Irie, H., Takashima, H., Kanaya, Y., Boersma, K. F., Gast, L., Wittrock, F., Brunner, D., Zhou, Y., and Van Roozendael, M.: Eight-component retrievals from ground-based MAX-DOAS observations, Atmos. Meas. Tech., 4, 1027–1044, https://doi.org/10.5194/amt-4-1027-2011, 2011.
Jacob, D. J.: Introduction to Atmospheric Chemistry, Princeton University Press, Princeton, New Jersey, 280 pp., ISBN 9780691001852, available at: https://press.princeton.edu/books/hardcover/9780691001852/introduction-to-atmospheric-chemistry (last access: 6 December 2021), 2000.
Javed, Z., Liu, C., Khokhar, M., Tan, W., Liu, H., Xing, C., Ji, X., Tanvir, A., Hong, Q., Sandhu, O., Rehman, A., Javed, Z., Liu, C., Khokhar, M. F., Tan, W., Liu, H., Xing, C., Ji, X., Tanvir, A., Hong, Q., Sandhu, O., and Rehman, A.: Ground-Based MAX-DOAS Observations of CHOCHO and HCHO in Beijing and Baoding, China, Remote Sens.-Basel, 11, 1524, https://doi.org/10.3390/rs11131524, 2019.
Jin, X., Jin, X., Fiore, A., Fiore, A., Boersma, K. F., De Smedt, I., and Valin, L.: Inferring Changes in Summertime Surface Ozone-NOx-VOC Chemistry over U.S. Urban Areas from Two Decades of Satellite and Ground-Based Observations, Environ. Sci. Technol., 54, 6518–6529, https://doi.org/10.1021/acs.est.9b07785, 2020.
Kaiser, J., Wolfe, G. M., Min, K. E., Brown, S. S., Miller, C. C., Jacob, D. J., deGouw, J. A., Graus, M., Hanisco, T. F., Holloway, J., Peischl, J., Pollack, I. B., Ryerson, T. B., Warneke, C., Washenfelder, R. A., and Keutsch, F. N.: Reassessing the ratio of glyoxal to formaldehyde as an indicator of hydrocarbon precursor speciation, Atmos. Chem. Phys., 15, 7571–7583, https://doi.org/10.5194/acp-15-7571-2015, 2015.
Kleipool, Q., Ludewig, A., Babić, L., Bartstra, R., Braak, R., Dierssen, W., Dewitte, P.-J., Kenter, P., Landzaat, R., Leloux, J., Loots, E., Meijering, P., van der Plas, E., Rozemeijer, N., Schepers, D., Schiavini, D., Smeets, J., Vacanti, G., Vonk, F., and Veefkind, P.: Pre-launch calibration results of the TROPOMI payload on-board the Sentinel-5 Precursor satellite, Atmos. Meas. Tech., 11, 6439–6479, https://doi.org/10.5194/amt-11-6439-2018, 2018.
Kleipool, Q. L., Dobber, M. R., de Haan, J. F., and Levelt, P. F.: Earth surface reflectance climatology from 3 years of OMI data, J. Geophys. Res., 113, D18308, https://doi.org/10.1029/2008JD010290, 2008.
Kluge, F., Hüneke, T., Knecht, M., Lichtenstern, M., Rotermund, M., Schlager, H., Schreiner, B., and Pfeilsticker, K.: Profiling of formaldehyde, glyoxal, methylglyoxal, and CO over the Amazon: normalized excess mixing ratios and related emission factors in biomass burning plumes, Atmos. Chem. Phys., 20, 12363–12389, https://doi.org/10.5194/acp-20-12363-2020, 2020.
Knote, C., Hodzic, A., Jimenez, J. L., Volkamer, R., Orlando, J. J., Baidar, S., Brioude, J., Fast, J., Gentner, D. R., Goldstein, A. H., Hayes, P. L., Knighton, W. B., Oetjen, H., Setyan, A., Stark, H., Thalman, R., Tyndall, G., Washenfelder, R., Waxman, E., and Zhang, Q.: Simulation of semi-explicit mechanisms of SOA formation from glyoxal in aerosol in a 3-D model, Atmos. Chem. Phys., 14, 6213–6239, https://doi.org/10.5194/acp-14-6213-2014, 2014.
Kosarev, A. N., Kostianoy, A. G., and Zonn, I. S.: Kara-Bogaz-Gol bay: Physical and chemical evolution, Aquat. Geochem., 15, 223–236, https://doi.org/10.1007/s10498-008-9054-z, 2009.
Kumar, V., Sarkar, C., and Sinha, V.: Influence of post-harvest crop residue fires on surface ozone mixing ratios in the N.W. IGP analyzed using 2 years of continuous in situ trace gas measurements, J. Geophys. Res., 121, 3619–3633, https://doi.org/10.1002/2015JD024308, 2016.
Kumar, V., Beirle, S., Dörner, S., Mishra, A. K., Donner, S., Wang, Y., Sinha, V., and Wagner, T.: Long-term MAX-DOAS measurements of NO2, HCHO, and aerosols and evaluation of corresponding satellite data products over Mohali in the Indo-Gangetic Plain, Atmos. Chem. Phys., 20, 14183–14235, https://doi.org/10.5194/acp-20-14183-2020, 2020.
Lawson, S. J., Selleck, P. W., Galbally, I. E., Keywood, M. D., Harvey, M. J., Lerot, C., Helmig, D., and Ristovski, Z.: Seasonal in situ observations of glyoxal and methylglyoxal over the temperate oceans of the Southern Hemisphere, Atmos. Chem. Phys., 15, 223–240, https://doi.org/10.5194/acp-15-223-2015, 2015.
Lerot, C.: TROPOMI glyoxal tropospheric columns, Royal Belgian Institute for Space Aeronomy (BIRA-IASB) [data set], Brussels, Belgium, https://doi.org/10.18758/71021069, 2021.
Lerot, C., Stavrakou, T., De Smedt, I., Müller, J.-F., and Van Roozendael, M.: Glyoxal vertical columns from GOME-2 backscattered light measurements and comparisons with a global model, Atmos. Chem. Phys., 10, 12059–12072, https://doi.org/10.5194/acp-10-12059-2010, 2010.
Levelt, P. F., Van Den Oord, G. H. J., Dobber, M. R., Mälkki, A., Visser, H., De Vries, J., Stammes, P., Lundell, J. O. V., and Saari, H.: The Ozone Monitoring Instrument, IEEE Trans. Geosci. Remote Sens., 44, 1093, https://doi.org/10.1109/TGRS.2006.872333, 2006.
Levelt, P. F., Stein Zweers, D. C., Aben, I., Bauwens, M., Borsdorff, T., De Smedt, I., Eskes, H. J., Lerot, C., Loyola, D. G., Romahn, F., Stavrakou, T., Theys, N., Van Roozendael, M., Veefkind, J. P., and Verhoelst, T.: Air quality impacts of COVID-19 lockdown measures detected from space using high spatial resolution observations of multiple trace gases from Sentinel-5P/TROPOMI, Atmos. Chem. Phys. Discuss. [preprint], https://doi.org/10.5194/acp-2021-534, in review, 2021.
Li, J., Mao, J., Min, K.-E., Washenfelder, R. A., Brown, S. S., Kaiser, J., Keutsch, F. N., Volkamer, R., Wolfe, G. M., Hanisco, T. F., Pollack, I. B., Ryerson, T. B., Graus, M., Gilman, J. B., Lerner, B. M., Warneke, C., de Gouw, J. A., Middlebrook, A. M., Liao, J., Welti, A., Henderson, B. H., McNeill, V. F., Hall, S. R., Ullmann, K., Donner, L. J., Paulot, F., and Horowitz, L. W.: Observational constraints on glyoxal production from isoprene oxidation and its contribution to organic aerosol over the Southeast United States, J. Geophys. Res.-Atmos., 121, 9849–9861, https://doi.org/10.1002/2016JD025331, 2016.
Liu, Z., Wang, Y., Vrekoussis, M., Richter, A., Wittrock, F., Burrows, J. P., Shao, M., Chang, C.-C., Liu, S.-C., Wang, H., and Chen, C.: Exploring the missing source of glyoxal (CHOCHO) over China, Geophys. Res. Lett., 39, L10812, https://doi.org/10.1029/2012GL051645, 2012.
Lorente, A., Folkert Boersma, K., Yu, H., Dörner, S., Hilboll, A., Richter, A., Liu, M., Lamsal, L. N., Barkley, M., De Smedt, I., Van Roozendael, M., Wang, Y., Wagner, T., Beirle, S., Lin, J.-T., Krotkov, N., Stammes, P., Wang, P., Eskes, H. J., and Krol, M.: Structural uncertainty in air mass factor calculation for NO2 and HCHO satellite retrievals, Atmos. Meas. Tech., 10, 759–782, https://doi.org/10.5194/amt-10-759-2017, 2017.
Lorente, A., Boersma, K. F., Stammes, P., Tilstra, L. G., Richter, A., Yu, H., Kharbouche, S., and Muller, J.-P.: The importance of surface reflectance anisotropy for cloud and NO2 retrievals from GOME-2 and OMI, Atmos. Meas. Tech., 11, 4509–4529, https://doi.org/10.5194/amt-11-4509-2018, 2018.
Loyola, D. G., Xu, J., Heue, K.-P., and Zimmer, W.: Applying FP_ILM to the retrieval of geometry-dependent effective Lambertian equivalent reflectivity (GE_LER) daily maps from UVN satellite measurements, Atmos. Meas. Tech., 13, 985–999, https://doi.org/10.5194/amt-13-985-2020, 2020.
Ludewig, A., Kleipool, Q., Bartstra, R., Landzaat, R., Leloux, J., Loots, E., Meijering, P., van der Plas, E., Rozemeijer, N., Vonk, F., and Veefkind, P.: In-flight calibration results of the TROPOMI payload on board the Sentinel-5 Precursor satellite, Atmos. Meas. Tech., 13, 3561–3580, https://doi.org/10.5194/amt-13-3561-2020, 2020.
Lutz, R., Loyola, D., Gimeno García, S., and Romahn, F.: OCRA radiometric cloud fractions for GOME-2 on MetOp-A/B, Atmos. Meas. Tech., 9, 2357–2379, https://doi.org/10.5194/amt-9-2357-2016, 2016.
Mahajan, A. S., Prados-Roman, C., Hay, T. D., Lampel, J., Pöhler, D., Großmann, K., Tschritter, J., Frieß, U., Platt, U., Johnston, P., Kreher, K., Wittrock, F., Burrows, J. P., Plane, J. M. C., and Saiz-Lopez, A.: Glyoxal observations in the global marine boundary layer, J. Geophys. Res.-Atmos., 119, 6160–6169, https://doi.org/10.1002/2013JD021388, 2014.
Marais, E. A., Jacob, D. J., Kurosu, T. P., Chance, K., Murphy, J. G., Reeves, C., Mills, G., Casadio, S., Millet, D. B., Barkley, M. P., Paulot, F., and Mao, J.: Isoprene emissions in Africa inferred from OMI observations of formaldehyde columns, Atmos. Chem. Phys., 12, 6219–6235, https://doi.org/10.5194/acp-12-6219-2012, 2012.
Mason, J. D., Cone, M. T., and Fry, E. S.: Ultraviolet (250–550 nm) absorption spectrum of pure water, Appl. Optics, 55, 7163, https://doi.org/10.1364/AO.55.007163, 2016.
Müller, J.-F. and Brasseur, G.: IMAGES: A three-dimensional chemical transport model of the global troposphere, J. Geophys. Res., 100, 16445, https://doi.org/10.1029/94JD03254, 1995.
Müller, J.-F., Stavrakou, T., Bauwens, M., Compernolle, S., and Peeters, J.: Chemistry and deposition in the Model of Atmospheric composition at Global and Regional scales using Inversion Techniques for Trace gas Emissions (MAGRITTE v1.0). Part B. Dry deposition, Geosci. Model Dev. Discuss. [preprint], https://doi.org/10.5194/gmd-2018-317, 2018.
Müller, J.-F., Stavrakou, T., and Peeters, J.: Chemistry and deposition in the Model of Atmospheric composition at Global and Regional scales using Inversion Techniques for Trace gas Emissions (MAGRITTE v1.1) – Part 1: Chemical mechanism, Geosci. Model Dev., 12, 2307–2356, https://doi.org/10.5194/gmd-12-2307-2019, 2019.
Müller, J.-F., Stavrakou, T., Wallens, S., De Smedt, I., Van Roozendael, M., Potosnak, M. J., Rinne, J., Munger, B., Goldstein, A., and Guenther, A. B.: Global isoprene emissions estimated using MEGAN, ECMWF analyses and a detailed canopy environment model, Atmos. Chem. Phys., 8, 1329–1341, https://doi.org/10.5194/acp-8-1329-2008, 2008.
Munro, R., Lang, R., Klaes, D., Poli, G., Retscher, C., Lindstrot, R., Huckle, R., Lacan, A., Grzegorski, M., Holdak, A., Kokhanovsky, A., Livschitz, J., and Eisinger, M.: The GOME-2 instrument on the Metop series of satellites: instrument design, calibration, and level 1 data processing – an overview, Atmos. Meas. Tech., 9, 1279–1301, https://doi.org/10.5194/amt-9-1279-2016, 2016.
Myriokefalitakis, S., Vrekoussis, M., Tsigaridis, K., Wittrock, F., Richter, A., Brühl, C., Volkamer, R., Burrows, J. P., and Kanakidou, M.: The influence of natural and anthropogenic secondary sources on the glyoxal global distribution, Atmos. Chem. Phys., 8, 4965–4981, https://doi.org/10.5194/acp-8-4965-2008, 2008.
Noël, S., Bramstedt, K., Bovensmann, H., Gerilowski, K., Burrows, J. P., Standfuss, C., Dufour, E., and Veihelmann, B.: Quantification and mitigation of the impact of scene inhomogeneity on Sentinel-4 UVN UV-VIS retrievals, Atmos. Meas. Tech., 5, 1319–1331, https://doi.org/10.5194/amt-5-1319-2012, 2012.
Palmer, P. I., Jacob, D. J., Chance, K., Martin, R. V., Spurr, R. J. D., Kurosu, T. P., Bey, I., Yantosca, R., Fiore, A., and Li, Q.: Air mass factor formulation for spectroscopic measurements from satellites: Application to formaldehyde retrievals from the Global Ozone Monitoring Experiment, J. Geophys. Res.-Atmos., 106, 14539–14550, https://doi.org/10.1029/2000JD900772, 2001.
Palmer, P. I., Abbot, D. S., Fu, T.-M., Jacob, D. J., Chance, K., Kurosu, T. P., Guenther, A., Wiedinmyer, C., Stanton, J. C., Pilling, M. J., Pressley, S. N., Lamb, B., and Sumner, A. L.: Quantifying the seasonal and interannual variability of North American isoprene emissions using satellite observations of the formaldehyde column, J. Geophys. Res., 111, D12315, https://doi.org/10.1029/2005JD006689, 2006.
Peters, E., Wittrock, F., Richter, A., Alvarado, L. M. A., Rozanov, V. V., and Burrows, J. P.: Liquid water absorption and scattering effects in DOAS retrievals over oceans, Atmos. Meas. Tech., 7, 4203–4221, https://doi.org/10.5194/amt-7-4203-2014, 2014.
Platt, U. and Stutz, J.: Differential Optical Absorption Spectroscopy: Principles and Applications, Physics of Earth and Space Environments, Springer, Berlin and Heidelberg, ISBN: 978-3-540-75776-4, 2008.
Puķīte, J., Kühl, S., Deutschmann, T., Platt, U., and Wagner, T.: Extending differential optical absorption spectroscopy for limb measurements in the UV, Atmos. Meas. Tech., 3, 631–653, https://doi.org/10.5194/amt-3-631-2010, 2010.
Richter, A. and Burrows, J. P.: Tropospheric NO2 from GOME measurements, Adv. Space Res., 29, 1673–1683, https://doi.org/10.1016/S0273-1177(02)00100-X, 2002.
Richter, A., Begoin, M., Hilboll, A., and Burrows, J. P.: An improved NO2 retrieval for the GOME-2 satellite instrument, Atmos. Meas. Tech., 4, 1147–1159, https://doi.org/10.5194/amt-4-1147-2011, 2011.
Richter, A., Hilboll, A., Sanders, A., Peters, E., and Burrows, J. P.: Inhomogeneous scene effects in OMI NO2 observations, Geophysical Research Abstracts Vol. 20, EGU2018-9630-3, EGU General Assembly 2018, 8–13 April 2018, Vienna, Austria, available at: http://www.doas-bremen.de/posters/egu_2018_richter.pdf (last access: 6 December 2021), 2018.
Rothman, L. S., Gordon, I. E., Babikov, Y., Barbe, A., Chris Benner, D., Bernath, P. F., Birk, M., Bizzocchi, L., Boudon, V., Brown, L. R., Campargue, A., Chance, K., Cohen, E. A., Coudert, L. H., Devi, V. M., Drouin, B. J., Fayt, A., Flaud, J. M., Gamache, R. R., Harrison, J. J., Hartmann, J. M., Hill, C., Hodges, J. T., Jacquemart, D., Jolly, A., Lamouroux, J., Le Roy, R. J., Li, G., Long, D. A., Lyulin, O. M., Mackie, C. J., Massie, S. T., Mikhailenko, S., Müller, H. S. P., Naumenko, O. V., Nikitin, A. V., Orphal, J., Perevalov, V., Perrin, A., Polovtseva, E. R., Richard, C., Smith, M. A. H., Starikova, E., Sung, K., Tashkun, S., Tennyson, J., Toon, G. C., Tyuterev, V. G., and Wagner, G.: The HITRAN2012 molecular spectroscopic database, J. Quant. Spectrosc. Ra., 130, 4–50, https://doi.org/10.1016/j.jqsrt.2013.07.002, 2013.
Rozanov, A., Rozanov, V., Buchwitz, M., Kokhanovsky, A., and Burrows, J. P.: SCIATRAN 2.0 – A new radiative transfer model for geophysical applications in the 175–2400 nm spectral region, Adv. Space Res., 36, 1015–1019, https://doi.org/10.1016/j.asr.2005.03.012, 2005.
Schenkeveld, V. M. E., Jaross, G., Marchenko, S., Haffner, D., Kleipool, Q. L., Rozemeijer, N. C., Veefkind, J. P., and Levelt, P. F.: In-flight performance of the Ozone Monitoring Instrument, Atmos. Meas. Tech., 10, 1957–1986, https://doi.org/10.5194/amt-10-1957-2017, 2017.
Schreier, S. F., Richter, A., Peters, E., Ostendorf, M., Schmalwieser, A. W., Weihs, P., and Burrows, J. P.: Dual ground-based MAX-DOAS observations in Vienna, Austria: Evaluation of horizontal and temporal NO2, HCHO, and CHOCHO distributions and comparison with independent data sets, Atmos. Environ. X, 5, 100059, https://doi.org/10.1016/J.AEAOA.2019.100059, 2020.
Serdyuchenko, A., Gorshelev, V., Weber, M., Chehade, W., and Burrows, J. P.: High spectral resolution ozone absorption cross-sections – Part 2: Temperature dependence, Atmos. Meas. Tech., 7, 625–636, https://doi.org/10.5194/amt-7-625-2014, 2014.
Sinreich, R., Coburn, S., Dix, B., and Volkamer, R.: Ship-based detection of glyoxal over the remote tropical Pacific Ocean, Atmos. Chem. Phys., 10, 11359–11371, https://doi.org/10.5194/acp-10-11359-2010, 2010.
Spurr R. and Christi M.: The LIDORT and VLIDORT Linearized Scalar and Vector Discrete Ordinate Radiative Transfer Models: Updates in the Last 10 Years, in: Springer Series in Light Scattering, edited by: Kokhanovsky, A., Springer, Cham, ISBN: 978-3-030-03444-3, https://doi.org/10.1007/978-3-030-03445-0_1, 2019.
Stavrakou, T., Müller, J.-F., De Smedt, I., Van Roozendael, M., van der Werf, G. R., Giglio, L., and Guenther, A.: Evaluating the performance of pyrogenic and biogenic emission inventories against one decade of space-based formaldehyde columns, Atmos. Chem. Phys., 9, 1037–1060, https://doi.org/10.5194/acp-9-1037-2009, 2009a.
Stavrakou, T., Müller, J.-F., De Smedt, I., Van Roozendael, M., Kanakidou, M., Vrekoussis, M., Wittrock, F., Richter, A., and Burrows, J. P.: The continental source of glyoxal estimated by the synergistic use of spaceborne measurements and inverse modelling, Atmos. Chem. Phys., 9, 8431–8446, https://doi.org/10.5194/acp-9-8431-2009, 2009b.
Stavrakou, T., Müller, J.-F., Boersma, K. F., van der A, R. J., Kurokawa, J., Ohara, T., and Zhang, Q.: Key chemical NOx sink uncertainties and how they influence top-down emissions of nitrogen oxides, Atmos. Chem. Phys., 13, 9057–9082, https://doi.org/10.5194/acp-13-9057-2013, 2013.
Stavrakou, T., Müller, J.-F., Bauwens, M., De Smedt, I., Lerot, C., Van Roozendael, M., Coheur, P.-F., Clerbaux, C., Boersma, K. F., Van Der A, R., and Song, Y.: Substantial Underestimation of Post-Harvest Burning Emissions in the North China Plain Revealed by Multi-Species Space Observations, Sci. Rep., 6, 32307, https://doi.org/10.1038/srep32307, 2016.
Thalman, R. and Volkamer, R.: Temperature dependent absorption cross-sections of O2–O2 collision pairs between 340 and 630 nm and at atmospherically relevant pressure, Phys. Chem. Chem. Phys., 15, 15371, https://doi.org/10.1039/c3cp50968k, 2013.
Theys, N., Volkamer, R., Müller, J. F., Zarzana, K. J., Kille, N., Clarisse, L., De Smedt, I., Lerot, C., Finkenzeller, H., Hendrick, F., Koenig, T. K., Lee, C. F., Knote, C., Yu, H., and Van Roozendael, M.: Global nitrous acid emissions and levels of regional oxidants enhanced by wildfires, Nat. Geosci., 13, 681–686, https://doi.org/10.1038/s41561-020-0637-7, 2020.
Tilstra, L. G., Tuinder, O. N. E., Wang, P., and Stammes, P.: Surface reflectivity climatologies from UV to NIR determined from Earth observations by GOME-2 and SCIAMACHY, J. Geophys. Res.-Atmos., 122, 4084–4111, https://doi.org/10.1002/2016JD025940, 2017.
Tilstra, L. G., Tuinder, O. N. E., Wang, P., and Stammes, P.: Directionally dependent Lambertian-equivalent reflectivity (DLER) of the Earth's surface measured by the GOME-2 satellite instruments, Atmos. Meas. Tech., 14, 4219–4238, https://doi.org/10.5194/amt-14-4219-2021, 2021.
Torres, O., Bhartia, P. K., Jethva, H., and Ahn, C.: Impact of the ozone monitoring instrument row anomaly on the long-term record of aerosol products, Atmos. Meas. Tech., 11, 2701–2715, https://doi.org/10.5194/amt-11-2701-2018, 2018.
Valks, P.: GOME-2 glyoxal tropospheric columns, DLR-IMF [data set], available at: https://acsaf.org/datarecord_access.php, last access: 6 December 2021.
Valks, P., Hao, N., and Lerot, C.: Algorithm Theoretical Basis Document for GOME-2 glyoxal column data records, SAF/AC/DLR/ATBD/GLY/01; Iss. 1/B., available at: https://acsaf.org/atbds.php (last access 6 December 2021), 2020.
Vandaele, A. C., Hermans, C., Simon, P. C., Carleer, M., Colin, R., Fally, S., Mérienne, M. F., Jenouvrier, A., and Coquart, B.: Measurements of the NO2 absorption cross-section from 42 000 cm−1 to 10 000 cm−1 (238–1000 nm) at 220 K and 294 K, J. Quant. Spectrosc. Ra., 59, 171–184, https://doi.org/10.1016/S0022-4073(97)00168-4, 1998.
van Geffen, J. H. G. M., Eskes, H. J., Boersma, K. F., Maasakkers, J. D., and Veefkind, J. P.: TROPOMI ATBD of the total and tropospheric NO2 data products, S5p/TROPOMI, (1.4.0), 1–76, available at: https://sentinel.esa.int/documents/247904/2476257/Sentinel-5P-TROPOMI-ATBD-NO2-data-products (last access: 6 December 2021), 2019.
Veefkind, J. P., Aben, I., McMullan, K., Förster, H., de Vries, J., Otter, G., Claas, J., Eskes, H. J., de Haan, J. F., Kleipool, Q., van Weele, M., Hasekamp, O., Hoogeveen, R., Landgraf, J., Snel, R., Tol, P., Ingmann, P., Voors, R., Kruizinga, B., Vink, R., Visser, H., and Levelt, P. F.: TROPOMI on the ESA Sentinel-5 Precursor: A GMES mission for global observations of the atmospheric composition for climate, air quality and ozone layer applications, Remote Sens. Environ., 120, 70–83, https://doi.org/10.1016/j.rse.2011.09.027, 2012.
Veefkind, J. P., de Haan, J. F., Sneep, M., and Levelt, P. F.: Improvements to the OMI O2–O2 operational cloud algorithm and comparisons with ground-based radar–lidar observations, Atmos. Meas. Tech., 9, 6035–6049, https://doi.org/10.5194/amt-9-6035-2016, 2016.
Verhoelst, T., Compernolle, S., Pinardi, G., Lambert, J.-C., Eskes, H. J., Eichmann, K.-U., Fjæraa, A. M., Granville, J., Niemeijer, S., Cede, A., Tiefengraber, M., Hendrick, F., Pazmiño, A., Bais, A., Bazureau, A., Boersma, K. F., Bognar, K., Dehn, A., Donner, S., Elokhov, A., Gebetsberger, M., Goutail, F., Grutter de la Mora, M., Gruzdev, A., Gratsea, M., Hansen, G. H., Irie, H., Jepsen, N., Kanaya, Y., Karagkiozidis, D., Kivi, R., Kreher, K., Levelt, P. F., Liu, C., Müller, M., Navarro Comas, M., Piters, A. J. M., Pommereau, J.-P., Portafaix, T., Prados-Roman, C., Puentedura, O., Querel, R., Remmers, J., Richter, A., Rimmer, J., Rivera Cárdenas, C., Saavedra de Miguel, L., Sinyakov, V. P., Stremme, W., Strong, K., Van Roozendael, M., Veefkind, J. P., Wagner, T., Wittrock, F., Yela González, M., and Zehner, C.: Ground-based validation of the Copernicus Sentinel-5P TROPOMI NO2 measurements with the NDACC ZSL-DOAS, MAX-DOAS and Pandonia global networks, Atmos. Meas. Tech., 14, 481–510, https://doi.org/10.5194/amt-14-481-2021, 2021.
Vigouroux, C., Langerock, B., Bauer Aquino, C. A., Blumenstock, T., Cheng, Z., De Mazière, M., De Smedt, I., Grutter, M., Hannigan, J. W., Jones, N., Kivi, R., Loyola, D., Lutsch, E., Mahieu, E., Makarova, M., Metzger, J.-M., Morino, I., Murata, I., Nagahama, T., Notholt, J., Ortega, I., Palm, M., Pinardi, G., Röhling, A., Smale, D., Stremme, W., Strong, K., Sussmann, R., Té, Y., van Roozendael, M., Wang, P., and Winkler, H.: TROPOMI–Sentinel-5 Precursor formaldehyde validation using an extensive network of ground-based Fourier-transform infrared stations, Atmos. Meas. Tech., 13, 3751–3767, https://doi.org/10.5194/amt-13-3751-2020, 2020.
Vohra, K., Vodonos, A., Schwartz, J., Marais, E. A., Sulprizio, M. P., and Mickley, L. J.: Global mortality from outdoor fine particle pollution generated by fossil fuel combustion: Results from GEOS-Chem, Environ. Res., 195, 110754, https://doi.org/10.1016/j.envres.2021.110754, 2021.
Volkamer, R., Spietz, P., Burrows, J., and Platt, U.: High-resolution absorption cross-section of glyoxal in the UV–vis and IR spectral ranges, J. Photoch. Photobio. A, 172, 35–46, https://doi.org/10.1016/j.jphotochem.2004.11.011, 2005.
Volkamer, R., San Martini, F., Molina, L. T., Salcedo, D., Jimenez, J. L., and Molina, M. J.: A missing sink for gas-phase glyoxal in Mexico City: Formation of secondary organic aerosol, Geophys. Res. Lett., 34, L19807, https://doi.org/10.1029/2007GL030752, 2007.
Volkamer, R., Baidar, S., Campos, T. L., Coburn, S., DiGangi, J. P., Dix, B., Eloranta, E. W., Koenig, T. K., Morley, B., Ortega, I., Pierce, B. R., Reeves, M., Sinreich, R., Wang, S., Zondlo, M. A., and Romashkin, P. A.: Aircraft measurements of BrO, IO, glyoxal, NO2, H2O, O2–O2 and aerosol extinction profiles in the tropics: comparison with aircraft-/ship-based in situ and lidar measurements, Atmos. Meas. Tech., 8, 2121–2148, https://doi.org/10.5194/amt-8-2121-2015, 2015.
Voors, R., Dobber, M., Dirksen, R., and Levelt, P.: Method of calibration to correct for cloud-induced wavelength shifts in the Aura satellite's Ozone Monitoring Instrument, Appl. Optics, 45, 3652–3658, https://doi.org/10.1364/AO.45.003652, 2006.
Vrekoussis, M., Wittrock, F., Richter, A., and Burrows, J. P.: Temporal and spatial variability of glyoxal as observed from space, Atmos. Chem. Phys., 9, 4485–4504, https://doi.org/10.5194/acp-9-4485-2009, 2009.
Vrekoussis, M., Wittrock, F., Richter, A., and Burrows, J. P.: GOME-2 observations of oxygenated VOCs: what can we learn from the ratio glyoxal to formaldehyde on a global scale?, Atmos. Chem. Phys., 10, 10145–10160, https://doi.org/10.5194/acp-10-10145-2010, 2010.
Wagner, T., Beirle, S., and Deutschmann, T.: Three-dimensional simulation of the Ring effect in observations of scattered sun light using Monte Carlo radiative transfer models, Atmos. Meas. Tech., 2, 113–124, https://doi.org/10.5194/amt-2-113-2009, 2009.
Wells, K. C., Millet, D. B., Payne, V. H., Deventer, M. J., Bates, K. H., de Gouw, J. A., Graus, M., Warneke, C., Wisthaler, A., and Fuentes, J. D.: Satellite isoprene retrievals constrain emissions and atmospheric oxidation, Nature, 585, 225–233, https://doi.org/10.1038/s41586-020-2664-3, 2020.
van der Werf, G. R., Randerson, J. T., Giglio, L., van Leeuwen, T. T., Chen, Y., Rogers, B. M., Mu, M., van Marle, M. J. E., Morton, D. C., Collatz, G. J., Yokelson, R. J., and Kasibhatla, P. S.: Global fire emissions estimates during 1997–2016, Earth Syst. Sci. Data, 9, 697–720, https://doi.org/10.5194/essd-9-697-2017, 2017.
Wittrock, F., Richter, A., Oetjen, H., Burrows, J. P., Kanakidou, M., Myriokefalitakis, S., Volkamer, R., Beirle, S., Platt, U., and Wagner, T.: Simultaneous global observations of glyoxal and formaldehyde from space, Geophys. Res. Lett., 33, L16804, https://doi.org/10.1029/2006GL026310, 2006.
World Health Organization: Ambient air pollution: A global assessment of exposure and burden of disease, WHO, Geneva, Switzerland, 121 pp., ISBN 978-9-2415-1135-3, available at: https://apps.who.int/iris/handle/10665/250141 (last access: 6 December 2021), 2016.
Zara, M., Boersma, K. F., De Smedt, I., Richter, A., Peters, E., van Geffen, J. H. G. M., Beirle, S., Wagner, T., Van Roozendael, M., Marchenko, S., Lamsal, L. N., and Eskes, H. J.: Improved slant column density retrieval of nitrogen dioxide and formaldehyde for OMI and GOME-2A from QA4ECV: intercomparison, uncertainty characterisation, and trends, Atmos. Meas. Tech., 11, 4033–4058, https://doi.org/10.5194/amt-11-4033-2018, 2018.
Zhou, Y., Brunner, D., Boersma, K. F., Dirksen, R., and Wang, P.: An improved tropospheric NO2 retrieval for OMI observations in the vicinity of mountainous terrain, Atmos. Meas. Tech., 2, 401–416, https://doi.org/10.5194/amt-2-401-2009, 2009.
- Abstract
- Introduction
- TROPOMI and other nadir-viewing satellite sensors
- Description of the algorithm
- Comparison with other satellite instruments
- Validation with MAX-DOAS data
- Conclusions
- Data availability
- Author contributions
- Competing interests
- Disclaimer
- Acknowledgements
- Financial support
- Review statement
- References
- Supplement