the Creative Commons Attribution 4.0 License.
the Creative Commons Attribution 4.0 License.
 | 07 Mar 2022
Aerosol optical characteristics in the urban area of Rome, Italy, and their impact on the UV index
Monica Campanelli
Henri Diémoz
Anna Maria Siani
Alcide di Sarra
Anna Maria Iannarelli
Rei Kudo
Gabriele Fasano
Giampietro Casasanta
Luca Tofful
Marco Cacciani
Paolo Sanò
Stefano Dietrich
The impact of the aerosol optical properties on the ultraviolet index (UVI) in the urban area of Rome is investigated in this study. In particular, the influence of aerosol optical depth (AOD) and single scattering albedo (SSA), estimated at the wavelength of 340 nm, and of the Ångström exponent, calculated in the range 340–500 nm, over a period of 11 years (2010–2020) in the months from March to September are analyzed. The UVI is monitored by a Brewer spectrophotometer, whereas measurements of the direct Sun and diffuse sky irradiances are performed by a co-located PREDE-POM sun–sky radiometer of the ESR/SKYNET network; the aerosol optical properties are obtained by the Skyrad MRIv2 retrieval. A novel method, based on physical principles and easily adaptable to other contexts, is developed to extrapolate the aerosol properties to the UV range during periods when only visible to near-infrared measurements are available. The retrievals from the sun–sky radiometer are consistent with the chemical characterization of urban PM10 (particulate matter 10 mm or less in diameter) samples collected during an intensive field campaign held in summer 2011 at the same site (URBan Sustainability Related to Observed and Monitored Aerosol – URBS ROMA). The PM macro components identified during the campaign are grouped in order to evaluate the contribution of the main macro sources (soil, sea, secondary inorganic, organics, and traffic) whose relative role is indeed expected to strongly affect the aerosol absorption capability. The surface forcing efficiency, calculated as the change in the UV index for a unit AOD variation, shows that AOD is the primary parameter affecting the surface irradiance under clear-sky conditions in Rome. SSA and the Ångström exponent are also identified as secondary influencing factors, i.e., the surface forcing efficiency is found to be greater for smaller zenith angles and for larger and more absorbent particles in the UV range (such as, e.g., mineral dust).
- Article
(2743 KB) - Full-text XML
- BibTeX
- EndNote


The aerosol influence on the incoming and outgoing solar radiation is a widely studied topic because of its relation with the Earth's radiative balance and climate. In particular, the aerosol capability of attenuating the UV radiation is partly responsible for its short and long-term variations, and it has important implications for tropospheric photochemistry, human health, and for the properties of organic materials, such as plastics and wood routinely exposed to solar radiation, as well as aquatic systems (Dickerson et al., 1997; He and Carmichael, 1999; Castro et al., 2001; Casasanta et al., 2011; Mok et al. 2018). Nevertheless, various aspects are still uncertain because the columnar absorbing and scattering properties of suspended particles are not very common in this wavelength region.
The aerosol optical depth (AOD) and single scattering albedo (SSA), that is the ratio of the aerosol scattering to extinction coefficient, representing an index of the aerosol absorption capability, are important radiative parameters to determine the aerosol effect on the UV irradiance at the surface.
Reuder and Schwander (1999) demonstrated that more than 80 % of the aerosol effect on surface UV radiation due to increasing turbidity of the atmosphere can be estimated through aerosol optical depth and single scattering albedo. Strong UV absorption by aerosol, characterized by low SSA values at wavelengths shorter than 400 nm, is commonly attributed to organic aerosols that absorb predominantly in the UV region (Martins et al., 2009) and trigger a stronger wavelength dependence than for the pure black carbon component (Kirchstetter et al., 2004). In effect, an enhancement of the aerosol absorption at UV wavelengths was observed in urban cities such as Rome, Italy (Ialongo et al., 2010), and Athens, Greece (Kazadzis et al., 2016), especially in winter. Also, mineral components show a significant absorption in the UV region, as highlighted by Meloni et al. (2006). Di Sarra et al. (2002), Panicker et al. (2009), and Antón et al. (2011), among others, have shown that an increase in AOD induces a reduction in the UV index (UVI), a relevant quantity expressing the levels of UV radiation potentially harmful to human health. These studies suggested that a unit increase in aerosol optical depth at about 400 nm may produce a significant decrease in UVI, which depends on the solar zenith angle and aerosol properties, and may exceed 50 %. More recently, Fountoulakis et al. (2021) showed that the positive trends in UV irradiance detected in Rome in specific months during the last few decades are possibly driven by changes in clouds and/or aerosols.
This work is aimed at determining, for the first time in Rome, the effect of aerosol optical properties on UV radiation, evaluating the role of SSA, AOD, and the Ångström exponent. Aerosol optical properties were provided by a PREDE-POM sun–sky radiometer of the ESR/SKYNET (http://www.euroskyrad.net/, last access: 1 March 2022) network, and the UVI values were obtained by UV irradiances measured by a Brewer spectrophotometer. The dataset covers a period of 11 years, from 2010 to 2020, in the spring–summer months (March to September). In the selected months, UVI at solar zenith angles (SZAs) smaller than 40∘ are analyzed. For SZA > 40∘, the uncertainty of the irradiances measured by the Brewer increases due to effects such as stray light (Bais and Zerefos, 1996) and angular response error (Antòn et al., 2008). Therefore, an enhancement of the estimated error of UVI, which is about 4 %–5 %, (Schmalwieser et al., 2017) is also expected. This could affect the identification of its variation caused by the aerosol effect.
2.1 Measurement site
Rome is a large urban site, with about 3 million inhabitants, located 25 km east of the Tyrrhenian Sea, in the middle of an undulating plain. The atmosphere is affected by urban emissions, by semi-rural particulates, and, especially during the spring and summer seasons, by sea breezes and long-range desert dust advection from the Saharan region (e.g., Ciardini et al., 2012; Di Bernardino et al., 2021). Long-term measurements of aerosol physical and optical properties, columnar ozone content, and UV irradiance (290–325 nm) are carried out in Rome, on the roof of the Physics Department of Sapienza University (41.9∘ N, 12.5∘ E; altitude 75 m), in the central sector of the city. This site has, since 2019 been part of the BAQUNIN project (Boundary-layer Air Quality-analysis Using Network of INstruments; Iannarelli et al., 2021).
2.2 Sun–sky radiometer measurements
Aerosol properties are retrieved from observations taken in clear sky conditions by the sun–sky radiometer PREDE-POM model 01 (hereafter called POM). It is a narrow band filter photometer able to perform measurements of direct solar and diffuse sky irradiances within a narrow field of view of 1∘ at selected wavelengths (315, 340, 400, 500, 675, 870, 940, and 1020 nm). The measurement schedule includes direct irradiance observations every 1 min and diffuse (almucantar; at 24 scattering angles in the range [0–180∘]) irradiances observations every 10 min. The 315 and 940 nm channels are mainly used to retrieve ozone and water vapor columnar content, whereas the other ones provide information on aerosols. The filter at 315 nm, which is characterized by a low transmittance, was replaced with one centered at 340 nm in May 2016. This instrument is part of the European Skynet Radiometer network (ESR; Campanelli et al., 2012a; http://www.euroskyrad.net/, last access: 1 March 2022), which is a regional subnetwork of SKYNET (Nakajima et al., 2020); it has been operating in Rome since 2010 up to the present. Calibration is performed monthly by the Improved Langley method (Campanelli et al., 2007), a well-tested, on-site procedure that allows one to frequently check the instrument status.
2.3 Brewer measurements
Brewer MKIV spectrophotometer with the serial number 067 has been operating at the Solar Radiometry Observatory of the Physics Department of Sapienza University of Rome since 1992. Total column ozone has been recorded since 1992, whereas the spectral UV irradiances have been performed by the same instrument since 1996. This instrument is part of the European Brewer Network (EUBREWNET) and, since 2019, has become part BAQUNIN project (Iannarelli et al., 2021).
The Brewer MKIV is a single monochromator spectrophotometer specifically designed to retrieve the total column ozone by measuring solar direct irradiances at selected UV wavelengths in the ozone absorption spectrum (Siani et al., 2018) and nitrogen dioxide in the visible part of the spectrum (Diémoz et al., 2021). The accuracy of the direct Sun measurements of total ozone taken with a well-maintained Brewer spectrophotometer is 1 % (Vanicek, 2006). The consistency among the different instruments is ∼1 % (Redondas et al., 2018). The Brewer also measures global spectral irradiances from 290 to 325 nm, with a step of 0.5 nm and a spectral resolution of about 0.6 nm. UV spectral scans are performed at Rome every 30 min throughout the day. The performance of the Brewer instrument for UV measurements was controlled every 2 years until 2014 through intercomparisons to the traveling reference QASUME UV spectroradiometer operated by the Physykalish Meteorologisches Observatorium Davos/World Radiation Center (Gröbner et al., 2005). The mean ratio of Brewer-integrated solar UV irradiances to QASUME is within +3 % (see https://www.pmodwrc.ch/en/world-radiation-center-2/wcc-uv/, last access: 1 March 2022). Thereafter, the UV calibration has been carried out by International Ozone Services Inc. (IOS) using 1000 W lamps, which are traceable to the National Institute of Standards and Technology (NIST; Maryland, USA) and regularly compared to QASUME (Siani et al., 2013).
2.4 Particulate matter samples collected at the surface
Results from an intensive field campaign (URBan Sustainability Related to Observed and Monitored Aerosol – URBS ROMA; Campanelli et al., 2012), conducted in the period June–July 2011 in the same location and which aimed to determine the aerosol direct radiative effect at the surface, are also shown to provide additional information on the aerosol properties at Rome during a summer season, and to demonstrate the soundness of the column retrievals. PM10 (particulate matter with diameter smaller than 10 mm) samples were collected by using a dual-channel sampler (HYDRA Dual Sampler; FAI Instruments s.r.l., Fonte Nuova, Rome, Italy) equipped with Teflon membrane filters and quartz fiber filters, respectively, on the two sampler's channels. The PM10 mass concentration was measured on Teflon filters by gravimetry using an automated microbalance.
3.1 Sun–sky radiometer retrieval method
Skyrad_MRIv2. pack (Kudo et al., 2021), one of the official computer codes employed in the SKYNET network, was used to retrieve the aerosol optical properties from the normalized radiance, which is the ratio between the solar diffuse radiance and direct solar irradiance, at all available wavelengths. The expected uncertainty in the retrieval products at near-ultraviolet, visible, and near-infrared wavelengths is less than 0.04 for AOD and less than 0.05 for SSA. The retrievals by Skyrad MRIv2 have been previously validated based on in situ measurements and radiative closure at the ground (Kudo et al., 2021; Fasano et al., 2021). A detailed comparison with the retrievals from a co-located AERONET photometer operating at the BAQUNIN supersite is in preparation. The cloud screening was performed based on the measurement of the fitness (fobs) parameter introduced by Kudo et al. (2021).
In order to relate the UV index to the aerosol optical properties, these latter values have to be determined at a wavelength as close as possible to the one corresponding to the maximum of the erythemally weighted solar spectrum (usually <320 nm, depending on the solar zenith angle). The shortest wavelength at which reliable observations are available from the POM operating in Rome is 340 nm. Measurements at this wavelength were started in 2016 (dataset 2), while the shortest wavelength was 400 nm prior to that date (dataset 1). Hence, to increase the length of the aerosol dataset at the shortest measured wavelength and cover a larger overlapping period with the UVI series from the Brewer, we developed a new physically based method (described below) to extrapolate the aerosol optical depth and aerosol properties from longer wavelengths (400 nm and above) down to 340 nm for both dataset 1 and 2. Then, to assess the accuracy of the method, we compare the outcome of this extrapolation with the retrieval obtained using all available wavelengths, including 340 nm (period dataset 2). Based on the very good results of such a comparison (Sect. 4.1), we always use the extrapolated data set throughout the period analyzed here for consistency. Replacing the retrievals based on observations at 340 nm (in the few periods when they are available) with the extrapolation is therefore not expected to affect the findings of this study.
The extrapolation is performed using the aerosol optical properties (AOPs) program included in the Skyrad MRIv2 package. AOP is able to calculate the aerosol optical properties at arbitrary wavelengths from the results of the Skyrad inversion, using the same kernels as in the retrieval. For example, it is normally used to interpolate the aerosol properties to the lidar wavelengths. The optical properties are calculated by the procedure described by Kudo et al. (2021), i.e., from the retrieved volume size distribution (VSD) and complex refractive index. The real (RRI) and imaginary (IRI) part of the refractive index are interpolated in the log–log space. In the default AOP operation, the RRI and IRI at the shortest/longest available wavelengths are used when properties at wavelengths beyond the measured interval are requested. However, in the present study, we further modified the code to allow extrapolation outside the measurement interval. The limitations of this approach are discussed in the next sections. Hence, the aerosol products considered in this study are as follows: AOD340, SSA340, absorption aerosol optical depth (AAOD340 = AOD340 ⋅ (1−SSA340)), and the Ångström exponent calculated from the AOD at 340 and 500 nm (Ae340_500) to infer the AOD wavelength dependence in that spectral range.
3.2 Brewer retrieval method
Spectral UV irradiances, measured by the Brewer spectrophotometer in clear-sky conditions (no clouds obscure the sun), selected according to the Alexandrov et al. (2004) methodology, were used to retrieve the UV index (UVI). The UVI was introduced in Canada in 1992 (Fioletov, 2010) to represent the potentially harmful effects of UV radiation in a simple form. UVI is a unitless quantity determined by multiplying the erythemally weighted UV irradiances (in Watts per square meter; W m−2) over the range 280–400 nm by 40 m2 W−1 (COST-713, 2000). UVI values are grouped into exposure categories expressing the risk for unprotected skin to Sun exposure. Typically at mid-latitudes, UVI values at noon vary from 0 to 10; however, larger values (e.g., a peak of 12.3 at Plateau Rosa, 3500 m a.s.l., in the Valle d'Aosta Region, Italy) can be experienced, even in Italy, at high altitudes (e.g., Casale et al., 2015) or at low-latitude sites.
The spectral irradiances were processed using the SHICrivm software version 3_075 (Slaper et al., 1995) to check for any spectral wavelength shift and spectral anomalies (Slaper et al., 1995) in the UV data. Furthermore, the software allowed us to obtain the biologically effective UV irradiance by weighting the solar irradiances with the erythemal action spectrum (CIE, 1999). Since the Brewer MKIV spectrophotometer measures spectral irradiances up to 325 nm, the non-measured part of the UVA spectrum needed for the calculation of UVI was extrapolated by the same software. Based on considerations for similar corrections in the Brewer operating software (Fioletov et al., 2004), we estimate an additional contribution (<2 %) to the overall uncertainty in the UV index value for solar zenith angles <70∘ due to this extrapolation.
Total ozone values (O3) from direct Sun measurements were generated by using the Brewer processing software, applying the rejection criteria on ozone values less than 100 DU and greater than 500 DU (Siani et al., 2018). Yet, individual total ozone values were discarded when standard deviation is above 2.5 DU and ozone air mass is above 3.5 (the ozone air mass is defined as the ratio of the actual ozone path length taken by the direct solar beam to the analogous vertical ozone path when the Sun is overhead from the surface to the top of the atmosphere).
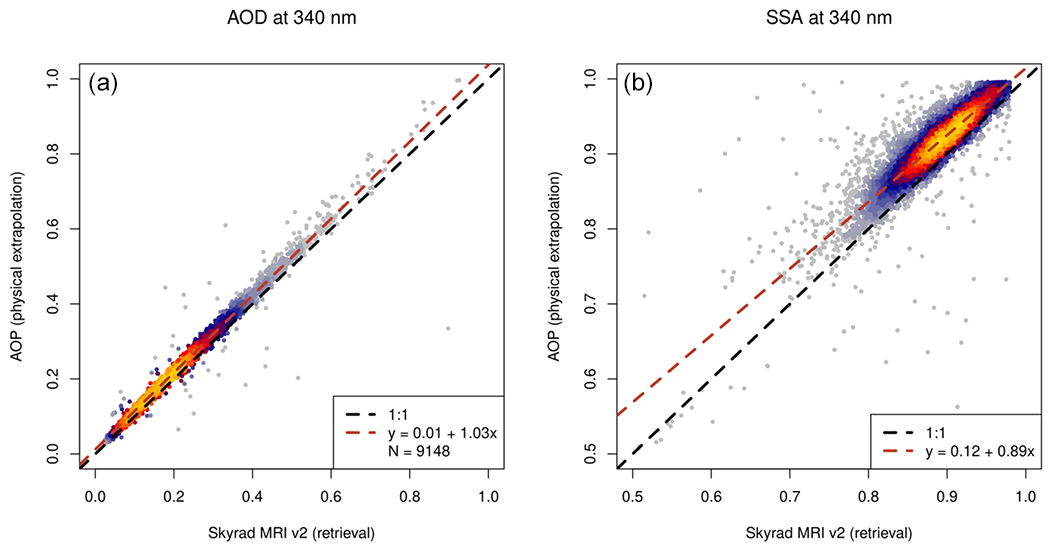
Figure 1Comparison of the AOD (a) and SSA (b) at the wavelength of 340 nm retrieved from Skyrad MRIv2 using measurements at all wavelengths as input (x axis) and the physically based extrapolation from the visible IR (>400 nm) to 340 nm based on the AOP program (y axis). Colors represent the density of the points based on a two-dimensional kernel density estimation (Venables and Ripley, 2013). Data refer to the period 2017–2020, i.e., a period when measurements in the 340 nm channel were available.
3.3 PM samples chemical analysis
Chemical characterization of the PM10 samples collected during the URBS campaign was carried out according to the method reported in Perrino et al. (2009). Briefly, elements were determined on Teflon filters by X-ray fluorescence (XRF); then, the filters were extracted from water and analyzed for their ionic content by ion chromatography (IC). Elemental and organic carbon (EC and OC) were detected on quartz filters by thermo-optical analysis (NIOSH-quartz temperature protocol). This overall analytical procedure allows the determination of each individual component, typically accounting for more than 1 % of the PM10 mass (macro components of Si, Al, Fe, Na, K, Mg, Ca, chloride, nitrate, sulfate, ammonium, elemental carbon, and organic carbon) and to obtain the mass closure.
PM10 macro components can be grouped into five clusters to estimate the contribution of the main macro sources: soil, sea, secondary inorganics, organics, and traffic. Details about the algorithms are reported in Perrino et al. (2014). The contribution of soil was calculated by adding the concentration of the following elements (considered as metal oxides) generally associated with mineral dust: Al, Si, Fe, the insoluble fractions of K, Mg, Ca (calculated as the difference between XRF and IC determinations), and calcium and magnesium carbonate (calculated as the sum of soluble calcium multiplied by 1.5 and soluble magnesium multiplied by 2.5). The sea contribution was estimated from the sum of Na+ and Cl− multiplied by 1.176 in order to take into account minor sea water components. Secondary inorganics were calculated as the sum of nitrate, ammonium, and non-sea-salt sulfate. The contribution of road traffic was estimated by adding elemental carbon to an equivalent amount multiplied by 1.1 in order to consider the contribution of primary organic matter that can be adsorbed on particles surface. The remaining organic carbon, multiplied by 1.6 to take into account non-C atoms, constituted the organics and included both secondary organic species and primary components.
3.4 Optical properties of surface aerosol from a radiative transfer model
RSTAR (System for Transfer of Atmospheric Radiation for Radiance calculations) is a radiative transfer model (Nakajima and Tanaka, 1986) able to simulate the radiation fields in the atmosphere–land–ocean system in the wavelength range 0.17–1000 µm. In total, eight fundamental materials (water, dust-like material, sea salt, volcanic ash, yellow sand, ice, water-soluble material, soot, and 75 %H2SO4) are considered to assemble a three-component internal mixture for each of the 10 particle model types (water, dust-like material, volcanic ash, rural, urban, yellow sand, ice, soot, 75 %H2SO4, sea spray, and tropospheric). The imaginary parts of the refractive index of each fundamental material in the RSTAR model were used as reference values and helped us to understand the variety of absorption capability of the PM10 macro components' concentration in the atmosphere over Rome.

Figure 2Monthly averages of AOD340, SSA340, Ae340−500, and total O3 for each year from 2010 to 2020. The number of points refers to the available daily mean data used in the calculation of the aerosol parameters monthly means. Error bars are the standard deviation that, for SSA, can be lower compared to the reported 0.05 error on SSA retrieval.
3.5 Assessment of the dependence of UVI on the aerosol optical properties
To discern the dependence of UVI on the aerosol characteristics, the influence produced by the solar zenith, angle total column of ozone, and orbital parameters (varying Earth–Sun distance) must be minimized. Therefore, first, the UVI was corrected for the variation in the Earth–Sun distance, and the values were reduced to the mean Sun–Earth distance (Madronich, 1993a). Second, only data at two values of SZA at 30∘ (±1∘) and 40∘ (±1∘) were selected. This criterion excludes data related to autumn and winter seasons, when the solar zenith angle is always higher than 40∘ in Rome. Third, the UVI dependence on total O3 has been removed. This correction has been implemented using the radiation amplification factor (RAF) and scaling the UVI to the total ozone daily average value for the day with the lowest AOD340 recorded in the entire dataset (283 DU on 8 July 2014). In fact, the effect of ozone on the erythemal UV irradiance may be described as suggested by Madronich (1993b) and Booth and Madronich (1994) as follows:
where E and E∗ are two UV irradiances observations, and O3 and O3* their corresponding total ozone amounts.
Similarly, it is possible to apply the above relationship to UVI as follows:
where < O3> is the daily ozone average value, O3∗ is the daily ozone average value during the day with the minimum average AOD340, and RAF is assumed to be equal to 1.25, according to di Sarra et al. (2002). In that study, the authors (Fig. 8) retrieved values of RAF after correcting for the influence of co-varying aerosol optical depth, and they found the values between 1.0 and 1.2 at 30 and 40∘ solar zenith angles when considering all aerosol conditions. As discussed in the paper, these values are affected by different processes (the wavelength dependence of the aerosol sensitivity, the interdependence between ozone and aerosol, possibly through increased ozone absorption following enhanced scattering by aerosols, ozone, and aerosol vertical distributions). The value of 1.25 was derived from UVSPEC radiative transfer model calculations (Emde et al., 2016) where the aerosol amount was kept fixed. This value is also in agreement with various other determinations of the ozone RAF (e.g., De Luisi and Harris, 1983; McKenzie et al., 1991; Kerr and McElroy, 1993). However, a sensitivity study of UVI∗ on the RAF variation from 1 to 1.25 has been performed over all the dataset showing an average decrease of UVI∗ by about 1.4 %, which is within the declared uncertainty of 4 %–5 %, (Schmalwieser et al., 2017).
To point out the possible effect of aerosol optical characteristics measured at 340 nm on UVI∗, UVI∗ was analyzed as function of AOD340, SSA340, AAOD340, and Ae340−500 at the two fixed solar zenith angles, associating estimations of aerosol parameters and UVI∗ made within ±5 min.

Figure 3Behavior of AOD340, SSA340, Ae340−500, and AAOD340 versus the percentage contribution of some components as retrieved during the URBS campaign.
4.1 Validation of the method to extrapolate the aerosol properties to 340 nm
Figure 1 shows a comparison of the AOD and SSA extrapolated at 340 nm by AOP (from wavelengths of 400 nm and above) and retrieved by Skyrad MRIv2, using all wavelengths (including 340 nm) for the period 2017–2020 (dataset 2). The discrepancies are well within the estimated uncertainties for both AOD340 and SSA340. Regarding the latter, it is possible that the extrapolation leads to a slight overestimation due to neglecting organic aerosols in the atmosphere that are, instead, present in Rome as found during the URBS campaign (Sect. 4.3). Indeed, the organic compounds are characterized by a larger absorption in the UV than in the visible range (Massabò et al., 2015).
To remove this residual discrepancy, thus taking the likely effect of organics into account, we further corrected the extrapolated data (AOD and SSA) by applying a simple offset/slope correction derived from the linear regression of AOP (y) vs. Skyrad (x, with ). By definition, this brings the AOP results to overlap to the Skyrad MRIv2 retrievals, on average, for the selected period. This correction assumes that the average relationship found for the 2017–2020 period also stands for the previous years. To verify this hypothesis, we again compare this optimized extrapolation to the real Skyrad retrievals in a different period (May–December 2016), when measurements at 340 nm are also available. Negligible differences are obtained, on average, even for this period (dAOD<0.006 and dSSA<0.01, not shown), hence demonstrating the robustness of the procedure.
Table 1Slope, intercept, and determination coefficient values for the linear fit of UVI∗ vs. AOD340, AAOD340, and SSA34 for different cases and the two zenith angles.

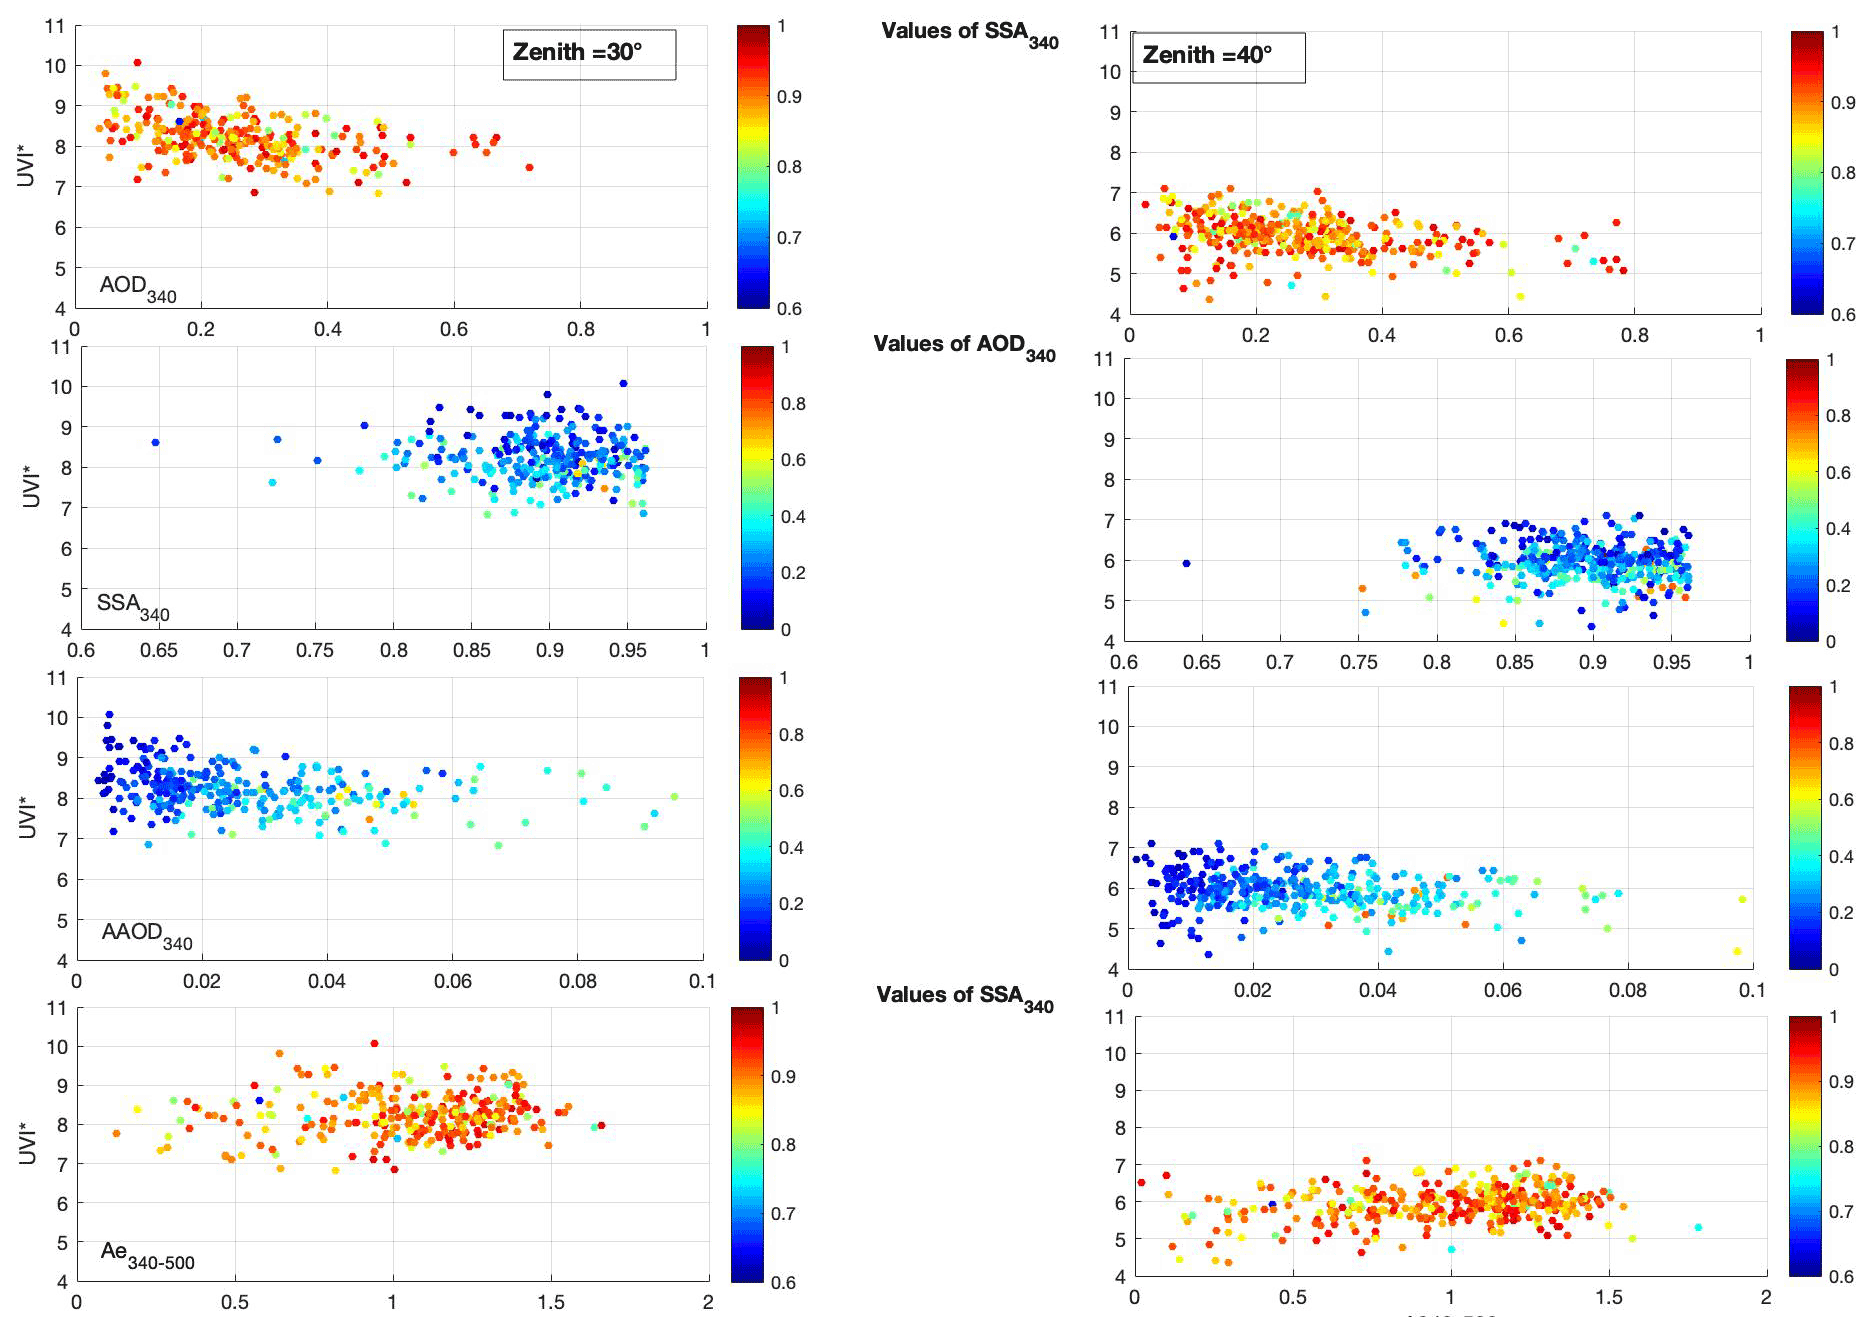
Figure 5Scatterplot of UVI∗ vs. AOD340 (top), SSA340 (second raw), AAOD340 (third raw), and Ae340−500 (bottom) for solar zenith angles of 30∘ (left) and of 40∘ (right). The colors represent the values of SSA340 (first and fourth rows) and AOD340 (second and third rows).
4.2 UVI dependence on aerosol optical parameters
The analyzed dataset covers the period of March–September from 2010 to 2020 (for the last year, the series ends in August). Figure 2 shows monthly averages of AOD340, SSA340, and Ae340−500 for the period under study. Monthly means of SSA340 vary between a minimum value of 0.84 ± 0.04 (observed in March 2010) and a maximum of 0.94 ± 0.01 (observed in June 2015). AOD340 monthly mean values range between a minimum of 0.15 ± 0.08 (in May 2019) and a maximum of 0.43 ± 0.25 (in June 2015). Ae340−500 varies between 0.45 ± 0.37 (in March 2018) and 1.34 ± 0.19 (in June 2015). The total ozone content values are also plotted in Fig. 2. The seasonal ozone behavior is typical of mid-latitude sites, with highest values measured in spring and particularly in April 2010 (385 DU) and the minimum in September 2011 (292 DU).
During June–July 2011 the PM10 chemical analyses show an average contribution over the entire sampled mass of about 29 % of soil, 6 % of sea, 23 % of secondary inorganics, 28 % of organics, and 9 % of traffic components. The absorption capability of these components is very different. In the RSTAR radiative transfer model at 336 nm, the imaginary part of the refractive index varies from low values (weak absorption) of for marine aerosol (sea salt) and for 75 %H2SO4 (characterizing secondary inorganics fraction) to a maximum of for soot (characterizing the traffic contribution). It is, therefore, expected that the modulation of the concentration of these co-existent materials can strongly affect the absorption capability of the atmosphere over Rome.
A regression analysis of the daily means of SSA340, AOD340, AAOD340, and Ae340−500, and the percentage contribution of each chemical component, has been performed in order to check whether the optical properties retrieved over the whole column and the chemical composition of samples collected at the surface are linked. Scatterplots of SSA340 and AAOD340 versus the fraction of the soil component contained in PM10 (Fig. 3b, d) exhibit a reasonable correlation (R2=0.49 and 0.31, respectively) showing an increase of the absorption capability in the atmosphere (lower SSA340 and higher AAOD340 values), with the enhancement of the soil contribution. A weaker correlation is found between Ae340−500 and the percent amount of organics and secondary INORGANICS contributions (R2=0.35 and 0.22, respectively), highlighting that an enrichment of these particulates sampled at ground level may be associated with higher values of Ae340−500 due to the presence of smaller particles in the atmosphere (Fig. 4c). Secondary inorganics seem also to be weakly correlated with AOD340 in Rome.
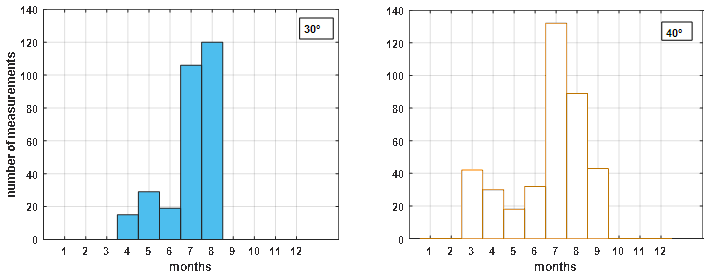
In order to point out the possible effect of aerosol optical characteristics measured at 340 nm on UVI∗, the latter was analyzed as a function of AOD340, SSA340, AAOD340, and Ae340−500 at the two selected values of the solar zenith angle. Figure 4 shows the frequency distributions of the number of measurements per month for each of the two angles. SZA equal to 30∘ is more representative of the warmest months, whereas 40∘ covers a wider period.
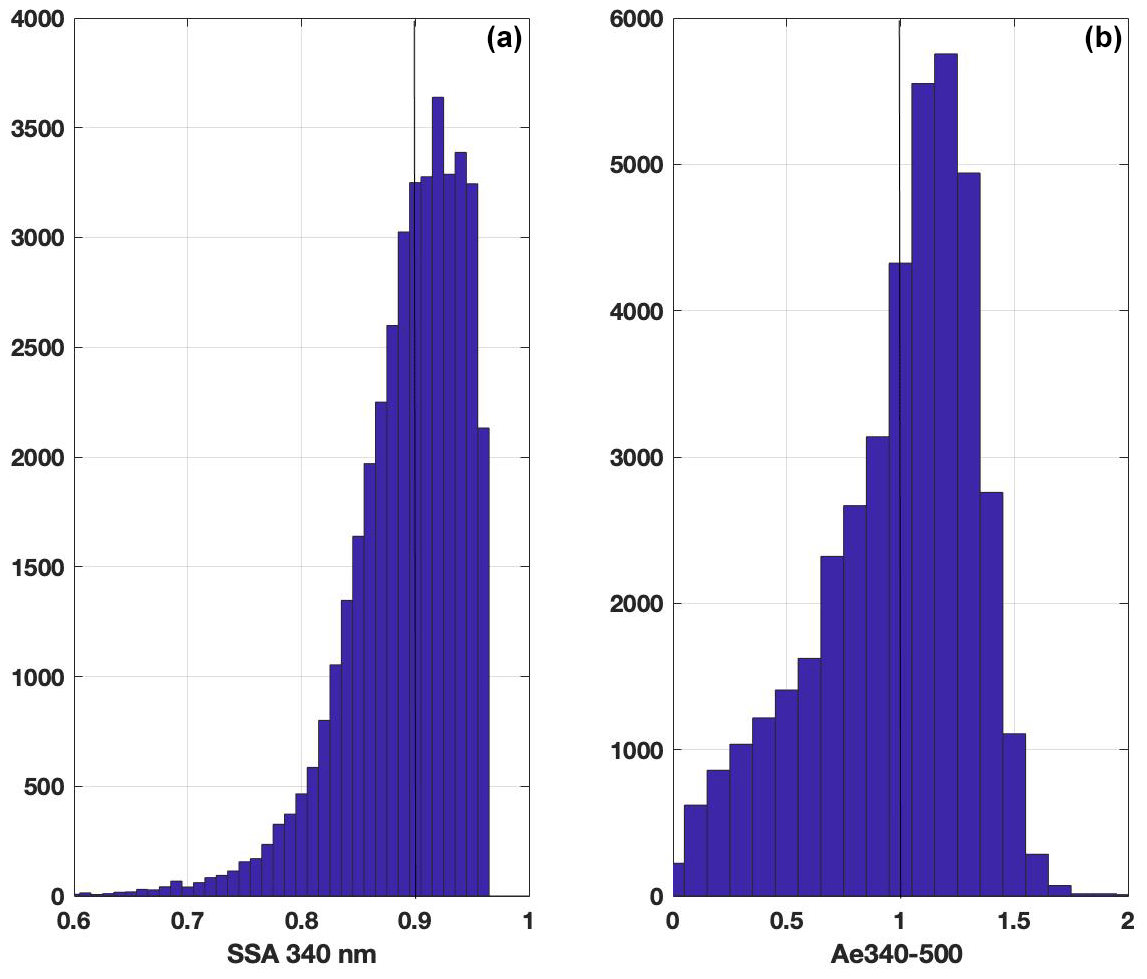
Figure 6Frequency distributions of the values of SSA340 (a) and Ang340−500 (b) for the entire investigation period. The median values used as threshold values to separate the different classes are highlighted with vertical black lines.
The dependency of UVI∗ on AOD340, SSA340, AAOD340, and Ae340_500 for 30∘ and 40∘ solar zenith angles is shown in Fig. 5 and colored for different values of SSA340 or AOD340. Slopes, intercepts, and correlation coefficients R2 are shown in Table 1. The slope retrieved for UVI∗ versus AOD corresponds to the UVI radiative forcing efficiency, i.e., the change in UVI produced by a unit change in AOD.
It is worthwhile mentioning that the UVI effective wavelengths are around 305–310 nm, depending on solar elevation, whereas aerosol properties are here retrieved at 340 nm. Since AOD305 is theoretically higher than AOD340 for the same instant, and the relationship between AAOD305 and AAOD340 depends on SSA spectral behavior in the UVB, the obtained results in Fig. 5 and Table 1 could be partly affected by the spectral behavior of both AOD and SSA in the 305–340 nm range. A slight decreasing trend of UVI∗ when AOD340 increases is evident at the smaller solar zenith angle, which is in agreement with what is found by previous studies (di Sarra et al., 2008; Antón et al., 2011). For the other parameters, no dependence is visible from this first analysis. To investigate in more detail the possible effects on UVI∗ caused by particles dimensions and atmospheric absorption capabilities, the entire dataset was divided in two groups of Ae340_500 values below and above 1, respectively, and in two groups of SSA340 values smaller and larger than 0.9, respectively. The values separating the different groups were determined according to the frequency distributions of the two variables for the entire investigation period (shown in Fig. 6). They are the median values of the distributions. To understand if the extreme values of the distributions have a different impact on UVI∗, the first and fourth quartiles were also considered as threshold values for the SSA340 and Ae340−500 datasets, i.e., (i) smaller than 0.8 and greater than 1.2, for the Ae340−500 dataset, and (ii) smaller than 0.87 and larger than 0.93, for the SSA340 dataset. Scatterplots of UVI∗ versus the two variables for each group were generated, and points with a distance greater than 2σ from the regression line (nout), with σ the standard deviation of the residuals, were rejected for the final linear fit. The dependence of UVI∗ on AOD for the classes of Ae340−500 separated by the median value is shown in Fig. 7 and colored for different values of SSA340, and statistical results for all the classes are reported in Table 1.
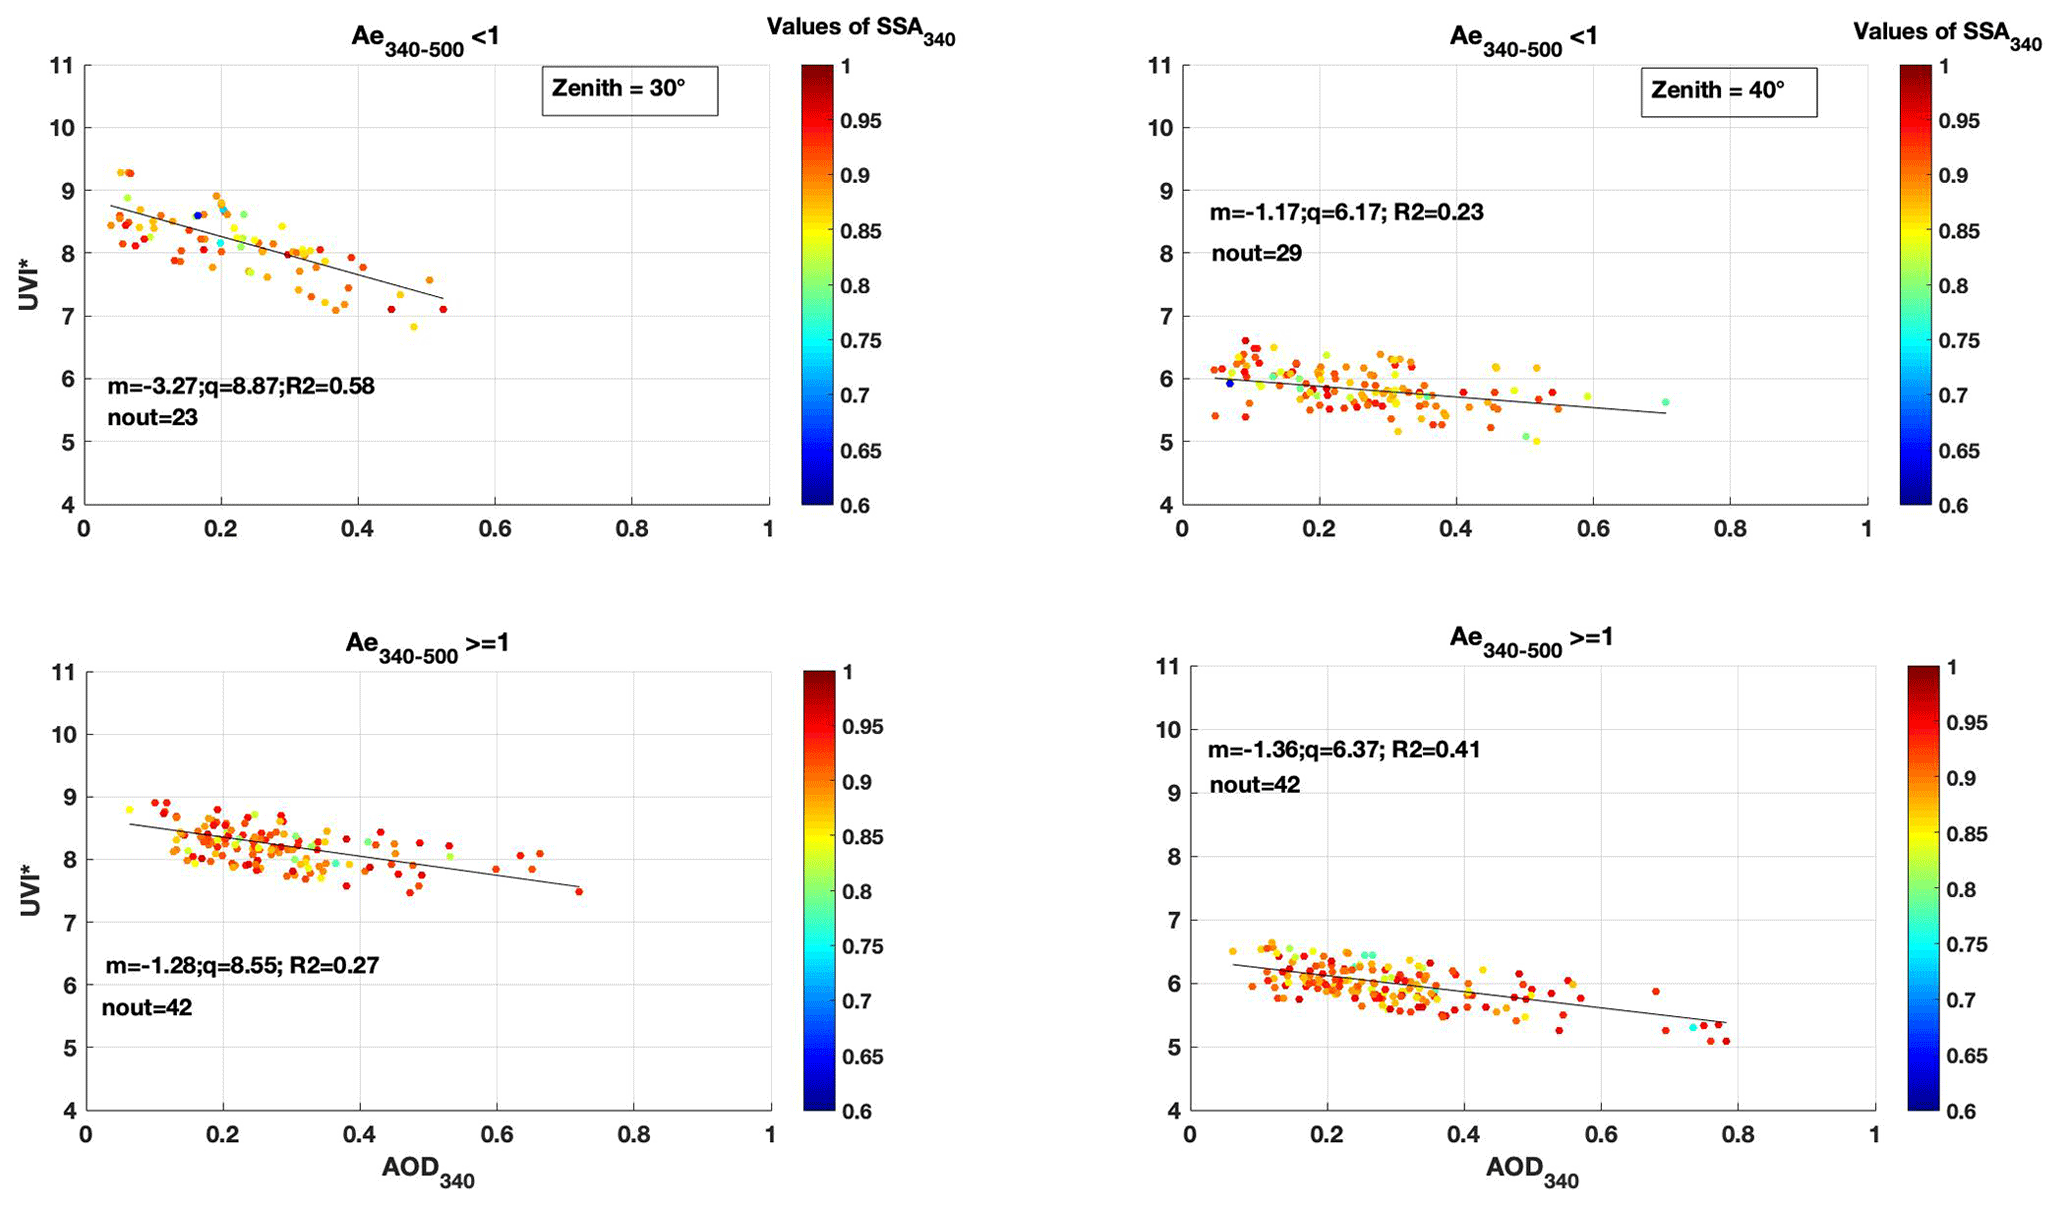
Figure 7Scatterplot of UVI∗ vs. AOD340 for two groups of Ang340−500 values and two solar zenith angles. The colors represent the values of SSA340. Note: nout is the number of rejected outliers, m is the slope, and q is the intercept value.
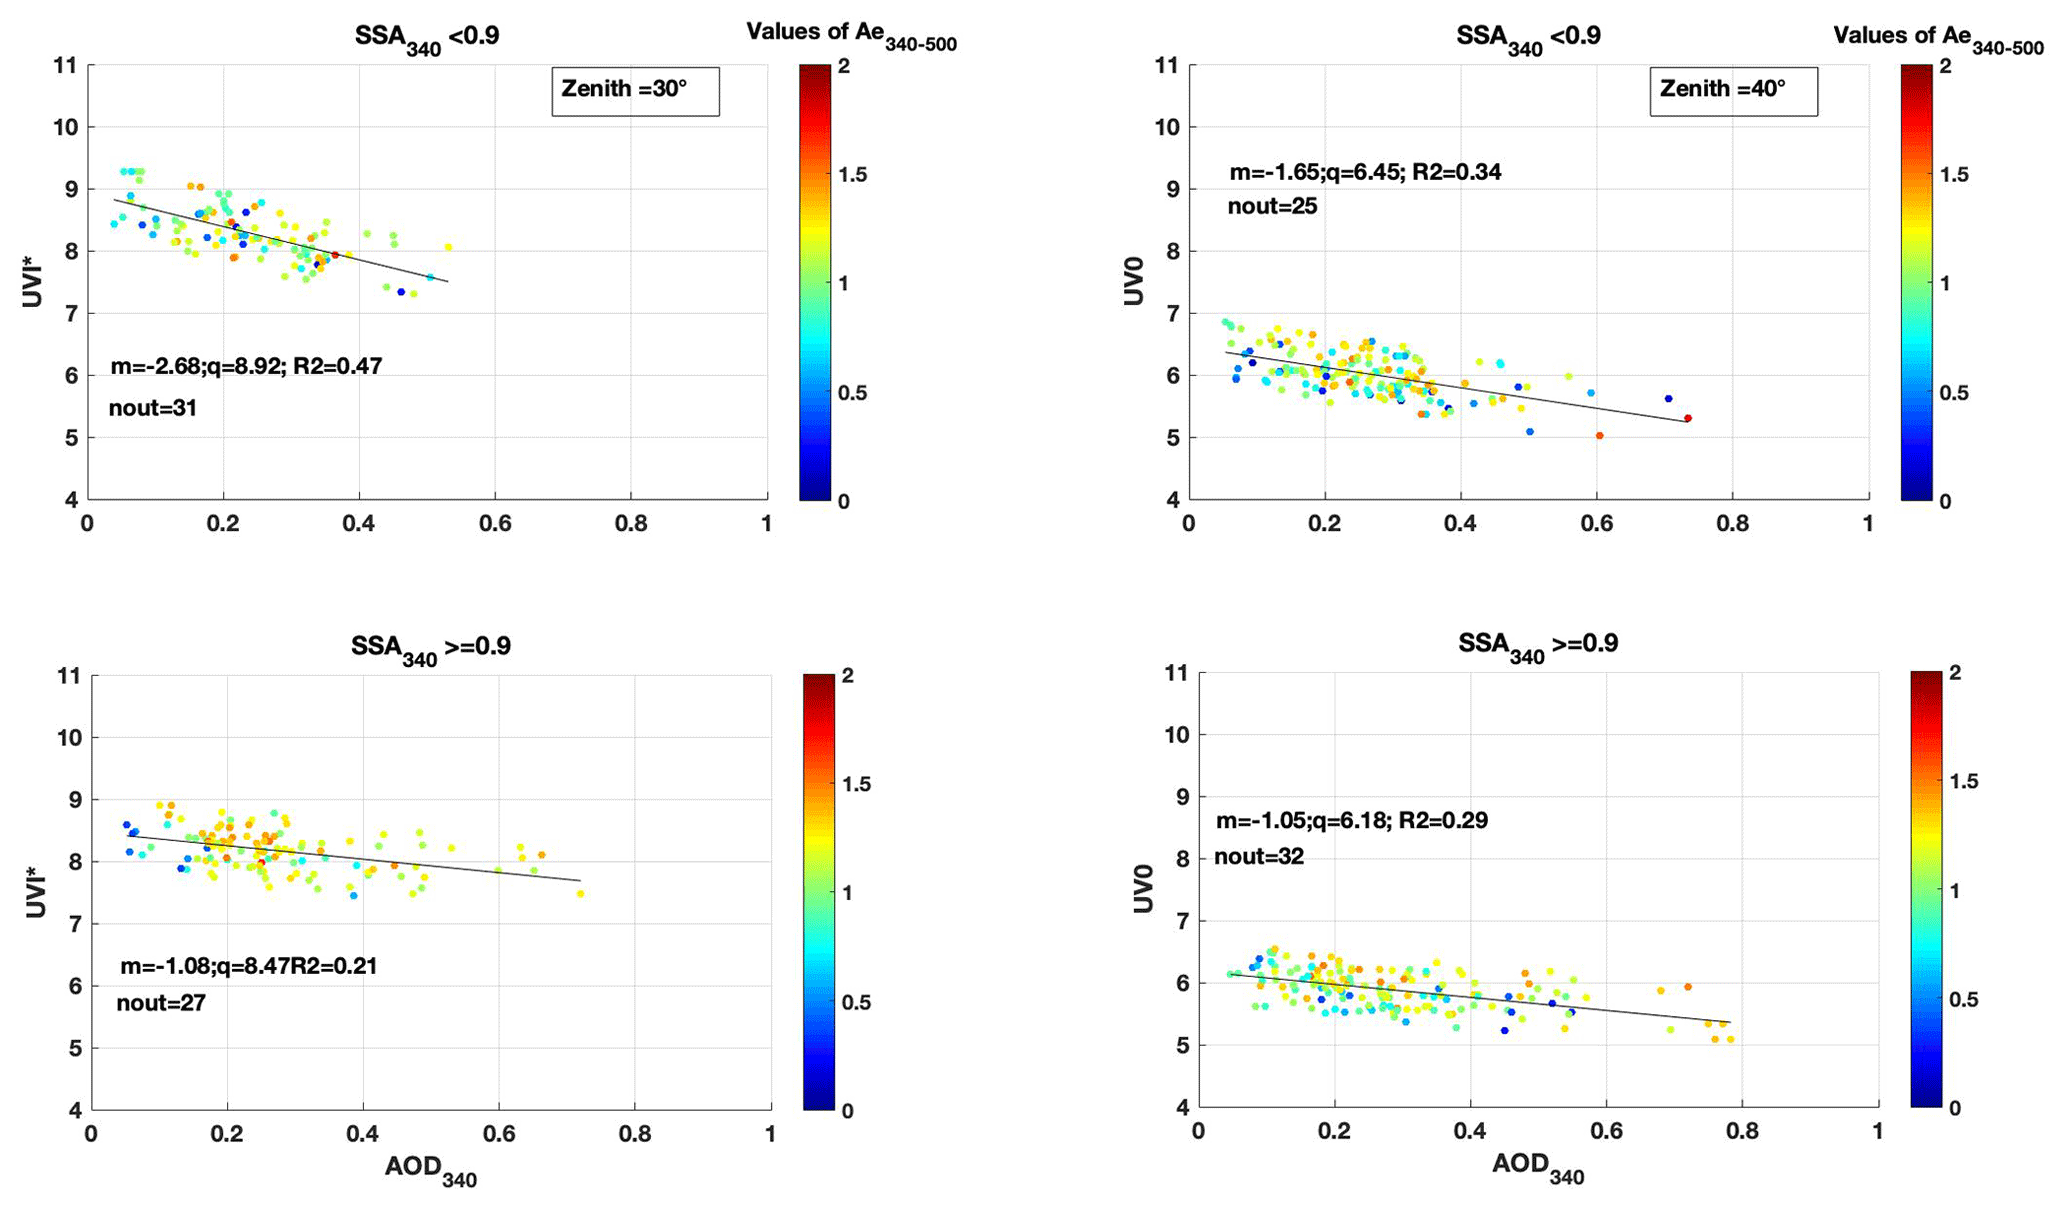
Figure 8Scatterplot of UVI∗ vs. AOD340 for two groups of SSA340 values and two solar zenith angles. The color scale refers to the values of Ang. Note: nout is the number of rejected outliers, m is the slope, and q is the intercept value.
At 30∘, the slope is greater for smaller values of Ae340−500, both in the case of median and quartiles thresholds (−3.27 and −3.02, respectively), similar to what found by Antón et al. (2011), and the correlation coefficients R2 are the highest. Small values of the Ångström exponents are due to the presence of coarse particles that, in Rome, are generally related to the presence of Saharan dust absorbing more in the UV than in the visible regions.
Smaller particles show a smaller forcing efficiency, despite the presence of organic aerosol likely absorbing in the UV range (Fig. 3). In fact, in the case of Ae340−500 greater than 1.0, which according to the analysis from the URBS campaign is likely related to concentrations from 15 % to 35 % of organics and secondary inorganics fractions (Fig. 3c), smaller values of slope (−1.28 and −1.34) and R2 are visible. These small particles are able to reduce the UVI∗ by about 1.0 when AOD340 reaches values of 0.7. A similar dependency on the Ångström exponent was found by di Sarra et al. (2008) when considering the forcing efficiency over the whole shortwave spectral range.
At 40∘ SZA, the slope is reduced with respect to 30∘, as expected. Slightly larger (negative) slopes are found at 40∘ for Ae340−500 values >1.0; however, these differences are not significant compared to the combined uncertainty of the slopes and might have been introduced by statistical sampling only.
Figure 8 shows the scatterplots of UVI∗ vs. AOD340 for SSA340<0.9 (top) and SSA340≥0.9 (bottom), with a color scale for different values of the Ångström exponent at the two zenith angles. Less absorbent particles (SSA340>0.9) show similar slopes at 30 and 40∘. The slopes increase in the case of a more absorbent atmosphere, which is in agreement with the findings by Antòn et al. (2011) in Granada, Spain, where, as expected, stronger aerosol absorption leads to a large surface forcing efficiency. At 30∘ SZA, slopes reach values of −2.68 and −2.52 in the case of median and quartiles thresholds, respectively. According to the results from the URBS campaign (Fig. 4b, d), the absorption capability (SSA340 and AAOD340) in Rome is correlated to the increase in the soil concentration; therefore, it could be inferred that the greater this component is in the atmosphere, the larger the radiative forcing efficiency is. The slopes are again greater at 30∘ compared with the results at 40∘.
The aerosol optical properties in the urban area of Rome were retrieved for a period of 11 years, in the months from March to September 2010–2020, when also co-located surface measurements of the spectral UV irradiance were available. The impact of AOD and SSA at 340 nm and the Ångström exponent calculated at 340–500 nm on the UV index has been analyzed. A new physically based method was developed to extrapolate the aerosol optical properties to the UV range when only visible to infrared measurements were available. The method was validated based using data collected at all wavelengths and was applied to the period when measurements at 340 nm were not available. The dependence of UVI∗, corrected for total ozone changes and scaled at the mean Sun–Earth distance, was studied with respect to AOD340, SSA340, AAOD340, and Ae340−500. Data at two fixed values of the solar zenith angle (30 and 40∘) were selected in order to identify the possible effects of the aerosol optical characteristics on UVI∗. A slight decreasing trend of UVI∗ when increasing AOD340 is evident at the smaller solar zenith angle, with the slope corresponding to the UVI∗ radiative forcing efficiency, i.e., the change in UVI∗ produced by a unit change in AOD. For the other parameters, no dependence is visible.
To investigate in more detail the possible effects on UVI∗ caused by the particles' dimensions and atmospheric absorption capabilities, the entire dataset was divided in two groups of Ae340_500, below and above 1, and in two groups of SSA340, smaller and larger than 0.9, where the thresholds are the median values of the two data distributions.
The forcing efficiency was found greater for the lower zenith angle and smaller values of Ae340−500 in both the case of median and quartile thresholds. Small values of Ångström exponents are related to the presence of coarse particles that, in Rome, are generally linked to the presence of Saharan dust in the atmospheric column, with more being absorbed in the UV than VIS regions.
More absorbent particles (SSA340<0.9) showed a larger forcing efficiency at smaller zenith angles. According to the results from the URBS campaign in Rome, the absorption capability is correlated to the increase in the soil fraction; therefore, it could be inferred that, the greater this component in the atmosphere, the larger the radiative forcing efficiency.
All raw data can be provided by the corresponding authors upon request.
MC, HD, and AdS wrote the draft. AdS, MC, HD, AMI, AMS, GF, and LT analyzed the data. MC, AMS, AMI, GC, LT, and MC performed the measurements. RK developed the model and supported the authors during its use. GC, LT, PS, and SD reviewed and edited the paper.
The contact author has declared that neither they nor their co-author has any competing interests.
Publisher’s note: Copernicus Publications remains neutral with regard to jurisdictional claims in published maps and institutional affiliations.
This article is part of the special issue “SKYNET – the international network for aerosol, clouds, and solar radiation studies and their applications (AMT/ACP inter-journal SI)”. It does not belong to a conference.
This paper was edited by Stelios Kazadzis and reviewed by three anonymous referees.
Alexandrov, M. D., Marshak, A., Cairns, B., Lacis, A. A., and Carlson, B. E.: Automated cloud screening algorithm for MFRSR data, Geophys. Res. Lett., 31, L04118, https://doi.org/10.1029/2003GL019105, 2004.
Antón, M., Serrano, A., Cancillo, M. L., Vilaplana, J., Cachorro, V. E., and Gröbner, J.: Correction of Angular Response Error in Brewer UV Irradiance Measurements, J. Atmos. Ocean. Technol., 25, 2018–2027, https://doi.org/10.1175/2008JTECHA1040.1, 2008.
Antón, M., Gil, J. E., Fernández-Gálvez, J., Lyamani, H., Valenzuela, A., Foyo-Moreno, I., Olmo, F. J., and Alados-Arboledas, L.: Evaluation of the aerosol forcing efficiency in the UV erythemal range at Granada, Spain, J. Geophys. Res., 116, D20214, https://doi.org/10.1029/2011JD016112, 2011.
Bais, A. F. and Zerefos, C. S: Solar UVB measurements with the double- and single- monochromator Brewer Ozone Spectrophotomete, Geophys. Res. Lett., 23, 833–836, 1996.
Booth, C. and Madronich, S.: Radiation amplification factors: Improved formulation accounts for large increases in ultraviolet radiation associated with Antarctic ozone depletion, Antar. Res. S., 62, 39–42, https://doi.org/10.1029/AR062p0039, 1994.
Campanelli, M., Estellés, V., Tomasi, C., Nakajima, T., Malvestuto, V., and Martiínez-Lozano, J. A.: Application of the SKYRAD Improved Langley plot method for the in situ calibration of CIMEL Sun–sky photometers, Appl. Opt., 46, 2688–2702, 2007.
Campanelli, M., Estellés, V., Smyth, T., Tomasi, C., Martínez-Lozano, M. P., Claxton, B., Muller, P., Pappalardo, G.,Pietruczuk, A., Shanklin, J., Colwell, S., Wrench, C., Lupi, A., Mazzola, M., Lanconelli, C., Vitale, V., Congeduti, F., Dionisi, D., and Cacciani, M.: Monitoring of Eyjafjallajoekull volcanic aerosol by the new European SkyRad users (ESR) sun–sky radiometernetwork, Atmos. Environ., 48, 33–45, 2012a.
Campanelli, M., Bassani, C., Cacciani, M., Siani, A. M., Perrino, C., Canepari, S., Di Sarra, A., Salzano, R., Casasanta, G. P., Tirelli, C., and Estelles, V.: Direct effect of aerosol on incident solar radiation at the surface as a function of aerosol mixtures measured in the center of Rome, Geophysical Research Abstracts, Vol. 14, EGU2012-4820, EGU General Assembly, 2012b.
Casale, G. R., Siani, A. M., Diémoz, H., Agnesod, G., Parisi, A. V., and Colosimo, A.: Extreme UV index and solar exposures at Plateau Rosà (3500ma.s.l.) in Valle d'Aosta Region, Italy, Sci. Total Environ., 512–513, 622–630, 2015.
Casasanta, G., di Sarra, A., Meloni, D., Monteleone, F., Pace, G., Piacentino, S., and Sferlazzo D.: Large aerosol effects on ozone photolysis in the Mediterranean, Atmos. Environ., 45, 3937–3943, 2011.
Castro, T., Madronich, S., Rivale, S., Muhlia, A., and Mar, B.: The influence of aerosols on photochemical smog in Mexico City, Atmos. Environ., 35, 1765–1772, 2001.
Ciardini, V., Di Iorio, T., Di Liberto, L., Tirelli, C., Casasanta, G., di Sarra, A., Fiocco, G., Fuà, D., and Cacciani, M.: Seasonal variability of tropospheric aerosols in Rome, Atmos. Res., 118, 205–214, https://doi.org/10.1016/j.atmosres.2012.06.026, 2012.
CIE: CIE S007/E-1998 Erythema reference action spectrum and standard erythema dose, Color Res. Appl., 24, 158–158, https://doi.org/10.1002/(sici)1520-6378(199904)24:2<158::aid-col11>3.0.co;2-4, 1999.
COST-713 Action: UV Index for the Public, European, Communities, Brussels, 27, 2000.
De Luisi, J. J. and Harris, J. M.: A determination of the absolute radiant energy of a Robertson-Berger meter sunburn unit, Atmos. Environ., 17, 751–758, 1983.
Di Bernardino, A., Iannarelli, A. M., Casadio, S., Mevi, G., Campanelli, M., Casasanta, G., Cede, A., Tiefengraber, M., Siani, A. M., Spinei, E., and Cacciani, M.: On the effect of sea breeze regime on aerosols and gases properties in the urban area of Rome, Italy, Urban Climate, 37, 100842, https://doi.org/10.1016/j.uclim.2021.100842, 2021.
Dickerson, R. R., Kondragunta, S., Stenchikov, G., Civerolo, K. L.,Doddridge, B. G., and Holben, B. N.: The impact of aerosolson solar ultraviolet radiation and photochemical smog, Science, 278, 827–830, https://doi.org/10.1126/science.278.5339.827, 1997.
Diémoz, H., Siani, A. M., Casadio, S., Iannarelli, A. M., Casale, G. R., Savastiouk, V., Cede, A., Tiefengraber, M., and Müller, M.: Advanced NO2 retrieval technique for the Brewer spectrophotometer applied to the 20-year record in Rome, Italy, Earth Syst. Sci. Data, 13, 4929–4950, https://doi.org/10.5194/essd-13-4929-2021, 2021.
di Sarra, A., Cacciani, M., Chamard, P., Cornwall, C., DeLuisi, J. J., Di Iorio, T., Disterhoft, P., Fiocco G., Fua, D., and Monteleone, F.: Effects of desert dust and ozone on the ultraviolet irradiance at the Mediterranean island of Lampedusa during PAUR II, J. Geophys. Res., 107, 8135, https://doi.org/10.1029/2000JD000139, 2002.
di Sarra, A., Pace, G., Meloni, D., De Silvestri, L., Piacentino, S., and Monteleone, F.: Surface shortwave radiative forcing of different aerosol types in the Mediterranean, Geophys. Res. Lett., 35, L02714, https://doi.org/10.1029/2007GL032395, 2008.
Emde, C., Buras-Schnell, R., Kylling, A., Mayer, B., Gasteiger, J., Hamann, U., Kylling, J., Richter, B., Pause, C., Dowling, T., and Bugliaro, L.: The libRadtran software package for radiative transfer calculations (version 2.0.1), Geosci. Model Dev., 9, 1647–1672, https://doi.org/10.5194/gmd-9-1647-2016, 2016.
Fasano, G., Diémoz, H., Fountoulakis, I., Cassardo, C., Kudo, R., Siani, A. M., and Ferrero, L.: Vertical profile of the clear-sky aerosol direct radiative effect in an Alpine valley, by the synergy of ground-based measurements and radiative transfer simulations, B. Atmos. Sci. Technol., 2, 11, https://doi.org/10.1007/s42865-021-00041-w, 2021.
Fioletov, V. E., Kimlin, M. G., Krotkov, N., McArthur, L. J. B., Kerr, J. B., Wardle, D. I., Herman, J. R., Meltzer, R., Mathews, T. W., and Kaurola, J.: UV index climatology over the United States and Canada from ground-based and satellite estimates, J. Geophys. Res., 109, D22308, https://doi.org/10.1029/2004JD004820, 2004.
Fioletov, V., Kerr, J. B., and Fergusson, A.: The UV Index: Definition, Distribution and Factors Affecting It, Can. J. Public Health, 101, I5–I9, 2010.
Fountoulakis, I., Diémoz, H., Siani, A. M., di Sarra, A., Meloni, D., and Sferlazzo, D. M.: Variability and trends in surface solar spectral ultraviolet irradiance in Italy: on the influence of geopotential height and lower-stratospheric ozone, Atmos. Chem. Phys., 21, 18689–18705, https://doi.org/10.5194/acp-21-18689-2021, 2021.
Gröbner, J., Schreder, J., Kazadzis, S., Bais, A. F., Blumthaler, M., Gorts, P., Tax, R., Koskela, T., Seckmeyer, G., and Webb, A. R.: “A travelling reference spectroradiometer for routine quality assurance of spectral solar ultraviolet irradiance measurements”, Appl. Opt., 44, 5321–5331, 2005.
He, S. and Carmichael, G. R.: Sensitivity of photolysis rates and ozone production in the troposphere to aerosol properties, J. Geophys. Res., 104, 26307–26324, https://doi.org/10.1029/1999JD900789, 1999.
Ialongo, I., Buchard, V., Brogniez, C., Casale, G. R., and Siani, A. M.: Aerosol Single Scattering Albedo retrieval in the UV range: an application to OMI satellite validation, Atmos. Chem. Phys., 10, 331–340, https://doi.org/10.5194/acp-10-331-2010, 2010.
Iannarelli, A. M., Di Bernardino, A., Casadio, S., Bassani, C., Cacciani, M., Campanelli, M., Casasanta, G., Cadau, E., Diémoz, H., Mevi, G., Siani, A. M., Cardaci, M., Dehn, A., and Goryl, P.: The Boundary-layer Air Quality-analysis Using Network of INstruments (BAQUNIN) supersite for Atmospheric Research and Satellite Validation over Rome area, B. Am. Meteorol. Soc., E599–E618, https://doi.org/10.1175/BAMS-D-21-0099.1, 2021.
Kazadzis, S., Raptis, P., Kouremeti, N., Amiridis, V., Arola, A., Gerasopoulos, E., and Schuster, G. L.: Aerosol absorption retrieval at ultraviolet wavelengths in a complex environment, Atmos. Meas. Tech., 9, 5997–6011, https://doi.org/10.5194/amt-9-5997-2016, 2016.
Kerr, J. B. and McElroy, C. T.: Evidence for large upward trends of ultraviolet-B radiation linked to ozone depletion, Science, 262, 1032–1034, 1993.
Kirchstetter, T. W., Novakov, T., and Hobbs, P. V.: Evidence that the spectral dependence of light absorption by aerosols is affected by organic carbon, J. Geophys. Res., 109, D21208, https://doi.org/10.1029/2004JD004999, 2004.
Kudo, R., Diémoz, H., Estellés, V., Campanelli, M., Momoi, M., Marenco, F., Ryder, C. L., Ijima, O., Uchiyama, A., Nakashima, K., Yamazaki, A., Nagasawa, R., Ohkawara, N., and Ishida, H.: Optimal use of the Prede POM sky radiometer for aerosol, water vapor, and ozone retrievals, Atmos. Meas. Tech., 14, 3395–3426, https://doi.org/10.5194/amt-14-3395-2021, 2021.
Madronich, S.: The Atmosphere and UV-B Radiation at Ground Level, in: Environmental UV Photobiology, edited by: Young, A. R., Moan, J., Björn, L. O., and Nultsch, W., Springer, Boston, MA, https://doi.org/10.1007/978-1-4899-2406-3_1, 1993a.
Madronich, S.: UV radiation in the natural and perturbed atmosphere, in: Environmental Effects of Ultraviolet Radiation, edited by: Tevini, M., Lewis, Boca Raton, Florida, CRC Press, 17–69, 1993b.
Martins, J. V., Artaxo, P., Kaufman, Y. J., Castanho, A. D., and Remer, L. A.: Spectral absorption properties of aerosol particles from 350–2500 nm, Geophys. Res. Lett., 36, L13810, https://doi.org/10.1029/2009GL037435, 2009.
Massabò D., Caponi, L., Bernardoni, V., Bove, M. C., Brotto, P., Calzolai, G., Cassola, F., Chiari, M., Fedi, M. E, Fermo, P., Giannoni, M., Lucarelli, F., Nava, S., Piazzalunga, A., Valli, G., Vecchi, R., and Prati, P.: Multi-wavelength optical determination of black and brown carbon in atmospheric aerosols, Atmos. Environ., 108, 1–12, https://doi.org/10.1016/j.atmosenv.2015.02.058, 2015.
McKenzie, R. L., Matthews, W. A., and Johnston, P. V.: The relationship between erythemal UV and ozone, derived from spectral irradiance measurements, Geophys. Res. Lett., 18, 2269–2272, 1991.
Meloni, D., di Sarra, A., Pace, G., and Monteleone, F.: Aerosol optical properties at Lampedusa (Central Mediterranean). 2. Determination of single scattering albedo at two wavelengths for different aerosol types, Atmos. Chem. Phys., 6, 715–727, https://doi.org/10.5194/acp-6-715-2006, 2006.
Mok, J., Krotkov, N. A., Torres, O., Jethva, H., Li, Z., Kim, J., Koo, J.-H., Go, S., Irie, H., Labow, G., Eck, T. F., Holben, B. N., Herman, J., Loughman, R. P., Spinei, E., Lee, S. S., Khatri, P., and Campanelli, M.: Comparisons of spectral aerosol single scattering albedo in Seoul, South Korea, Atmos. Meas. Tech., 11, 2295–2311, https://doi.org/10.5194/amt-11-2295-2018, 2018.
Nakajima, T. and Tanaka, M.: Matrix formulation for the transfer of solar radiation in a plane-parallel scattering atmosphere, J. Quant. Spectrosc. Ra., 35, 13–21, 1986.
Nakajima, T., Campanelli, M., Che, H., Estellés, V., Irie, H., Kim, S.-W., Kim, J., Liu, D., Nishizawa, T., Pandithurai, G., Soni, V. K., Thana, B., Tugjsurn, N.-U., Aoki, K., Go, S., Hashimoto, M., Higurashi, A., Kazadzis, S., Khatri, P., Kouremeti, N., Kudo, R., Marenco, F., Momoi, M., Ningombam, S. S., Ryder, C. L., Uchiyama, A., and Yamazaki, A.: An overview of and issues with sky radiometer technology and SKYNET, Atmos. Meas. Tech., 13, 4195–4218, https://doi.org/10.5194/amt-13-4195-2020, 2020.
Panicker, A. S., Pandithurai, G., Takamura, T., and Pinker, R. T.: Aerosol effects in the UV-B spectral region over Pune, an urban site in India Geophys. Res. Lett., 36, L10802, https://doi.org/10.1029/2009GL037632, 2009.
Perrino, C., Canepari, S., Catrambone, M., Dalla Torre, S., Rantica, E., and Sargolini, T.: “Influence of natural events on the concentration and composition of atmospheric particulate matter”, Atmos. Environ., 43, 4766–4779, 2009.
Perrino, C., Catrambone, M., Dalla Torre, S., Rantica, E., Sargolini, T., and Canepari, S.: “Seasonal variations in the chemical composition of particulate matter: a case study in the Po Valley. Part I: macro-components and mass closure”, Environ. Sci. Pollut. Res., 21, 3999–4009, 2014.
Redondas, A., Carreño, V., León-Luis, S. F., Hernández-Cruz, B., López-Solano, J., Rodriguez-Franco, J. J., Vilaplana, J. M., Gröbner, J., Rimmer, J., Bais, A. F., Savastiouk, V., Moreta, J. R., Boulkelia, L., Jepsen, N., Wilson, K. M., Shirotov, V., and Karppinen, T.: EUBREWNET RBCC-E Huelva 2015 Ozone Brewer Intercomparison, Atmos. Chem. Phys., 18, 9441–9455, https://doi.org/10.5194/acp-18-9441-2018, 2018.
Reuder, J. and Schwander, H.: Aerosol effects on UV radiation in nonurban regions, First published: 01 February 1999, J. Geophys. Res., 104, 4065–4077, https://doi.org/10.1029/1998JD200072, 1999.
Schmalwieser, A. W., Gröbner, J., Blumthaler, M., Klotz, B., De Backer, H., Bolsée, D., Werner, R., Tomsic, D., Metelka, L., Eriksen, P., Jepsen, N., Aun, M., Heikkilä, A., Duprat, T., Sandmann, H., Weiss, T., Bais, A., Toth, Z., Siani, A. M., Vaccaro, L., Diémoz, H., Grifoni, D., Zipoli, G., Lorenzetto, G., Petkov, B. H., Di Sarra, A. G., Massen, F., Yousif, C., Aculinin, A. A., Den Outer, P., Svendby, T., Dahlback, A., Johnsen, B., Biszczuk-Jakubowska, J., Krzyscin, J., Henriques, D., Chubarova, N., Kolarž, P., Mijatovic, Z., Groselj, D., Pribullova, A., Gonzales, J. R. M., Bilbao, J., Guerrero, J. M. V., Serrano, A., Andersson, S., Vuilleumier, L., Webb, A., and O'Hagan, J.: UV Index monitoring in Europe, Photoch. Photobio. Sci., 16, 1349–1370, 2017.
Siani, A. M., Modesti, S., Casale, G. R., Diemoz, H., and Colosimo, A.: Biologically effective surface UV climatology at Rome and Aosta, Italy, AIP Conference Proceedings, 1531, 903–906, https://doi.org/10.1063/1.4804917, 2013.
Siani, A. M., Frasca, F., Scarlatti, F., Religi, A., Diémoz, H., Casale, G. R., Pedone, M., and Savastiouk, V.: Examination on total ozone column retrievals by Brewer spectrophotometry using different processing software, Atmos. Meas. Tech., 11, 5105–5123, https://doi.org/10.5194/amt-11-5105-2018, 2018.
Slaper, H., Reinen, A. J. M., Blumthaler, M., Huber, M., and Kuik, F.: Comparing ground-level spectrally resolved solar UV measurements using various instruments: a technique resolving effects of wavelength shift and slit width, Geophys. Res. Lett., 22, 2721–2724, 1995.
Vanicek, K.: Differences between ground Dobson, Brewer and satellite TOMS-8, GOME-WFDOAS total ozone observations at Hradec Kralove, Czech, Atmos. Chem. Phys., 6, 5163–5171, https://doi.org/10.5194/acp-6-5163-2006, 2006.
Venables, W. N. and Ripley, B. D.: Modern applied statistics with S-PLUS, Springer Science & Business Media, New York, 2013.