the Creative Commons Attribution 4.0 License.
the Creative Commons Attribution 4.0 License.
 | 09 Mar 2022
Assessment of the quality of ACE-FTS stratospheric ozone data
Patrick E. Sheese
Chris D. Boone
Adam E. Bourassa
Doug A. Degenstein
Lucien Froidevaux
C. Thomas McElroy
Donal Murtagh
James M. Russell III
Jiansheng Zou
For the past 17 years, the Atmospheric Chemistry Experiment Fourier Transform Spectrometer (ACE-FTS) instrument on the Canadian SCISAT satellite has been measuring profiles of atmospheric ozone. The latest operational versions of the level 2 ozone data are versions 3.6 and 4.1. This study characterizes how both products compare with correlative data from other limb-sounding satellite instruments, namely MAESTRO, MLS, OSIRIS, SABER, and SMR. In general, v3.6, with respect to the other instruments, exhibits a smaller bias (which is on the order of ∼ 3 %) in the middle stratosphere than v4.1 (∼ 2 %–9 %); however, the bias exhibited in the v4.1 data tends to be more stable, i.e. not changing significantly over time in any altitude region. In the lower stratosphere, v3.6 has a positive bias of about 3 %–5 % that is stable to within ±1 % per decade, and v4.1 has a bias on the order of −1 % to +5 % and is also stable to within ±1 % per decade. In the middle stratosphere, v3.6 has a positive bias of ∼ 3 % with a significant negative drift on the order of 0.5 %–2.5 % per decade, and v4.1 has a positive bias of 2 %–9 % that is stable to within ±0.5 % per decade. In the upper stratosphere, v3.6 has a positive bias that increases with altitude up to ∼ 16 % and a significant negative drift on the order of 2 %–3 % per decade, and v4.1 has a positive bias that increases with altitude up to ∼ 15 % and is stable to within ±1 % per decade. Estimates indicate that both versions 3.6 and 4.1 have precision values on the order of 0.1–0.2 ppmv below 20 km and above 45 km (∼ 5 %–10 %, depending on altitude). Between 20 and 45 km, the estimated v3.6 precision of ∼ 4 %–6 % is better than the estimated v4.1 precision of ∼ 6 %–10 %.
- Article
(6118 KB) - Full-text XML
- BibTeX
- EndNote


It has been well established that prior to the implementation of the Montreal Protocol, global stratospheric ozone (O3) concentrations were declining on the order of approximately 5 % per decade (WMO, 2018). Since 1997, after the implementation of the Montreal Protocol, stratospheric O3 concentrations are no longer declining, and now the question remains, are O3 concentrations recovering? Multiple recent studies (e.g. Harris et al., 2015; Arosio et al., 2019; Szelag et al., 2020) have shown that merged satellite O3 data sets do exhibit positive stratospheric trends over the past decade or so; however, the positive trends may or may not be considered significant depending on how the uncertainties within the individual data sets are treated (SPARC/IO3C/GAW, 2019). When calculating atmospheric trends, one type of uncertainty that needs to be properly characterized is the stability of systematic errors (drift) in the data. This is especially important when merging O3 data sets in order to produce a long-term data record on the order of decades. The ACE-FTS (Atmospheric Chemistry Experiment Fourier Transform Spectrometer) satellite instrument's O3 data set is frequently used to help understand the state of stratospheric ozone. It is important to note that this study in no way tries to answer the question of whether O3 concentrations are recovering or not – it assesses the quality of ACE-FTS O3 data in the context of O3 recovery.
As of yet, there have been no published studies focusing on characterizing ACE-FTS O3 drift; however, Hubert et al. (2016) compared 14 different O3 data sets from satellite limb sounders to ground- and balloon-based measurements in order to determine the long-term stability of the satellite instruments. They did not find any significant drift in the version 3.0 ACE-FTS data, although the analysis only included ACE-FTS data from 2004–2010. Rahpoe et al. (2015) calculated relative drifts between six different O3 data sets from satellite limb sounders. Similarly, the ACE-FTS version 3.0 data product used only spanned 2004–2010, and no significant drift was identified. Although, as this study will show, it is possible that significant drifts would have been identified had longer time series been analyzed.
In this study, ACE-FTS O3 profiles have been compared to correlative data sets from satellite-based limb sounders that overlap in time with essentially the entire ACE-FTS mission, i.e. MAESTRO (Measurement of Aerosol Extinction in the Stratosphere and Troposphere Retrieved by Occultation), Aura MLS (Microwave Limb Sounder), OSIRIS (Optical Spectrograph and Infrared Imaging System), SABER (Sounding of the Atmosphere using Broadband Emission Radiometry), and SMR (Sub-Millimetre Radiometer). These five instruments were all in orbit and measuring ozone in 2004, the year when ACE-FTS began making measurements, and are still in operation.
A description of the instrumentation can be found in Sect. 2, and the methodology is described in Sect. 3. The global and regional results for ACE-FTS O3 comparisons are discussed in Sect. 4, and all the results are summarized in Sect. 5.
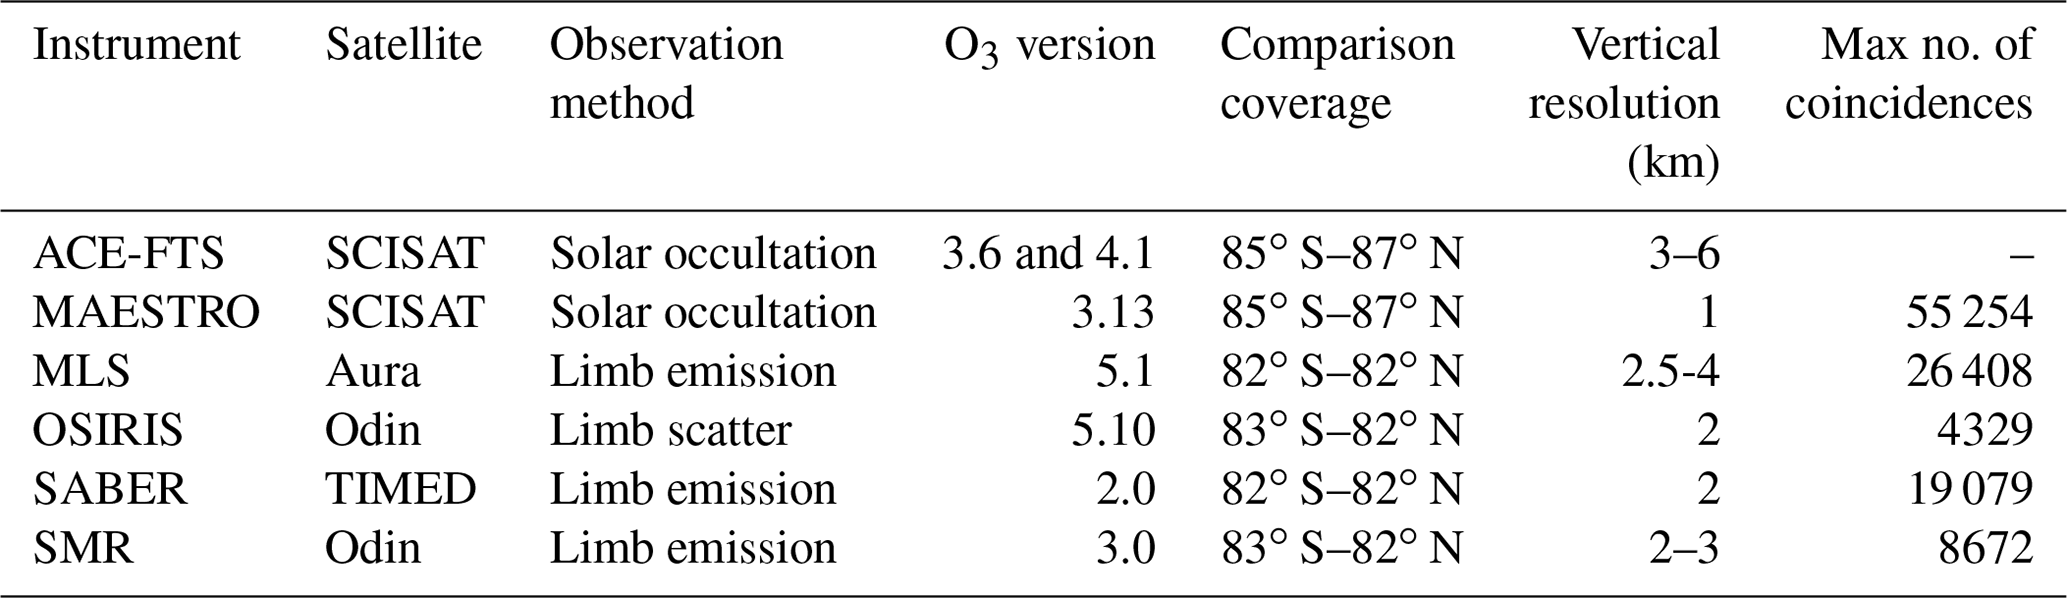
Table 1 gives an overview of some of the key details related to the satellite instruments used in this study.
Table 1Selected details of the instruments and the O3 data sets used in the comparisons.
2.1 Instruments on SCISAT
The Canadian SCISAT satellite was launched into a non-sun synchronous, high-inclination orbit in 2003 at an altitude of ∼ 650 km. On board are two instruments, ACE-FTS and MAESTRO, both of which use solar occultation viewing geometry to measure profiles of atmospheric state parameters. Both instruments began making regular measurements in February 2004 and are still in operation as of 2021.
2.1.1 ACE-FTS
The ACE-FTS instrument (Bernath et al., 2005) is a high-spectral-resolution (0.02 cm−1) spectrometer viewing the Earth's limb in the infrared between 750 and 4400 cm−1, measuring pressure and temperature profiles and volume mixing ratio (VMR) profiles of over 40 atmospheric trace gases and more than 20 isotopologue species. ACE-FTS profiles the limb between 5 and 150 km with a vertical sampling of ∼ 2 to 6 km, depending on the orbital geometry and tangent height, and the vertical extent of the instrument field-of-view at the tangent altitude is on the order of 3–4 km. Two different versions of the level 2 ACE-FTS O3 data are used in this study, version 3.6 (v3.6) and version 4.1 (v4.1).
The retrieval algorithm for trace species concentrations is described by Boone et al. (2005, 2013, 2020), and it uses a non-linear, least-squares, global-fitting technique that fits observed spectra to forward modelled spectra in species-dependent microwindows. The modelled spectra are calculated using spectral line parameters from the HITRAN2004 database (Rothman et al., 2005) with various updates (Boone et al., 2013) for version 3.6, and the v4.1 retrieval uses HITRAN2016 (Gordon et al., 2017). In March 2021, the processing environment for the v4 retrievals was changed, and the current operational version is currently v4.1/4.2, with no significant differences in the retrieval results between v4.1 and 4.2.
Both versions 3.6 and 4.1 of the ACE-FTS O3 retrieval use 40 microwindows between 829 and 2673 cm−1 and account for CFC-12, HCFC-22, CFC-11, N2O, CH4, HCOOH, and various isotopologues as interfering species. The retrievals have a lower altitude limit of 5 km and an upper altitude limit of 95 km. Horizontal homogeneity is assumed in the retrievals, and diurnal variation along the line of sight is not taken into account. ACE-FTS v2.2 O3 was validated by Dupuy et al. (2009), and Sheese et al. (2017) compared ACE-FTS v3.5 O3 to correlative data from MIPAS and MLS. The ACE-FTS v2.2 O3 profiles are known to have a positive bias on the order of 15 %–20 % in the upper stratosphere to lower mesosphere, near 50–60 km, and on average typically agree with correlative data sets to within ±5 % in the middle lower to middle stratosphere (∼ 20–40 km) with a slight positive bias on the order of a few percent. The average bias found between ACE-FTS v3.5 and Aura MLS and MIPAS is within 2 % from 10–45 km and up to 19 % between 46 and 60 km.
2.1.2 MAESTRO
The MAESTRO instrument (McElroy et al., 2007) consists of two spectrophotometers designed to cover the spectral range 210–1015 nm, with 1.5–2 nm spectral resolution. The solar occultation measurements are used to retrieve profiles of aerosol extinction and concentrations of O3, NO2, and H2O in the upper troposphere and stratosphere (∼ 5–52 km) with a vertical resolution on the order of 1 km. The O3 retrieval algorithm (McElroy et al., 2007) fits apparent optical depth spectra to modelled spectra in order to derive slant column densities. The forward model assumes temperature-independent O3 and NO2 absorption cross sections from Burrows et al. (1998, 1999). The slant columns are then used in a Chahine inversion technique (Chahine, 1968) to retrieve O3 profiles.
This study uses v3.13 of the MAESTRO O3 data, which have not yet been independently validated. Kar et al. (2007) compared version 1.2 MAESTRO O3 data to correlative data from ozonesondes and satellite instruments, including ACE-FTS. They found that between 16 and 50 km MAESTRO typically agreed with ozonesonde data to within ∼ 5 %–10 % and that MAESTRO and ACE-FTS tended to agree within ∼ 5 %–15 % in the stratosphere up to 50 km. They also found that while MAESTRO sunset profiles typically agreed with satellite measurements to within 5 %–10 % in the 16–40 km region, MAESTRO sunrise profiles exhibited a positive bias of up to ∼ 20 %–30 % in the 40–55 km region and a negative bias of ∼ 5 %–15 % near 20–30 km. Similar results were found by Dupuy et al. (2009) when comparing v1.2 MAESTRO O3 data to correlative data from satellite, balloon, airborne, and ground-based instruments. Hubert et al. (2016) found no significant drift between MAESTRO v1.2 and balloon-borne measurements for the period 2004–2010.
2.2 MLS on Aura
The Aura satellite was launched in 2004 into a sun-synchronous orbit (ascending node of 13:45 LT) near 700 km. On board is the MLS instrument (Waters et al., 2006), which observes thermal emission in the Earth's limb in a spectral range of 118 GHz to 2.5 THz in order to retrieve profiles of temperature, geopotential height, and concentrations of over 15 atmospheric trace species on a vertical pressure grid.
The MLS v5 O3 profiles, which are used in this study, are retrieved from the 240 GHz radiometer measurements and are scientifically useful between pressure levels of 261 and 0.001 hPa (∼ 10 and 90 km), with a vertical resolution of 2.5–4 km in the stratosphere (Livesey et al., 2022). The MLS retrieval algorithm, as described by Livesey et al. (2006, 2022), uses a Newtonian optimal estimation technique (Rodgers, 2008), with a forward model that does not assume horizontal homogeneity, given the Aura MLS line-of-sight viewing conditions (Livesey and Read, 2000). The absorption cross sections used in the forward model are from the JPL Spectral Line Catalogue (Pickett et al., 1998) with updates.
The v2.2 O3 product has been validated by Jiang et al. (2007), Froidevaux et al. (2008), and Livesey et al. (2008); in the stratosphere, the results of those validation studies are generally applicable to the v5.1 stratospheric O3 data (Livesey et al., 2022). When comparing to ground-based O3 profiles, Hubert et al. (2016) found the v3.3 MLS O3 data to be stable within 2 % per decade in the upper stratosphere and within 1.5 % per decade in the middle stratosphere.
2.3 Instruments on Odin
The Odin satellite (Murtagh et al., 2002) was launched in 2001 into a sun-synchronous orbit (ascending node of 06:00 LT) at an altitude of ∼ 600 km. There are two limb sounding instruments aboard the satellite that are currently in operation, OSIRIS (Llewellyn et al., 2004) and SMR (Frisk et al., 2003).
2.3.1 OSIRIS
The OSIRIS instrument uses an optical spectrograph operating in the spectral range of 280–810 nm to observe Rayleigh and Mie scattered sunlight in the Earth's limb and retrieves profiles of O3, NO2, and BrO concentrations and aerosol extinction. Scans are made between altitudes of approximately 7 and 110 km with a vertical field-of-view of approximately 1 km. As detailed by Bourassa et al. (2012), O3 concentrations are retrieved using the Multiplicative Algebraic Reconstruction Technique (MART) (Roth et al., 2007; Degenstein et al., 2009) between approximately 10 and 60 km, with a vertical resolution on the order of 2 km, and pressure and temperature profiles from the European Centre for Medium-Range Weather Forecasts (ECMWF) ERA-Interim reanalysis are used (Dee et al., 2011). Within the O3 retrieval, UV and visible absorption is taken into account, and aerosols and NO2 are both considered interfering species and are pre-retrieved.
The version 5.10 OSIRIS data are used in this study. Hubert et al. (2016) found there to be a significant positive drift in the v5.07 OSIRIS O3 data above 20 km with respect to ozonesonde and lidar data. Between 22 and 35 km, the OSIRIS drift is on the order of 1 %–3 % per decade, and above 37 km the positive drift increases to 8 % per decade near 42 km. However, Bourassa et al. (2018) determined that these drifts were due to a systematic error in the pointing knowledge and showed that the drifts were significantly reduced in v5.10. Adams et al. (2014) determined that throughout the stratosphere the v5.07 OSIRIS drift relative to the GOMOS (Global Ozone Monitoring by Occultation of Stars) was less than 3 % per decade, and v5.07 was shown to be in excellent agreement (within < 5 %) with coincident SAGE II profiles throughout the stratosphere by Adams et al. (2013).
2.3.2 SMR
The SMR instrument uses four tuneable receivers within 486–581 GHz and a millimetre-wave receiver at 119 GHz to observe thermal emissions in the Earth's limb. The SMR observations are used to retrieve profiles of temperature and O3, H2O, N2O, HNO3, and ClO concentrations. Three different O3 products are retrieved, one from emissions measured at the 544.6 GHz line, one from the 501.8 GHz, and one from the 488 GHz line; however, only the 544 GHz O3 retrievals are used in this study.
The O3 retrieval algorithm (Urban et al., 2005) makes use of measurements in a 1 GHz band (centred at 544.6 GHz) and uses a Newtonian Levenberg–Marquardt optimal estimation technique (Rodgers, 2008). The forward model used in the retrievals is the open-source ARTS (Atmospheric Radiative Transfer Simulator) forward model (Buehler et al., 2005). Version 3.0 O3, used in this study, is retrieved at altitudes between 11 and 109 km, with a vertical resolution of ∼ 2–3 km.
Jones et al. (2007) compared v2.1 501 GHz O3 to correlative data from satellite and balloon measurements, and Sagi and Murtagh (2016) compared the v2.1 501 and 544 GHz O3 data sets, showing that the two data sets are within 10 % of each other at altitudes between 15 and 40 km. Sagi et al. (2017) used v2.1 544 GHz O3 data in their study on O3 depletion in the Northern Hemisphere.
2.4 SABER on TIMED
The TIMED (Thermosphere, Ionosphere, Mesosphere Energetics and Dynamics) satellite was launched in 2001 into a non-sun-synchronous orbit, sweeping through 24 h of local time every 36 d. On board is the SABER instrument (Russell et al., 1999), which uses observations of infrared emissions to retrieve O3 concentrations throughout the stratosphere to lower thermosphere in a 9.6 µm channel and in the mesosphere to lower thermosphere in a 1.27 µm channel, both with a vertical resolution of ∼ 2 km. This study makes use of the v2.0 O3 9.6 µm data, the retrieval of which is described by Rong et al. (2009) and uses an iterative onion peel retrieval method, taking into account non-LTE (local thermodynamic equilibrium) effects.
The version 1.07 O3 data products are discussed and validated by Rong et al. (2009), where they found the 9.6 µm O3 data to have a positive bias in the stratosphere on the order of 5 %–15 % (above what can be explained by systematic uncertainties). Corrections for this bias have been formulated and are under active study by the SABER team. An updated data set is expected to be produced in the next year (James Russell, personal communication, 2021, Hampton University, Hampton, VA). To the authors' knowledge, no studies have been published on the differences between the v1.07 and v2.0 9.6 µm O3 data products; however, Fytterer et al. (2015) discuss how v1.07 can be used to supplement v2.0 where there are data gaps without the need for systematic corrections. The SABER O3 data were not considered in the drift analysis study of Hubert et al. (2016).
In this and the following sections, the term INST will be used in general to refer to any of the instruments (other than ACE-FTS). The coincidence criteria used in all of the comparisons were such that ACE-FTS and INST profiles must have been measured within 6 h and 300 km of each other. These coincidence criteria were chosen in order to ensure that coincident profiles were as close to common volume as possible while still having enough profiles to ensure results are statistically significant, and, as discussed by Sheese et al. (2021), these criteria keep the estimated O3 geophysical variability (1σ) between ACE and Odin measurements to less than 5 %. The geophysical variability between ACE-FTS and MLS and between ACE-FTS and SABER is assumed to be similar to the geophysical variability between ACE and Odin.
Prior to analysis, all MAESTRO, OSIRIS, SABER, and SMR profiles, which do not have simultaneously retrieved pressure values, have been linearly interpolated onto the ACE-FTS 1 km grid. The MLS profiles have been interpolated to corresponding coincident ACE-FTS pressure values (on a 1 km grid) in order to avoid any uncertainties inherent in the retrieved MLS geopotential height values. None of the profiles were vertically smoothed, as the vertical resolutions of all the instruments are relatively similar and smoothing the data has little to no effect on comparison results (e.g. Sheese et al., 2016). In cases where an ACE-FTS profile was coincident with multiple profiles from an INST data set, only the profile measured closest in latitude to the ACE-FTS occultation was used.
For direct comparisons between ACE-FTS and INST, the relative mean differences are calculated with respect to ACE-FTS data as
where Xi denotes the ACE-FTS values at a given height and Yi denotes the corresponding INST values. The dual-instrument mean is used in the denominator as ACE-FTS and most other INST retrievals allow for negative concentrations. When the average of two compared values is near zero (due to allowing negative values), this can cause unrealistically large percent differences.
A similar approach to Bourassa et al. (2012) was taken to determine estimates of the ACE-FTS precision. Following the methodology in their Sect. 3.2, the ACE-FTS relative precision, pA, is given by
where σA is the standard deviation of the ACE-FTS measurements, σI is the standard deviation of the INST measurements, and σA−I is the standard deviation of the differences. In order to avoid imaginary values in the overall mean precision profiles, mean profiles of the absolute precision-squared values were calculated, of which the square roots were then calculated.
When determining the multi-instrument averages for the ACE-FTS comparison results, the INST values (relative to ACE-FTS) are weighted using the inverse square of the standard deviation of the differences,
where is the INST weight at height z, and σ(z) is the standard deviation of the differences between INST and ACE-FTS. This, rather than a simple mean, is done to account for the quality of the INST data sets used in the comparisons and assumes that all data sets, in comparison with ACE-FTS, exhibit similar geophysical variability.
Similar to the analyses by Hubert et al. (2016), the drift and its corresponding error at each altitude are determined by fitting the 30 d mean relative difference time series to a linear model using iterative reweighting least-squares fitting with a bisquare weighting function (Street et al., 1988). Using 30 d mean values as opposed to daily means eliminates the need to deseasonalize the data prior to analysis within specific latitude bands. A Student's t test is then performed to determine the uncertainty of the linear drift for a confidence level of 99 %. When determining the multi-instrument average of the ACE-FTS drift, the drift values for ACE-FTS – INST are weighted using the inverse square of the uncertainty of the drift,
where is the INST weight at height z, and δ(z)INST is the uncertainty of the calculated linear drift between INST and ACE-FTS. The drift is considered to be non-zero when the weighted-average error bounds are less than 100 % of the drift value.
Prior to analysis, the ACE-FTS data were screened using the ACE-FTS quality flags as described by Sheese et al. (2015). For all other data sets, all recommended quality, status, and convergence flags were taken into account when such flags were available. Quality flags were generated for the MAESTRO data using the same algorithm as the ACE-FTS quality flags and were used to screen out unphysical outliers. For MLS data, no profile that was flagged as having cloud contamination at any pressure level was used in the analysis. For SABER data, as recommended by Fytterer et al. (2015), no data with values greater than 20 ppmv were used. Only SMR data where the corresponding measurement response (sum of the rows of the averaging kernels) values were greater than 0.8 were used.
4.1 Global comparisons
Figure 1 shows the results of comparing v3.6 and v4.1 ACE-FTS O3 profiles to coincident MAESTRO, MLS, OSIRIS, SABER, and SMR using all available data from 2004 to 2020 with coincidence criteria of being within 6 h and 300 km (excluding MAESTRO PM data below 23 km, as will be discussed in Sect. 4.2). The thick black lines are the multi-instrument weighted averages and are shown without the individual INST comparisons in Fig. 2. As can be seen in Fig. 1, both versions 3.6 and 4.1 yield similar average standard deviations of differences and correlation coefficient profiles. At all altitudes examined, the correlation coefficients are on the order of 0.8–0.9, and the standard deviations are on the order of 15 % (∼ 0.3 ppmv) in the upper stratosphere, 10 % (∼ 0.5 ppmv) in the middle stratosphere, and 20 % (0.1 ppmv) in the lower stratosphere. It should be noted that the coincidence criteria were chosen so that the estimated 1σ natural variability (variability due to sampling differences) is less than or on the order of ∼ 5 % (Sheese et al., 2021). For comparisons between atmospheric measurements, it is desirable to have coincidence criteria that allow for the natural variability to be less than the combined accuracies, and the value of 5 % is the minimum accuracy recommended by the Global Climate Observing System (GGOS) for stratospheric O3 (GCOS, 2011). Figure 2 highlights the difference in the ACE-FTS bias between versions 3.6 and 4.1, showing that the bias in the upper and lower stratosphere improved in 4.1 but worsened in the middle stratosphere. In the 15–20 km region, the bias decreased from ∼ 3 %–5 % (∼ 0.05 ppmv) to about −1 % to 5 % (−0.02 to 0.05 ppmv) and is in part due to updates in spectroscopic parameters from HITRAN2004 to HITRAN2016. Above 45 km the bias decreased slightly from 2 %–13 % to 2 %–11 % due to an improvement in the ACE-FTS altitude registration, which is now generated from measurements of the N2 continuum (Boone et al., 2020). In the 20–45 km region, where ozone concentrations peak, the bias was on the order of −1 % to 3 % (maximum of 0.2 ppmv near 33 km) in v3.6 and increased to ∼ 2 %–9 % (maximum of just over 0.5 ppmv near 30 km). Although the overall bias with respect to other limb sounders worsened, the increase is in part due to the improved instrument line shape modelling, which now allows for asymmetry and improved wavenumber variation (Boone et al., 2020).

Figure 1Comparisons between ACE-FTS O3 and MAESTRO (blue), MLS (red), OSIRIS (yellow), SABER (purple), and SMR (green) with coincidence criteria of within 6 h and 300 km for all coincident profiles within 2004–2020. ACE-FTS v3.6 (top) and v4.1 (bottom). From left to right the plots show the mean of the differences between ACE-FTS and INST in ppmv, the standard deviation of the differences between ACE-FTS and INST in ppmv, the mean of the relative differences between ACE-FTS and INST in percent, the standard deviation of the relative differences between ACE-FTS and INST in percent, and the correlation coefficients. The black line in each plot provides the weighted average (see text).
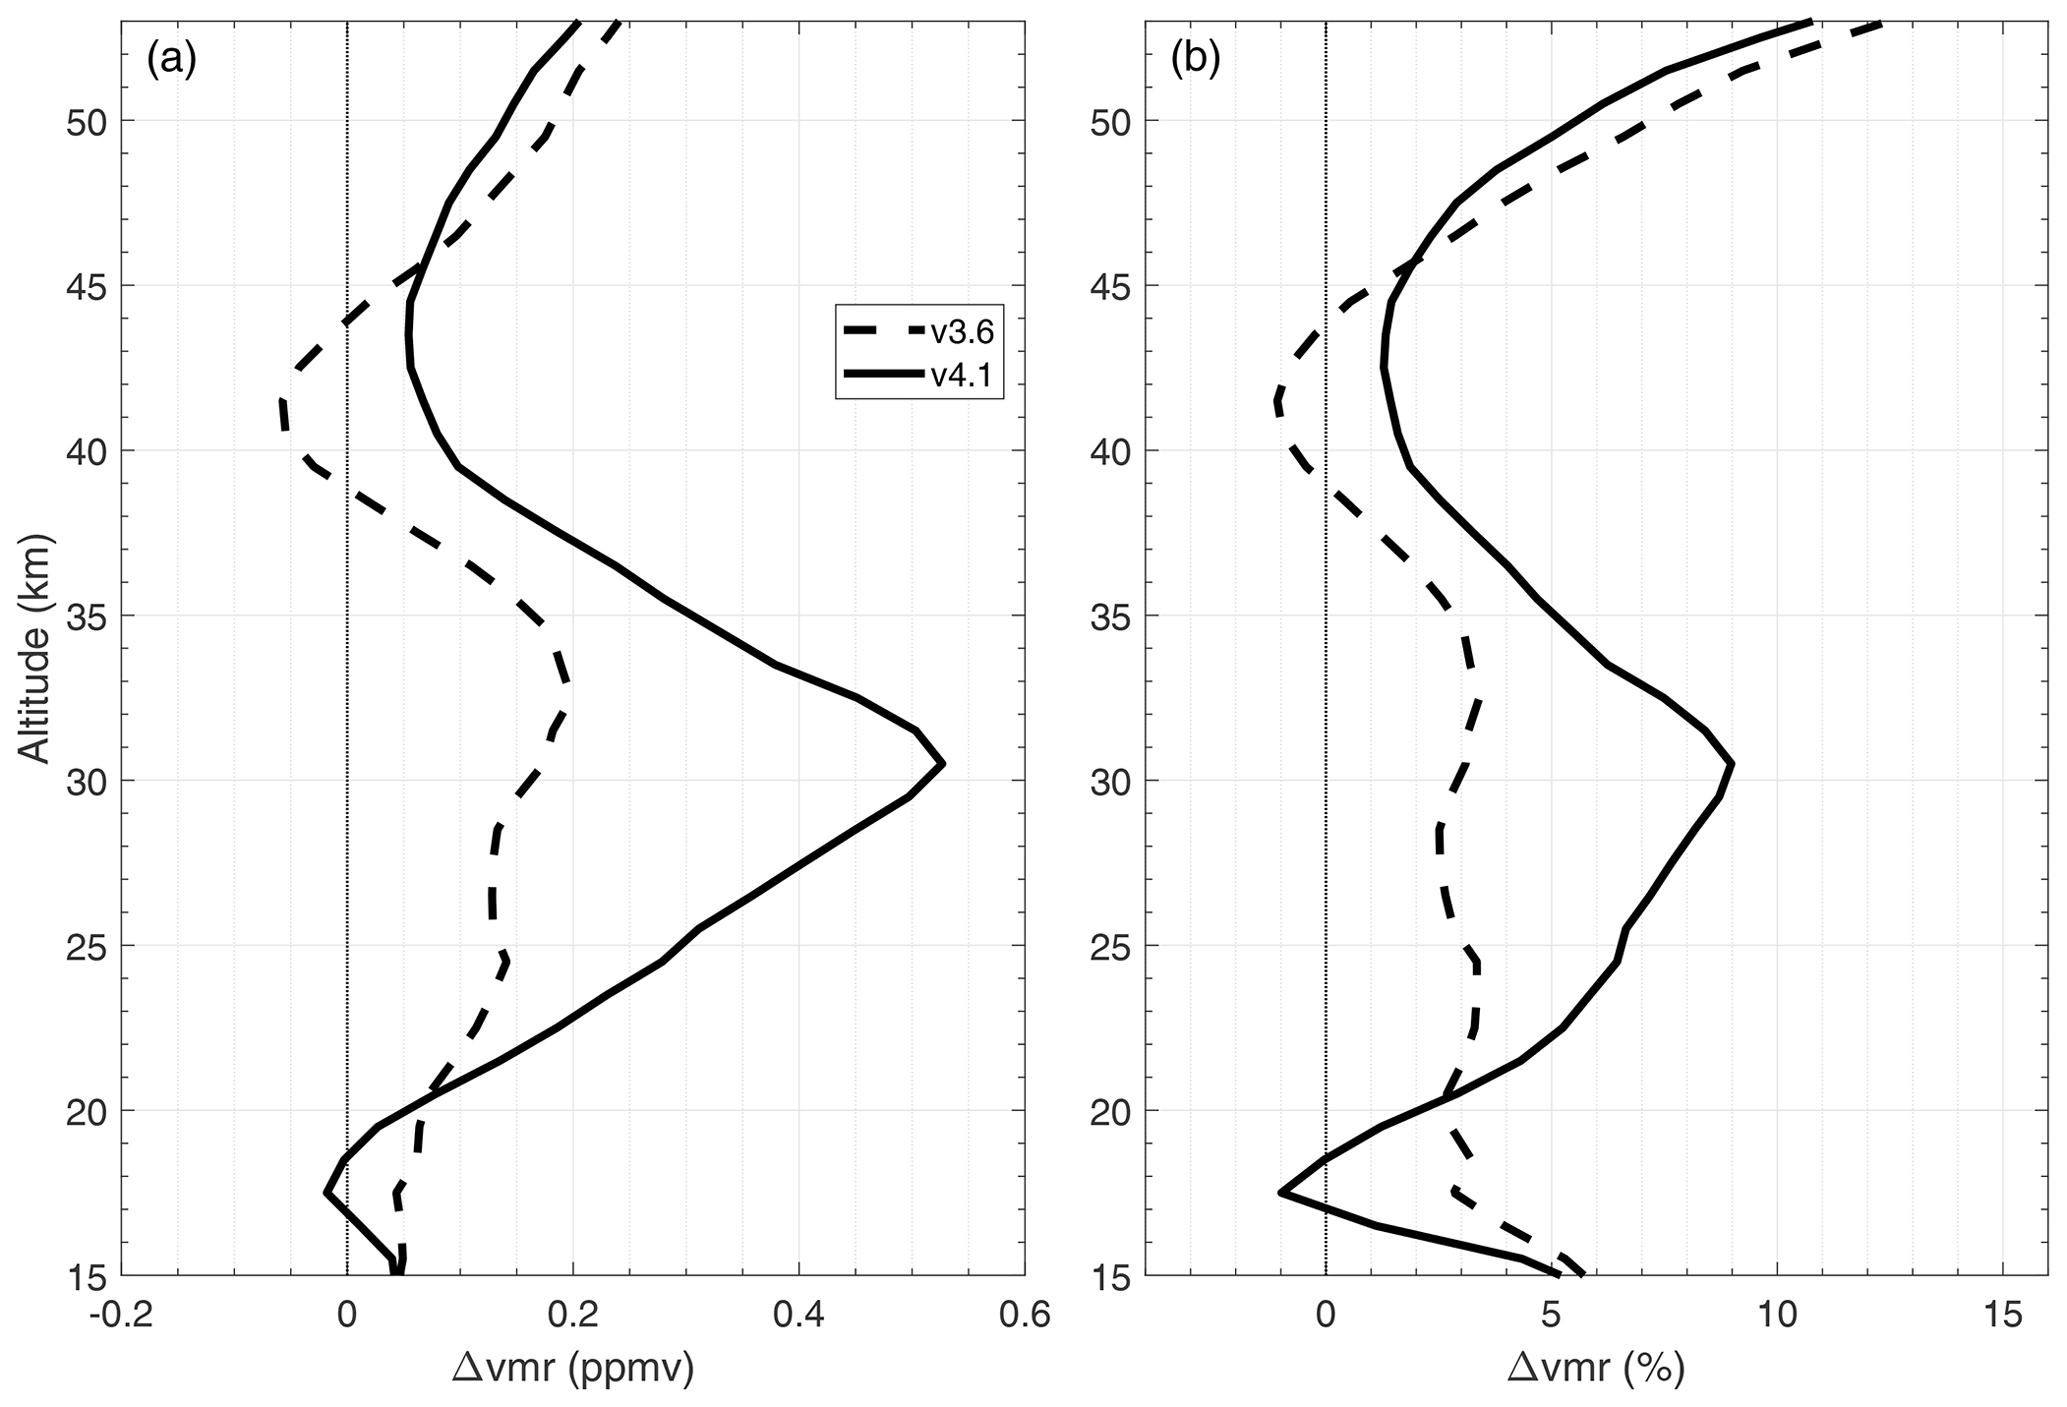
Figure 2Weighted averages of the mean differences (a) and mean percent differences (b) for comparisons between ACE-FTS and all instruments. Dashed lines represent ACE-FTS v3.6 and solid lines represent v4.1.
The ACE-FTS relative precision profiles (relative to INST) and weighted-mean precision estimates are shown in Fig. 3. For v3.6, Fig. 3a shows that for each comparison the ACE-FTS relative precision is ∼ 0.1–0.2 ppmv above 40 km, ∼ 0.1–0.5 ppmv between 20–40 km, and ∼ 0.1–0.4 ppmv below 20 km. For v4.1 (Fig. 3b) the ACE-FTS relative precision profiles have a more consistent variation with altitude between INST comparisons, with values of ∼ 0.1–0.3 ppmv above 45 km, 0–0.4 ppmv below 25 km, and peak (worst) values near 30 km on the order of 0.7–0.8 ppmv. The weighted-mean relative precision values for both v3.6 and 4.1 are on the order of 0.1–0.2 ppmv (∼ 6 %–10 %) below 20 km and ∼ 0.15 ppmv (∼ 5 %–8 %) above 45 km. In the intermediate altitudes, the v3.6 precision is typically within 4 %–6 %, whereas it is slightly worse for v4.1, typically within 6 %–10 %.
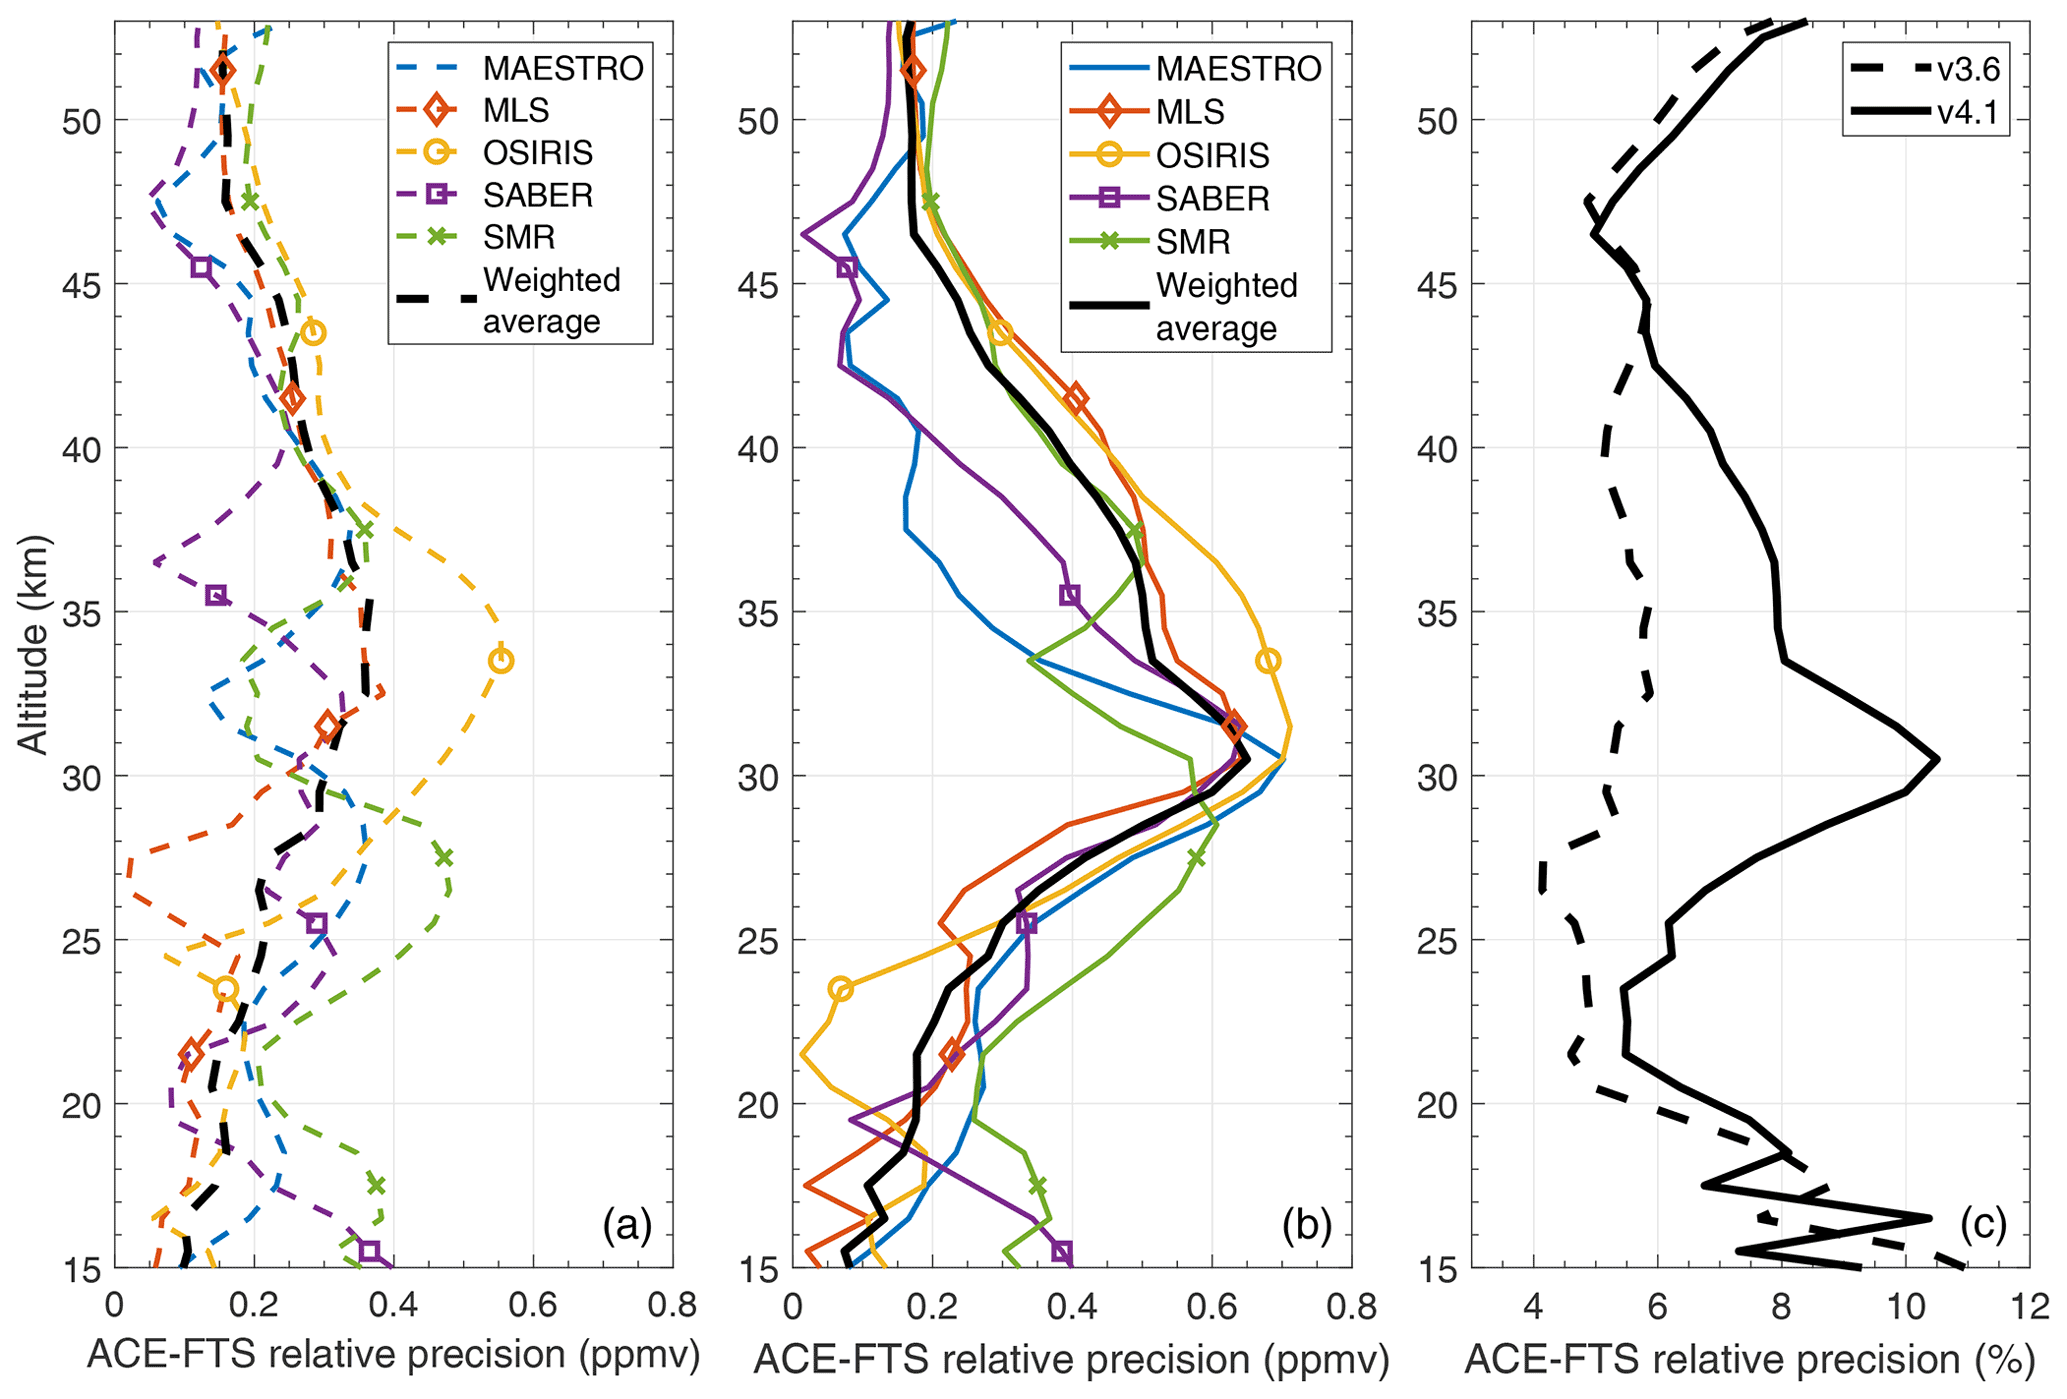
Figure 3ACE-FTS relative precision estimates for (a) v3.6 relative to INST in ppmv, (b) v4.1 relative to INST in ppmv, and (c) weighted mean profiles in percent.
The source of the change in precision can in part be explained by the change in the tangent height retrieval algorithm. The update of CO2 spectroscopic parameters between versions 3 and 4, along with fixing the pressure near 18 km to the results of the N2 continuum analysis (Boone et al., 2020), leads to an increase in O3 number density variability of ∼ 1 % throughout the stratosphere. Further contributions to the reduction of precision in v4.1 are currently being investigated.
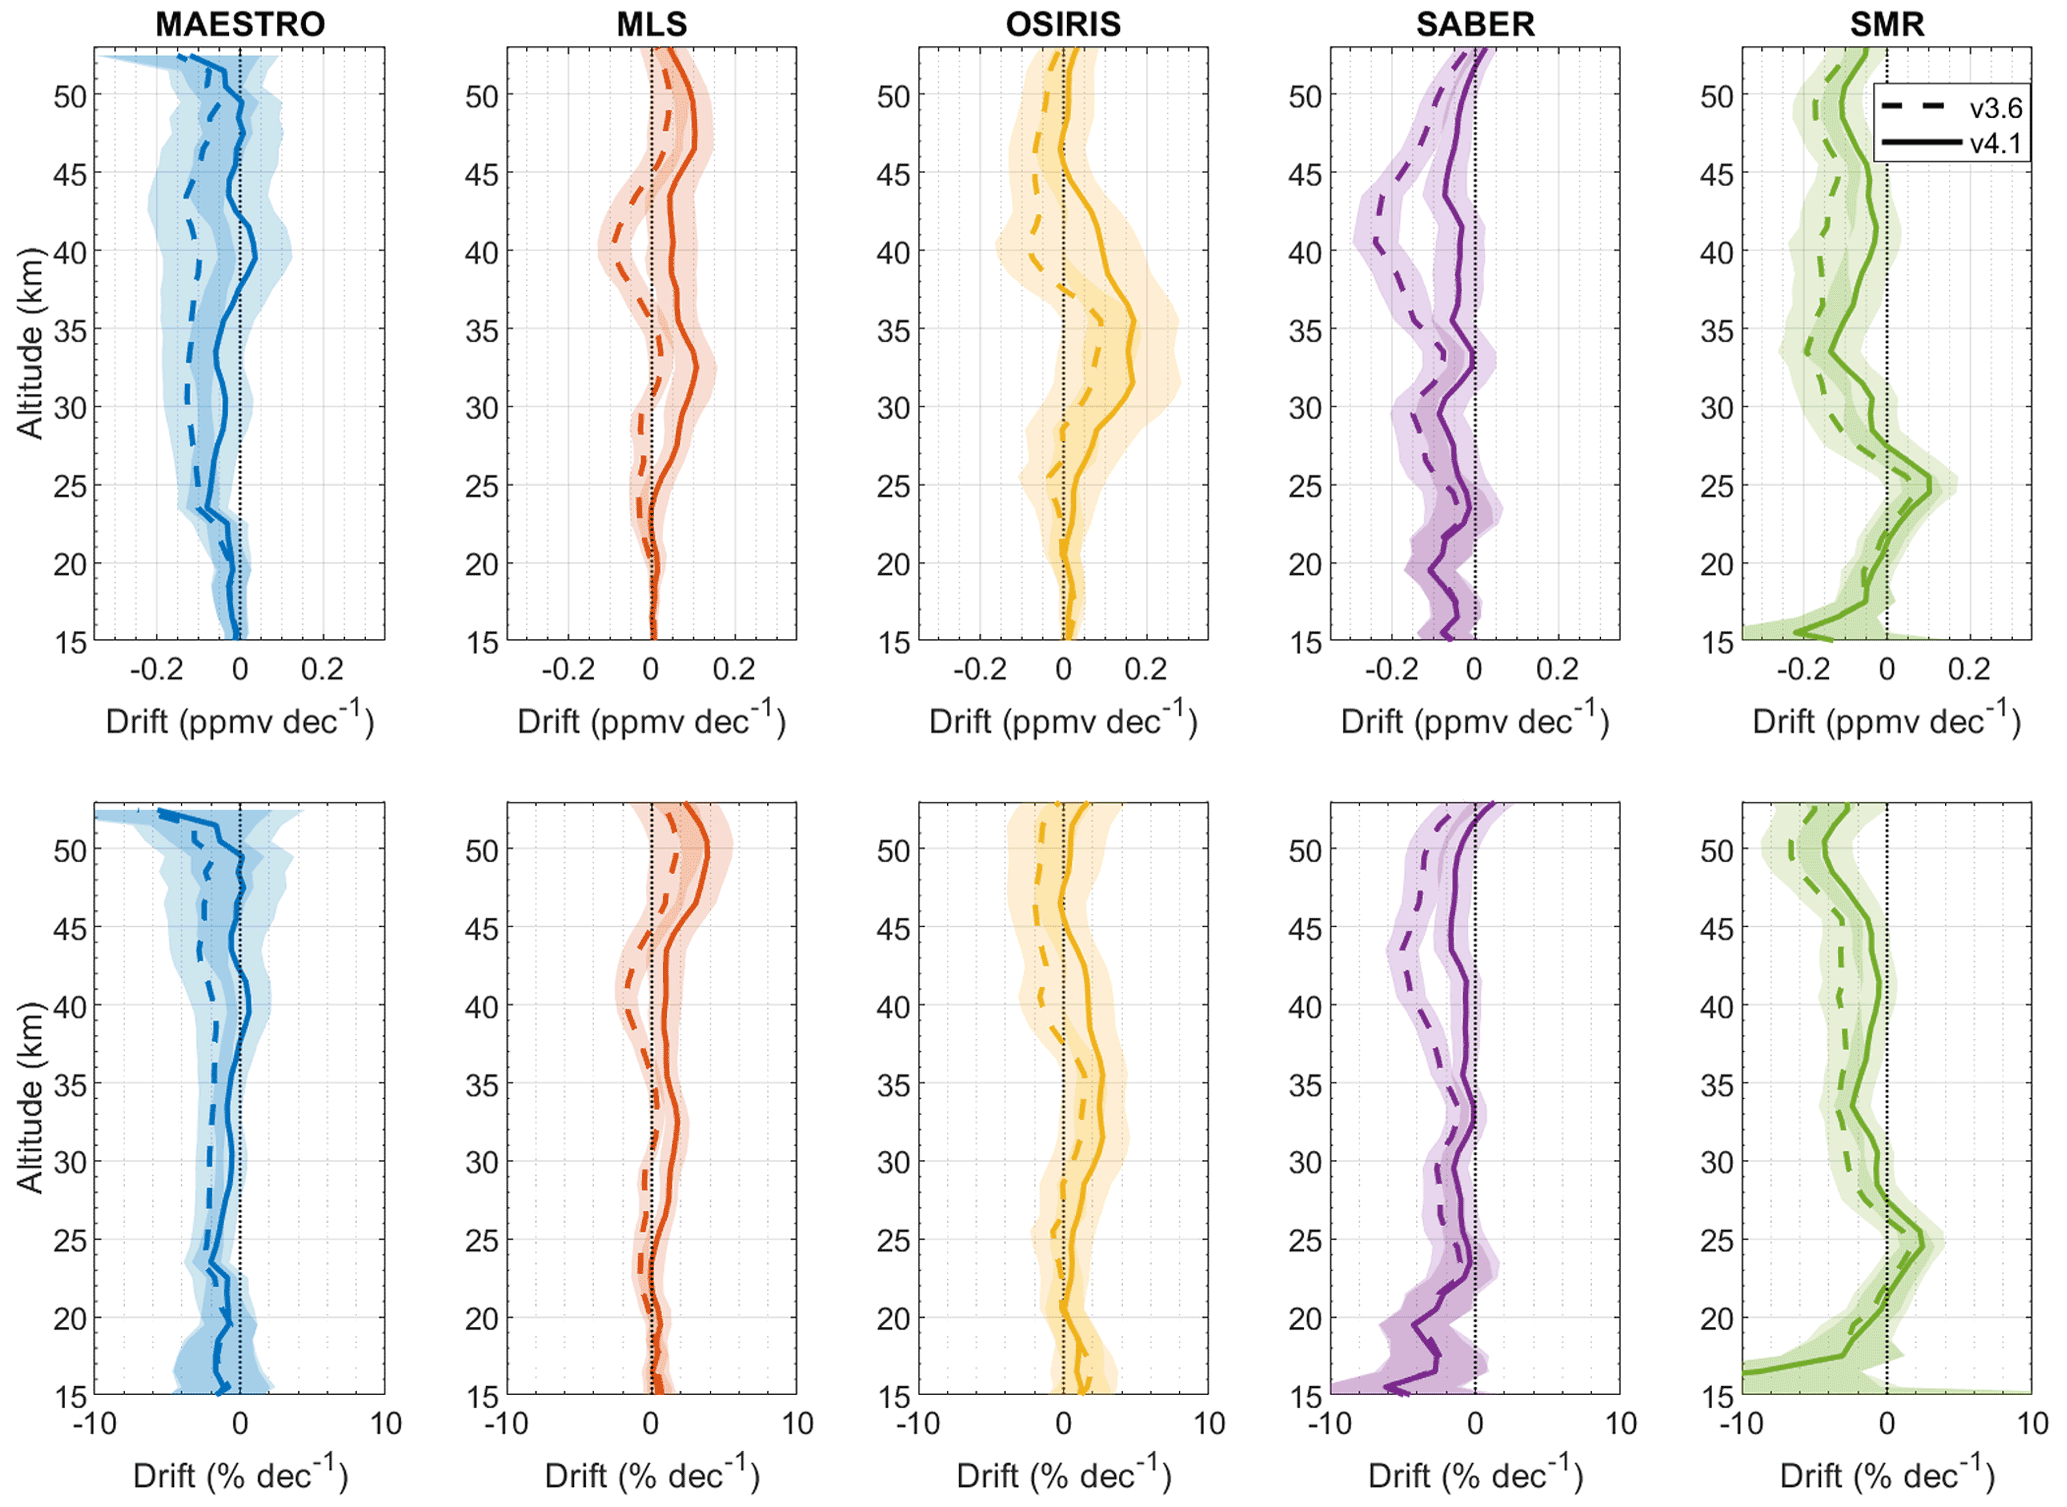
Figure 4Drift profiles (curves) and corresponding 99 % confidence bounds (semitransparent shaded regions) for comparisons between v3.6 and v4.1 ACE-FTS O3 and MAESTRO (blue), MLS (red), OSIRIS (yellow), SABER (purple), and SMR (green) with coincidence criteria of within 6 h and 300 km for all coincident profiles within 2004–2020. Results in ppmv per decade (top) and in percent per decade (bottom).
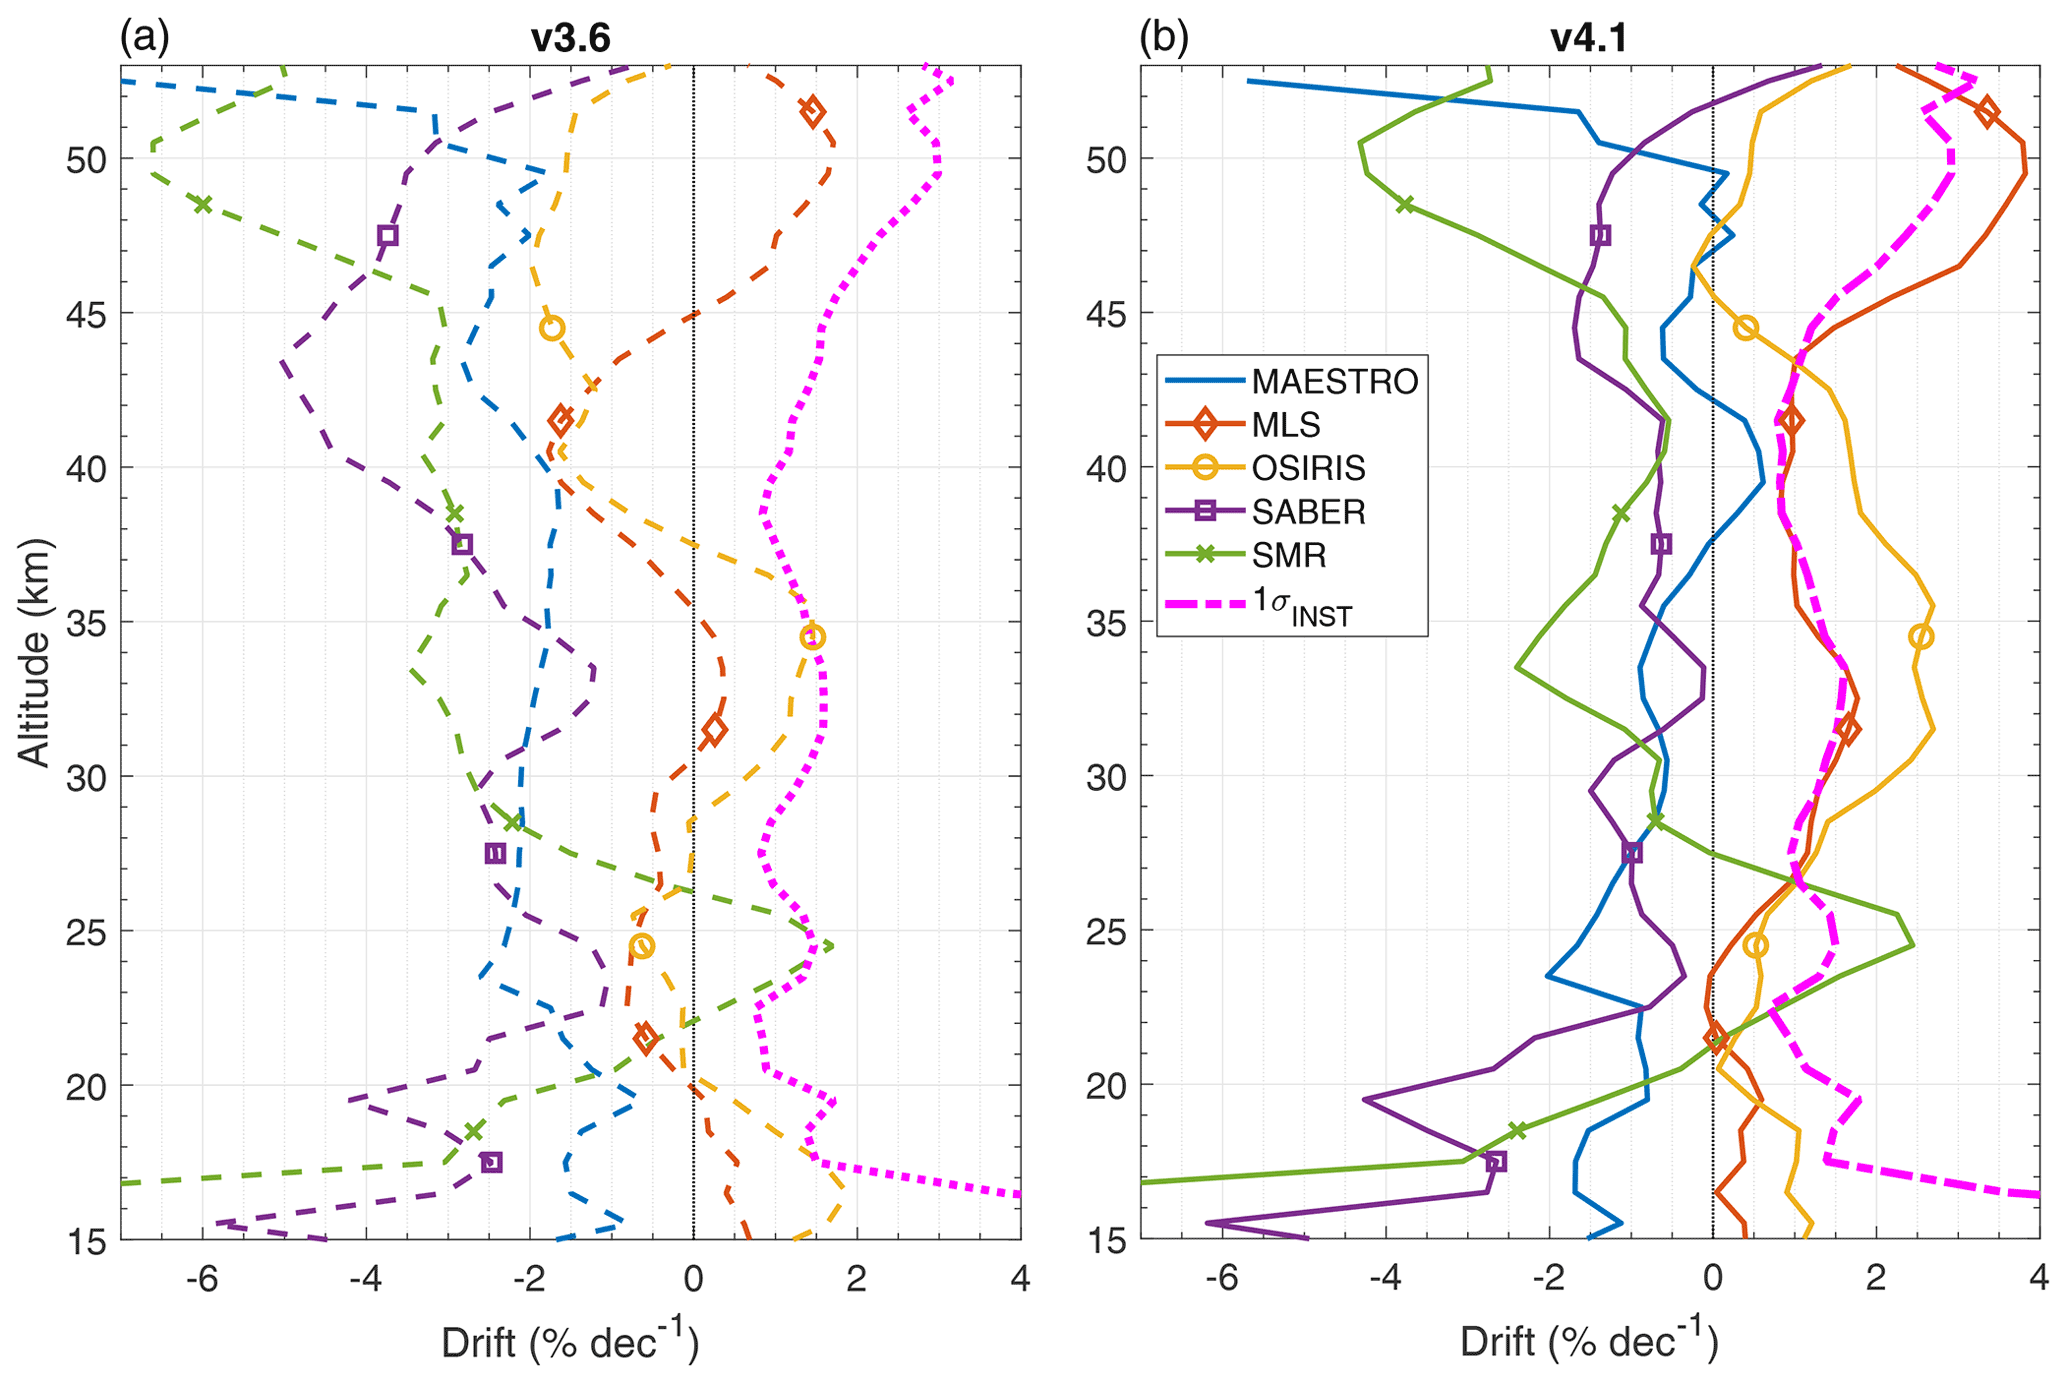
Figure 5Relative drift profiles for each INST relative to ACE-FTS v3.6 (a) and v4.1 (b) and the corresponding inter-instrument stability (magenta), represented by the standard deviation of the drift profiles.
Figure 4 shows the calculated v3.6 and v4.1 ACE-FTS drift profiles relative to INST, given the coincidence criteria of within 6 h and 300 km. All INST profiles exhibit similar differences in drifts versus ACE-FTS profiles between v3.6 and v4.1. All ACE-FTS – INST profiles show no significant change in drift between ACE-FTS data versions below ∼ 22 km and a significant positive shift in drift, on the order of 1 %–3 % per decade, above ∼ 22 km. These changes in drift between ACE-FTS versions are more clearly seen in Fig. 5, which shows that the largest differences in drift are exhibited in the 40–45 km region. Also shown is the inter-instrumental stability, which is calculated (for both v3.6 and v4.1) as the standard deviation of all ACE-FTS drifts relative to INST. For both versions of ACE-FTS, the best inter-instrumental stability is 0.8 % per decade near 22 km, and between 17 and 46 km, the inter-instrumental stability is below 2 % per decade. Figure 6 shows the ACE-FTS MLS time series (30 d mean values) at 42.5 km as an example of the calculated trends and their uncertainty (represented as 99 % confidence intervals). At this altitude level, the ACE-FTS v3.6 drift relative to MLS is −1.3 ± 1.1 % per decade (−0.06 ± 0.05 ppmv per decade), whereas the drift in v4.1 relative to MLS is not significant with a value of 0.9 ± 1.3 % per decade (0.04 ± 0.06 ppmv per decade). The global drift results, seen in Fig. 7, clearly show that not only is there a significant difference in drift values between v3.6 and v4.1 at nearly all altitudes above ∼ 25 km, but that there is a significant drift in v3.6 O3 at all altitudes above 20 km and no drift in v4.1 at any analyzed altitude. ACE-FTS v3.6 data exhibit a mean drift on the order of 1 ± 0.5 % per decade between 20 and 35 km and on the order of 2.5 ± 1 % per decade in the 40–50 km region. This drift is due to an inaccurate trend in the assumed CO2 concentrations used in the v3.6 pressure and temperature retrieval (which are used in the O3 retrievals). In version v4.1, CO2 concentrations are determined using a more accurate model (Boone et al., 2020).
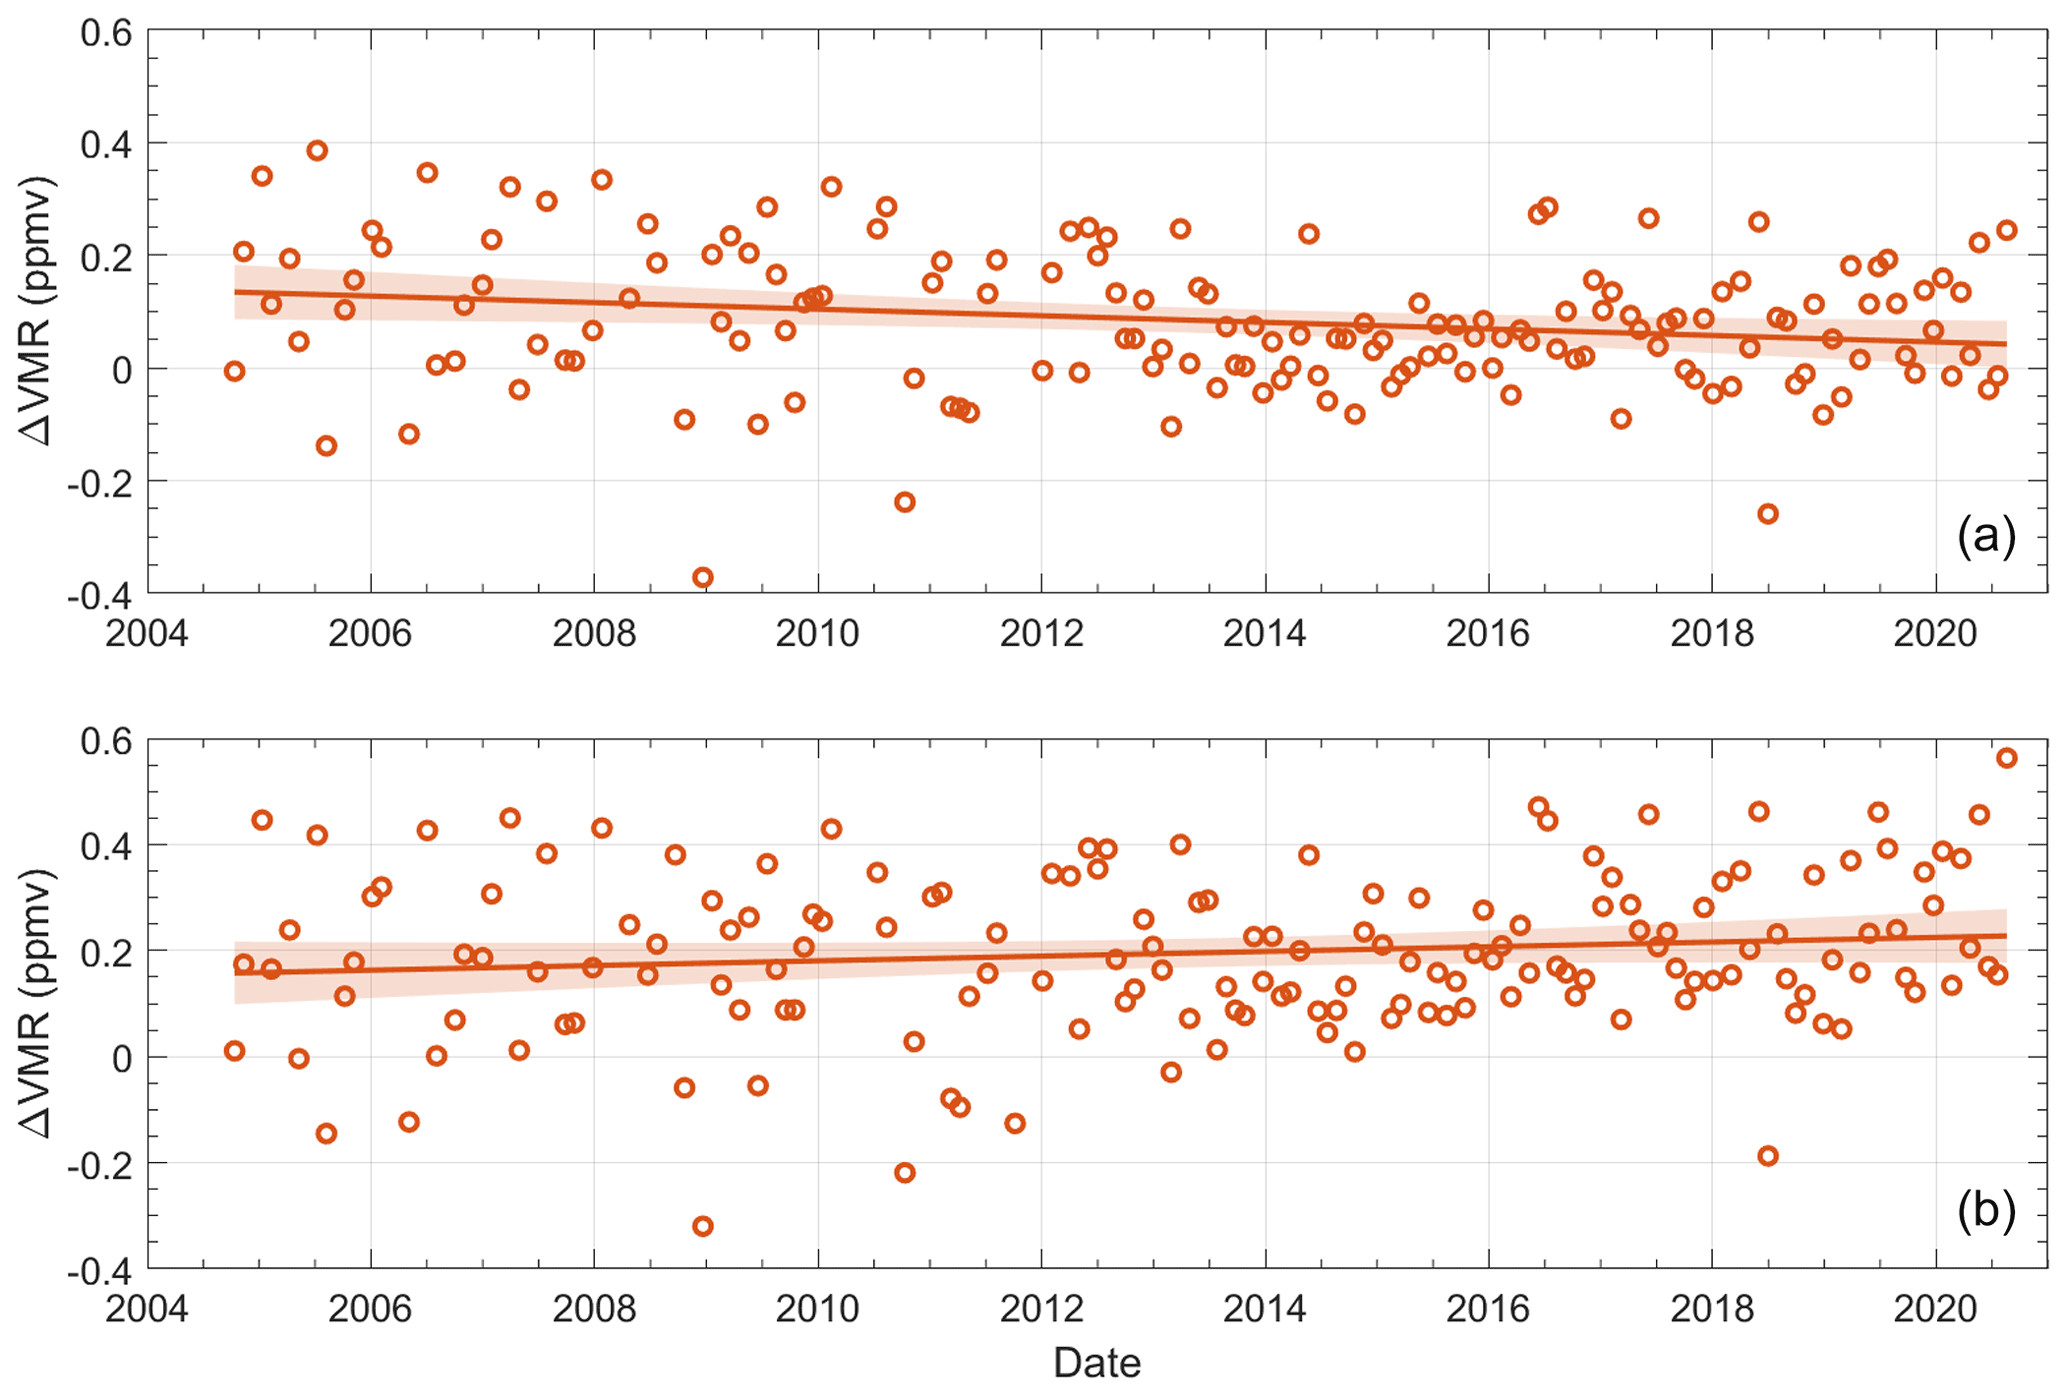
Figure 6Linear fits (lines) to the 30 d average differences (circles) between ACE-FTS and MLS at an altitude of 42.5 km for (a) ACE-FTS v3.6 and (b) ACE-FTS v4.1. Shaded areas represent the 99 % confidence bounds.
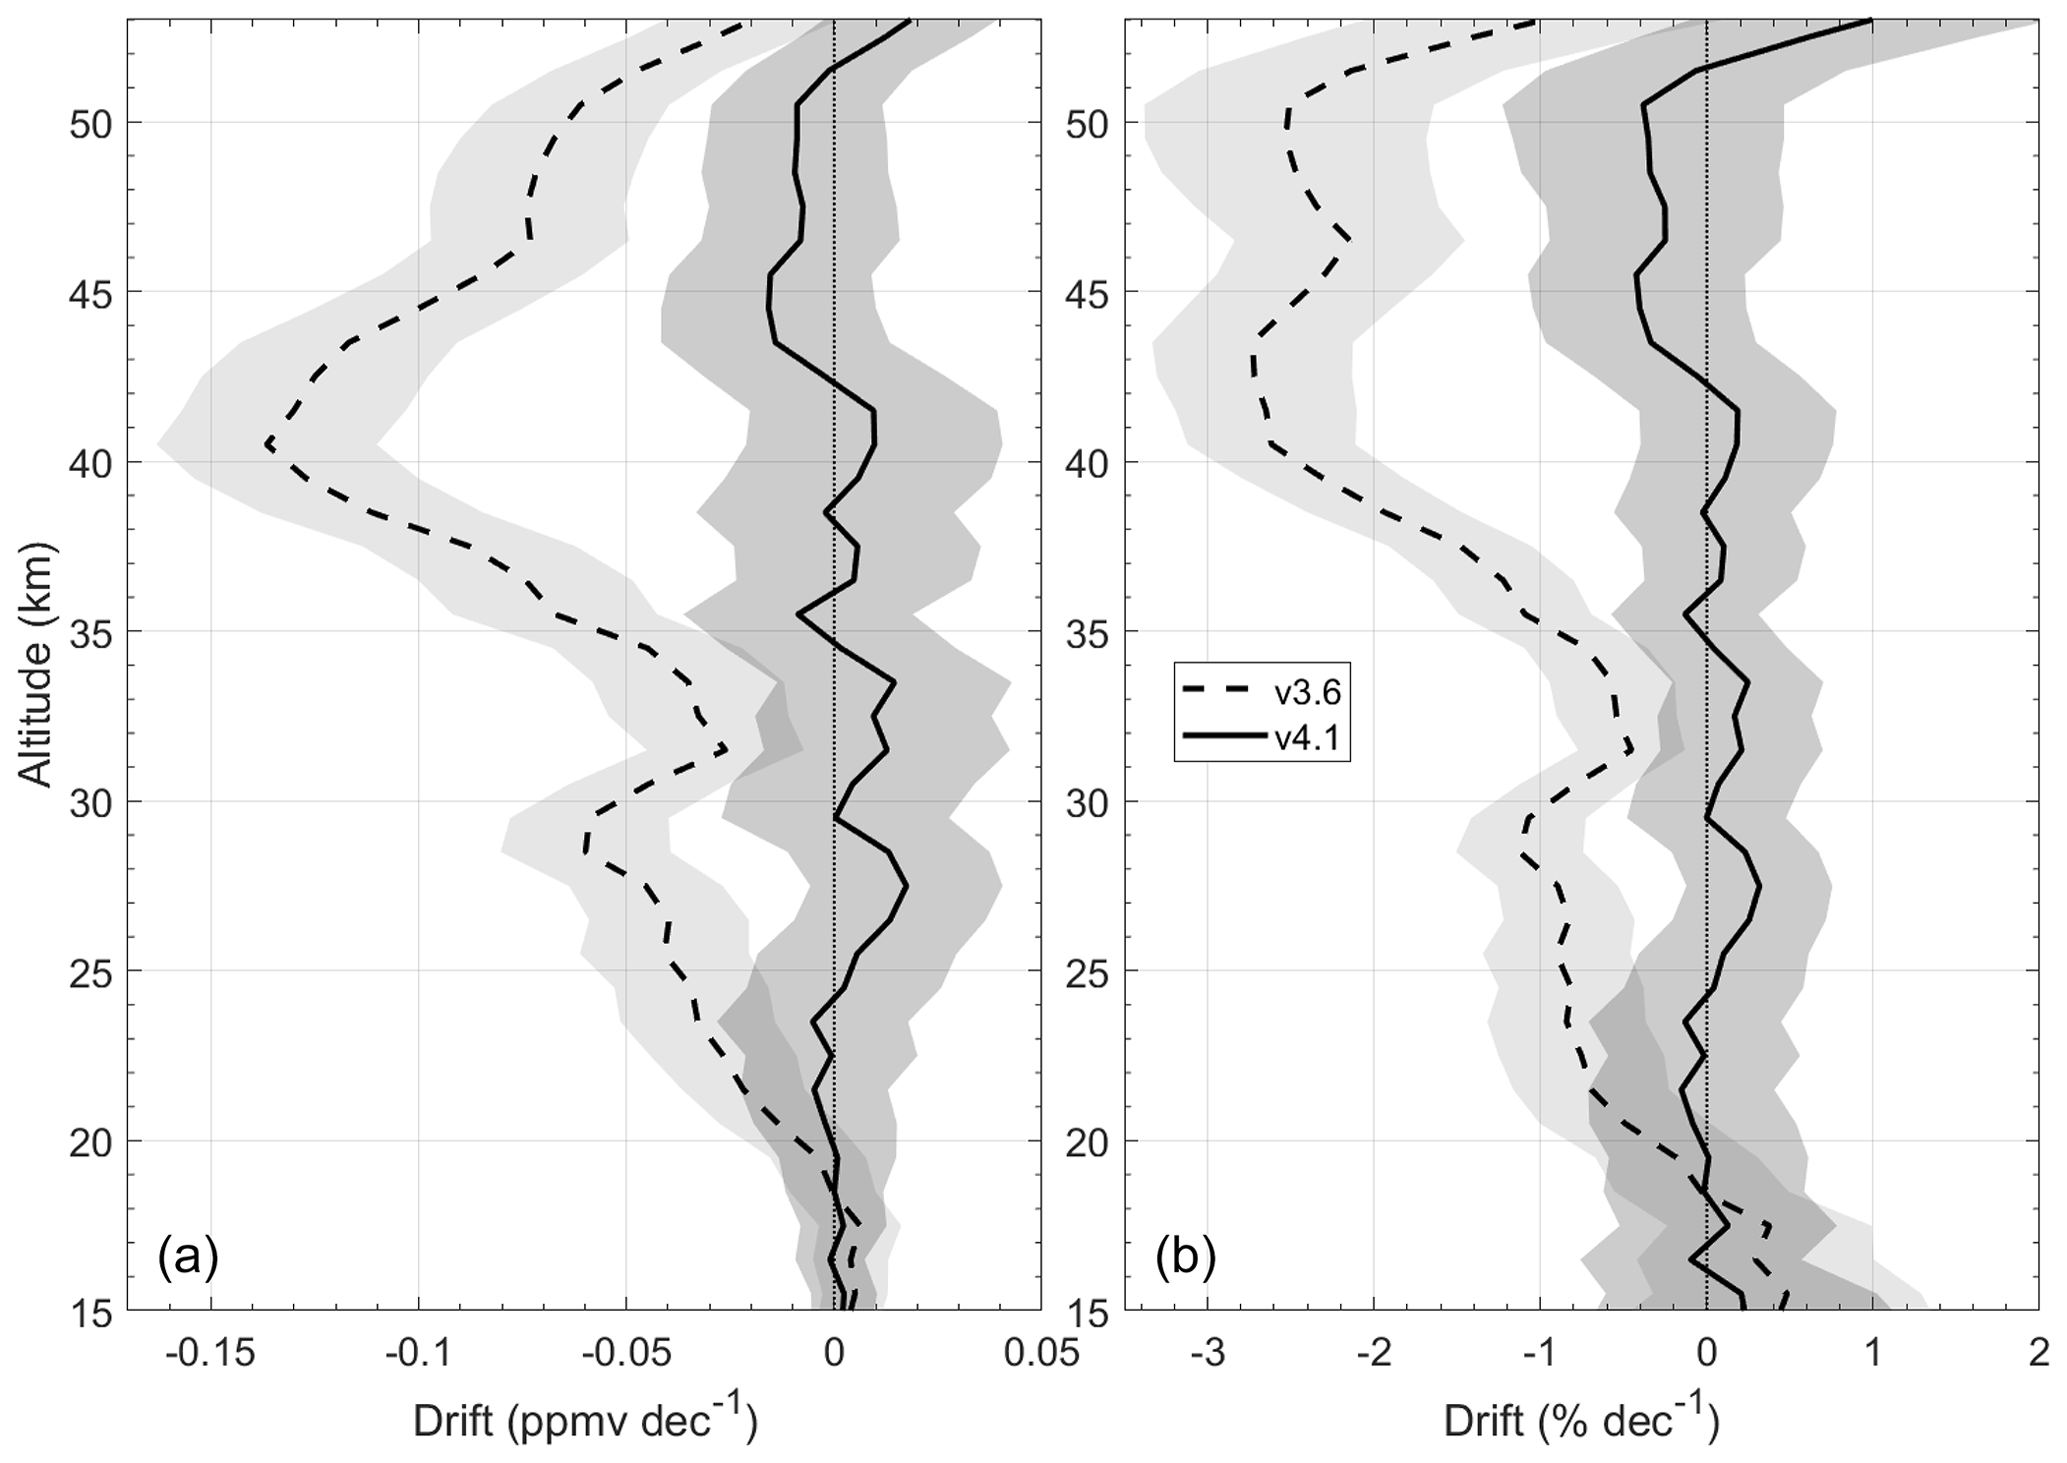
Figure 7Weighted average ACE-FTS drift profiles for v3.6 (dashed lines) and v4.1 (solid lines) in (a) absolute differences and (b) relative differences. Shaded regions (semitransparent) represent the 99 % confidence bounds.
4.2 Regional comparisons
The ACE-FTS weighted-average bias was calculated for data that were binned by ACE-FTS measurement local time (AM and PM) and by latitude – Arctic (50–90∘ N; Arc), Antarctic (50–90∘ S; Ant), and extra-polar (50∘ S–50∘ N; EP). The results, Fig. 8, show that in the middle stratosphere there is little change with local time and latitude in the ACE-FTS bias. At all local times and latitudes between 20–40 km, the v3.6 bias is typically positive and on the order of 0 %–4 %, and the v4.1 bias is positive and greater than 1 %, peaking near 30 km at ∼ 8 %–9 %. As shown in Sect. 4.1, these biases include a positive bias introduced by FOV modelling error, which, for globally averaged data, is on the order of a couple of percent near 20 and 40 km and ∼ 7 % near 27 km. The weighted-average biases seen in Fig. 8 have not been corrected for FOV modelling errors, as those errors have not yet been calculated on a regional basis.
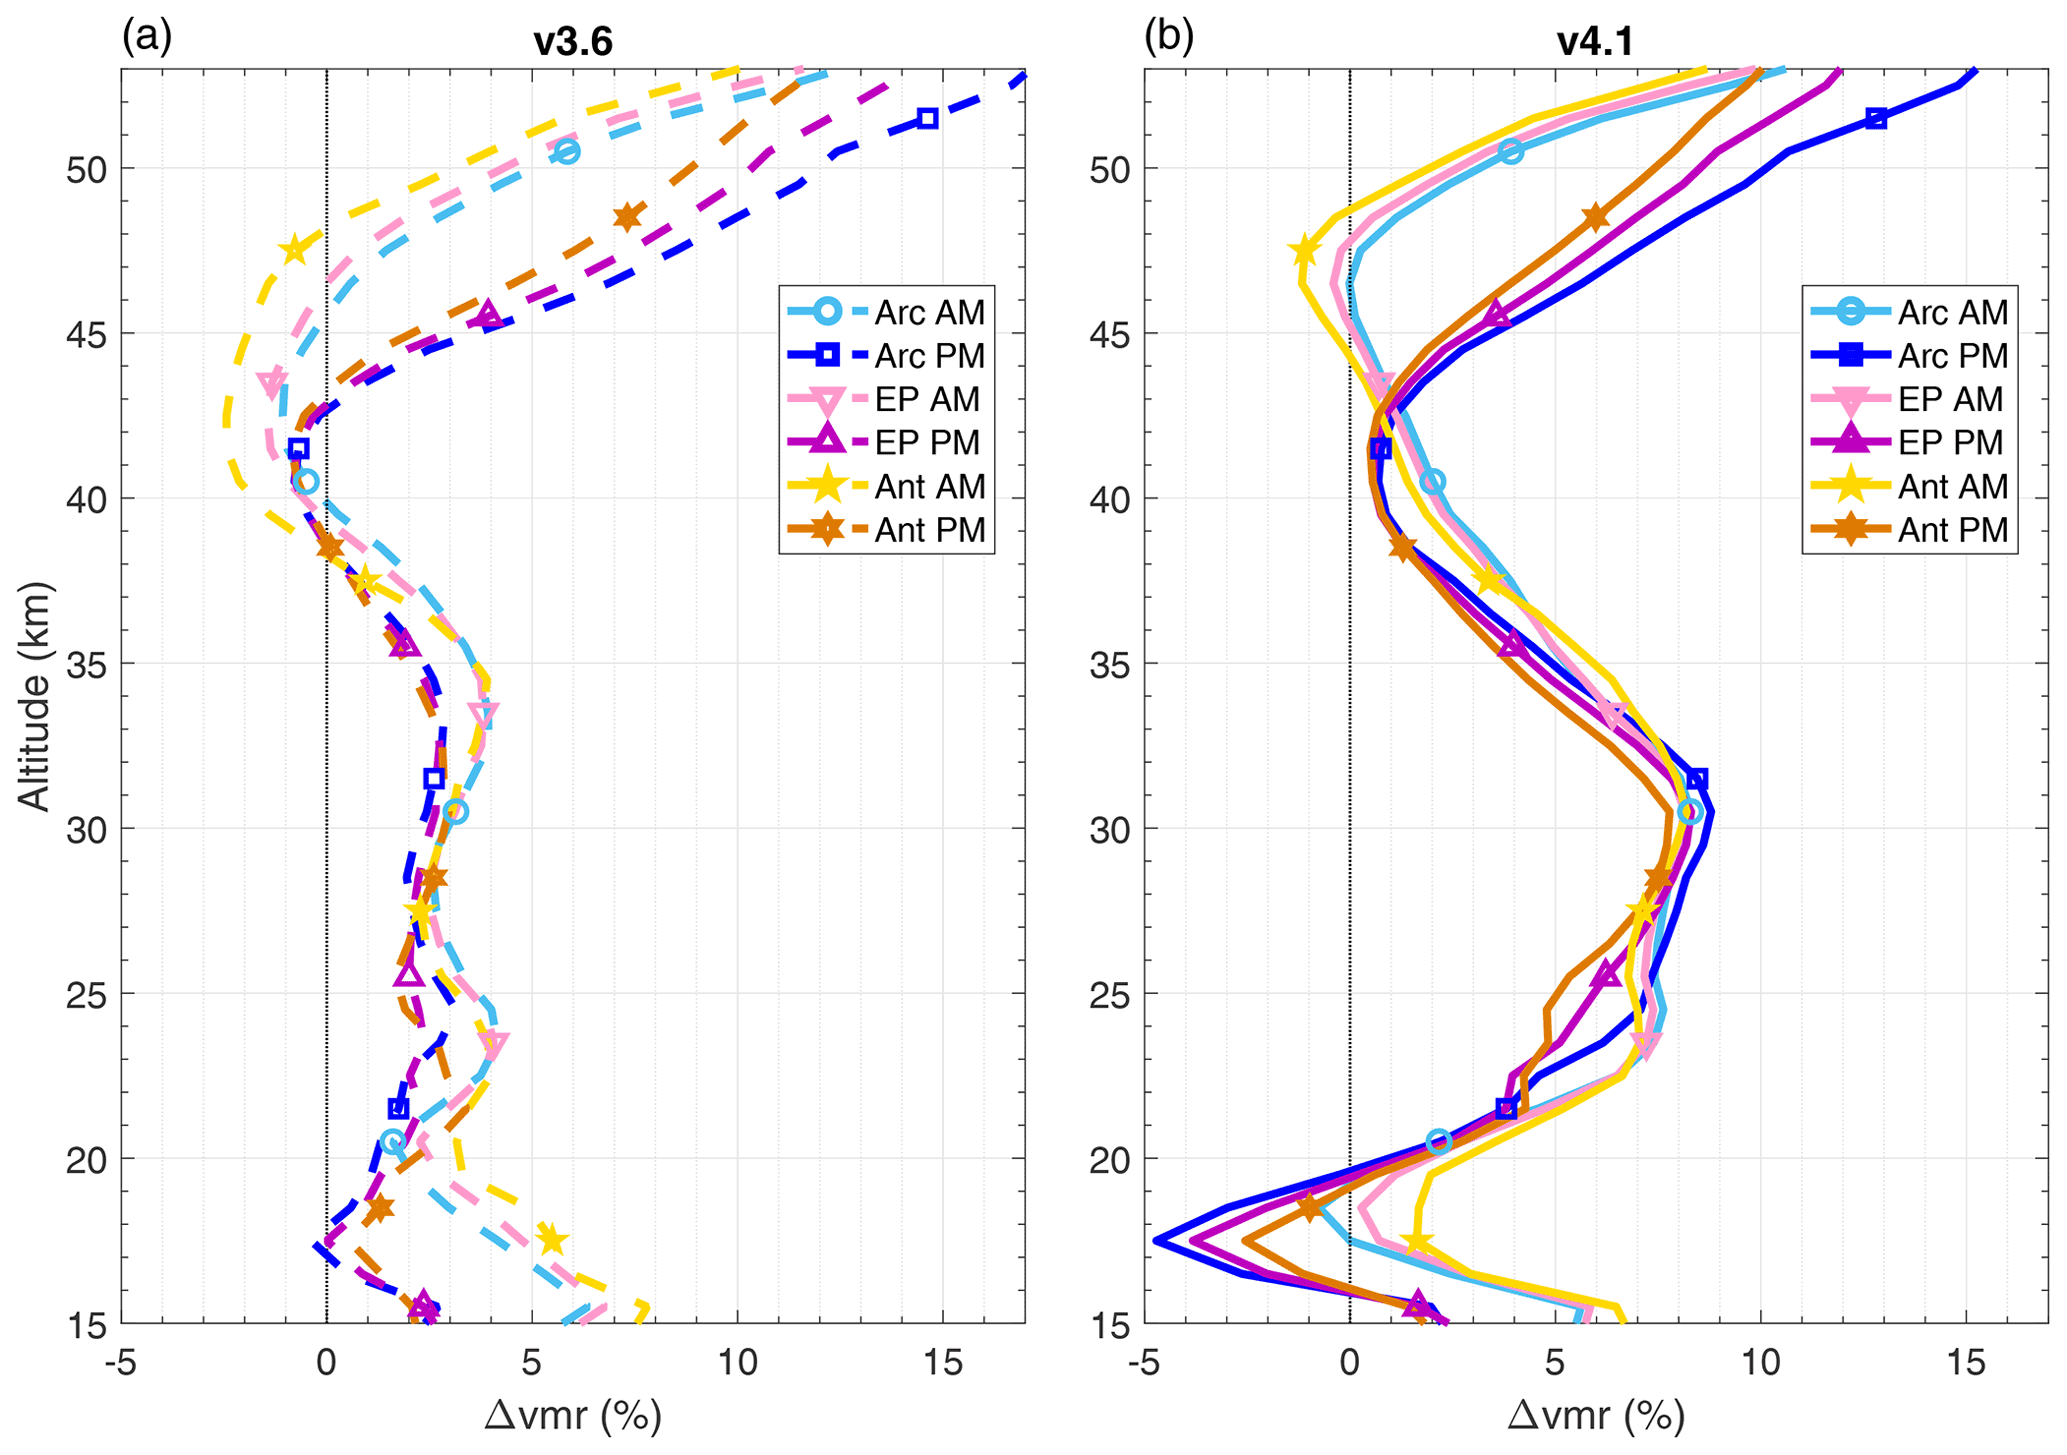
Figure 8Weighted-average percent biases between ACE-FTS O3 and INST for comparisons in different local time and latitudinal bins of Arctic (Arc), extra-polar (EP), and Antarctic (Ant), and with coincidence criteria of within 6 h and 300 km. (a) ACE-FTS v3.6 and (b) v4.1.
When comparing ACE-FTS O3 to INST profiles that were binned according to measurement local time, MAESTRO was the only instrument that exhibited a significant difference in drift values with respect to ACE-FTS between AM and PM measurements. As seen in Fig. 9, below 23 km, the PM comparisons exhibit a statistically significant drift on the order of 5 %–10 %, whereas the AM comparisons exhibit a non-significant drift of ∼ 1 %–2 %. As none of the other instruments exhibit this type of difference with respect to local time (not shown), it is likely that it is the MAESTRO PM data that have a positive drift. Due to this, all global comparisons in Sect. 4.1 exclude MAESTRO PM data below 23 km. The source of this drift has not yet been identified but is being investigated by the MAESTRO team.
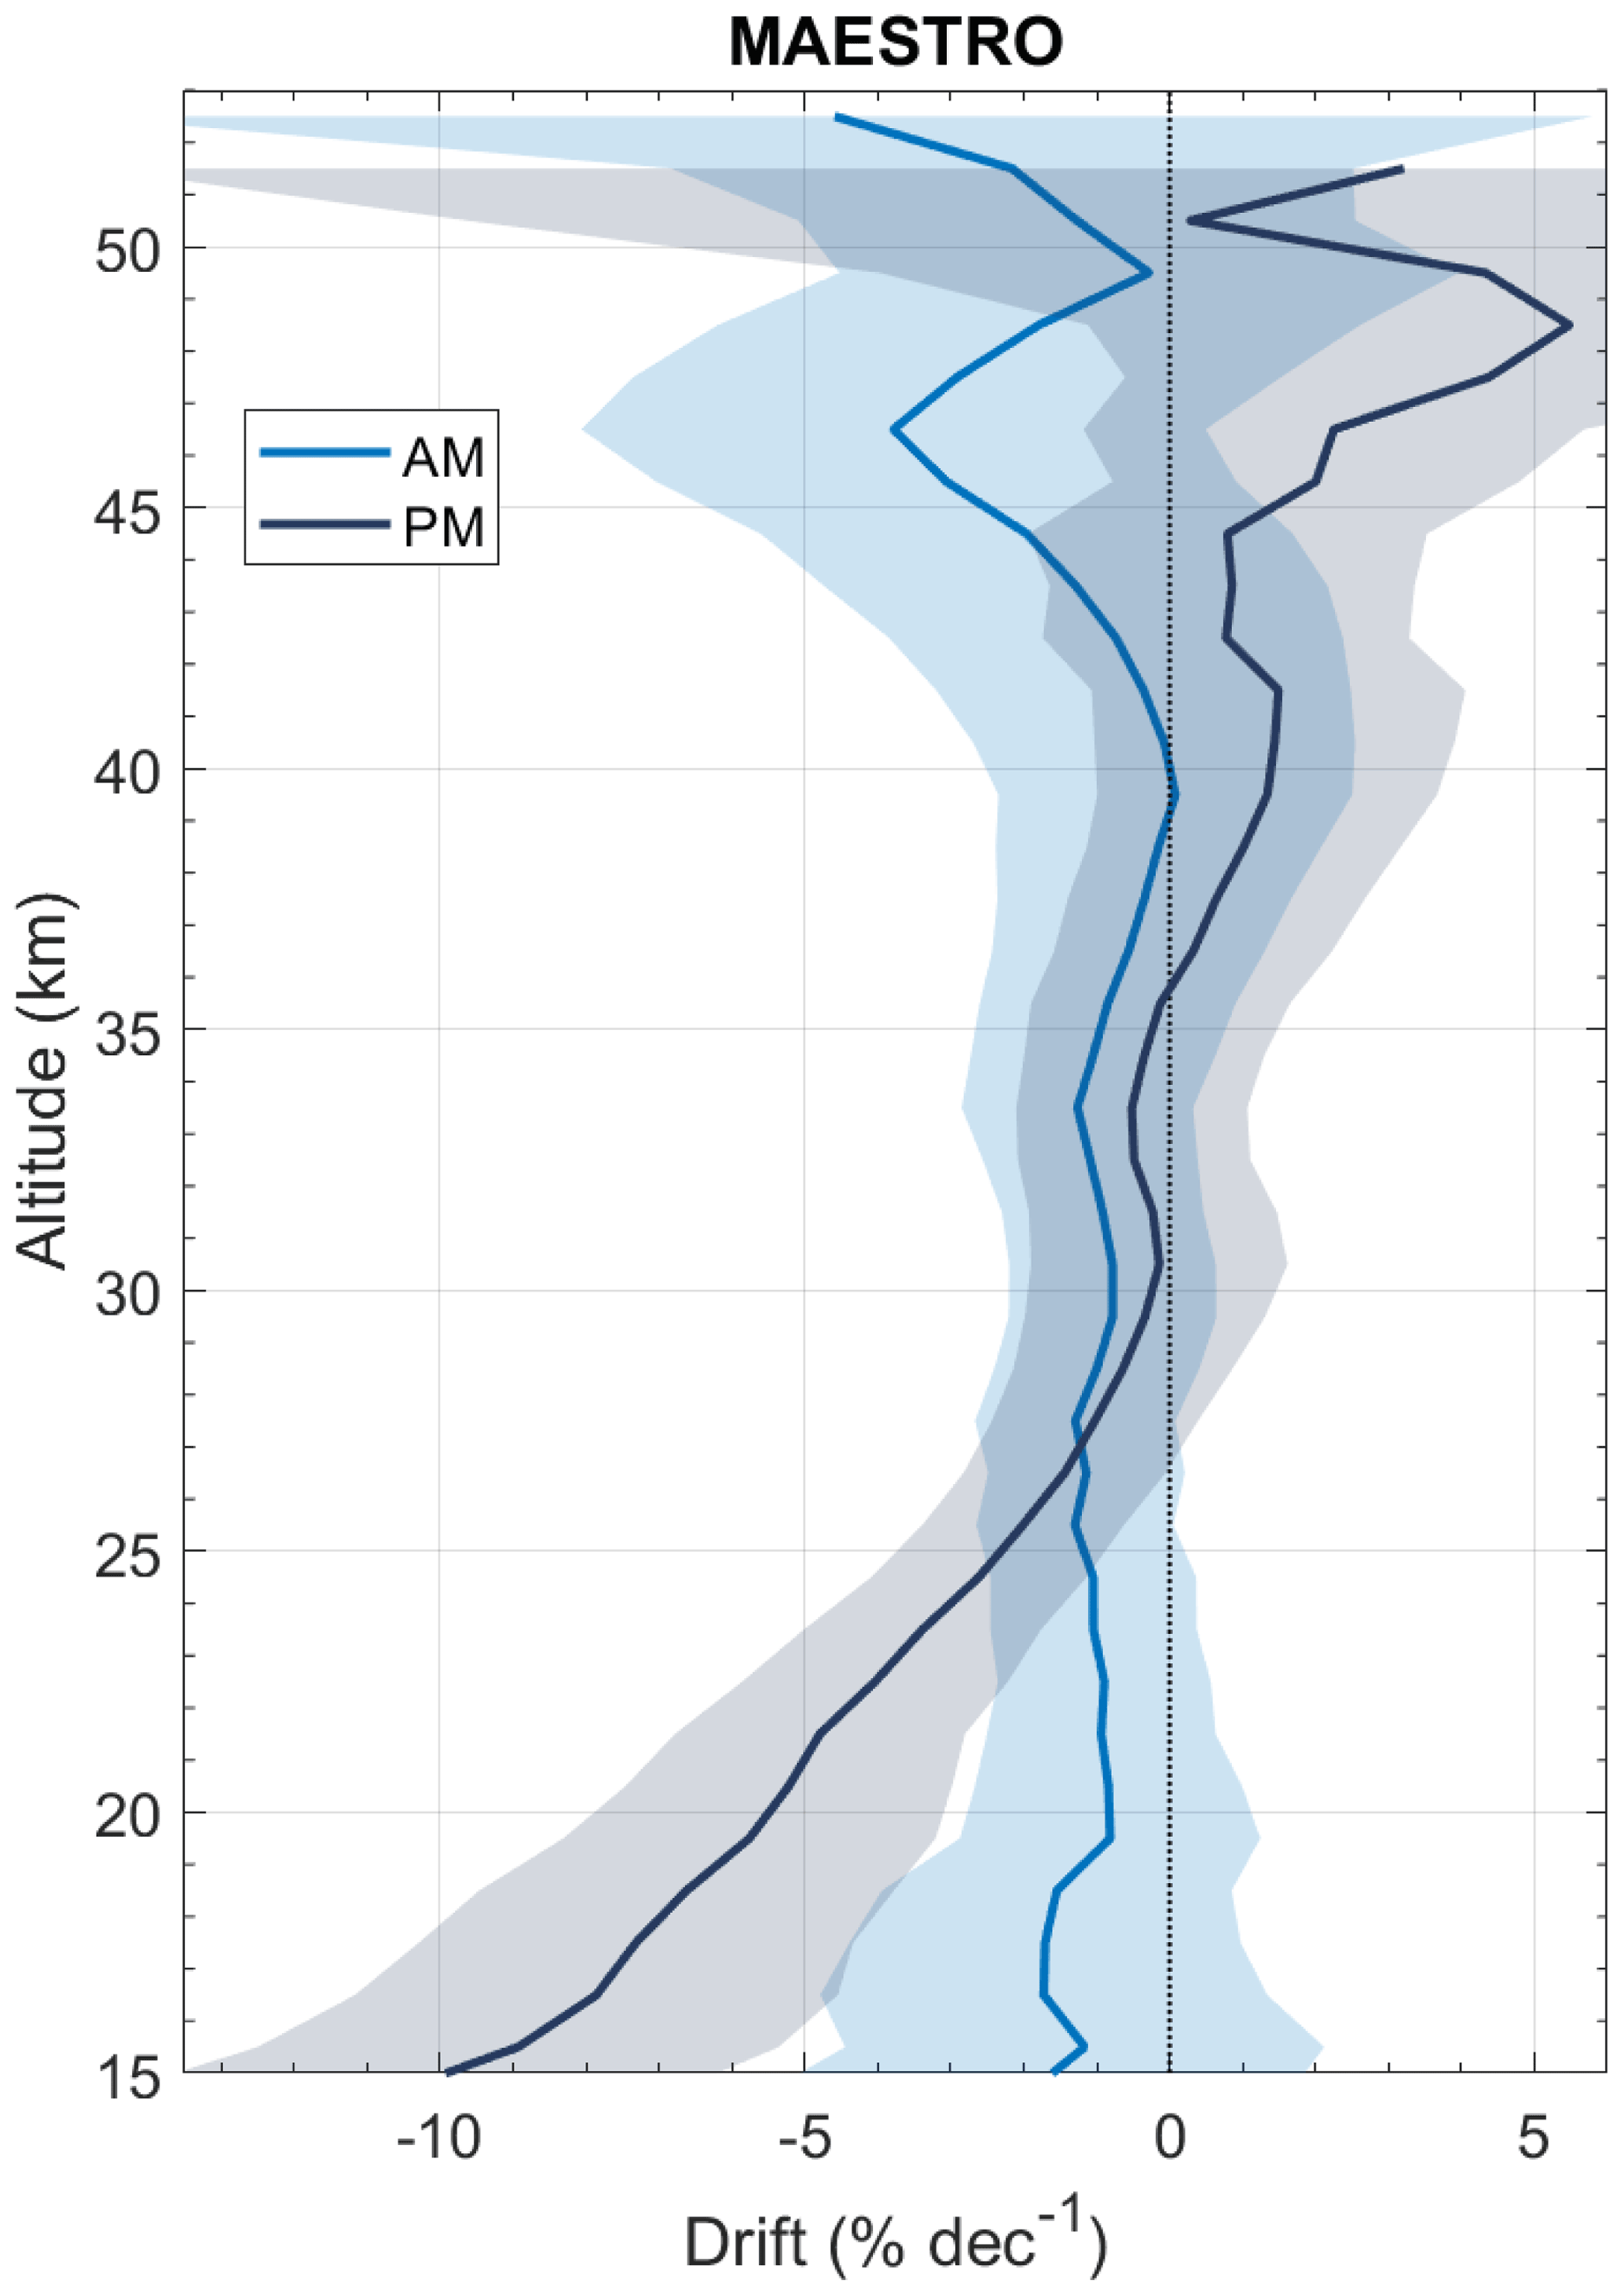
Figure 9Drift profiles between ACE-FTS v4.1 and MAESTRO for AM (blue) and PM (purple) measurements. Shaded regions (semitransparent) represent 99 % confidence bounds.
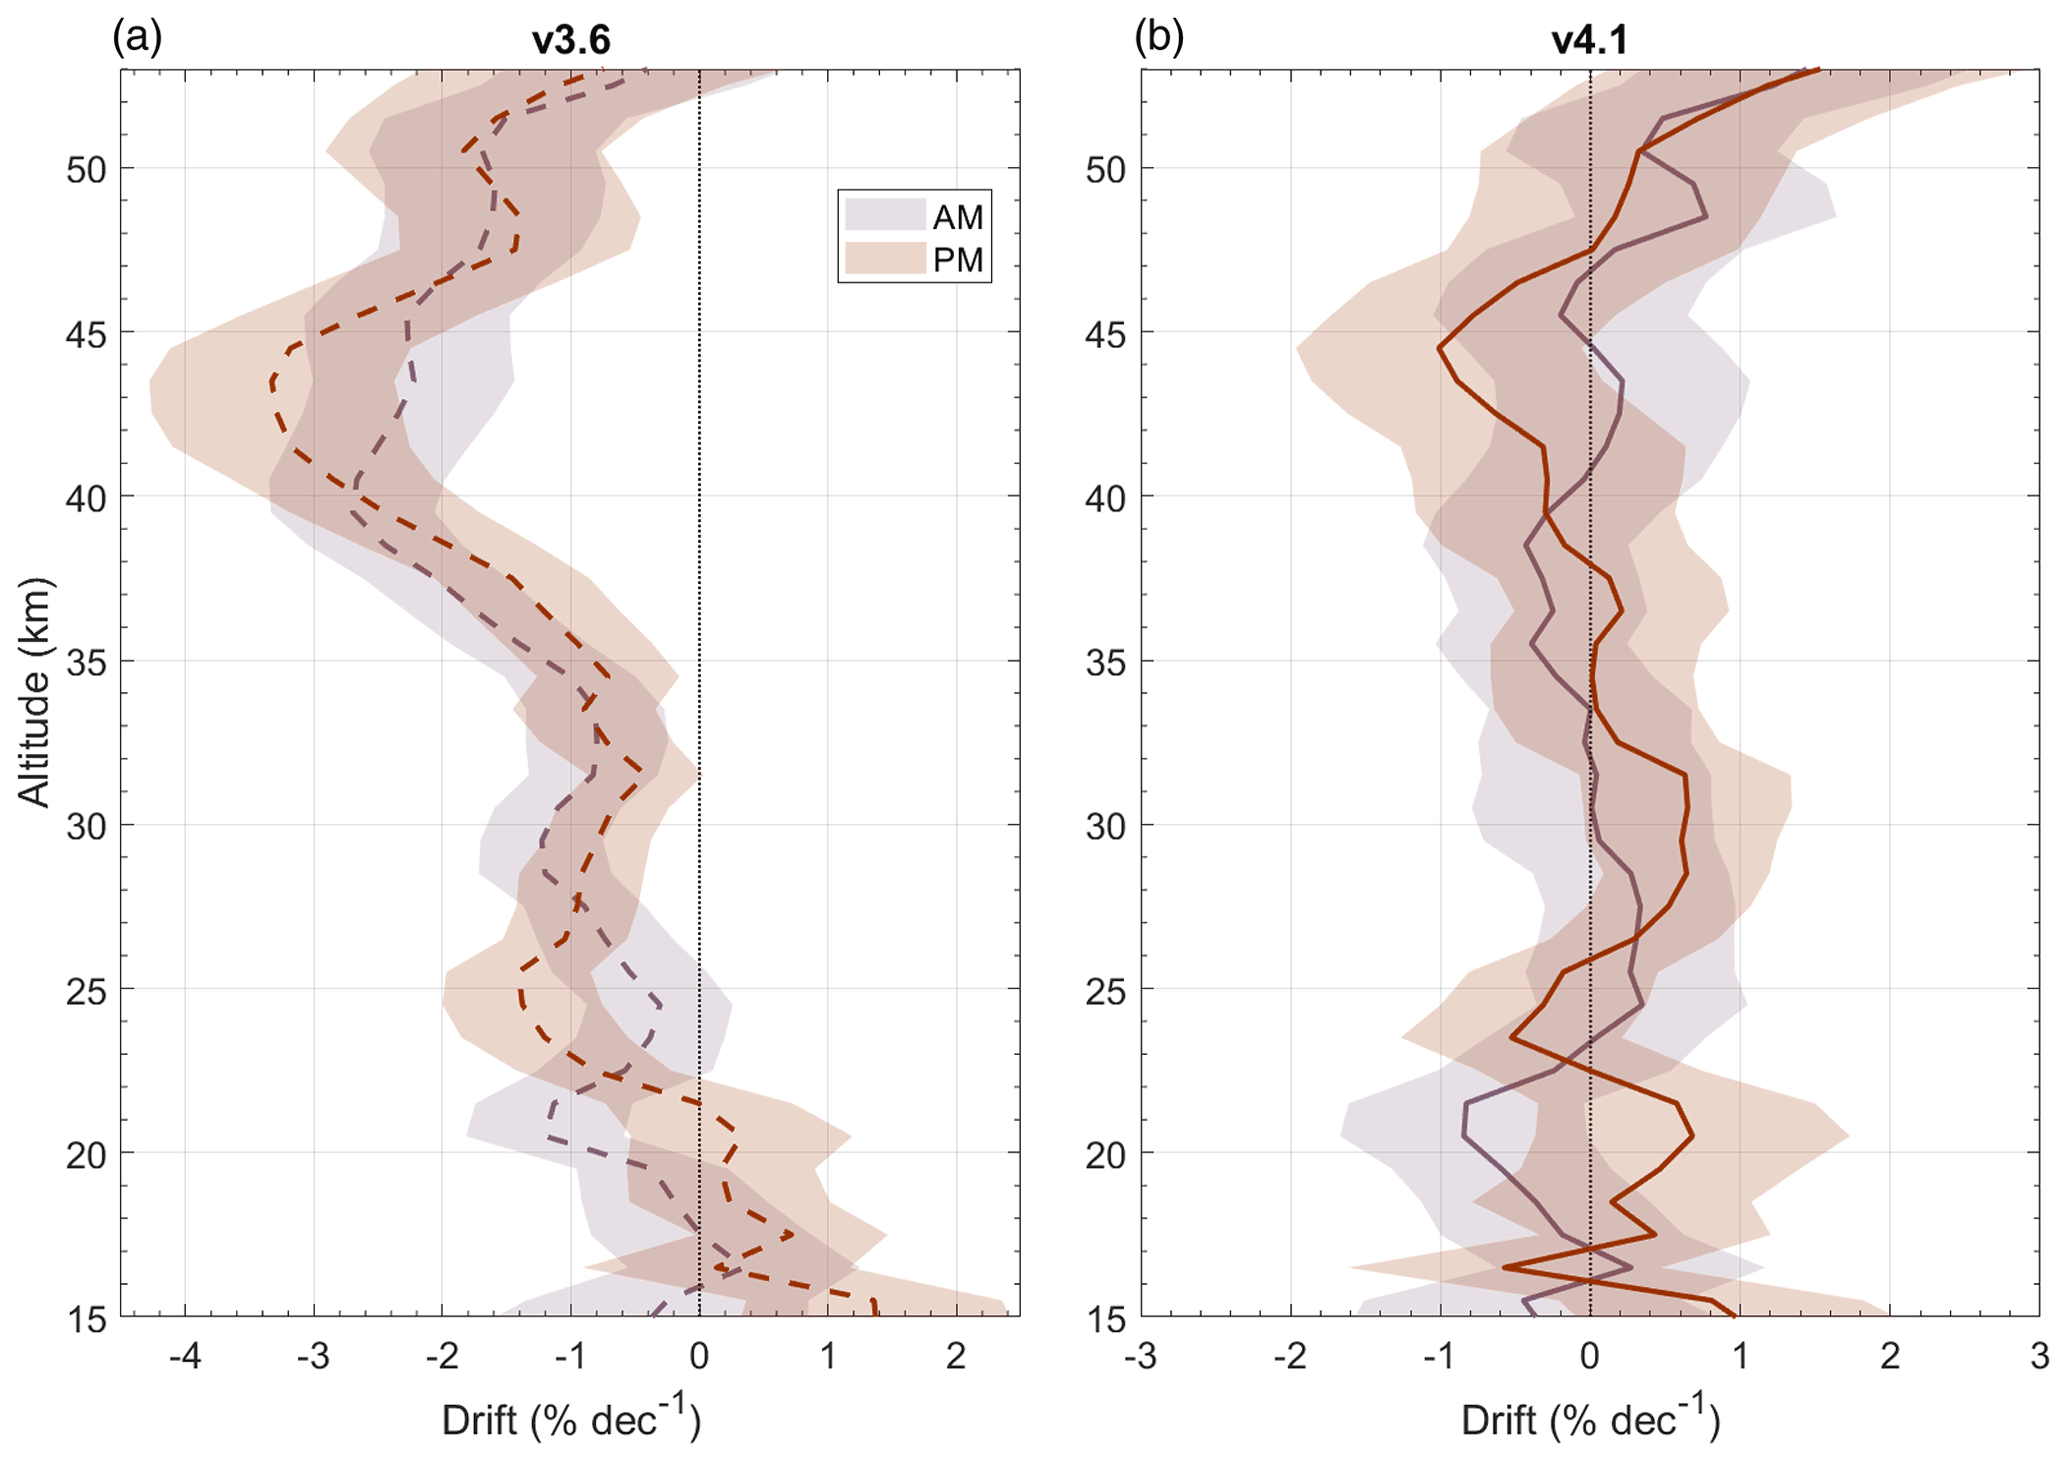
Figure 10Weighted-average ACE-FTS drift profiles for AM and PM comparisons in relative terms. (a) ACE-FTS v3.6, (b) v4.1. Shaded regions (semitransparent) represent 99 % confidence bounds.
The weighted average ACE-FTS drift was calculated for different local times and latitude regions for v4.1 only. The v3.6 drift identified in Sect. 4.1 exists at all local time and latitudes and therefore the v3.6 O3 data are not recommended for use in trend studies. As seen in Fig. 10, when the v4.1 data are binned by local time there are small but significant drifts of approximately −0.8 ± 0.8 % per decade in the AM data near 21 km and approximately −1 ± 1 % per decade in the PM data at 44.5 km. When the AM and PM data were further partitioned into Arctic, Antarctic, and extra-polar latitudinal bins, no significant trend was detectable near 45 km in the PM data at any latitude region, and the AM data only exhibited a significant drift in the extra-polar region near 21 km, as shown in Fig. 11. Unfortunately, the ACE sampling is too sparse to detect a statistically significant drift result in sub-regions of the AM EP bin, which could help to further elucidate the cause of the drift. However, it should be noted that in every latitudinal region there are no significant differences between AM and PM mean drifts, and similarly, for both AM and PM data there are no significant differences in drift between latitudinal regions.

Figure 11Weighted-average ACE-FTS v4.1 drift profiles for comparisons in Antarctic (Ant), extra-polar (EP), and Arctic (Arc) latitude bands and separated by AM and PM local times. Shaded regions (semitransparent) represent 99 % confidence bounds.
GCOS recommends that for long-term stratospheric O3 trend studies, data sets should have a stability of within 1 % per decade (GCOS, 2011), and the European Space Agency Ozone Climate Change Initiative program (ozone_CCI) recommends a stability of less than 1 %–3 % per decade at all latitudes throughout the stratosphere (van Weele, 2016). Both of the significant AM and PM drifts detected in the ACE-FTS v4.1 O3 data (−1 % per decade near 45 km and 0.8 % per decade near 21 km, respectively) are at or below the recommended limits.
Figure 11 also shows that in the upper altitude regions, above 50 km, the Antarctic data exhibit a positive drift on the order of 2 %–4 % per decade, which is more prominent for PM data. When the data are not binned by local time, the SH results exhibit a positive drift that is significant above 51 km and has a maximum value of 2.4 ± 1.5 %, which is within the ozone_CCI stability recommendations but only just meets the stricter recommendations of GCOS within the uncertainty.
Both versions 3.6 and 4.1 of stratospheric ACE-FTS O3 profiles have been compared to correlative measurements from the limb-viewing satellite instruments MAESTRO, MLS, OSIRIS, SABER, and SMR. On a global scale, the v3.6 profiles exhibit a mean bias that is positive on the order of ∼ 3 % in the 17–35 km region and a bias that increases with altitude from −1 % near 40 km up to ∼ 13 % near 52 km. The v4.1 O3 bias profile tends to be more positive than that of v3.6 in the middle stratosphere, reaching up to 9 % near 30 km, and more negative by ∼ 3 %–4 % percent above 46 km as well as below 20 km.
In the middle stratosphere (∼ 20–45 km), neither version varies drastically (typically < 3 %) as a function of local time or latitude; however, above 45 km and below 20 km, there are significant differences in the mean biases between AM and PM profiles. Below 20 km, the bias in the AM data is up to 5 % greater than the PM bias, and above 45 km the PM bias is up to ∼ 6 % greater than the AM bias. It should be noted that above ∼ 40 km O3 undergoes large diurnal variation and the time coincidence criterion of 6 h could be a source of the larger bias at these altitudes. Similarly, ACE-FTS does not account for the increased horizontal inhomogeneity across the day–night terminator at these altitudes.
Similar to the bias, the estimated ACE-FTS precision in the middle stratosphere worsened from v3.6 to v4.1. The v3.6 relative precision was estimated to be between 5 % and 6 %, whereas that of v4.1 was estimated to be ∼ 7 %–10 %. The source of the change in precision between versions is currently under investigation.
The GCOS recommendations for O3 profile accuracy are within 5 %–20 % in the upper stratosphere and within 10 % in the upper troposphere to lower stratosphere (GCOS, 2011). At all analyzed altitude levels both the v3.6 and v4.1 O3 data meet these accuracy recommendations. ESA ozone_CCI, however, has stricter recommendations. Above 20 km, ozone_CCI recommends an O3 accuracy of within 8 %, and an accuracy of 16 % below 20 km. The v3.6 PM data meet these requirements at all analyzed altitude levels below 47 km, and at all altitude levels below 51 km for the AM data. The v4.1 data, on the other hand, only meet the ozone_CCI requirements near 30 km in certain sub-regions, as the bias can range between 7 % and 9 %, depending on local time and latitude. However, it should be noted that the results presented in this study are not strictly measurements of accuracy, but rather of bias relative to other limb sounders where the true O3 profiles are unknown.
In terms of drift, ACE-FTS v4.1 O3 is a significant improvement over v3.6. The v3.6 data exhibited a significant drift at all analyzed altitude levels above 21 km, peaking at −0.14 ± 0.02 ppmv per decade at 40.5 km, and on the order of −1.0 ± 0.4 % within ∼ 20–35 km and −2.5 ± 0.8 % per decade within ∼ 40–50 km. The ∼ −2.5 % per decade drift in the upper stratosphere technically meets the ozone_CCI stability recommendation of within 1 %–3 % per decade but not the GCOS recommendation of within 1 % per decade. Therefore, v3.6 ACE-FTS O3 data above 35 km are not recommended for use in trend studies and should only be used with caution in the 20–35 km region. The v4.1 data, when analyzed on a global scale, exhibit no significant drift at any analyzed altitude and drift values are within ±0.4 % below 52 km. When the data are binned by local time, there is a small drift in the AM data near 21 km of approximately −0.8 ± 0.8 % per decade and approximately −1 ± 1 % per decade near 44 km in the PM data; however, both these subsets adhere to the GCOS and ozone_CCI stability recommendations. This study also found that there is likely a significant positive O3 drift (∼ 2 %–10 % with respect to ACE-FTS) in the MAESTRO PM data below 23 km that worsens with decreasing altitude.
The MATLAB code used in the analyses for this paper is available at https://doi.org/10.5683/SP3/TDCB7J (Sheese and Walker, 2022).
The ACE-FTS and MAESTRO Level 2 data can be obtained via the ACE database (registration required), https://databace.scisat.ca/level2/ (ACE-FTS, 2022; MAESTRO, 2022). The ACE-FTS data quality flags used for filtering the dataset can be accessed at https://doi.org/10.5683/SP2/BC4ATC (Sheese and Walker, 2020). The MLS data can be obtained via the Goddard Earth Sciences Data and Information Services Center archive, https://disc.gsfc.nasa.gov/ (last access: 2 March 2022, registration required; https://doi.org/10.5067/Aura/MLS/DATA2516, Schwartz et al., 2020). The OSIRIS data can be obtained via ftp://odin-osiris.usask.ca/ (last access: 2 March 2022, registration required; https://doi.org/10.5281/zenodo.4532249, Bourassa et al., 2021). The SABER data can be obtained via ftp://saber.gats-inc.com/ (SABER, 2022). The SMR data can be obtained via https://doi.org/10.5270/OD1-d98abd8 (European Space Agency, 2020).
PES wrote the manuscript, performed the analysis, and helped develop the project. KAW helped develop the project and provided insight into the ACE-FTS and MAESTRO data. CDB provided insight into the ACE-FTS data. AEB and DAD provided insight into the OSIRIS data. LF provided insight into the MLS data. CTM and JZ provided insight into the MAESTRO data. DM provided insight into the SMR data. and JMR provided insight into the SABER data. Valuable comments on the manuscript were provided by all coauthors.
The contact author has declared that neither they nor their co-authors have any competing interests.
Publisher’s note: Copernicus Publications remains neutral with regard to jurisdictional claims in published maps and institutional affiliations.
This article is part of the special issue “New developments in atmospheric limb measurements: instruments, methods, and science applications (AMT/ACP inter-journal SI)”. It is a result of the 10th international limb workshop, Greifswald, Germany, 4–7 June 2019.
The Atmospheric Chemistry Experiment is a Canadian-led mission mainly supported by the CSA. We thank Peter Bernath, who is the PI of the ACE mission. Odin is a Swedish-led satellite project funded jointly by Sweden (Swedish National Space Board), Canada (CSA), France (Centre National d'Études Spatiales), and Finland (Tekes), with support by the third-party mission programme of the European Space Agency (ESA). Work at the Jet Propulsion Laboratory was performed under contract with the National Aeronautics and Space Administration.
This research has been supported by the Canadian Space Agency (contract no. 9F045-180034/001/MTB).
This paper was edited by Chris McLinden and reviewed by Chris Sioris and Chris McLinden.
ACE-FTS: Level 2 Data, Version 4.1/4.2, ACE-FTS [data set], available at: https://databace.scisat.ca/level2/, last access: 2 March 2022.
Adams, C., Bourassa, A. E., Bathgate, A. F., McLinden, C. A., Lloyd, N. D., Roth, C. Z., Llewellyn, E. J., Zawodny, J. M., Flittner, D. E., Manney, G. L., Daffer, W. H., and Degenstein, D. A.: Characterization of Odin-OSIRIS ozone profiles with the SAGE II dataset, Atmos. Meas. Tech., 6, 1447–1459, https://doi.org/10.5194/amt-6-1447-2013, 2013.
Adams, C., Bourassa, A. E., Sofieva, V., Froidevaux, L., McLinden, C. A., Hubert, D., Lambert, J.-C., Sioris, C. E., and Degenstein, D. A.: Assessment of Odin-OSIRIS ozone measurements from 2001 to the present using MLS, GOMOS, and ozonesondes, Atmos. Meas. Tech., 7, 49–64, https://doi.org/10.5194/amt-7-49-2014, 2014.
Arosio, C., Rozanov, A., Malinina, E., Weber, M., and Burrows, J. P.: Merging of ozone profiles from SCIAMACHY, OMPS and SAGE II observations to study stratospheric ozone changes, Atmos. Meas. Tech., 12, 2423–2444, https://doi.org/10.5194/amt-12-2423-2019, 2019.
Bernath, P. F., McElroy, C. T., Abrams, M. C., Boone, C. D., Butler, M., Camy-Peyret, C., Carleer, M., Clerbaux, C., Coheur, P.-F., Colin, R., DeCola, P., DeMazière, M., Drummond, J. R., Dufour, D., Evans, W. F. J., Fast, H., Fussen, D., Gilbert, K., Jennings, D. E., Llewellyn, E. J., Lowe, R. P., Mahieu, E., McConnell, J. C., McHugh, M., McLeod, S. D., Michaud, R., Midwinter, C., Nassar, R., Nichitiu, F., Nowlan, C., Rinsland, C. P., Rochon, Y. J., Rowlands, N., Semeniuk, K., Simon, P., Skelton, R., Sloan, J. J., Soucy, M.-A., Strong, K., Tremblay, P., Turnbull, D., Walker, K. A., Walkty, I., Wardle, D. A., Wehrle, V., Zander, R., and Zou, J.: Atmospheric Chemistry Experiment (ACE): Mission overview, Geophys. Res. Lett., 32, L15S01, https://doi.org/10.1029/2005GL022386, 2005.
Boone, C. D., Nassar, R., Walker, K. A., Rochon, Y., McLeod, S. D., Rinsland, C. P., and Bernath, P. F.: Retrievals for the Atmospheric Chemistry Experiment Fourier-Transform Spectrometer, Appl. Opt., 44, 7218–7231, https://doi.org/10.1364/AO.44.007218, 2005.
Boone, C. D., Walker, K. A., and Bernath, P. F.: Version 3 Retrievals for the Atmospheric Chemistry Experiment Fourier Transform Spectrometer (ACE-FTS), The Atmospheric Chemistry Experiment ACE at 10: A Solar Occultation Anthology, A. Deepak Publishing, Hampton, Virginia, USA, 103–127, ISBN 978-0-937194-54-9, 2013.
Boone, C. D., Bernath, P. F., Cok, D., Jones, S. C., and Steffen, J.: Version 4 retrievals for the Atmospheric Chemistry Experiment Fourier Transform Spectrometer (ACE-FTS) and imagers, J. Quant. Spectrosc. Ra., 247, 106939, https://doi.org/10.1016/j.jqsrt.2020.106939, 2020.
Bourassa, A. E., McLinden, C. A., Bathgate, A. F., Elash, B. J., and Degenstein, D. A.: Precision estimate for Odin-OSIRIS limb scatter retrievals, J. Geophys. Res., 117, D04303, https://doi.org/10.1029/2011JD016976, 2012.
Bourassa, A. E., Roth, C. Z., Zawada, D. J., Rieger, L. A., McLinden, C. A., and Degenstein, D. A.: Drift-corrected Odin-OSIRIS ozone product: algorithm and updated stratospheric ozone trends, Atmos. Meas. Tech., 11, 489–498, https://doi.org/10.5194/amt-11-489-2018, 2018.
Bourassa, A. E., Roth, C. Z., Zawada, D. J., Rieger, L. A., McLinden, C. A., and Degenstein, D. A.: OSIRIS Ozone, Zenodo [data set], https://doi.org/10.5281/zenodo.4532249, 2021.
Buehler, S. A., Eriksson, P., Kuhn, T., von Engeln, A., and Verdes, C.: ARTS, the Atmospheric Radiative Transfer Simulator. J. Quant. Spectrosc. Ra., 91, 65–93, https://doi.org/10.1016/j.jqsrt.2004.05.051, 2005.
Burrows, J. P., Dehn, A., Deters, B., Himmelmann, S., Richter, A., Voigt, S., and Orphal, J.: Atmospheric remote-sensing reference data from GOME: 1. Temperature-dependent absorption cross-sections of NO2 in the 231–794 nm range, J. Quant. Spectrosc. Ra., 60, 1025–1031, https://doi.org/10.1016/S0022-4073(97)00197-0, 1998.
Burrows, J. P., Weber, M., Buchwitz, M., Rozanov, V., Ladstätter-Weißenmayer, A., Richter, A., Debeek, R., Hoogen, R., Bramstedt, K., Eichmann, K.-U., Eisinger, M., and Perner, D.: The Global Ozone Monitoring Experiment (GOME): Mission Concept and First Scientific Results, J. Atmos. Sci., 56, 151–175, https://doi.org/10.1175/15200469(1999)056<0151:TGOMEG>2.0.CO;2, 1999.
Chahine, M. T.: Determination of the temperature profile in an atmosphere from its outgoing radiance, J. Opt. Soc. Am., 58, 1634, https://doi.org/10.1364/JOSA.58.001634, 1968.
Dee, D. P., Uppala, S. M., Simmons, A. J., Berrisford, P., Poli, P., Kobayashi, S., Andrae, U., Balmaseda, M. A., Balsamo, G., Bauer, P., Bechtold, P., Beljaars, A. C. M., van de Berg, L., Bidlot, J., Bormann, N., Delsol, C., Dragani, R., Fuentes, M., Geer, A. J., Haimberger, L., Healy, S. B., Hersbach, H., Hólm, E. V., Isaksen, L., Kållberg, P., Köhler, M., Matricardi, M., McNally, A. P., Monge-Sanz, B. M., Morcrette, J.-J., Park, B.-K., Peubey, C., de Rosnay, P., Tavolato, C., Thépaut, J.-N., and Vitart, F.: The ERA-Interim reanalysis: configuration and performance of the data assimilation system, Q. J. Roy. Meteorol. Soc., 137, 553–597, https://doi.org/10.1002/qj.828, 2011.
Degenstein, D. A., Bourassa, A. E., Roth, C. Z., and Llewellyn, E. J.: Limb scatter ozone retrieval from 10 to 60 km using a multiplicative algebraic reconstruction technique, Atmos. Chem. Phys., 9, 6521–6529, https://doi.org/10.5194/acp-9-6521-2009, 2009.
Dupuy, E., Walker, K. A., Kar, J., Boone, C. D., McElroy, C. T., Bernath, P. F., Drummond, J. R., Skelton, R., McLeod, S. D., Hughes, R. C., Nowlan, C. R., Dufour, D. G., Zou, J., Nichitiu, F., Strong, K., Baron, P., Bevilacqua, R. M., Blumenstock, T., Bodeker, G. E., Borsdorff, T., Bourassa, A. E., Bovensmann, H., Boyd, I. S., Bracher, A., Brogniez, C., Burrows, J. P., Catoire, V., Ceccherini, S., Chabrillat, S., Christensen, T., Coffey, M. T., Cortesi, U., Davies, J., De Clercq, C., Degenstein, D. A., De Mazière, M., Demoulin, P., Dodion, J., Firanski, B., Fischer, H., Forbes, G., Froidevaux, L., Fussen, D., Gerard, P., Godin-Beekmann, S., Goutail, F., Granville, J., Griffith, D., Haley, C. S., Hannigan, J. W., Höpfner, M., Jin, J. J., Jones, A., Jones, N. B., Jucks, K., Kagawa, A., Kasai, Y., Kerzenmacher, T. E., Kleinböhl, A., Klekociuk, A. R., Kramer, I., Küllmann, H., Kuttippurath, J., Kyrölä, E., Lambert, J.-C., Livesey, N. J., Llewellyn, E. J., Lloyd, N. D., Mahieu, E., Manney, G. L., Marshall, B. T., McConnell, J. C., McCormick, M. P., McDermid, I. S., McHugh, M., McLinden, C. A., Mellqvist, J., Mizutani, K., Murayama, Y., Murtagh, D. P., Oelhaf, H., Parrish, A., Petelina, S. V., Piccolo, C., Pommereau, J.-P., Randall, C. E., Robert, C., Roth, C., Schneider, M., Senten, C., Steck, T., Strandberg, A., Strawbridge, K. B., Sussmann, R., Swart, D. P. J., Tarasick, D. W., Taylor, J. R., Tétard, C., Thomason, L. W., Thompson, A. M., Tully, M. B., Urban, J., Vanhellemont, F., Vigouroux, C., von Clarmann, T., von der Gathen, P., von Savigny, C., Waters, J. W., Witte, J. C., Wolff, M., and Zawodny, J. M.: Validation of ozone measurements from the Atmospheric Chemistry Experiment (ACE), Atmos. Chem. Phys., 9, 287–343, https://doi.org/10.5194/acp-9-287-2009, 2009.
European Space Agency: Odin SMR Level 2 data products, Version 3, European Space Agency [data set], https://doi.org/10.5270/OD1-d98abd8, 2020.
Frisk, U., Hagström, M., Ala-Laurinaho, J., Andersson, S., Berges, J.-C., Chabaud, J.-P., Dahlgren, M., Emrich, A., Florén, H.-G., Florin, G., Fredrixon, M., Gaier, T., Haas, R., Hirvonen, T., Hjalmarsson, Å., Jakobsson, B., Jukkala, P., Kildal, P. S., Kollberg, E., Lassing, J., Lecacheux, A., Lehikoinen, P., Lehto, A., Mallat, J., Marty, C., Michet, D., Narbonne, J., Nexon, M., Olberg, M., Olofsson, A. O. H., Olofsson, G., Origné, A., Petersson, M., Piironen, P., Pons, R., Pouliquen, D., Ristorcelli, I., Rosolen, C., Rouaix, G., Räisänen, A. V., Serra, G., Sjöberg, F., Stenmark, L., Torchinsky, S., Tuovinen, J., Ullberg, C., Vinterhav, E., Wadefalk, N., Zirath, H., Zimmermann, P., and Zimmermann, R.: The Odin satellite. I. Radiometer design and test, Astron. Astrophys., 402, L27–L34, https://doi.org/10.1051/0004-6361:20030335, 2003.
Froidevaux, L., Jiang, Y. B., Lambert, A., Livesey, N. J., Read, W. G., Waters, J. W., Browell, E. V., Hair, J. W., Avery, M. A., McGee, T. J., Twigg, L. W., Sumnicht, G. K., Jucks, K. W., Margitan, J. J., Sen, B., Stachnik, R. A., Toon, G. C., Bernath, P. F., Boone, C. D., Walker, K. A., Filipiak, M. J., Harwood, R. S., Fuller, R. A., Manney, G. L., Schwartz, M. J., Daffer, W. H., Drouin, B. J., Cofield, R. E., Cuddy, D. T., Jarnot, R. F., Knosp, B. W., Perun, V. S., Snyder, W. V., Stek, P. C., Thurstans, R. P., and Wagner, P. A.: Validation of Aura Microwave Limb Sounder stratospheric ozone measurements, J. Geophys. Res.-Atmos., 113, D15S20, https://doi.org/10.1029/2007JD008771, 2008.
Fytterer, T., Mlynczak, M. G., Nieder, H., Pérot, K., Sinnhuber, M., Stiller, G., and Urban, J.: Energetic particle induced intra-seasonal variability of ozone inside the Antarctic polar vortex observed in satellite data, Atmos. Chem. Phys., 15, 3327–3338, https://doi.org/10.5194/acp-15-3327-2015, 2015.
GCOS: Systematic Observation Requirements for Satellite-based Products for Climate, 2011 update, available at: https://library.wmo.int/doc_num.php?explnum_id=3710 (last access: 25 November 2021), 2011.
Gordon, I. E., Rothman, L. S., Hill, C., Kochanov, R. V., Tan, Y., Bernath, P. F., Birk, M., Boudon, V., Campargue, A., Chance, K. V., Drouin, B. J., Flaud, J.-M., Gamache, R. R., Hodges, J. T., Jacquemart, D., Perevalov, V. I., Perrin, A., Shine, K. P., Smith, M.-A. H., Tennyson, J., Toon, G. C., Tran, H., Tyuterev, V. G., Barbe, A., Császár, A. G., Devi, V. M., Furtenbacher, T., Harrison, J. J., Hartmann, J.-M., Jolly, A., Johnson, T. J., Karman, T., Kleiner, I., Kyuberis, A. A., Loos, J., Lyulin, O. M., Massie, S. T., Mikhailenko, S. N., Moazzen-Ahmadi, N., Müller, H. S. P., Naumenko, O. V., Nikitin, A. V., Polyansky, O. L., Rey, M., Rotger, M., Sharpe, S. W., Sung, K., Starikova, E., Tashkun, S. A., Vander Auwera, J., Wagner, G., Wilzewski, J., Wcisło, P., Yu, S., and Zak, E. J.: The HITRAN2016 molecular spectroscopic database, J. Quant. Spectrosc. Ra., 203, 3–69, https://doi.org/10.1016/j.jqsrt.2017.06.038, 2017.
Harris, N. R. P., Hassler, B., Tummon, F., Bodeker, G. E., Hubert, D., Petropavlovskikh, I., Steinbrecht, W., Anderson, J., Bhartia, P. K., Boone, C. D., Bourassa, A., Davis, S. M., Degenstein, D., Delcloo, A., Frith, S. M., Froidevaux, L., Godin-Beekmann, S., Jones, N., Kurylo, M. J., Kyrölä, E., Laine, M., Leblanc, S. T., Lambert, J.-C., Liley, B., Mahieu, E., Maycock, A., de Mazière, M., Parrish, A., Querel, R., Rosenlof, K. H., Roth, C., Sioris, C., Staehelin, J., Stolarski, R. S., Stübi, R., Tamminen, J., Vigouroux, C., Walker, K. A., Wang, H. J., Wild, J., and Zawodny, J. M.: Past changes in the vertical distribution of ozone – Part 3: Analysis and interpretation of trends, Atmos. Chem. Phys., 15, 9965–9982, https://doi.org/10.5194/acp-15-9965-2015, 2015.
Hubert, D., Lambert, J.-C., Verhoelst, T., Granville, J., Keppens, A., Baray, J.-L., Bourassa, A. E., Cortesi, U., Degenstein, D. A., Froidevaux, L., Godin-Beekmann, S., Hoppel, K. W., Johnson, B. J., Kyrölä, E., Leblanc, T., Lichtenberg, G., Marchand, M., McElroy, C. T., Murtagh, D., Nakane, H., Portafaix, T., Querel, R., Russell III, J. M., Salvador, J., Smit, H. G. J., Stebel, K., Steinbrecht, W., Strawbridge, K. B., Stübi, R., Swart, D. P. J., Taha, G., Tarasick, D. W., Thompson, A. M., Urban, J., van Gijsel, J. A. E., Van Malderen, R., von der Gathen, P., Walker, K. A., Wolfram, E., and Zawodny, J. M.: Ground-based assessment of the bias and long-term stability of 14 limb and occultation ozone profile data records, Atmos. Meas. Tech., 9, 2497–2534, https://doi.org/10.5194/amt-9-2497-2016, 2016.
Jiang, Y. B., Froidevaux, L., Lambert, A., Livesey, N. J., Read, W. G., Waters, J. W., Bojkov, B., Leblanc, T., McDermid, I. S., Godin-Beekmann, S., Filipiak, M. J., Harwood, R. S., Fuller, R. A., Daffer, W. H., Drouin, B. J., Cofield, R. E., Cuddy, D. T., Jarnot, R. F., Knosp, B. W., Perun, V. S., Schwartz, M. J., Snyder, W. V., Stek, P. C., Thurstans, R. P., Wagner, P. A., Allaart, M., Andersen, S. B., Bodeker, G., Calpini, B., Claude, H., Coetzee, G., Davies, J., De Backer, H., Dier, H., Fujiwara, M., Johnson, B., Kelder, H., Leme, N. P., König-Langlo, G., Kyro, E., Laneve, G., Fook, L. S., Merrill, J., Morris, G., Newchurch, M., Oltmans, S., Parrondos, M. C., Posny, F., Schmidlin, F., Skrivankova, P., Stubi, R., Tarasick, D., Thompson, A., Thouret, V., Viatte, P., Vömel, H., von Der Gathen, P., Yela, M., and Zablocki, G.: Validation of Aura Microwave Limb Sounder Ozone by ozonesonde and lidar measurements, J. Geophys. Res.-Atmos., 112, D24S34, https://doi.org/10.1029/2007JD008776, 2007.
Jones, A., Murtagh, D., Urban, J., Eriksson, P., and Rosevall, J.: Intercomparison of Odin/SMR ozone measurements with MIPAS and balloonsonde data, Can. J. Phys., 85, 1111–1123, https://doi.org/10.1139/P07-118, 2007.
Kar, J., McElroy, T., Drummond, J. R., Zou, J., Nichitiu, F., Walker, K. A., Randall, C. E., Nowlan, C. R., Dufour, D. G., Boone, C. D., Bernath, P. F., Trepte, C. R., Thomason, L. W., and McLinden, C.: Initial comparison of ozone and NO2 profiles from ACE-MAESTRO with balloon and satellite data, J. Geophys. Res., 112, D16301, https://doi.org/10.1029/2006JD008242, 2007.
Livesey, N. J. and Read, W. G.: Direct retrieval of line-of-sight atmospheric structure from limb sounding observations, Geophys. Res. Lett., 27, 891–894, https://doi.org/10.1029/1999GL010964, 2000.
Livesey, N. J., Van Snyder, W., Read, W. G., and Wagner, P. A.: Retrieval algorithms for the EOS Microwave Limb Sounder (MLS), IEEE Trans. Geosci. Remote Sens., 44, 1144–1155, https://doi.org/10.1109/TGRS.2006.872327, 2006.
Livesey, N. J., Filipiak, M. J., Froidevaux, L., Read, W. G., Lambert, A., Santee, M. L., Jiang, J. H., Pumphrey, H. C., Waters, J. W., Cofield, R. E., Cuddy, D. T., Daffer, W. H., Drouin, B. J., Fuller, R. A., Jarnot, R. F., Jiang, Y. B., Knosp, B. W., Li, Q. B., Perun, V. S., Schwartz, M. J., Snyder, W. V., Stek, P. C., Thurstans, R. P., Wagner, P. A., Avery, M., Browell, E. V., Cammas, J.-P., Christensen, L. E., Diskin, G. S., Gao, R.-S., Jost, H.-J., Loewenstein, M., Lopez, J. D., Nedelec, P., Osterman, G. B., Sachse, G. W., and Webster, C. R.: Validation of Aura Microwave Limb Sounder O3 and CO observations in the upper troposphere and lower stratosphere, J. Geophys. Res.-Atmos., 113, D15S02, https://doi.org/10.1029/2007JD008805, 2008.
Livesey, N. J., Read, W. G., Wagner, P. A., Froidevaux, L., Santee, M. L., Schwartz, M. J., Lambert, A., Millan Valle, L. F., Pumphrey, H. C., Manney, G. L., Fuller, R. A., Jarnot, R. F., Knosp, B. W., and Lay, R. R.: Version 5.0x Level 2 and 3 data quality and description document, Rev. A, Jet Propulsion Laboratory, Pasadena, CA USA, available at: http://mls.jpl.nasa.gov, last access: 27 January 2022.
Llewellyn, E. J., Lloyd, N. D., Degenstein, D. A., Gattinger, R. L., Petelina, S. V., Bourassa, A. E., Wiensz, J. T., Ivanov, E. V., McDade, I. C., Solheim, B. H., McConnell, J. C., Haley, C. S., von Savigny, C., Sioris, C. E., McLinden, C. A., Griffioen, E., Kaminski, J., Evans, W. F. J., Puckrin, E., Strong, K., Wehrle, V., Hum, R. H., Kendall, D. J. W., Matsushita, J., Murtagh, D. P., Brohede, S., Stegman, J., Witt, G., Barnes, G., Payne, W. F., Piché, L., Smith, K., Warshaw, G., Deslauniers, D. L., Marchand, P., Richardson, E. H., King, R.A., Wevers, I., McCreath, W., Kyrola, E., Oikarinen, L., Leppelmeier, G. W., Auvinen, H., Mégie, G., Hauchecorne, A., Lefèvre, F., de La Nöe, J., Ricaud, P., Frisk, U., Sjoberg, F., von Schéele, F., and Nordh, L.: The OSIRIS instrument on the Odin spacecraft, Can. J. Phys., 82, 411–422, https://doi.org/10.1139/P04-005, 2004.
MAESTRO: Level 2 Data, Version 3.13, MAESTRO [data set], available at: https://databace.scisat.ca/level2/, last access: 2 March 2022.
McElroy, C. T., Nowlan, C., Drummond, J., Bernath, P., Barton, D., Dufour, D., Midwinter, C., Hall, R., Ogyu, A., Ullberg, A., Wardle, D., Kar, J., Zou, J., Nichitiu, F., Boone, C., Walker, K., and Rowlands, N.: The ACE-MAESTRO instrument on SCISAT: description, performance, and preliminary results, Appl. Opt. 46, 4341–4356, https://doi.org/10.1364/AO.46.004341, 2007.
Murtagh, D., Frisk, U., Merino, F., Ridal, M., Jonsson, A., Stegman, J., Witt, G., Eriksson, P., Jiménez, C., Megie, G., de la Noë, J., Ricaud, P., Baron, P., Pardo, J. R., Hauchcorne, A., Llewellyn, E. J., Degenstein, D. A., Gattinger, R. L., Lloyd, N. D., Evans, W. F. J., McDade, I. C., Haley, C. S., Sioris, C., von Savigny, C., Solheim, B. H., McConnell, J. C., Strong, K., Richardson, E. H., Leppelmeier, G. W., Kyrölä, E., Auvinen, H., and Oikarinen, L.: An overview of the Odin atmospheric mission, Can. J. Phys. 80, 309–319, https://doi.org/10.1139/P01-157, 2002.
Pickett, H. M., Poynter, R. L., Cohen, E. A., Delitsky, M. L., Pearson, J. C., and Müller, H. S. P.: Submillimeter, millimeter, and microwave spectral line catalogue, J. Quant. Spectrosc. Ra., 60, 883–890, https://doi.org/10.1016/S0022-4073(98)00091-0, 1998.
Rahpoe, N., Weber, M., Rozanov, A. V., Weigel, K., Bovensmann, H., Burrows, J. P., Laeng, A., Stiller, G., von Clarmann, T., Kyrölä, E., Sofieva, V. F., Tamminen, J., Walker, K., Degenstein, D., Bourassa, A. E., Hargreaves, R., Bernath, P., Urban, J., and Murtagh, D. P.: Relative drifts and biases between six ozone limb satellite measurements from the last decade, Atmos. Meas. Tech., 8, 4369–4381, https://doi.org/10.5194/amt-8-4369-2015, 2015.
Rodgers, C. D.: Inverse Methods for Atmospheric Sounding, World Sci., Hackensack, New Jersey, USA, ISBN 978-981-02-2740-1, 2008.
Rong, P. P., Russell III, J. M., Mlynczak, M. G., Remsberg, E. E., Marshall, B. T., Gordley, L. L., and López-Puertas, M.: Validation of Thermosphere Ionosphere Mesosphere Energetics and Dynamics/Sounding of the Atmosphere using Broadband Emission Radiometry (TIMED/SABER) v1.07 ozone at 9.6 µm in altitude range 15–70 km, J. Geophys. Res., 114, D04306, https://doi.org/10.1029/2008JD010073, 2009.
Roth, C. Z., Degenstein, D. A., Bourassa, A. E., and Llewellyn, E.J.: The retrieval of vertical profiles of the ozone number density using Chappuis band absorption information and a multiplicative algebraic reconstruction technique, Can. J. Phys., 85, 1225–1243, https://doi.org/10.1139/P07-130, 2007.
Rothman, L. S., Jacquemart, D., Barbe, A., Benner, C. D., Birk, M., Browne, L. R., Carleer, M. R., Chackerian Jr., C., Chance, K., Coudert, L. H., Dana, V., Devi, V. M., Flaud, J.-M., Gamache, R. R., Goldman, A., Hartmann, J.-M., Jucks, K. W., Maki, A. G., Mandin, J.-Y., Massien, S. T., Orphal, J., Perrin, A., Rinsland, C. P., Smith, M. A. H., Tennyson, J., Tolchenov, R. N., Toth, R. A., Vander Auwera, J., Varanasiq, P., and Wagner, G.: The HITRAN 2004 molecular spectroscopic database, J. Quant. Spectrosc. Ra., 96, 139–204, https://doi.org/10.1016/j.jqsrt.2004.10.008, 2005.
Russell III, J. M., Mlynczak, M. G., Gordley, L. L., Tansock, J., and Esplin, R.: An overview of the SABER experiment and preliminary calibration results, Proc. SPIE, 3756, 277–288, https://doi.org/10.1117/12.366382, 1999.
SABER: Level 2 Data, Version 2, SABER [data set], available at: ftp://saber.gats-inc.com/, last access: 2 March 2022.
Sagi, K. and Murtagh, D.: A long term study of polar ozone loss derived from data assimilation of Odin/SMR observations, Atmos. Chem. Phys. Discuss. [preprint], https://doi.org/10.5194/acp-2016-352, in review, 2016.
Sagi, K., Pérot, K., Murtagh, D., and Orsolini, Y.: Two mechanisms of stratospheric ozone loss in the Northern Hemisphere, studied using data assimilation of Odin/SMR atmospheric observations, Atmos. Chem. Phys., 17, 1791–1803, https://doi.org/10.5194/acp-17-1791-2017, 2017.
Schwartz, M., Froidevaux, L., Livesey, N., and Read, W.: MLS/Aura Level 2 Ozone (O3) Mixing Ratio V005, Greenbelt, MD, USA, Goddard Earth Sciences Data and Information Services Center (GES DISC) [data set], https://doi.org/10.5067/Aura/MLS/DATA2516, 2020.
Sheese, P. and Walker, K.: Data Quality Flags for ACE-FTS Level 2 Version 4.1/4.2 Data Set, Scholars Portal Dataverse, V2 [data set], https://doi.org/10.5683/SP2/BC4ATC, 2020.
Sheese, P. and Walker, K.: Code used for Assessment of the quality of ACE-FTS stratospheric ozone data, Scholars Portal Dataverse, V1 [code], https://doi.org/10.5683/SP3/TDCB7J, 2022.
Sheese, P. E., Boone, C. D., and Walker, K. A.: Detecting physically unrealistic outliers in ACE-FTS atmospheric measurements, Atmos. Meas. Tech., 8, 741–750, https://doi.org/10.5194/amt-8-741-2015, 2015.
Sheese, P. E., Walker, K. A., Boone, C. D., McLinden, C. A., Bernath, P. F., Bourassa, A. E., Burrows, J. P., Degenstein, D. A., Funke, B., Fussen, D., Manney, G. L., McElroy, C. T., Murtagh, D., Randall, C. E., Raspollini, P., Rozanov, A., Russell III, J. M., Suzuki, M., Shiotani, M., Urban, J., von Clarmann, T., and Zawodny, J. M.: Validation of ACE-FTS version 3.5 NOy species profiles using correlative satellite measurements, Atmos. Meas. Tech., 9, 5781–5810, https://doi.org/10.5194/amt-9-5781-2016, 2016.
Sheese, P. E., Walker, K. A., Boone, C. D., Bernath, P. F., Froidevaux, L., Funke, B., Raspollini, P., and von Clarmann, T.: ACE-FTS ozone, water vapour, nitrous oxide, nitric acid, and carbon monoxide profile comparisons with MIPAS and MLS, J. Quant. Spectrosc. Ra., 186, 63–80, https://doi.org/10.1016/j.jqsrt.2016.06.026, 2017.
Sheese, P. E., Walker, K. A., Boone, C. D., Degenstein, D. A., Kolonjari, F., Plummer, D., Kinnison, D. E., Jöckel, P., and von Clarmann, T.: Model estimations of geophysical variability between satellite measurements of ozone profiles, Atmos. Meas. Tech., 14, 1425–1438, https://doi.org/10.5194/amt-14-1425-2021, 2021.
SPARC/IO3C/GAW: SPARC/IO3C/GAW report on Long-term Ozone Trends and Uncertainties in the Stratosphere, edited by: Petropavlovskikh, I., Godin-Beekmann, S., Hubert, D., Damadeo, R., Hassler, B., and Sofieva, V., SPARC Report No. 9, WCRP-17/2018, GAW Report No. 241, https://doi.org/10.17874/f899e57a20b, 2019.
Street, J. O., Carroll, R. J., and Ruppert, D.: A Note on Computing Robust Regression Estimates Via Iteratively Reweighted Least Squares, Am. Stat., 42, 152–154, https://doi.org/10.1080/00031305.1988.10475548, 1988.
Szeląg, M. E., Sofieva, V. F., Degenstein, D., Roth, C., Davis, S., and Froidevaux, L.: Seasonal stratospheric ozone trends over 2000–2018 derived from several merged data sets, Atmos. Chem. Phys., 20, 7035–7047, https://doi.org/10.5194/acp-20-7035-2020, 2020.
Urban, J., Lautié, N., Le Flochmoën, E., Jiménez, C., Eriksson, P., de La Noë, J., Dupuy, E., El Amraoui, L., Frisk, U., Jégou, F., Murtagh, D., Olberg, M., Ricaud, P., Camy-Peyret, C., Dufour, G., Payan, S., Huret, N., Pirre, M., Robinson, A. D., Harris, N. R. P., Bremer, H., Kleinböhl, A., Küllmann, K., Künzi, K., Kuttippurath, J., Ejiri, M. K., Nakajima, H., Sasano, Y., Sugita, T., Yokota, T., Piccolo, C., Raspollini, P., and Ridolfi, M.: Odin/SMR limb observations of stratospheric trace gases: Level 2 processing of ClO, N2O, HNO3, and O3, J. Geophys. Res., 110, D14307, https://doi.org/10.1029/2004JD005741, 2005.
van Weele, M.: Ozone_cci, User Requirement Document (URD), Tech. rep. v3.0, KNMI, available at: https://climate.esa.int/sites/default/files/filedepot/incoming/Ozone_cci_urd_v3.0_final.pdf (last access: 8 December 2020), 2016.
Waters, J. W., Froidevaux, L., Harwood, R. S., Jarnot, R. F., Pickett, H. M., Read, W. G., Siegel, P. H., Cofield, R. E., Filipiak, M. J., Flower, D. A., Holden, J. R., Lau, G. K., Livesey, N. J., Manney, G. L., Pumphrey, H. C., Santee, M. L., Wu, D. L., Cuddy, D. T., Lay, R. R., Loo, M. S., Perun, V. S., Schwartz, M. J., Stek, P. C., Thurstans, R. P., Boyles, M. A., Chandra, K. M., Chavez, M. C., Chen, G. S., Chudasama, B. V., Dodge, R., Fuller, R. A., Girard, M. A., Jiang, J. H., Jiang, Y. B., Knosp, B. W., LaBelle, R. C., Lam, J. C., Lee, K. A., Miller, D., Oswald, J. E., Patel, N. C., Pukala, D. M., Quintero, O., Scaff, D. M., Van Snyder, W., Tope, M. C., Wagner, P. A., and Walch, M. J.: The Earth observing system microwave limb sounder (EOS MLS) on the Aura Satellite, IEEE Trans. Geosci. Remote Sens., 44, 1075–1092, https://doi.org/10.1109/TGRS.2006.873771, 2006.
WMO: Scientific Assessment of Ozone Depletion: 2018, Global Ozone Research and Monitoring Project – Report No. 58, available at: https://ozone.unep.org/sites/default/files/2019-05/SAP-2018-Assessment-report.pdf (last access: 5 July 2021), 2018.