the Creative Commons Attribution 4.0 License.
the Creative Commons Attribution 4.0 License.
 | 16 Mar 2022
Ozone formation sensitivity study using machine learning coupled with the reactivity of volatile organic compound species
Junlei Zhan
Wei Ma
Xin Zhang
Xuezhong Wang
Fang Bi
Yujie Zhang
Zhenhai Wu
Hong Li
The formation of ground-level ozone (O3) is dependent on both atmospheric chemical processes and meteorological factors. In this study, a random forest (RF) model coupled with the reactivity of volatile organic compound (VOC) species was used to investigate the O3 formation sensitivity in Beijing, China, from 2014 to 2016, and evaluate the relative importance (RI) of chemical and meteorological factors to O3 formation. The results showed that the O3 prediction performance using concentrations of measured/initial VOC species () was better than that using total VOC (TVOC) concentrations (R2=0.77). Meanwhile, the RIs of initial VOC species correlated well with their O3 formation potentials (OFPs), which indicate that the model results can be partially explained by the maximum incremental reactivity (MIR) method. O3 formation presented a negative response to nitrogen oxides (NOx) and relative humidity (RH), and a positive response to temperature (T), solar radiation (SR), and VOCs. The O3 isopleth calculated by the RF model was generally comparable with those calculated by the box model. O3 formation shifted from a VOC-limited regime to a transition regime from 2014 to 2016. This study demonstrates that the RF model coupled with the initial concentrations of VOC species could provide an accurate, flexible, and computationally efficient approach for O3 sensitivity analysis.
- Article
(4002 KB) - Full-text XML
-
Supplement
(9539 KB) - BibTeX
- EndNote


Ground-level ozone (O3) pollution, which can cause adverse human health effects such as cardiovascular and respiratory diseases, has received increasing attention in recent decades (Cohen et al., 2017). Oxidation of volatile organic compounds (VOCs) will produce peroxyl radicals (RO2) and hydroperoxyl radicals (HO2). The can accelerate the conversion from NO to NO2, subsequently, formation of O3 by photolysis of NO2 in the presence of O2 (T. Wang et al., 2017). The production and loss of RO2 and HO2 are highly dependent on the concentration ratio of VOCs and NOx in the atmosphere. Hence, atmospheric O3 concentrations or production rates show a nonlinear relationship with VOCs and NOx. Moreover, the O3–VOC–NOx sensitivity is readily influenced by VOC species (Tan et al., 2018), meteorological parameters (H. Liu et al., 2020; Liu and Wang, 2020), and even atmospheric particulate matter (Li et al., 2019), thus, exhibiting high temporal and spatial variability. Therefore, it is urgent to develop an accurate and highly efficient method for timely assessing the sensitivity regime of O3 production and evaluating the effectiveness of a potential measure on O3 pollution control. The sensitivity of O3 formation can usually be analyzed using observed indicators, such as ozone production efficiency (OPE, ) (Wang et al., 2010; Lin et al., 2011), (Martin et al., 2004), and (or ) (Sillman 1995; Hammer et al., 2002; T. Wang et al., 2017), observation-based model (OBM) (Vélez-Pereira et al., 2021) and chemical transport models including community multiscale air quality (CMAQ) (Djalalova et al., 2015) and Weather Research and Forecasting with Chemistry (WRF-Chem) model (P. Wang et al., 2020).
The observed indicators can be utilized to quickly diagnose the sensitivity regime of O3 production. However, the accuracy is sensitive to the precision of tracer measurements. OBMs combine in situ field observations, remote sensing measurements, and chemical box models, which are built on widely used chemistry mechanisms (e.g., MCM, Carbon Bond, RACM or SAPRC) and applied to the observed atmospheric conditions to simulate the in situ O3 production rate (Mo et al., 2018). The sensitivity of O3 production to various O3 precursors, including NOx and VOCs, can be diagnosed based on the empirical kinetic modeling approach (EKMA) or quantitatively assessed with the relative incremental reactivity (RIR). Chemical transport models, which are driven by meteorological dynamics and incorporated with the emissions of pollutants and the complex atmospheric chemical mechanism, provide a powerful tool for simulating various atmospheric processes, including spatial distribution, regional transport vs. local formation, source apportionment and production rates of pollutants, and so on (Sayeed et al., 2021). At present, OBMs are widely used to investigate O3 formation sensitivity in China. Previous studies indicated that O3 formation in urban areas of China is located in a VOC-limited or a transition regime and varies with time and location (Ou et al., 2016; T. Wang et al., 2017; Zhan et al., 2021). Although both OBMs and chemical transport models can assess the sensitivity of O3 production and predict the O3 pollution level in a scenario of control measures, the calculation accuracy is affected by the uncertainty of input parameters (Tang et al., 2011; L. Yang et al., 2021). Thus, they are mostly applied to sampling cases with a short time span (days or weeks) (Xue et al., 2014; Ou et al., 2016).
Compared to traditional methods, machine learning (ML) is able to capture the main factors affecting atmospheric O3 formation in a timely manner with great flexibility (without the constraints of time and space) and high computational efficiency (Y. Wang et al., 2020b; Grange et al., 2021; J. Yang et al., 2021). Although attention should be paid to the robustness of machine learning because it depends on the input dataset (observations or outputs of chemical transport models), previous studies have demonstrated that cross-validation and data normalization can well reduce the dependence of the model on input data and improve the robustness of the model (Y. Wang et al., 2016, 2017; Liu et al., 2021; R. Ma et al., 2021). Thus, it is a promising alternative to account for the effects of meteorology on air pollutants and has been intensively used in atmospheric studies (H. Liu et al., 2020; Hou et al., 2022).
Recently, ML based on convolutional neural network (CNN), random forest (RF), and artificial neural network (ANN) models have been applied in simulating atmospheric O3 and shown good performance in O3 prediction (Ma et al., 2020; Xing et al., 2020). For example, R. Ma et al. (2021) simulated O3 concentrations in the Beijing–Tianjin–Hebei (BTH) region from 2010–2017 using an RF model that considered meteorological variables and output variables from chemical transport models, and the correlation coefficient (R2) between the observed and modeled O3 concentrations was greater than 0.8. Liu et al. (2021) also reported a high accuracy (80.4 %) for classifying pollution levels of O3 and fine particulate matter with aerodynamic diameters less than 2.5 µm (PM2.5) at 1464 monitoring sites in China using an RF model. Thus, the RF model has shown good performance in terms of prediction accuracy and computational efficiency (Y. Wang et al., 2016, 2017).
Although ML is widely used to understand air pollution, many ML studies have used total VOCs (TVOCs) to simulate O3 formation and rarely considered the effect of VOC species on O3 formation sensitivity (Feng et al., 2019; Liu et al., 2021; R. Ma et al., 2021). Thus, they were unable to identify the chemical reactivity of a single species to O3 formation, which may lead to underestimations or even misunderstandings of the role of VOCs in O3 formation because the same concentration of TVOCs with different compositions may lead to different OPEs. In addition, VOCs react with OH radicals during atmospheric transport, which is the most important sink of VOCs (di Carlo et al., 2004; Y. Liu et al., 2020). Makar et al. (1999) reported that the isoprene emissions were underestimated by up to 40 % if the OH oxidation is not considered. Other studies indicated that the initial concentrations of VOCs, which account for the photochemical loss of VOCs during transport, were more representative of pollution levels in the sampling area than the observed VOCs (Yuan et al., 2013; Zhan et al., 2021). However, whether the ML model can identify the connection between the reactivity of VOC species and O3 formation sensitivity has not been clarified.
It should be noted that physical interpretability of the results is an important question when ML models are applied in atmospheric studies (Hou et al., 2022). However, explanations of ML results (e.g., RI) are somewhat vague because ML is a “black-box” model from the point view of chemical mechanism (Hou et al., 2022; Taoufik et al., 2022). In this study, we used the RF model to evaluate the prediction performance of atmospheric O3 using the TVOCs, measured VOC species, and photochemical initial concentration (PIC) of VOC species, which is calculated based on the photochemical-age approach (Shao et al., 2011). We compared the relative importance (RI) of the precursors (VOC species, NOx, PM2.5, CO) and the meteorological parameters (temperature, solar radiation, relative humidity, wind speed, and direction) on O3 formation in the summer of Beijing from 2014 to 2016. We also discussed the possibility of connecting the RIs of VOCs with their O3 formation potentials (OFPs) and the changes in O3–VOC–NOx sensitivity based on the RF model from 2014 to 2016. Our study indicates that the RF model combined with initial concentrations of VOC species can simulate O3 concentrations well and provides a flexible and efficient tool for O3 modeling in a near-real-time way.
2.1 Sampling site and data
The sampling site (40.04∘ N, 116.42∘ E) is located at the campus of Chinese Research Academy of Environmental Sciences and was described in our previous work (Zhang et al., 2021). Briefly, the station is located 2 km from the north 4th Ring Road and surrounded by a mixed residential and commercial area. The concentrations of VOCs, NOx, CO, O3, and PM2.5 were measured at 8 m above ground level at this location. Meteorological parameters, including temperature (T), relative humidity (RH), wind speed and direction (WS&WD), and solar radiation (SR), were monitored at 15 m above ground level. VOCs were measured by an online commercial instrument (GC-866, Chromatotec, France), which consisted of two independent analyzers for detecting C2–C6 and C6–C12 hydrocarbon components. More details about the observations can be found in the Supplement (Sect. S1). The calculation of initial VOCs and sensitivity tests can be found in Sect. S2
2.2 Random forest model
The random forest (RF) is a type of ensemble decision tree that can be used for classification and regression (Breiman, 2001). In this work, we performed O3 and RI calculations using the RF method in MATLAB's Statistics and Machine Learning Toolbox. During the training process, the model creates a large number of different decision trees with different sample sets at each node and then averages the results of all decision trees as its final results (Breiman, 2001). To avoid over-fitting, we trained the random forest model using cross-validation for the normalized data, which can improve the robustness of the model. Briefly, we randomly divided the normalized data into 12 subsets, then alternately took one subset as testing data along with the rest as training data. By doing this, every data point has an equal chance of being trained and tested. The length of the input data from 2014 to 2016 was 1190, 1062, and 872 rows, respectively, in which different types of VOCs, NOx, CO, PM2.5, and meteorological parameters (including temperature, relative humidity, solar radiation, wind speed and direction) were used as input variables and O3 as output variables. The mean values (± standard deviation) of input/output parameters are shown in Table S1 in the Supplement. Approximately of the samples are excluded from the sample, when the decision tree is built and used to calculate the out-of-bag data error. Hence, RF can evaluate the RI of variables via the changes in out-of-bag (OOB) data error (Svetnik et al., 2003),
where N represents the number of decision trees, and errOOB1 and errOOB2 represent the out-of-bag data error of feature i before and after randomly permuting the observation, respectively. The RIi is used to evaluate the importance and sensitivity of feature i to O3 formation in this study. More details about workflow of RF model and the hyperparameter tuning can be found in Sect. S3. The optimized parameters are shown in Table S2. To verify the stability of the model, we performed a significance test on the model results. The results showed that there was no significant difference among the different tests (P>0.05, R2>0.98).
When plotting the O3 formation sensitivity curves, we made a virtual matrix of inputs by varying the concentrations of NOx and VOCs from 0.9 to 1.1 times (with a step of 0.01) of their mean values while keeping all other inputs unchanged (i.e., the mean values). Then, the new matrix was used as testing data, while all the measured data were taken as training data. Thus, the testing data should represent the mean sensitivity regime of O3 in Beijing, while the training data actually covered all the sensitivity regimes of O3 formation to guarantee a sufficient coverage in the NOx-limited regime for the RF model simulations. The EKMA curves were plotted using the daily maximum 8 h (MDA8) O3. More details can be found in the Supplement.
3.1 Overview of air pollutants and meteorological conditions
Figure 1 shows the time series of air pollutants and meteorological parameters during the observations from 2014 to 2016. In 2014, 2015, and 2016, the wind direction was dominated by northwest winds (Fig. S1 in the Supplement), with mean wind speeds of 3.1±2.7, 2.3±2.2, and 1.3±1.2 m s−1, respectively, and the mean daytime temperatures were 22.3±5.8, 23.9±5.0, and 24.0±4.4 ∘C, respectively. The average value of SR decreased from 162.9 to 150.8 W m−2 during the observation period. As shown in Fig. 1f–g, in 2014, 2015, and 2016, the mean VOC concentrations were 20.3±10.9, 15.8±8.3, and 12.1±7.7 ppbv, respectively, while the mean initial VOC concentrations were 28.1±25.7, 27.2±32.6, and 16.4±16.1 ppbv, respectively. Both the measured VOCs and initial VOCs showed a decline along with a decrease in PM2.5 concentration from 67.2±53.5 to 61.1±48.6 µg m−3 due to the Air Pollution Prevention and Control Action Plan in China (Zhao et al., 2021). However, O3 concentrations showed a slight downward trend from 44.3±32.4 to 42.7±27.9 ppbv from 2014 to 2015 and then reach to 44.0±29.6 ppbv in 2016. A slight upward trend was observed for NOx concentrations (Fig. S2). As shown in Fig. 1f–g, the concentrations of four types (alkanes, alkenes, alkynes, and aromatics) of VOCs showed significant differences from 2014 to 2016 due to the variations in emission sources (Zhang et al., 2021). In addition to VOC species, the variations in other parameters, such as meteorological conditions and PM2.5, should have a complex influence on O3–VOC–NOx sensitivity (Li et al., 2019; S. Ma et al., 2021).
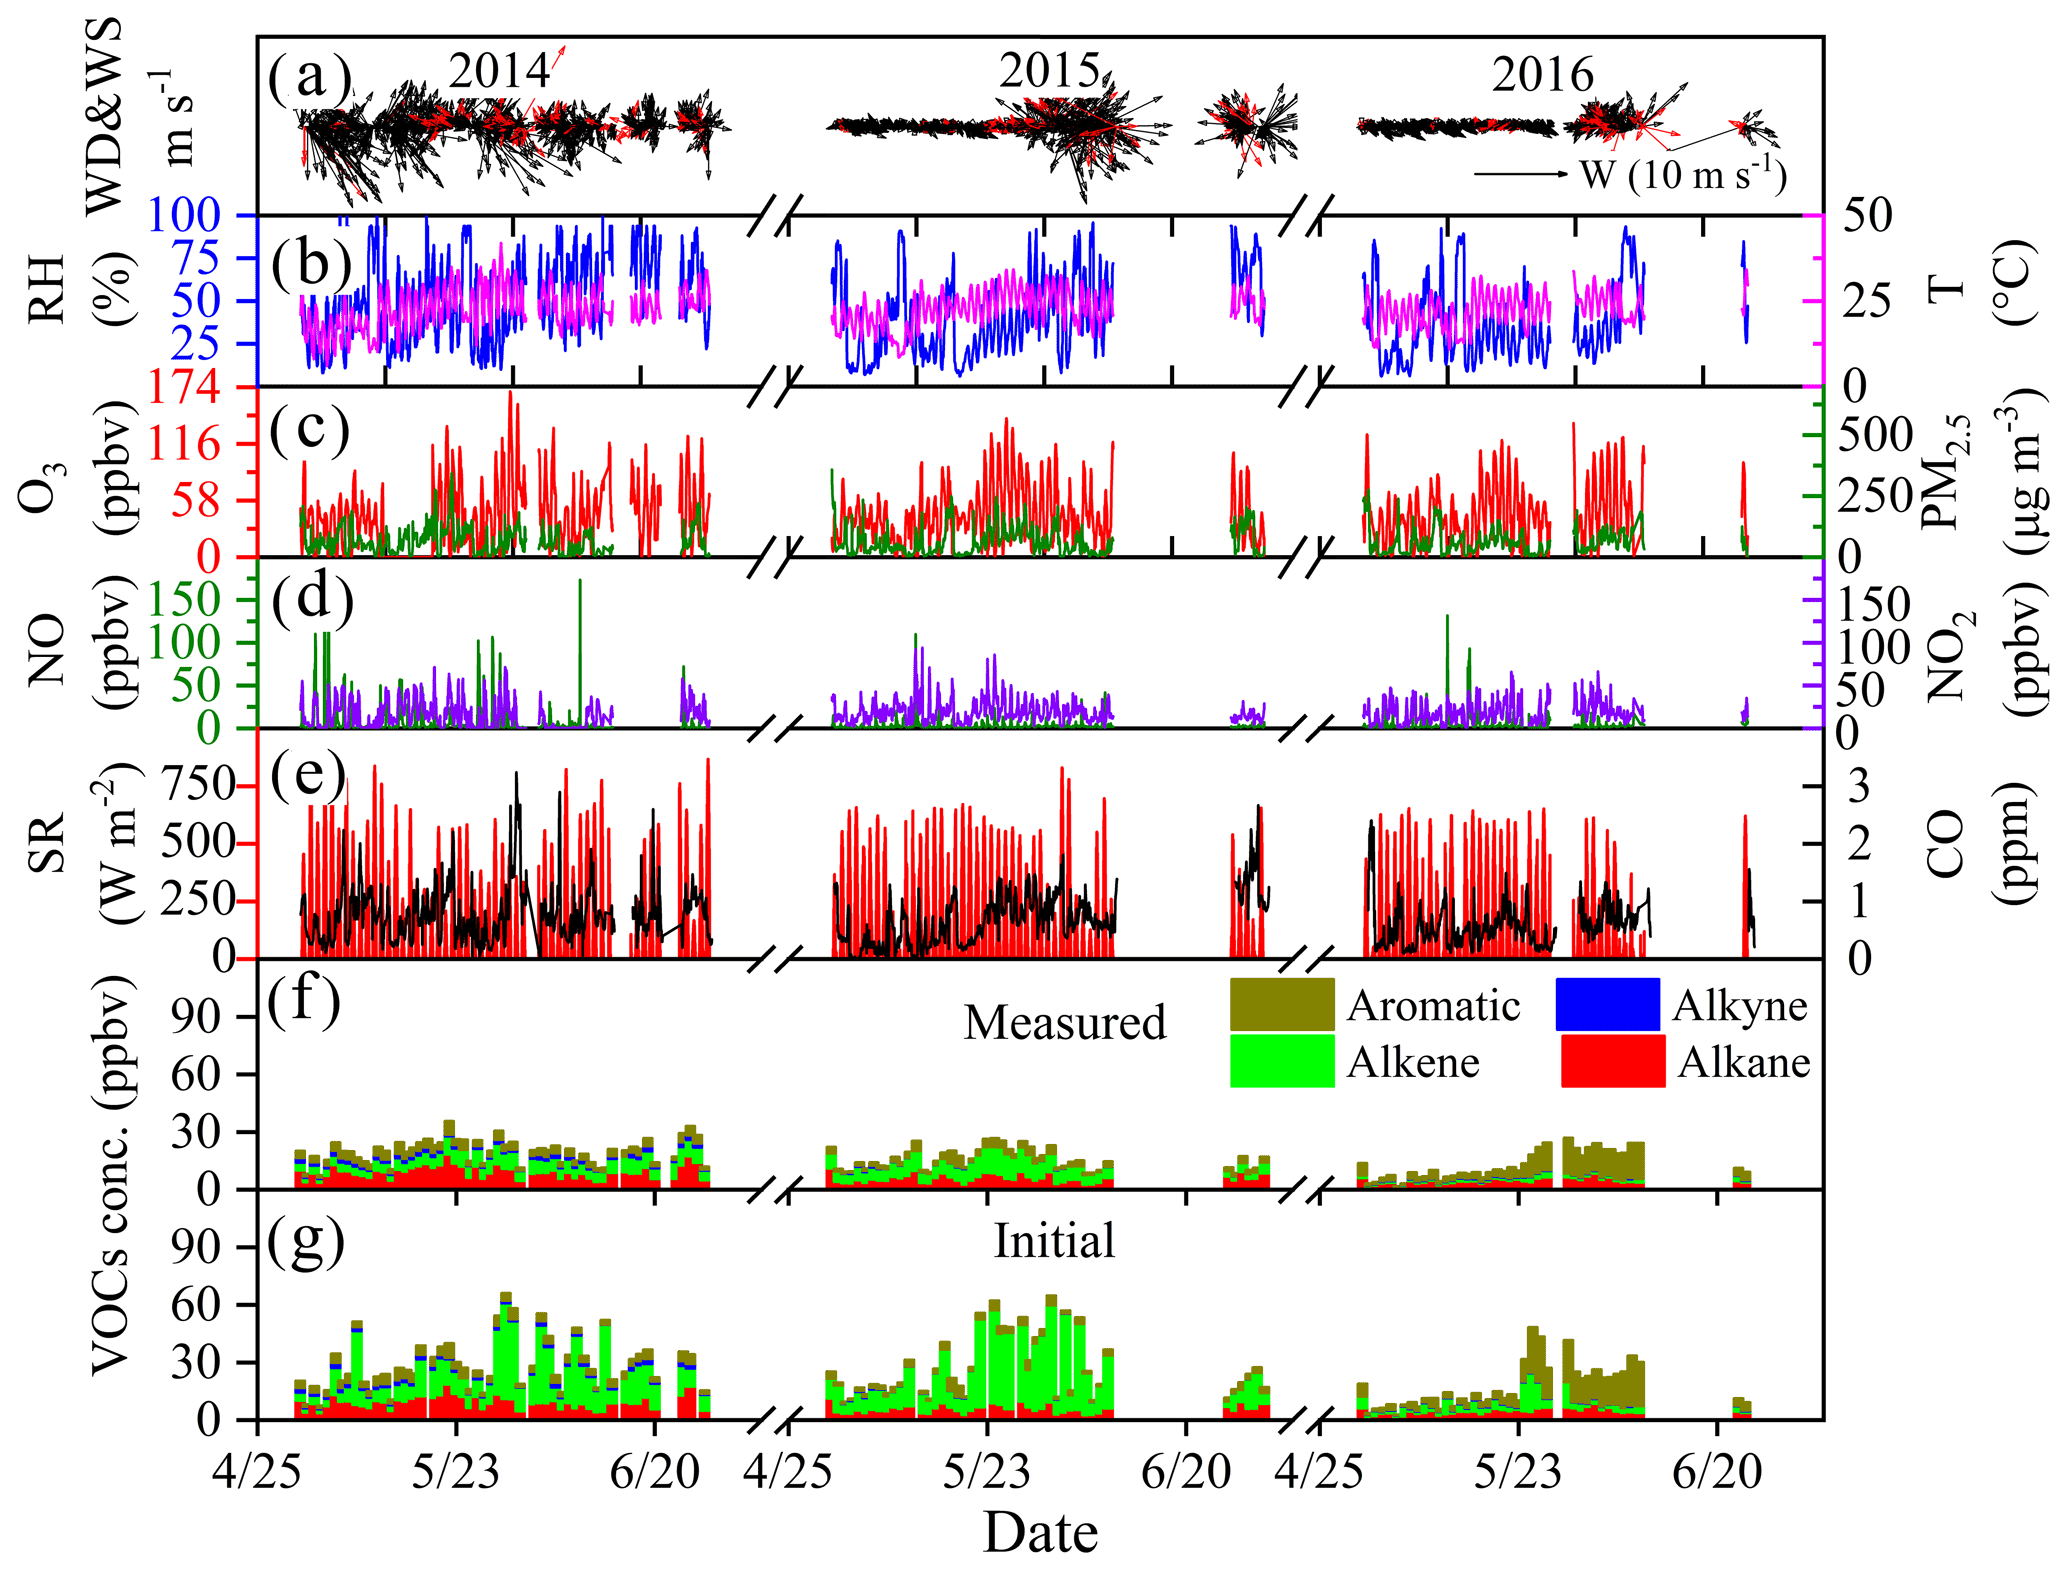
Figure 1Time series of air pollutants and meteorological parameters during observations in Beijing. In panel a, the red arrows represent the O3 concentration exceeding 74.6 ppbv according to the national ambient air quality standard.
3.2 Prediction performance of the model
To build a robust model, we evaluated the prediction performance of the RF model for the ambient O3 simulation. Figure 2 shows the O3 prediction performance in 2015 when chemical species (including VOCs, NOx, PM2.5, CO) and meteorological factors (i.e., WS, WD, SR, T and RH) were used as inputs in the RF model. The prediction performance of RF model for 2014 and 2016 is shown in Figs. S3 and S4, respectively. The details of the modeling and input parameters are shown in Table S2. Figure 2a–c show the time series of the measured and modeled O3 concentrations, which were simulated using the TVOCs, measured VOC species, and initial VOC species as part input variables along with the same set of other parameters. The correlation coefficients (R2) of the training data were 0.77, 0.82, and 0.81 for the TVOCs, measured VOC species, and initial VOC species, respectively. The corresponding root mean square errors (RMSEs) for the predicted O3 concentrations were 17.4, 12.6, and 13.9. Figure 2d–f show the prediction performance of the testing dataset under these three circumstances. When the TVOCs were split into measured or initial VOC species, the R2 increased obviously as the number of data features increased. Therefore, the VOC composition has a significant influence on O3 prediction using the RF model. In previous studies using TVOCs, the influence of VOC composition was neglected (Liu et al., 2021; R. Ma et al., 2021). Our results indicate that the RF model can accurately predict O3 concentrations when the concentrations of measured/initial VOC species are considered.
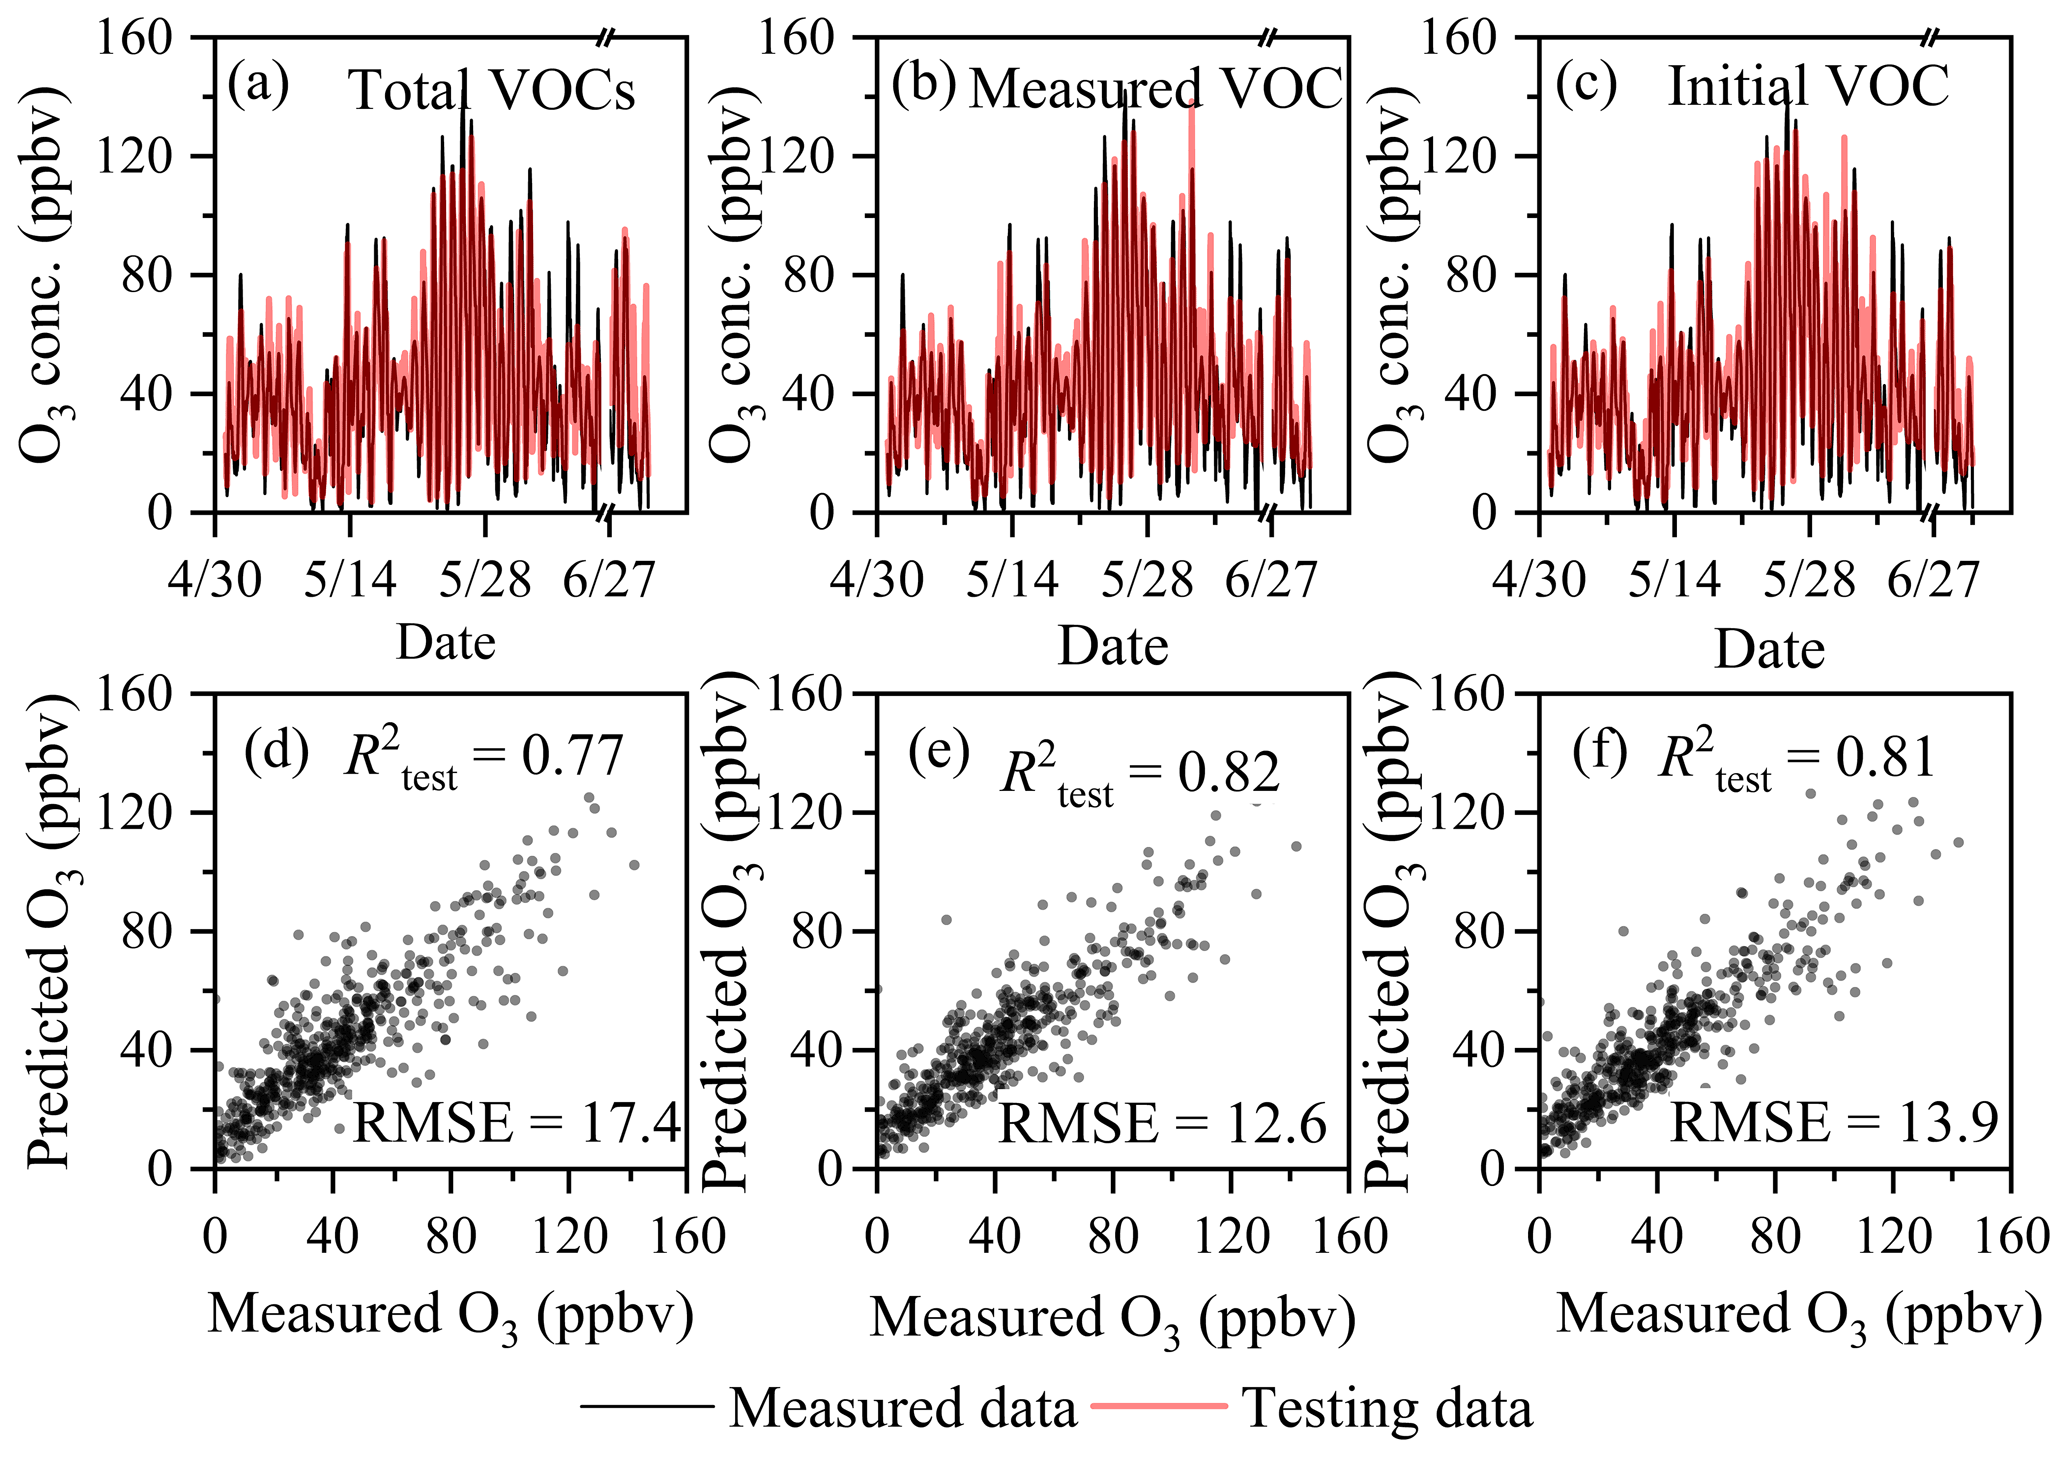
Figure 2Comparison of the predicted and measured O3 concentrations in Beijing in the summer of 2015 (a, d: TVOC concentrations; b, e: measured concentrations of VOC species; c, f: initial concentrations of VOC species).
It should be pointed out that if the training dataset does not have sufficient coverage in the NOx-limited regime, then the trained algorithm essentially attempts to extrapolate in that regime, which is prone to overtraining. To avoid such overtraining, a 12-fold cross-validation by randomly dividing the observation data in each day into 12 subsets and alternately taking 1 subset as testing data and the rest as training data ensures that each data point has an equal chance of being trained and tested. The curves of the predicted O3 concentrations in Fig. 2 were spliced using the testing datasets in all runs. Thus, our results actually covered all the sensitivity regimes of O3 formation. This means that the model is robust.
3.3 Relative importance of major factors
Figure 3a shows the RIs of different ambient factors, including chemical and meteorological variables on O3 formation. The difference in the RIs is also compared using the TVOCs and the VOC species as inputs. Chemical factors (including VOC species, NOx, PM2.5 and CO) accounted for 79.1 % of the contribution to O3 production in the summer of 2016. Meanwhile, VOC species accounted for approximately 63.4 % of O3 production while the RIs using TVOC concentrations accounted for only 2.1 %. S. Ma et al. (2021) analyzed the contribution of meteorological conditions and chemical factors to O3 formation on the North China Plain (NCP) using the CMAQ model in combination with process analysis and found that chemical factors dominate O3 formation in summer. Using probability theory, Ueno and Tsunematsu (2019) also found that dominates O3 production compared to meteorological variables. Thus, our results are similar to those of previous studies based on chemical models (Ueno and Tsunematsu, 2019), which demonstrates that the RF model can reflect the contribution of VOC species to O3 production even if the observed VOC species are used.
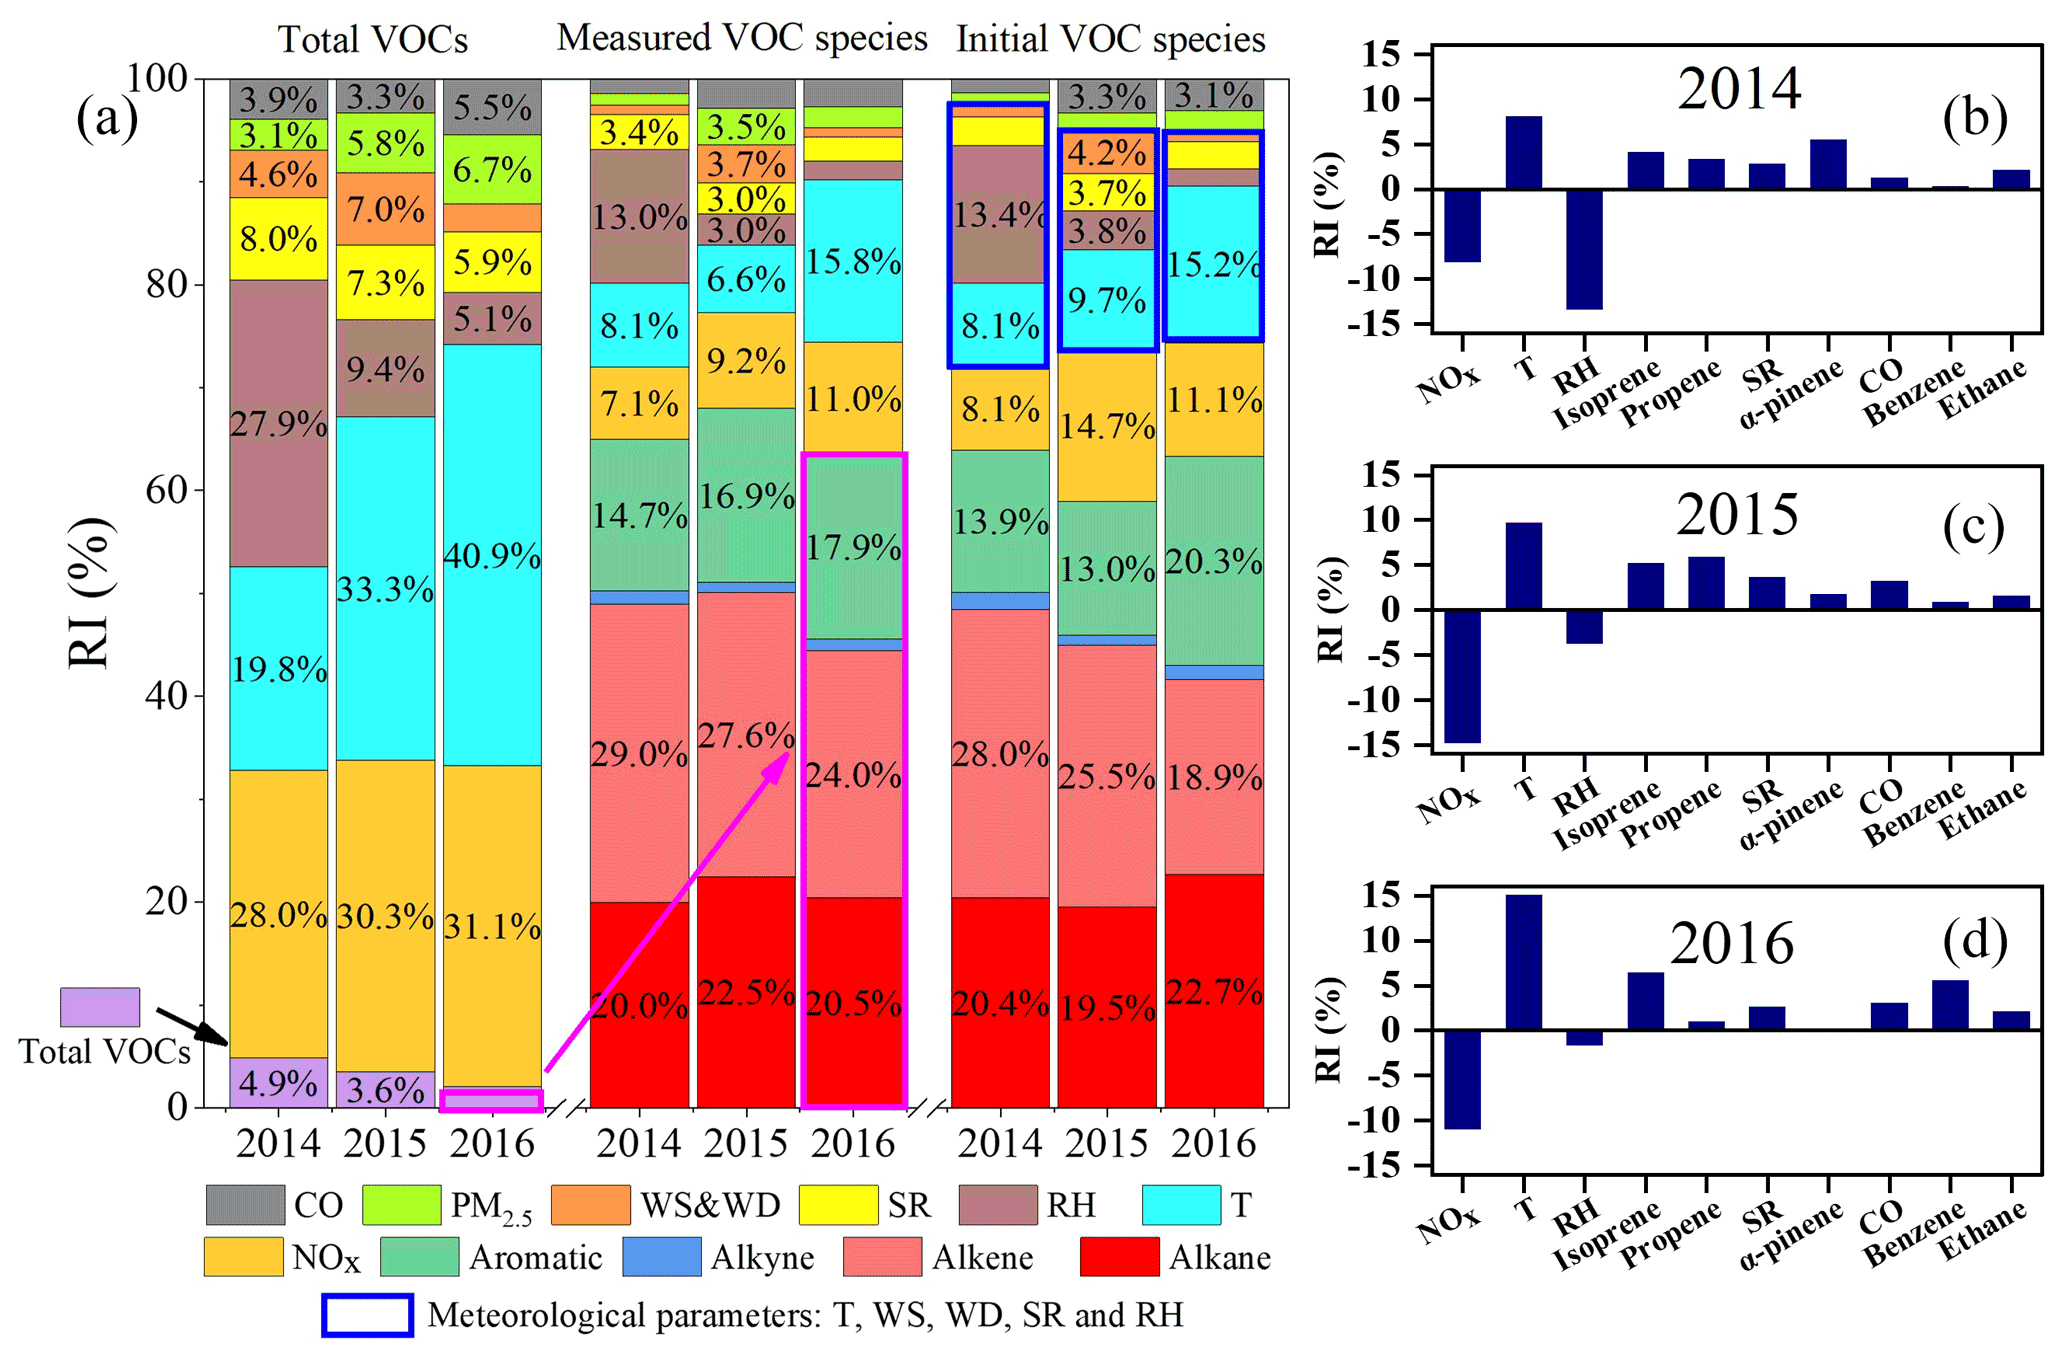
Figure 3Percentage of RI for O3 precursors and meteorological parameters (a) and the top 10 factors with high values of RI in 2014–2016 (b–d: using initial concentrations of VOC species).
Here, we compared the RIs of VOCs calculated using the initial VOC species and the observed VOC species with the OFPs. The OFPs were calculated by the maximum incremental reactivity (MIR) method (Carter, 2010). As shown in Fig. S5, the RIs showed good correlations with the OFP. Interestingly, the initial concentrations of VOC species improved the correlation coefficients between the RIs and OFPs. Furthermore, we calculated the RIs and OFPs of different species using the observed data during the campaign study in Daxing District in the summer of 2019 (Zhan et al., 2021), and a stronger correlation was observed between the RIs of the initial VOC species and the OFPs (Fig. S6). These results indicate that the RIs of the initial VOCs species in the ML model should partially reflect the chemical reactivity of VOCs to produce O3 in the atmosphere.
Although the RIs calculated using the initial VOC species slightly changed compared to those calculated using the observed VOCs (Table S3), VOCs still dominated O3 formation (Fig. 3a). For example, the initial VOCs dominated O3 production in 2014, 2015, and 2016, with RI values of 64.0 %, 59.0 %, and 63.3 %, respectively. Li et al. (2020a) used a multiple linear regression (MLR) model to study the contribution of anthropogenic and meteorological factors to O3 formation in China from 2013–2019 and found that meteorological factors accounted for 36.8 % and anthropogenic factors accounted for 63.2 %, which is similar to our results. Figure 3b–d show the top 10 factors having a strongly influence on O3 production. Interestingly, NOx and RH showed negative responses to O3 formation, while other variables, including T, SR, CO, and all of the VOCs, showed positive responses. Thus, a decrease in NOx or RH will lead to an increase in O3 concentration, while a decrease in T, SR, CO, and VOCs will lead to a decrease in O3 concentration. Although O3 formation is highly related to the photolysis of NO2, a previous study demonstrated that it is VOC-limited in summer in Beijing (Zhan et al., 2021). This finding is consistent with the observed negative response of O3 to NOx in this work. High RH usually coincides with low surface O3 concentrations in field observations, which can be ascribed to the inhibition of O3 formation by the transfer of -containing products into the particle phase and the promotion of dry deposition of O3 on the surface (Kavassalis and Murphy, 2017; Yu 2019). In addition, it has been shown that RH is negatively related to the rate constant of HONO formation (Hu et al., 2011). Thus, RH might also affect the O3 formation by influencing atmospheric OH radicals from photolysis of HONO. It should be noted that the negative response of ozone to RH might also have resulted from the dependence of RH on other parameters/conditions, such as SR. However, RH and SR showed a bad correlation (r<0.1). We further tested the dependence of the RI on RH and SR with or without the counterpart as input. The stable RI values (Table S4) mean that RH and SR are independent from each other. These previous works can well explain the observed negative response of O3 to RH in Fig. 3b–d. Previous studies have observed a positive correlation between the O3 concentration and T or SR (Steiner et al., 2010; Paraschiv et al., 2020; Li et al., 2021). Temperature can directly affect the chemical reaction rate of O3 formation (Fu et al., 2015), and SR can promote the photolysis of NO2 (Hu et al., 2017; Y. Wang et al., 2020a), thus accelerating O3 formation. As mentioned above, O3 formation is VOC-limited in Beijing; thus, a positive response of O3 concentration to VOCs is observed in Fig. 3b. Interestingly, the RIs of isoprene showed an increasing trend from 2014 to 2016 because of the obvious reduction in anthropogenic VOCs (Fig. S7) (Zhang et al., 2021). In the context of global warming, studies should focus on the factors that affect O3 formation, including biogenic emissions, T, and SR. Thus, additional efforts will be required to reduce anthropogenic pollutants in the future.
3.4 Ozone formation sensitivity
To further analyze the sensitivity of O3 to VOCs and NOx from 2014 to 2016, we plotted sensitivity curves for O3 generation using the RF model, and the results are shown in Fig. 4a–c. Moreover, EKMA curves in 2015 were also obtained using the OBM (Fig. 4d). As shown in Fig. 4a–c, O3 formation was sensitive to VOCs in the summer of Beijing during our observations, which is consistent with previous studies that used box models (Li et al., 2020b) and chemical transport models (Shao et al., 2021). This result is also consistent with the RIs of VOCs or NOx to O3 formation (Fig. 3b–d). Interestingly, the O3 formation sensitivity to VOCs decreases or gradually shifts from the observed point to the transition regime from 2014 to 2016 (Fig. 4a–c), which is similar to that reported by Zhang et al. (2021). These phenomena can be ascribed to the increased relative importance of meteorological factors, such as T, SR, and RH, for O3 formation and the variation in anthropogenic VOC emissions (Steiner et al., 2010; S. Ma et al., 2021).

Figure 4Ozone formation sensitivity curves from 2014–2016 (a, b, c: calculated by the RF model for 2014, 2015, and 2016, respectively, d calculated by the OBM for 2015.)
We compared the relative error of simulated MDA8 O3 calculated using the RF and OBM model in 2015, as shown in Fig. S8. The mean relative error of simulated MDA8 O3 between RF model and box model was 15.6 %. Hence, a combination of the RF model and initial VOCs species can accurately depict the sensitivity regime of O3 formation, while the calculated RIs correlate well with the OFPs.
In summary, this work investigated O3 formation sensitivity in the summer from 2014–2016 in Beijing using the RF model coupled with the reactivity of VOC species. The results show that the prediction performance of O3 by the RF model was significantly improved when measured/initial VOC species were considered compared to TVOCs. Furthermore, after the photochemical loss of VOC species during transport was corrected, the RIs of the VOC species were well correlated with the OFPs of VOC species calculated using the MIR method, thus indicating that the RIs in the ML model reflect the chemical reactivity of VOCs. Meanwhile, both NOx and highly reactive species (such as isoprene, propene, benzene) played an important role in O3 formation. An increased contribution of temperature to O3 production was observed, which implied the importance of temperature to O3 pollution in the context of global warming conditions. Both the RF model and the box model results showed that O3 formation was sensitive to VOCs in Beijing, although the sensitivity regime shifted from VOC-limited regime to a transition regime from 2014 to 2016. Due to the high computational efficiency of ML, the O3 formation sensitivity plotted by the RF model coupled with the reactivity of VOC species can provide an accurate, flexible, and efficient approach for analyzing O3 sensitivity in a near-real-time way.
The datasets are available at https://doi.org/10.5281/zenodo.6330176 (Zhan et al., 2022a). The code is available at https://doi.org/10.5281/zenodo.6327734 (Zhan et al., 2022b). The solar radiation data are publicly available via https://www.copernicus.eu/en (last access: 4 March 2022; Copernicus, 2022).
The supplement related to this article is available online at: https://doi.org/10.5194/amt-15-1511-2022-supplement.
JZ designed the idea and wrote the manuscript; YL and HL provided useful advice and revised the manuscript; WM performed box model simulations; and XZ, XW, FB, YZ, and ZW conducted the campaign and compiled the data. All authors contributed to the discussion of the results and writing of the manuscript.
The contact author has declared that neither they nor their co-authors have any competing interests.
Publisher’s note: Copernicus Publications remains neutral with regard to jurisdictional claims in published maps and institutional affiliations.
This research was financially supported by the Ministry of Science and Technology of the People's Republic of China (grant no. 2019YFC0214701), the National Natural Science Foundation of China (grant nos. 41877306 and 92044301), and the programs from Beijing Municipal Science & Technology Commission (grant no. Z181100005418015). We thank Yizhen Chen for providing the meteorological parameter data for campaign studies.
This research has been supported by the Ministry of Science and Technology of the People's Republic of China (grant no. 2019YFC0214701), the National Natural Science Foundation of China (grant nos. 41877306 and 92044301), and the Beijing Municipal Science and Technology Commission (grant no. Z181100005418015).
This paper was edited by Glenn Wolfe and reviewed by two anonymous referees.
Breiman, L.: Random Forests, Mach. Learn., 45, 5–32, https://doi.org/10.1023/A:1010933404324, 2001.
Carter, W.: Updated maximum incremental reactivity scale and hydrocarbon bin reactivities for regulatory applications, California Air Resources Board Contract 07-339, 2010.
Cohen, A. J., Brauer, M., Burnett, R., Anderson, H. R., Frostad, J., Estep, K., Balakrishnan, K., Brunekreef, B., Dandona, L., Dandona, R., Feigin, V., Freedman, G., Hubbell, B., Jobling, A., Kan, H., Knibbs, L., Liu, Y., Martin, R., Morawska, L., Pope, C. A., Shin, H., Straif, K., Shaddick, G., Thomas, M., van Dingenen, R., van Donkelaar, A., Vos, T., Murray, C. J. L., and Forouzanfar, M. H.: Estimates and 25-year trends of the global burden of disease attributable to ambient air pollution: an analysis of data from the Global Burden of Diseases Study 2015, The Lancet, 389, 1907–1918, https://doi.org/10.1016/S0140-6736(17)30505-6, 2017.
Copernicus: https://www.copernicus.eu/en, last access: 4 March 2022.
di Carlo, P., Brune, W. H., Martinez, M., Harder, H., Lesher, R., Ren, X., Thornberry, T., Carroll, M. A., Young, V., Shepson, P. B., Riemer, D., Apel, E., and Campbell, C.: Missing OH Reactivity in a Forest: Evidence for Unknown Reactive Biogenic VOCs, Science, 304, 722–725, https://doi.org/10.1126/science.1094392, 2004.
Djalalova, I., Delle Monache, L., and Wilczak, J.: PM2.5 analog forecast and Kalman filter post-processing for the Community Multiscale Air Quality (CMAQ) model, Atmos. Environ., 108, 76–87, https://doi.org/10.1016/j.atmosenv.2015.02.021, 2015.
Feng, R., Zheng, H.-j., Gao, H., Zhang, A.-r., Huang, C., Zhang, J.-x., Luo, K., and Fan, J.-r.: Recurrent Neural Network and random forest for analysis and accurate forecast of atmospheric pollutants: A case study in Hangzhou, China, J. Clean. Prod., 231, 1005–1015, https://doi.org/10.1016/j.jclepro.2019.05.319, 2019.
Fu, T.-M., Zheng, Y., Paulot, F., Mao, J., and Yantosca, R. M.: Positive but variable sensitivity of August surface ozone to large-scale warming in the southeast United States, Nat. Clim. Change, 5, 454–458, https://doi.org/10.1038/nclimate2567, 2015.
Grange, S. K., Lee, J. D., Drysdale, W. S., Lewis, A. C., Hueglin, C., Emmenegger, L., and Carslaw, D. C.: COVID-19 lockdowns highlight a risk of increasing ozone pollution in European urban areas, Atmos. Chem. Phys., 21, 4169–4185, https://doi.org/10.5194/acp-21-4169-2021, 2021.
Hammer, M.-U., Vogel, B., and Vogel, H.: Findings on as an indicator of ozone sensitivity in Baden-Württemberg, Berlin-Brandenburg, and the Po valley based on numerical simulations, J. Geophys. Res., 107, 8190, https://doi.org/10.1029/2000JD000211, 2002.
Hou, L., Dai, Q., Song, C., Liu, B., Guo, F., Dai, T., Li, L., Liu, B., Bi, X., Zhang, Y., and Feng, Y.: Revealing Drivers of Haze Pollution by Explainable Machine Learning, Environ. Sci. Tech. Let., 9, 112–119, https://doi.org/10.1021/acs.estlett.1c00865, 2022.
Hu, B., Zhao, X., Liu, H., Liu, Z., Song, T., Wang, Y., Tang, L., Xia, X., Tang, G., Ji, D., Wen, T., Wang, L., Sun, Y., and Xin, J.: Quantification of the impact of aerosol on broadband solar radiation in North China, Sci. Rep., 7, 44851, https://doi.org/10.1038/srep44851, 2017.
Hu, G., Xu, Y., and Jia, L.: Effects of relative humidity on the characterization of a photochemical smog chamber, J. Environ. Sci., 23, 2013–2018, https://doi.org/10.1016/S1001-0742(10)60665-1, 2011.
Kavassalis, S. C. and Murphy, J. G.: Understanding ozone-meteorology correlations: A role for dry deposition, Geophys. Res. Lett., 44, 2922–2931, https://doi.org/10.1002/2016GL071791, 2017.
Li, J., Cai, J., Zhang, M., Liu, H., Han, X., Cai, X., and Xu, Y.: Model analysis of meteorology and emission impacts on springtime surface ozone in Shandong, Sci. Total Environ., 771, 144784, https://doi.org/10.1016/j.scitotenv.2020.144784, 2021.
Li, K., Jacob, D. J., Liao, H., Zhu, J., Shah, V., Shen, L., Bates, K. H., Zhang, Q., and Zhai, S.: A two-pollutant strategy for improving ozone and particulate air quality in China, Nat. Geosci., 12, 906–910, https://doi.org/10.1038/s41561-019-0464-x, 2019.
Li, K., Jacob, D. J., Shen, L., Lu, X., De Smedt, I., and Liao, H.: Increases in surface ozone pollution in China from 2013 to 2019: anthropogenic and meteorological influences, Atmos. Chem. Phys., 20, 11423–11433, https://doi.org/10.5194/acp-20-11423-2020, 2020a.
Li, Q., Su, G., Li, C., Liu, P., Zhao, X., Zhang, C., Sun, X., Mu, Y., Wu, M., Wang, Q., and Sun, B.: An investigation into the role of VOCs in SOA and ozone production in Beijing, China, Sci. Total Environ., 720, 137536, https://doi.org/10.1016/j.scitotenv.2020.137536, 2020b.
Lin, W., Xu, X., Ge, B., and Liu, X.: Gaseous pollutants in Beijing urban area during the heating period 2007–2008: variability, sources, meteorological, and chemical impacts, Atmos. Chem. Phys., 11, 8157–8170, https://doi.org/10.5194/acp-11-8157-2011, 2011.
Liu, H., Liu, J., Liu, Y., Ouyang, B., Xiang, S., Yi, K., and Tao, S.: Analysis of wintertime O3 variability using a random forest model and high-frequency observations in Zhangjiakou–an area with background pollution level of the North China Plain, Environ. Pollut., 262, 114191, https://doi.org/10.1016/j.envpol.2020.114191, 2020.
Liu, Y. and Wang, T.: Worsening urban ozone pollution in China from 2013 to 2017 – Part 1: The complex and varying roles of meteorology, Atmos. Chem. Phys., 20, 6305–6321, https://doi.org/10.5194/acp-20-6305-2020, 2020.
Liu, Y., Cheng, Z., Liu, S., Tan, Y., Yuan, T., Yu, X., andShen, Z.: Quantitative structure activity relationship (QSAR) modelling of the degradability rate constant of volatile organic compounds (VOCs) by OH radicals in atmosphere, Sci. Total Environ., 729, 138871, https://doi.org/10.1016/j.scitotenv.2020.138871, 2020.
Liu, Z., Qi, Z., Ni, X., Dong, M., Ma, M., Xue, W., Zhang, Q., and Wang, J.: How to apply O3 and PM2.5 collaborative control to practical management in China: A study based on meta-analysis and machine learning, Sci. Total Environ., 772, 145392, https://doi.org/10.1016/j.scitotenv.2021.145392, 2021.
Ma, R., Ban, J., Wang, Q., and Li, T.: Statistical spatial-temporal modeling of ambient ozone exposure for environmental epidemiology studies: A review, Sci. Total Environ., 701, 134463, https://doi.org/10.1016/j.scitotenv.2019.134463, 2020.
Ma, R., Ban, J., Wang, Q., Zhang, Y., Yang, Y., He, M. Z., Li, S., Shi, W., and Li, T.: Random forest model based fine scale spatiotemporal O3 trends in the Beijing-Tianjin-Hebei region in China, 2010 to 2017, Environ. Pollut., 276, 116635, https://doi.org/10.1016/j.envpol.2021.116635, 2021.
Ma, S., Shao, M., Zhang, Y., Dai, Q., and Xie, M.: Sensitivity of PM2.5 and O3 pollution episodes to meteorological factors over the North China Plain, Sci. Total Environ., 792, 148474, https://doi.org/10.1016/j.scitotenv.2021.148474, 2021.
Makar, P. A., Fuentes, J. D., Wang, D., Staebler, R. M., and Wiebe, H. A.: Chemical processing of biogenic hydrocarbons within and above a temperate deciduous forest, J. Geophys. Res., 104, 3581–3603, https://doi.org/10.1029/1998JD100065, 1999.
Martin, R. V., Fiore, A. M., and Van Donkelaar, A.: Space-based diagnosis of surface ozone sensitivity to anthropogenic emissions, Geophys. Res. Lett., 31, L06120, https://doi.org/10.1029/2004GL019416, 2004.
Mo, Z., Shao, M., Liu, Y., Xiang, Y., Wang, M., Lu, S., Ou, J., Zheng, J., Li, M., Zhang, Q., Wang, X., and Zhong, L.: Species-specified VOC emissions derived from a gridded study in the Pearl River Delta, China, Sci. Rep., 8, 2963, https://doi.org/10.1038/s41598-018-21296-y, 2018.
Ou, J., Yuan, Z., Zheng, J., Huang, Z., Shao, M., Li, Z., Huang, X., Guo, H., and Louie, P. K. K.: Ambient Ozone Control in a Photochemically Active Region: Short-Term Despiking or Long-Term Attainment?, Environ. Sci. Technol., 50, 5720–5728, https://doi.org/10.1021/acs.est.6b00345, 2016.
Paraschiv, S., Barbuta-Misu, N., and Paraschiv, S. L.: Influence of NO2, NO and meteorological conditions on the tropospheric O3 concentration at an industrial station, Energy Rep., 6, 231–236, https://doi.org/10.1016/j.egyr.2020.11.263, 2020.
Sayeed, A., Choi, Y., Eslami, E., Jung, J., Lops, Y., Salman, A. K., Lee, J.-B., Park, H.-J., and Choi, M.-H.: A novel CMAQ-CNN hybrid model to forecast hourly surface-ozone concentrations 14 days in advance, Sci. Rep., 11, 10891, https://doi.org/10.1038/s41598-021-90446-6, 2021.
Shao, M., Wang, W., Yuan, B., Parrish, D. D., Li, X., Lu, K., Wu, L., Wang, X., Mo, Z., Yang, S., Peng, Y., Kuang, Y., Chen, W., Hu, M., Zeng, L., Su, H., Cheng, Y., Zheng, J., and Zhang, Y.: Quantifying the role of PM2.5 dropping in variations of ground-level ozone: Inter-comparison between Beijing and Los Angeles, Sci. Total Environ., 788, 147712, https://doi.org/10.1016/j.scitotenv.2021.147712, 2021.
Sillman, S.: The use of NOy, H2O2, and HNO3 as indicators for ozone-NOx-hydrocarbon sensitivity in urban locations, J. Geophys. Res., 100, 14175–14188, https://doi.org/10.1029/94JD02953, 1995.
Steiner, A. L., Davis, A. J., Sillman, S., Owen, R. C., Michalak, A. M., and Fiore, A. M.: Observed suppression of ozone formation at extremely high temperatures due to chemical and biophysical feedbacks, P. Natl. Acad. Sci. USA, 107, 19685–19690, https://doi.org/10.1073/pnas.1008336107, 2010.
Svetnik, V., Liaw, A., Tong, C., Culberson, J. C., Sheridan, R. P., and Feuston, B. P.: Random Forest: A Classification and Regression Tool for Compound Classification and QSAR Modeling, J. Chem. Inf. Comp. Sci., 43, 1947–1958, https://doi.org/10.1021/ci034160g, 2003.
Tan, Z., Lu, K., Jiang, M., Su, R., Dong, H., Zeng, L., Xie, S., Tan, Q., and Zhang, Y.: Exploring ozone pollution in Chengdu, southwestern China: A case study from radical chemistry to O3-VOC-NOx sensitivity, Sci. Total Environ., 636, 775–786, https://doi.org/10.1016/j.scitotenv.2018.04.286, 2018.
Tang, X., Zhu, J., Wang, Z. F., and Gbaguidi, A.: Improvement of ozone forecast over Beijing based on ensemble Kalman filter with simultaneous adjustment of initial conditions and emissions, Atmos. Chem. Phys., 11, 12901–12916, https://doi.org/10.5194/acp-11-12901-2011, 2011.
Taoufik, N., Boumya, W., Achak, M., Chennouk, H., Dewil, R., and Barka, N.: The state of art on the prediction of efficiency and modeling of the processes of pollutants removal based on machine learning, Sci. Total Environ., 807, 150554, https://doi.org/10.1016/j.scitotenv.2021.150554, 2022.
Ueno, H. and Tsunematsu, N.: Sensitivity of ozone production to increasing temperature and reduction of precursors estimated from observation data, Atmos. Environ, 214, 116818, https://doi.org/10.1016/j.atmosenv.2019.116818, 2019.
Vélez-Pereira, A. M., De Linares, C., and Belmonte, J.: Aerobiological modeling I: A review of predictive models, Sci. Total Environ., 795, 148783, https://doi.org/10.1016/j.scitotenv.2021.148783, 2021.
Wang, P., Qiao, X., and Zhang, H.: Modeling PM2.5 and O3 with aerosol feedbacks using WRF/Chem over the Sichuan Basin, southwestern China, Chemosphere, 254, 126735, https://doi.org/10.1016/j.chemosphere.2020.126735, 2020.
Wang, T., Nie, W., Gao, J., Xue, L. K., Gao, X. M., Wang, X. F., Qiu, J., Poon, C. N., Meinardi, S., Blake, D., Wang, S. L., Ding, A. J., Chai, F. H., Zhang, Q. Z., and Wang, W. X.: Air quality during the 2008 Beijing Olympics: secondary pollutants and regional impact, Atmos. Chem. Phys., 10, 7603–7615, https://doi.org/10.5194/acp-10-7603-2010, 2010.
Wang, T., Xue, L., Brimblecombe, P., Lam, Y. F., Li, L., and Zhang, L.: Ozone pollution in China: A review of concentrations, meteorological influences, chemical precursors, and effects, Sci. Total Environ., 575, 1582–1596, https://doi.org/10.1016/j.scitotenv.2016.10.081, 2017.
Wang, Y., Li, Y., Pu, W., Wen, K., Shugart, Y. Y., Xiong, M., and Jin, L.: Random Bits Forest: a Strong Classifier/Regressor for Big Data, Sci. Rep., 6, 30086, https://doi.org/10.1038/srep30086, 2016.
Wang, Y., Wu, G., Deng, L., Tang, Z., Wang, K., Sun, W., and Shangguan, Z.: Prediction of aboveground grassland biomass on the Loess Plateau, China, using a random forest algorithm, Sci. Rep., 7, 6940, https://doi.org/10.1038/s41598-017-07197-6, 2017.
Wang, Y., Gao, W., Wang, S., Song, T., Gong, Z., Ji, D., Wang, L., Liu, Z., Tang, G., Huo, Y., Tian, S., Li, J., Li, M., Yang, Y., Chu, B., Petäjä, T., Kerminen, V.-M., He, H., Hao, J., Kulmala, M., Wang, Y., and Zhang, Y.: Contrasting trends of PM2.5 and surface-ozone concentrations in China from 2013 to 2017, Natl. Sci. Rev., 7, 1331–1339, https://doi.org/10.1093/nsr/nwaa032, 2020a.
Wang, Y., Wen, Y., Wang, Y., Zhang, S., Zhang, K. M., Zheng, H., Xing, J., Wu, Y., and Hao, J.: Four-Month Changes in Air Quality during and after the COVID-19 Lockdown in Six Megacities in China, Environ. Sci. Tech. Let., 7, 802–808, https://doi.org/10.1021/acs.estlett.0c00605, 2020b.
Xing, J., Zheng, S., Ding, D., Kelly, J. T., Wang, S., Li, S., Qin, T., Ma, M., Dong, Z., Jang, C., Zhu, Y., Zheng, H., Ren, L., Liu, T.-Y., and Hao, J.: Deep Learning for Prediction of the Air Quality Response to Emission Changes, Environ. Sci. Technol., 54, 8589–8600, https://doi.org/10.1021/acs.est.0c02923, 2020.
Xue, L. K., Wang, T., Gao, J., Ding, A. J., Zhou, X. H., Blake, D. R., Wang, X. F., Saunders, S. M., Fan, S. J., Zuo, H. C., Zhang, Q. Z., and Wang, W. X.: Ground-level ozone in four Chinese cities: precursors, regional transport and heterogeneous processes, Atmos. Chem. Phys., 14, 13175–13188, https://doi.org/10.5194/acp-14-13175-2014, 2014.
Yang, J., Wen, Y., Wang, Y., Zhang, S., Pinto, J. P., Pennington, E. A., Wang, Z., Wu, Y., Sander, S. P., Jiang, J. H., Hao, J., Yung, Y. L., and Seinfeld, J. H.: From COVID-19 to future electrification: Assessing traffic impacts on air quality by a machine-learning model, P. Natl. Acad. Sci. USA, 118, e2102705118, https://doi.org/10.1073/pnas.2102705118, 2021a.
Yang, L., Yuan, Z., Luo, H., Wang, Y., Xu, Y., Duan, Y., and Fu, Q.: Identification of long-term evolution of ozone sensitivity to precursors based on two-dimensional mutual verification, Sci. Total Environ., 760, 143401, https://doi.org/10.1016/j.scitotenv.2020.143401, 2021b.
Yu, S.: Fog geoengineering to abate local ozone pollution at ground level by enhancing air moisture, Environ. Chem. Lett., 17, 565–580, https://doi.org/10.1007/s10311-018-0809-5, 2019.
Yuan, B., Hu, W. W., Shao, M., Wang, M., Chen, W. T., Lu, S. H., Zeng, L. M., and Hu, M.: VOC emissions, evolutions and contributions to SOA formation at a receptor site in eastern China, Atmos. Chem. Phys., 13, 8815–8832, https://doi.org/10.5194/acp-13-8815-2013, 2013.
Zhan, J., Feng, Z., Liu, P., He, X., He, Z., Chen, T., Wang, Y., He, H., Mu, Y., and Liu, Y.: Ozone and SOA formation potential based on photochemical loss of VOCs during the Beijing summer, Environ. Pollut., 285, 117444, https://doi.org/10.1016/j.envpol.2021.117444, 2021.
Zhan, J., Liu, Y., Ma, W., Zhang, X., Wang, X., Bi, F., Zhang, Y., Wu, Z., and Li, H.: Ozone formation sensitivity study using machine learning coupled with the reactivity of volatile organic compound species, Zenodo, Version 1 [data set], https://doi.org/10.5281/zenodo.6330176, 2022a.
Zhan, J., Liu, Y., Ma, W., Zhang, X., Wang, X., Bi, F., Zhang, Y., Wu, Z., and Li, H.: Ozone formation sensitivity study using machine learning coupled with the reactivity of volatile organic compound species, Zenodo, Version 1 [code], https://doi.org/10.5281/zenodo.6327734, 2022b.
Zhang, X., Li, H., Wang, X., Zhang, Y., Bi, F., Wu, Z., Liu, Y., Zhang, H., Gao, R., Xue, L., Zhang, Q., Chen, Y., Chai, F., and Wang, W.: Heavy ozone pollution episodes in urban Beijing during the early summertime from 2014 to 2017: Implications for control strategy, Environ. Pollut., 285, 117162, https://doi.org/10.1016/j.envpol.2021.117162, 2021.
Zhao, H., Chen, K., Liu, Z., Zhang, Y., Shao, T., and Zhang, H.: Coordinated control of PM2.5 and O3 is urgently needed in China after implementation of the “Air pollution prevention and control action plan”, Chemosphere, 270, 129441, https://doi.org/10.1016/j.chemosphere.2020.129441, 2021.