the Creative Commons Attribution 4.0 License.
the Creative Commons Attribution 4.0 License.
 | 18 Mar 2022
Far-ultraviolet airglow remote sensing measurements on Feng Yun 3-D meteorological satellite
Yungang Wang
Liping Fu
Fang Jiang
Xiuqing Hu
Chengbao Liu
Xiaoxin Zhang
Jiawei Li
Zhipeng Ren
Lingfeng Sun
Ling Sun
Zhongdong Yang
Peng Zhang
Jingsong Wang
Tian Mao
The Ionospheric Photometer (IPM) is carried on the Feng Yun 3-D (FY3D) meteorological satellite, which allows for the measurement of far-ultraviolet (FUV) airglow radiation in the thermosphere. IPM is a compact and high-sensitivity nadir-viewing FUV remote sensing instrument. It monitors 135.6 nm emission in the nightside thermosphere and 135.6 nm and N2 Lyman–Birge–Hopfield (LBH) emissions in the dayside thermosphere that can be used to invert the peak electron density of the F2 layer (NmF2) at night and the 2 ratio in the daytime, respectively. Preliminary observations show that the IPM could monitor the global structure of the equatorial ionization anomaly (EIA) structure around 02:00 LT using atomic oxygen (OI) 135.6 nm nightglow. It could also identify the reduction of 2 in the high-latitude region during the geomagnetic storm of 26 August 2018. The IPM-derived NmF2 agrees well with that observed by four ionosonde stations along 120∘ E with a standard deviation of 26.67 %. Initial results demonstrate that the performance of IPM meets the design requirements and therefore can be used to study the thermosphere and ionosphere in the future.
- Article
(7240 KB) - Full-text XML
- BibTeX
- EndNote


The Earth's far-ultraviolet (FUV) airglow radiation from the thermosphere includes the emission of H, O, and N2 and the absorption of O2 (Meier, 1991). The atomic oxygen (OI) 135.6 nm nightglow emission, which is mainly produced by the recombination of ionospheric O+ and electrons, represents the spatial and temporal variations of the ionosphere in the nighttime. The 135.6 nm and N2 Lyman–Birge–Hopfield (LBH) dayglow emissions, which are produced by energetic photon-electron impact excitation of the neutral atmosphere, are used to derive the column 2 in the sunlit disk. The Earth's atmosphere is opaque to the FUV radiation due to the lower atmosphere absorption. The background emission of FUV airglow from the Earth's surface is absent. Thus, FUV airglow radiation is particularly well suited to space-based remote sensing (Paxton et al., 2003; Budzien et al., 2019). In past decades, FUV spectrography has been used extensively in studying the thermosphere and ionosphere from satellites, such as GUVI (the Global Ultra-Violet Imager) on the NASA TIMED (Thermosphere, Ionosphere, Mesosphere Energetics and Dynamics) satellite (Christensen et al., 2003) and the Far Ultraviolet Imager (FUV) on the NASA IMAGE (Imager for Magnetopause-to-Aurora Global Exploration) satellite (Sagawa et al., 2005). The other useful instrument is ionospheric photometer, which is compact and highly sensitive. The photometer on the polar-orbiting Department of Defense satellite S3-4 was used to measure the airglow, aurora, and solar scatter radiance of the Earth's atmosphere (Huffman et al., 1980). The US Naval Research Laboratory gave the concept for a new class of ionospheric photometer 20 years ago. It was supplied in the Tiny Ionospheric Photometer (TIP) on the Constellation Observing System for Meteorology, Ionosphere, and Climate satellites (Anthes et al., 2008; Dymond et al., 2016), complemented and upgraded in TIP as part of the GPS Radio Occultation and Ultraviolet Photometry – Colocated (GROUP-C) experience on the International Space Station (Budzien et al., 2019, 2017), and notably improved in the Triple Tiny Ionospheric Photometer (Tri-TIP) in the Coordinated Ionospheric Reconstruction CubeSat Experience (Dymond et al., 2017; Stephan et al., 2018).
The compact and high-sensitivity nadir-viewing FUV Ionospheric Photometer (IPM) is one of 10 scientific payloads aboard the Feng Yun 3-D (FY3D) meteorological satellite. IPM monitors 135.6 nm emission in the nightside thermosphere and 135.6 nm and N2 LBH emissions in the dayside thermosphere by employing a filter wheel that adds two red-leak signal channels for daytime and nighttime red leaks, respectively. Red leaks refer to weak residual sensitivity of the sensor to detect unwanted wavelengths including visible light that is “redder” than ultraviolet (Budzien et al., 2019). The main scientific objectives of IPM are follows: (1) measure 135.6 nm emission in the nightside thermosphere to capture the large-scale structure of the low- and mid-latitude ionosphere. (2) Measure 135.6 nm and N2 LBH emissions in the dayside thermosphere to capture global variations 2 ratio and evolutions of the thermosphere and ionosphere during extreme space weather events. The FY3D is an afternoon Sun-synchronous satellite with an orbit altitude of 830 km, an inclination of 98.75∘, and orbit period of ∼ 102 min, and is designed for weather forecast, atmospheric chemistry, climate change monitoring, and space weather monitoring. The FY3D satellite was launched at 18:35 UTC on 14 November 2017 from the Taiyuan Satellite Base, Shanxi province, China. This paper presents instrumental descriptions and initial observations by IPM.
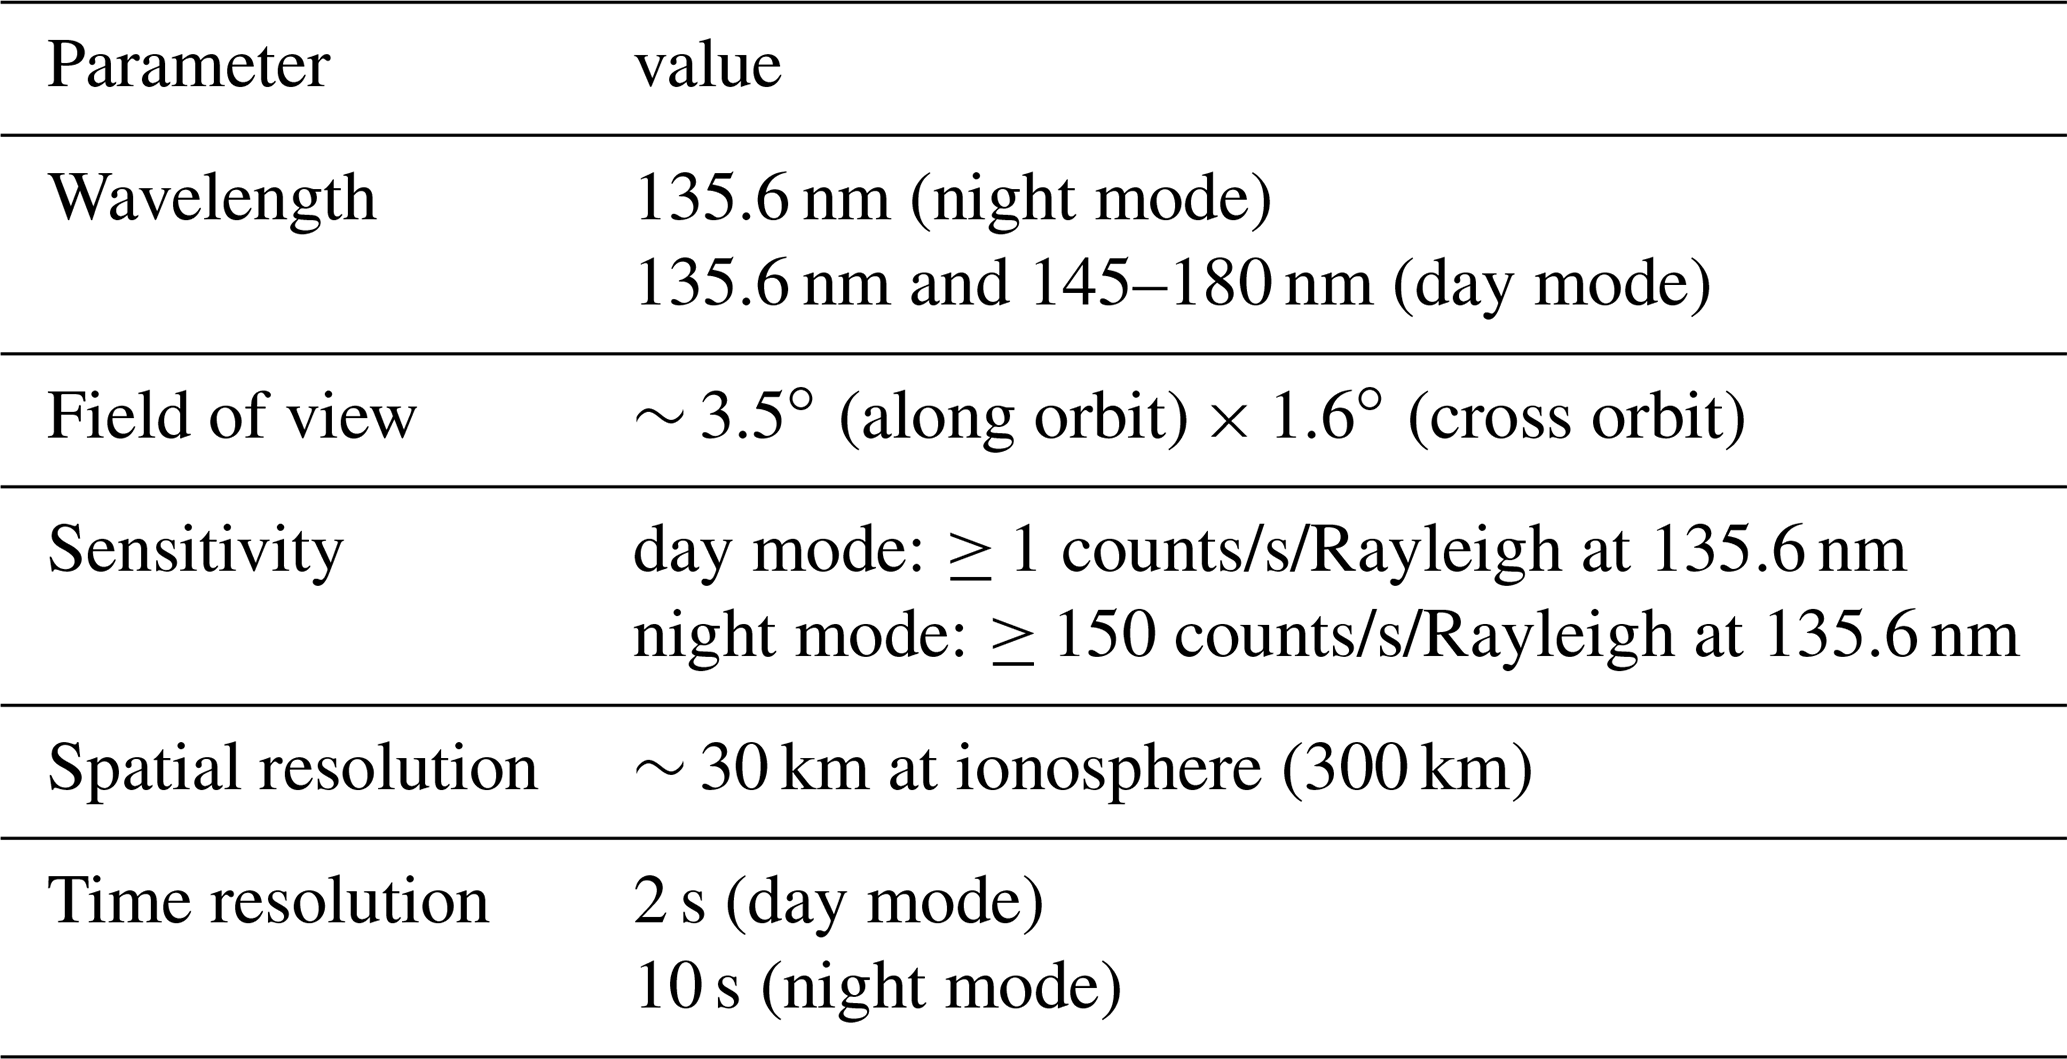
2.1 Instrument parameter requirements
According to the two main scientific objectives mentioned above, the IPM instrument requirements are summarized in the Table 1. In the design of the ionospheric photometer, there are two important problems to be solved. One problem is red leak. It is a major challenge to ionospheric photometers that visible light radiation from the Sun is about 109 times more than FUV radiation. The other problem is that ionospheric photometers need to eliminate 130.44 nm and shorter wavelengths airglow and collect 135.6 nm airglow emissions with high sensitivity.
2.2 Composition, channel, and mode
The IPM instrument is shown in Fig. 1 and includes a telescope, a filter wheel, a detector system, and control electronics cabinet. The telescope has a field of view of 3.5∘ (along orbit) × 1.6∘ (cross orbit). An off-axis aluminum mirror coating MgF2 is used to collected airglow emission in the telescope. To suppress the longer wavelength radiance, a sunblind photomultiplier tube (PMT) (R10825, Hamamatsu) with cesium iodide (CsI) photocathode is used in the detector system (Fu et al., 2015). The quantum efficiency of the PMT with an effective area of 4 × 9.5 mm and is about 26 % at a wavelength of 135.6 nm, at 254 nm, and at 514 nm. The PMT has better than 10−4 rejection at wavelengths longer than 200 nm.

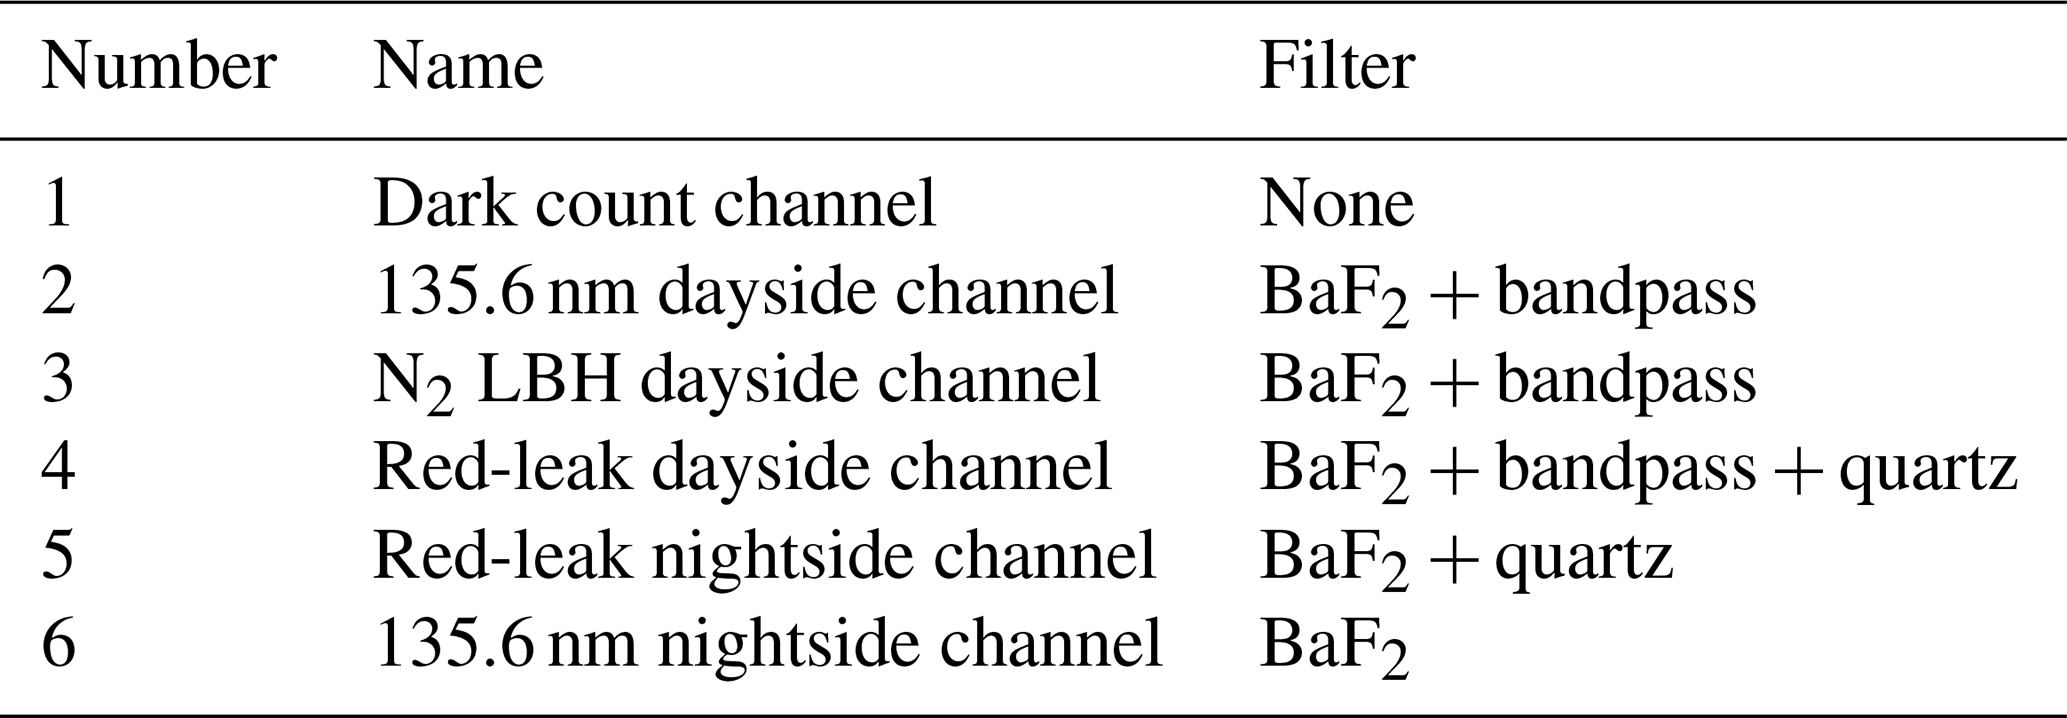
IPM monitors 135.6 nm emissions in the nighttime and 135.6 nm and N2 LBH emissions in the daytime by employing a filter wheel. There are six spots in the filter wheel (Fig. 1c) corresponding to six channels of IPM: dark count channel, 135.6 nm nightside channel, red-leak nightside channel, red-leak dayside channel, N2 LBH dayside channel, and 135.6 nm dayside channel. The channel information of IPM is shown in Table 2. In order to suppress the longer wavelength radiance further, the bandpass filter centered on 135.6 nm is used in the 135.6 nm dayside channel, and the bandpass filter centered on 160 nm is used in the N2 LBH channel. Besides, IPM specifically adds two red-leak signal channels for daytime and nighttime red leaks, respectively. Based on the design of dayside or nightside channel, a SiO2 filter is added in the red-leak channels in order to eliminate longer than 180 nm wavelengths. By differencing the measurements of dayglow channels and red-leak dayside channel, dayglow radiations can be detected. And by differencing the measurements of 135.6 nm nightside channel and red-leak nightside channel, 135.6 nm radiation in the nighttime can be detected. To exclude radiation shorter than 135.6 nm completely, a 0.5 mm thin vacuum ultraviolet (VUV)-grade barium fluoride (BaF2) flat filter is used, and the transmittance at 135.6 nm at room temperature is 0.5 (Fu et al., 2015). The emission of wavelengths shorter than 132 nm cannot pass the 0.5 mm thick BaF2 filter over a temperature range of 5 to 35 ∘C.
IPM has two observation modes: day mode and night mode. The day mode includes four observations of the 135.6 nm dayside channel, four observations of the N2 LBH channel, two observations of the red-leak dayside channel, and one dark count observation in each frame. The night mode includes eight observations of the 135.6 nm night channel, one observation of the red-leak nightside channel, and one dark count observation.
2.3 Laboratory calibration
The IPM was calibrated at ground laboratory prior to flight. The optical calibration facility at ground has a deuterium lamp, a monochromator, a collimator, a diffuser, a National Institute of Standards and Technology (NIST) standard detector, and a vacuum chamber assembled in a modular pattern (Fig. 2). The deuterium lamp (L11798) with a MgF2 window has 150 W power and provides a bright, stable source of FUV radiation. The source of FUV radiation is wavelength selected by the monochromator (234/302) which has a f/4.5 0.2 m Czerny–Turner with a 1200 grooves mm−1 grating. A collimator ensures that the beam consists of parallel rays. The NIST standard detector (AXUV-100G) traced from NIST provides a reference for calibrating IPM.

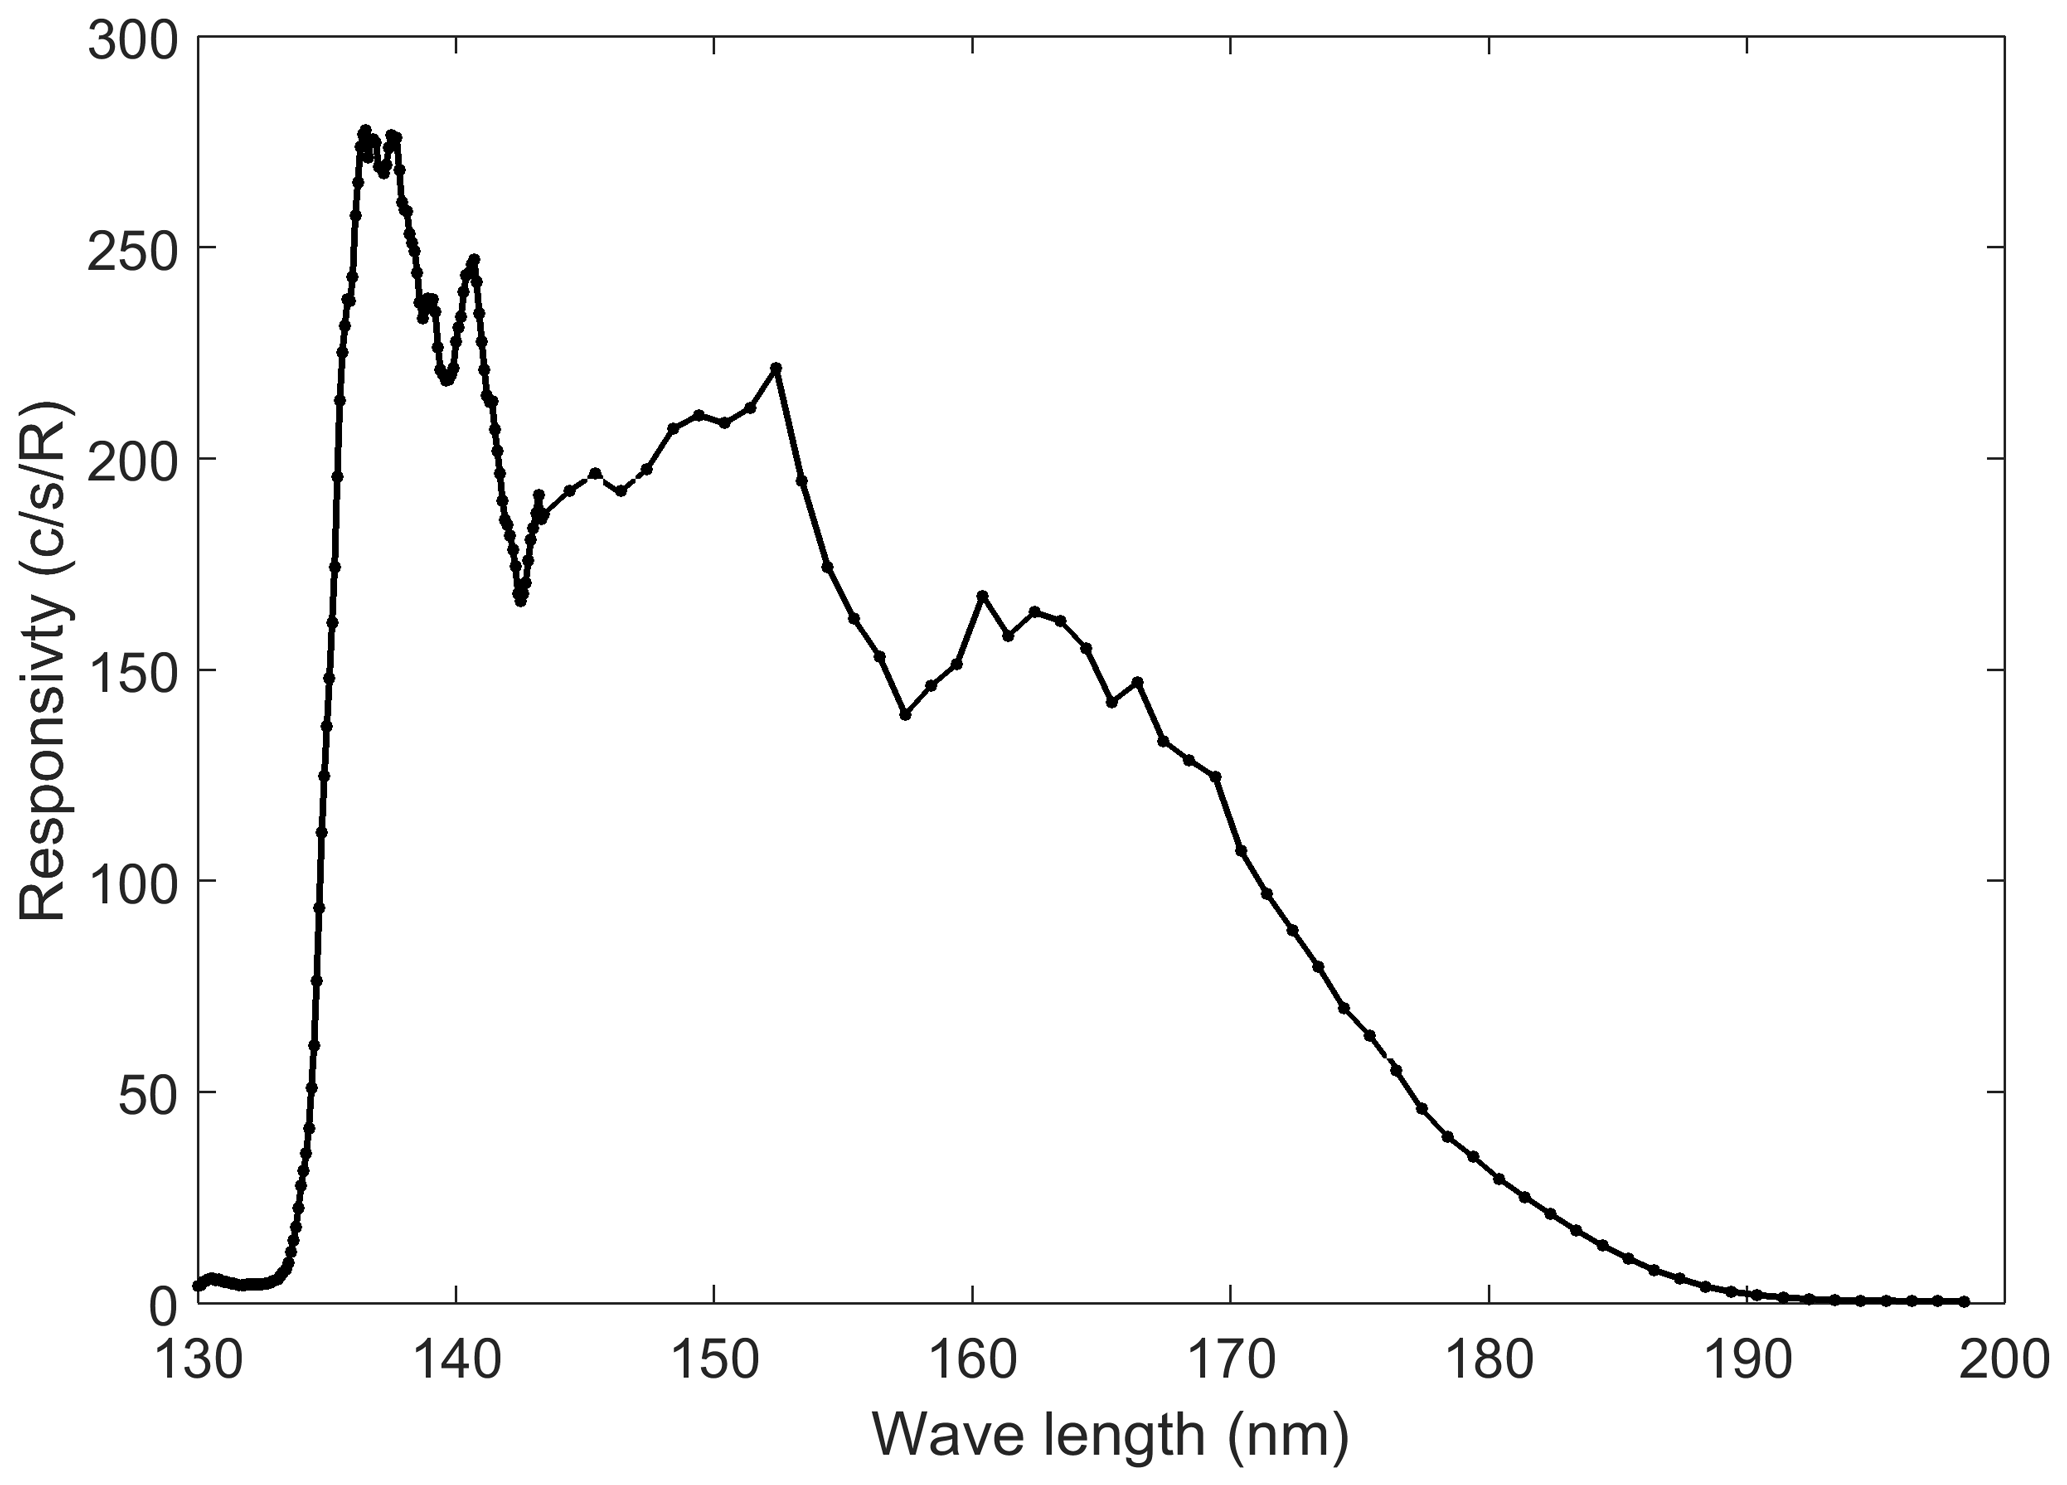
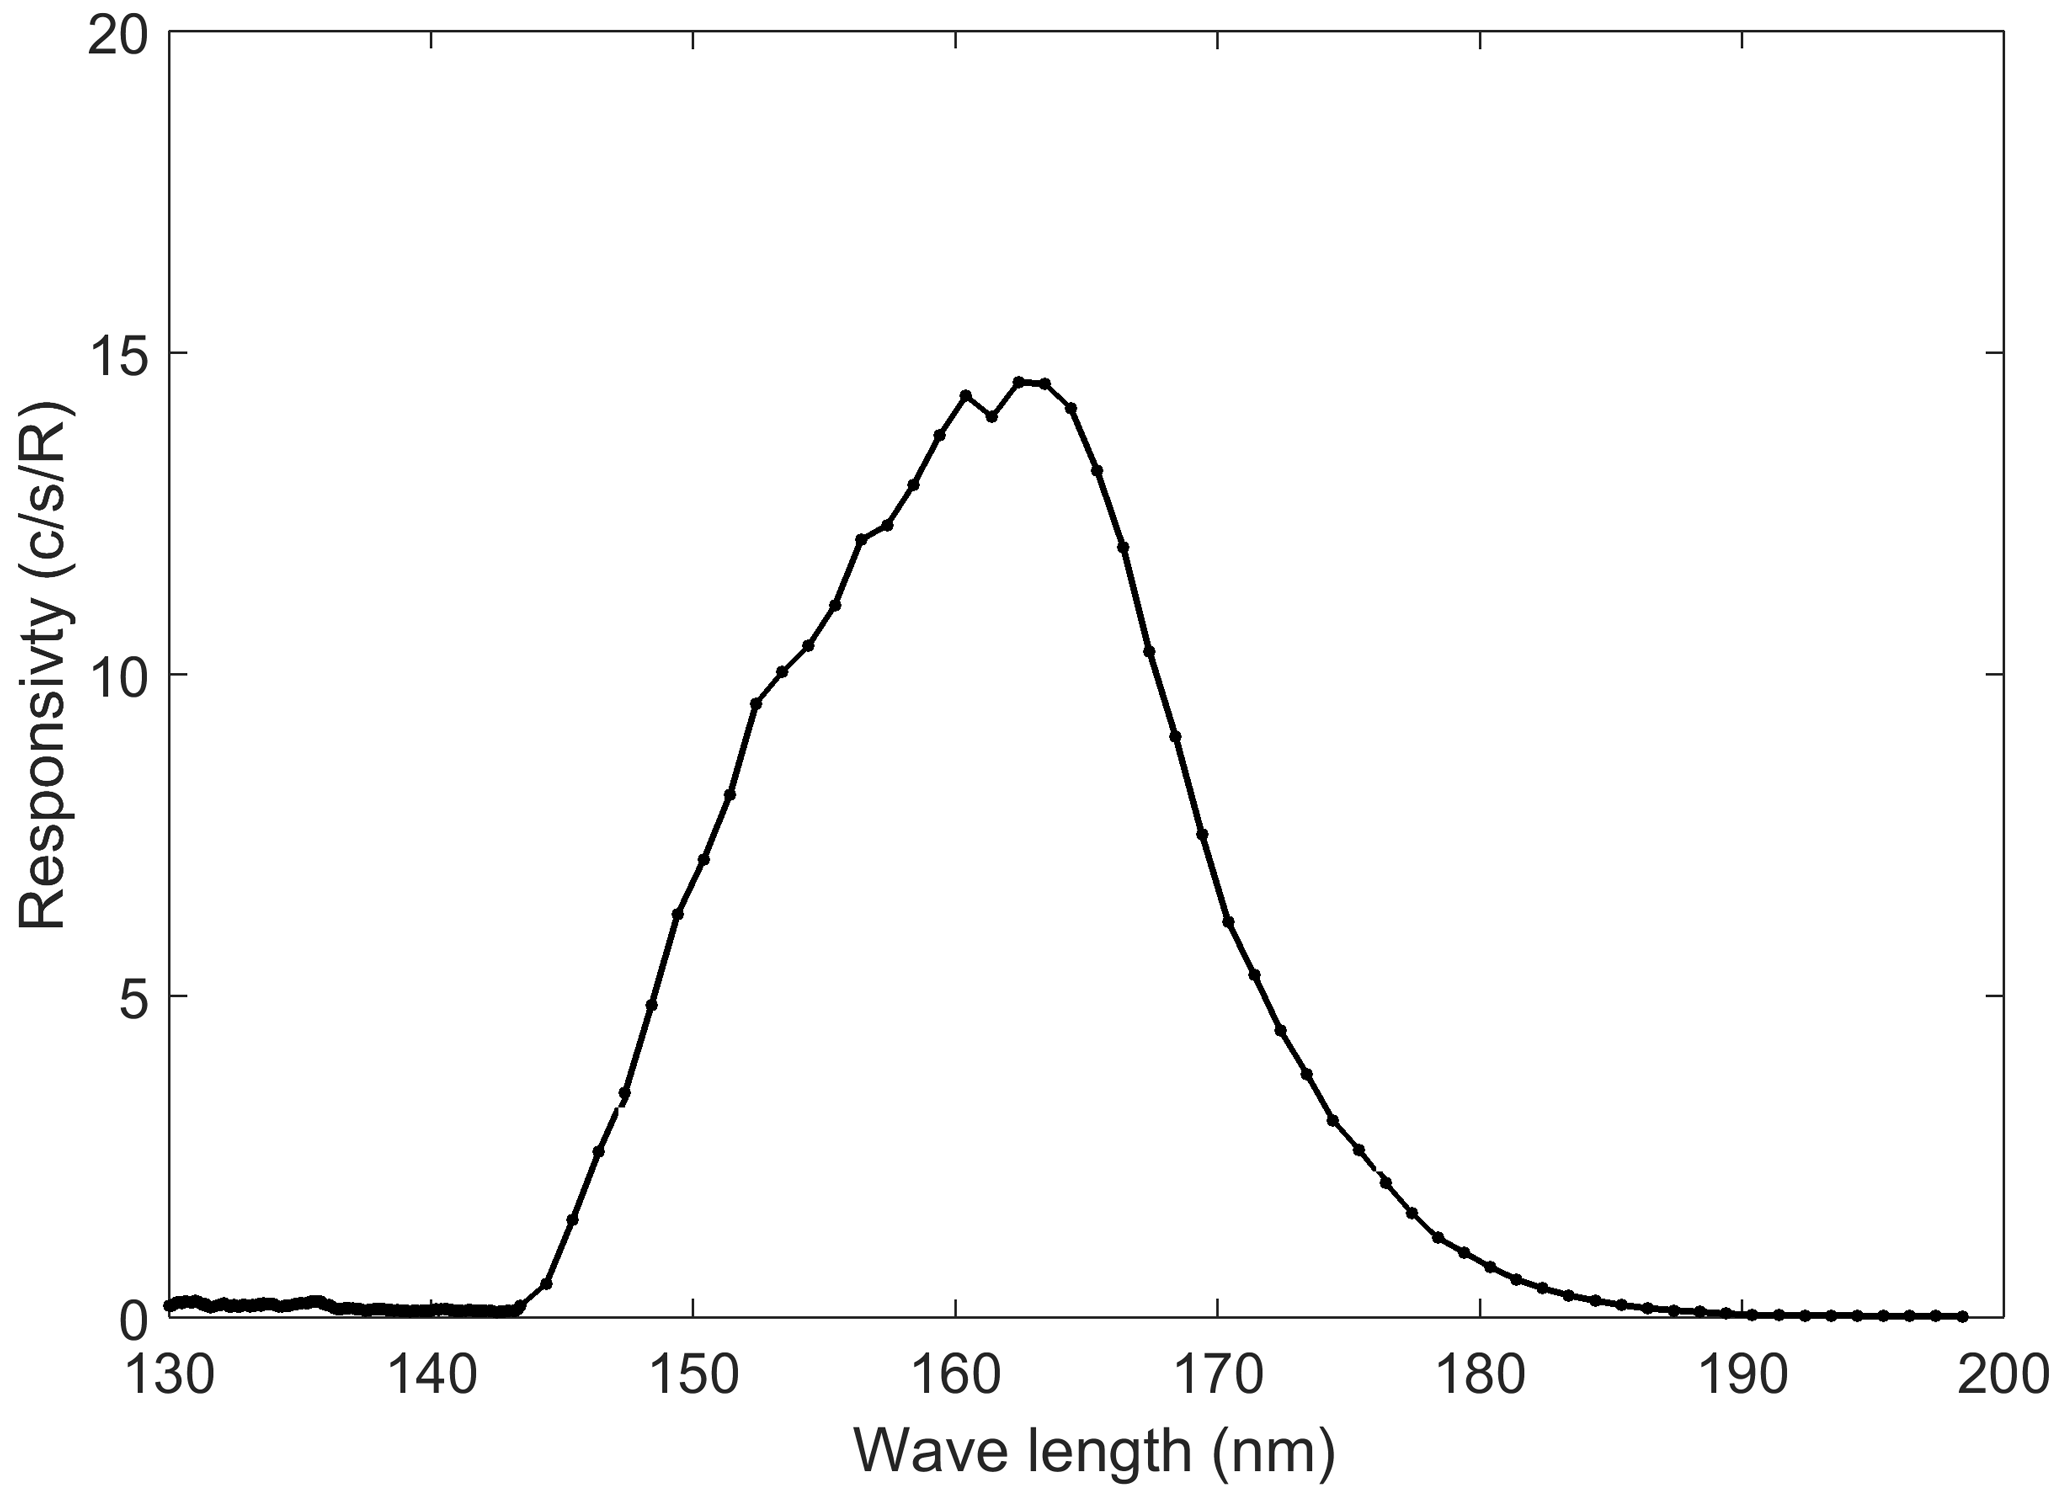
The processes of calibration are as follows: first, the FUV light at 125–200 nm from the deuterium lamp is selected by the monochromator. Second, the wavelength selected reaches the NIST standard detector through the collimator, and the NIST standard detector obtains the irradiance of the wavelength selected. And then, by using a rotating platform, the wavelength selected reaches the diffuser board through the collimator and enters IPM. IPM obtains the signal for the wavelength selected. Finally, the count and irradiance of the wavelength selected are used in calculating the responsivity to the wavelength selected. The uncertainty of the ground calibration comes from the stability of the FUV light source, the error of the standard detector, the bi-directional reflection distribution function (BRDF) uncertainty of the diffuser board, the non-uniformity of the light source, and so on. The uncertainty of the ground calibration is estimated to reach 11.25 %. As a function of wavelength, the responsivity of the 135.6 nm nightside channel from 130 to 200 nm is shown in Fig. 3. The responsivity to 135.6 nm radiation at night is about 266.9 counts/s/R near the peak of the responsivity function distribution and reaches the design requirement of the 135.6 nm nightside channel. The responsivity to 135.6 nm radiation at night provides high sensitivity in observations of OI 135.6 nm radiation at night.
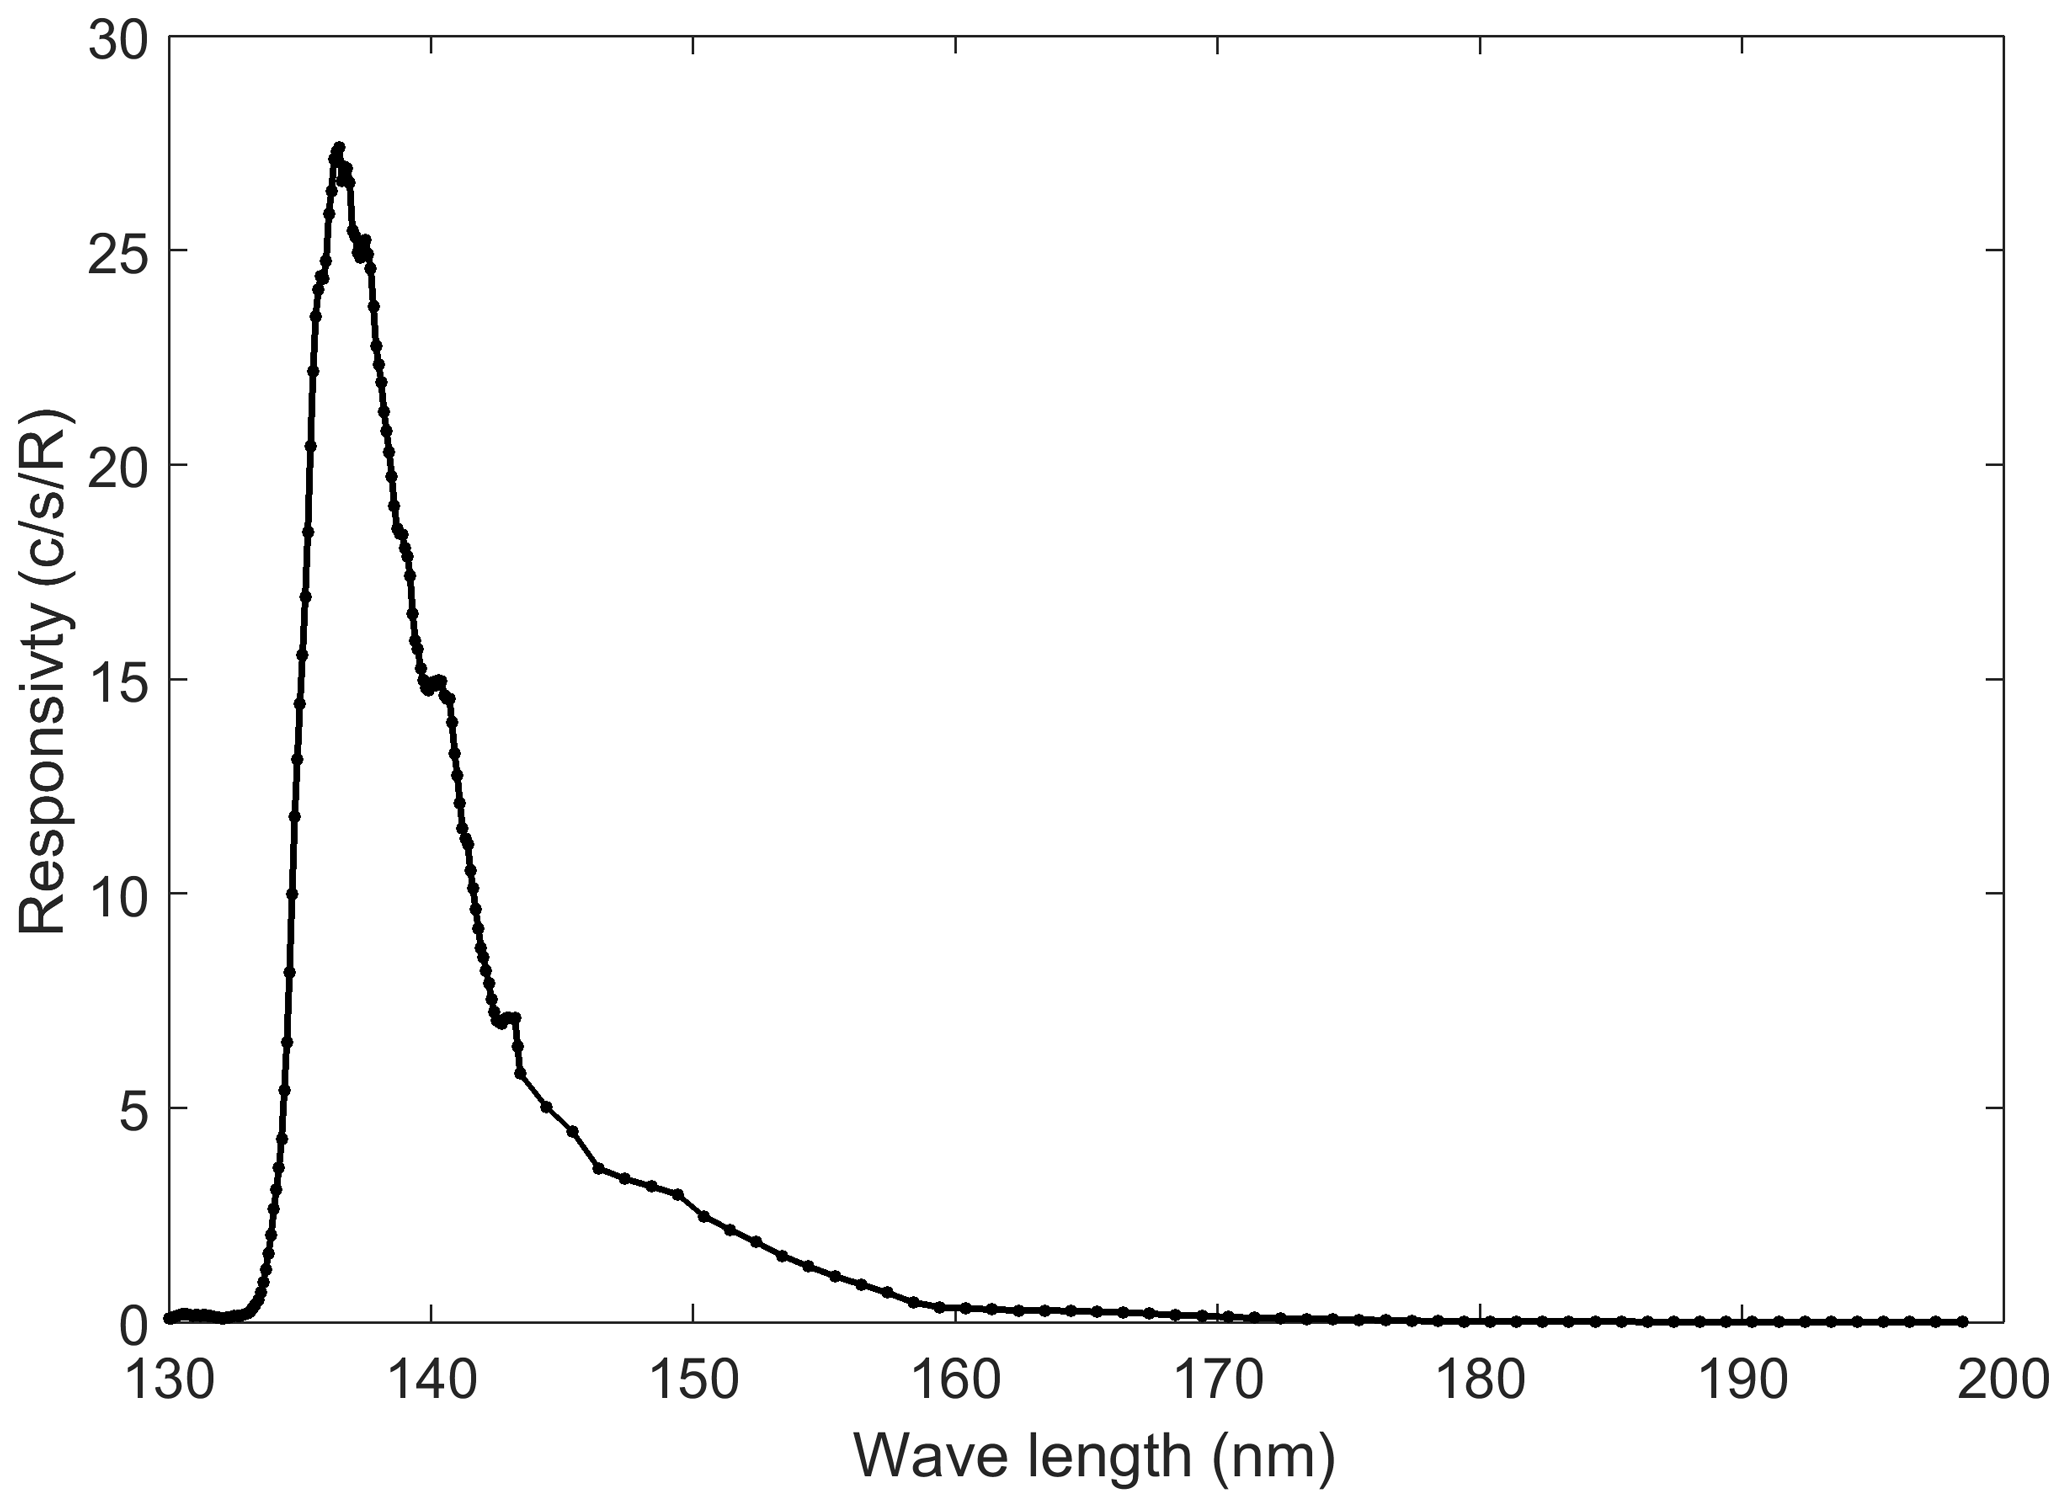
As a function of wavelength, the responsivity of the 135.6 nm dayside channel from 130 to 200 nm is shown in Fig. 4. The responsivity to the 135.6 nm radiation in daytime is about 23.2 counts/s/R and also reaches the design requirement of the 135.6 nm dayside channel. The responsivity is much less than the one on the nightside due to the bandpass used in the 135.6 nm dayside channel, which is designed to obtain the radiation of 135.6 nm in daytime and suppress the radiation at wavelengths shorter than 135.6 nm, N2 LBH, and red-leak contributions in daytime. The other bandpass is used in the N2 LBH day channel in order to obtain the radiation of N2 LBH and suppress the radiation of 135.6 nm and red-leak contributions in daytime. The responsivity of N2 LBH channel is shown in Fig. 5.
3.1 OI 135.6 nm emission on the nightside
After the FY3D satellite was launched at 18:35 UTC on 14 November 2017, IPM started operation at 10:20 UTC on 25 November 2017. In IPM data processing, dark count is used to confirm the working status of IPM. Generally, the dark count of IPM is less than 10 counts per second. When the FY3D satellite passes by the South Atlantic Anomaly (SAA), the dark count of IPM increases rapidly and reaches about 2000 counts per second due to the energetic particles in the SAA.

Figure 6The count of the 135.6 nm nightside channel with red leak (a, d), without red leak (c, f), and the count of the red-leak nightside channel (b, e). 17 March 2018 is the new moon day, and 31 March 2018 is full moon day.
The count of the 135.6 nm nightside channel is presented in Fig. 6. The count with red leak on 17 March 2018 (new moon) and on 31 March 2018 (full moon) are shown in panels (a) and (d), respectively. The counts without red leak on 17 and 3 March 2018 are shown in panels (c) and (f), respectively. The count of the 135.6 nm nightside channel in panel (d) is several times the count of the 135.6 nm nightside channel in panel (a) due to moonlight reflecting into the 135.6 nm nightside channel from cloud tops, while the count levels in panels (c) and (f) are very similar. We found that the red-leak nightside channel is effective to eliminate the contamination of moonlight on the 135.6 nm nightside channel.
An example of the global count of the 135.6 nm nightside channel is presented in Fig. 7a. The solid red line indicates the magnetic dip Equator. The data in Fig. 7 are from 7 to 11 December 2017. From 7 to 11 December 2017, Kp index was not more than 4, and the geomagnetic conditions were relatively quiet. As shown in Fig. 7a, there is a high-count area near the magnetic dip Equator in South America, which shows the contamination in SAA associated with particles impacting the instrument. An example of global brightness of the 135.6 nm nightside channel without red leak and the effect of dark count is presented in Fig. 7b. As shown in Fig. 7b, there are some brighter areas located on either side of the magnetic dip Equator in South America and Africa, which are the so-called equatorial ionization anomaly (EIA) structure. The EIA has been studied extensively by using data from ground-based ionosondes (Moffett and Hanson, 1965; Walker, 1981) and ground-based optical observations (Thuillier et al., 1976). The OI 135.6 nm emission data from GUVI aboard the TIMED satellite, FUV aboard the IMAGE satellite, and the TIP aboard the COSMIC satellites have also been used in study of the EIA phenomenon (Christensen et al., 2003; Sagawa et al., 2005; Immel et al., 2006 and Coker et al., 2009). The local time of the IPM orbit on the nightside is 02:00 LT. The EIA structure which we found at 02:00 LT is later than other results mentioned earlier, and it needs to be studied further.
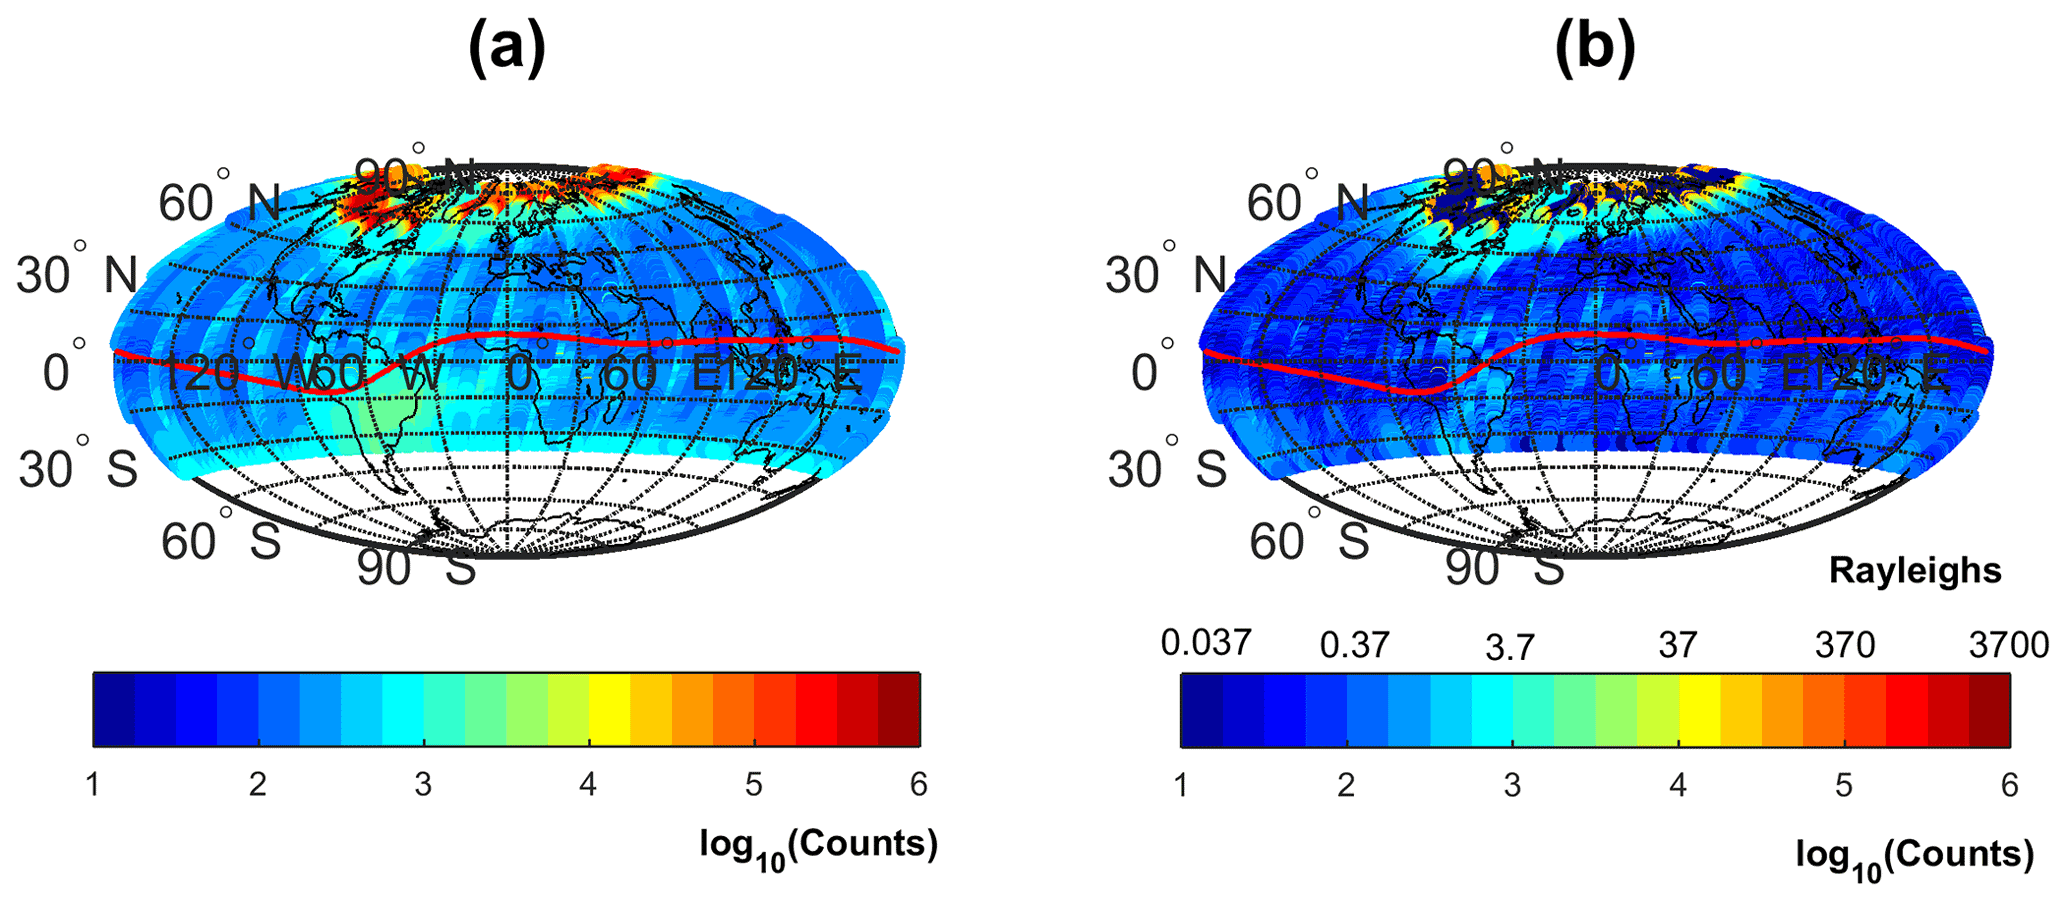
Figure 7The global count (a) and brightness (b) of the 135.6 nm nightside channel from 7 to 11 December 2017. The brightness is without red leak and the effect of dark count. The solid red line indicates the magnetic dip Equator.
3.2 NmF2 and total electron content
OI 135.6 nm emission is one of the strongest lines in the FUV nightglow at low latitudes and has relatively high transparency in the upper atmosphere. In the nightside ionosphere, there are two primary production mechanisms of OI 135.6 nm emission: (1) atomic oxygen is excited through the recombination of atomic oxygen ions with electrons and produces OI 135.6 nm emission; (2) atomic oxygen is excited through the mutual neutralization of O+ with O− and produces OI 135.6 nm emission (Meier, 1991). The mutual neutralization has a relatively smaller contribution. The brightness of OI 135.6 nm emission varies with the electron density and the oxygen ion concentration basically. Equivalently, OI 135.6 nm emission is approximately proportional to the square of the electron density in the F region.
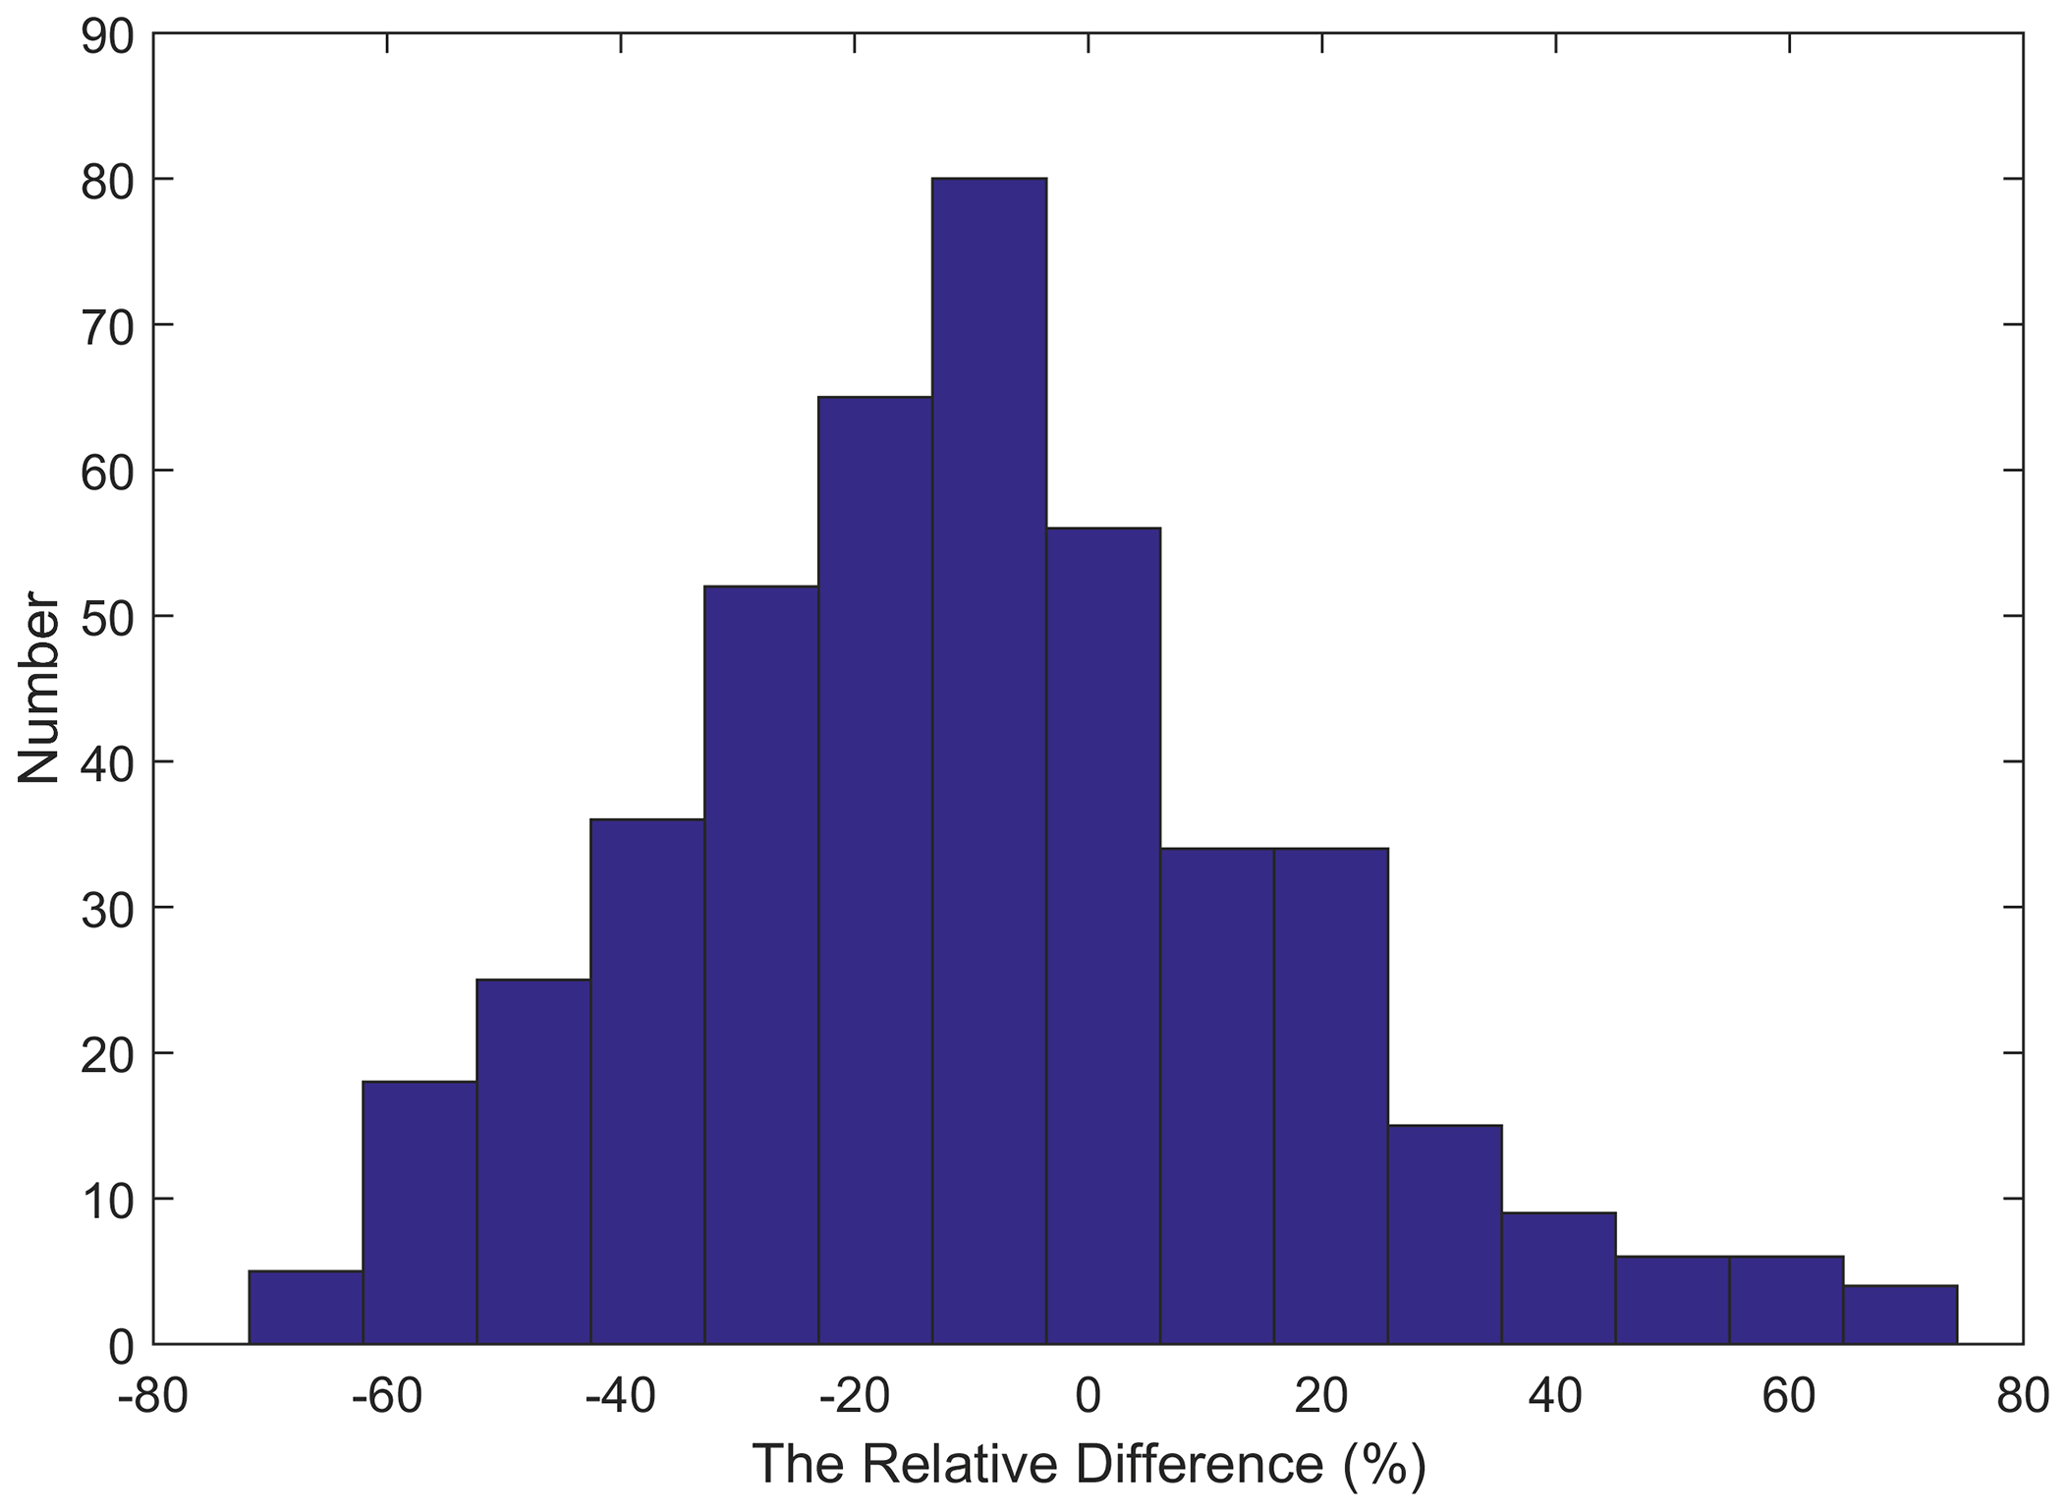
The algorithm of deriving NmF2 from the nighttime OI 135.6 nm emission is provided by Rajesh et al. (2011) and Jiang et al. (2014, 2018). The nighttime OI 135.6 nm emission is calculated based on a nighttime OI 135.6 nm airglow radiative and emissive model. The electron density profile, the O+ density profile, and the electron temperature profile are calculated using the IRI2000 model, and the neutral components are calculated using the MSISE90 model. The OI 135.6 nm emission is fitted to the square of NmF2 linearly. The ratio of the square of NmF2 to the OI 135.6 nm emission is obtained. Finally, NmF2 is retrieved based on the observed OI 135.6 nm emission and the ratio. We selected the IPM-derived NmF2 data which were near four Institute of Geology and Geophysics, Chinese Academy of Sciences (IGGCAS) ionosonde stations (Sanya (18.3∘ N, 109.6∘ E), Wuhan (30.5∘ N, 114.4∘ E), Beijing (40.3∘ N, 116.2∘ E), and Mohe (50.2∘ N, 122.5∘ E)) from 25 November 2017 to 8 May 2018 (shown in Fig. 8). Their difference in longitude was less than 12∘ and in latitude was less than 5∘. There is a standard deviation of 26.67 % between IPM NmF2 and IGGCAS ionosonde NmF2 (shown in Fig. 9).
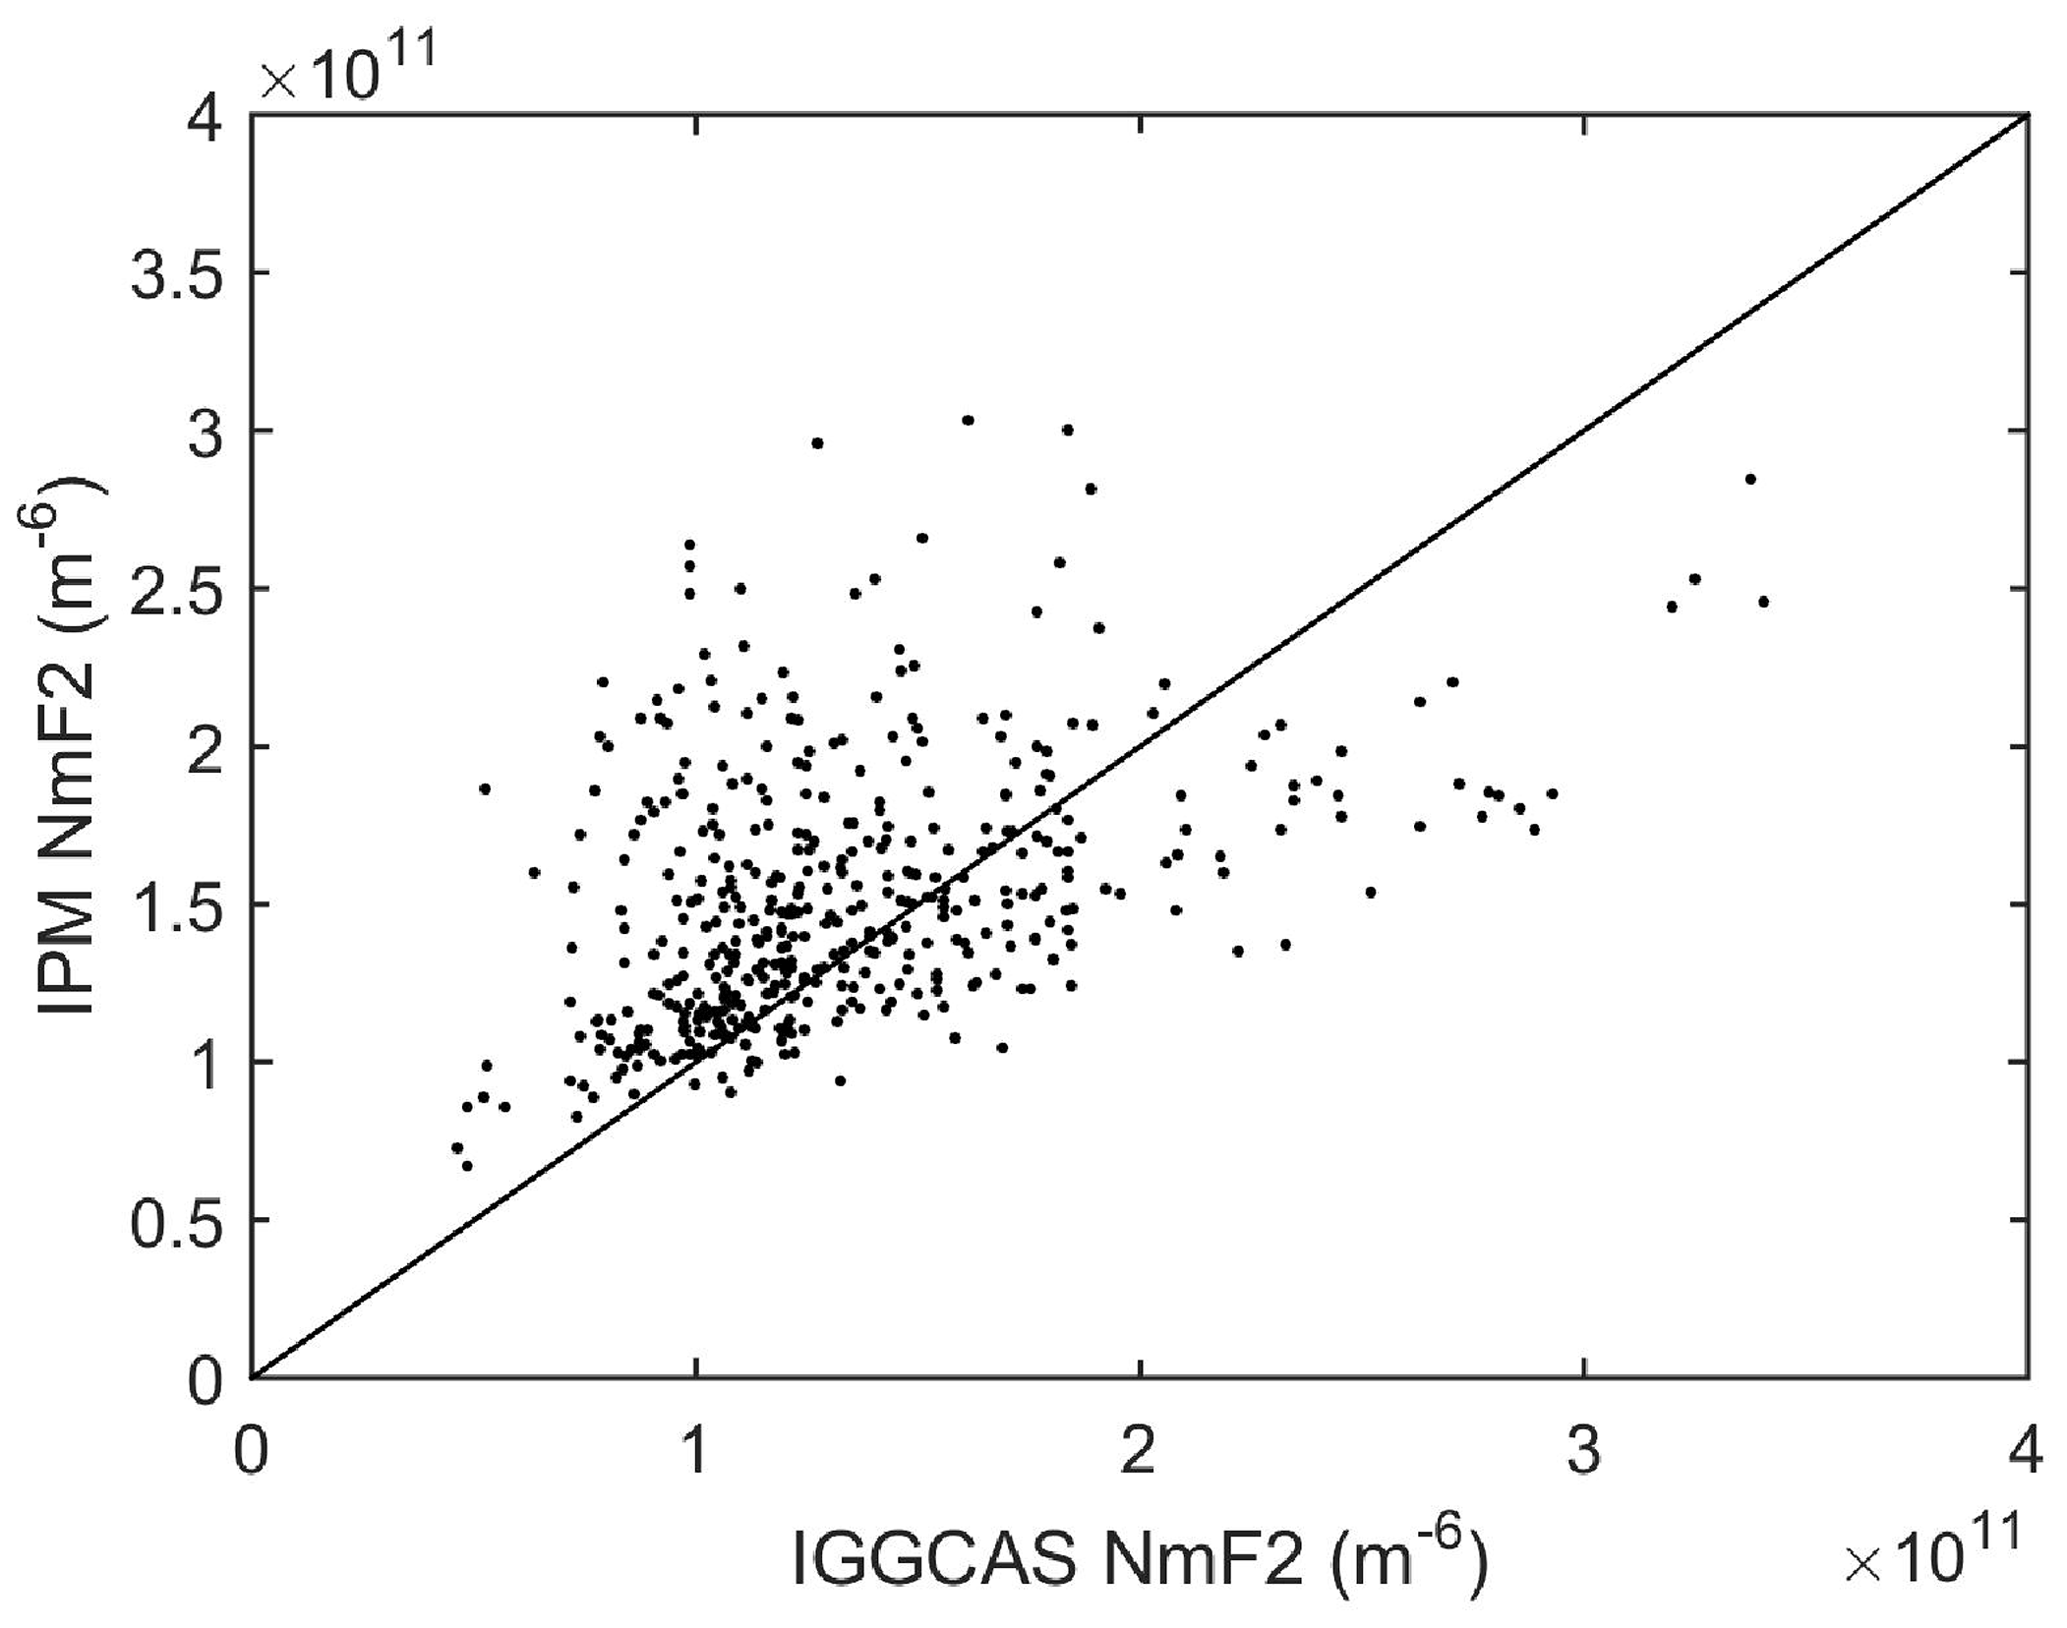
Figure 8IPM-derived NmF2 and IGGCAS ionosonde NmF2 from 25 November 2017 to 8 May 2018. (The longitude difference between the IPM substellar point and ionosonde stations is less than 12∘, and the latitude difference is less than 5∘.)
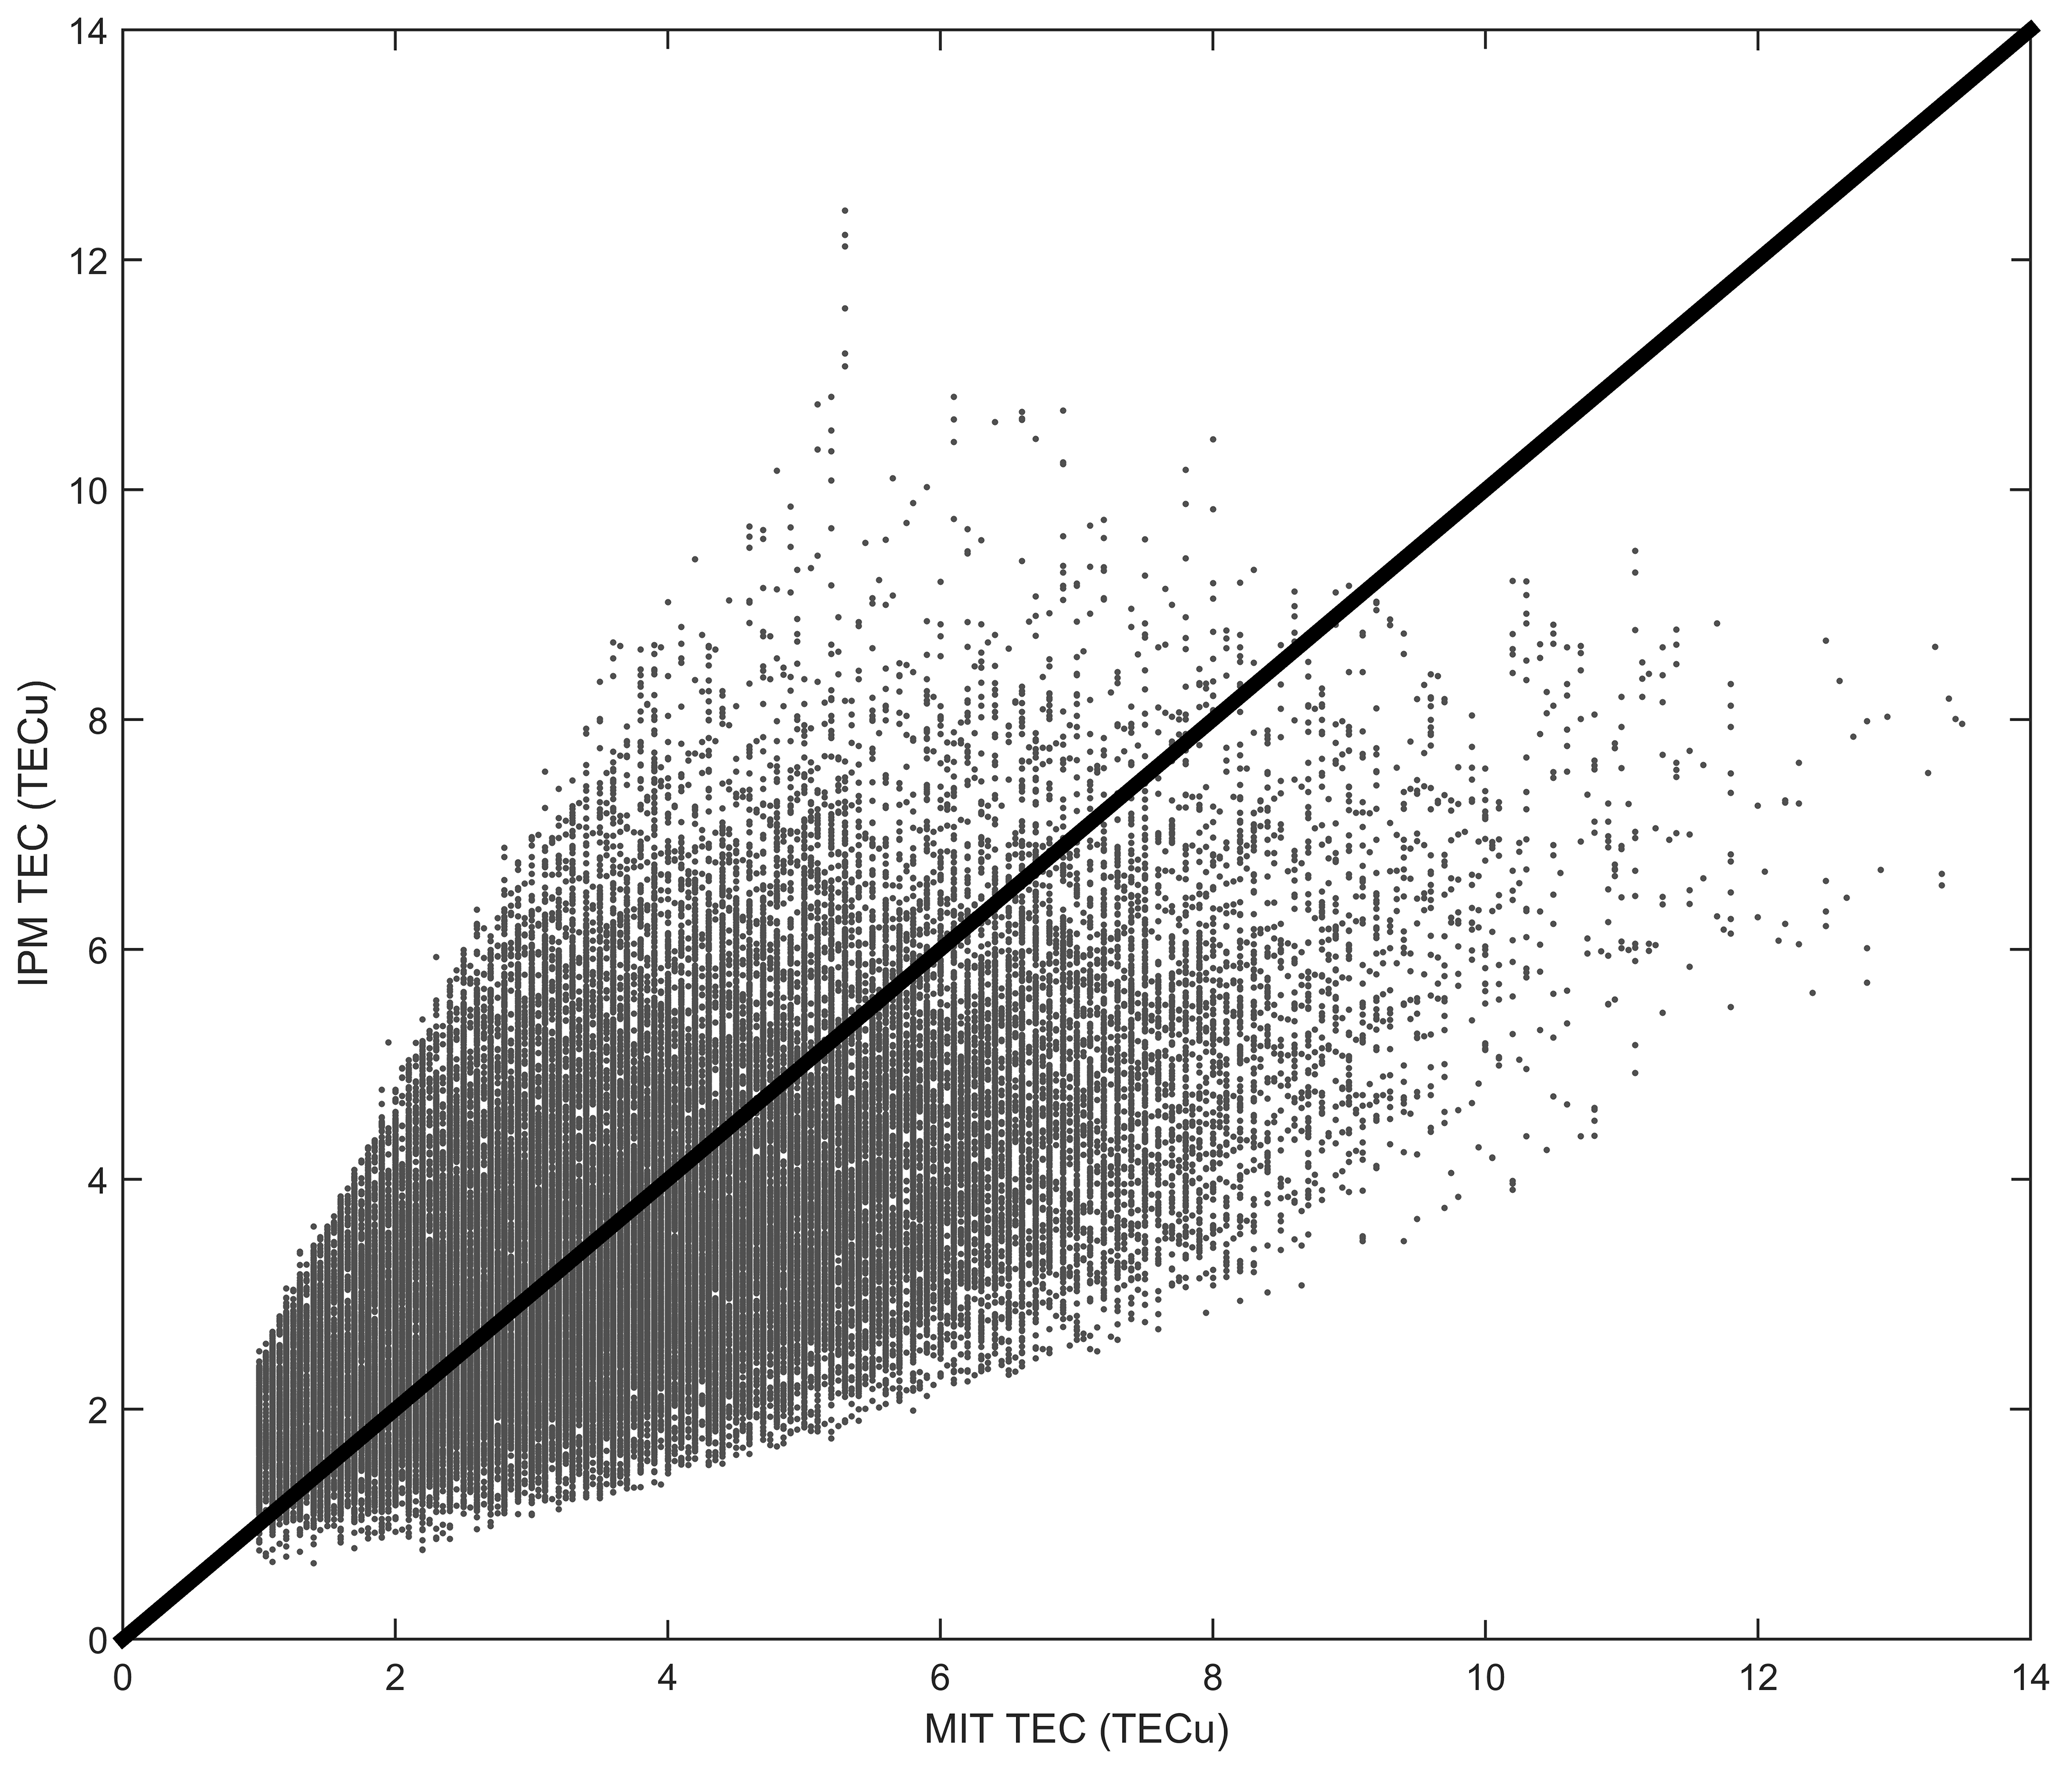
The algorithm of deriving total electron content (TEC) from the nighttime OI 135.6 nm emission is provided by Rajesh et al. (2011) and Jiang et al. (2014). The process of deriving TEC based on the ratio between TEC and the nighttime OI 135.6 nm emission intensity is similar to that of deriving NmF2. We further calculated TEC from IPM results and compared with that of MIT TEC data from 25 November 2017 to 8 April 2018. The MIT TEC data (Rideout and Coster, 2006) was obtained from the MIT Haystack Observatory Madrigal database (http://www.openmadrigal.org, last access: 29 June 2021). There is a standard deviation of 39.41 % between IPM TEC (total electron content unit, TECu) and MIT TEC (TECu) (shown in Fig. 10). The standard deviation between IPM TEC (TECu) and MIT TEC (TECu) is more than the one between IPM NmF2 and IGGCAS ionosonde NmF2. MIT TEC is integrated from ground to 20 200 km. It includes plasmasphere contribution and ionosphere contribution. IPM TEC is integrated from ground to 830 km; it only includes ionosphere contribution. There is diurnal interchange between the ionosphere and the plasmasphere, the downward diffusion from the plasmasphere helps to maintain the nighttime F2 layer. The results of Jason-1, MetOp-A, and TerraSAR-X (Yizengawa et al., 2008; Zakharenkova and Cherniak, 2015; Klimenko et al., 2015) show that the plasmasphere contribution at night cannot be neglected.
3.3 ON2
Energetic photon–electron impact excitation of the neutral atmosphere produces 135.6 nm emission and N2 LBH emission, which are proportional to the concentration of O and N2, respectively (Meier, 1991). The 135.6 nm emission and N2 LBH emission can be used to derive column 2. The derivation of 2 from disk 135.6 nm and N2 LBH dayglow observations was first addressed by Strickland et al. (1995), and the topic of 2 from 135.6 nm emission and N2 LBH emission has been studied extensively (Christensen et al., 2003; Strickland et al., 2004; Zhang et al., 2014). During geomagnetic storms, enhanced joule and particle heating in the high-latitude ionosphere produces upwelling of the oxygen-depleted or nitrogen-rich air. The upwelling rises from much lower in the thermosphere into the F region. The heating also leads to enhanced horizontal equatorward neutral winds that can change the distribution of the nitrogen-rich/oxygen-depleted air.
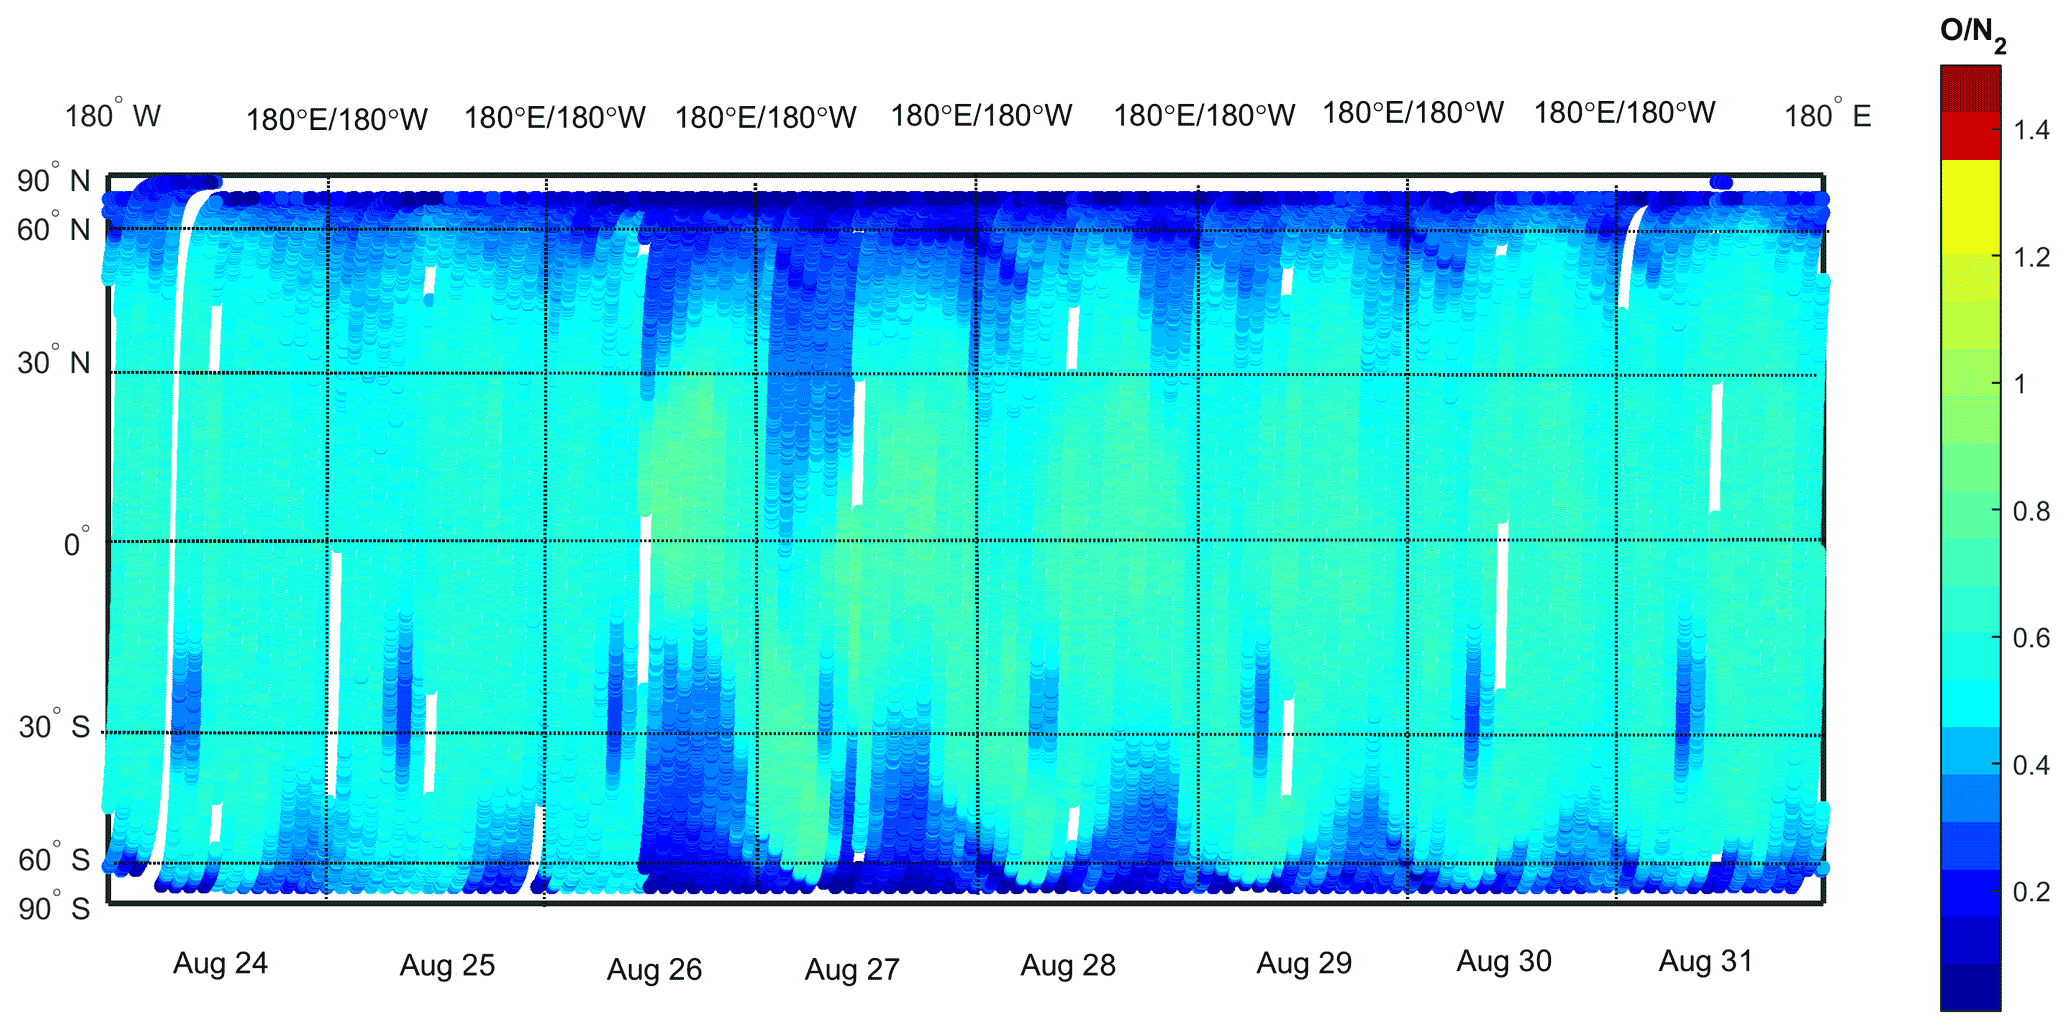
Giving an N2 depth of 1017 cm−2, column O and N2 ratio is derived from the value at a given solar zenith angle (SZA) by two-dimensional interpolation. The retrieval algorithm was described by Strickland et al. (1995) and Zhang et al. (2014). The brightness of the 135.6 nm emission and the N2 LBH emission on the dayside was derived from observations of the 135.6 nm dayside channel and the N2 LBH dayside channel, respectively. In order to further deduct the red leak from the cloud tops, we used a Butterworth filter in the data processing. The input parameters of the filter were optimized according to the red leak from the cloud tops. The improved AURIC model (Wang and Wang, 2016) was used to produce a simulation. The simulation provided the coefficient for deriving 2 from a measured pair of 135.6 nm and LBH. The column 2 ratio during the magnetic storm of 26 August 2018 is presented in Fig. 11. On 24 August and most of 25 August 2018, Kp index was not more than 3. It abruptly rose to 7 in 26 August 2018. From 29 to 31 August 2018, Kp index was not more than 3. The column 2 on 24 and 25 August was relatively quiet, and significant changes in column 2 occurred on 26 and 27 August. The reduction of 2 extended from the high-latitude region to mid- and low-latitude regions in the Northern Hemisphere and Southern Hemisphere. On 30 and 31 August, column 2 returned to a quiet state.
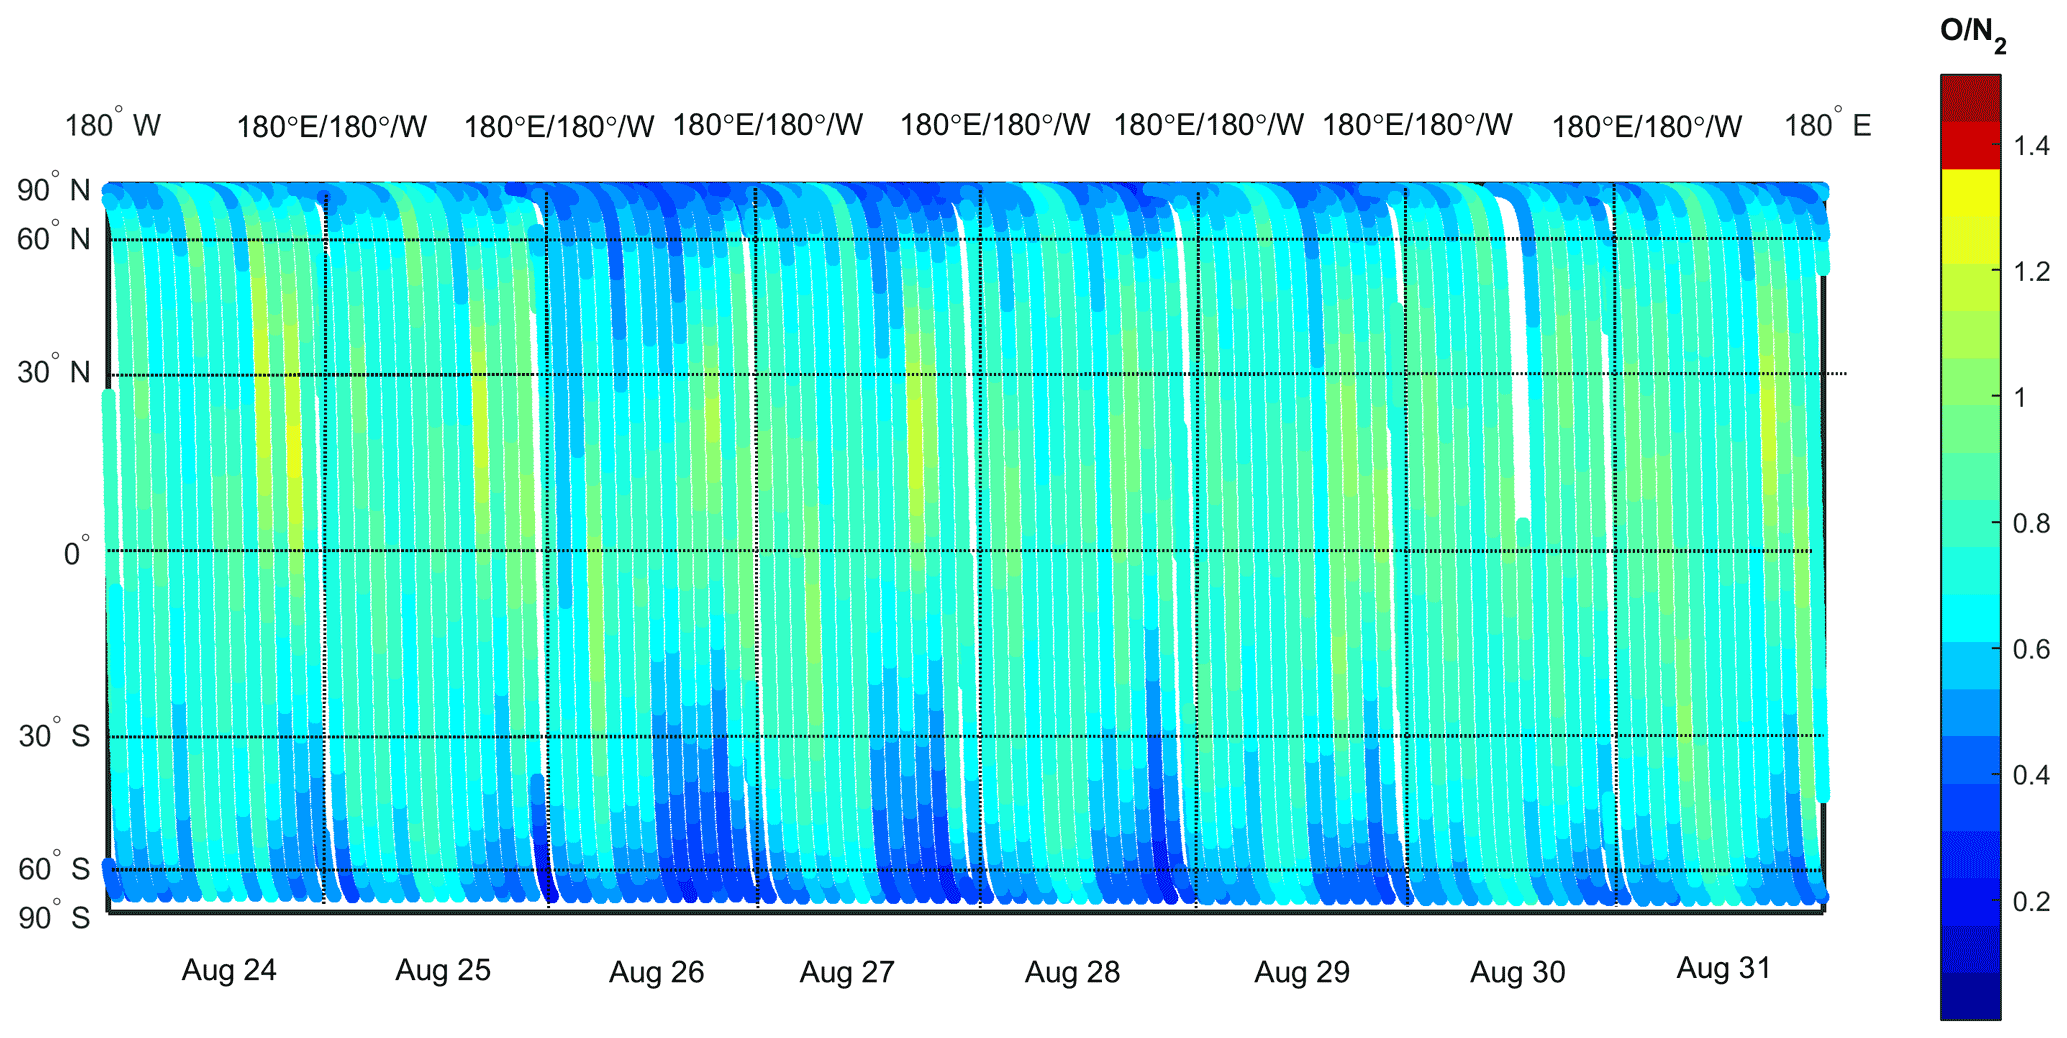
The column O and N2 ratio derived from GUVI during the magnetic storm of 26 August 2018 is presented in Fig. 12. The GUVI column 2 data (Strickland et al., 2004) was obtained from the GUVI website (http://guvitimed.jhuapl.edu/data_fetch_l3_on2_idlsave, last access: 30 December 2021). The column 2 from GUVI on 24 and 25 August was relatively quiet, and significant changes in column 2 occurred on 26 and 27 August. The reduction of 2 also extended from the high-latitude region to mid- and low-latitude regions in the Northern and Southern Hemisphere. On 30 and 31 August, the column 2 of GUVI also returned to a quiet state. The features of column 2 of IPM and GUVI during the magnetic storm of 26 August 2018 were similar. These results showed that the IPM data could provide a good monitoring of 2 changes during the magnetic storm.
The FY3D meteorological satellite was launched at 18:35 UTC on 14 November 2017 from the Taiyuan Satellite Base, Shanxi province, China. The Ionospheric Photometer instrument carried aboard the FY3D meteorological satellite measures the spectral radiance of the Earth far-ultraviolet airglow in the spectral region from 133 to 180 nm. IPM is a tiny, highly sensitive, and robust remote sensing instrument. Preliminary observations show that the IPM could monitor the global structure of the equatorial ionization anomaly structure around 02:00 LT using OI 135.6 nm nightglow properly. It could also identify the reduction of 2 in the high-latitude region during the geomagnetic storm of 26 August 2018. The IPM-derived NmF2 agrees well with that observed by four ionosonde stations along 120∘ E with a standard deviation of 26.67 %. Initial results demonstrate that the performance of IPM meets the design requirements and therefore can be used to study the thermosphere and ionosphere in the future.
Data are available at http://satellite.nsmc.org.cn/PortalSite/Default.aspx (FENGYUN Satellite Data Center, 2018). Data can be searched and downloaded from the website after registration.
YW and TM performed the data validation and prepared the paper and most of the plots; LF and FJ designed the IPM and provided laboratory calibration data; XH, CL, XZ, JL, LS, ZY, PZ, and JW participated in instrument parameter requirements, judging of instrument design, and data validation; ZR, FH, and LS participated in validation and intercomparisons.
The contact author has declared that neither they nor their co-authors have any competing interests.
Publisher’s note: Copernicus Publications remains neutral with regard to jurisdictional claims in published maps and institutional affiliations.
This research has been supported by the Natural Science Foundation of China (grant nos. 41874187, 41774195, and 41931073) and the Fengyun Satellite Ground Application System.
This paper was edited by Jörg Gumbel and reviewed by two anonymous referees.
Anthes, R. A., Bernhardt, P. A., Chen, Y., Cucurull, L., Dymond, K. F., Ector, D., Healy, S. B., Ho, S., Hunt D. C, Kuo, Y., Liu, H., Maning, K., McCormick, C., Meehan, T. K., Randel, W. J., Rocken, C., Schreiner, W. S., Sokolovskiy, S. V., Syndergaard, S., Thompson, D. C., Trenberth, K. E., Wee, T., Yen, N. L., and Zeng, Z.: The COSMIC/FORMOSAT-3 mission: early results, B. Am. Meteor. Soc., 89, 313–333, https://doi.org/10.1175/BAMS-89-3-313, 2008.
Budzien, S., Powell, S., O'Hanlon, B., Bishop, R., Humphreys, T., and Stephan, A.: Early Results and Ionospheric Observations from GROUP-C on the ISS, 15th International Ionospheric Effects Symposium, Alexandria, Virginia, Paper 11A3, 2017.
Budzien, S., Fritz, B., Stephan, A., Marquis, P., Powell, S., O'Hanlon, B., Nicholas, A., Dymond, K., and Brown, C.: Comparison of second and third generation 135.6 nm ionospheric photometers using onorbitand laboratory results, Proc. SPIE 11131, CubeSats and SmallSats for Remote Sensing III, 1113102, https://doi.org/10.1117/12.2528791, 2019.
Christensen, A. B., Paxton, L. J., Avery, S., Craven, J., Crowley, G., Humm, D. C., Kill, H., Mejer, R. R., Meng, C., Morrison, D., Ogorzalek, B. S., Straus, P., Strickland, D. J., Swenson, R. M., Walterscheid, R. L., Wolven, B., and Zhang, Y.: Initial observations with the Global Ultraviolet Imager (GUVI) in the NASA TIMED satellite mission, J. Geophys. Res., 108, 1–16, https://doi.org/10.1029/2003JA009918, 2003.
Coker, C., Dymond, K. F., Budzien, S. A., Chua, D. H., Liu, J., Anderson, D. N., Basu, S., and Pedersen, T. R.: Observations of the ionosphere using the tiny ionospheric photometer, Terr. Atmos. Ocean. Sci., 20, 227–235, https://doi.org/10.3319/TAO.2008.01.18.02(F3C), 2009.
Dymond, K. F., Budzen, S. A., Coker, C., and Chua, D. H.: The Tiny Ionospheric Photometer (TIP) on the Constellation Observing System for Meteorology, Ionosphere, and Climate (COSMIC/FORMOSAT-3), J. Geophys. Res. Space, 121, 10614–10622, https://doi.org/10.1002/2016JA022900, 2016.
Dymond, K. F., Nicholas, A. C., Budzien, S. A., Stephan, A. W., Marquis, P., Brown, C. M., Finne, T., and Wolfram, K. D.: Low-latitude ionospheric research using the CIRCE Mission: instrumentation overview, UV, X-Ray, and Gamma-Ray Space Instrumentation for Astronomy XX, Proc. SPIE, 10397, 1039719, https://doi.org/10.1117/12.2275336, 2017.
FENGYUN Satellite Data Center: National Satellite Meteorological Center [data set], http://satellite.nsmc.org.cn/PortalSite/Default.aspx (last access: 30 December 2021), 2018.
Fu, L., Peng, R., Shi, E., Peng, J., Wang, T., Jiang, F., Jia, N., Li, X., and Wang, Y.: Far Ultraviolet nighttime ionospheric photometer, Astrophys Space Sci., 355, 1–7, https://doi.org/10.1007/S10509-014-2139-9, 2015.
Huffman, R. E., Leblanc, F. J., Larrabee, J. C., and Paulsen, D. E.: Satellite vacuum ultraviolet airglow and auroral observations, J. Geophys. Res., 85, 2201-2215, https://doi.org/10.1029/JA085iA05p02201, 1980.
Immel, T. J., Sagawa, E., England, S. L., Henderson, S. B., Hagan, M. E., Mende, S. B., Frey, H. U., Swenson C. M., and Paxton, L. J.: Control of equatorial ionospheric morphology by atmospheric tides, Geophys. Res. Lett., 33, L15108, https://doi.org/10.1029/2006GL026161, 2006.
Jiang, F., Mao, T., and Fu, L.: The research on NmF2 and TEC derived from nighttime OI 135.6 nm emission measurement, Chinese J. Geophys., 57, 3679–3687, 2014 (in Chinese).
Jiang, F., Mao, T., Li, X., Fu, L., Wang, Y., and Yu, T.: Retrieval algorithm and precision analysis for NmF2 of nighttime OI 135.6 nm emission, Chin. J. Space Sci., 38, 58–64, 2018.
Klimenko, M. V., Klimenko, V. V., Zakharenkova, I. E., and Cherniak, L. V.: The global morphology of the plasmaspheric electron content during northern winter 2009 based on GPS/COSMIC observation and GSM TIP model results, Adv. Space Res., 55, 2077–2085, 2015.
Meier, R. R.: Ultraviolet spectroscopy and remote sensing of the upper atmosphere, Space Sci. Rev., 58, 1–185, https://doi.org/10.1007/BF01206000, 1991.
Moffett, R. J. and Hanson, W. B.: Effect of ionization transport on the equatorial F-region, Nature, 206, 4985, 705–706, https://doi.org/10.1038/206705a0, 1965.
Paxton, L. J., Morrison, D., Strickland, D. J., McHarg, M. G., Zhang, Y. L., Wolven, B., Kill, H., Crowley, G., Christensen, A. B., and Meng, C.: The use of far ultraviolet remote sensing to monitor space weather, Adv. Space Res., 31, 813–818, https://doi.org/10.1016/S0273-1177(02)00886-4, 2003.
Rajesh, P. K., Liu, J. Y., Hsu, M. L., Lin, C. H., Oyama, K. I., and Paxton, L. J.: Ionospheric electron content and NmF2 from nighttime OI 135.6 nm intensity, J. Geophys. Res., 116, A02313, https://doi.org/10.1029/2010JA015686, 2011.
Rideout, W. and Coster, A.: Automated GPS processing for global total electron content data, GPS Solutions, 10, 219–228, https://doi.org/10.1007/s10291-006-0029-5, 2006.
Sagawa, E., Immel, T. J., Frey, H. U., and Mende, S. B.: Longitudinal structure of the equatorial anomaly in the nighttime ionosphere observed by IMAGE/FUV, J. Geophys. Res., 110, A11302, https://doi.org/10.1029/2004JA010848, 2005.
Stephan, A. W., Marquis, P. J., Budzien, S. A., Dymond, K. F., Brown, C. M., Wolfram, K. D., and Nicholas, A. C.: Evaluation of UV optics for Triple Tiny Ionospheric Photemeters on CubeSat missions: CubeSats and NanoSats for Remote Sensing, Proc. SPIE, 10769, 107690W, https://doi.org/10.1117/12.2321042, 2018.
Strickland, D. J., Evans, J. S., and Paxton, L. J.: Satellite remote sensing of thermospheric 2 and solar EUV: 1, Theory, J. Geophys. Res., 100, 12217–12226, https://doi.org/10.1029/95JA00574, 1995.
Strickland, D. J., Meier, R. R., Walterscheid, R. L., Craven, J. D., Christensen, A. B., Paxton, L. J., Morrison, D., and Crowley, G.: Quiet-time seasonal behavior of the thermosphere seen in the far ultraviolet dayglow, J. Geophys. Res., 109, 1–10, https://doi.org/10.1029/2003JA010220, 2004.
Thuillier, G., King, J. W., and Slater, A. J.: An explanation of the longitudinal variation of the O1D (630 nm) tropical nightglow intensity, J. Atmos. Terr. Phys., 38, 155–158, 1976.
Walker, G. O.: Longitudinal structure of the F-region equatorial anomaly: a review, J. Atmos. Terr. Phys., 43, 763–774, https://doi.org/10.1016/0021-9169(81)90052-0, 1981.
Wang, H. and Wang, Y.: Airglow simulation based on the atmospheric ultraviolet radiance integrated code of 2012, Sci. China Earth Sci., 59, 425–435, 2016.
Yizengawa, E., Moldwin, M. B., Galvan, D., Lijima, B. A., Komjathy, A., and Mannucci, A. J.: Global plasmaspheric TEC and its relative contribution to GPS TEC, J. Atmos. Terr. Phys., 70, 1541–1548, https://doi.org/10.1016/j.jastp.2008.04.022, 2008.
Zakharenkova, I. and Cherniak, L.: How can GOCE and TerraSAR-X contribute to the topside ionosphere and plasmasphere research, Space Weather, 13, 271–285, https://doi.org/10.1002/2015SW001162, 2015.
Zhang, Y., Paxton, L. J., Morrison, D., Marsh, D., and Kil, H: Storm-time behaviors of 2 and NO variations, J. Atmos. Terr. Phys., 114, 42–49, https://doi.org/10.1016/j.jastp.2014.04.003, 2014.