the Creative Commons Attribution 4.0 License.
the Creative Commons Attribution 4.0 License.
 | 23 Mar 2022
A comparison of the impact of TROPOMI and OMI tropospheric NO2 on global chemical data assimilation
Kazuyuki Miyazaki
Henk Eskes
Kengo Sudo
Masayuki Takigawa
Yugo Kanaya
This study gives a systematic comparison of the Tropospheric Monitoring Instrument (TROPOMI) version 1.2 and Ozone Monitoring Instrument (OMI) QA4ECV tropospheric NO2 column through global chemical data assimilation (DA) integration for the period April–May 2018. DA performance is controlled by measurement sensitivities, retrieval errors, and coverage. The smaller mean relative observation errors by 16 % in TROPOMI than OMI over 60∘ N–60∘ S during April–May 2018 led to larger reductions in the global root-mean-square error (RMSE) against the assimilated NO2 measurements in TROPOMI DA (by 54 %) than in OMI DA (by 38 %). Agreements against the independent surface, aircraft-campaign, and ozonesonde observation data were also improved by TROPOMI DA compared to the control model simulation (by 12 %–84 % for NO2 and by 7 %–40 % for ozone), which were more obvious than those by OMI DA for many cases (by 2 %–70 % for NO2 and by 1 %–22 % for ozone) due to better capturing spatial and temporal variability by TROPOMI DA. The estimated global total NOx emissions were 15 % lower in TROPOMI DA, with 2 %–23 % smaller regional total emissions, in line with the observed negative bias of the TROPOMI version 1.2 product compared to the OMI QA4ECV product. TROPOMI DA can provide city-scale emission estimates, which were within 10 % differences with other high-resolution analyses for several limited areas, while providing a globally consistent analysis. These results demonstrate that TROPOMI DA improves global analyses of NO2 and ozone, which would also benefit studies on detailed spatial and temporal variations in ozone and nitrate aerosols and the evaluation of bottom-up NOx emission inventories.
- Article
(8874 KB) - Full-text XML
- BibTeX
- EndNote


Satellite measurements from the Global Ozone Monitoring Experiment (GOME) (Burrows et al., 1999), the Scanning Imaging Absorption Spectrometer for Atmospheric Chartography (SCIAMACHY) (Bovensmann et al., 1999), the Ozone Monitoring Instrument (OMI) (Levelt et al., 2006), and GOME-2 (Callies et al., 2000) have provided long-term global pictures of tropospheric NO2 columns since 1996. Tropospheric NO2 is important for air quality, atmospheric chemistry, and climate change as the main precursor of tropospheric ozone and nitrate aerosols (IPCC, 2022). Although these measurements have provided unprecedented information on global and regional NO2 variations associated with changes in human and natural activity, their spatial coverage and accuracy limited their ability for a range of applications. Since October 2017, the Tropospheric Monitoring Instrument (TROPOMI) aboard the Sentinel-5 Precursor (Veefkind et al., 2012) has been measuring tropospheric NO2 columns at higher spatial resolutions of 7×3.5 km2 (5.5×3.5 km2 after 6 August 2019) and improved signal-to-noise () ratio, compared to previous satellite measurements such as OMI (Eskes et al., 2019; van Geffen et al., 2020).
Satellite NO2 observations have proven useful for constraining NOx emissions, for instance, through fitting downwind line densities (e.g., Lin et al., 2012; de Foy et al., 2015; Liu et al., 2016) and chemical transport modeling (e.g., Stavrakou et al., 2013; Ding et al., 2015; Miyazaki et al., 2017). Using TROPOMI NO2, surface NOx emissions have been estimated at high spatial and temporal resolutions, but studies are mostly limited to specific areas at point source to urban scales (Beirle et al., 2019; Goldberg et al., 2019; Lorente et al., 2019; van der A et al., 2020; Huber et al., 2020; Lange et al., 2021). In recent studies, TROPOMI NO2 retrievals have also been used to provide a detailed understanding of regional and global emission reductions during the COVID-19 lockdowns (Ding et al., 2020; Miyazaki et al., 2020b, 2021; Kim et al., 2021; Zhang et al., 2021). These studies demonstrate the great potential of TROPOMI NO2 for improving the spatial distribution and temporal variability of emissions. Nevertheless, its relative advantage over previous satellite measurements, such as OMI NO2, in emission estimations for different regions of the world has not been clearly addressed in a quantitative and consistent manner.
Impacts of individual measurements can be evaluated using state-of-the-art data assimilation (DA) techniques, which have widely been used in numerical weather forecast applications (e.g., Gelaro and Zhu, 2009). Chemical DA systems have been used to address measurement impacts on atmospheric composition analysis, including the evaluation of air pollutant emissions (Fortems-Cheiney et al., 2009; Barré et al., 2014, 2015; Emili et al., 2014; Miyazaki et al., 2012b, 2017, 2019; Zhang et al., 2019). A multi-constituent chemical DA system developed by our group assimilates multiple satellite measurements simultaneously to improve emissions and concentrations of various species (e.g., Miyazaki et al., 2017, 2020a; Sekiya et al., 2021), which allows us to evaluate the relative value of TROPOMI and OMI retrievals in a consistent framework.
In this study, we compared concentration and emission analyses derived from the assimilation of TROPOMI and OMI tropospheric NO2 retrievals, which simultaneously optimize tropospheric NO2, ozone concentrations, and NOx emissions at 0.56∘ resolution for the globe. Although this resolution is still insufficient to resolve point source to urban scales, it has the advantage of providing globally consistent analyses on a megacity scale (Sekiya et al., 2021). The DA analyses were validated against assimilated and independent observations. The systematic comparison of TROPOMI DA and OMI DA reveals relative advantages of DA using TROPOMI over OMI, which benefit studies in particular on the evaluation of bottom-up emission inventories and formation processes of ozone and nitrate aerosols. The remainder of this paper is structured as follows. Section 2 describes the observation data used for the assimilation and validation and the DA system. Section 3 validates tropospheric NO2 concentration analyses against assimilated and independent observations. Sections 4 and 5 present surface NOx emission analyses and their impacts on the ozone analyses, respectively. Section 6 provides a summary of the study.
2.1 TROPOMI and OMI satellite observations of tropospheric NO2 for assimilation
The TROPOMI and OMI instruments are ultraviolet/visible nadir-scanning solar-backscatter spectrometers (Levelt et al., 2006; Veefkind et al., 2012). The local Equator crossing time is approximately 13:40 LT (local time) for both instruments. The TROPOMI and OMI ground pixel sizes are 3.5×7 km2 (3.5×5.5 km2 after 6 August 2019) and 13×24 km2, respectively. TROPOMI and OMI provide nearly global daily coverage. We used the TROPOMI NO2 unofficial reprocessing product (version 1.2 beta), which is similar to the official version 1.2.2 reprocessing product (ESA, 2018; van Geffen et al., 2020), and the OMI QA4ECV version1.1 product (Boersma et al., 2017, 2018) for the period 1 April–31 May 2018. These products were retrieved based on the differential optical absorption spectroscopy (DOAS) approach using the same wavelength window of 405–465 nm, with slight differences in the detailed settings, such as the formulation of modeled reflectance, the fitting methods, and the intensity offset correction (van Geffen et al., 2020). The TROPOMI slant column density (SCD) error for a single pixel is 30 % (20 % after 6 August 2019) lower than that of the OMI retrievals (van Geffen et al., 2020). A priori NO2 profiles for TROPOMI and OMI were obtained from the TM5-MP data assimilation system at resolution. Temporal changes in row anomalies (after 2007), stripes, and instrument radiometric degradation increase the uncertainty of the OMI NO2 SCD by 1 % yr−1–2 % yr−1 and decrease the coverage area fraction (Schenkeveld et al., 2017; Zara et al., 2018). Therefore, the relative advantages of TROPOMI over OMI in 2018 need to be evaluated with caution.
The TROPOMI retrievals with quality assurance (QA) values of >0.75 were used, which corresponds to good-quality retrievals over (nearly) cloud-free scenes. These screening criteria are similar to the criteria applied for OMI: cloud radiance fraction (CRF) of <0.5, solar zenith angle (SZA) of <81∘, surface albedo of <0.3, quality flag of =0, and ratio of tropospheric air mass factor (AMF) to geometric AMF of >0.05. For OMI, retrievals affected by row anomalies were excluded using a quality flag. Cloud-covered scene retrievals with CRF of >0.5 were separately used for optimizing lightning NOx sources, following the method proposed by Miyazaki et al. (2014).
Negative biases (by up to 50 %) against surface remote sensing observations in the TROPOMI versions 1.2 and 1.3 products were reported by Verhoelst et al. (2021). However, a large fraction of the negative biases might arise from the vertical profile shape of NO2 assumed for retrievals, as reported by Dimitropoulou et al. (2020) for Uccle, Belgium. Compared to the OMI QA4ECV product, the tropospheric NO2 column in the TROPOMI version 1.2 and 1.3 products is systematically lower especially for winter, as reported by Lambert et al. (2021), which is largely attributed to a negative cloud height bias in the Fast Retrieval Scheme for Clouds from Oxygen A band (FRESCO) implementation (van Geffen et al., 2021).
2.2 Independent observations for validation
Vertical profiles and surface concentrations of NO2 and ozone derived from TROPOMI DA and OMI DA were validated against independent observations. The DA analysis fields at the closest time to measurement were sampled using two-hourly analysis output and then linearly interpolated to the observation locations from the surrounding grids in the horizontal and vertical directions. Vertical profiles were compared by averaging data within each vertical pressure bin, namely seven bins from 850 (800–900) to 250 (200–300) hPa.
2.2.1 NASA ATom aircraft-campaign observations
Vertical profiles of NO2 were obtained from the NASA Atmospheric Tomography mission 4 (ATom-4) aircraft campaign (Wofsy et al., 2018). The ATom-4 campaign was conducted using a NASA DC-8 aircraft from 24 April to 21 May 2018. The DC-8 flight tracks covered regions between 85∘ S and 83∘ N over the Pacific, Atlantic, and United States. The NO2 concentrations were measured via the NOAA NOyO3 four-channel chemiluminescence instrument per 1 s with precision of 5–10 pptv (https://espoarchive.nasa.gov/instrument/NOyO3, last access: 1 February 2022). The merged dataset of flight data with 10 s means was used for the validation. To evaluate the DA performance for vertical NO2 profiles over polluted areas, we used data averaged over coastal regions of the western United States (32–37∘ N, 117.25–122.5∘ W) from three flights on 24 and 27 April and on 21 May.
2.2.2 Surface in situ observations
We used surface NO2 and ozone concentrations from 3255 sites over Europe obtained from the European air quality database (AirBase) of the European Environmental Agency (EEA), 404 sites over the United States obtained from the Air Quality System (AQS) of the United States Environmental Protection Agency (US EPA), and 1246 sites over Japan obtained from Japanese continuous measurement data of general air pollution at ground level compiled by the National Institute for Environmental Studies (NIES). We excluded sites in high-traffic and industrial locations, because the 0.56∘ resolution model grids cannot resolve NO2 enhancement at roadside and individual point sources. For AirBase and AQS, sites with station types of “industrial” and “traffic” and with land use of “industrial” and “mobile” were excluded, respectively. For Japan, we excluded measurement sites for automobile exhaust gases. More than 97 % of the observed NO2 concentrations used in this study were measured by commercial chemiluminescence analyzers, with typical measurement errors of 1 %–5 % (Gluck et al., 2003). These analyzers overestimate the ambient NO2 concentrations, because the measurements contain interference from reactive nitrogen compounds other than NO2 (e.g., Dickerson et al., 2019). Thus, correction factors proposed by Lamsal et al. (2008) using concentration analyses of HNO3, PAN, and ∑ANs were applied to the observations derived from the commercial chemiluminescence analyzers in the manner described by Sekiya et al. (2021):
where ∑ AN is the sum of all alkyl nitrate concentrations, and PAN is the peroxyacetyl nitrate concentrations.
2.2.3 Ozonesonde observations
The observed vertical profiles of ozone were obtained from the World Ozone and Ultraviolet Radiation Data Centre (WOUDC, https://woudc.org, last access: 1 February 2022), Southern Hemisphere Additional Ozonesondes (SHADOZ; Sterling et al., 2018; Thompson et al., 2017; Witte et al., 2017, 2018) and the National Oceanic and Atmospheric Administration (NOAA) Earth System Research Laboratory (ESRL) Global Monitoring Division (GMD, https://gml.noaa.gov., last access: 28 February 2022). We used 127 profiles at 19 stations for the northern extratropics (20–90∘ N), 45 profiles at 9 stations for the tropics (20∘ S–20∘ N), and 36 profiles at 7 stations for the southern extratropics (20–90∘ S).
2.3 Data assimilation system
2.3.1 CHASER chemical transport model
We used the global chemical transport model, CHASER V4.0, at a resolution of 0.56∘ with 32 vertical layers (Sudo et al., 2002; Sekiya et al., 2018) as the forecast model, which simulates tracer transport, emission, dry and wet deposition, and chemical processes (92 species and 262 reactions) including the ozone–HOx–NOx–CO–VOCs system. The meteorological fields simulated by the dynamical and physical modules of CHASER (i.e., MIROC-AGCM atmospheric general circulation model; K-1 model developers, 2004) were nudged to the 6-hourly ERA-Interim reanalysis data (Dee et al., 2011) with a relaxation time of 5 d for temperature and 0.7 d for horizontal winds and used in the chemical module of CHASER at every time step (1–4 min). We demonstrated that increasing model resolution from the conventional resolution (2.8∘) to 0.56∘ resolution substantially improves the model performance over polluted regions (Sekiya et al., 2018).
The a priori surface NOx emissions were obtained from the HTAPv2.2 anthropogenic emission inventory (at 0.1∘ resolution) for 2010 (Janssens-Maenhout et al., 2015), the Global Fire Emissions Database (GFED) version 4.1s monthly-based biomass burning emission inventory (at 0.25∘ resolution) for 2018 (Randerson et al., 2018), and the Global Emissions Initiative (GEIA) soil NOx emission inventory (at 0.5∘ resolution) (Yienger and Levy, 1995). These emissions are released at the lowest model layers. The a priori lightning NOx sources were calculated in the model at each model time step using the parameterization proposed by Price and Rind (1992), with the assumption for vertical distribution of lightning NOx source based on the C-shaped profile given by Pickering et al. (1998).
2.3.2 Ensemble Kalman filter data assimilation
We developed a state-of-the-art chemical DA system (e.g., Miyazaki et al., 2019, 2020a) using the local ensemble transform Kalman filter (LETKF) technique (Hunt et al., 2007), which optimizes ozone and related chemical species' concentrations and ozone precursors' emissions simultaneously. The LETKF uses an ensemble model forecast to estimate background error covariance assuming that the background ensemble perturbations sample the forecast model errors. The background ensemble model fields were converted into observation space by applying the observation operator which includes a spatial interpolation operator and an averaging kernel. The inclusion of averaging kernels in the observation operator describes the vertically dependent sensitivities and removes the influence of a priori profile shape (Eskes and Boersma, 2003). The analysis ensemble mean was obtained by combining the background ensemble mean and assimilated observations yo with relative weights, which were determined using background and observation error covariance matrices Xb and R, respectively:
where is the local analysis error covariance in the ensemble space, while and Yb are the background ensemble mean and error covariance in the observation space, respectively. The local analysis error covariance was estimated as
where Δ is a covariance inflation factor (=7 % per DA cycle) and k is the ensemble size (32 or 64 in this study; see Table 1 for details).
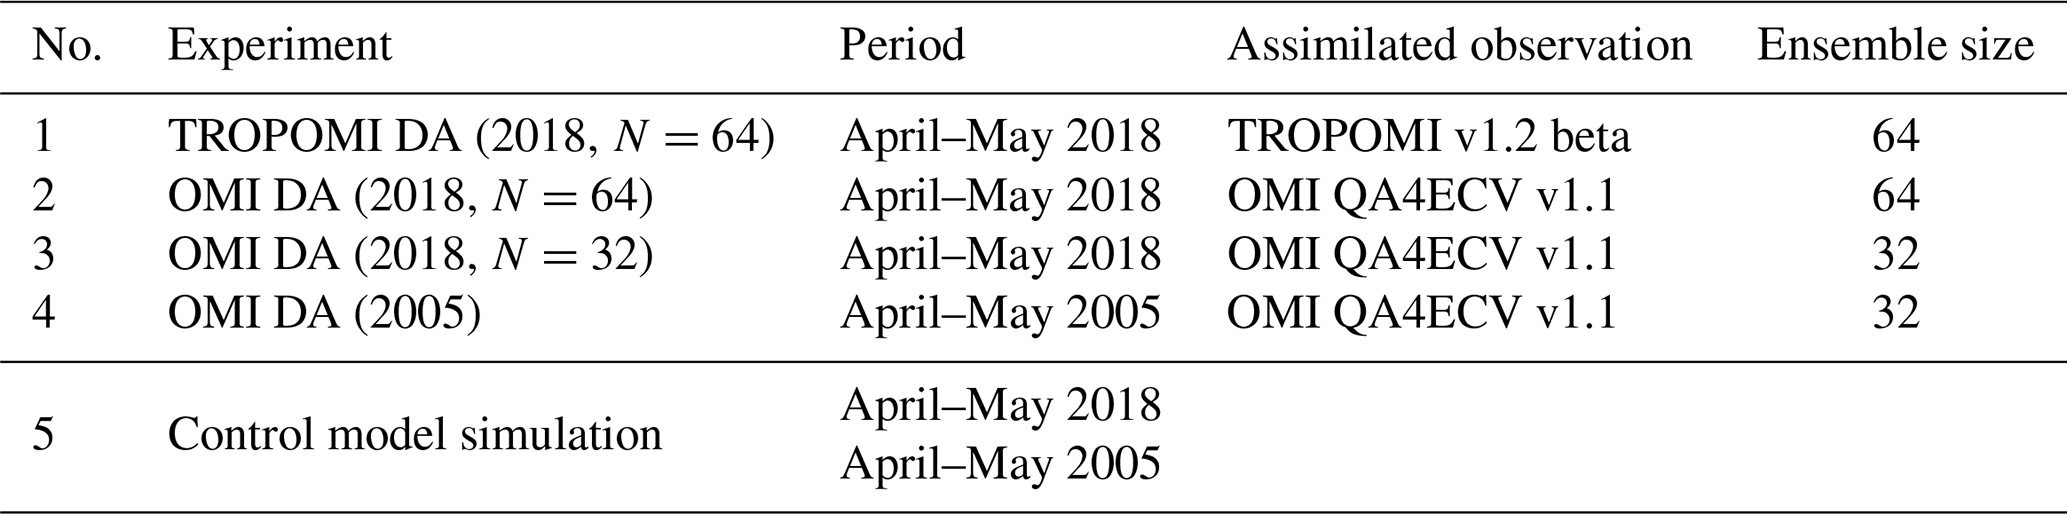
Table 1List of data assimilation and control model simulation runs performed in this study.
Surface and lightning NOx emissions were estimated based on a state argumentation method (e.g., Evensen, 2009) using the relationship between NO2 concentrations and NOx emissions in the background error covariance matrix generated based on ensemble model simulations. For lightning NOx, multiplication factors for the lightning NO production rate were adjusted differently at different model layers using the method proposed by Miyazaki et al. (2014) and the background error covariance matrix. The initial a priori error was set as 40 % and 60 % for the surface and lightning NOx sources, respectively. In the analysis step, the standard deviation of emission ensembles was artificially inflated to a predefined minimum value obtained through sensitivity calculations (i.e., 56 % of a priori emissions) to prevent covariance underestimation.
Our previous study (Sekiya et al., 2021) demonstrated that DA improvements were larger by factors of 1.5–3 at 0.56∘ resolution than at 2.8∘ resolution over polluted regions in comparison to the assimilated NO2 observations. This high resolution leads to reduced spatial representativeness errors (due to an increased average coverage fraction per grid cell at 0.56∘ resolution by a factor of 2, compared to 2.8∘ resolution). The 0.56∘ resolution ensemble model simulation also generates a background error covariance matrix which describes small (0.56∘) scale features. Because of distinct non-linear transport and chemical processes, assimilation considering the background error covariance would also be essential for making the best use of observational information. The multi-constituent DA systems have been used to assimilate ozone, NO2, CO, SO2, and HNO3 (Miyazaki et al., 2020a). Nevertheless, in this study, only TROPOMI and OMI NO2 were assimilated to emphasize the impact of assimilation of tropospheric NO2 retrievals.
2.3.3 Super-observation approach
The super-observation approach (Eskes et al., 2003; Miyazaki et al., 2012a) was used for generating satellite observation data representative to the model grid size (i.e., 0.56∘). The super-observation approach can minimize spatial representativeness errors for spatially varying concentrations of short-lived tracers on sub-grid scales, such as NO2, compared to the thinning approach which randomly selects an observation per grid cell (Boersma et al., 2016). The resolution of super-observation was set to be identical to the forecast model resolution. The super-observation concentration was generated by averaging all data within a super-observation grid cell, while applying a weighting function based on the coverage area of overlap with the super-observation grid cell. The super-observation error was calculated as a combination of measurement and spatial representativeness errors . In our approach, the super-observation measurement error σm was estimated as
where σm,i is the mean measurement error at individual pixels related to total slant column density (SCD), stratosphere–troposphere separation (STS), and tropospheric AMF; c is the error correlation coefficient among the individual retrieval data for these error components; and n is the number of measurements with non-zero overlap with the chosen grid cell. This approach explicitly accounts for spatial correlations, c, between observation errors, which depend on the error sources, compared to the conventional approach used in Miyazaki et al. (2012a). It is supposed that observation errors related to total SCD and tropospheric AMF contain larger random components (by 85 %, i.e., c=0.15) than those related to STS (by 0 %, i.e., c=1.0). The spatial representativeness error σr was calculated as a function of coverage area fraction in the same way as Boersma et al. (2016).
2.4 Experimental setup
As summarized in Table 1, four DA runs from April–May (61 d) were performed. Firstly, we conducted two DA calculations for TROPOMI and OMI separately at an ensemble size of 64. This comparison was used to investigate how TROPOMI DA improves agreements with assimilated and independent observations, compared to OMI DA (Sects. 3.2–3.4, 4, and 5). Secondly, we compared OMI DA calculations for two different years (2005 and 2018) at an ensemble size of 32. This demonstrates the impacts of OMI instrumental degradation and row anomalies, which significantly reduce daily coverage (see Sect. 2.1), on the DA performance (Sect. 3.5). In addition, a control model simulation without any DA was conducted to measure the DA impacts in each case. We chose the calculation period of April–May 2018 because of the ATom-4 aircraft-campaign data availability (see Sect. 2.2.1). Furthermore, systematic biases between the TROPOMI and OMI retrievals are known to be smaller in the summer season than those in the winter season (Lambert et al., 2020). We analyzed the DA results for the period 15 April–31 May after a 2-week-long spin-up.
3.1 Data characteristics
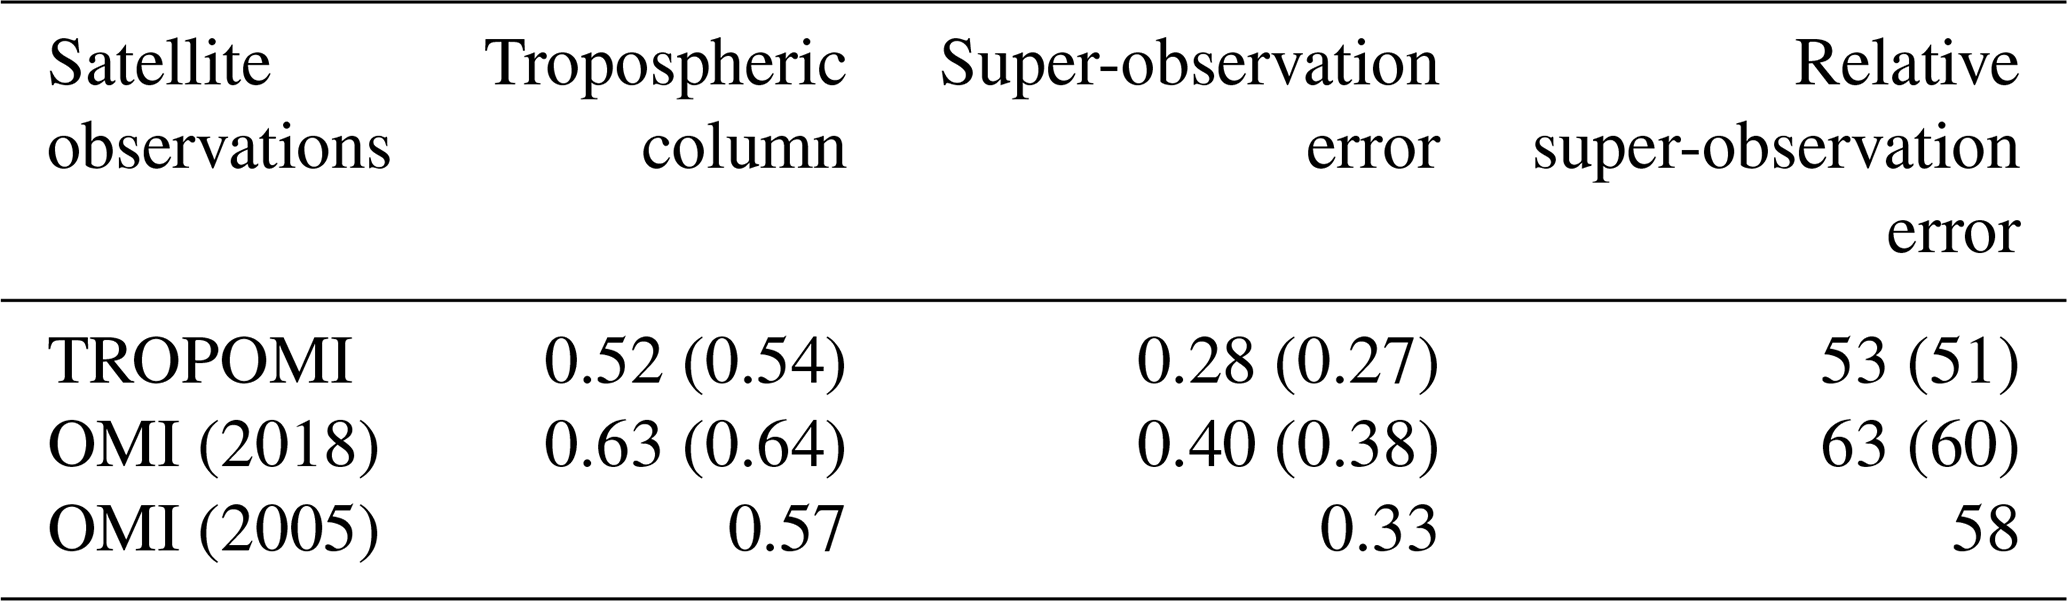
Super-observation concentrations and errors can affect DA results, which are compared in Fig. 1 and Table 2. The TROPOMI and OMI super-observation concentrations were well correlated (r=0.82 over 60∘ S–60∘ N) during April–May 2018, with lower concentrations in TROPOMI by 15 % averaged over 60∘ S–60∘ N without applying averaging kernels of each other. The mean super-observation errors and mean relative super-observation errors (i.e., errors divided by concentrations) in TROPOMI averaged over 60∘ S–60∘ N were compared to those in OMI. The mean super-observation errors were 33 % smaller in TROPOMI than in OMI, while the mean relative super-observation errors were 16 % smaller in TROPOMI. These differences mainly result from improvements in SCD-related errors associated with improved ratio of TROPOMI data, reduced random error components by increasing spatial resolution of TROPOMI data (i.e., an increasing number of observations per super-observation grid cell; see Eq. 4), and smaller TROPOMI stripes. The improved ratio and stripes contributed to about 80 % and almost 100 % of smaller super-observation errors over polluted and remote regions, respectively. Over polluted regions, because individual retrieval uncertainties scale with tropospheric column amounts, the lower mean concentrations in TROPOMI than in OMI also led to the smaller super-observation errors in TROPOMI (by 33 %). As an exception, over remote regions, reduced ratio in SCD, rather than the lower concentrations, explains the smaller super-observation errors (by 32 %) in TROPOMI. Over some remote areas, such as northern high latitudes, the Tarim Basin, the tropical Pacific Ocean, and southern midlatitudes, relative errors were larger in TROPOMI than in OMI (Fig. 1i). The larger TROPOMI relative errors over these areas are influenced by dominant contribution of the uncertainties in stratospheric column for TROPOMI because of reduced random error components in TROPOMI and the assumption of spatial correlation c=1.
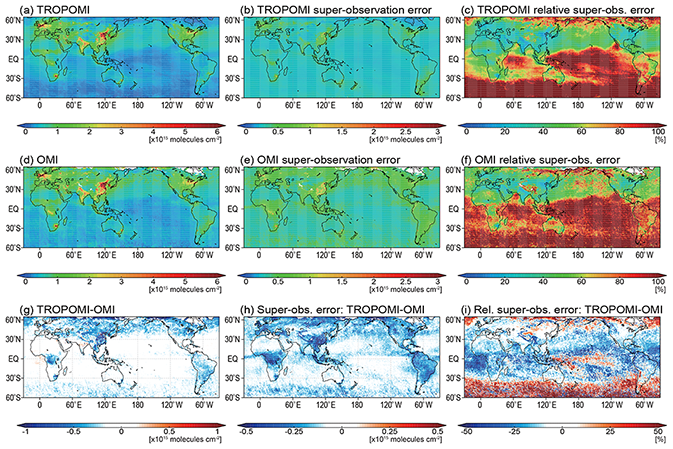
Figure 1Global distribution of tropospheric NO2 column (a, d, g), super-observation errors (b, e, h), and relative super-observation errors (c, f, i) obtained from the Tropospheric Monitoring Instrument (TROPOMI; a–c) and the Ozone Monitoring Instrument (OMI; d–f) from April–May 2018, as well as the differences between TROPOMI and OMI (g–i). The values are mapped onto 0.56∘ resolution grids. The units of the tropospheric NO2 column, super-observation errors, and relative super-observation errors are ×1015 molec. cm−2, ×1015 molec. cm−2, and percentage (%), respectively.
Table 2Mean tropospheric NO2 column ( molec. cm−2), super-observation error ( molec. cm−2), relative super-observation error (%) over 60∘ S–60∘ N in the Tropospheric Monitoring Instrument (TROPOMI) from April to May 2018, and the Ozone Monitoring Instrument (OMI) from April to May in 2005 and 2018. Values in brackets are calculated from TROPOMI and OMI data with co-location criteria of <60 km in space and <2 h in time.
The spatial coverage per super-observation grid cell of TROPOMI (72 %) was larger than that of OMI (69 %) mainly because of OMI row anomalies, which led to smaller spatial representativeness errors of TROPOMI (7 %) than those of OMI (10 %). The mean relative super-observations errors of OMI were 8 % smaller in 2005 than in 2018 (figure not shown), which is attributed to the temporal changes in OMI row anomalies, stripes, and instrument radiometric degradation (see Sect. 2.1). The averaging kernel values in the lower troposphere (below 850 hPa) were higher by 44 % in TROPOMI averaged over 60∘ S–60∘ N than those in OMI, because mean CRF over 60∘ S–60∘ N is 15 % smaller in TROPOMI due to better resolving small-scale cloud-free scenes.
3.2 Self-consistency
The performance of TROPOMI DA and OMI DA was confirmed by the χ2 test (Ménard and Chang, 2000; Zupanski and Zupanski, 2006). The χ2 value is used to diagnose balance between actual errors and estimated errors. When the χ2 value is larger (smaller) than the ideal value of 1, it suggests underestimated (overestimated) background error covariance or observation errors. The χ2 value is diagnosed from the ratio of the observation minus forecast (OmF; i.e., yo−H(xb)) to estimated error covariance in the observational space (HPbHT+R) as
The mean values of estimated χ2 with standard deviation range over polluted regions ( molec. cm−2) after inflation factor tuning was 0.99±0.25 for TROPOMI DA, whereas the mean χ2 of 1.17±0.19 for OMI DA is larger than the ideal value.
We also evaluated the self-consistency with the assimilated observations based on reductions in root-mean-square error (RMSE) by DA (ΔRMSE) using daily maps sampled at observation locations as
where V and A are the observed tropospheric NO2 column and corresponding averaging kernels, respectively, used for DA; cassim and cctl are NO2 concentration fields obtained from the DA runs and control model simulations, respectively; and N is the number of super-observation data. The level of significance of ΔRMSE was determined using the Mann–Whitney U test (Mann and Whitney, 1947).
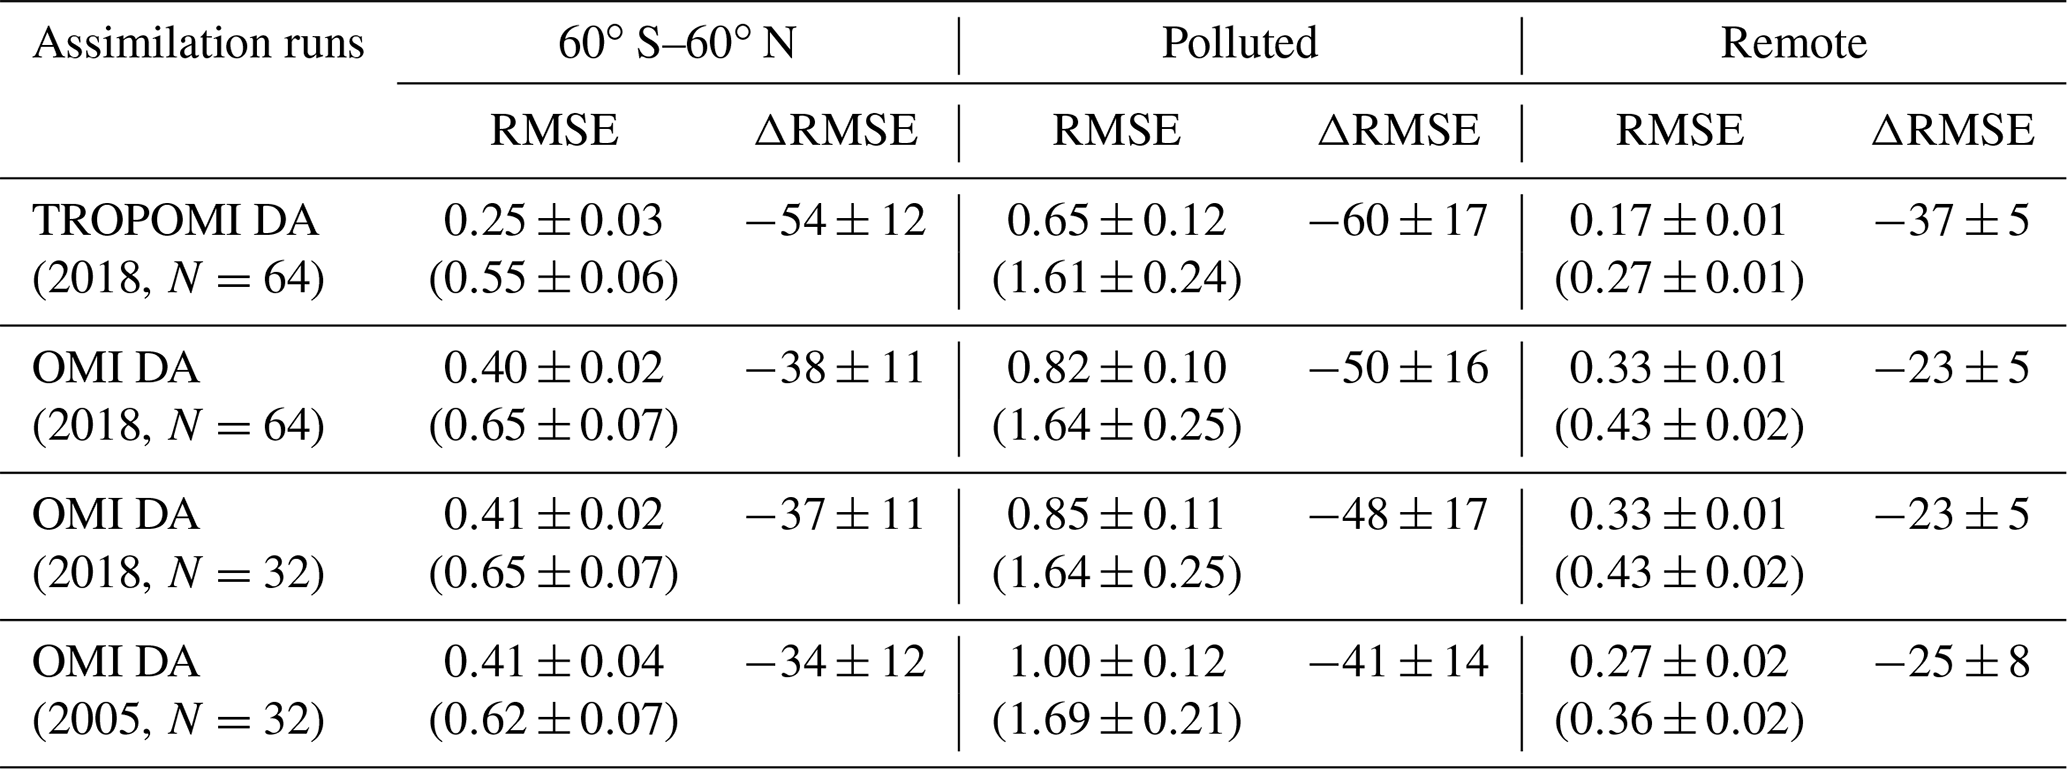
As shown in Fig. 2 and Table 3, the RMSE for TROPOMI DA over 60∘ S–60∘ N was reduced by 54 % compared to that for the control model simulation, with larger RMSE reductions over polluted regions (by 60 %) than over remote regions (by 37 %). The RMSE reductions were substantial over most regions in the tropics and northern midlatitudes, whereas improvements are not clear over the northern high latitudes, Tarim Basin, Arabian Sea, northern Australia, South America, and parts of the southern midlatitudes. Mean RMSE reductions were larger for TROPOMI DA than OMI DA (by 38 %). The differences in RMSE reductions between TROPOMI DA and OMI DA over the tropics and northern midlatitudes were statistically significant at the 95 % confidence level. These differences can be explained by the reduced relative super-observation errors in TROPOMI. Over the oceans in the tropics and midlatitudes, higher vertical sensitivity (i.e., averaging kernels) in TROPOMI than OMI in the lower troposphere and above clouds contributed to the improved performance, through ship and lightning NOx emission corrections and direct NO2 concentration modifications. In contrast, the differences in RMSE reduction between TROPOMI DA and OMI DA were statistically insignificant over most regions with larger relative super-observation errors in TROPOMI.
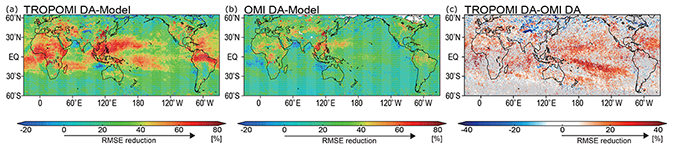
Figure 2Root-mean-square error (RMSE) reduction for tropospheric NO2 concentration fields against assimilated observations by data assimilation (DA) (%) obtained from Tropospheric Monitoring Instrument (TROPOMI) DA (a) and Ozone Monitoring Instrument (OMI) DA (b), as well as the differences between them (c). For the right panel, grids with a gray color indicate differences between RMSE reductions by TROPOMI DA and OMI DA that are statistically insignificant at the 95 % confidence level using the Mann–Whitney U test. The values are mapped onto 0.56∘ resolution grids.
Table 3Root-mean-square error (RMSE) for tropospheric NO2 concentration fields against assimilated observations after data assimilation (DA) (the control model simulation in brackets) and differences in RMSEs between DA and the control model simulation (ΔRMSE) over 60∘ S–60∘ N from 15 April–31 May. N denotes the ensemble size. RMSE and ΔRMSE are expressed as ×1015 molec. cm−2 and percentage (%), respectively. Polluted regions are defined as the areas where the Tropospheric Monitoring Instrument (TROPOMI) tropospheric NO2 column contains molec. cm−2. The ranges of RMSE and ΔRMSE are the standard deviation of the time series.
The two-dimensional histogram of grid-level relative super-observation errors and RMSE reductions (Fig. 3a and b) shows clear decreases in RMSE reductions with increasing relative super-observation errors for both TROPOMI and OMI DA. Steep RMSE decreases occurred around relative super-observation errors of 20 %–50 %, which reflected areas over and downwind of polluted regions. Over polluted regions, observational information is more effectively assimilated into the model, because of the large uncertainty (i.e., background error covariance) of estimated NOx emissions over these regions. As shown in Fig. 3c, mean relative super-observation errors at individual grids were smaller than those in TROPOMI in OMI by 16 %. Corresponding to these smaller super-observation errors, the mean RMSE reductions by TROPOMI DA at individual grids (by 54 %) were larger than those by OMI DA (by 38 %), with large differences in frequency of RMSE reductions between TROPOMI DA and OMI DA for RMSE reductions of >10 % (Fig. 3d). These results confirm that improved RMSE reductions by TROPOMI DA compared to OMI DA can be attributed to the reduced relative super-observation errors in TROPOMI. Meanwhile, the obtained result suggests that the DA efficiency by TROPOMI was evaluated based on RMSE against assimilated observation itself. It is determined by the amount and quality of TROPOMI data, regardless of the TROPOMI low bias.
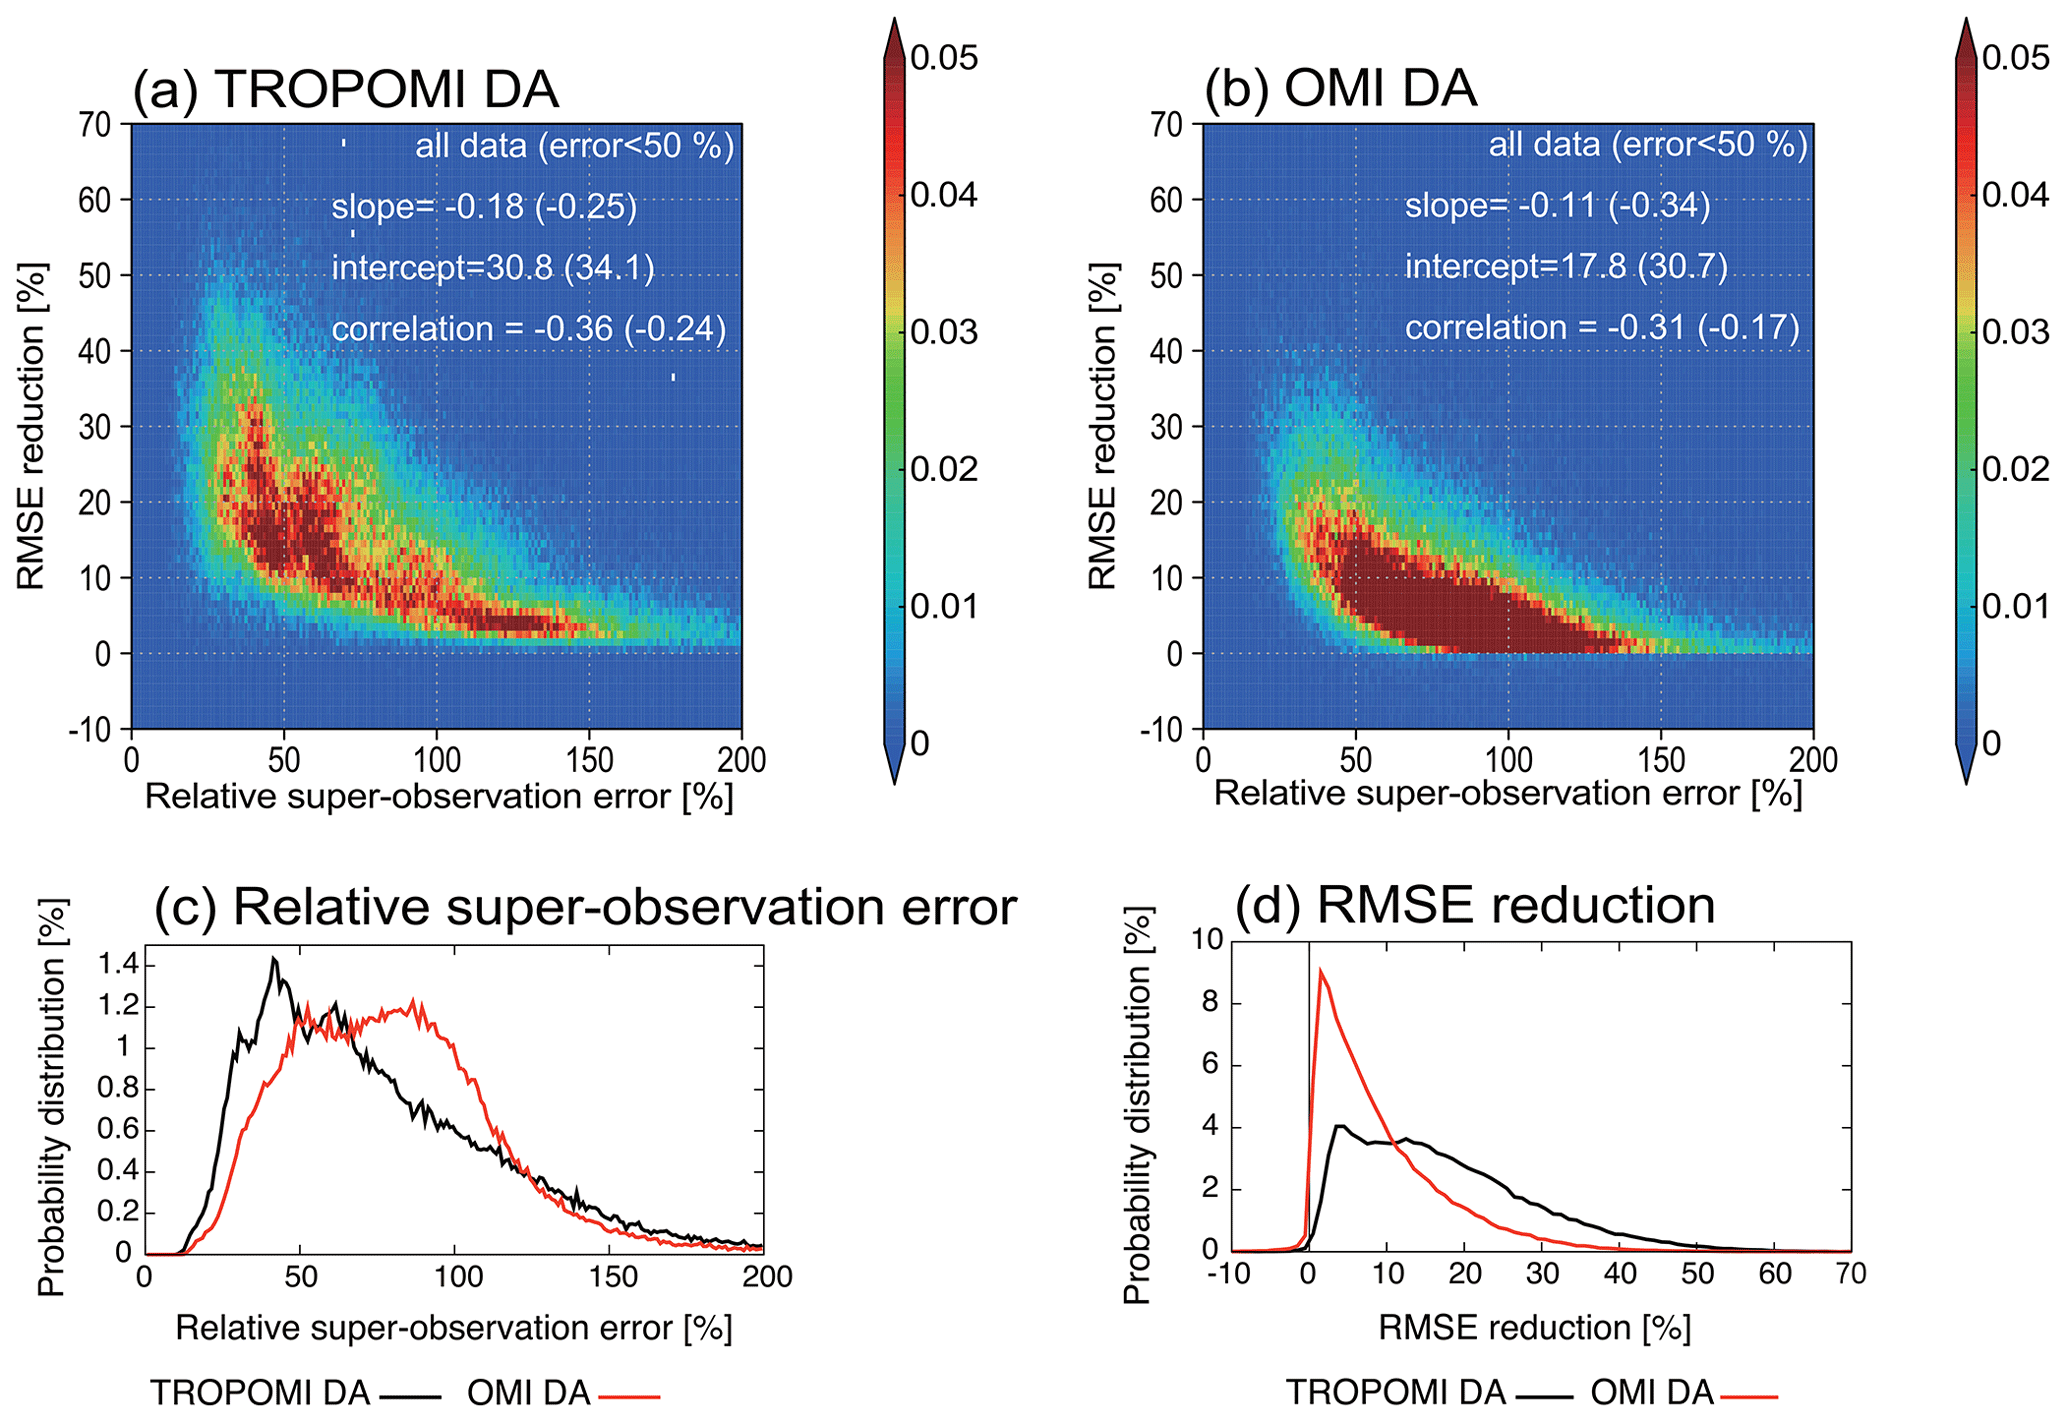
Figure 3Two-dimensional (2-D) histogram (%) as a function of relative super-observation errors (%) and root-mean-square error (RMSE) reductions (%) for tropospheric NO2 column made to data assimilation (DA) (a, b) obtained from Tropospheric Monitoring Instrument (TROPOMI) DA (a, c) and Ozone monitoring Instrument (OMI) DA (b, d). The values in the top panels are regression coefficients, intercepts, and correlation coefficients between relative super-observation errors and RMSE reductions against assimilated observations by DA on the grid scale. The values in brackets were calculated using data with relative super-observation errors of <50 %. One-dimensional (1-D) histograms as a function of relative super-observation errors (c) and RMSE reductions (d) are exhibited in the bottom row. The black and red lines are taken from TROPOMI DA and OMI DA, respectively.
3.3 Validation against independent observations
3.3.1 ATom aircraft-campaign data
Figure 4 and Table 4 validated the vertical profiles of NO2 with the ATom-4 aircraft-campaign observations on 24 and 27 April and 21 May when the DC-8 aircraft flew over coastal areas of the western United States (32–37∘ N, 117.25–122.5∘ W). For the comparison, model simulation and data assimilation results were sampled at observation locations, and then the observation data, the control model simulation, and the data assimilation were averaged on each day over the coastal areas of the western United States. The control model simulation overestimated the observed concentrations in the lower troposphere (700–900 hPa) by factors of 1.4–4 in all cases, while underestimating the NO2 concentrations in the middle and upper troposphere (300–700 hPa) by 48 %–70 %, except on 27 April. The positive model biases were particularly large at 750 hPa on 24 April and at 850 hPa on 27 April and 21 May. The use of 2010 anthropogenic NOx emissions could explain the positive model biases. In addition, on 24 April, the simulated planetary boundary layer (PBL) height was 30 % higher than that in the ERA-Interim reanalysis, which could in turn increase NO2 bias at 750 hPa.
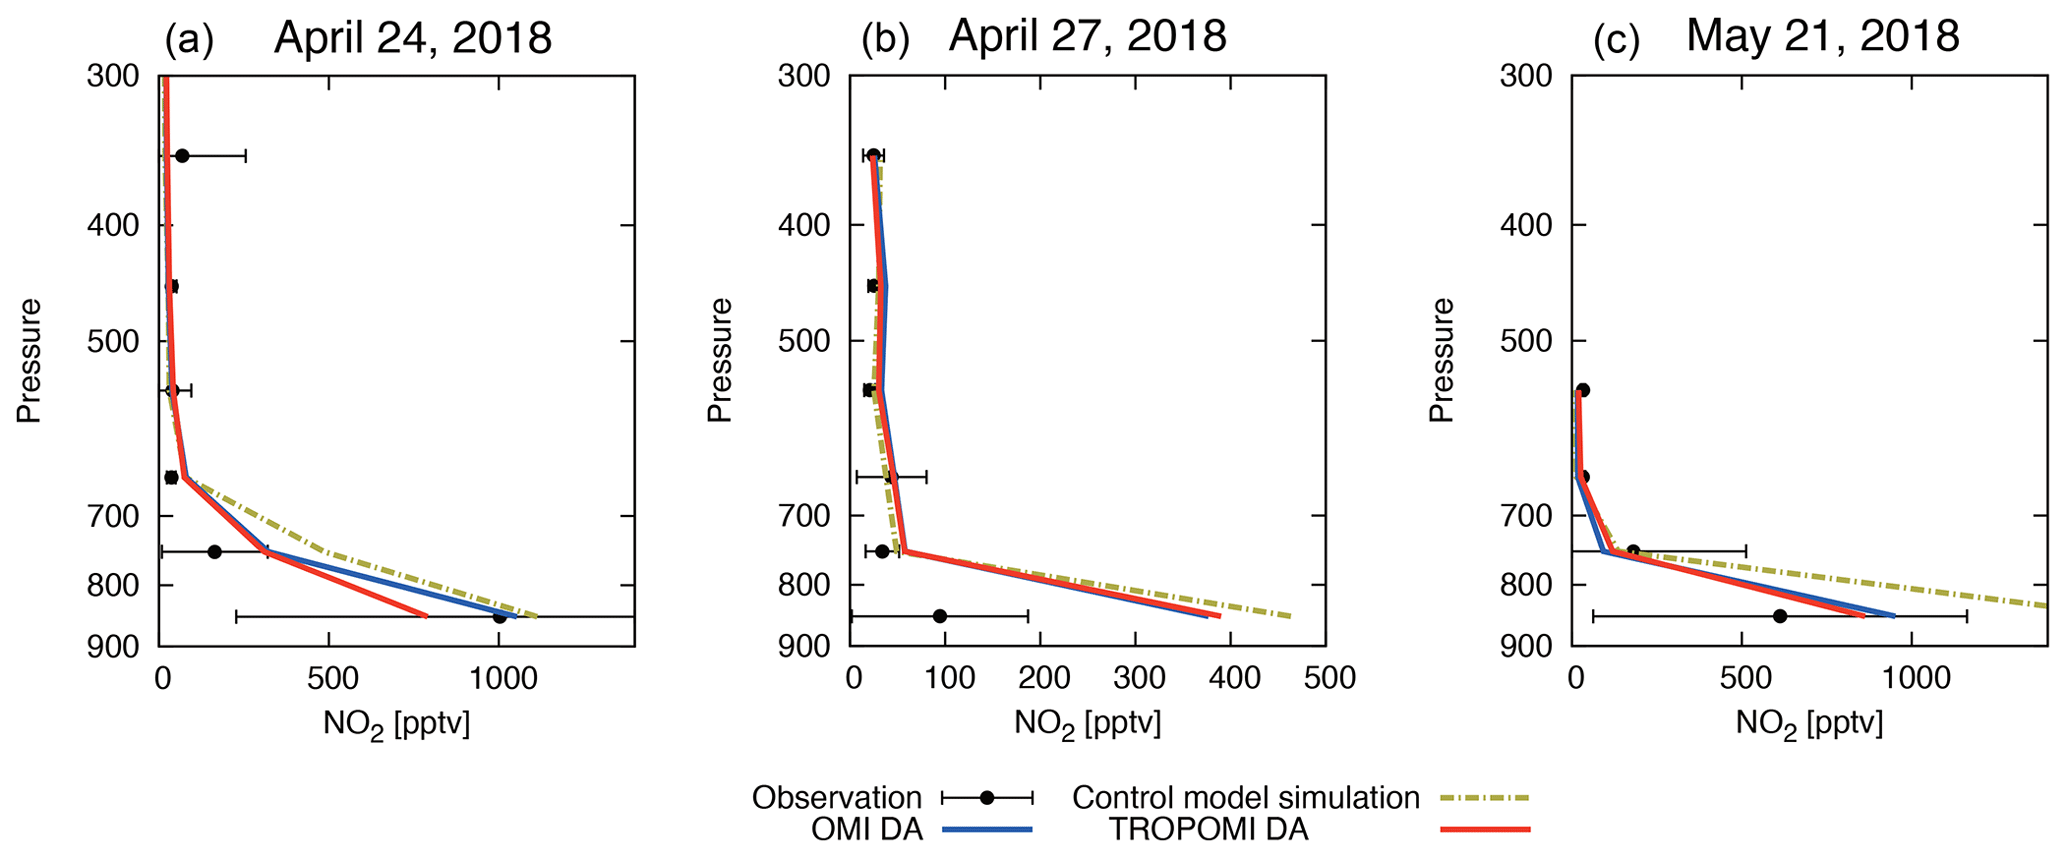
Figure 4Vertical profiles of NO2 (pptv) on 24 April (a), 27 April (b), and 21 May (c) over coastal areas of the western United States (32–37∘ N, 117.25–122.5∘ W). The results were obtained from the ATom-4 aircraft-campaign observations (black), Tropospheric Monitoring Instrument (TROPOMI) data assimilation (DA) (red), Ozone Monitoring Instrument (OMI) DA (blue), and the control model simulation (yellow). The error ranges are the standard deviations of individual values in each pressure bin.
Table 4Mean bias (MB) against the ATom-4 aircraft-campaign observations in the lower (700–900 hPa) and middle–upper troposphere (300–700 hPa) over coastal areas of the western United States (32–37∘ N, 117.25–122.5∘ W) on 24 and 27 April and 21 May 2018. MB is expressed in parts per trillion by volume (pptv). Boldface denotes the best agreement with in situ observations. The ranges of MB are the standard deviations of individual values in each pressure bin. “Model” indicates the control model simulation.
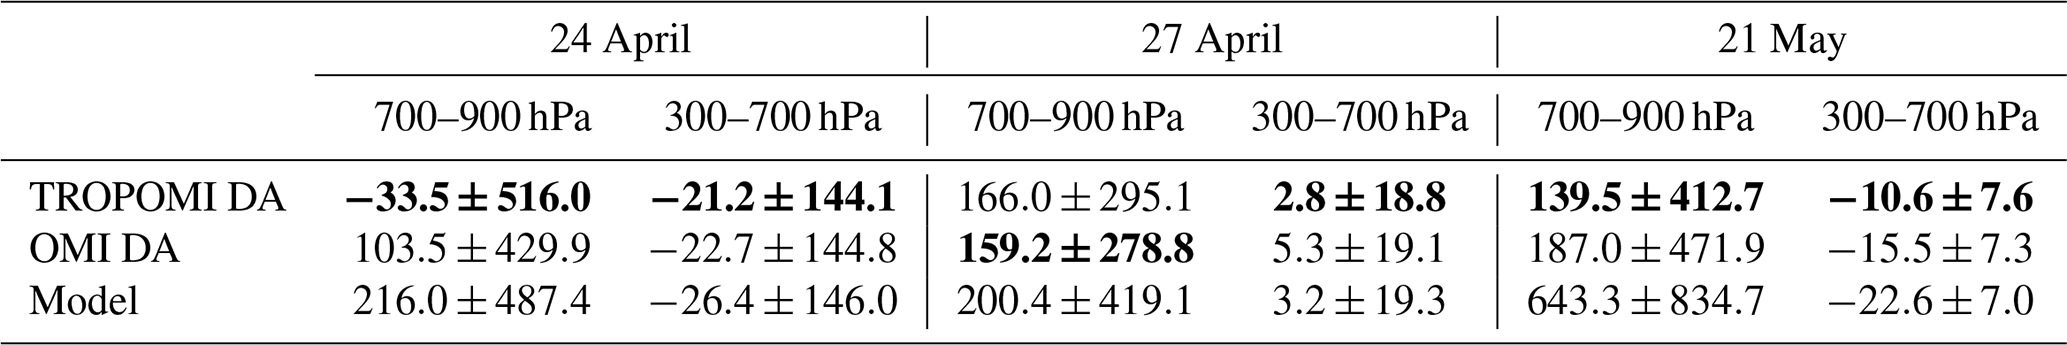
On 24 April, TROPOMI DA increased negative bias at 850 hPa, while it reduced positive bias at 750 hPa, which could also be attributable to model biases in PBL height. The mean bias in the lower troposphere (below 700 hPa) was largely reduced by TROPOMI DA (by 84 %) on 24 April. The improvements were small (by 17 %) on 27 April when the DC-8 aircraft NO2 measurements were conducted in the early morning before the TROPOMI overpass time, whereas TROPOMI DA reduced positive model biases by 78 % in the lower troposphere on 21 May. In the middle and upper troposphere, TROPOMI DA reduced the model biases by 12 %–53 %. These bias reductions were larger by 52 %–70 % for the lower troposphere and by up to 31 % for the middle and upper troposphere in TROPOMI DA than OMI DA, except for the lower troposphere on 27 April. Because of the large variability in the observed concentrations, these differences in bias were statistically insignificant based on a two-sample t test, except for the upper troposphere on 21 May.
3.3.2 Surface in situ data
Surface in situ observation data at 14:00 LT were used for validation to evaluate assimilation impacts just after their overpass times. Validation was conducted after filtering out model grids where water bodies cover >50 % of a grid box area using annual Moderate Resolution Imaging Spectroradiometer (MODIS) land cover data (Friedl and Sulla-Menashe, 2015) for 2018, considering large representativeness errors. Over Europe, the regional mean model bias and RMSE of NO2 were −18 % and 145 %, respectively (absolute errors are shown in Table 5). The model biases vary with regions, with positive biases of 12 %–115 % over the United Kingdom (UK), Belgium, and the Netherlands and negative biases of 42 %–78 % over Italy, Serbia, and Romania (Fig. 5). Over the United States, regional mean model bias and RMSE were 37 % and 268 %, respectively, with larger positive biases over urban areas such as New York, Los Angeles, and Chicago. The regional mean bias and RMSE over Japan were −23 % and 124 %, respectively.
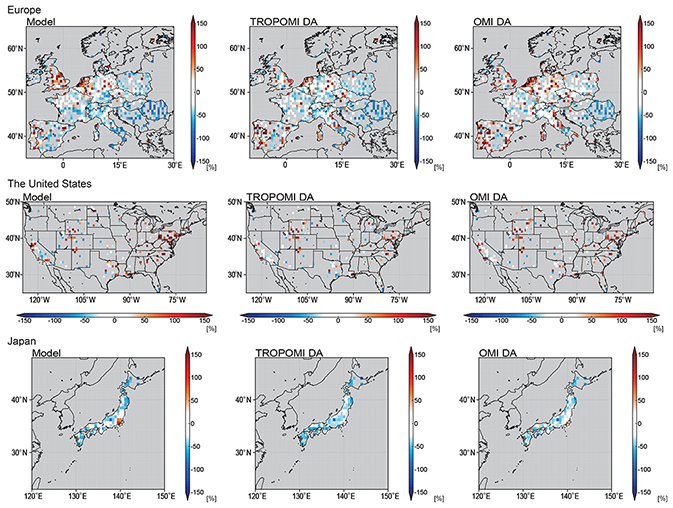
Figure 5Mean model biases against surface in situ observations for surface NO2 concentrations (%) at 14:00 LT (local time) derived from the control model simulation (left column), Tropospheric Monitoring Instrument (TROPOMI) data assimilation (DA) (middle column), and Ozone Monitoring Instrument (OMI) DA (right column) over Europe (top), the United States (middle), and Japan (bottom). The values are mapped onto 0.56∘ resolution grids.
Table 5Mean bias (MB) and root-mean-square error (RMSE) for surface NO2 at 14:00 LT (local time) and daily maximum 8 h average (MDA8) ozone against in situ observations during 15 April–31 May 2018. The units of MB and RMSE are parts per billion by volume (ppbv). Boldface denotes the best agreement with in situ observations. The ranges of MB and RMSE are the standard deviation of the time series. “Model” indicates the control model simulation.
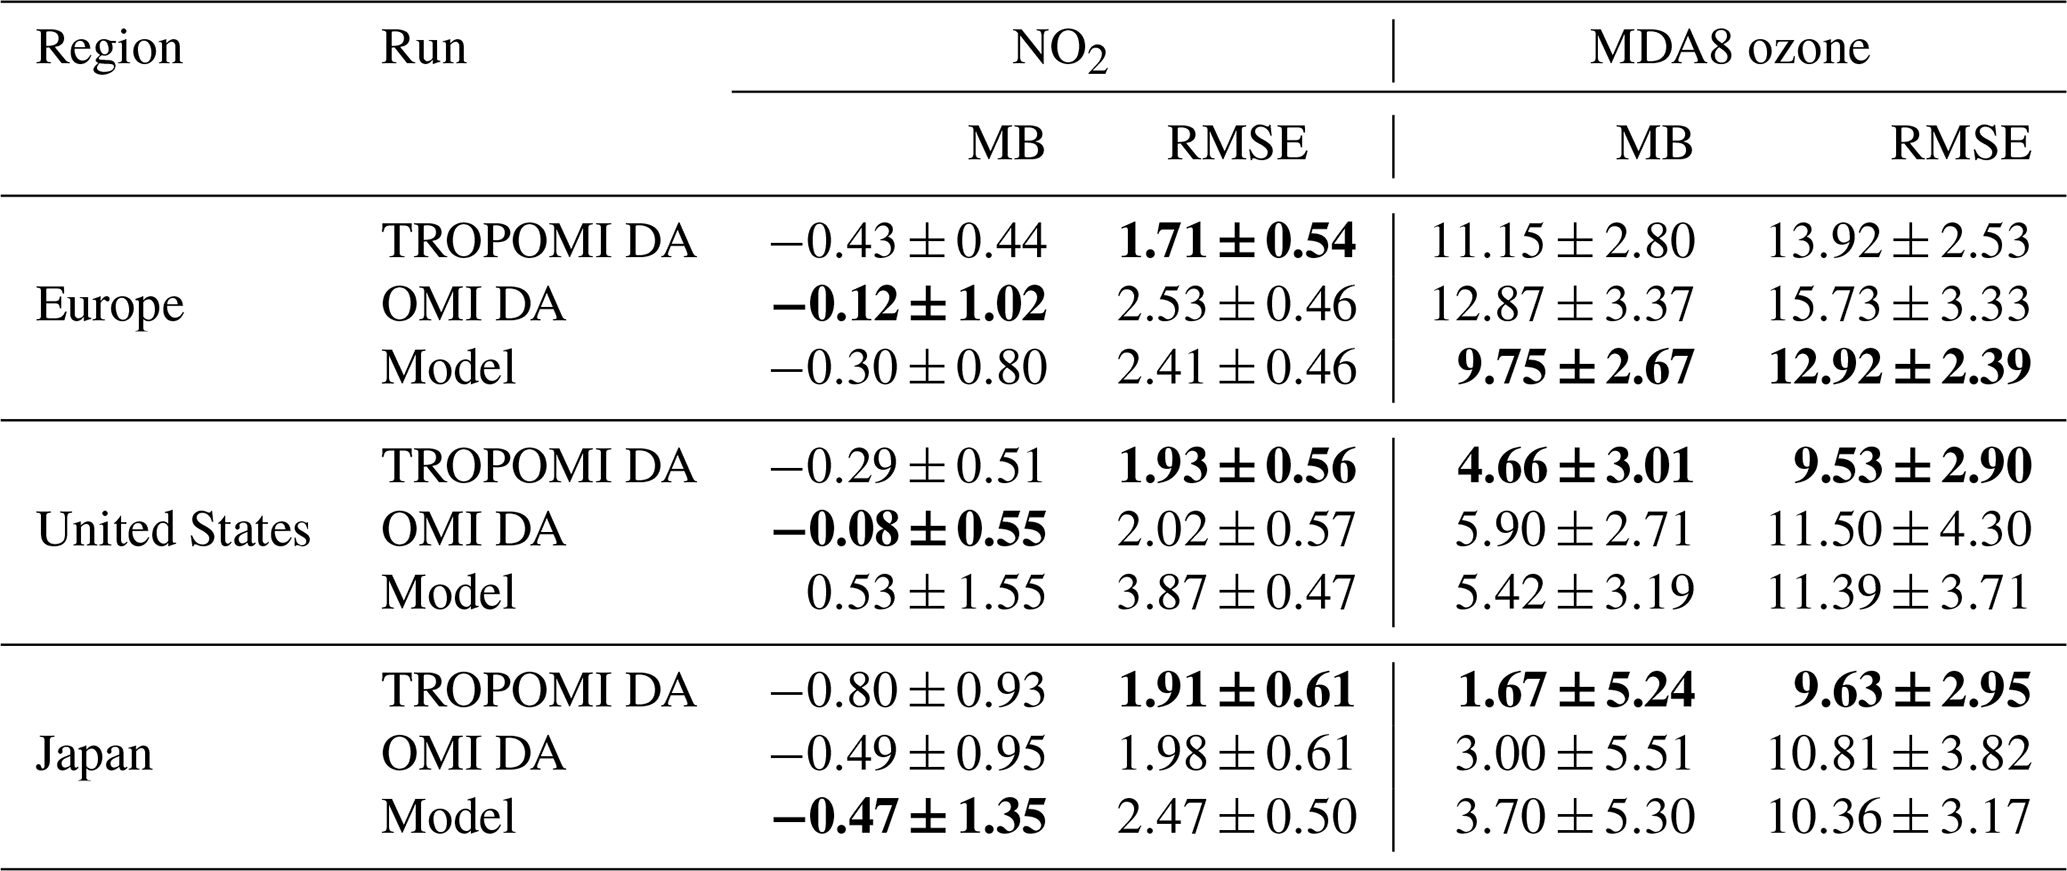
TROPOMI DA reduced the regional RMSE over Europe by 29 %, with larger RMSE reductions by 45 % and 47 % over the UK and the Netherlands, respectively, reflecting improvements in spatial and temporal variability by TROPOMI DA (Fig. 6). Because of the small RMSEs in the control model simulation, RMSE reductions by TROPOMI DA were not obvious over Italy, Spain, and Portugal. Over the United States, TROPOMI DA reduced the regional mean bias and RMSE by 46 % and 50 %, respectively. In contrast to the large RMSE reductions over the eastern United States and western coastal areas, RMSEs increased over Colorado and Wyoming again due to the small RMSEs in the control model simulations. Over Japan, TROPOMI DA reduced RMSE by 23 % due to better capturing spatial and temporal variations but increased negative model bias by 68 %. Error reductions were smaller in OMI DA overall. The RMSE over Europe was increased by OMI DA by 5 % mainly due to the increased errors over the Netherlands. Over the United States and Japan, the RMSE reductions for megacities such as New York, Los Angeles, and Tokyo were 25 %–70 % larger in TROPOMI DA than in OMI DA. The regional RMSE reduction was comparable between the two runs (by 47 % for the United States and 20 % for Japan by OMI DA). These results suggest that the results of TROPOMI DA were affected by the TROPOMI low bias compared to OMI, while TROPOMI DA provided better constraints on spatial and temporal variations in NO2 concentrations than OMI DA.

Figure 6Root-mean-square errors (RMSEs) against surface in situ observations for surface NO2 concentration fields (ppbv) at 14:00 LT (local time) in the control model simulation (left column) and their reductions (%) by Tropospheric Monitoring Instrument (TROPOMI) data assimilation (DA) and Ozone Monitoring Instrument (OMI) DA (middle and right columns, respectively) over Europe (top), the United States (middle), and Japan (bottom). The values are mapped onto 0.56∘ resolution grids. For the middle and right columns, grids with open circles indicate RMSE reductions that are statistically significant at the 95 % confidence level using the Mann–Whitney U test.
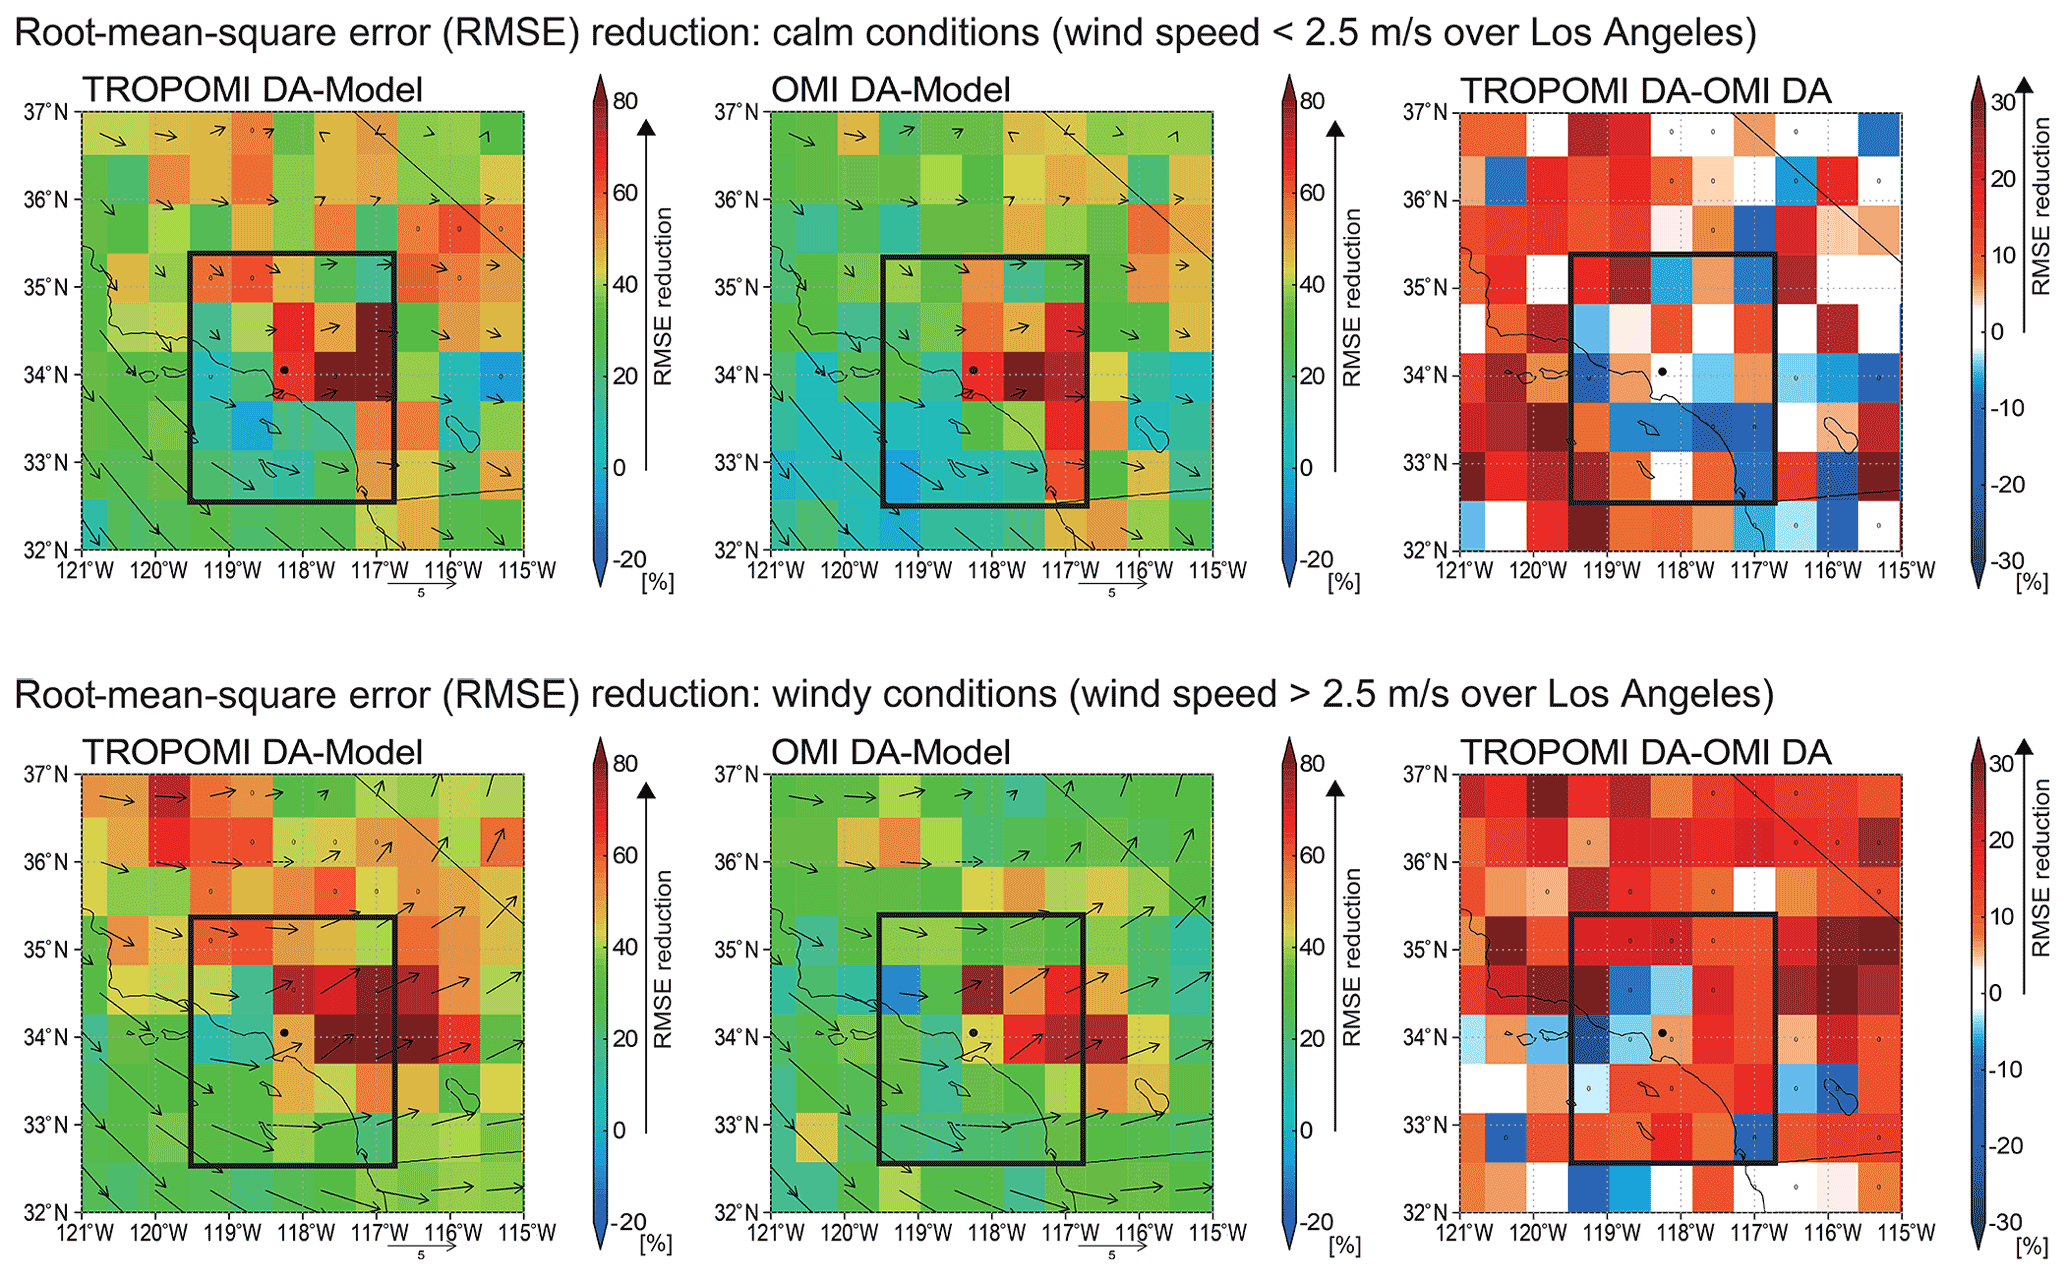
Figure 7Root-mean-square error (RMSE) reduction for tropospheric NO2 concentration fields against assimilated observations by data assimilation (DA) over Los Angeles under windy (wind speed >2.5 m s−1, top row) and calm (bottom row) conditions. The left, middle, and right columns show Tropospheric Monitoring Instrument (TROPOMI) DA, Ozone Monitoring Instrument (OMI) DA, and the differences between them, respectively. The unit is percentage (%). Arrows in the left and middle columns show surface winds derived from ERA-Interim reanalysis data. For the right column, grids with open circles indicate the differences in RMSE reductions between TROPOMI DA and OMI DA that are statistically significant at the 95 % confidence level using the Mann–Whitney U test. The black circle indicates the location of Los Angles city center.
3.4 Regional performance over Los Angeles
The magnitude of improvements by DA can be affected by meteorological conditions (e.g., Miyazaki et al., 2019). We evaluated impacts of meteorological conditions on the self-consistency over Los Angeles where both independent surface and aircraft-campaign observations were available (Sect. 3.3.1 and 3.3.2). During 15 April–31 May, southwesterly winds were predominant over Los Angeles, while wind speed varied (see Fig. 8). As shown in Fig. 7, the RMSEs over the city of Los Angeles (black rectangles of Fig. 7) were reduced by TROPOMI DA in windy conditions (wind speed >2.5 m s−1) by 46 % and calm conditions by 37 %. Over the city of Los Angeles, the RMSE reductions by TROPOMI DA were larger under the windy conditions (by a factor of 1.3) compared with OMI DA, with statistical significance at the 99 % confidence level; the RMSE reductions were comparable under the calm conditions (within 5 %). The TROPOMI measurements with high vertical sensitivity (i.e., averaging kernels) in the lower troposphere captured the dilution of NO2 over the city of Los Angeles during the windy conditions better than OMI, which resulted in better improvements by TROPOMI DA than OMI DA under the windy conditions. The vertical sensitivity of TROPOMI in the lower troposphere over the city of Los Angeles was 36 % higher than that of OMI, reflecting a smaller CRF in TROPOMI than in OMI (by 17 %), because TROPOMI has higher spatial resolution and better resolves small-scale cloud-free scenes over Los Angeles. In contrast, the super-observation errors and quantities in TROPOMI and OMI during the windy conditions were comparable to those during the calm conditions (figure not shown). Meanwhile, over the surrounding areas of the city of Los Angeles, RMSE reductions by TROPOMI DA and OMI DA were comparable under both the windy and calm conditions.
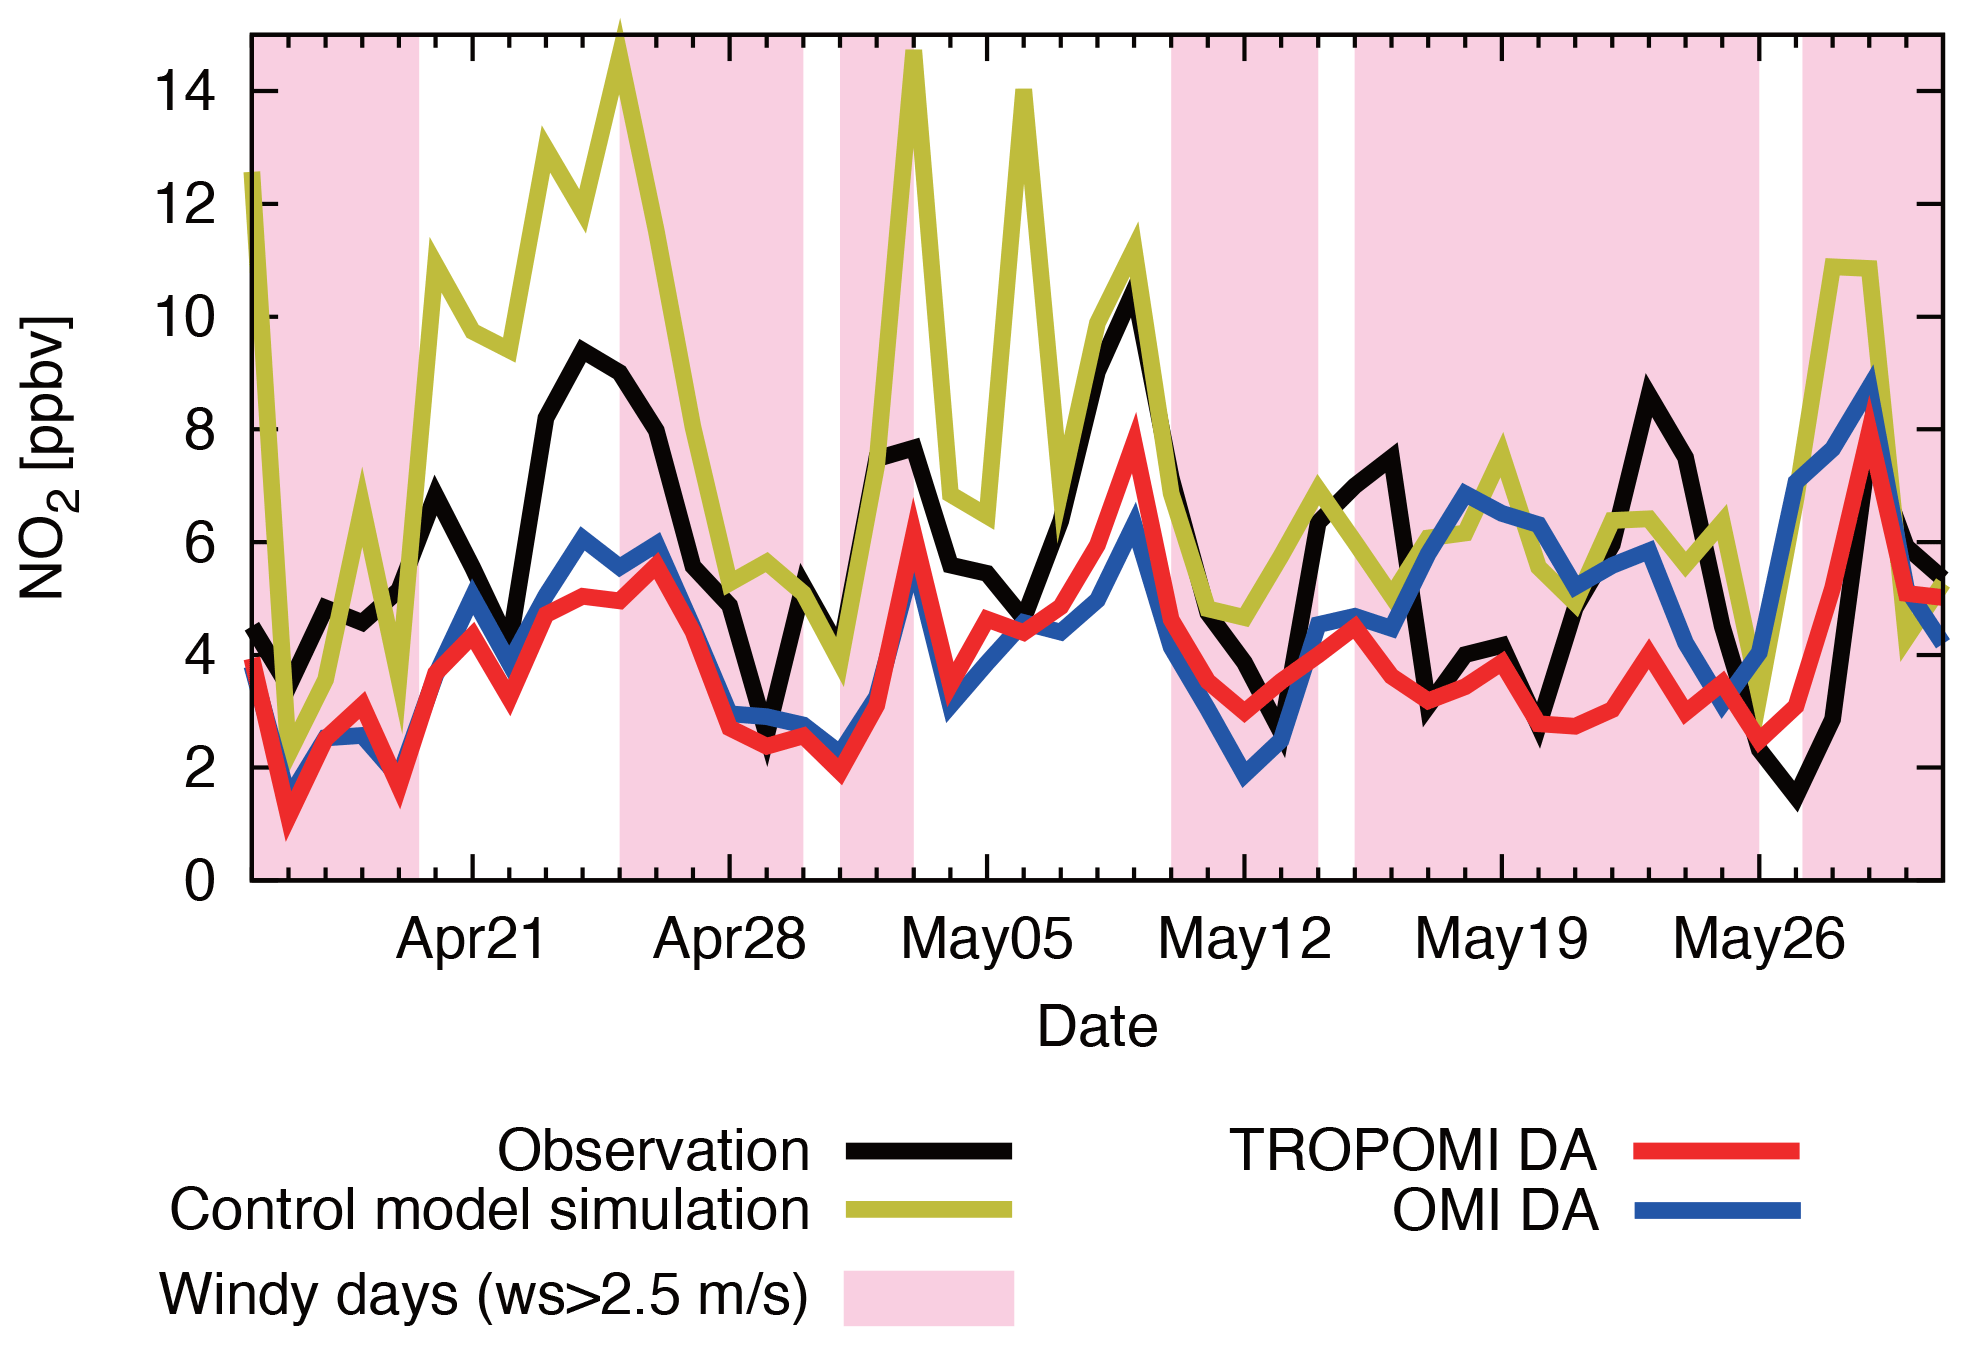
Figure 8Surface NO2 concentrations (ppbv) at 14:00 LT over Los Angeles. The results were obtained from in situ observations (black), Tropospheric Monitoring Instrument (TROPOMI) data assimilation (DA) (red), Ozone Monitoring Instrument (OMI) DA (blue), and the control model simulation (yellow). The periods filled in pink are windy conditions (wind speed >2.5 m s−1).
Table 6Mean bias (MB), temporal correlation coefficient (T-Corr.), and root-mean-square error (RMSE) for surface NO2 at 14:00 LT (local time) against in situ observations from the Air Quality System (AQS) over Los Angeles from 15 April–31 May 2018 under all, calm (wind speed ≤2.5 m s−1), and windy conditions. Both MB and RMSE are expressed in parts per billion by volume (ppbv). Boldface denotes the best agreement with in situ observations. The range of the MB is the standard deviation of the time series. “Model” indicates the control model simulation.

As summarized in Table 6, positive model bias in NO2 concentrations against in situ observations for 15 April–31 May 2018 was 33 %. Temporal correlation coefficient between observed and simulated concentrations was 0.49. TROPOMI DA introduced negative bias while improving the temporal correlation to 0.63. RMSEs were reduced by 37 % and 26 % during the calm and windy conditions, respectively. The negative bias was larger in TROPOMI DA than in OMI DA, whereas temporal correlation coefficients in TROPOMI DA (r=0.63) were larger than those in OMI DA (r=0.25). The RMSE reductions by TROPOMI DA were 8 % larger than those by OMI DA under the windy conditions, whereas the RMSE reductions by TROPOMI DA and OMI DA were comparable under the calm conditions. These results suggest similar improvements by TROPOMI DA compared to OMI DA under the windy and calm conditions, while meteorological conditions slightly affect the magnitude of improvements in NO2 concentrations by TROPOMI DA compared to OMI DA.
3.5 Impact of OMI instrumental degradation
Temporal changes in OMI row anomalies, stripes, and instrument radiometric degradation from 2005 to 2018 could affect OMI DA results. Thus, we compared OMI DA results between 2005 and 2018. As summarized in Table 3, the RMSE reduction over polluted regions in 2018 (by 48 %) was larger than that in 2005 (by 41 %) with statistical significance at the 99 % confidence level. The multi-year difference in DA performance is likely driven by inter-annual variations in meteorological conditions rather than by OMI degradation. Over Europe, the United States, and China, the number of cloud-free scenes in 2018 was increased by 11 %–19 % compared to those in 2005. In contrast, RMSE reductions over remote regions were similar (23 % in 2018 and 25 % in 2005). Such interannual changes in cloud cover can affect the overall OMI DA performance, which needs to be considered in the TROPOMI and OMI comparison results for 2018. Nevertheless, the improvements against assimilated observations by TROPOMI DA (by 54 %) were larger than those by OMI DA for both years 2005 (by 34 %) and 2018 (by 38 %). TROPOMI DA clearly shows better performance compared to OMI DA for the periods before instrumental degradation, even when considering inter-annual variations in meteorological conditions.
The top-down estimates provided by TROPOMI DA significantly differed from the a priori emissions (Fig. 9 and Table 7). TROPOMI DA tends to decrease emissions over the eastern United States, China, northern India, and Central Africa. Large positive increments (by 42 % on average) were found over regions where soil emissions are dominant (>50 % in a priori emissions), such as over remote areas of Spain, Turkey, the Midwestern United States, Kazakhstan, and the Sahel regions. This suggests underestimated soil emissions in a prior inventories, as commonly reported by previous studies (Vinken et al., 2014; Oikawa et al., 2015; Visser et al., 2019). The country and regional total emissions were decreased by 14 % in the United States, 38 % in China, 17 % in India, and 22 % in Central Africa, and they were increased by 12 % in Europe, 39 % in the Middle East, and 44 % in Southeast Asia.
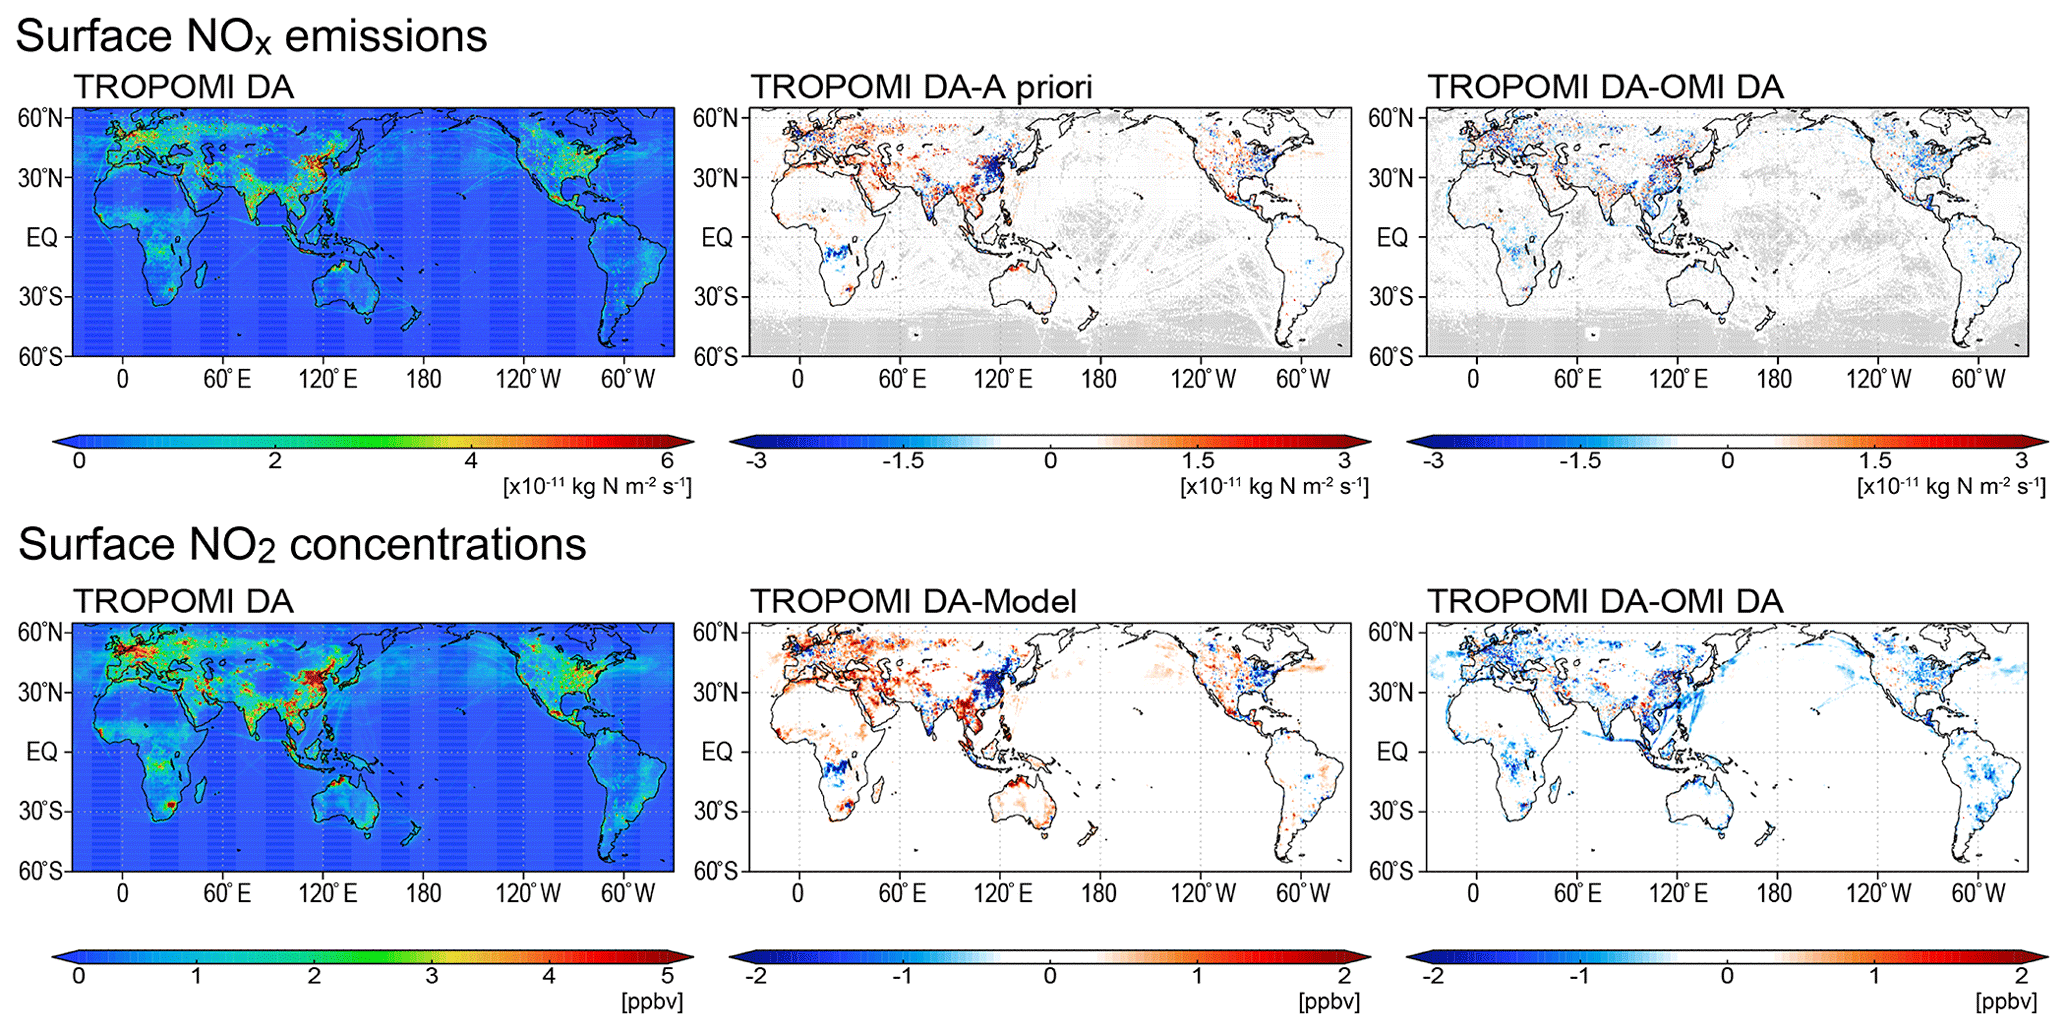
Figure 9Global distributions of top-down NOx emission estimates (top) and surface NO2 concentrations (bottom) provided by Tropospheric Monitoring Instrument (TROPOMI) data assimilation (DA) from 15 April–31 May 2018 (left), as well as the differences between TROPOMI DA and a priori emissions (middle) and between TROPOMI DA and Ozone Monitoring Instrument (OMI) DA (right). For the middle upper and right upper panels, grids with a gray color indicate the differences that are statistically insignificant at the 95 % confidence level using the Mann–Whitney U test. The units of NOx emissions and NO2 concentrations are kg N m−2 s−1 and ppbv, respectively.
Table 7Global and regional total surface and lightning NOx emissions (Tg yr−1) from 15 April–31 May 2018, taken from a priori emissions, Tropospheric Monitoring Instrument (TROPOMI) data assimilation (DA), Ozone Monitoring Instrument (OMI) DA, EDGARv5 (for 2015)+GFED4 (for 2018) inventories, and REASv3.2 (for 2015)+GFED4 (for 2018) inventories. The ranges are the standard deviations of the time series. A priori lightning emissions are calculated in the control model simulation.
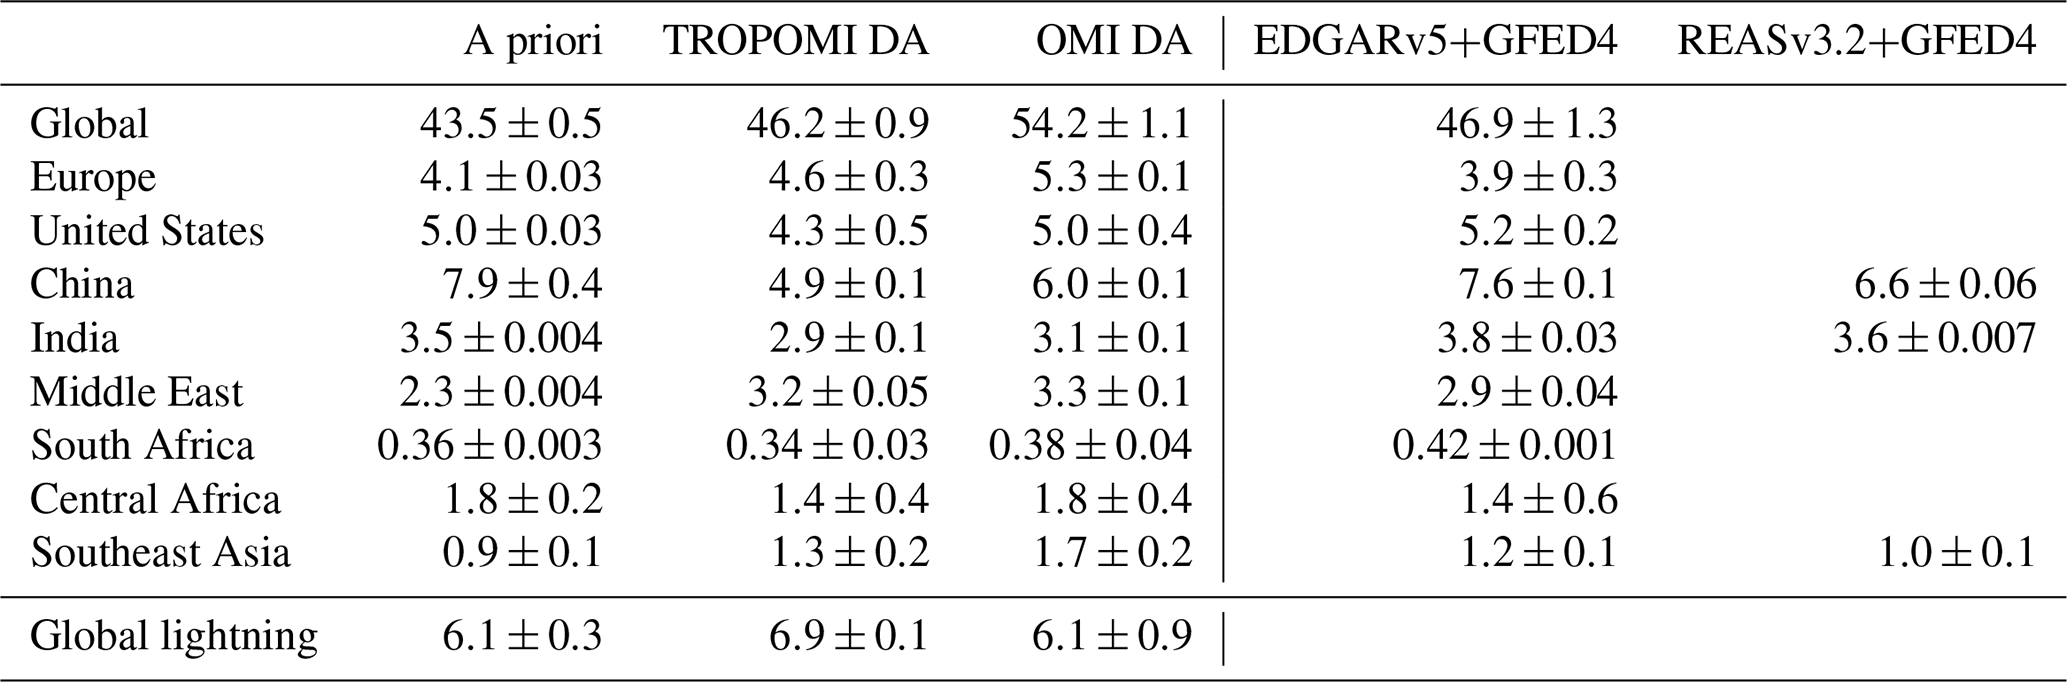
The global total NOx emissions were 15 % smaller in TROPOMI DA than in OMI DA, with 3 %–18 % smaller regional total emissions for polluted regions and 22 %–23 % smaller regional total emissions for biomass burning regions, which led to smaller surface NO2 concentrations (Fig. 9). These differences reflect the low bias of TROPOMI retrievals compared to OMI retrievals. The low bias of the TROPOMI retrievals compared to the OMI retrievals also affects OH concentrations. Assimilation of lower NO2 retrievals, through NOx emission and NO2 concentration optimization, led to weaker chemical production of HOx and conversion from HO2 to OH. This effect resulted in 2 %–21 % smaller regional-mean OH concentrations in the lower troposphere in TROPOMI DA, except for South Africa. In contrast, differences in the regional total emissions over India and the Middle East between TROPOMI DA and OMI DA were small (4 %–5 %), reflecting small differences in regional-mean concentrations between the TROPOMI and OMI retrievals (4 %–6 % lower in TROPOMI). Compared to the EDGARv5 (Crippa et al., 2019) and REASv3.2 (Kurokawa and Ohara, 2020) bottom-up emission inventories for 2015, the regional total emissions from TROPOMI DA and OMI DA over major polluted regions, except for Europe, were smaller by 17 %–35 % and 9 %–21 %, respectively. These results suggest that the emission estimates from OMI DA are closer to the EDGARv5 and REASv3.2 bottom-up emission inventories than those from TROPOMI DA (using the TROPOMI v1.2 beta product).
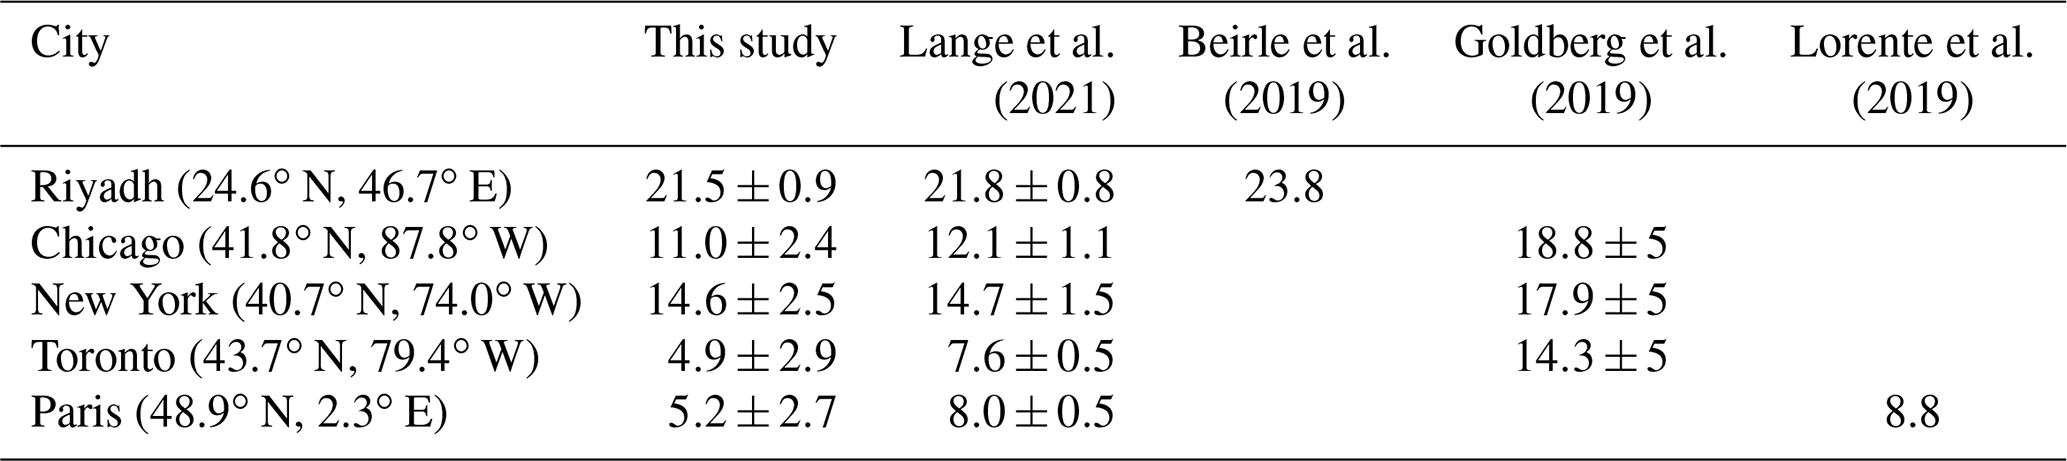
The NOx emissions derived from TROPOMI DA were compared with previous estimates over large urban areas based on statistical fits of NO2 line density data with the exponentially modified Gaussian (EMG) function using TROPOMI NO2 (Beirle et al., 2019; Lorente et al., 2019; Goldberg et al., 2019; Lange et al., 2021). We focused on large urban areas where at least two estimates were available. For this comparison, a posteriori emissions from our TROPOMI DA estimates were integrated inside a square of 100×100 km2 centered on the selected urban area, while the uncertainty information was obtained from the analysis ensemble spreads. As summarized in Table 8, our estimates were in good agreement with the previous estimates within 10 % differences for Riyadh, Chicago, and New York compared to the estimates from Beirle et al. (2019) and Lange et al. (2021). Nevertheless, lower emissions in our estimates by 18 %–66 % over Chicago, New York, and Toronto than the estimates from Goldberg et al. (2019) could be explained by the difference in the TROPOMI NO2 AMF calculation, which was replaced by Environment and Climate Change Canada (ECCC) with their high-resolution regional chemical transport model (CTM) and the MODIS surface reflectance (Griffin et al., 2019). For Paris, our estimate in late spring was lower by 35 % and 41 % than those by Lorente et al. (2019) and Lange et al. (2021), respectively, but analyzed for different time periods in winter and annually, respectively. Increases in NOx emissions during cold seasons are because of residential heating (Lorente et al., 2019). Overall, these results imply that top-down NOx emission estimates using TROPOMI version 1.2–1.3 products could be affected by the TROPOMI low biases compared to OMI, while top-down estimates using TROPOMI have the potential for constraints on detailed spatial and temporal variations based on validation results (see Sect. 3.3).
Lange et al.Beirle et al.Goldberg et al.Lorente et al.2021201920192019Table 8NOx emission estimates in large urban areas obtained from this study and previous studies. The unit is megagrams (Mg) per hour. Emissions are averaged for the period 15 April–31 May 2018 for this study, March 2018–November 2020 for Lange et al. (2021), December 2017–October 2018 for Beirle et al. (2019), May–September 2018 for Goldberg et al. (2019), and February–June 2018 for Lorente et al. (2019). The ranges of the emissions are emission analysis spreads in this study, while the ranges are the errors estimated by individual previous studies.
Cloud-covered scenes of satellite NO2 retrievals were used to optimize lightning NOx sources following the method of Miyazaki et al. (2014), which provide important constraints on tropospheric chemistry including ozone (e.g., Boersma et al., 2005; Miyazaki et al., 2014; Allen et al., 2021). Because of its high spatial resolution, TROPOMI NO2 retrievals offer the potential for better resolving small-scale cloud-covered scenes (Marais et al., 2021) and constraining lightning NOx sources. As a result, the difference between TROPOMI DA and OMI DA can be attributed to 75 %–92 % higher vertical sensitivities above the cloud height for cloud-covered scenes (CRF >0.5). As shown in Table 7, the global total production of lightning NO estimated by TROPOMI DA was 13 % larger than that estimated by OMI DA, with larger regional total production by 14 %–52 % over North and South America, Southeast Asia, the Atlantic, and the Indian Ocean. The impacts of TROPOMI on lightning NOx source estimation will be investigated in more detail in a separate study.
The NO2 DA plays an important role in improving the representation of tropospheric chemistry, including ozone. We evaluated the relative values of TROPOMI and OMI NO2 DA on surface and tropospheric ozone analysis.
5.1 Validation using surface in situ data
Daily maximum 8 h average (MDA8) ozone concentrations were validated using surface in situ observation data in the same manner as NO2. As summarized in Table 5, the regional mean bias and RMSE of the control model simulation against surface in situ ozone observations over Europe were 22 % and 29 %, respectively, with large RMSEs over southern Europe (Fig. 10). Over the United States, the mean model bias and RMSE were 10 % and 22 %, respectively, reflecting large model biases over the eastern United States. The mean bias and RMSE over Japan were 7 % and 18 %, respectively. Positive model biases in surface ozone over polluted regions are commonly reported in other global CTMs (Schnell et al., 2015; Turnock et al., 2020).

Figure 10Root-mean-square errors (RMSEs) against surface in situ observations (ppbv) for daily maximum 8 h average (MDA8) ozone concentrations in the control model simulation (left), as well as their reductions by Tropospheric Monitoring Instrument (TROPOMI) data assimilation (DA) and Ozone Monitoring Instrument (OMI) DA (middle and right, respectively) over Europe (top), the United States (middle), and Japan (bottom). The values are mapped onto 0.56∘ resolution grids. For the middle and right columns, grids with open circles indicate the RMSE reductions that are statistically significant at the 95 % confidence level using the Mann–Whitney U test.
TROPOMI DA increased the mean bias and RMSE of surface ozone over Europe by 14 % and 8 %, respectively, with large error increases over southern Europe. Increased bias and RMSE were also found over the western United States. Many factors can lead to increased errors in ozone, including model errors in ozone precursors' emissions other than NOx, chemical processes, and meteorological processes such as PBL vertical mixing. For example, ozone responses to NOx emissions strongly depend on the choice of CTMs (Miyazaki et al., 2020c), which affects the impacts of NOx emission corrections on ozone analyses. Over the eastern United States, RMSEs were typically reduced by 5–10 ppbv by TROPOMI DA, resulting in improved bias by 14 % and RMSE by 16 % at the country scale. Over Japan, the mean bias and RMSE were reduced by TROPOMI DA by 54 % and 7 %, respectively.
For most regions, better agreement with surface ozone data was obtained from TROPOMI DA than from OMI DA. OMI DA resulted in larger increases in the positive bias and RMSE over Europe by 32 % and 22 %, respectively. Over the United States, the mean bias and RMSE were slightly increased by OMI DA by 8 % and 1 %, respectively. The bias reduction over Japan by TROPOMI DA was larger than that by OMI DA (by 18 %), while RMSE over Japan was increased by OMI DA (by 4 %). The better agreement in surface ozone by TROPOMI DA coincides with that in surface NO2 (see Sect. 3.3.2). This confirms that the better representation of NO2 through assimilation of advanced NO2 satellites is essential to improve surface ozone analysis for many regions of the world. Meanwhile, any biases in satellite NO2 retrievals affect surface ozone analysis. Surface ozone analysis biases are expected to be increased for a NOx-limited ozone chemical regime when using updated retrievals with reduced TROPOMI NO2 negative bias.
5.2 Validation using ozonesonde data
Here we focus on the NO2 DA impacts on free tropospheric ozone. Mean negative model biases of ozone at 500 and 800 hPa against ozonesonde observations were 9.5 % and 3.8 %, respectively, over the 20–90∘ N band, 15.7 % and 3.6 % over the tropics (20∘ S–20∘ N), and 14.4 % and 20.6 % over the 20–90∘ S band. The RMSEs at 500 and 800 hPa were 16 % and 23 %, respectively, over the 20–90∘ N band, 26 % and 31 % over the tropics, and 23 % and 18 % over the 20–90∘ S band (Table 9).
Table 9Mean bias (MB) and root-mean-square error (RMSE) for ozone concentrations at 500 and 800 hPa against ozonesonde observations over three latitude bands from 15 April–31 May 2018. The units of MB and RMSE are in parts per billion by volume (ppbv). Boldface denotes the best agreement with in situ observations. “Model” indicates the control model simulation.
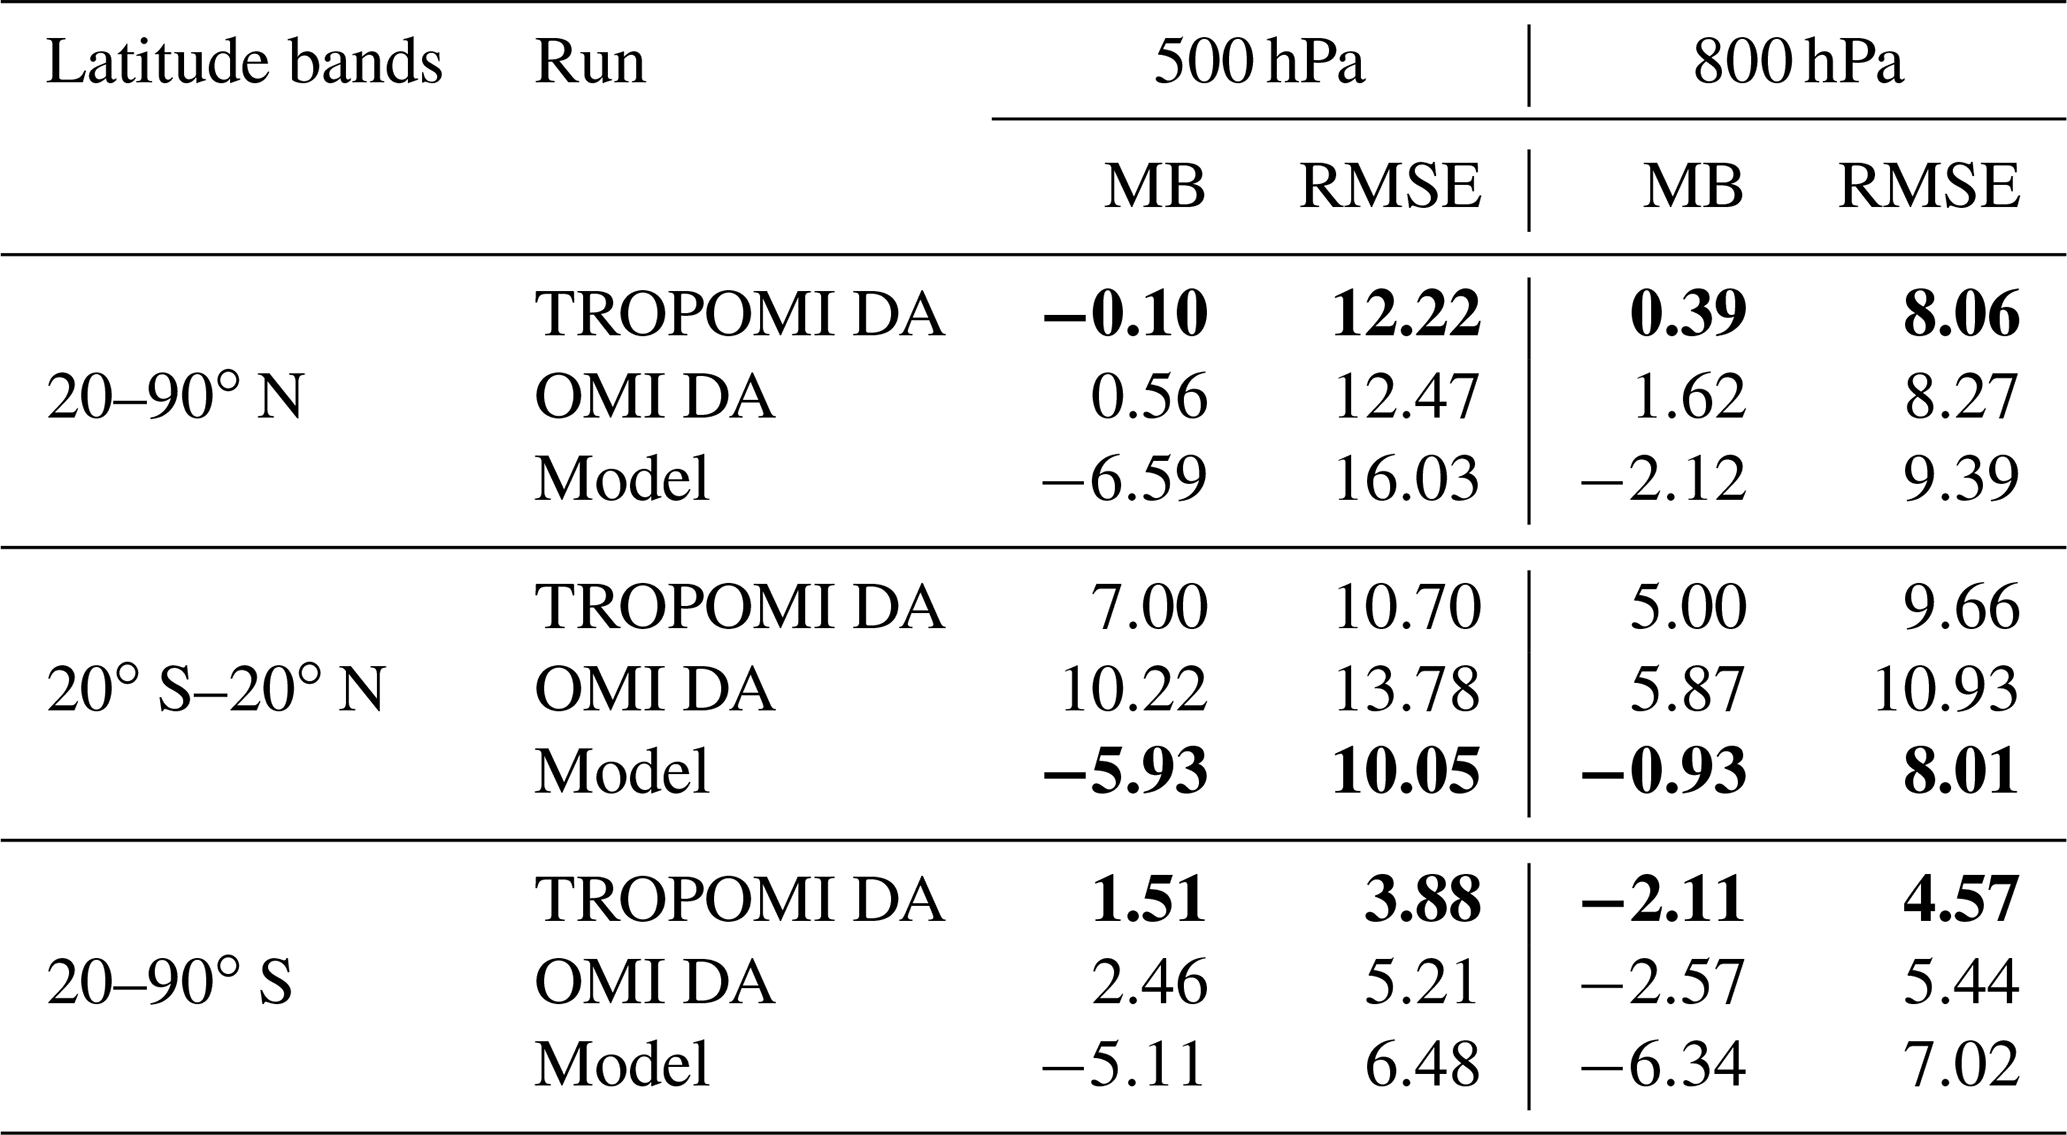
TROPOMI DA greatly reduced the mean model biases and RMSE by 98 % and 24 % at 500 hPa, respectively, and 82 % and 14 % at 800 hPa over the 20–90∘ N band. Over the 20–90∘ S band, there were reductions of 67 % and 40 % at 500 hPa, respectively, and 70 % and 35 % at 800 hPa. In contrast, it introduced large positive biases in the tropics. The reductions in model bias and RMSEs over the 20–90∘ N and S bands provided by TROPOMI DA were larger than those by OMI DA (by 24 %–91 % and 12 %–22 %, respectively). The increases in model biases and RMSEs over the tropics by TROPOMI DA were smaller than those by OMI DA. The larger differences at 500 hPa over the tropics than over the extratropics can be attributed to smaller NOx emission estimates over biomass burning regions in TROPOMI DA than those in OMI DA, through upward transport of ozone and NOx and chemical processes. In addition, the tropospheric ozone burden over 60∘ N–60∘ S was smaller in TROPOMI DA (291 Tg of O3) than in OMI DA (304 Tg of O3), while estimates from both TROPOMI DA and OMI DA were within the 287–311 Tg of O3 range of satellite-based estimates (i.e., the OMI/MLS, OMI-SAO, OMI-RAL, IASI-FORLI, and IASI-SOFRID satellite products) for the period 2014–2016 (Gaudel et al., 2018).
We compared DA analyses of NO2, ozone concentrations, and NOx emissions derived from the assimilation of the TROPOMI and OMI tropospheric NO2 column retrievals. To generate observation data representative to the model grid size, we employed a super-observation approach that explicitly accounts for spatial correlations between observation errors. Because of 16 % smaller relative super-observation errors in TROPOMI than in OMI, the DA self-consistency, as measured by RMSE reductions against the assimilated observations, was improved in TROPOMI DA by 54 %, which was larger than OMI DA (by 38 %). Agreements against the independent ATom-4 aircraft-campaign and surface in situ NO2 data were also improved by 12 %–84 % and 23 %–50 %, respectively, which was larger than those for OMI DA (by up to 70 % and 47 %, respectively) for many cases. The improved NO2 led to improved agreement with surface in situ MDA8 ozone over the United States and Japan in TROPOMI DA (by 7 %–40 %) than in OMI DA (by 1 %–22 %). Agreements with ozonesonde data at 500 and 800 hPa were also improved by TROPOMI DA by 14 %–40 % for most regions, except for the tropics, which was larger than those by OMI DA (by 12 %–22 %).
Global total NOx emission for 15 April–31 May 2018 was increased from 43.5 Tg N yr−1 in a priori emissions to 46.2 Tg N yr−1 by TROPOMI DA, which was 15 % smaller than those derived from OMI DA (54.2 Tg N), with 3 %–23 % smaller regional total emissions for major polluted and biomass burning areas. The city-scale emissions derived from TROPOMI DA were generally consistent with previous estimates using limited-area high-resolution analyses (within 10 % differences for Riyadh, New York, and Chicago). The global emission estimates constrained by the more accurate and dense TROPOMI measurements provide complementary information about emission variability, especially where accurate and detailed information on activity data and emission factors is missing when developing bottom-up inventories (Elguindi et al., 2020). This would also benefit model simulations of tropospheric ozone (e.g., Miyazaki et al., 2019; Visser et al., 2019; Bae et al., 2020; Qu et al., 2020) and estimations of nitrate aerosols and their deposition flux (Nowlan et al., 2014; Geddes and Martin, 2017). These improvements are important for productivities and diversities of terrestrial and marine ecosystems.
The DA performance comparisons provide a systematic evaluation of TROPOMI and OMI retrievals, independent from their averaging kernels and a priori profiles. The improved agreements with independent observations in TROPOMI DA demonstrate the importance of improved spatial coverage and reduced retrieval uncertainty for many science applications. Along with the improved spatial patterns, the impact of systematic biases in the retrievals needs to be carefully evaluated. Validation against surface NO2 measurements confirmed lower bias in TROPOMI retrievals compared to OMI retrievals by 15 % for the United States, Europe, and Japan, consistent with previous validation results (Lambert et al., 2021). The smaller estimated NOx emissions also confirm the low biases in TROPOMI NO2 relative to OMI NO2 globally, which in turn affected ozone analysis.
The systematic differences of TROPOMI version 1.2 compared to ground-based remote sensing and OMI are larger in winter than in other seasons over the polluted regions (Verhoelst et al., 2021; Lambert et al., 2021), consistent with Appendix A. The influence of negative biases related to the a priori profile shape area removed by using averaging kernels. However, because of the larger TROPOMI (version 1.2) negative bias in winter than in April–May, the relative DA performance between TROPOMI and OMI will depend on the season, especially over heavily polluted areas. Because of the availability of aircraft-campaign observational data for validation and the active photochemical production during the target period, this study focused on April–May 2018 only, and the impact of seasonally varying relative biases between OMI and TROPOMI has not been investigated. The low bias in TROPOMI version 1.2.2 compared to OMI is largely attributed to a negative cloud height bias in the FRESCO cloud retrieval algorithm (van Geffen et al., 2021). The updated TROPOMI NO2 products were introduced in December 2020 (version 1.4) and July 2021 (version 2.2) after this study. These new versions largely remove the bias with respect to the OMI QA4ECV product for all seasons, especially in winter over polluted areas (van Geffen et al., 2021). Lambert et al. (2021) and van Geffen et al. (2021) reported that the negative biases of the updated TROPOMI retrievals (versions 1.4.x and 2.x) compared to OMI are reduced to within 10 %. Assuming a remaining bias of 10 % compared to OMI, the improved TROPOMI retrievals would increase the estimated NOx emissions by 10 %–30 % over Europe and eastern China in winter for areas with a weak chemical non-linearity, compared to the DA using TROPOMI version 1.2 beta. The increase in NOx emissions would reduce negative ozone biases in the DA analysis for a NOx-limited ozone chemical regime. Further investigations on the impacts of the seasonally varying retrieval biases would provide more detailed insights into the relative performance of TROPOMI and OMI DA. Meanwhile, in contrast to the large systematic difference in mean NO2 concentrations, the relative super-observation errors of TROPOMI retrievals were almost identical between different retrieval versions (Appendix B). This suggests that the DA efficiency, for example, to constrain detailed temporal and spatial variations using TROPOMI as demonstrated by this study, might not be largely affected by the retrieval updates.
Consequently, the evaluation of individual satellite measurement through DA integration provides unique and detailed information on possible retrieval errors and its characteristics, including their spatiotemporal structures, which in turn provides a platform to evaluate different retrievals and supports satellite retrieval developments. Meanwhile, application of bias correction in DA analysis is essential for the combined use of observational information from multiple sensors, including those from other polar orbit satellites such as OMPS and advanced geostationary satellites such as GEMS, TEMPO, and Sentinel-4.
As shown in Fig. A1, the negative biases in TROPOMI tropospheric NO2 column compared to OMI are larger in December 2018–February 2019 (by 25 %, 19 %, and 26 % over Europe, the United States, and China, respectively) than in April–May 2018 (by 10 %, 17 %, and 16 % over Europe, the United States, and China, respectively). In contrast, the differences in super-observation errors between TROPOMI and OMI are relatively constant over time. The differences in the relative super-observation errors (i.e., errors divided by concentrations) obtained from TROPOMI and OMI are smaller in winter than in other seasons over Europe and China because of the larger bias of the TROPOMI tropospheric NO2 column compared to OMI in winter than in other seasons.
The strong negative biases in TROPOMI retrievals in winter would increase the negative bias in NO2 concentration analysis and reduce the estimated NOx emissions. Meanwhile, the differences in relative super-observation errors of TROPOMI retrievals between winter and other seasons suggest that TROPOMI DA might provide less constraints on spatial and temporal variations in NO2 in winter than in other seasons and would still provide better constraints than OMI DA.

Figure A1Monthly-mean time series of tropospheric NO2 column (a, b, c), super-observation errors (d, e, f), and relative super-observation errors (g, h, i) obtained from the Tropospheric Monitoring Instrument (TROPOMI) version 1.2 beta (April–May 2018) and version 1.2 (June 2018–March 2019) products during April 2018–March 2019 over Europe (a, d, g; 35–60∘ N, 10∘ W–30∘ E), the United States (b, e, h; 28–50∘ N, 70–125∘ W), and China (c, f, i; 18–50∘ N, 102–132∘ E). The units of the tropospheric NO2 column, super-observation errors, and relative super-observation errors are ×1015 molec. cm−2, ×1015 molec. cm−2, and percentage (%), respectively.
In the latest version of the TROPOMI NO2 product, the low bias compared to OMI QA4ECV is largely improved from the previous versions (ESA, 2021; van Geffen et al., 2021). To discuss the potential impacts of the algorithm updates on the DA performance, Fig. B1 compares global distributions of tropospheric NO2 column, super-observation errors, and relative super-observation errors (i.e., errors divided by concentrations) obtained from the TROPOMI version 1.2 beta product, which was used in this study, and the S5P-PAL reprocessing product (processed with same processor as version 2.3.1), which was released more recently, for May 2018. The S5P-PAL reprocessing product data were obtained from the S5P-PAL data portal (https://data-portal.s5p-pal.com, last access: 1 February 2022). The algorithm updates from versions 1.2 to 2.3 led to increases in tropospheric NO2 column amounts typically by 6 % over polluted areas due to the algorithm updates from versions 1.2 to 2.3. These increases are mainly attributable to the improved FRESCO cloud retrievals (van Geffen et al., 2021). In contrast, the relative super-observation errors over most regions except for the southern midlatitudes are comparable between the products, with less than 0.2 % differences in the mean relative super-observation error over 60∘ N–60∘ S. These differences are much smaller than the differences between the TROPOMI version 1.2 beta and OMI QA4ECV products (by 19 % in May 2018).
The improved TROPOMI retrievals would reduce the negative bias in NO2 concentration analysis and increase the estimated NOx emissions for areas with weak chemical non-linearity. The increase in NOx emissions would reduce the negative biases in ozone analysis under NOx-limited ozone chemical regime. Meanwhile, the relative super-observation errors of TROPOMI retrievals were almost identical between versions 1.2 beta and 2.3.1. This suggests that the DA efficiency, for example, to constrain detailed temporal and spatial variations, might not be largely affected by the algorithm updates.
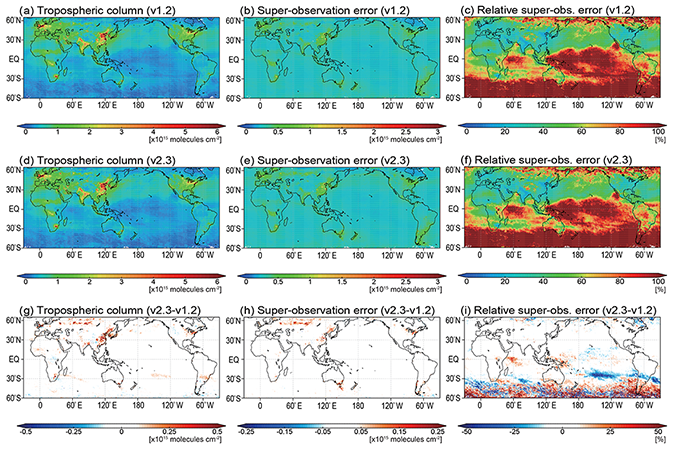
Figure B1Global distribution of tropospheric NO2 column (a, d, g), super-observation errors (b, e, h), and relative super-observation errors (c, f, i) obtained from the Tropospheric Monitoring Instrument (TROPOMI) version 1.2 beta product (a, b, c) and TROPOMI S5P-PAL (same as version 2.3.1) product (d, e, f), as well as the differences between TROPOMI version 1.2 beta and S5P-PAL products (g, h, i) during May 2018. The units of the tropospheric NO2 column, super-observation errors, and relative super-observation errors are ×1015 molec. cm−2, ×1015 molec. cm−2, and percentage (%), respectively.
The source code is not publicly available because of license restriction. The source code is available from Kengo Sudo (kengo@nagoya-u.jp) upon request. The source code for the data assimilation system is available from Kazuyuki Miyazaki (kazuyuki.miyazaki@jpl.nasa.gov) upon request.
The data assimilation results are available online (https://figshare.com/projects/Sekiya_et_al_2021/126770, last access: 1 February 2022; Sekiya et al., 2021, https://doi.org/10.1029/2020MS002180). The TROPOMI and OMI satellite retrievals are publicly available at the TEMIS website (https://www.temis.nl/airpollution/no2col/no2regio_tropomi.php, last access: 1 February 2022; TEMIS, 2022) and the S5P-PAL data portal (https://data-portal.s5p-pal.com/browser/, last access: 1 February 2022, ESA, 2022). The AirBase data, AQS data, and Japanese continuous measurement data were provided by the EEA (https://discomap.eea.europa.eu/map/fme/AirQualityExport.htm, last access: 1 February 2022, EEA, 2022), the US EPA (https://aqs.epa.gov/aqsweb/airdata/download_files.html#Raw, last access: 1 February 2022; U.S. Environmental Protection Agency, 2022), and NIES (https://www.nies.go.jp/igreen/, last access: 1 February 2022; National Institute for Environmental Studies, 2022), respectively. The ATom-4 observation data were taken from the NASA Ames Earth Science Project Office (https://espoarchive.nasa.gov/archive/browse/atom/id14/DC8, last access: 1 February 2022; NASA Ames Earth Science Project Office, 2022). Ozonesonde observation data were obtained from https://woudc.org/data/explore.php?lang=en (last access: 1 February 2022; World Ozone and Ultraviolet Radiation Data Centre, 2022), SHADOZ (https://tropo.gsfc.nasa.gov/shadoz/Archive.html, last access: 1 February 2022; National Aeronautics and Space Administration, 2022), and NOAA ESRL GMD (https://gml.noaa.gov/aftp/data/ozwv/Ozonesonde/, last access: 28 February 2022; National Oceanic and Atmospheric Administration, 2022). MCD12C1 MODIS/Terra+Aqua Land Cover Type data (Yearly L3 Global 0.05Deg CMG) were obtained from NASA Earthdata website (https://earthdata.nasa.gov/, last access: 1 February 2022; Friedl and Sulla-Menashe, 2015, https://doi.org/10.5067/MODIS/MCD12C1.006).
TS, KM, and HE designed this study. TS conducted data assimilation calculations and analyzed the results. HE provided the TROPOMI and OMI NO2 data. All the coauthors commented upon and helped improve the manuscript.
The contact author has declared that neither they nor their co-authors have any competing interests.
Publisher’s note: Copernicus Publications remains neutral with regard to jurisdictional claims in published maps and institutional affiliations.
A part of the research was conducted at the Jet Propulsion Laboratory, California Institute of Technology, under a contract with NASA. This work contains the modified Copernicus Sentinel data (2018), processed by ESA, for TROPOMI. Earth Simulator was used for simulation and data assimilation calculations with the support of JAMSTEC.
This research has been supported by MEXT (grant no. JPMXP1020200305) as the Program for Promoting Researches on the Supercomputer Fugaku (Large Ensemble Atmospheric and Environmental Prediction for Disaster Prevention and Mitigation) and by JSPS KAKENHI (grant nos. 18H01285 and 18KK0102).
This paper was edited by Helen Worden and reviewed by two anonymous referees.
Allen, D., Pickering, K. E., Bucsela, E., Van Geffen, J., Lapierre, J., Koshak, W., and Eskes, H.: Observations of Lightning NOx Production From Tropospheric Monitoring Instrument Case Studies Over the United States, J. Geophys. Res.-Atmos., 126, e2020JD034174, https://doi.org/10.1029/2020JD034174, 2021. a
Bae, C., Kim, H. C., Kim, B.-U., and Kim, S.: Surface ozone response to satellite-constrained NOx emission adjustments and its implications, Environ. Pollut., 258, 113469, https://doi.org/10.1016/j.envpol.2019.113469, 2020. a
Barré, J., Peuch, V.-H., Lahoz, W. A., Attié, J.-L., Josse, B., Piacentini, A., Eremenko, M., Dufour, G., Nedelec, P., von Clarmann, T., and El Amraoui, L.: Combined data assimilation of ozone tropospheric columns and stratospheric profiles in a high-resolution CTM, Q. J. Roy. Meteor. Soc., 140, 966–981, https://doi.org/10.1002/qj.2176, 2014. a
Barré, J., Gaubert, B., Arellano, A. F. J., Worden, H. M., Edwards, D. P., Deeter, M. N., Anderson, J. L., Raeder, K., Collins, N., Tilmes, S., Francis, G., Clerbaux, C., Emmons, L. K., Pfister, G. G., Coheur, P.-F., and Hurtmans, D.: Assessing the impacts of assimilating IASI and MOPITT CO retrievals using CESM-CAM-chem and DART, J. Geophys. Res.-Atmos., 120, 10501–10529, https://doi.org/10.1002/2015JD023467, 2015. a
Beirle, S., Borger, C., Dörner, S., Li, A., Hu, Z., Liu, F., Wang, Y., and Wagner, T.: Pinpointing nitrogen oxide emissions from space, Science Advances, 5, eaax9800, https://doi.org/10.1126/sciadv.aax9800, 2019. a, b, c, d, e, f
Boersma, K. F., Eskes, H. J., Meijer, E. W., and Kelder, H. M.: Estimates of lightning NOx production from GOME satellite observations, Atmos. Chem. Phys., 5, 2311–2331, https://doi.org/10.5194/acp-5-2311-2005, 2005. a
Boersma, K. F., Vinken, G. C. M., and Eskes, H. J.: Representativeness errors in comparing chemistry transport and chemistry climate models with satellite UV–Vis tropospheric column retrievals, Geosci. Model Dev., 9, 875–898, https://doi.org/10.5194/gmd-9-875-2016, 2016. a, b
Boersma, K. F., Eskes, H., Richter, A., De Smedt, I., Lorente, A., Beirle, S., Van Geffen, J., Peters, E., Van Roozendael, M., and Wagner, T.: QA4ECV NO2 tropospheric and stratospheric vertical column data from OMI (Version 1.1), Royal Netherlands Meteorological Institute (KNMI) [data set], https://doi.org/10.21944/qa4ecv-no2-omi-v1.1, 2017. a
Boersma, K. F., Eskes, H. J., Richter, A., De Smedt, I., Lorente, A., Beirle, S., van Geffen, J. H. G. M., Zara, M., Peters, E., Van Roozendael, M., Wagner, T., Maasakkers, J. D., van der A, R. J., Nightingale, J., De Rudder, A., Irie, H., Pinardi, G., Lambert, J.-C., and Compernolle, S. C.: Improving algorithms and uncertainty estimates for satellite NO2 retrievals: results from the quality assurance for the essential climate variables (QA4ECV) project, Atmos. Meas. Tech., 11, 6651–6678, https://doi.org/10.5194/amt-11-6651-2018, 2018. a
Bovensmann, H., Burrows, J. P., Buchwitz, M., Frerick, J., Noël, S., Rozanov, V. V., Chance, K. V., and Goede, A. P. H.: SCIAMACHY: Mission Objectives and Measurement Modes, J. Atmos. Sci., 56, 127–150, https://doi.org/10.1175/1520-0469(1999)056<0127:SMOAMM>2.0.CO;2, 1999. a
Burrows, J. P., Weber, M., Buchwitz, M., Rozanov, V., Ladstätter-Weißenmayer, A., Richter, A., DeBeek, R., Hoogen, R., Bramstedt, K., Eichmann, K.-U., Eisinger, M., and Perner, D.: The Global Ozone Monitoring Experiment (GOME): Mission Concept and First Scientific Results, J. Atmos. Sci., 56, 151–175, https://doi.org/10.1175/1520-0469(1999)056<0151:TGOMEG>2.0.CO;2, 1999. a
Callies, J., Corpaccioli, E., Eisinger, M., Hahne, A., and Lefebvre, A.: GOME-2- Metop's second-generation sensor for operational ozone monitoring, ESA bulletin, 102, 28–36, 2000. a
Crippa, M., Guizzardi, D., Muntean, M., and Schaaf, E.: EDGAR v5.0 Global Air Pollutant Emissions, European Commission, Joint Research Centre (JRC) [data set], https://data.jrc.ec.europa.eu/dataset/377801af-b094-4943-8fdc-f79a7c0c2d19 (last access: 1 February 2022), 2019. a
de Foy, B., Lu, Z., Streets, D. G., Lamsal, L. N., and Duncan, B. N.: Estimates of power plant NOx emissions and lifetimes from OMI NO2 satellite retrievals, Atmos. Environ., 116, 1–11, https://doi.org/10.1016/j.atmosenv.2015.05.056, 2015. a
Dee, D. P., Uppala, S. M., Simmons, A. J., Berrisford, P., Poli, P., Kobayashi, S., Andrae, U., Balmaseda, M. A., Balsamo, G., Bauer, P., Bechtold, P., Beljaars, A. C. M., van de Berg, L., Bidlot, J., Bormann, N., Delsol, C., Dragani, R., Fuentes, M., Geer, A. J., Haimberger, L., Healy, S. B., Hersbach, H., Hólm, E. V., Isaksen, L., Kållberg, P., Köhler, M., Matricardi, M., McNally, A. P., Monge-Sanz, B. M., Morcrette, J.-J., Park, B.-K., Peubey, C., de Rosnay, P., Tavolato, C., Thépaut, J.-N., and Vitart, F.: The ERA-Interim reanalysis: configuration and performance of the data assimilation system, Q. J. Roy. Meteor. Soc., 137, 553–597, https://doi.org/10.1002/qj.828, 2011. a
Dickerson, R. R., Anderson, D. C., and Ren, X.: On the use of data from commercial NOx analyzers for air pollution studies, Atmos. Environ., 214, 116873, https://doi.org/10.1016/j.atmosenv.2019.116873, 2019. a
Dimitropoulou, E., Hendrick, F., Pinardi, G., Friedrich, M. M., Merlaud, A., Tack, F., De Longueville, H., Fayt, C., Hermans, C., Laffineur, Q., Fierens, F., and Van Roozendael, M.: Validation of TROPOMI tropospheric NO2 columns using dual-scan multi-axis differential optical absorption spectroscopy (MAX-DOAS) measurements in Uccle, Brussels, Atmos. Meas. Tech., 13, 5165–5191, https://doi.org/10.5194/amt-13-5165-2020, 2020. a
Ding, J., van der A, R. J., Mijling, B., Levelt, P. F., and Hao, N.: NOx emission estimates during the 2014 Youth Olympic Games in Nanjing, Atmos. Chem. Phys., 15, 9399–9412, https://doi.org/10.5194/acp-15-9399-2015, 2015. a
Ding, J., van der A, R. J., Eskes, H. J., Mijling, B., Stavrakou, T., van Geffen, J. H. G. M., and Veefkind, J. P.: NOx Emissions Reduction and Rebound in China Due to the COVID-19 Crisis, Geophys. Res. Lett., 47, e2020GL089912, https://doi.org/10.1029/2020GL089912, 2020. a
EEA: Air Quality e-Reporting (AQ e-Reporting), EEA, https://discomap.eea.europa.eu/map/fme/AirQualityExport.htm, last access: 1 February 2022. a
Elguindi, N., Granier, C., Stavrakou, T., Darras, S., Bauwens, M., Cao, H., Chen, C., Denier van der Gon, H. A. C., Dubovik, O., Fu, T. M., Henze, D. K., Jiang, Z., Keita, S., Kuenen, J. J. P., Kurokawa, J., Liousse, C., Miyazaki, K., Müller, J.-F., Qu, Z., Solmon, F., and Zheng, B.: Intercomparison of Magnitudes and Trends in Anthropogenic Surface Emissions From Bottom-Up Inventories, Top-Down Estimates, and Emission Scenarios, Earth's Future, 8, e2020EF001520, https://doi.org/10.1029/2020EF001520, 2020. a
Emili, E., Barret, B., Massart, S., Le Flochmoen, E., Piacentini, A., El Amraoui, L., Pannekoucke, O., and Cariolle, D.: Combined assimilation of IASI and MLS observations to constrain tropospheric and stratospheric ozone in a global chemical transport model, Atmos. Chem. Phys., 14, 177–198, https://doi.org/10.5194/acp-14-177-2014, 2014. a
ESA: Copernicus Sentinel-5P, TROPOMI Level 2 Nitrogen Dioxide total column products, Version 01, European Space Agency [data set], https://doi.org/10.5270/S5P-s4ljg54, 2018. a
ESA: Copernicus Sentinel-5P, TROPOMI Level 2 Nitrogen Dioxide total column products, Version 02, European Space Agency [data set], https://doi.org/10.5270/S5P-9bnp8q8, 2021. a
ESA: S5P-PAL data portal, ESA, https://data-portal.s5p-pal.com/browser/, last access: 1 February 2022. a
Eskes, H., van Geffen, J., Boersma, K. F., Eichmann, K.-U., Apituley, A., Pedergnana, M., Sneep, M., Veefkind, J. P., and Loyola, D.: Sentinel-5 precursor/TROPOMI Level 2 Product User Manual Nitrogendioxide, S5P-KNMI-L2-0021-MA, https://sentinel.esa.int/documents/247904/2474726/Sentinel-5P-Level-2-Product-User-Manual-Nitrogen-Dioxide, last access: 28 February 2022. a
Eskes, H. J. and Boersma, K. F.: Averaging kernels for DOAS total-column satellite retrievals, Atmos. Chem. Phys., 3, 1285–1291, https://doi.org/10.5194/acp-3-1285-2003, 2003. a
Eskes, H. J., Velthoven, P. F. J. V., Valks, P. J. M., and Kelder, H. M.: Assimilation of GOME total-ozone satellite observations in a three-dimensional tracer-transport model, Q. J. Roy. Meteor. Soc., 129, 1663–1681, https://doi.org/10.1256/qj.02.14, 2003. a
Evensen, G.: The ensemble Kalman filter for combined state and parameter estimation, IEEE Control Syst. Mag., 29, 83–104, 2009. a
Fortems-Cheiney, A., Chevallier, F., Pison, I., Bousquet, P., Carouge, C., Clerbaux, C., Coheur, P.-F., George, M., Hurtmans, D., and Szopa, S.: On the capability of IASI measurements to inform about CO surface emissions, Atmos. Chem. Phys., 9, 8735–8743, https://doi.org/10.5194/acp-9-8735-2009, 2009. a
Friedl, M. and Sulla-Menashe, D.: MCD12C1 MODIS/Terra+Aqua Land Cover Type Yearly L3 Global 0.05Deg CMG, NASA EOSDIS Land Processes DAAC [data set], https://doi.org/10.5067/MODIS/MCD12C1.006, 2015 (data available at: https://earthdata.nasa.gov/, last access: 1 February 2022). a, b
Gaudel, A., Cooper, O. R., Ancellet, G., Barret, B., Boynard, A., Burrows, J. P., Clerbaux, C., Coheur, P.-F., Cuesta, J., Cuevas, E., Doniki, S., Dufour, G., Ebojie, F., Foret, G., Garcia, O., Granados-Muñoz, M. J., Hannigan, J. W., Hase, F., Hassler, B., Huang, G., Hurtmans, D., Jaffe, D., Jones, N., Kalabokas, P., Kerridge, B., Kulawik, S., Latter, B., Leblanc, T., Le Flochmoën, E., Lin, W., Liu, J., Liu, X., Mahieu, E., McClure-Begley, A., Neu, J. L., Osman, M., Palm, M., Petetin, H., Petropavlovskikh, I., Querel, R., Rahpoe, N., Rozanov, A., Schultz, M. G., Schwab, J., Siddans, R., Smale, D., Steinbacher, M., Tanimoto, H., Tarasick, D. W., Thouret, V., Thompson, A. M., Trickl, T., Weatherhead, E., Wespes, C., Worden, H. M., Vigouroux, C., Xu, X., Zeng, G., and Ziemke, J.: Tropospheric Ozone Assessment Report: Present-day distribution and trends of tropospheric ozone relevant to climate and global atmospheric chemistry model evaluation, Elementa: Science of the Anthropocene, 6, 39, https://doi.org/10.1525/elementa.291, 2018. a
Geddes, J. A. and Martin, R. V.: Global deposition of total reactive nitrogen oxides from 1996 to 2014 constrained with satellite observations of NO2 columns, Atmos. Chem. Phys., 17, 10071–10091, https://doi.org/10.5194/acp-17-10071-2017, 2017. a
Gelaro, R. and Zhu, Y.: Examination of observation impacts derived from observing system experiments (OSEs) and adjoint models, Tellus A, 61, 179–193, https://doi.org/10.1111/j.1600-0870.2008.00388.x, 2009. a
Gluck, S., Glenn, C., Logan, T., Vu, B., Walsh, M., and Williams, P.: Evaluation of NOx Flue Gas Analyzers for Accuracy and Their Applicability for Low-Concentration Measurements, J. Air Waste Manage., 53, 749–758, https://doi.org/10.1080/10473289.2003.10466208, 2003. a
Goldberg, D. L., Lu, Z., Streets, D. G., de Foy, B., Griffin, D., McLinden, C. A., Lamsal, L. N., Krotkov, N. A., and Eskes, H.: Enhanced Capabilities of TROPOMI NO2: Estimating NOX from North American Cities and Power Plants, Environ. Sci. Technol., 53, 12594–12601, https://doi.org/10.1021/acs.est.9b04488, 2019. a, b, c, d, e, f
Griffin, D., Zhao, X., McLinden, C. A., Boersma, F., Bourassa, A., Dammers, E., Degenstein, D., Eskes, H., Fehr, L., Fioletov, V., Hayden, K., Kharol, S. K., Li, S.-M., Makar, P., Martin, R. V., Mihele, C., Mittermeier, R. L., Krotkov, N., Sneep, M., Lamsal, L. N., ter Linden, M., van Geffen, J., Veefkind, P., and Wolde, M.: High-Resolution Mapping of Nitrogen Dioxide With TROPOMI: First Results and Validation Over the Canadian Oil Sands, Geophys. Res. Lett., 46, 1049–1060, https://doi.org/10.1029/2018GL081095, 2019. a
Huber, D. E., Steiner, A. L., and Kort, E. A.: Daily Cropland Soil NOx Emissions Identified by TROPOMI and SMAP, Geophys. Res. Lett., 47, e2020GL089949, https://doi.org/10.1029/2020GL089949, 2020. a
Hunt, B. R., Kostelich, E. J., and Szunyogh, I.: Efficient data assimilation for spatiotemporal chaos: A local ensemble transform Kalman filter, Physica D, 230, 112–126, https://doi.org/10.1016/j.physd.2006.11.008, 2007. a
IPCC: Climate Change 2021: The Physical Science Basis. Contribution of Working Group I to the Sixth Assessment Report of the Intergovernmental Panel on Climate Change, in press, 2022. a
Janssens-Maenhout, G., Crippa, M., Guizzardi, D., Dentener, F., Muntean, M., Pouliot, G., Keating, T., Zhang, Q., Kurokawa, J., Wankmüller, R., Denier van der Gon, H., Kuenen, J. J. P., Klimont, Z., Frost, G., Darras, S., Koffi, B., and Li, M.: HTAP_v2.2: a mosaic of regional and global emission grid maps for 2008 and 2010 to study hemispheric transport of air pollution, Atmos. Chem. Phys., 15, 11411–11432, https://doi.org/10.5194/acp-15-11411-2015, 2015. a
K-1 model developers: K-1 Coupled GCM (MIROC) Description, Tech. rep., Center for Climate System Research (Univ. of Tokyo), National Institute for Environmental Studies, and Frontier Research Center for Global Change, 38 pp., https://ccsr.aori.u-tokyo.ac.jp/~hasumi/miroc_description.pdf (last access: 28 February 2022), 2004. a
Kim, H. C., Kim, S., Cohen, M., Bae, C., Lee, D., Saylor, R., Bae, M., Kim, E., Kim, B.-U., Yoon, J.-H., and Stein, A.: Quantitative assessment of changes in surface particulate matter concentrations and precursor emissions over China during the COVID-19 pandemic and their implications for Chinese economic activity, Atmos. Chem. Phys., 21, 10065–10080, https://doi.org/10.5194/acp-21-10065-2021, 2021. a
Kurokawa, J. and Ohara, T.: Long-term historical trends in air pollutant emissions in Asia: Regional Emission inventory in ASia (REAS) version 3, Atmos. Chem. Phys., 20, 12761–12793, https://doi.org/10.5194/acp-20-12761-2020, 2020. a
Lambert, J.-C., Compernolle, S., Eichmann, K.-U., de Graaf, M., Hubert, D., Keppens, A., Kleipool, Q., Langerock, B., Sha, M. K., Verhoelst, T., Wagner, T., Ahn, C., Argyrouli, A., Balis, D., Chan, K. L., De Smedt, I., Eskes, H., Fjæraa, A. M., Garane, K., F., G. J., Goutail, F., Granville, J., Hedelt, P., Heue, K.-P., Jaross, G., Koukouli, M., Landgraf, J., Lutz, R., Nanda, S., Niemejer, S., Pazmiño, A., Pinardi, G., Pommereau, J.-P., Richter, A., Rozemeijer, N., Sneep, M., Stein Zweers, D., Theys, N., Tilstra, G., Torres, O., Valks, P., van Geffen, J., Vigouroux, C., Wang, P., and Weber, M.: Quarterly Validation Report of the Copernicus Sentinel-5 Precursor Operational Data Products #8, Tech. Rep. 7, S5P MPC Routine Operations Consolidated Validation Report series, version 07.00.00, 161 pp., http://www.tropomi.eu/sites/default/files/files/publicS5P-MPC-IASB-ROCVR-07.0.0-20200629_FINALsigned.pdf (last access: 22 March 2021), 2020. a
Lambert, J.-C., Compernolle, S., Eichmann, K.-U., de Graaf, M., Hubert, D., Keppens, A., Kleipool, Q., Langerock, B., Sha, M., Verhoelst, T., Wagner, T., Ahn, C., Argyrouli, A., Balis, D., Chan, K., De Smedt, I., Eskes, H., Fjæraa, A., Garane, K., Gleason, J., Goutail, F., Granville, J., Hedelt, P., Heue, K.-P., Jaross, G., Koukouli, M., Landgraf, J., Lutz, R., Nanda, S., Niemeijer, S., Pazmiño, A., Pinardi, G., Pommereau, J.-P., Richter, A., Rozemeijer, N., Sneep, M., Stein Zweers, D., Theys, N., Tilstra, G., Torres, O., Valks, P., van Geffen, J., Vigouroux, C., Wang, P., and Weber, M.: Quarterly Validation Report of the Copernicus Sentinel-5 Precursor Operational Data Products #12: April 2018–September 2021, Tech. Rep. 12, S5P MPC Routine Operations Consolidated Validation Report series, version 12.01.00, 172 pp., https://mpc-vdaf.tropomi.eu/ProjectDir/reports//pdf/S5P-MPC-IASB-ROCVR-12.01.01-20210930-signedJCL_AD.pdf, last access: 26 October 2021. a, b, c, d
Lamsal, L. N., Martin, R. V., van Donkelaar, A., Steinbacher, M., Celarier, E. A., Bucsela, E., Dunlea, E. J., and Pinto, J. P.: Ground‐level nitrogen dioxide concentrations inferred from the satellite‐borne Ozone Monitoring Instrument, J. Geophys. Res., 113, D16308, https://doi.org/10.1029/2007JD009235, 2008. a
Lange, K., Richter, A., and Burrows, J. P.: Variability of nitrogen oxide emission fluxes and lifetimes estimated from Sentinel-5P TROPOMI observations, Atmos. Chem. Phys. Discuss. [preprint], https://doi.org/10.5194/acp-2021-273, in review, 2021. a, b, c, d, e, f, g
Levelt, P. F., van den Oord, G. H. J., Dobber, M. R., Malkki, A., Visser, H., de Vries, J., Stammes, P., Lundell, J. O. V., and Saari, H.: The ozone monitoring instrument, IEEE T. Geosci. Remote, 44, 1093–1101, https://doi.org/10.1109/TGRS.2006.872333, 2006. a, b
Lin, J.-T., Liu, Z., Zhang, Q., Liu, H., Mao, J., and Zhuang, G.: Modeling uncertainties for tropospheric nitrogen dioxide columns affecting satellite-based inverse modeling of nitrogen oxides emissions, Atmos. Chem. Phys., 12, 12255–12275, https://doi.org/10.5194/acp-12-12255-2012, 2012. a
Liu, J., Bowman, K. W., and Lee, M.: Comparison between the Local Ensemble Transform Kalman Filter (LETKF) and 4D-Var in atmospheric CO2 flux inversion with the Goddard Earth Observing System-Chem model and the observation impact diagnostics from the LETKF, J. Geophys. Res., 121, 13066–13087, https://doi.org/10.1002/2016JD025100, 2016. a
Lorente, A., Boersma, K. F., Eskes, H. J., Veefkind, J. P., van Geffen, J. H. G. M., de Zeeuw, M. B., Denier van der Gon, H. A. C., Beirle, S., and Krol, M. C.: Quantification of nitrogen oxides emissions from build-up of pollution over Paris with TROPOMI, Sci. Rep., 9, 20033, https://doi.org/10.1038/s41598-019-56428-5, 2019. a, b, c, d, e, f, g
Mann, H. B. and Whitney, D. R.: On a Test of Whether one of Two Random Variables is Stochastically Larger than the Other, Ann. Math. Stat., 18, 50–60, http://www.jstor.org/stable/2236101 (last access: 1 February 2022), 1947. a
Marais, E. A., Roberts, J. F., Ryan, R. G., Eskes, H., Boersma, K. F., Choi, S., Joiner, J., Abuhassan, N., Redondas, A., Grutter, M., Cede, A., Gomez, L., and Navarro-Comas, M.: New observations of NO2 in the upper troposphere from TROPOMI, Atmos. Meas. Tech., 14, 2389–2408, https://doi.org/10.5194/amt-14-2389-2021, 2021. a
Miyazaki, K., Eskes, H. J., and Sudo, K.: Global NOx emission estimates derived from an assimilation of OMI tropospheric NO2 columns, Atmos. Chem. Phys., 12, 2263–2288, https://doi.org/10.5194/acp-12-2263-2012, 2012a. a, b
Miyazaki, K., Eskes, H. J., Sudo, K., Takigawa, M., van Weele, M., and Boersma, K. F.: Simultaneous assimilation of satellite NO2, O3, CO, and HNO3 data for the analysis of tropospheric chemical composition and emissions, Atmos. Chem. Phys., 12, 9545–9579, https://doi.org/10.5194/acp-12-9545-2012, 2012b. a
Miyazaki, K., Eskes, H. J., Sudo, K., and Zhang, C.: Global lightning NOx production estimated by an assimilation of multiple satellite data sets, Atmos. Chem. Phys., 14, 3277–3305, https://doi.org/10.5194/acp-14-3277-2014, 2014. a, b, c, d
Miyazaki, K., Eskes, H., Sudo, K., Boersma, K. F., Bowman, K., and Kanaya, Y.: Decadal changes in global surface NOx emissions from multi-constituent satellite data assimilation, Atmos. Chem. Phys., 17, 807–837, https://doi.org/10.5194/acp-17-807-2017, 2017. a, b, c
Miyazaki, K., Sekiya, T., Fu, D., Bowman, K. W., Kulawik, S. S., Sudo, K., Walker, T., Kanaya, Y., Takigawa, M., Ogochi, K., Eskes, H., Boersma, K. F., Thompson, A. M., Gaubert, B., Barre, J., and Emmons, L. K.: Balance of Emission and Dynamical Controls on Ozone During the Korea-United States Air Quality Campaign From Multiconstituent Satellite Data Assimilation, J. Geophys. Res.-Atmos., 124, 387–413, https://doi.org/10.1029/2018JD028912, 2019. a, b, c, d
Miyazaki, K., Bowman, K., Sekiya, T., Eskes, H., Boersma, F., Worden, H., Livesey, N., Payne, V. H., Sudo, K., Kanaya, Y., Takigawa, M., and Ogochi, K.: Updated tropospheric chemistry reanalysis and emission estimates, TCR-2, for 2005–2018, Earth Syst. Sci. Data, 12, 2223–2259, https://doi.org/10.5194/essd-12-2223-2020, 2020a. a, b, c
Miyazaki, K., Bowman, K., Sekiya, T., Jiang, Z., Chen, X., Eskes, H., Ru, M., Zhang, Y., and Shindell, D.: Air Quality Response in China Linked to the 2019 Novel Coronavirus (COVID-19) Lockdown, Geophys. Res. Lett., 47, e2020GL089252, https://doi.org/10.1029/2020GL089252, 2020b. a
Miyazaki, K., Bowman, K. W., Yumimoto, K., Walker, T., and Sudo, K.: Evaluation of a multi-model, multi-constituent assimilation framework for tropospheric chemical reanalysis, Atmos. Chem. Phys., 20, 931–967, https://doi.org/10.5194/acp-20-931-2020, 2020c. a
Miyazaki, K., Bowman, K., Sekiya, T., Takigawa, M., Neu, J. L., Sudo, K., Osterman, G., and Eskes, H.: Global tropospheric ozone responses to reduced NOx emissions linked to the COVID-19 worldwide lockdowns, Science Advances, 7, eabf7460, https://doi.org/10.1126/sciadv.abf7460, 2021. a
Ménard, R. and Chang, L.-P.: Assimilation of Stratospheric Chemical Tracer Observations Using a Kalman Filter. Part II: χ2-Validated Results and Analysis of Variance and Correlation Dynamics, Mon. Weather Rev., 128, 2672–2686, https://doi.org/10.1175/1520-0493(2000)128<2672:AOSCTO>2.0.CO;2, 2000. a
NASA Ames Earth Science Project Office: ATom-4 observation data, NASA Ames ESPO [data set], https://espoarchive.nasa.gov/archive/browse/atom/id14/DC8, last access: 1 February 2022. a
National Aeronautics and Space Administration (NASA): SHADOZ – Southern Hemisphere ADditional OZonesondes, An Archive of sub/tropical and remote ozonesonde data, NASA, Goddard Space Flight Center, https://tropo.gsfc.nasa.gov/shadoz/Archive.html, last access: 1 February 2022. a
National Institute for Environmental Studies (NIES): Continuous measurements of general air pollution at ground level, NIES [data set], https://www.nies.go.jp/igreen/, last access: 1 February 2022 (in Japanese). a
National Oceanic and Atmospheric Administration (NOAA): Global Monitoring Laboratory (GML), NOAA ESRL GML, https://gml.noaa.gov/aftp/data/ozwv/Ozonesonde/, last access: 28 February 2022. a
Nowlan, C. R., Martin, R. V., Philip, S., Lamsal, L. N., Krotkov, N. A., Marais, E. A., Wang, S., and Zhang, Q.: Global dry deposition of nitrogen dioxide and sulfur dioxide inferred from space-based measurements, Global Biogeochem. Cy., 28, 1025–1043, https://doi.org/10.1002/2014GB004805, 2014. a
Oikawa, P. Y., Ge, C., Wang, J., Eberwein, J. R., Liang, L. L., Allsman, L. A., Grantz, D. A., and Jenerette, G. D.: Unusually high soil nitrogen oxide emissions influence air quality in a high-temperature agricultural region, Nat. Commun., 6, 8753, https://doi.org/10.1038/ncomms9753, 2015. a
Pickering, K. E., Wang, Y., Tao, W.-K., Price, C., and Müller, J.-F.: Vertical distributions of lightning NOx for use in regional and global chemical transport models, J. Geophys. Res., 103, 31203–31216, https://doi.org/10.1029/98JD02651, 1998. a
Price, C. and Rind, D.: A simple lightning parameterization for calculating global lightning distributions, J. Geophys. Res., 97, 9919–9933, https://doi.org/10.1029/92JD00719, 1992. a
Qu, Z., Henze, D. K., Cooper, O. R., and Neu, J. L.: Impacts of global NOx inversions on NO2 and ozone simulations, Atmos. Chem. Phys., 20, 13109–13130, https://doi.org/10.5194/acp-20-13109-2020, 2020. a
Randerson, J. T., van der Werf, G. R., Giglio, L., Collatz, G. J., and Kasibhatla, P. S.: Global Fire Emissions Database, Version 4.1 (GFEDv4), ORNL DAAC [data set], Oak Ridge, Tennessee, USA, https://doi.org/10.3334/ORNLDAAC/1293, 2018. a
Schenkeveld, V. M. E., Jaross, G., Marchenko, S., Haffner, D., Kleipool, Q. L., Rozemeijer, N. C., Veefkind, J. P., and Levelt, P. F.: In-flight performance of the Ozone Monitoring Instrument, Atmos. Meas. Tech., 10, 1957–1986, https://doi.org/10.5194/amt-10-1957-2017, 2017. a
Schnell, J. L., Prather, M. J., Josse, B., Naik, V., Horowitz, L. W., Cameron-Smith, P., Bergmann, D., Zeng, G., Plummer, D. A., Sudo, K., Nagashima, T., Shindell, D. T., Faluvegi, G., and Strode, S. A.: Use of North American and European air quality networks to evaluate global chemistry–climate modeling of surface ozone, Atmos. Chem. Phys., 15, 10581–10596, https://doi.org/10.5194/acp-15-10581-2015, 2015. a
Sekiya, T., Miyazaki, K., Ogochi, K., Sudo, K., and Takigawa, M.: Global high-resolution simulations of tropospheric nitrogen dioxide using CHASER V4.0, Geosci. Model Dev., 11, 959–988, https://doi.org/10.5194/gmd-11-959-2018, 2018. a, b
Sekiya, T., Miyazaki, K., Ogochi, K., Sudo, K., Takigawa, M., Eskes, H., and Boersma, K. F.: Impacts of Horizontal Resolution on Global Data Assimilation of Satellite Measurements for Tropospheric Chemistry Analysis, J. Adv. Model. Earth Sy., 13, e2020MS002180, https://doi.org/10.1029/2020MS002180, 2021 (data available at: https://figshare.com/projects/Sekiya_et_al_2021/126770, last access: 1 February 2022). a, b, c, d, e
S5P-PAL data portal: https://data-portal.s5p-pal.com/, last access: 1 February 2022.
Stavrakou, T., Müller, J.-F., Boersma, K. F., van der A, R. J., Kurokawa, J., Ohara, T., and Zhang, Q.: Key chemical NOx sink uncertainties and how they influence top-down emissions of nitrogen oxides, Atmos. Chem. Phys., 13, 9057–9082, https://doi.org/10.5194/acp-13-9057-2013, 2013. a
Sterling, C. W., Johnson, B. J., Oltmans, S. J., Smit, H. G. J., Jordan, A. F., Cullis, P. D., Hall, E. G., Thompson, A. M., and Witte, J. C.: Homogenizing and estimating the uncertainty in NOAA's long-term vertical ozone profile records measured with the electrochemical concentration cell ozonesonde, Atmos. Meas. Tech., 11, 3661–3687, https://doi.org/10.5194/amt-11-3661-2018, 2018. a
Sudo, K., Takahashi, M., Kurokawa, J., and Akimoto, H.: CHASER: A global chemical model of the troposphere 1. Model description, J. Geophys. Res., 107, 4339, https://doi.org/10.1029/2001JD001113, 2002. a
TEMIS (Tropospheric Emission Monitoring Internet Service): https://www.temis.nl/airpollution/no2col/no2regio_tropomi.php, last access: 1 February 2022. a
Thompson, A. M., Witte, J. C., Sterling, C., Jordan, A., Johnson, B. J., Oltmans, S. J., Fujiwara, M., Vömel, H., Allaart, M., Piters, A., Coetzee, G. J. R., Posny, F., Corrales, E., Diaz, J. A., Félix, C., Komala, N., Lai, N., Ahn Nguyen, H. T., Maata, M., Mani, F., Zainal, Z., Ogino, S.-y., Paredes, F., Penha, T. L. B., da Silva, F. R., Sallons-Mitro, S., Selkirk, H. B., Schmidlin, F. J., Stübi, R., and Thiongo, K.: First Reprocessing of Southern Heamisphere Additional Ozonesondes (SHADOZ) Ozone Profiles (1998–2016): 2. Comparisons With Satellites and Ground-Based Instruments, J. Geophys. Res.-Atmos., 122, 13000–13025, https://doi.org/10.1002/2017JD027406, 2017. a
Turnock, S. T., Allen, R. J., Andrews, M., Bauer, S. E., Deushi, M., Emmons, L., Good, P., Horowitz, L., John, J. G., Michou, M., Nabat, P., Naik, V., Neubauer, D., O'Connor, F. M., Olivié, D., Oshima, N., Schulz, M., Sellar, A., Shim, S., Takemura, T., Tilmes, S., Tsigaridis, K., Wu, T., and Zhang, J.: Historical and future changes in air pollutants from CMIP6 models, Atmos. Chem. Phys., 20, 14547–14579, https://doi.org/10.5194/acp-20-14547-2020, 2020. a
U.S. Environmental Protection Agency (US EPA): Air Quality System (AQS), https://aqs.epa.gov/aqsweb/airdata/download_files.html#Raw, last access: 1 February 2022. a
van der A, R. J., de Laat, A. T. J., Ding, J., and Eskes, H. J.: Connecting the dots: NOx emissions along a West Siberian natural gas pipeline, npj Clim. Atmos. Sci., 3, 16, https://doi.org/10.1038/s41612-020-0119-z, 2020. a
van Geffen, J., Boersma, K. F., Eskes, H., Sneep, M., ter Linden, M., Zara, M., and Veefkind, J. P.: S5P TROPOMI NO2 slant column retrieval: method, stability, uncertainties and comparisons with OMI, Atmos. Meas. Tech., 13, 1315–1335, https://doi.org/10.5194/amt-13-1315-2020, 2020. a, b, c, d
van Geffen, J., Eskes, H., Compernolle, S., Pinardi, G., Verhoelst, T., Lambert, J.-C., Sneep, M., ter Linden, M., Ludewig, A., Boersma, K. F., and Veefkind, J. P.: Sentinel-5P TROPOMI NO2 retrieval: impact of version v2.2 improvements and comparisons with OMI and ground-based data, Atmos. Meas. Tech. Discuss. [preprint], https://doi.org/10.5194/amt-2021-329, in review, 2021. a, b, c, d, e, f
Veefkind, J., Aben, I., McMullan, K., Förster, H., de Vries, J., Otter, G., Claas, J., Eskes, H., de Haan, J., Kleipool, Q., van Weele, M., Hasekamp, O., Hoogeveen, R., Landgraf, J., Snel, R., Tol, P., Ingmann, P., Voors, R., Kruizinga, B., Vink, R., Visser, H., and Levelt, P.: TROPOMI on the ESA Sentinel-5 Precursor: A GMES mission for global observations of the atmospheric composition for climate, air quality and ozone layer applications, Remote Sens. Environ., 120, 70–83, https://doi.org/10.1016/j.rse.2011.09.027, 2012. a, b
Verhoelst, T., Compernolle, S., Pinardi, G., Lambert, J.-C., Eskes, H. J., Eichmann, K.-U., Fjæraa, A. M., Granville, J., Niemeijer, S., Cede, A., Tiefengraber, M., Hendrick, F., Pazmiño, A., Bais, A., Bazureau, A., Boersma, K. F., Bognar, K., Dehn, A., Donner, S., Elokhov, A., Gebetsberger, M., Goutail, F., Grutter de la Mora, M., Gruzdev, A., Gratsea, M., Hansen, G. H., Irie, H., Jepsen, N., Kanaya, Y., Karagkiozidis, D., Kivi, R., Kreher, K., Levelt, P. F., Liu, C., Müller, M., Navarro Comas, M., Piters, A. J. M., Pommereau, J.-P., Portafaix, T., Prados-Roman, C., Puentedura, O., Querel, R., Remmers, J., Richter, A., Rimmer, J., Rivera Cárdenas, C., Saavedra de Miguel, L., Sinyakov, V. P., Stremme, W., Strong, K., Van Roozendael, M., Veefkind, J. P., Wagner, T., Wittrock, F., Yela González, M., and Zehner, C.: Ground-based validation of the Copernicus Sentinel-5P TROPOMI NO2 measurements with the NDACC ZSL-DOAS, MAX-DOAS and Pandonia global networks, Atmos. Meas. Tech., 14, 481–510, https://doi.org/10.5194/amt-14-481-2021, 2021. a, b
Vinken, G. C. M., Boersma, K. F., van Donkelaar, A., and Zhang, L.: Constraints on ship NOx emissions in Europe using GEOS-Chem and OMI satellite NO2 observations, Atmos. Chem. Phys., 14, 1353–1369, https://doi.org/10.5194/acp-14-1353-2014, 2014. a
Visser, A. J., Boersma, K. F., Ganzeveld, L. N., and Krol, M. C.: European NOx emissions in WRF-Chem derived from OMI: impacts on summertime surface ozone, Atmos. Chem. Phys., 19, 11821–11841, https://doi.org/10.5194/acp-19-11821-2019, 2019. a, b
Witte, J. C., Thompson, A. M., Smit, H. G. J., Fujiwara, M., Posny, F., Coetzee, G. J. R., Northam, E. T., Johnson, B. J., Sterling, C. W., Mohamad, M., Ogino, S.-Y., Jordan, A., and da Silva, F. R.: First reprocessing of Southern Hemisphere ADditional OZonesondes (SHADOZ) profile records (1998–2015): 1. Methodology and evaluation, J. Geophys. Res.-Atmos., 122, 6611–6636, https://doi.org/10.1002/2016JD026403, 2017. a
Witte, J. C., Thompson, A. M., Smit, H. G. J., Vömel, H., Posny, F., and Stübi, R.: First Reprocessing of Southern Hemisphere ADditional OZonesondes Profile Records: 3. Uncertainty in Ozone Profile and Total Column, J. Geophys. Res.-Atmos., 123, 3243–3268, https://doi.org/10.1002/2017JD027791, 2018. a
Wofsy, S., Apel, E., Blake, D., Brock, C., Brune, W., T.P. Bui, B. D., Dibb, J., Diskin, G., Elkiins, J., Froyd, K., Hall, S., Hanisco, T., Huey, L., Jimenez, J., McKain, K., Montzka, S., Ryerson, T., Schwarz, J., Stephens, B., Weinzierl, B., and Wennberg, P.: ATom: Merged Atmospheric Chemistry, Trace Gases, and Aerosols, Version 1.5, ORNL DAAC [data set], Oak Ridge, Tennessee, USA, https://doi.org/10.3334/ORNLDAAC/1581, 2018. a
World Ozone and Ultraviolet Radiation Data Centre (WOUDC): https://woudc.org/data/explore.php?lang=en, last access: 1 February 2022. a
Yienger, J. J. and Levy, H.: Empirical model of global soil-biogenic NOx emissions, J. Geophys. Res., 100, 11447–11464, https://doi.org/10.1029/95JD00370, 1995. a
Zara, M., Boersma, K. F., De Smedt, I., Richter, A., Peters, E., van Geffen, J. H. G. M., Beirle, S., Wagner, T., Van Roozendael, M., Marchenko, S., Lamsal, L. N., and Eskes, H. J.: Improved slant column density retrieval of nitrogen dioxide and formaldehyde for OMI and GOME-2A from QA4ECV: intercomparison, uncertainty characterisation, and trends, Atmos. Meas. Tech., 11, 4033–4058, https://doi.org/10.5194/amt-11-4033-2018, 2018. a
Zhang, Q., Pan, Y., He, Y., Walters, W. W., Ni, Q., Liu, X., Xu, G., Shao, J., and Jiang, C.: Substantial nitrogen oxides emission reduction from China due to COVID-19 and its impact on surface ozone and aerosol pollution, Sci. Total Environ., 753, 142238, https://doi.org/10.1016/j.scitotenv.2020.142238, 2021. a
Zhang, X., Jones, D. B. A., Keller, M., Walker, T. W., Jiang, Z., Henze, D. K., Worden, H. M., Bourassa, A. E., Degenstein, D. A., and Rochon, Y. J.: Quantifying Emissions of CO and NOx Using Observations From MOPITT, OMI, TES, and OSIRIS, J. Geophys. Res., 124, 1170–1193, https://doi.org/10.1029/2018JD028670, 2019. a
Zupanski, D. and Zupanski, M.: Model Error Estimation Employing an Ensemble Data Assimilation Approach, Mon. Weather Rev., 134, 1337–1354, https://doi.org/10.1175/MWR3125.1, 2006. a
- Abstract
- Introduction
- Data and methods
- Validation results
- NOx emission estimates
- Impacts on ozone analysis
- Summary and discussion
- Appendix A: Seasonal cycles in the TROPOMI tropospheric NO2 and super-observation errors
- Appendix B: Characteristics of the TROPOMI version 1.2 and 2.3 products
- Code availability
- Data availability
- Author contributions
- Competing interests
- Disclaimer
- Acknowledgements
- Financial support
- Review statement
- References