the Creative Commons Attribution 4.0 License.
the Creative Commons Attribution 4.0 License.
 | 26 Apr 2022
Laboratory characterisation and intercomparison sounding test of dual thermistor radiosondes for radiation correction
Sang-Wook Lee
Sunghun Kim
Young-Suk Lee
Jae-Keun Yoo
Sungjun Lee
Suyong Kwon
Byung Il Choi
Jaewon So
Yong-Gyoo Kim
A dual thermistor radiosonde (DTR) comprising two (aluminium-coated and black) sensors with different emissivities was developed to correct the effects of solar radiation on temperature probes based on in situ radiation measurements. Herein, the DTR performance is characterised in terms of the uncertainty via a series of ground-based facilities and an intercomparison radiosounding test. The DTR characterisation procedure using laboratory facilities is as follows: individually calibrate the temperature of the thermistors in a climate chamber from −70 to 30 ∘C to evaluate the uncertainty of raw temperature measurement before radiation correction; test the effect of temperature on the resistance reading using radiosonde boards in the climate chamber from −70 to 20 ∘C to identify a potential source of errors owing to the boards, especially at cold temperatures; individually perform radiation tests on thermistors at room temperature to investigate the degree of heating of aluminium-coated and black sensors (the average ratio = 1 : 2.4) and use the result for obtaining unit-specific radiation correction formulas; and perform parameterisation of the radiation measurement and correction formulas with five representative pairs of sensors in terms of temperature, pressure, ventilation speed, and irradiance using an upper air simulator. These results are combined and applied to the DTR sounding test conducted in July 2021. Thereafter, the effective irradiance is measured using the temperature difference between the aluminium-coated and black sensors of the DTR. The measured irradiance is then used for the radiation correction of the DTR aluminium-coated sensor. The radiation-corrected temperature of the DTR is mostly consistent with that of a commercial radiosonde (Vaisala, RS41) within the expanded uncertainty (∼ 0.35 ∘C) of the DTR at the coverage factor k = 2. Furthermore, the components contributing to the uncertainty of the radiation measurement and correction are analysed. The DTR methodology can improve the accuracy of temperature measurement in the upper air within the framework of the traceability to the International System of Units.
- Article
(7039 KB) - Full-text XML
- BibTeX
- EndNote


Measurement of essential climate variables, such as temperature and water vapour (i.e. humidity) is important as they are essential input data for weather and climate prediction models (Bojinski et al., 2014). The temperature and humidity in the upper air are frequently and widely measured using radiosondes. A radiosonde is a telemetry device comprising various sensors that measure meteorological parameters and transmit the collected measurement data via radio frequency while being flown by a weather balloon up to about 35 km in altitude. Radiosonde observations can be co-located with global navigation satellite system radio occultation and these measurements are compared with each other to enhance the applicability and reliability of both techniques. The measurement accuracy of radiosondes needs to be improved in terms of uncertainty within the framework of the traceability to the International System of Units (SI).
Joint research programs between the metrology and the meteorology and climate communities, such as the MeteoMet–Metrology for Meteorology project, were initiated (Merlone et al., 2015, 2018) to acquire high-quality observational data on meteorological variables. Reference facilities have been developed through the project for calibrating the meteorological observation instruments to be used in the meteorological community. Additionally, low-temperature and low-pressure humidity chambers have been developed for calibrating radiosonde humidity sensors in the environments imitating the upper troposphere/lower stratosphere (Sairanen et al., 2015; Cuccaro et al., 2018). To investigate the climate change, a certain level of measurement uncertainty in radiosoundings should be secured in a SI-traceable way. Hence, the Global Climate Observing System (GCOS) Reference Upper Air Network (GRUAN) was founded to establish a dataset of traceable measurements with quantified uncertainties (GCOS, 2007). The required measurement accuracy of temperature specified by GRUAN is 0.2 ∘C in the stratosphere (GCOS, 2007).
A difficulty in improving the measurement accuracy of radiosondes is the correction of the solar radiation-induced heating of sensors during the daytime. The radiative heating of sensors is also affected by environmental conditions, such as temperature, air pressure and air ventilation, that are involved in convective cooling (Lee et al., 2018b, 2020). All these parameters should be considered together to precisely evaluate the radiation correction of radiosonde temperature sensors. Although most radiosonde manufacturers apply radiation corrections to their products (Nash et al., 2011), they do not disclose the detailed methodologies, including reference systems and correction algorithms. To independently evaluate the radiosondes, GRUAN has built a ground-based calibration facility and established a correction algorithm for the GRUAN data processing (GDP) of the Vaisala RS92 radiosonde (Dirksen et al., 2014). The uncertainty of the GDP of RS92 during daytime was gradually increased from 0.2 ∘C at the surface to 0.6 ∘C at 30 km with the coverage factor k = 2 (Dirksen et al., 2014). Recently, the same group built a new simulator to investigate the solar temperature error of radiosondes (SISTER) and derived a new GDP algorithm for the Vaisala RS41 radiosonde (von Rohden et al., 2022). The setup can control the irradiance, air pressure, ventilation, sensor rotation and tilting of the light incident angle. Using the setup, the uncertainty of the GDP of RS41 is evaluated to be about 0.3 ∘C (k = 2) at 35 km. It is also found that the daytime GRUAN profile is 0.35 ∘C warmer than the manufacturer's at 35 km (von Rohden et al., 2022); however, the surrounding temperature, which also affects the radiation correction, cannot be changed. Furthermore, an upper-air simulator (UAS) was developed by the Korea Research Institute of Standards and Science (KRISS) to similarly evaluate radiosondes (Lee et al., 2020). The UAS at KRISS can simultaneously control the temperature, pressure, ventilation and irradiance, and the UAS was recently supplemented with sensor tilting and rotation functions. Using this setup, a radiation correction formula of the RS41 radiosonde is presented (Lee et al., 2022); however, the radiation correction processes by GRUAN and KRISS assume that the solar irradiance is known. In fact, the solar irradiance is dependent on various parameters, such as cloud conditions, solar elevation angle, season and location. To date, the direct in situ measurements of solar irradiance are difficult without using additional pyranometers measuring on the same payload of radiosondes (Philipona et al., 2013). An alternative approach comprises the simulation of solar irradiance with appropriate cloud scenarios, surface albedo and solar angle (Key and Schweiger, 1998). From the perspective of the radiation correction uncertainty, the SI traceability of the simulated irradiance is incomplete when the sky is clear or cloudy because the simulated irradiance is constructed from the average of clear and cloudy sky cases (von Rohden et al., 2022). This results in the increase of the radiation correction uncertainty in the troposphere.
To resolve this issue, the concept of a dual thermistor radiosonde (DTR) comprising two temperature sensors with different emissivities was introduced to measure the effective irradiance using the temperature difference between them (Lee et al., 2018a, b). The DTR operation principle was demonstrated by investigating the effects of air ventilation as well as temperature and pressure using a wind tunnel and a climate chamber system, respectively. The temperature difference between the dual thermistors was shown to be linearly proportional to the effective irradiance, and the radiation-induced heating of the sensors was corrected according to the measured effective irradiance. Only the slope of the linear function of the radiation measurements and correction formulas changed with the environmental parameters, and the linearity itself was not altered; however, these DTR formulas were obtained using two separate setups that cannot be combined, and thus, the correction formula was incomplete in terms of the SI traceability.
Herein, the combined effect of temperature, pressure, ventilation and irradiance on DTR is investigated using the UAS at KRISS for the parameterisation of the radiation measurement and correction. The obtained formulas are used in an intercomparison sounding test performed in July 2021. Furthermore, a series of laboratory characterisations of DTR is conducted, including individual calibration of thermistors, test of temperature effect on resistance reading by radiosonde boards and individual radiation test on thermistors. The uncertainties due to parameterisation of the radiation correction formula using UAS and other characterisations are also evaluated. Then, the uncertainty components and their combined budget for the measured irradiance and corrected temperature in the sounding test are presented. Finally, the corrected temperatures of the DTR and the RS41 from parallel soundings are compared and the difference between them is discussed in terms of the uncertainty.
2.1 Dual thermistors with different emissivity
Figure 1a shows a DTR comprising two temperature sensors that are chip-in-glass type negative temperature coefficient (NTC) thermistors (Shibaura electronics, Model: PB7-41E). The glass bead encapsulating the sensing element is ellipsoidal in shape with 0.55 ± 0.1 mm diameter and 1.1 ± 0.3 mm length. The two thermistors are attached to the sensor boom via soldering and followed by epoxy for electrical insulation. The thermistors and sensor boom are coated with aluminium (Al) via thermal evaporation. One sensor is additionally coated with a black epoxy (Loctite, Model: STYCAST 2850 FT) to differentiate the emissivity (absorptivity) between them (inset of Fig. 1a). For convenience, the sensor coated with only Al is referred to as the white sensor, while the other sensor is referred to as the black sensor.
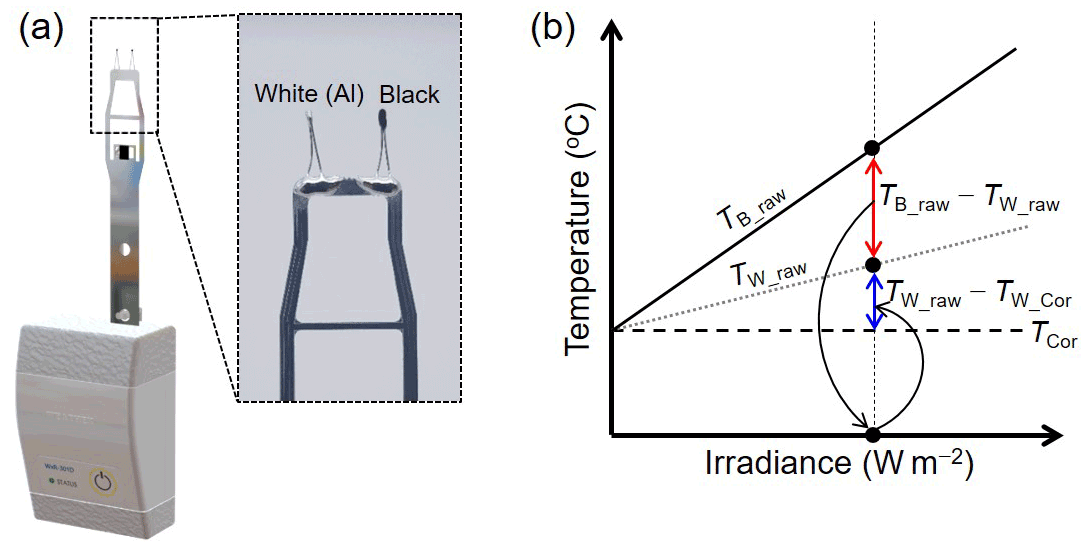
Figure 1(a) Dual thermistor radiosonde (DTR) with a white and black sensor and (b) operation principle of DTR for irradiance measurement and correction of radiation effect based on the measured irradiance. The temperature difference between the dual thermistors (TB_raw−TW_raw) is linearly proportional to the irradiance, and the radiation-induced heating of the white sensor (TW_raw−TW_cor) is corrected based on the irradiance measured by (TB_raw−TW_raw).
2.2 DTR operation principle
Previously, a pioneer work using multiple thermistors with different spectral responses (emissivity and absorptivity) was conducted for the radiation correction. In the work, however, complete knowledge on material properties of air and sensors and sensor geometry is required to solve multiple heat balance equations (Schmidlin et al., 1986). DTR utilises the purely experimental temperature difference between the white and black sensors to measure the effective irradiance and correct its effect on the white sensor (Fig. 1b). The temperature increase of each sensor due to solar irradiation is linearly proportional to the effective irradiance, as previously investigated by various theoretical and experimental studies (Lee et al., 2018b, a; Luers, 1990; McMillin et al., 1992). Additionally, the temperature of the black sensor (TB_raw) is higher than that of the white sensor (TW_raw) due to its high light absorptivity. Thus, the temperature difference between them (TB_raw−TW_raw) is also linearly proportional to the effective irradiance. Although other environmental parameters, e.g. air pressure and ventilation, affect the degree of heating of sensors via convective cooling; they only change the slope of the linear function and do not affect the linearity itself. The effect of other environmental parameters on the temperature difference and the temperature increase of the white sensor are investigated using the UAS developed at KRISS (Lee et al., 2022). Experimental results of the UAS are used to determine a formula to measure the effective irradiance based on the temperature difference between the two thermistors. Section 4 describes the procedure to obtain these formulas for the measurement of irradiance and the correction of the white sensor using the UAS in more detail.
3.1 Characterisation procedure
The DTR characterisation procedure is summarised in Fig. 2a–e. The characterisation process is categorised into laboratory experiments and sounding tests. First, the calibration of thermistors attached to the sensor boom is conducted from −70 to 30 ∘C in a climate chamber (Fig. 2a) and the uncertainty of raw temperature measurement is evaluated. Then, the temperature effect on the resistance reading by radiosonde boards is tested in the climate chamber from −70 to 20 ∘C to identify a potential source of errors owing to the boards, especially at cold temperatures (Fig. 2b). The temperature increase of all thermistors due to irradiation is individually recorded at room temperature (Fig. 2c) to include the differences in the sensitivities of the individual thermistors in the radiation correction. The radiation measurement and correction formulas of DTR are obtained in terms of temperature, pressure, ventilation speed and irradiance using the UAS (Fig. 2d). The laboratory experimental results are combined and applied to the DTR sounding system. Then, the sounding results of DTR are compared with those of a commercial radiosonde through dual soundings (Fig. 2e). Each characterisation procedure is discussed in detail in the following sections.

Figure 2Characterisations of DTR. (a) Individual calibration of thermistors in a climate chamber, (b) test of the effect of temperature on the resistance reading using the radiosonde boards in the climate chamber, (c) radiation test on individual thermistors, (d) parameterisation of radiation measurement and correction formulae using an upper air simulator and (e) sounding test by applying laboratory characterisation results.
3.2 Individual calibration of thermistors in a climate chamber
All thermistors are individually calibrated in a climate chamber (Kambic, Model: KK-190 CHULT). Figure 3a displays the calibration setup showing the sensors on the booms in the climate chamber, a digital multimeter (Keysight, Model: 34980A) to record the sensor resistances and a data acquisition computer. The setup can calibrate 35 pairs (7 × 5) of dual thermistors that are located on the same rectangular plane (230 mm × 190 mm). Five platinum resistance thermometers (PRT) with a nominal resistance of 100 Ω (PT100) are used as reference thermometers. They were calibrated at KRISS with an uncertainty of 0.05 ∘C at a coverage factor k = 2 and installed at the centre and four corners in the same rectangular plane as the thermistors. The average of the temperatures measured by the five reference PRTs (TRef_aver) is used as the reference temperature for calibration. Six calibration points are selected from −70 to 30 ∘C (Fig. 3b), of which the y-axis denotes the spatial temperature deviations (TRef_devi) represented by the maximum deviation from TRef_aver. Although the calibration range should be extended to −90 ∘C to cover temperatures over tropical and polar regions, it is not feasible using the climate chamber because the typical lowest temperature limit is approximately −80 ∘C.
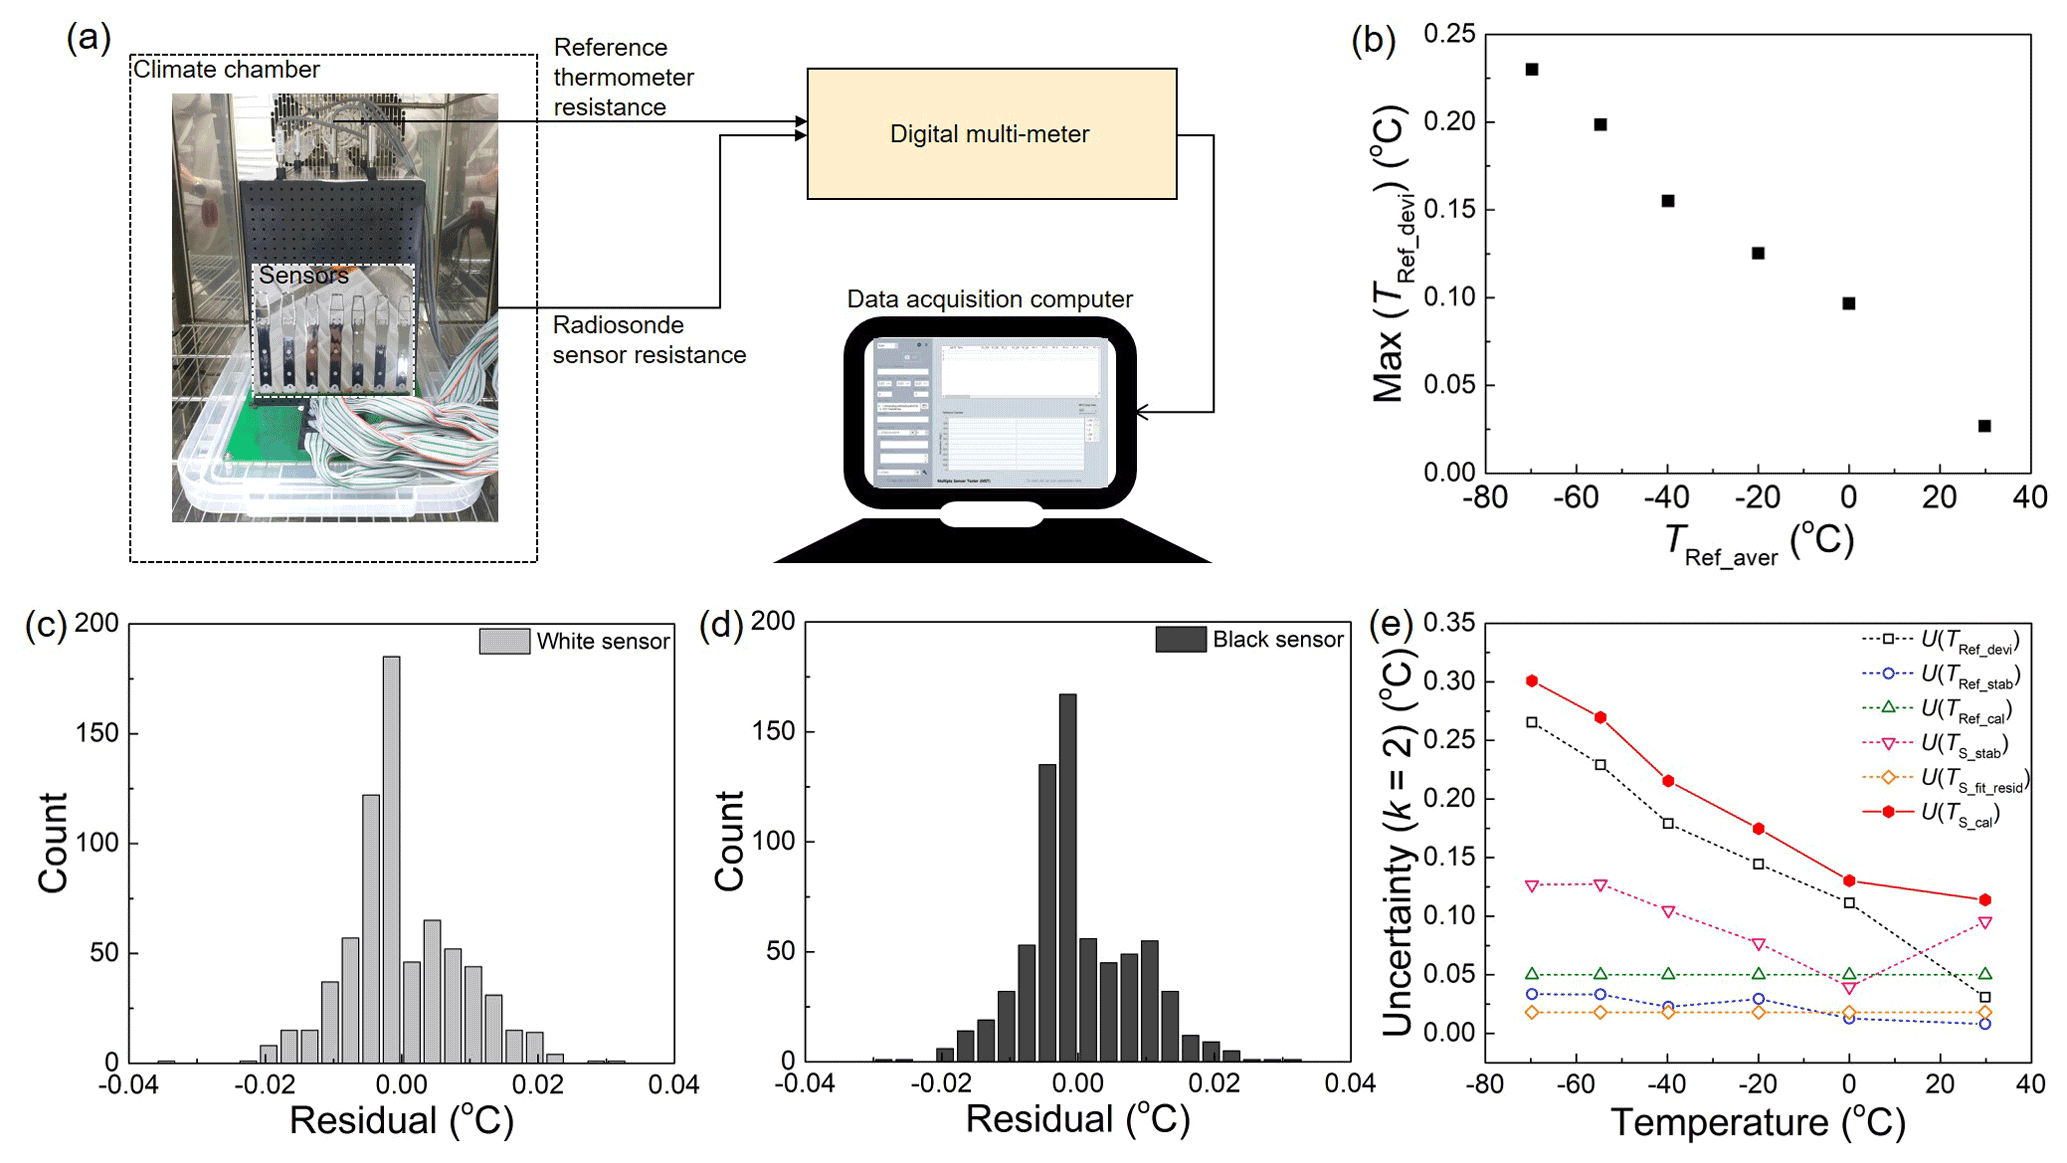
Figure 3Calibration of individual thermistors in a climate chamber. (a) Calibration setup showing thermistors on booms (left), a digital multimeter to read the sensor resistance (top right) and a data acquisition computer (bottom right). (b) Maximum temperature deviations (TRef_devi) with respect to the average of five reference thermometers (TRef_aver) as a function of TRef_aver. Distribution of the residuals of the (c) white and (d) black sensors by individually applying the calibration curves. (e) The uncertainty budget on the radiosonde thermistor calibration, U(Ts_cal), with a coverage factor k = 2. Uncertainty factors including reference temperature deviations U(TRef_devi), stability U(TRef_stab) and calibration U(TRef_cal), radiosonde sensor stability U(Ts_stab) and fitting residual U(Ts_fit_resid) are considered for U(Ts_cal).
Generally, the Steinhart-Hart equation is used for the calibration of NTC thermistors (White, 2017); however, the application of a third-order polynomial equation, i.e. the inclusion of a quadratic term, which is not present in the Steinhart-Hart equation, yields smaller fitting residuals than that of a second-order equation (Yang et al., 2021). In the work of Yang et al. (2021), the maximum value of the residuals was 117 and 13 mK for the second-order polynomial and the third-order polynomial, respectively. Therefore, the Steinhart-Hart equation is modified for the calibration as follows:
where Ts is the sensor temperature obtained based on the sensor resistance Rs and a0, a1, a2 and a3 are the fitting coefficients. The distributions of the fitting residuals of the white and black sensors are shown in Fig. 3c and d, respectively. In total, 696 data points are obtained, collected from 6 calibration points of 116 thermistors of the same colour. No essential difference is observed between the white and black sensors in the distributions of the residuals, implying that the emissivity difference plays a negligible role in the sensor calibration process.
Furthermore, the uncertainty of radiosonde sensors (thermistors) due to calibration U(Ts_cal) at k = 2 is calculated, as shown in Fig. 3e. The contributing uncertainty factors are temperature deviations U(TRef_devi), stability U(TRef_stab) and calibration U(TRef_cal) of the reference PRTs and the temperature stability U(Ts_stab) and fitting residuals U(Ts_fit_resid) of the sensors (thermistors). Consequently, the uncertainty of thermistors due to calibration is about 0.1–0.3 ∘C (k = 2) between 30 and −70 ∘C. The uncertainty due to spatial temperature deviations U(TRef_devi) in the chamber dominates the calibration uncertainty. The deviations are due to the temperature difference between the front door side and the rear fan side of the chamber. One of the practical ways to improve the calibration uncertainty is to find a location with reduced spatial temperature deviations in the climate chamber. More recently, the deviations were reduced by about one quarter of Fig. 3b at −70 ∘C by moving the thermistor set (35 pairs) lower than the rear side fan to avoid the direct wind. The temperature deviations can be affected by the thermal insulation of the door and the aisles for data cables as well as the ventilation by the fan in the chamber.
3.3 Test of temperature effect on resistance reading by radiosonde boards
To properly measure the temperature using the thermistors via Eq. (1), the effect of the temperature of the radiosonde electronics board on the thermistor resistance measurement should be investigated in the same temperature range of the thermistor calibration. Thus, 10 radiosonde prototypes covered with expanded polystyrene foam are installed in the climate chamber with varying temperatures. The radiosonde boards are wired to external reference resistors (Cropico, Model: 008-B) instead of thermistors, as shown in Fig. 4a. The resistance measured by radiosonde boards is collected by a computer via wired communication.
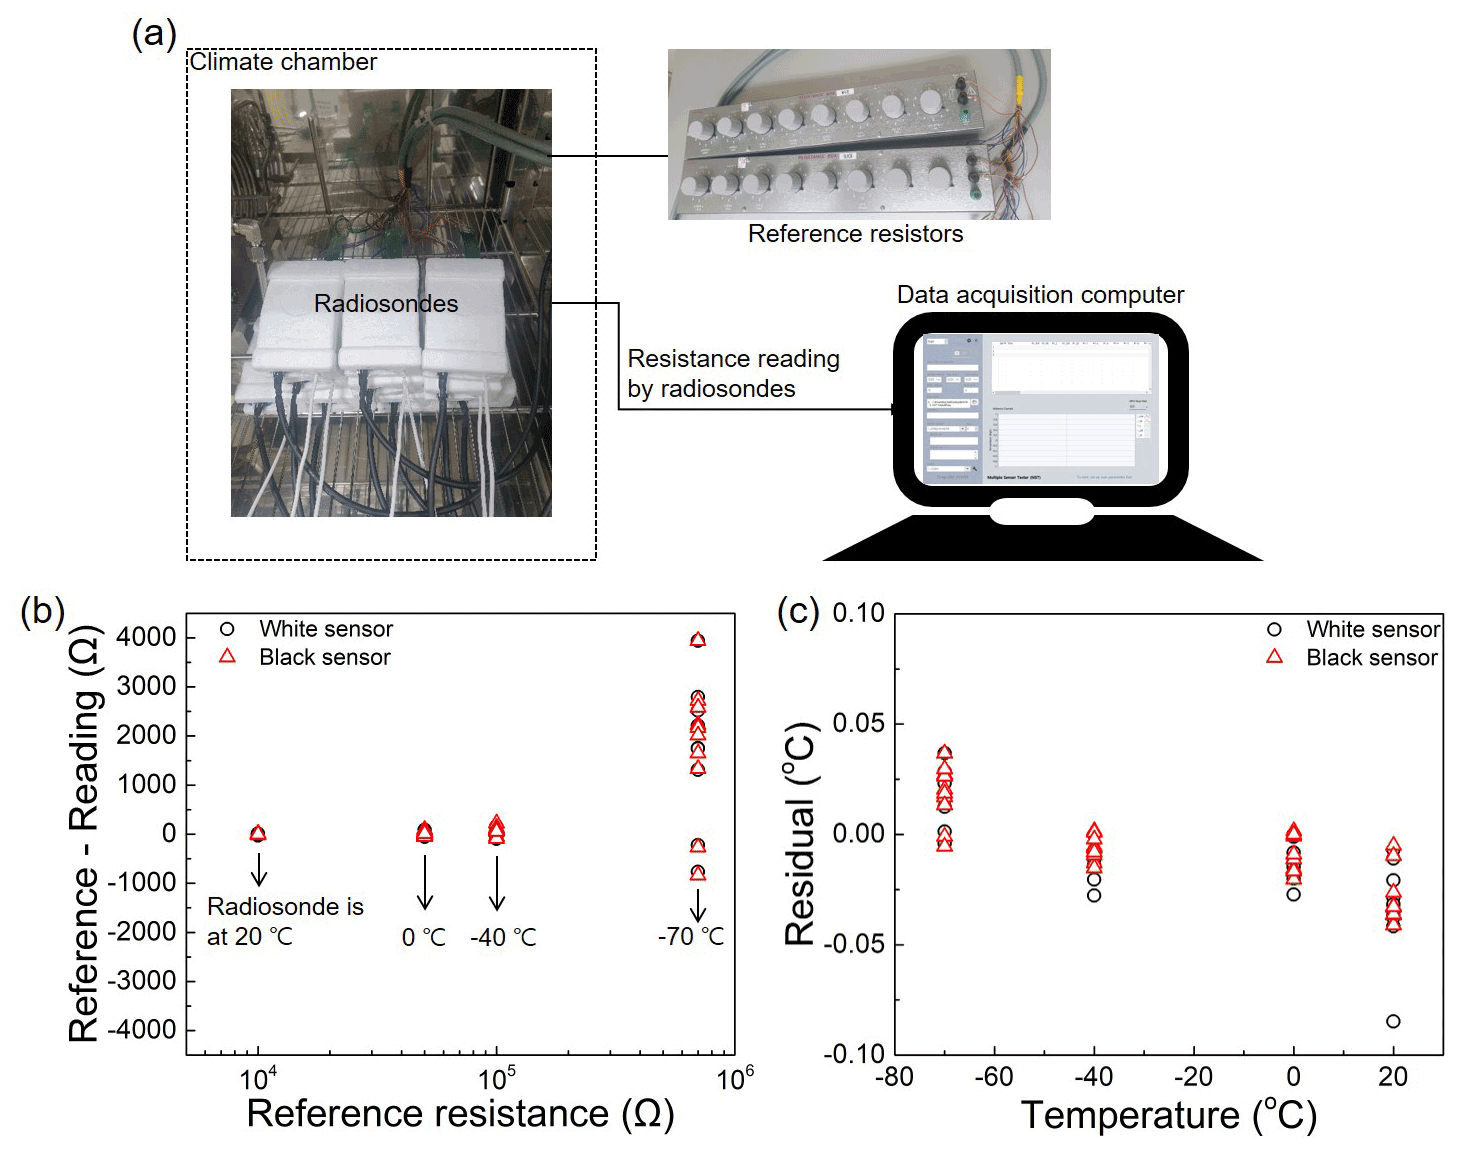
Figure 4Test of the temperature effect on resistance reading by radiosonde boards. (a) Test setup showing the radiosonde boards in a climate chamber (left), reference resistors (top right) and a data acquisition computer (bottom right). (b) Difference between the reference resistance and radiosonde reading as a function of the reference resistance. (c) Residual after conversion of resistance to temperature as a function of temperature.
Figure 4b shows the difference between the reference resistance and radiosonde reading as a function of the reference resistance. The reference resistance is changed according to the environmental temperature of the radiosonde boards, which is varied from −70 to 20 ∘C. For example, a reference resistance of 700 kΩ is chosen to imitate the sensor resistance of −70 ∘C when the temperature of the climate chamber measured by reference PRTs (TRef_aver) is −70 ∘C. Thereafter, both the reference resistance and resistance reading by radiosonde boards are converted into temperatures using a calibration curve based on Eq. (1). The resultant temperature error by radiosonde boards with varying temperature is shown in Fig. 4c. Assuming that the probability distribution is a normal distribution function, the standard deviation (SD) of all data points (0.04 ∘C) is used for standard uncertainty due to the influence of the temperature of radiosonde electronics boards on the resistance (or temperature) measurement.
3.4 Individual radiation test on radiosonde thermistors
The purpose of the calibration of thermistors and the investigation of the temperature effect on radiosonde electronics boards is to assess the accuracy (or uncertainty) of raw temperature measurement before radiation correction. The following step is to investigate the sensitivity of individual thermistors to irradiation because the amount of radiation correction varies for individual radiosondes, presumably related to the production process of the thermistors. This can be attributed to the irregularity in the thermistor glass bead sizes, the black epoxy coating and the sensor connection to the boom via soldering and epoxy. Effective irradiance to thermistors and the cooling by convection can be changed based on the glass bead sizes and the Al and black epoxy coatings. The connection between the sensor leads and the boom may be irregular because the soldering and the coating of epoxy resin were conducted manually. Radiative heating of glass beads, leads, and connection parts between the sensor leads and the boom should be affected by their size as previously reported (de Podesta et al., 2018); however, obtaining radiation correction formulas of radiosondes individually using UAS with varying temperature, pressure, air ventilation speed and irradiance is time-consuming and economically unfavourable. Therefore, a rotational radiation test (RRT) is performed on all thermistors in a vacuum chamber at room temperature (∼ 25 ∘C), and the results are correlated to the UAS experiments to acquire sensor-specific radiation correction formulas that reflect the unit difference. The RRT irradiance at the sensor position is 800 W m−2 with 0.8 % standard deviation for each irradiation. The ventilation and the pressure in the chamber are not measured. Since they depend on the performance of the vacuum pump and the sealing of the chamber lid using an O-ring, there can be slight variations in the ventilation and the pressure.

Figure 5Rotational radiation test (RRT) on radiosonde thermistors individually. (a) RRT setup showing the radiosonde thermistors in a chamber, solar simulator, and vacuum pump (left), a digital multimeter (top right) and a data acquisition computer (bottom right). (b) Temperature measured by a white (TW) and black (TB) sensor with/without light irradiation by the solar simulator. (c) Distribution of the temperature difference between the paired white and black sensors. (d) Distribution of the temperature increase of white sensors by the irradiation. Five pairs of a white and black sensors were selected for radiation correction experiments using an upper air simulator (UAS), as indicated by black arrows in (c) and (d).
Figure 5a shows an individual radiation test setup comprising a solar simulator, vacuum pump, vacuum chamber, digital multimeter and computer. A pair of dual thermistors is illuminated through a window in the lid of the vacuum chamber. The diameter (D) of the beam spot on the sensor is 45 mm and the distance between the sensor bead and the beam boundary is 25 mm. The rotation of 12 pairs of sensors and the light irradiation of the solar simulator are automatically controlled using a computer program. When a pair of dual thermistors arrives and stops beneath the window during rotation, the window is screened by a shutter to block the light irradiation. At this time, the irradiance is measured using a calibrated pyranometer on the shutter. Then, the shutter is opened and closed for 180 s each and this process is repeated 3 times for the illumination on each pair of thermistors. The temperatures of the white (TW) and black (TB) sensors are recorded (Fig. 5b), and 107 pairs of dual thermistors are tested in total. The temperature rise by the irradiation is determined by the difference of the average temperature for the last 30 s (30 data points) before the shutter is opened and closed. The mean temperature rise of the three repeated measurements is assigned as the RRT value for each pair of thermistors. The average ratio of the radiative heating of aluminium-coated and black sensors is 1 : 2.4 in the RRT experiment. Figure 5c and d show the temperature difference distributions between a pair of thermistors (TB_on−TW_on) and the temperature increase of the white sensor (TW_on−TW_off), respectively. The subscripts on and off indicate when the light irradiation is turned on and off, respectively. These values are used as parameters for the sensor-specific radiation correction formulas obtained by UAS experiments. Although the irradiance is constant for each sensor, the cooling efficiency of the sensors may vary depending on the bead size of thermistors, air flow, and the pressure. Five representative pairs of thermistors are selected for the radiation correction experiments using UAS, as indicated by black arrows in Fig. 5c and d.
4.1 Radiation measurement by DTR
The DTR is installed upside down in the test chamber of the UAS with the thermistors and the sensor boom in parallel with the air flow but perpendicular to the irradiation. Figure 6a–e show the UAS measurements for five representative temperature differences (TB_on−TW_on) between a pair of dual thermistors selected from the RRT in Fig. 5c. Previous studies reported that UAS has the capability of simultaneously varying environmental parameters for the radiation correction of commercial radiosondes (Lee et al., 2020, 2022). In Fig. 6, air pressure (P) is varied from 5 to 500 hPa and temperature (TW_off) is varied from −68 to 20 ∘C with a fixed irradiance (S0 = 960 W m−2) and ventilation speed (v0 = 5 m s−1). As expected, the level of (TB_on−TW_on)RRT is positively correlated with the degree of (TB_on−TW_on)UAS, exhibiting a gradual decrease of (TB_on−TW_on)UAS with decreasing (TB_on−TW_on)RRT (Fig. 6a–e).
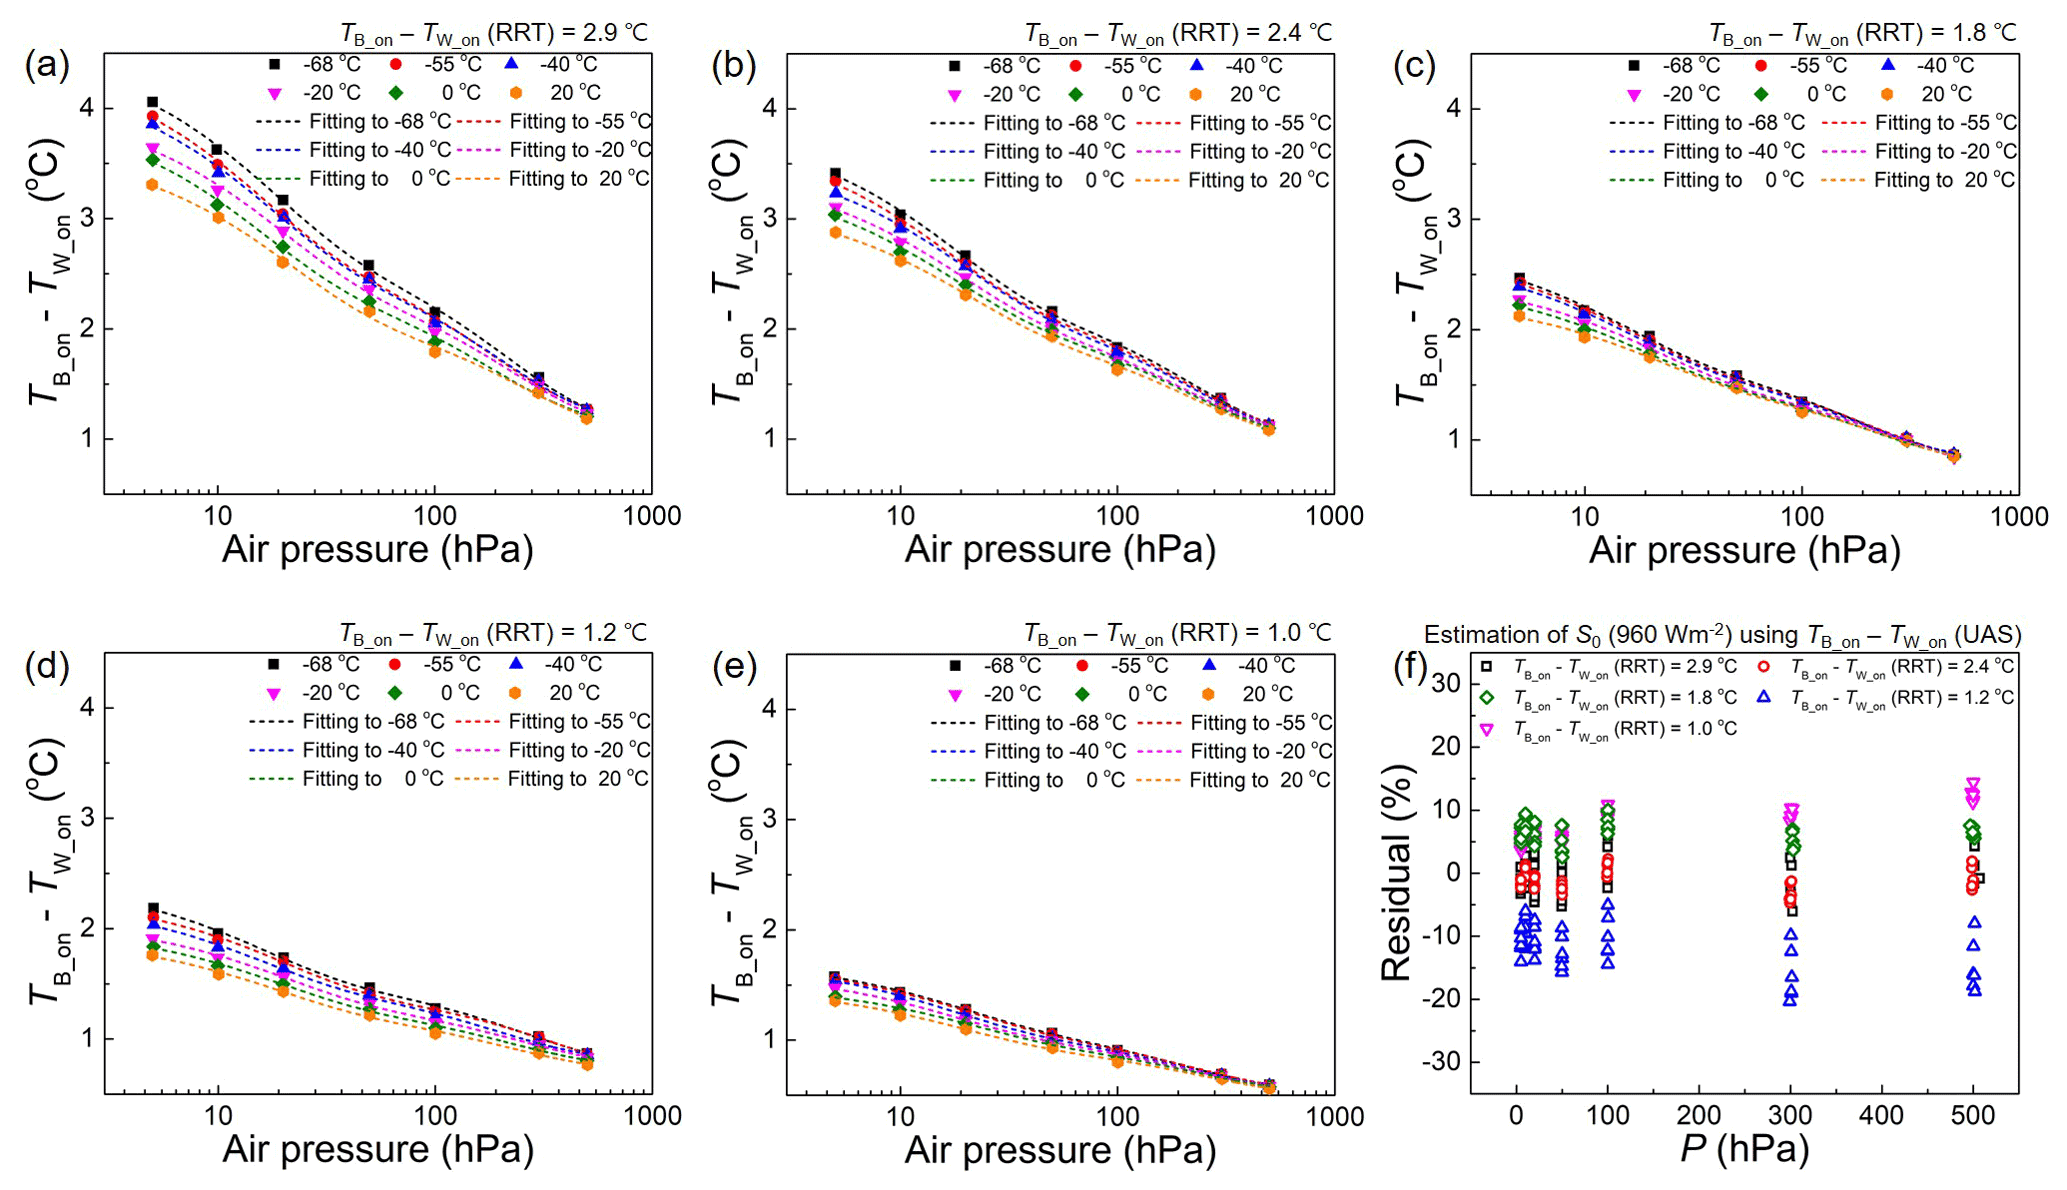
Figure 6Temperature differences between paired white and black sensors (TB_on−TW_on) investigated using UAS. (a–e) (TB_on−TW_on) of the five paired radiosonde thermistors as a function of air pressure with varying temperature. (f) Residual irradiance calculated on the basis of (TB_on−TW_on) obtained in UAS and the rotational radiation test.
To parameterise the radiation measurement formula, (TB_on−TW_on) of the UAS is fitted with empirical equations as follows:
where T0(TW_on), A0(TW_on), P0(TW_on), A1(TW_on) and P1(TW_on) are the fitting coefficients being functions of TW_on and units of ∘C, ∘C, hPa, ∘C and hPa, respectively. The dashed lines in Fig. 6a–e represent the fittings.
Interestingly, the level of (TB_on−TW_on) gradually increases as the temperature decreases especially for low pressures. A similar phenomenon was previously observed in a chamber with no apparent air ventilation (Lee et al., 2018a). The observed effect of temperature on (TB_on−TW_on) is because the convective heat transfer between the sensor and air is reduced at cold temperatures with positive correlations between the thermal conductivity and the viscosity of air and the air temperature (Lee et al., 2022). To incorporate the effect of temperature (TW_on) in Eq. (2), its coefficients of T0(TW_on), A0(TW_on), P0(TW_on), A1(TW_on) and P1(TW_on) are fitted with linear functions of TW_on as follows:
where a0, a1, b0, b1, c0, c1, d0, d1, e0 and e1 are the fitting coefficients. These coefficients are collected from five pairs of thermistors and each coefficient is again functionalised with (TB_on−TW_on)RRT to incorporate the individuality of thermistors observed in RRT into Eq. (2) as follows:
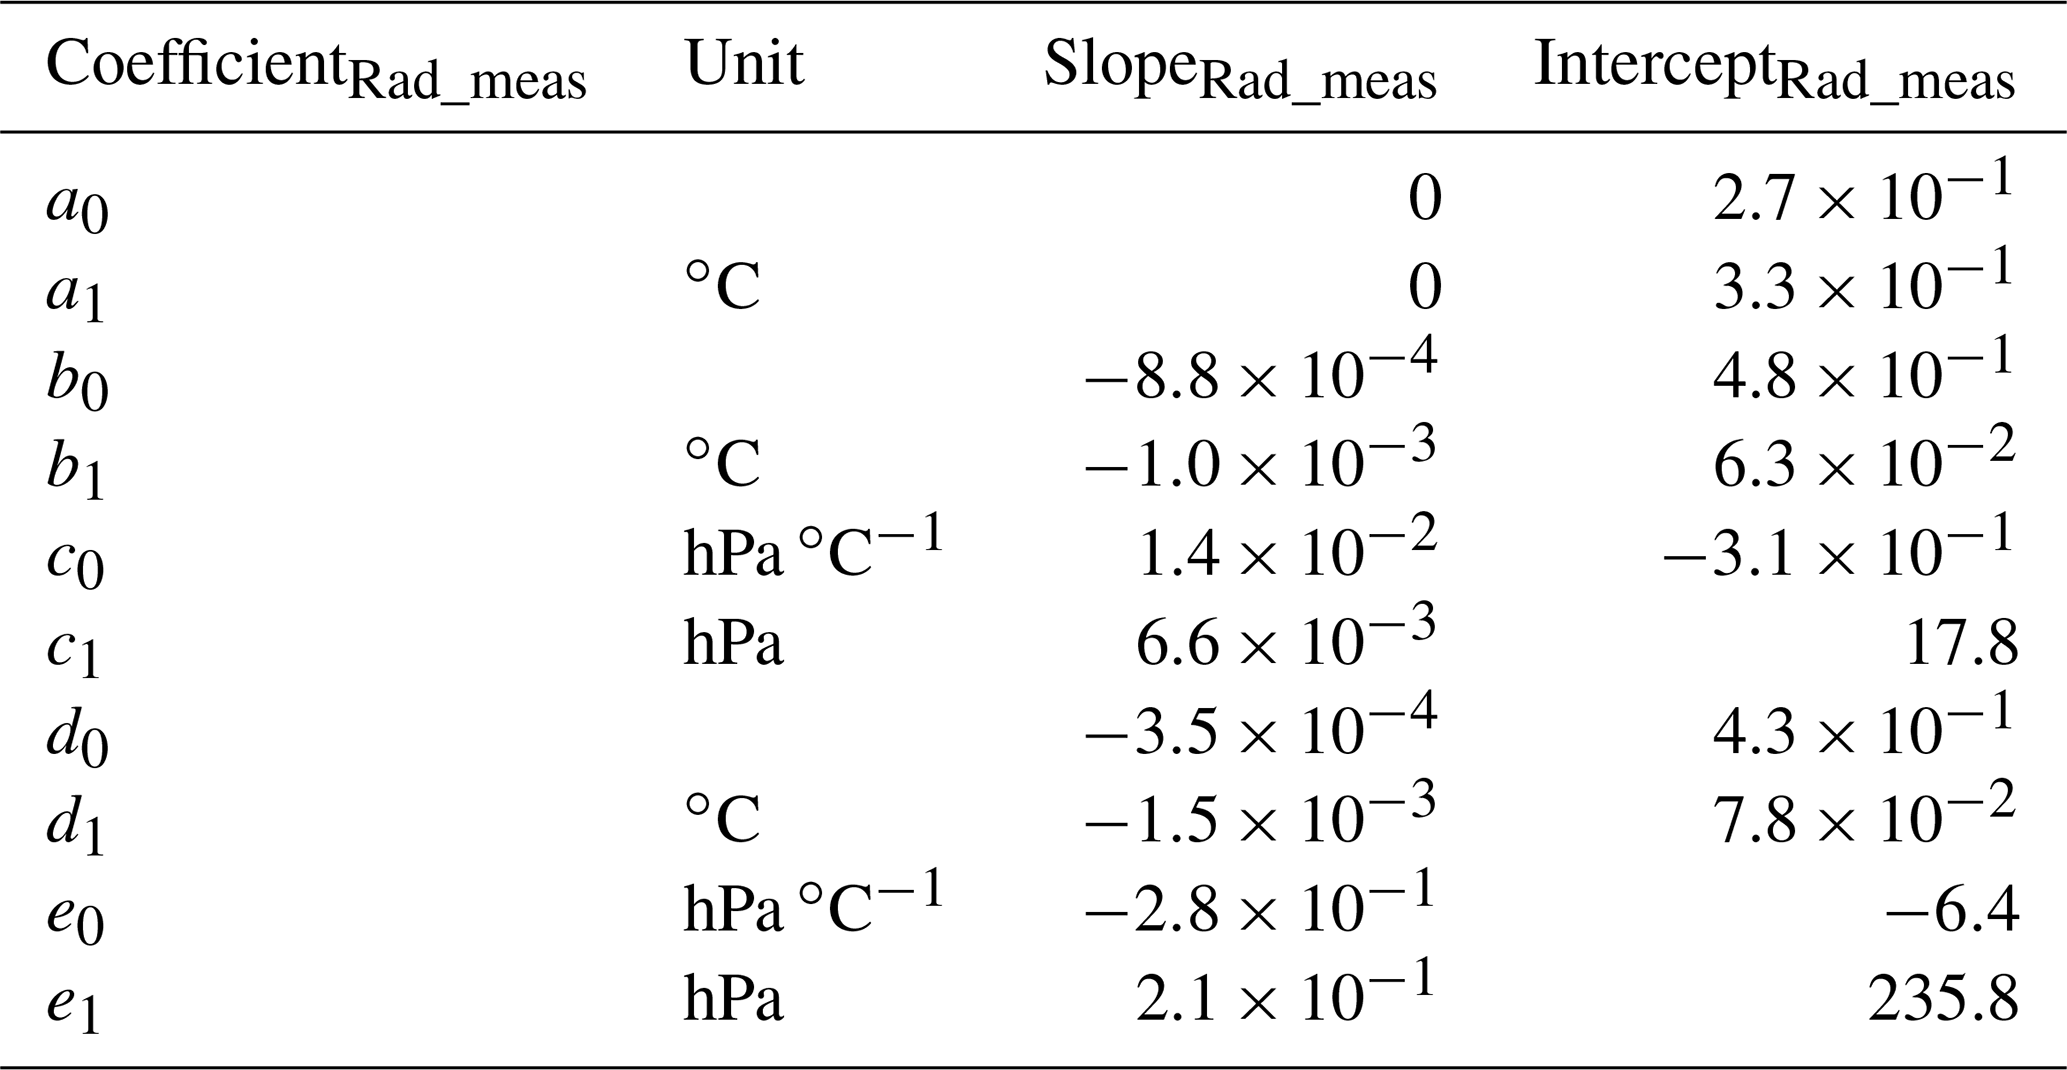
where CoefficientRad_meas represents a0, a1, b0, b1, c0, c1, d0, d1, e0 and e1 from the five pairs of dual thermistors, and SlopeRad_meas and InterceptRad_meas are the corresponding fitting coefficients. Table 1 presents the SlopeRad_meas and InterceptRad_measvalues. The applied concept of transferring the individual radiation sensitivities from the RRT based on the five chosen units to Eq. (2) does not necessarily rely on “realistic” irradiation and ventilation conditions in the RRT setup, but rather on the consistence of the existing conditions in the RRT over the radiation tests of all other sondes. The representativeness of the RRT results of the five thermistor pairs as part of all thermistors is based on the proportionality with the UAS results.
Table 1SlopeRad_meas and InterceptRad_meas of a0, a1, b0, b1, c0, c1, d0, d1, e0 and e1.
During soundings, the irradiance (S) is unknown but can be found using (TB−TW) of DTR. Hence, Eq. (2) is employed to measure the in situ irradiance using (TB_raw−TW_raw), where TB_raw and TW_raw are raw temperatures of the black and white sensors, respectively, based on the fact that the temperature difference between two sensors is linearly proportional to S (Lee et al., 2018a, b):
where the result of the individual radiation test (TB_on−TW_on)RRT is incorporated using Eqs. (2)–(8). Consequently, Fig. 6f shows the fitting residual. Although the temperature difference of the five pairs of thermistors is different by nearly a factor of 3, as shown in Fig. 6a–e, the residuals are within ±20 % due to the parameterisation of the RRT value into Eq. (9).
In Eq. (9), the air ventilation speed (v) imitating the ascent speed of radiosondes is fixed at v0 = 5 m s−1 and thus the effect of air ventilation cannot be identified in Fig. 6f. As determined by a separate pair of thermistors, (TB_on−TW_on)UAS decreases by 0.08 ∘C on average when v increases by 1 m s−1 due to the convective cooling in the range of v = 4–6.5 m s−1 and P = 7–100 hPa (data not shown). Thus, Eq. (9) can be revised to include the effect of air ventilation speed as follows:
The standard deviation of the residual for a pair of thermistors is 4.1 % with Eq. (9), while it is reduced to 3.4 % with Eq. (10) when the air ventilation is actually changed (4–6.5 m s−1). The absolute value of the sensitivity coefficient (−0.08 ∘C (m s−1)−1) against the ventilation speed will be significantly bigger when v is lower than 4 m s−1 while it will be a bit smaller when P is higher than 100 hPa. Note that Eq. (10) is used for the intercomparison sounding test, as described later.
4.2 Radiation correction by DTR
Figure 7a–e shows the (TW_on−TW_off) measured for obtaining the radiation correction values of the white sensors selected from the RRT in Fig. 5d. The experimental conditions of P, TW_off, S0 and v0 are identical to that of Fig. 6. Since the (TW_on−TW_off)RRT shows a positive correlation with the (TW_on−TW_off)UAS, the (TW_on−TW_off)RRT can be parameterised into a radiation correction formula based on (TW_on−TW_off)UAS to neutralise the difference among units.
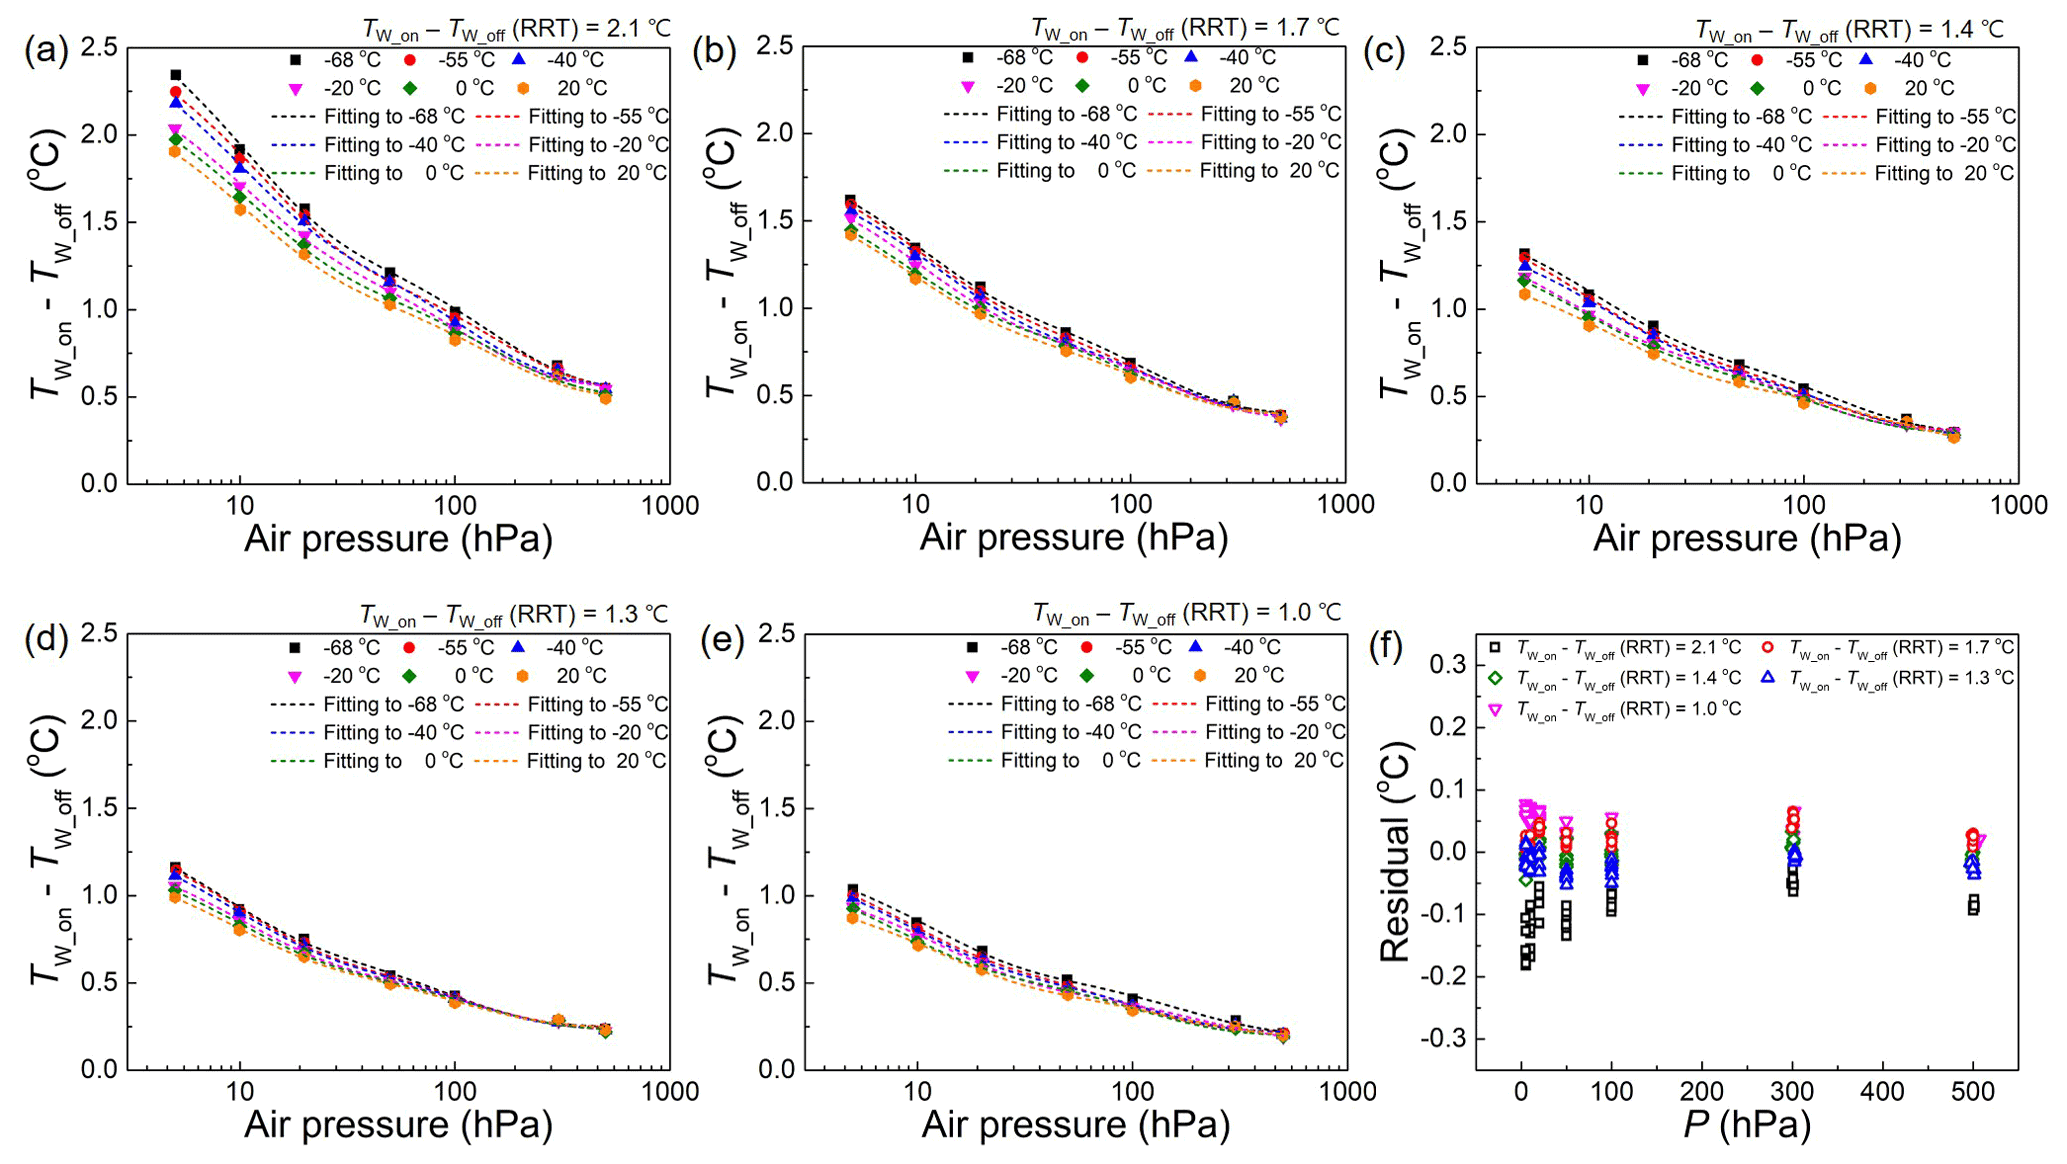
Figure 7Radiation correction value of white sensors (TW_on−TW_off) investigated using UAS. (a–e) (TW_on−TW_off) of the five radiosonde white sensors as a function of air pressure with varying temperature. (f) Residual of correction value calculated on the basis of (TW_on−TW_off) in UAS and the rotational radiation test.
To obtain the radiation correction formula of the DTR white sensors, the values of (TW_on−TW_off)UAS are fitted with empirical functions (dashed lines in Fig. 7) as follows:
where T1(TW_on), A2(TW_on), P2(TW_on), A3(TW_on) and P3(TW_on) are the fitting coefficients as a function of TW_on having units of ∘C, ∘C, hPa, ∘C and hPa, respectively.
The (TW_on−TW_off)UAS is dependent on the temperature. The (TW_on−TW_off)UAS at −68 ∘C is 118.9 ± 3.5 % (mean ± SD of 5 units) of that at 20 ∘C, when P = 5 hPa. In the previous study, the ratio for RS41 investigated by the same manner was 119 % (Lee et al., 2022). The thermal conductivity and the viscosity of air decrease as the air temperature decreases while the density of air is inversely correlated with the temperature. The net effect of these air properties is that the heat transfer from the sensor to air is positively correlated with the air temperature (Lee et al., 2022). The effect of long-wave radiation from the sensor is minor compared with that of convective heat transfer.
The effect of temperature (TW_on) in Eq. (11) is incorporated into the coefficients of T1(TW_on), A2(TW_on), P2(TW_on), A3(TW_on) and P3(TW_on) by fitting them with empirical linear functions of TW_on as follows:
where f0, f1, g0, g1, h0, h1, i0, i1, j0 and j1 are the fitting coefficients. These coefficients are obtained from five pairs of thermistors selected from the RRT and then each coefficient is changed into a function of (TW_on−TW_off)RRT to incorporate the RRT result into Eq. (11):
where CoefficientRad_cor represents f0, f1, g0, g1, h0, h1, i0, i1, j0 and j1, and SlopeRad_cor and InterceptRad_cor represent the corresponding fitting coefficients. The SlopeRad_cor and the InterceptRad_corvalues are presented in Table 2.
Table 2SlopeRad_cor and InterceptRad_cor of f0, f1, g0, g1, h0, h1, i0, i1, j0 and j1.

Although the irradiance (S0) is fixed as 960 W m−2 herein, (TW_on−TW_off)UAS is linearly proportional to S, as experimentally and theoretically studied in previous studies (McMillin et al., 1992; Lee et al., 2018b). To include the irradiance (S) obtained using Eq. (10) into the radiation correction formula, Eq. (11) is revised as follows:
where TW_raw and TW_cor are the raw temperature and radiation-corrected temperature of the white sensor, respectively. The result of the individual radiation test (TW_on−TW_off)RRT is incorporated using Eqs. (11)–(17).
The fitting residual obtained using Eq. (18) is shown in Fig. 7f. Although the radiation correction values of the 5 pairs of thermistors differ by more than a factor of 2, as shown in Fig. 5a–e, the residuals are within ±0.2 ∘C due to the RRT results considered for Eq. (18).
The effect of air ventilation speed is studied by a separate pair of thermistors and consequently, the (TW_on−TW_off)UAS decreases by 0.1 ∘C on average when v increases by 1 m s−1 in the range of v = 4–6.5 m s−1 and P = 7–100 hPa (data not shown). Thus, Eq. (18) can be slightly modified to incorporate the effect of v as follows:
If the air ventilation is actually changed (4–6.5 m s−1), the standard deviation of the residual for a pair of thermistors is 0.10 ∘C by Eq. (18) while it reduces to 0.04 ∘C with Eq. (19). The absolute value of the sensitivity coefficient (−0.1 ∘C (m s−1)−1) will significantly grow as v is lowered below 4 m s−1 whereas it will become smaller when P is higher than 100 hPa. It should be noted that Eq. (19) is applied to the DTR radiation correction in the intercomparison sounding test.
The radiation measurement and correction formulas of the DTR obtained via laboratory characterisations were applied to the sounding test performed during July 2021 in Jeju Island, South Korea. One, two, or three DTRs were tested in parallel with a RS41 in a single flight. The number of comparison (N) was N = 12 at daytime from 7 soundings. The daytime sounding was performed from 11:00 to 17:00 local time. The sky was normally cloudy. Figure 8a shows an example of the temperature difference (TB_raw−TW_raw) between the two sensors during sounding in the daytime. Note that (TB_raw−TW_raw) in the sounding data corresponds to the (TB_on−TW_on)UAS of the UAS experiment. Figure 8b displays the irradiance measured by the DTR based on the temperature difference between the dual thermistors and environmental parameters, including TW_raw, P and v. The irradiance measured by the DTR is the net effective irradiance to or from the thermistors including the components of direct solar irradiation, its reflection and scattering, the long-wave radiation from the earth, and the long-wave radiation from the thermistors; however, these components cannot be distinguished through DTR measurements. The radiation correction formula of the DTR is obtained based on the portion of the long-wave and the short-wave radiation from the solar simulator used as a radiation source in the UAS experiments. The emissivity and absorptivity are dependent on the wavelength. In this respect, the radiative heating of the DTR in soundings can be affected by the actual ratio of the long-wave and the short-wave radiation. For aluminium coating, the reflectance was 0.8–0.9 below 1000 nm and 0.9 above 1000 nm in wavelength. This means that the influence of the ratio between the long-wave and short-wave radiation would be a few percent of the radiative heating of the DTR even when the portion below 1000 nm is drastically different between the laboratory experiments and soundings. Then, using the effective irradiance (S), the radiation correction value (TW_raw−TW_cor) of the white sensor is obtained using Eq. (19), as shown in Fig. 8c. The correction value of the white sensor tends to gradually increase from the ground to the stratosphere with some fluctuations in the troposphere due to clouds.
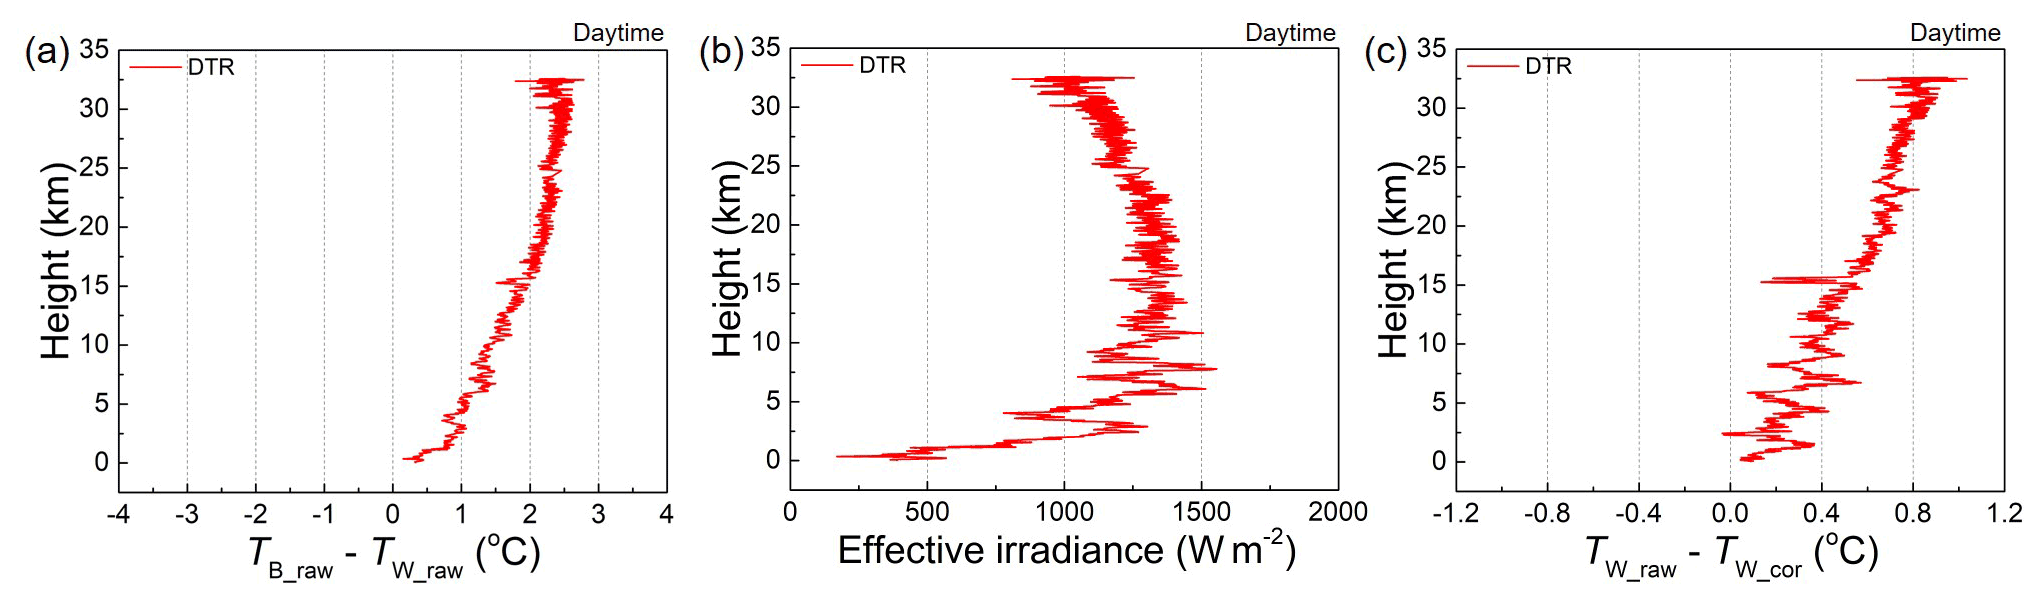
Figure 8Sounding test of dual thermistor radiosondes. (a) Raw temperature difference between the white and black sensors (TB_raw−TW_raw), (b) effective irradiance based on (TB_raw−TW_raw) calculated by Eq. (10) and (c) radiation correction value of the white sensor in the daytime calculated by Eq. (19).
6.1 Uncertainty budget on radiation measurement by DTR
According to the radiation measurement formula by the DTR (Eq. 10), the factors for the uncertainty of radiation measurement U(S) are TW_on, P, v, S0 and fitting residuals in Fig. 6f. These factors contribute to U(S) as follows:
Here, U(parameter) represents the expanded uncertainty of each parameter at k = 2, and the partial differential terms represent the sensitivity coefficients. The sensitivity coefficient of the uncertainty due to the fitting error U(Fitting) is because it is provided as a percentage in Fig. 6f. Then, U(S) is obtained by combining the contributions from these factors based on the uncertainty propagation law:
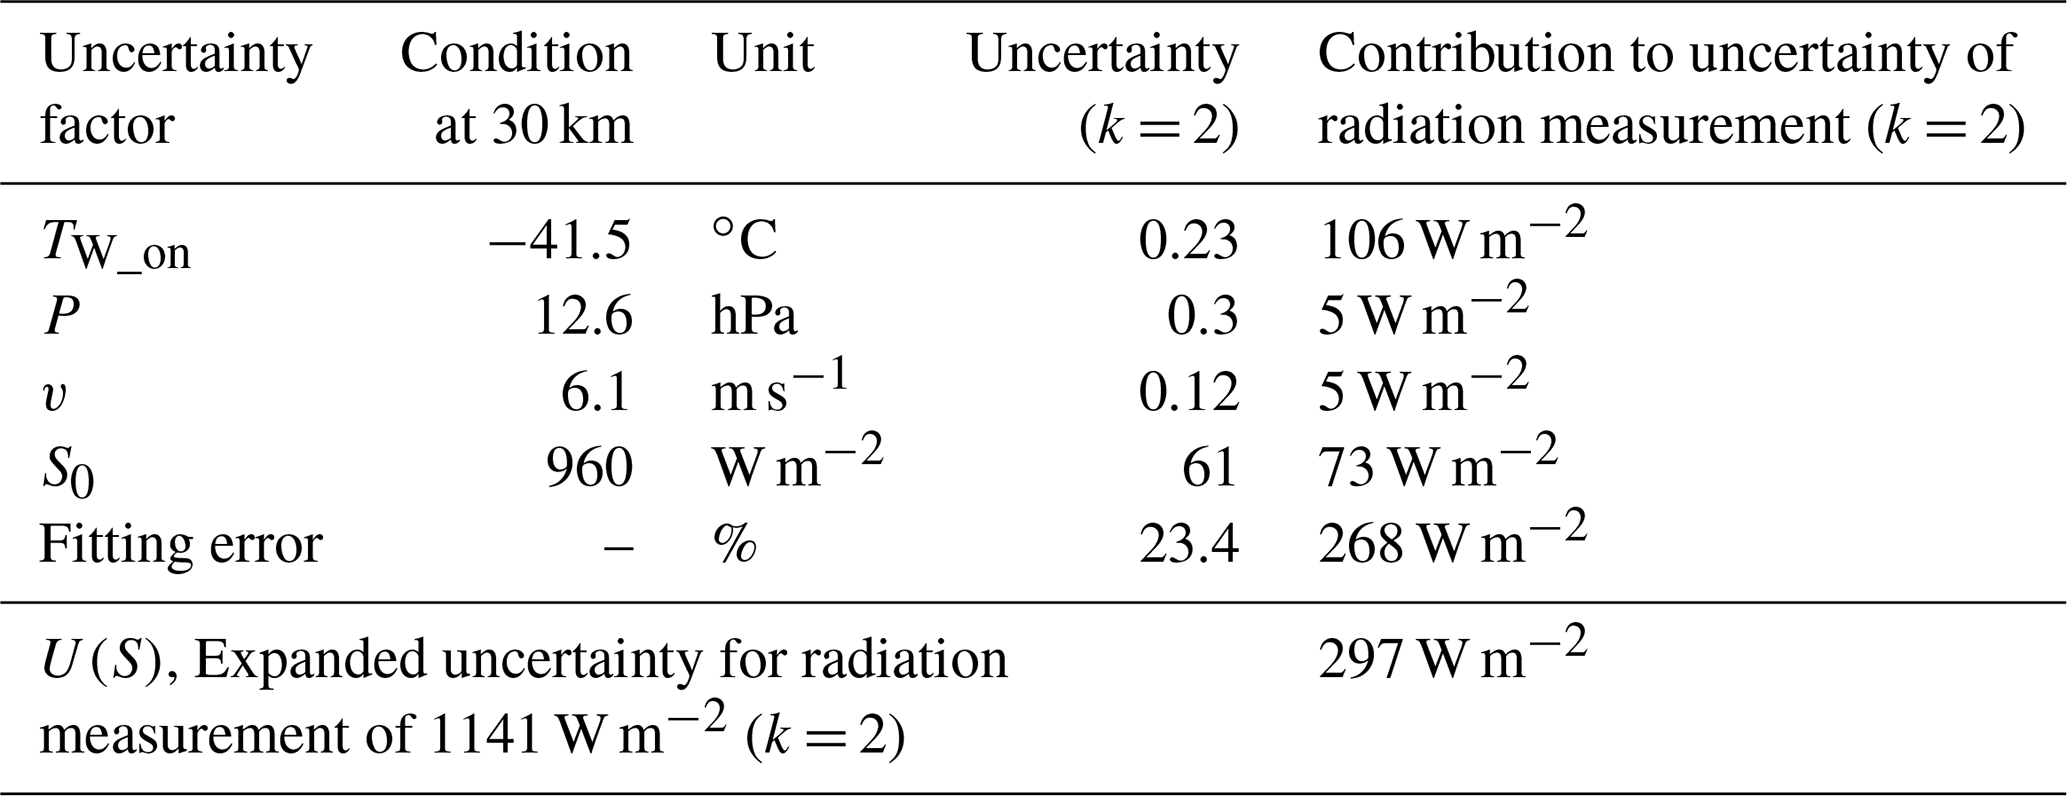
Figure 9a shows the average of the effective irradiance measured by DTR with the expanded uncertainty (k = 2) calculated using Eq. (25) in daytime. Radiation measurements by DTR from N = 12 are averaged in daytime. Examples of the uncertainty budget for the radiation measurement by the DTR at an altitude of 30 km are summarised in Table 3.
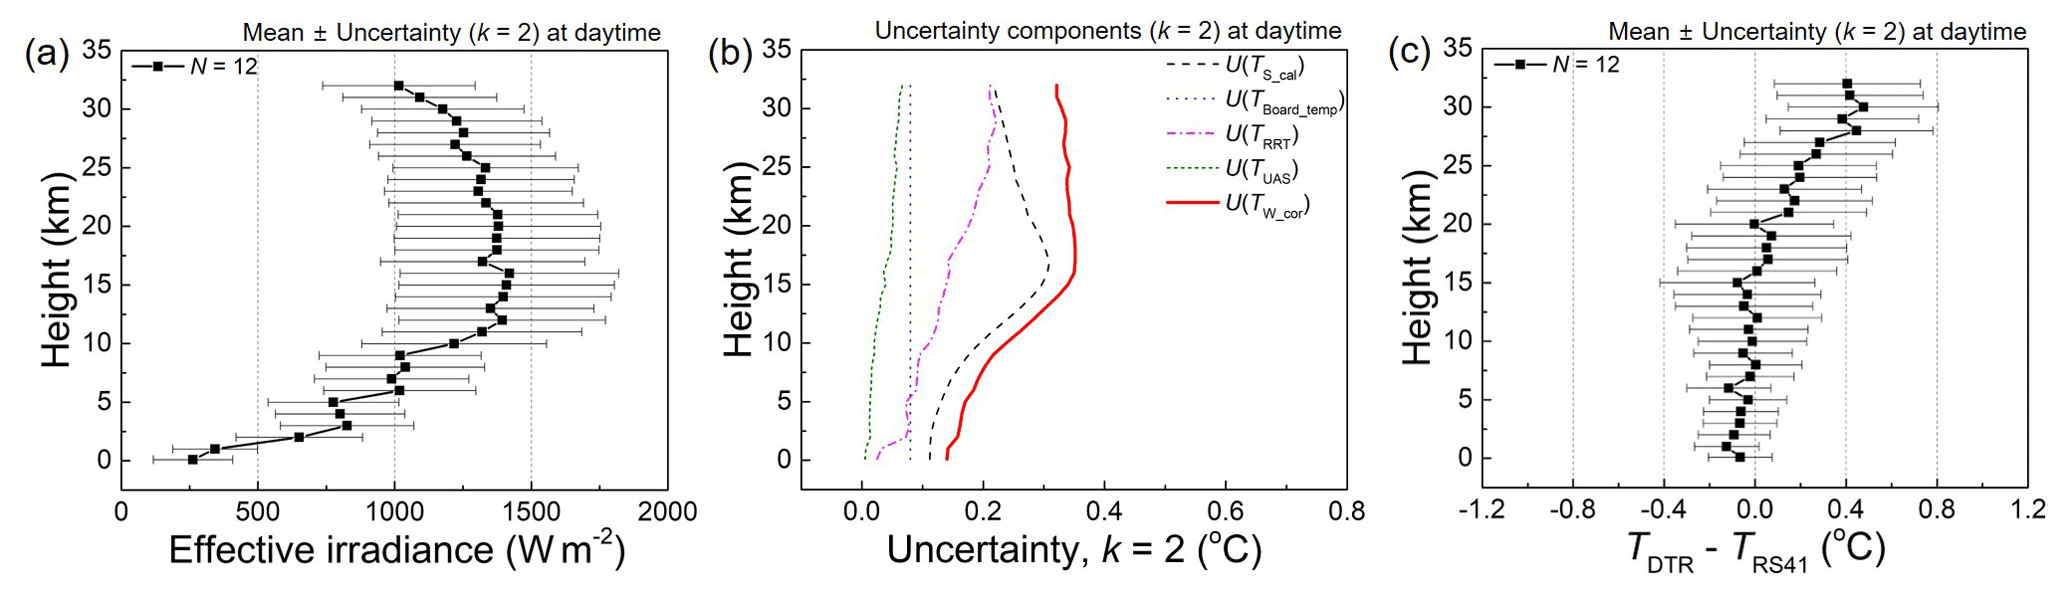
Figure 9Uncertainty analysis on the DTR and intercomparison with Vaisala RS41. (a) Daytime effective irradiance measured by DTR with uncertainty (k = 2). (b) Uncertainty factors contributing to the uncertainty of the corrected temperature U(TW_cor) of DTR in daytime. (c) Temperature difference between DTR and RS41 with DTR uncertainty (k = 2) at daytime.
Table 3Daytime uncertainty budget on radiation measurement of S = 1141 W m−2 by DTR at an altitude of 30 km.
6.2 Uncertainty of radiation correction by DTR
The radiation-corrected temperature (TW_cor) of DTR is obtained by subtracting the radiation correction value calculated using Eq. (19) from the raw temperature (TW_raw) of the white sensor:
Then, the uncertainty of the corrected temperature U(TW_cor) is calculated as follows:
where U(parameter) is the expanded uncertainty (k = 2). U(TW_raw)2 is the uncertainty of the raw temperature that is related to the uncertainty due to the calibration U(TS_cal)2 of thermistors in the climate chamber (Fig. 3) and the uncertainty due to the temperature effect on the radiosonde board U(TBoard_temp)2 (Fig. 4). is the uncertainty of the radiation correction value that is obtained using Eq. (19), comprising uncertainty factors TW_on, P, v and S0 and fitting residuals. The fitting residuals include the uncertainty due to RRT U(TRRT)2 (Fig. 7). Consequently, the expanded uncertainty of the corrected temperature of the DTR is as follows:
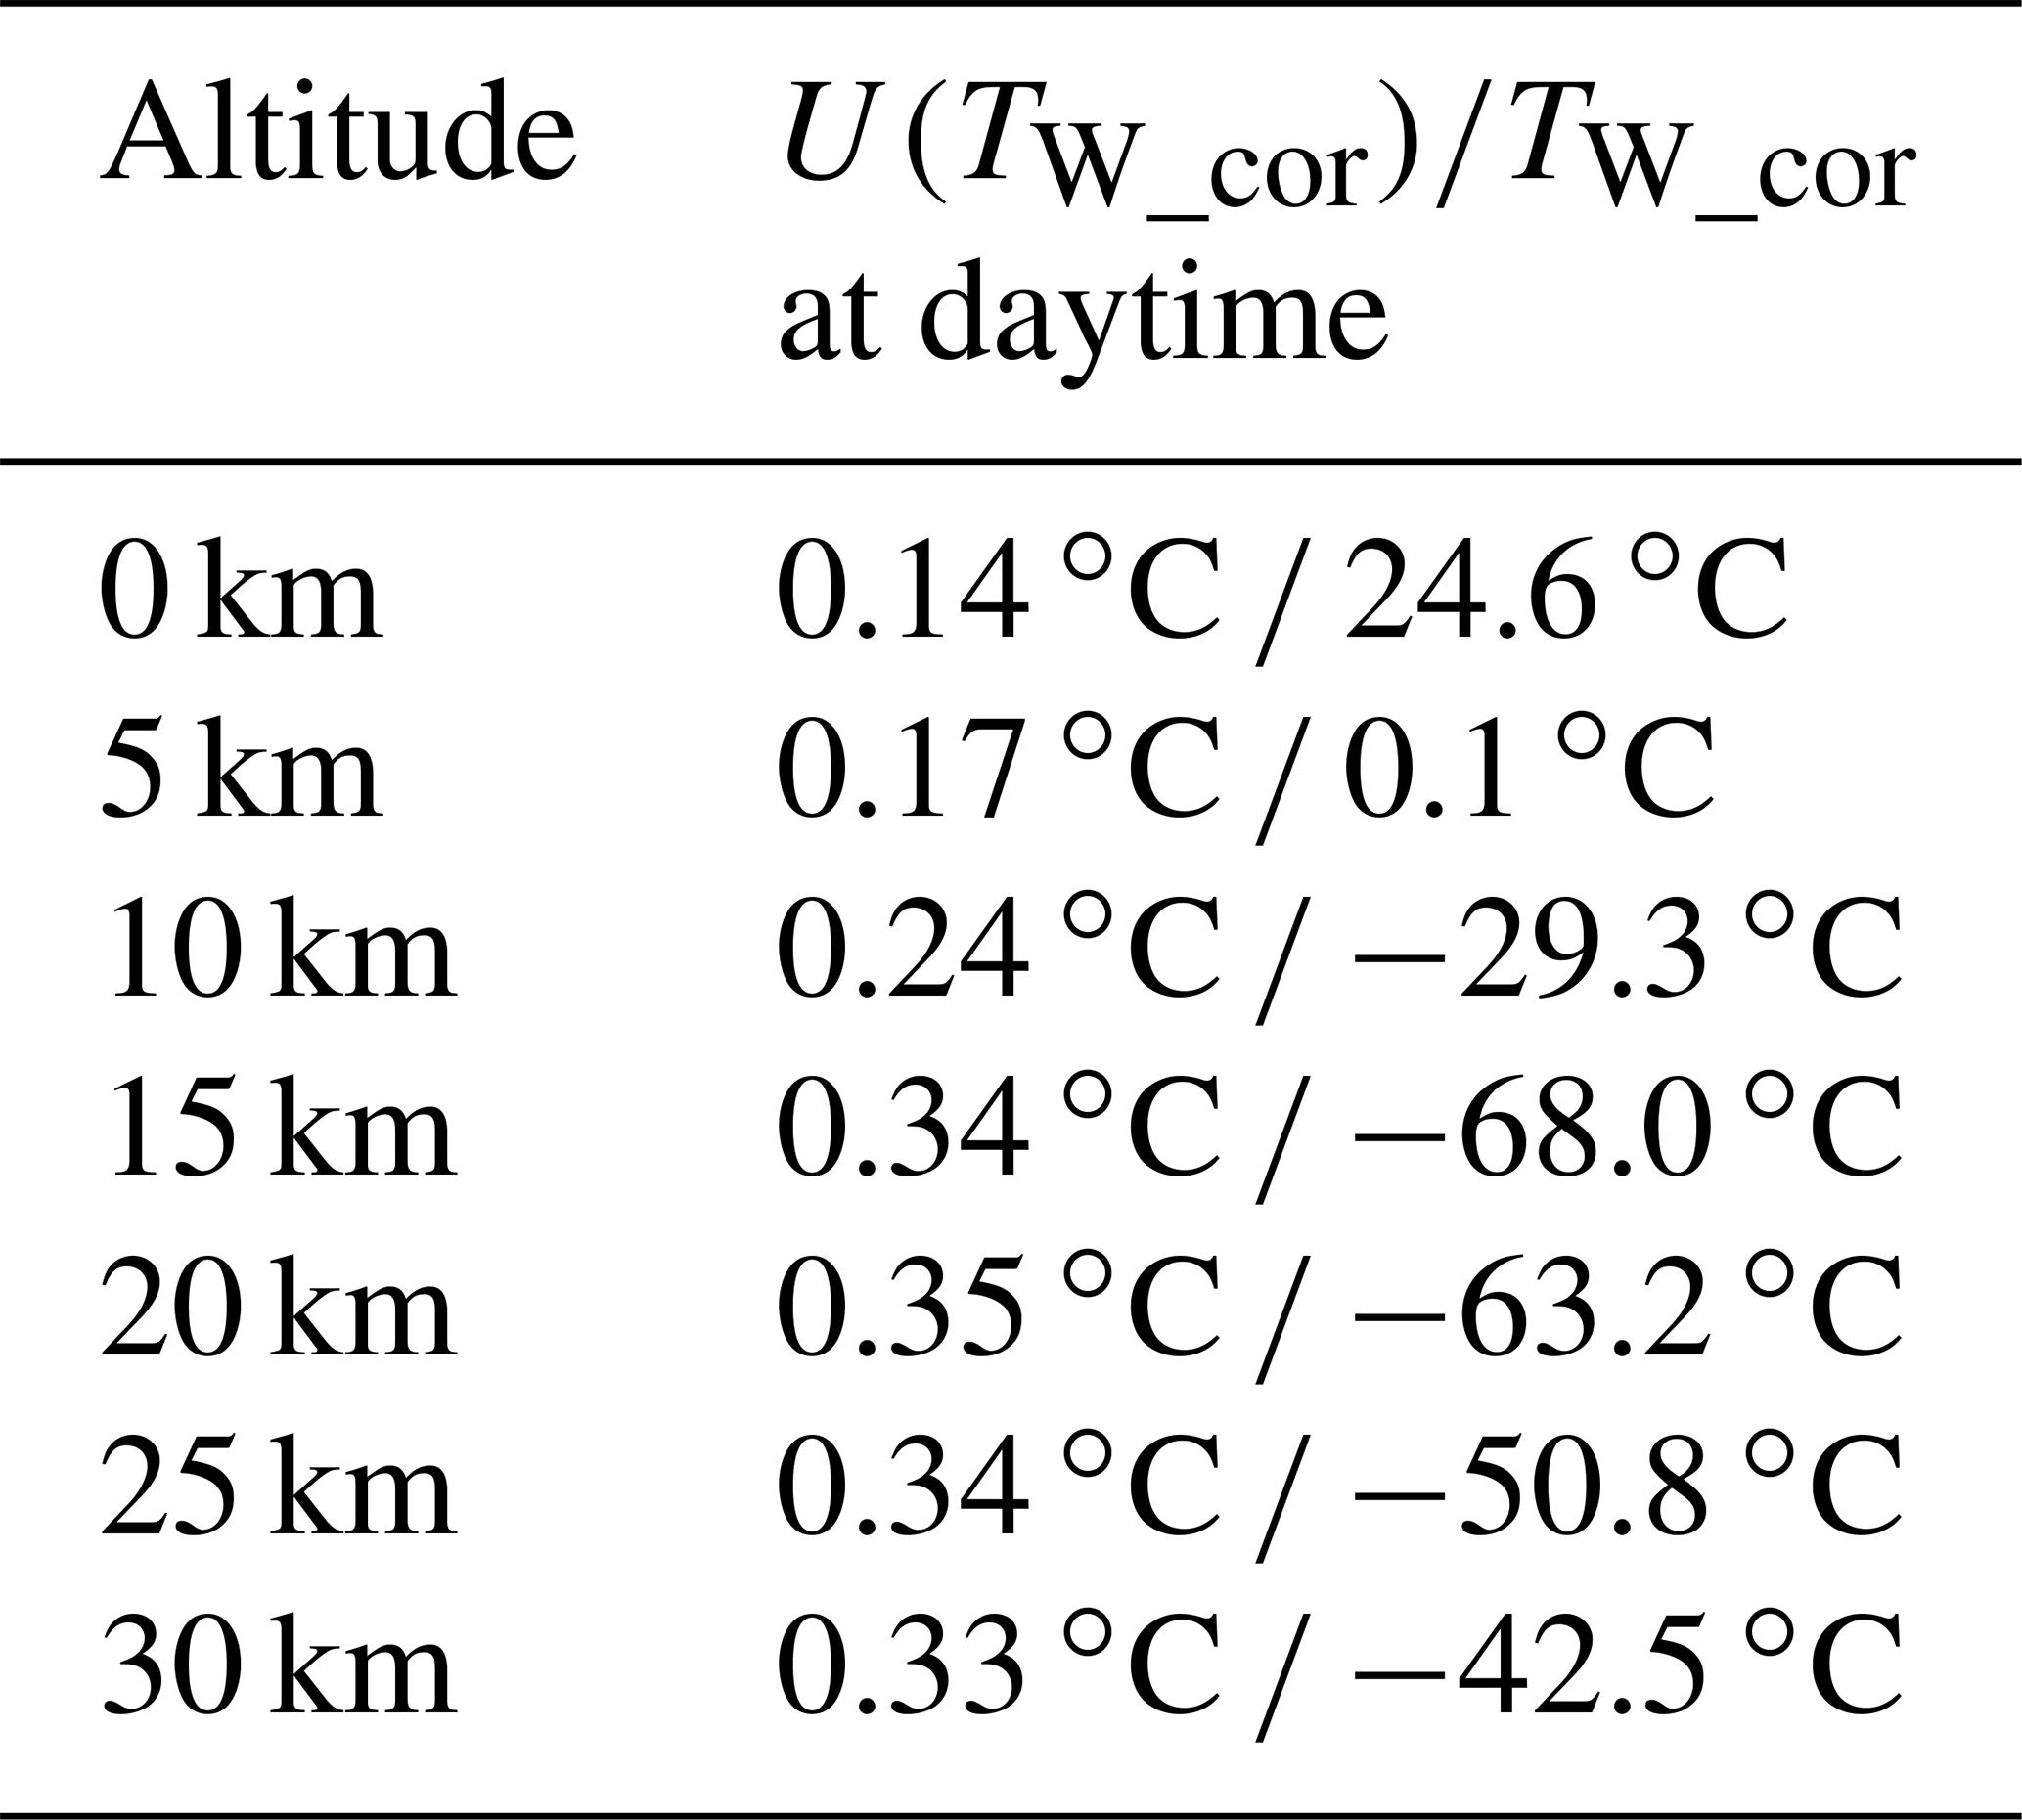
Figure 9b shows U(TW_cor) and its uncertainty components in daytime. In daytime the DTR uncertainty gradually increases up to about 0.35 ∘C at the tropopause and is maintained in the stratosphere (0.33 ∘C at 30 km). An example of the uncertainty budget on the radiation-corrected temperature of the DTR (TW_cor) at an altitude of 30 km is summarised in Table 4.
Table 4Uncertainty budget on radiation-corrected temperature by DTR in daytime at an altitude of 30 km.

The altitude-dependent U(TW_cor) of DTR (k = 2) in daytime is summarised in Table 5. The uncertainty at the tropopause (∼ 15 km) is higher than other regions mainly because the calibration uncertainty of the thermistors increases as the temperature is lowered (Fig. 3e). This means that a reduction of the calibration uncertainty of a massive amount of thermistors is needed to improve the uncertainty of radiation-corrected temperature of the DTR.
6.3 Intercomparison of DTR with Vaisala RS41
The radiation-corrected temperature of DTR (TW_cor = TDTR) is compared to that of a commercial radiosonde (Vaisala, RS41) via parallel sounding. Figure 9c displays the difference between the DTR and RS41 temperatures (TDTR−TRS41) with the DTR uncertainty (k = 2) as error bars during the daytime. Generally, the two temperatures are within the DTR uncertainty during daytime. The manufacturer specifies that the uncertainty of RS41 is 0.3 ∘C in altitudes of 0–16 km and 0.4 ∘C above 16 km (Vaisala, 2022). Then, the combined uncertainty of the RS41 (0.4 ∘C) and the DTR (0.33–0.35 ∘C) is 0.52–0.53 ∘C (k = 2) at 16 km and higher. Thus, the observed differences between the RS41 and the DTR are within their combined uncertainty in daytime. Nevertheless, the radiation-corrected temperature of DTR is about 0.4 ∘C higher than that of RS41 around 30 km in daytime. A similar trend is observed in the radiation correction of the RS41 radiosonde by the GRUAN using the SISTER setup (von Rohden et al., 2022). The radiation-corrected temperature of the RS41 obtained by the GRUAN is 0.35 ∘C warmer than that provided by Vaisala at 35 km although the difference in temperature between the GRUAN and Vaisala is within their combined uncertainty.
Recently, we have obtained a radiation correction formula of RS41 under a well-defined irradiance in the UAS (Lee et al., 2022); however, the correction formula cannot be applied to RS41 because the irradiance and its uncertainty in soundings are unknown. In this respect, the GRUAN uses a simulated irradiance calculated by the average of clear and cloudy sky cases for the radiation correction of RS41 (von Rohden et al., 2022). The maximum uncertainty of RS41 by the GRUAN is about 0.3 ∘C at k = 2, which is larger than our previous work on RS41 (0.17 ∘C at k = 2). This is because the irradiance in our work is assumed to be 1360 W m−2 in the stratosphere with a small uncertainty obtained by the laboratory experiments corresponding to the irradiance. Therefore, one of the prerequisites for the uncertainty evaluation on the radiation correction is to know the irradiance and its uncertainty in soundings. This work may contribute to improving the measurement of the irradiance and the estimation of its uncertainty using dual thermistor radiosondes.
The performance and uncertainty of DTR were evaluated via a series of laboratory setups and intercomparison sounding with a commercial radiosonde (Vaisala, RS41). The DTR comprises two temperature sensors (white and black) with different emissivities; their temperature difference can be used for the in situ measurement of the effective irradiance and the correction of the radiation-induced bias of the white sensor. The thermistors were individually calibrated in the range of −70–30 ∘C in a climate chamber, and the uncertainty due to the calibration was evaluated. Moreover, the effect of temperature on resistance reading by radiosonde boards was investigated from −70 to 20 ∘C in the climate chamber, and the corresponding uncertainty was evaluated. The RRT was individually performed on the thermistors to compensate for the unit difference. Parameterisation of the radiation measurements and correction formulas of DTR was performed via UAS experiments with varying temperature, pressure and ventilation speed. The fitting residual of the five DTRs selected from RRT was within 0.2 ∘C. The radiation measurement and correction formulas obtained by UAS were applied to the sounding test of DTR conducted in July 2021. The method of obtaining the radiation correction value of DTR using the effective irradiance measured by the temperature difference between dual sensors during sounding was discussed. Then, the contributing uncertainty factors on the corrected temperature of DTR were summarised for daytime. Generally, the uncertainty of the radiation-corrected temperature of DTR was about 0.35 ∘C in daytime with the coverage factor k = 2. The corrected temperature of the DTR was about 0.4 ∘C higher than that of RS41 around 30 km in daytime although the difference is within the combined uncertainty (∼ 0.5 ∘C at k = 2) of the RS41 and the DTR. The DTR methodology aims at enhancing the accuracy of the temperature measurement in the upper air based on in situ radiation measurements. Future works include an optimisation of each process shown in this study, such as the fabrication of the DTR and the evaluation using laboratory setups to improve the uncertainties due to irregularities in the production and testing of sensors. In addition, more parallel sounding tests in various conditions including daytime and nighttime and/or cloudy and windy weather will be conducted to better characterise the performance of the DTR. The radiation correction of the DTR, in particular, is expected to be different from others while and after passing through clouds because the DTR responds to an in situ radiation flux. Moreover, an extension of the environmental ranges, such as temperature and pressure, is desirable to cover the upper air environments of global areas. Since the radiation correction formula presented in this study is valid for the ventilation speed of 4–6.5 m s−1, the range should be widened to extend the applicability of the DTR.
The operation programme of the upper-air simulator based on LabVIEW software is available upon request.
The laboratory experimental data and sounding data used for Figs. 1–9 are available upon request.
SWL analysed the experimental data and wrote the paper. SKi, YSL, JKY and JS conducted the experiments. BIC revised the experimental setup. SL and SKw developed the measurement software. YGK designed the experiments.
The contact author has declared that neither they nor their co-authors have any competing interests.
Publisher’s note: Copernicus Publications remains neutral with regard to jurisdictional claims in published maps and institutional affiliations.
The authors would like to thank Inseok Yang and Young Hee Lee for providing an analysis tool for thermistor calibration and calibrating the thermistors, respectively.
This research has been supported by the Korea Research Institute of Standards and Science (grant no. GP2021-0005-02).
This paper was edited by Roeland Van Malderen and reviewed by Christoph von Rohden and two anonymous referees.
Bojinski, S., Verstraete, M., Peterson, T. C., Richter, C., Simmons, A., and Zemp, M.: The concept of essential climate variables in support of climate research, applications, and policy, B. Am. Meteorol. Soc., 95, 1431–1443, https://doi.org/10.1175/BAMS-D-13-00047.1, 2014.
Cuccaro, R., Rosso, L., Smorgon, D., Beltramino, G., Tabandeh, S., and Fernicola, V.: Development of a low frost-point generator operating at sub-atmospheric pressure, Meas. Sci. Technol., 29, 054002, https://doi.org/10.1088/1361-6501/aaa785, 2018.
de Podesta, M., Bell, S., and Underwood, R.: Air temperature sensors: dependence of radiative errors on sensor diameter in precision metrology and meteorology, Metrologia, 55, 229–244, https://doi.org/10.1088/1681-7575/aaaa52, 2018.
Dirksen, R. J., Sommer, M., Immler, F. J., Hurst, D. F., Kivi, R., and Vömel, H.: Reference quality upper-air measurements: GRUAN data processing for the Vaisala RS92 radiosonde, Atmos. Meas. Tech., 7, 4463–4490, https://doi.org/10.5194/amt-7-4463-2014, 2014.
GCOS: GCOS Reference Upper-Air Network (GRUAN): Justification, requirements, siting and instrumentation options, GCOS, https://library.wmo.int/doc_num.php?explnum_id=3821 (last access: 5 August 2021), 2007.
Key, J. R. and Schweiger, A. J.: Tools for atmospheric radiative transfer: Streamer and FluxNet, Comput. Geosci., 24, 443–451, https://doi.org/10.1016/S0098-3004(97)00130-1, 1998.
Lee, S. W., Park, E. U., Choi, B. I., Kim, J. C., Woo, S. B., Park, S., Yang, S. G., and Kim, Y. G.: Dual temperature sensors with different emissivities in radiosondes for the compensation of solar irradiation effects with varying air pressure, Meteorol. Appl., 25, 49–55, https://doi.org/10.1002/met.1668, 2018a.
Lee, S. W., Park, E. U., Choi, B. I., Kim, J. C., Woo, S. B., Kang, W., Park, S., Yang, S. G., and Kim, Y. G.: Compensation of solar radiation and ventilation effects on the temperature measurement of radiosondes using dual thermistors, Meteorol. Appl., 25, 209–216, https://doi.org/10.1002/met.1683, 2018b.
Lee, S. W., Yang, I., Choi, B. I., Kim, S., Woo, S. B., Kang, W., Oh, Y. K., Park, S., Yoo, J. K., and Kim, J. C.: Development of upper air simulator for the calibration of solar radiation effects on radiosonde temperature sensors, Meteorol. Appl., 27, e1855, https://doi.org/10.1002/met.1855, 2020.
Lee, S.-W., Kim, S., Lee, Y.-S., Choi, B. I., Kang, W., Oh, Y. K., Park, S., Yoo, J.-K., Lee, J., Lee, S., Kwon, S., and Kim, Y.-G.: Radiation correction and uncertainty evaluation of RS41 temperature sensors by using an upper-air simulator, Atmos. Meas. Tech., 15, 1107–1121, https://doi.org/10.5194/amt-15-1107-2022, 2022.
Luers, J. K.: Estimating the temperature error of the radiosonde rod thermistor under different environments, J. Atmos. Ocean. Tech., 7, 882–895, https://doi.org/10.1175/1520-0426(1990)007<0882:ETTEOT>2.0.CO;2, 1990.
McMillin, L., Uddstrom, M., and Coletti, A.: A procedure for correcting radiosonde reports for radiation errors, J. Atmos. Ocean. Tech., 9, 801–811, https://doi.org/10.1175/1520-0426(1992)009<0801:APFCRR>2.0.CO;2, 1992.
Merlone, A., Lopardo, G., Sanna, F., Bell, S., Benyon, R., Bergerud, R. A., Bertiglia, F., Bojkovski, J., Böse, N., and Brunet, M.: The MeteoMet project–metrology for meteorology: challenges and results, Meteorol. Appl., 22, 820–829, https://doi.org/10.1002/met.1528, 2015.
Merlone, A., Sanna, F., Beges, G., Bell, S., Beltramino, G., Bojkovski, J., Brunet, M., Del Campo, D., Castrillo, A., and Chiodo, N.: The MeteoMet2 project – highlights and results, Meas. Sci. Technol., 29, 025802, https://doi.org/10.1088/1361-6501/aa99fc, 2018.
Nash, J., Oakley, T., Vömel, H., and Li, W.: WMO intercomparisons of high quality radiosonde systems, WMO/TD-1580, WMO (World Meteorological Organization), https://library.wmo.int/doc_num.php?explnum_id=9467 (last access: 25 April 2022), 2011.
Philipona, R., Kräuchi, A., Romanens, G., Levrat, G., Ruppert, P., Brocard, E., Jeannet, P., Ruffieux, D., and Calpini, B.: Solar and thermal radiation errors on upper-air radiosonde temperature measurements, J. Atmos. Ocean. Tech., 30, 2382–2393, https://doi.org/10.1175/JTECH-D-13-00047.1, 2013.
Sairanen, H., Heinonen, M., and Högström, R.: Validation of a calibration set-up for radiosondes to fulfil GRUAN requirements, Meas. Sci. Technol., 26, 105901, https://doi.org/10.1088/0957-0233/26/10/105901, 2015.
Schmidlin, F. J., Luers, J. K., and Huffman, P.: Preliminary estimates of radiosonde thermistor errors, NASA (National Aeronautics and Space Administration of USA), https://ntrs.nasa.gov/api/citations/19870002653/downloads/19870002653.pdf (last access: 6 August 2021), 1986.
Vaisala: Vaisala Radiosonde RS41 Measurement Performance, Vaisala, https://www.vaisala.com/sites/default/files/documents/ WEA-MET-RS41-Performance-White-paper-B211356EN-B-LOW-v3.pdf, last access: 25 April 2022.
von Rohden, C., Sommer, M., Naebert, T., Motuz, V., and Dirksen, R. J.: Laboratory characterisation of the radiation temperature error of radiosondes and its application to the GRUAN data processing for the Vaisala RS41, Atmos. Meas. Tech., 15, 383–405, https://doi.org/10.5194/amt-15-383-2022, 2022.
White, D.: Interpolation errors in thermistor calibration equations, Int. J. Thermophys., 38, 59, https://doi.org/10.1007/s10765-017-2194-x, 2017.
Yang, I., Kim, S., Lee, Y. H., and Kim, Y.-G.: Simplified calibration process and uncertainty assessment for sampling large numbers of single-use thermistors for upper-air temperature measurement, Meas. Sci. Technol., 32, 045002, https://doi.org/10.1088/1361-6501/abd0c0, 2021.
- Abstract
- Introduction
- Introduction to DTR
- DTR characterisation
- Parameterisation for radiation measurement and correction by DTR using UAS
- Sounding test of DTR
- Uncertainty evaluation and intercomparison
- Conclusions
- Code availability
- Data availability
- Author contributions
- Competing interests
- Disclaimer
- Acknowledgements
- Financial support
- Review statement
- References