the Creative Commons Attribution 4.0 License.
the Creative Commons Attribution 4.0 License.
 | 19 Jan 2022
Improvement in algorithms for quality control of weather radar data (RADVOL-QC system)
Katarzyna Ośródka
Data from weather radars are commonly used in meteorology and hydrology, but they are burdened with serious disturbances, especially due to the appearance of numerous non-meteorological echoes. For this reason, these data are subject to advanced quality control algorithms. The paper presents a significant improvement of the RADVOL-QC system made necessary by the appearance of an increasing number of various disturbances. New algorithms are mainly addressed to the occurrence of clutter caused by wind turbines (DP.TURBINE algorithm) and other terrain obstacles (DP.NMET algorithm) as well as various forms of echoes caused by the interaction of a radar beam with RLAN signals (set of SPIKE algorithms). The individual algorithms are based on the employment of polarimetric data as well as on the geometric analysis of echo patterns. In the paper the algorithms are described along with examples of their performance and an assessment of their effectiveness, and finally examples of the performance of the whole system are discussed.
- Article
(5116 KB) - Full-text XML
- BibTeX
- EndNote


Weather radar data are widely employed in weather monitoring and forecasting; thus they have been significantly improved, and observational capabilities of radars have been enhanced in response to increasing demands for better resolution and accuracy. In particular, the enhancement of the accuracy of a quantitative precipitation estimation (QPE) has been a primary goal in weather radar applications in meteorology and hydrology. Moreover, the upgrade to dual polarization has promised substantial improvements in data reliability since polarimetric parameters offer many opportunities by compensating for various factors that cause measurement errors, such as the occurrence of different types of non-meteorological echoes, especially those caused by interfering radio local area network (RLAN) signals and wind turbines (e.g. Bringi et al., 2011; Saltikoff et al., 2019).
Radar precipitation estimates are affected by numerous sources of uncertainty (e.g. Villarini and Krajewski, 2010) and require advanced post-processing algorithms. While employing weather radar observations it is crucial to perform an advanced quality control (QC) of the data, which consists of clearing them of erroneous echoes (ground clutter, effects of anomalous beam propagation, biological scatterers such as birds and insects, etc.), correcting distorted data, and quantitative estimation of the final data uncertainty. Detailed descriptions and reviews of currently used methods of QC of radar data, which identify individual uncertainty components and address their combined effects, are commonly found in the literature (see e.g. Steiner and Smith, 2002; Berenguer et al., 2006; Cho et al., 2006; Gourley et al., 2007; Park et al., 2009; Zhang et al., 2011; Krajewski et al., 2011; Szturc et al., 2012; Ośródka et al., 2014). Many new dual-polarization-based quality control algorithms are being implemented in radar signal processors and are part of their own software.
The quantity called quality index (QI) plays an increasingly important role in quality control of weather radar data (e.g. Einfalt et al., 2010; Michelson et al., 2021) as it provides quantitative information on the quality of data but can also be used to generate more reliable individual products (Ośródka and Szturc, 2015) to produce composite maps (Fornasiero et al., 2006; Sandford and Gaussiat, 2012; Jurczyk et al., 2020a) or QPE based on multi-source information (Jatho et al., 2010; Jurczyk et al., 2020b; Méri et al., 2021).
Huge effort to resolve quality-related issues in radar observations has been made by various international research programmes, such as COST-717 (Michelson et al., 2005) and COST-731 (Rossa et al., 2010), EUMETNET OPERA (Huuskonen et al., 2014; Saltikoff et al., 2019), the BALTRAD project (Michelson et al., 2018), and others.
Different QC systems are designed to suit specific local conditions and are implemented in individual national meteorological services, e.g. ROPO in Finland (Peura, 2002); NMQ in NOAA, USA (Zhang et al., 2012); RADVOL-QC in Poland (Ośródka et al., 2014); qRad in Slovakia (Méri et al., 2021).
In the Polish national meteorological and hydrological service, i.e. the Institute of Meteorology and Water Management – National Research Institute, the RADVOL-QC system works operationally to perform QC of radar data delivered by the Polish weather radar network POLRAD (Ośródka et al., 2014; Szturc et al., 2018). The main objective of this study is to present new, more effective algorithms incorporated into the RADVOL-QC system which are able to effectively deal with the aforementioned disturbances in radar data.
The paper is structured as follows: first, the RADVOL-QC system, its structure, and applied approaches are briefly presented (Sect. 2); then new solutions in the field of non-meteorological echo detection, incorporated into the RADVOL-QC after the publication describing its earlier version, are discussed in Sect. 3, which is the essential part of the paper; next, algorithms for correcting these detected distorted echoes are described (Sect. 4); finally, there is a brief description of the verification of the system's effectiveness (Sect. 5), followed by a concise summary (Sect. 6).
2.1 Polish weather radar network POLRAD
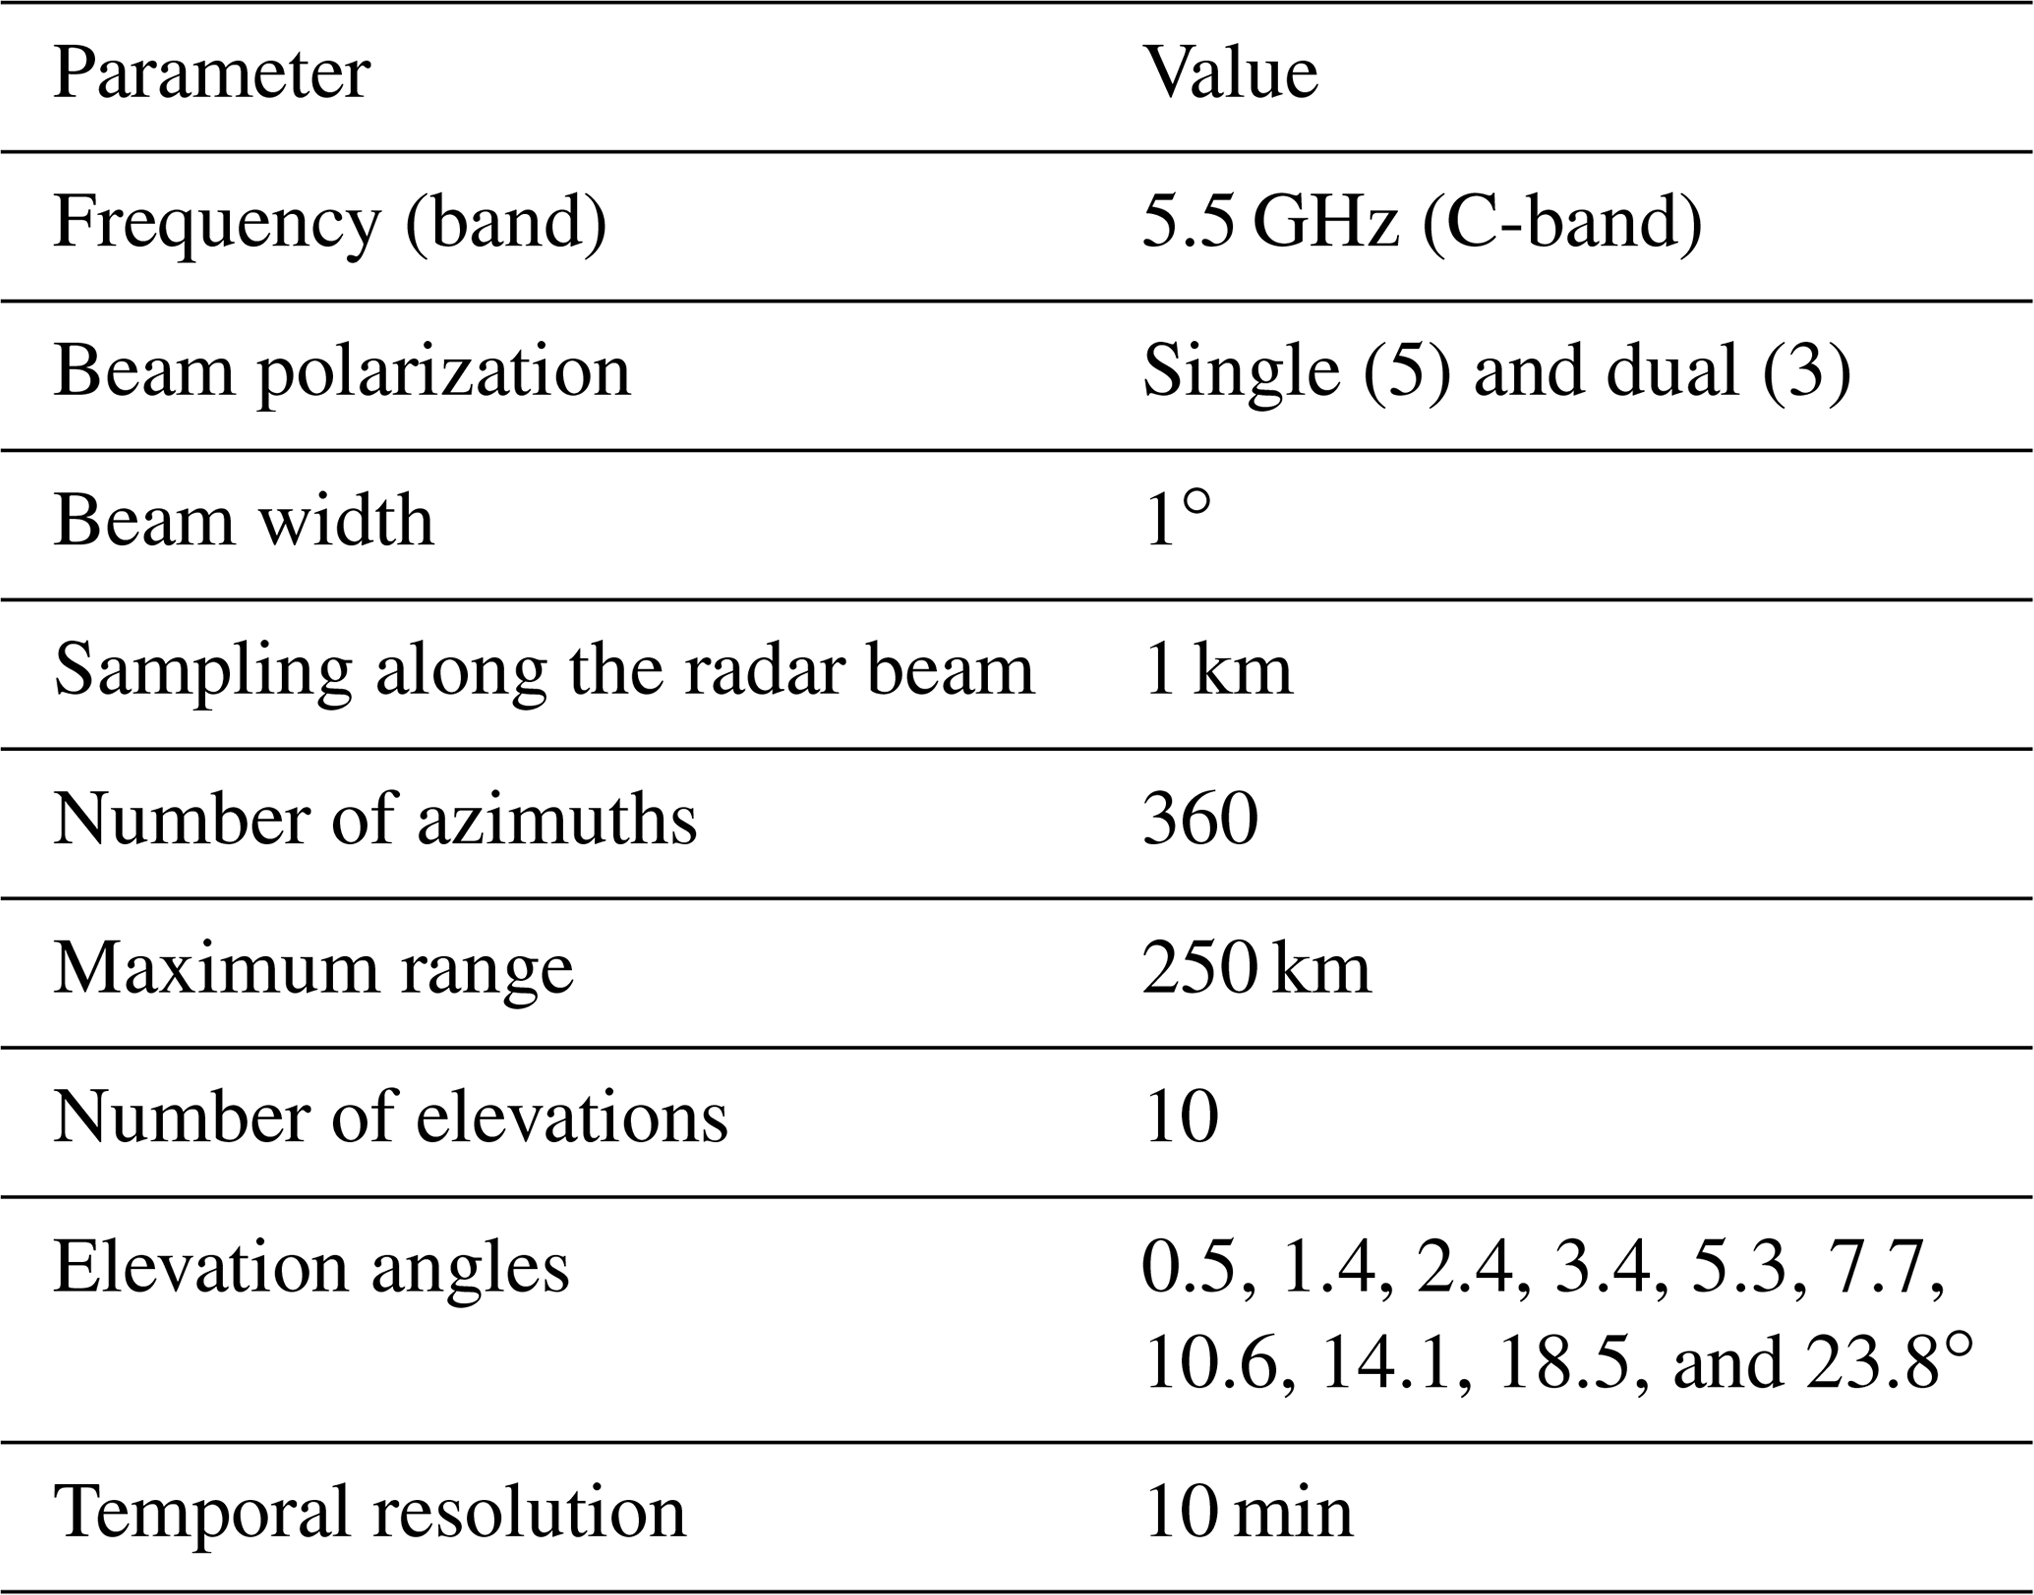
The algorithms for quality control of weather radar data described in the paper have been designed for the Polish weather radar network POLRAD, operated by the Institute of Meteorology and Water Management – National Research Institute (IMGW). The network consists of eight C-band Doppler radars (Fig. 1), of which three are polarimetric. All the radars were manufactured by the European company Leonardo S.p.A., formerly Gematronik (Germany). The main parameters of the radars and designed scan strategy are listed in Table 1. There is a plan in place to replace all radars in this network with dual-polarization ones and to expand it by two more radars in the years 2022–2023.

Figure 1Coverage of the area of Poland by weather radar network POLRAD with 250 km range as of 2021. Polarimetric radars marked in red.
Table 1Parameters and scan strategy for radar reflectivity scans used in weather radars of the POLRAD network.
2.2 Structure of the RADVOL-QC system
The 3-D raw data, so-called volumes, generated by POLRAD radars are quality-controlled by the RADVOL-QC system. The RADVOL-QC quality control system includes data correction and determination of QI resulting from each recognized error source (Ośródka et al., 2014). The QC applies to each radar bin – a point in space where a single measurement is performed. In the case of dual-polarization measurements, which offer more possibilities for efficient action but require different techniques (Bringi et al., 2011), the quality control algorithms constitute a separate category, and their names are prefixed with “DP”. Quality control of Doppler data, i.e. velocities, also carried out in RADVOL-QC, is not described in this paper.
The different kinds of errors taken into consideration by the RADVOL-QC system can be divided into several groups:
-
errors connected with radar beam geometry and effects related to increasing distance from the radar site along the beam, such as beam broadening, increasing distance between neighbouring bins, and increasing height of the radar beam above ground level;
-
disturbance by non-meteorological echoes, mainly caused by (i) ground clutter (mountains or high artificial structures located close to the radar site), (ii) external signals from RLAN emitters or the sun interfering with radar signals, which are usually visible in the radar image as spikes pointing from the emitter towards the radar site and can be removed using geometrical algorithms that analyse the variability in the echo along and across the radar beam; (iii) small-scale measurement noise (so-called speckles); and (iv) biological targets such as birds or insects;
-
other groups of errors resulting from (i) beam blockage on terrain (mountains) causing a decrease in radar signal, which is corrected using a digital terrain map; (ii) attenuation in rain, especially if it is heavy, corrected by iterative estimation of signal loss along the beam path in cases of single-polarization radars and by an algorithm based on polarimetric information in cases of dual-polarization radars; and (iii) anomalous propagation of the radar beam which causes, for example, echoes received from non-meteorological (terrain) and meteorological (hydrometeors) objects located outside the radar range.
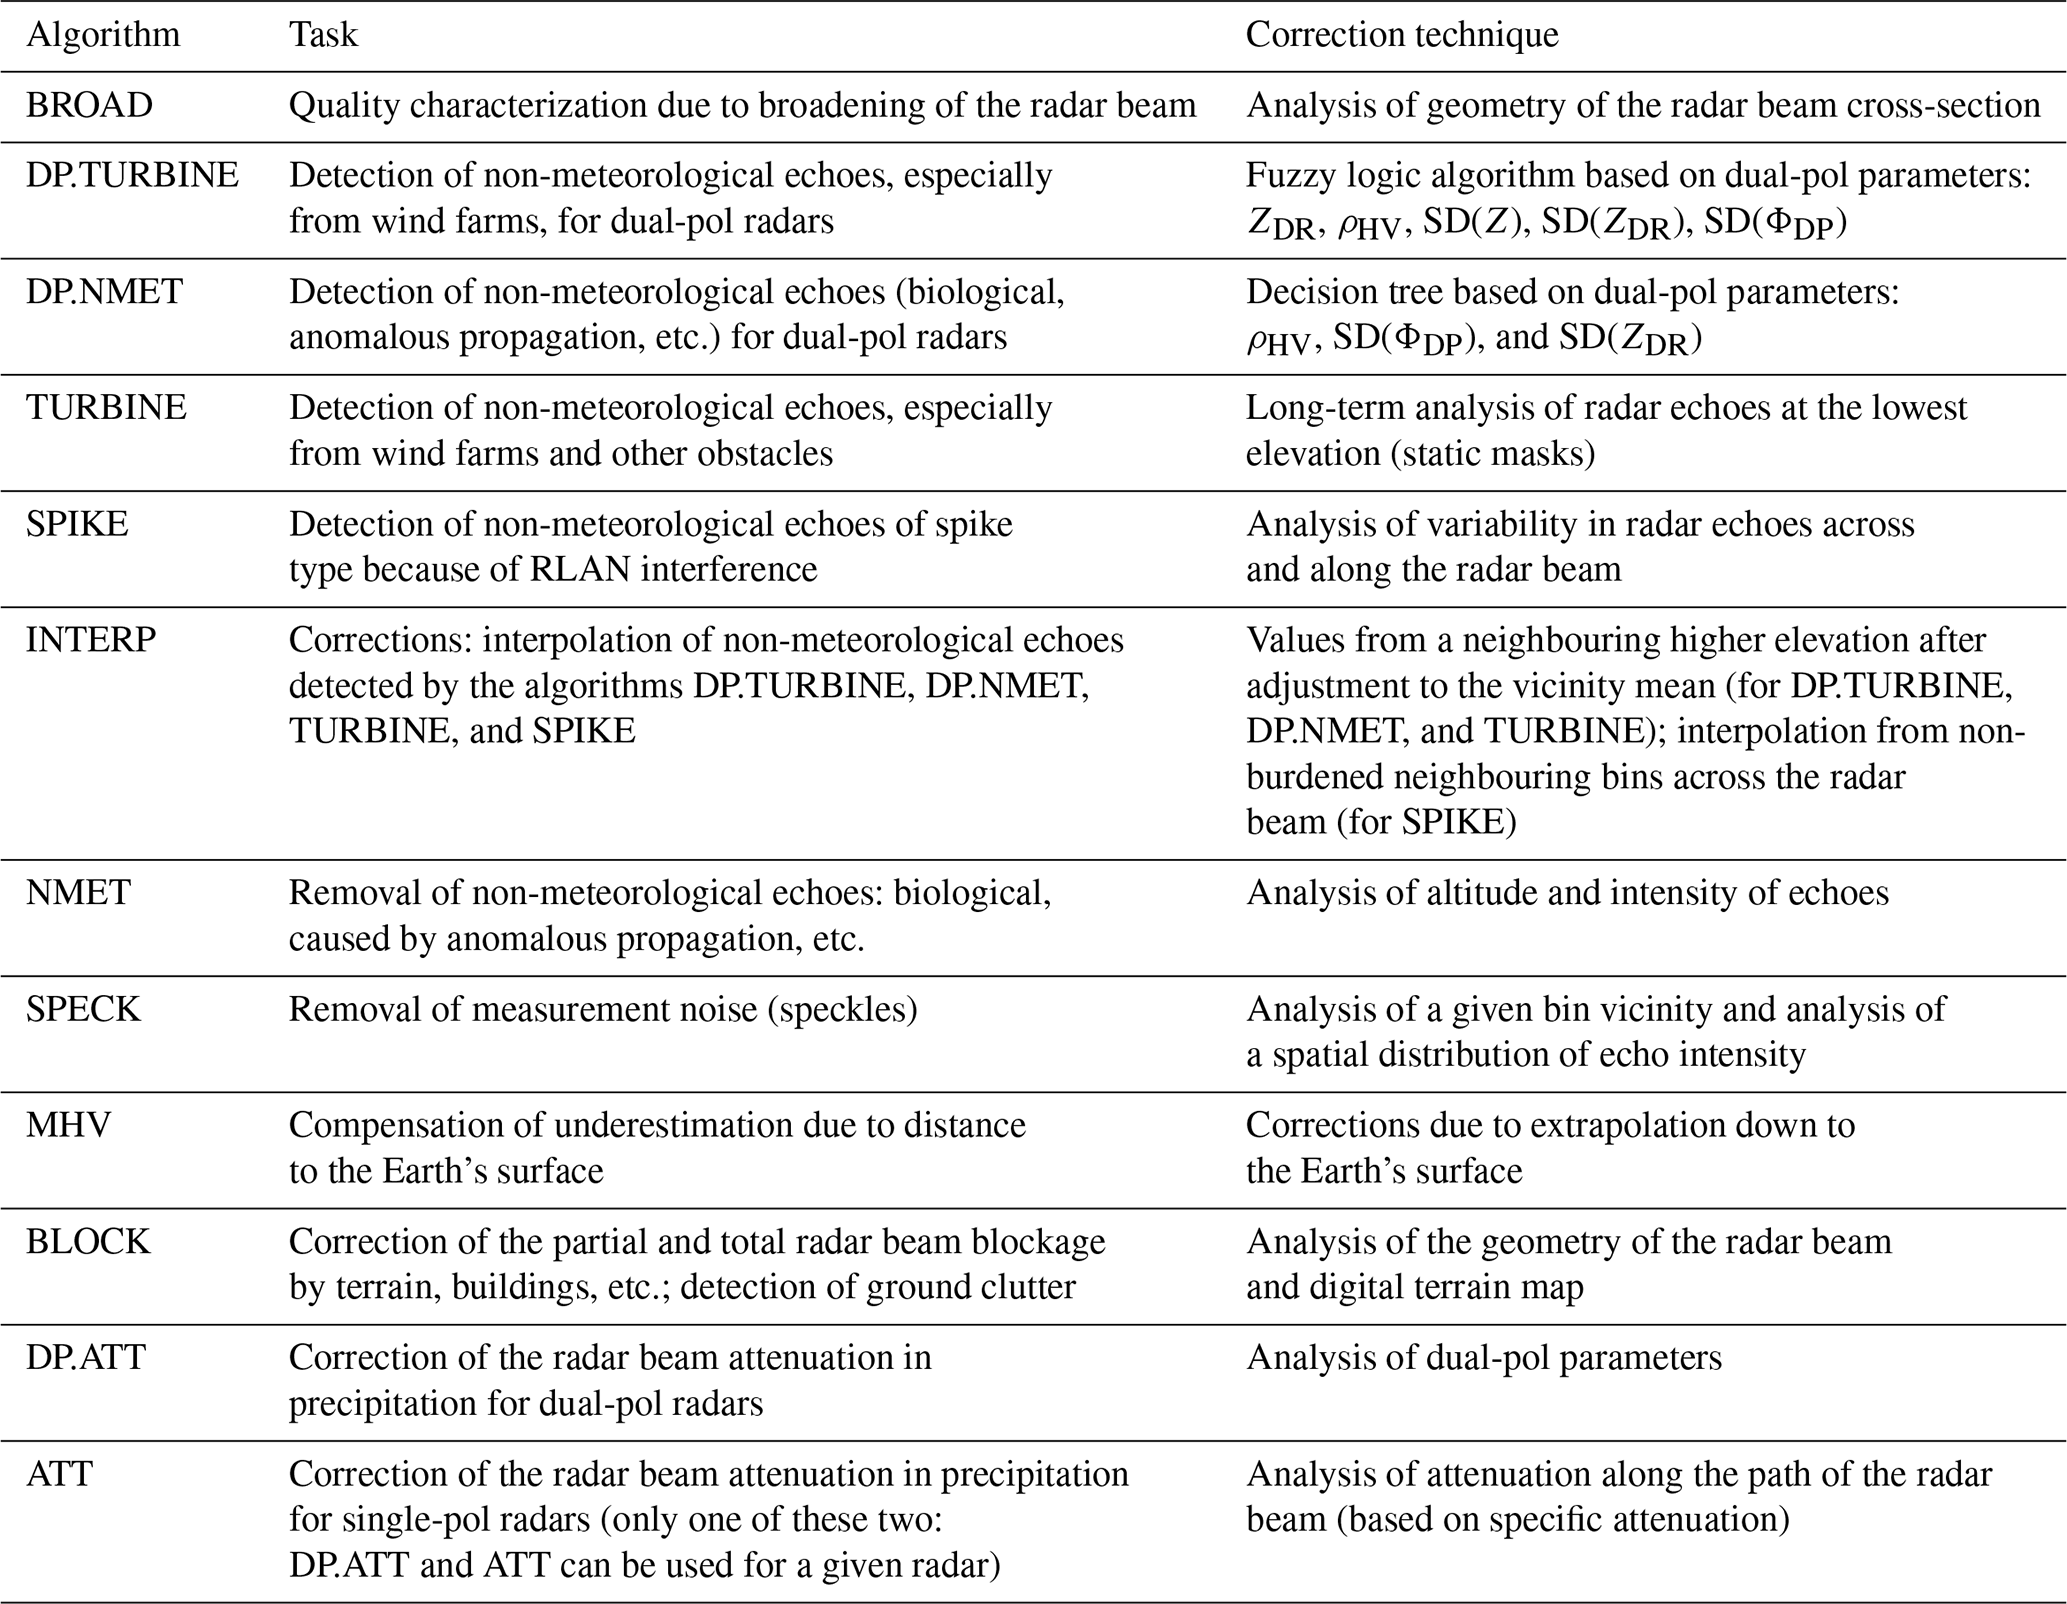
Each category of errors burdening radar data is characterized by specific properties, especially spatial and temporal structure. As a result, different approaches for their diagnosis and correction are required (Table 2).
Table 2List of quality control algorithms employed in the RADVOL-QC system for radar reflectivity data measured by single- and dual-polarization (single-pol and dual-pol) weather radars in order of the data processing chain.
Individual quality indices (QIi) are determined empirically or based on the author's experience in the frame of each ith RADVOL-QC algorithm separately, and after the whole quality control chain the final total QI is determined using a multiplicative formula (Einfalt et al., 2010; Ośródka et al., 2014). Its values range from 0 for extremely bad to 1 for perfect-quality data. The specific value of the quality index QIi is related to the significance and magnitude of a particular type of disturbance in the POLRAD network and synchronized with quality indices of other data applied at the IMGW.
In this paper only the new and enhanced algorithms implemented into the RADVOL-QC system after publication of the earlier paper by Ośródka et al. (2014) are described in detail. Since this time the system has continued to be developed, including within the European BALTRAD project (Michelson et al., 2018) and as part of the IMGW's statutory duties.
3.1 New challenges
The recent dramatic increase in the number of RLAN signals interfering with radar echoes (e.g. Saltikoff et al., 2016) as well as the greater number of wind farms used for energy generation (e.g. Hood et al., 2010) has created new and serious challenges to the developed QC algorithms despite the fact that the commonly used approaches show good performance in many observed cases.
The first problem, that of radio interference, is becoming more and more difficult to handle because of a growing number of such echoes. A team of experts from around the world representing institutions involved in weather radar measurements, including the EUMETNET OPERA programme, issued the following drastic statement: “As an extreme solution, and on a theoretical basis, an entire C-band network could be replaced by a dense network of X-band radars (...)” (Saltikoff et al., 2016). Nonetheless, the interference must be removed from radar-based precipitation data before ingestion into any application, such as input into hydrological rainfall-runoff modelling or assimilation into mesoscale numerical weather prediction models.
As a response to the increasing demand for renewable energy, the number of wind turbines is growing rapidly in many countries around the world. Their impact on weather radar performance has been extensively studied in recent years, with several cases of wind turbine clutter observed in meteorological radar applications (Isom et al., 2009; Norin and Haase, 2012; Angulo et al., 2015; Norin, 2015). The main objective of these studies was to characterize and try to mitigate wind turbine clutter, mainly by means of digital signal processing such as clutter-filtering techniques. However, the Doppler information that is often used for the removal of stationary target returns is not likely to be appropriate in this case because wind turbine blades are constantly rotating and, consequently, provide a non-zero Doppler signature (e.g. Angulo et al., 2015).
Erroneously estimated rainfall amounts propagate through hydrological models, affecting hydrologic simulations and predictions. To mitigate or eliminate the aforementioned RLAN interference and effects of wind turbines in quantitative rainfall estimation and subsequent applications, this paper proposes the incorporation of enhanced automated approaches into the RADVOL-QC system.
3.2 Fuzzy logic scheme for polarimetric parameters – DP.TURBINE algorithm
The algorithm named DP.TURBINE is used mainly for the detection of radar echoes generated by wind turbines; it employs a fuzzy logic scheme for selected polarimetric parameters (the definition of dual-polartimetric parameters can be found, for example, in Bringi and Chandrasekar, 2001). Preliminary analysis has been conducted to check which polarimetric parameters are most sensitive to non-meteorological echoes. This was investigated by means of histograms for the following classes of radar echoes: non-meteorological and meteorological. The latter is divided into two types – convective and stratiform precipitation – by means of the CONVECTION algorithm (Jurczyk et al., 2012; Ośródka and Szturc, 2015). Three parameters were finally selected to be employed in this algorithm: the differential reflectivity factor ZDR(dB), the cross-correlation coefficient between horizontally and vertically polarized radar returns ρHV, and the differential phase ΦDP(∘). The ρHV is employed in the algorithm directly, whereas for the others standard deviations SD(ZDR) and SD(ΦDP) computed within grids of 3 bins × 3 bins are employed. Histograms of the selected parameters obtained for the Ramża radar from 2 d – one with convective weather and the second with stratiform weather – are presented in Fig. 2.
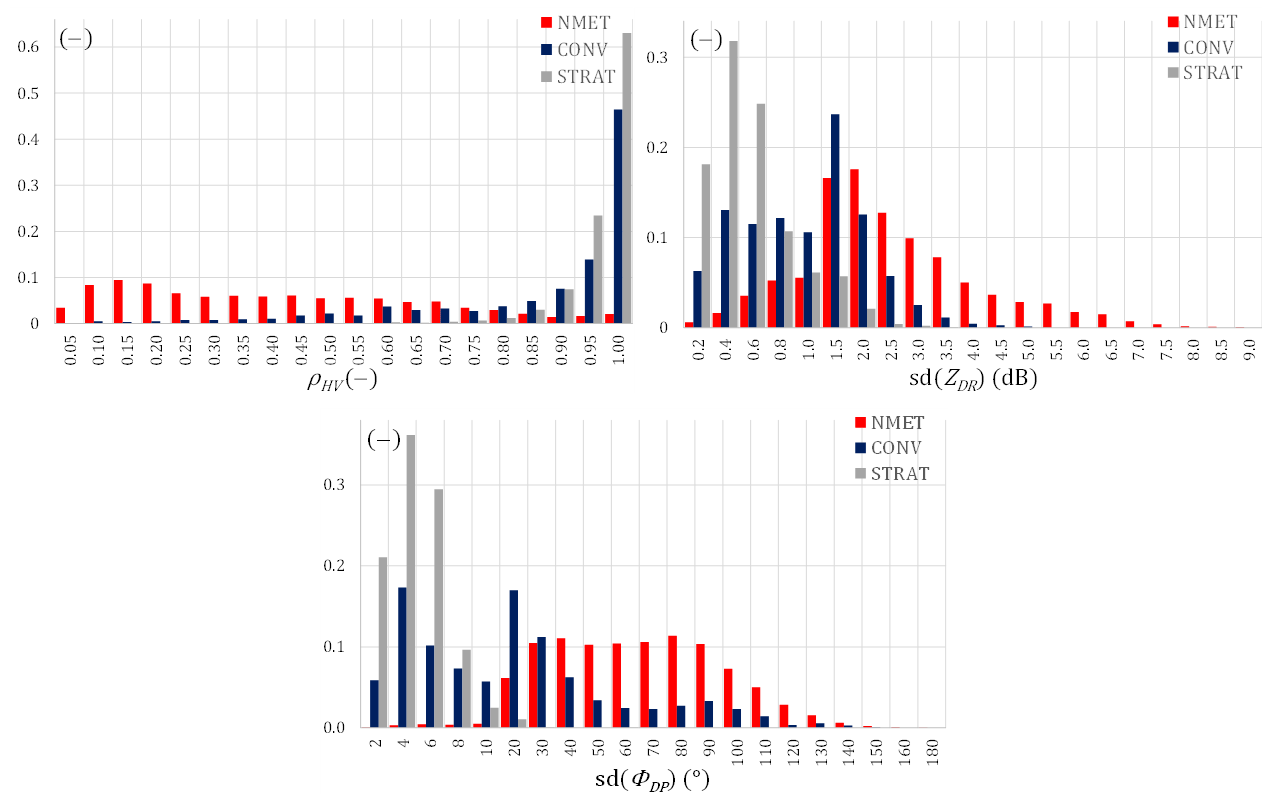
Figure 2Histograms for selected polarimetric parameters from the top left – ρHV, SD(ZDR), and SD(ΦDP) – for three classes of radar echoes: non-meteorological (NMET; in red), meteorological convective (CONV; in navy), and meteorological stratiform (STRAT; in grey). Ramża radar, data from 2 d (1 September 2018 and 21 February 2019), the lowest elevation.
It is notable that for correlation coefficient ρHV, the non-meteorological echoes generate values clearly different to those for meteorological echoes, and the range of overlap is quite narrow. The standard deviations SD(ZDR) and SD(ΦDP) also differ in values for the three classes, especially for stratiform precipitation. The above information collected for these three parameters allows one to deduce the presence of non-meteorological echoes with a relatively high certainty.
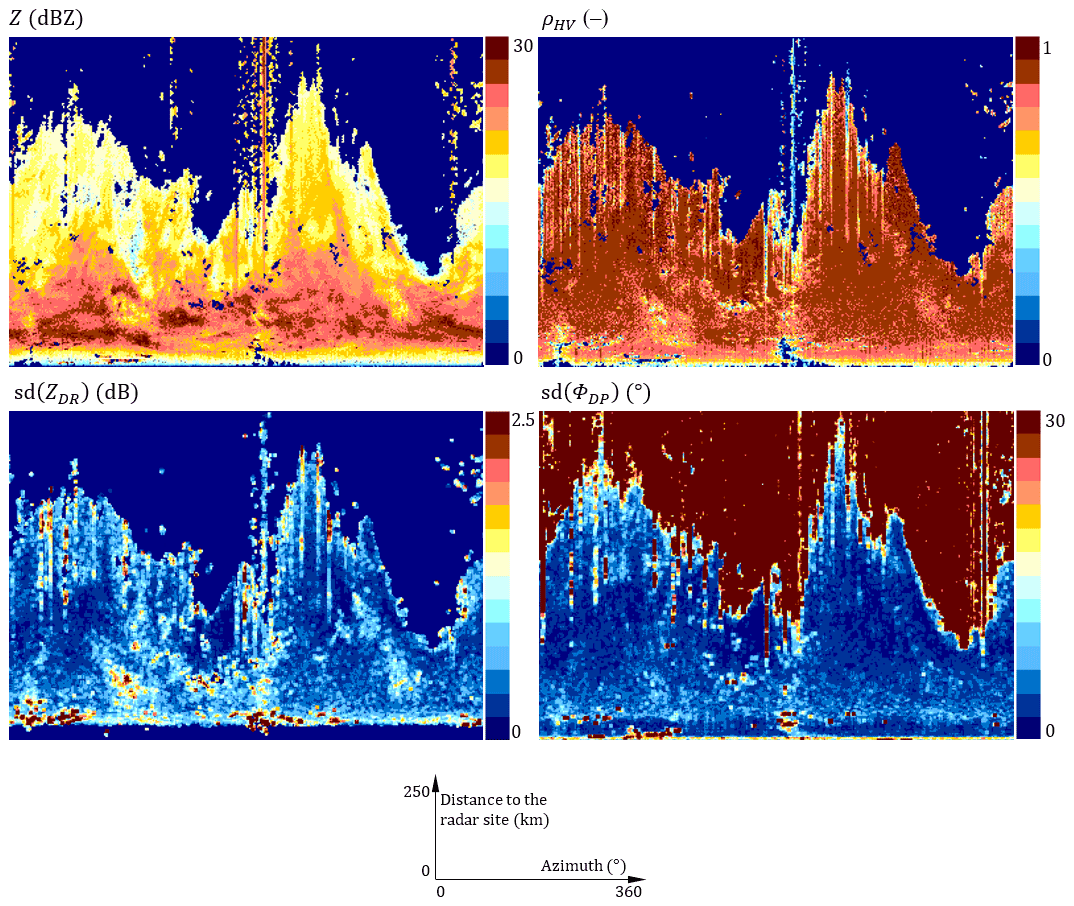
Figure 3Radar measurement fields from the top left: Z, ρHV, SD(ZDR), and SD(ΦDP). Ramża radar, the lowest elevation, 21 February 2019, 16:40 UTC. At the bottom: definition of axes in polar coordinates.
In Fig. 3 examples of radar reflectivity Z along with the three polarimetric parameters investigated in the DP.TURBINE algorithm are presented. All the radar pictures shown in this article, with the exception of those shown in Fig. 12, are presented in the polar coordinates: the horizontal axis gives the azimuth (α) in degrees, and the vertical axis gives the distance from the radar site (l) in kilometres.
The evident non-meteorological spike echoes are especially visible in ρHV data, whereas non-meteorological echoes from terrain and other obstacles are mainly visible in SD(ZDR) data.

Figure 4Membership functions for selected polarimetric parameters from the left – ρHV, SD(ZDR), and SD(ΦDP) – determined for meteorological (in navy) and non-meteorological echoes (in red).
Having selected the most appropriate polarimetric parameters, a fuzzy logic approach was applied to categorize radar bins into meteorological and non-meteorological echoes. Calibration of the scheme consists of the determination of the function parameters for each class of echoes – meteorological and non-meteorological – including those from wind farms (Fig. 4).
For both echo classes, values of relevant membership functions for all three selected parameters are aggregated as weighted sums:
where class is the echo class (meteorological or non-meteorological), i is the parameter number, 3 is the number of parameters, μi(class) is the membership function for the ith parameter for echo class, and Wi(class) is the weight of ith parameter for echo class. These weights equal 1.0, 0.5, and 1.0 for parameters ρHV, SD(ZDR), and SD(ΦDP), respectively. Comparison of the weighted sums decides which echo class a considered radar bin belongs to.
The designed algorithm proved to be effective, especially for the detection of wind turbines. The effectiveness of the algorithm was checked on data in the form of monthly precipitation accumulation determined for the lowest antenna elevation (0.5∘) because at a higher elevation the number of this kind of non-meteorological echo is not significant. The radar reflectivity was transformed into precipitation using the Marshall–Palmer formula. The following categories of objects were identified based on a map of aeronautical obstacles of Poland provided by the Polish Civil Aviation Authority (http://caa-pl.maps.arcgis.com/apps/webappviewer/index.html?id=252d2be2e6104adcb9be8201660a05b3/, last access: 8 January 2022): (i) wind turbines and wind farms, (ii) other disturbing objects, and (iii) undisturbed locations. Effectiveness of the DP.TURBINE algorithm has been assessed by the formula
where Rraw is the monthly uncorrected precipitation accumulation at the location of a given object, RDP.TURBINE is the precipitation accumulation in the same place after using the DP.TURBINE algorithm for the detection of obstacles and then the INTERP algorithm (see Sect. 4) for their correction, and Rbg is the monthly precipitation accumulation determined for the undisturbed neighbourhood of a considered object.
Table 3Monthly precipitation accumulations determined for the lowest elevation (0.5∘) at locations of wind turbines, other disturbing objects, and undisturbed locations. Data from Ramża radar, September 2018.
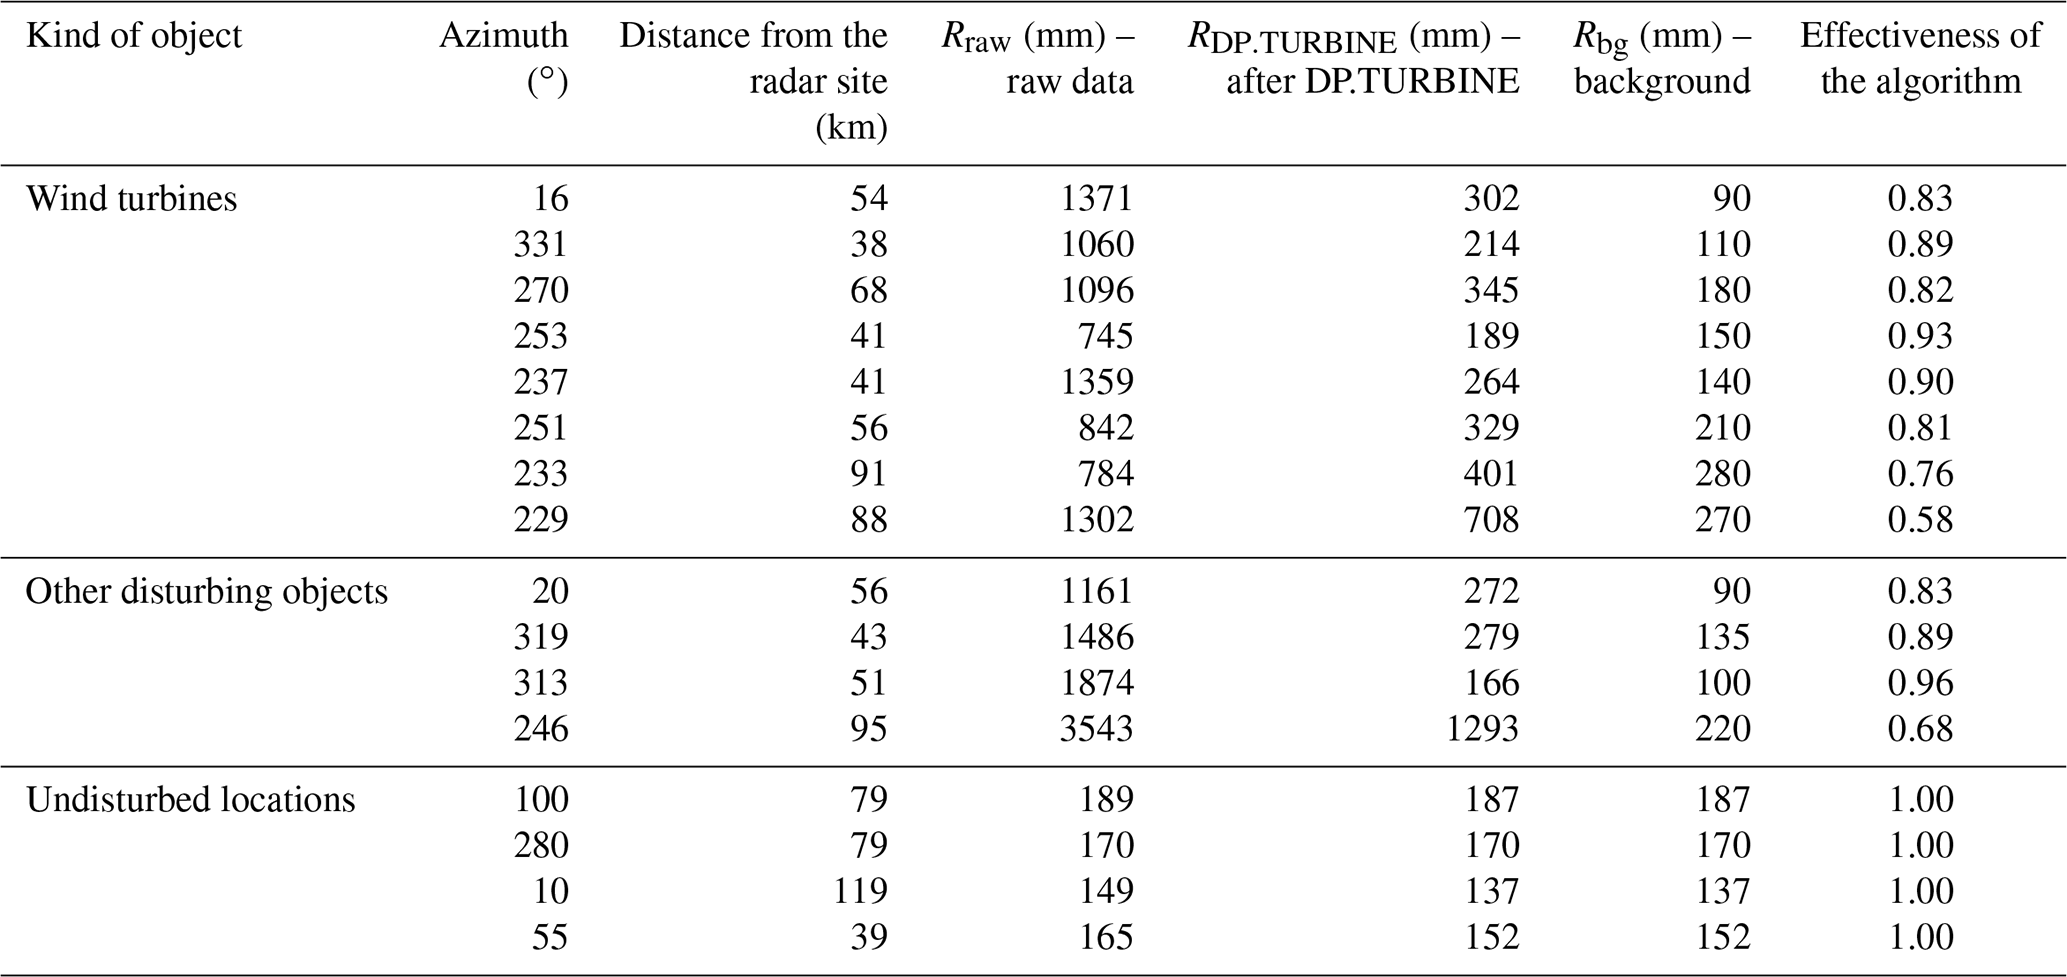
Table 3 shows the influence of the DP.TURBINE algorithm on the values of monthly accumulation of radar echoes in places where wind turbines and other obstacles (masts, chimneys) disturb the radar observations from Ramża radar. There are many such objects here, and their monthly precipitation accumulations resulting from disturbance from these turbines often significantly exceed 1000 mm. The effectiveness of the developed algorithm for echoes from wind turbines in the range of the Ramża radar, presented in Table 3, is on average 0.82. However, if the intensities of echoes from wind turbines are lower, this efficiency is lower.
In Fig. 5 an example of the DP.TURBINE running is also presented for the Ramża radar. Within this radar range several obstacles can be visible in the monthly accumulations, but only a small number of them are due to wind turbines. The extremely dense strong echoes placed within a distance approximately 30 km from the radar site are a result of the industrial and urbanized area (the Upper Silesia conurbation) located close to the Ramża radar. The existence of high buildings produces such strong echoes due to side lobes from the radar beam. Other disturbances are caused by RLAN interference.
The efficiency of the DP.TURBINE algorithm is clearly visible in the right picture. Example locations of wind turbines visible in the raw radar image are marked with red ellipses. It can be noticed that DP.TURBINE also weakens the echoes from RLAN interference.
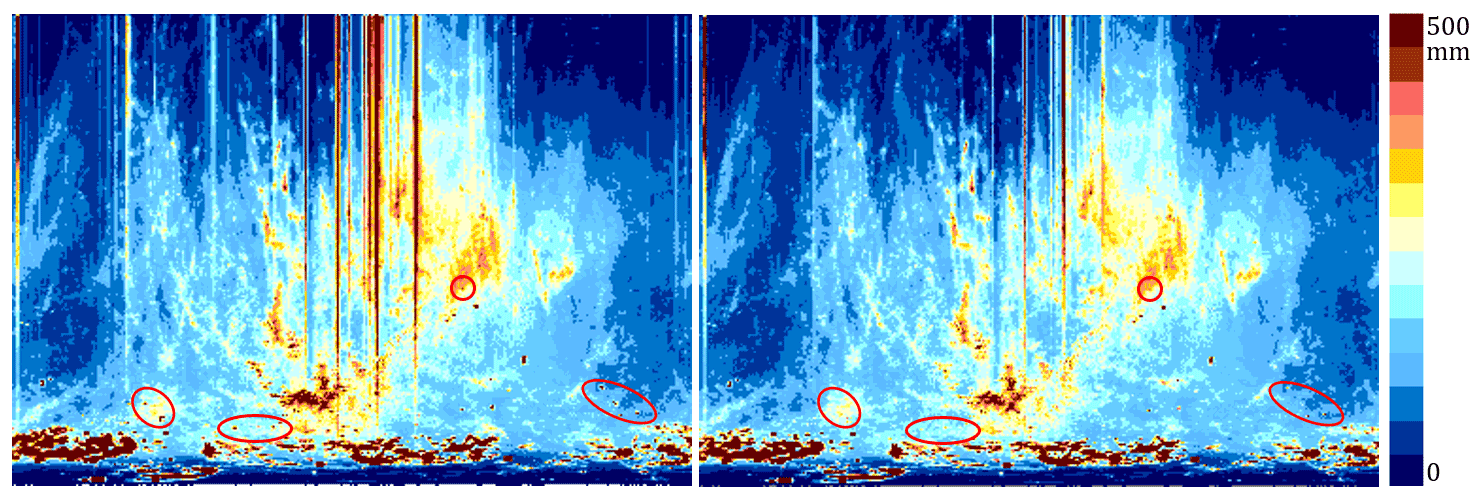
Figure 5Example of the performance of the DP.TURBINE algorithm from the left: raw data and data after detection of non-meteorological echoes by means of DP.TURBINE and their interpolation with INTERP. Ramża radar, monthly accumulation of precipitation, the lowest elevation, September 2018. The red ellipses show examples of echoes from wind turbines.
The individual quality index QIDP.TURBINE depends on the presence of a detected non-meteorological echo in a given bin according to the following equation:
3.3 Decision tree for polarimetric parameters – DP.NMET algorithm
As opposed to the DP.TURBINE algorithm, which has been designed especially for wind turbine echoes, the DP.NMET is dedicated to different types of disturbances in weather radar measurements, caused not only by wind turbines but also by RLAN interference, anomalous propagation, biological objects, etc. The main idea proposed by Seo et al. (2015) is to use a decision tree, in which the following polarimetric parameters are employed: Z, ρHV, SD(ΦDP), and SD(ZDR). The adaptation of this original scheme came down to tailoring parameters to local conditions and excluding the SD(ZDR) parameter as it weakly correlates with the occurrence of non-meteorological echoes (Fig. 6).
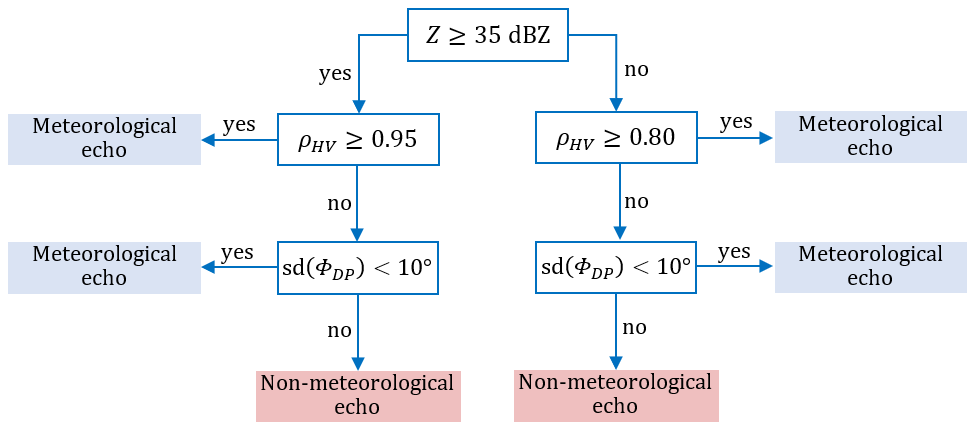
Figure 6Flowchart describing the DP.NMET algorithm designed to detect non-meteorological echoes of different types for dual-polarization radars (based on the scheme from Seo et al., 2015).
This flowchart can be written as one condition.
where values of the thresholds have been estimated for the radars of the POLRAD network.
The main approach of the algorithm is that the basic polarimetric parameter for differentiation between meteorological and non-meteorological echoes is the correlation coefficient ρHV. There are two thresholds for this coefficient established empirically for bins with low and high reflectivity (see Eq. 4), and the echo in a given bin is non-meteorological if the value of the correlation coefficient ρHV is lower than the relevant threshold. Because the ρHV has a wide overlapping range for the meteorological and non-meteorological classes (see Sect. 3.2), additional verification is needed since false detection of non-meteorological echoes occurs too often. For this reason, in the next step the standard deviation SD(ΦDP) is used to confirm the preliminary classification: if the value is higher than a defined threshold, the echo is recognized as non-meteorological.
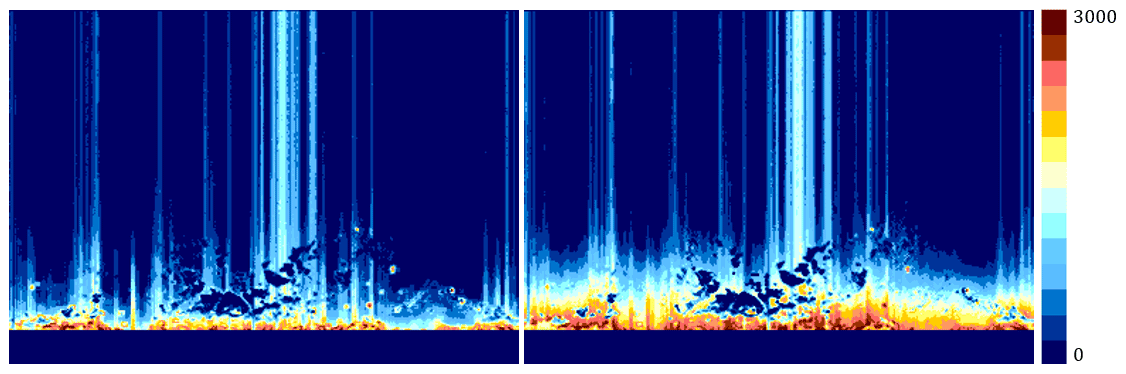
Figure 7Numbers of non-meteorological echoes detected separately by algorithms from the left: DP.TURBINE and DP.NMET. Ramża radar, September 2018, the lowest elevation. Up to 25 km from the radar, the algorithm is not applied.
Figure 7 shows how many times the DP.TURBINE (discussed in Sect. 3.2) and DP.NMET algorithms separately detected non-meteorological echoes during 1 month for Ramża radar data at the lowest elevation. The total number was 3000 out of approximately 4320 measurements.
Both algorithms are not applied up to 25 km from the radar site because within the RADVOL-QC system one of the SPECK sub-algorithms (see Ośródka et al., 2014) operates in this area, replacing the data from the lowest elevation with data from the adjacent higher one, which explains the wide strip near the radar site where no echoes were detected (the term “echo” denotes radar reflectivity, which is different from the numerical value assigned to “no echo” in a given radar data processing system; in the Rainbow system for Leonardo radars, this value is −32 dBZ).
It turned out that the DP.TURBINE algorithm is better at extracting small-area echoes associated with wind turbines, while the DP.NMET algorithm detects more other non-meteorological echoes, especially those located near the radar (but outside the aforementioned 25 km strip) caused by side lobes of the radar beam hitting various types of obstacles. It is noticeable that both algorithms are also sensitive to other types of non-meteorological echoes, especially those connected to RLAN interference of spike type. As mentioned in Sect. 3.2, the Ramża radar generates the most disturbed data, especially in the vicinity of the radar, due to its location near a large industrial and urban area.
Similarly to the previous algorithm, the individual quality index QIDP.NMET depends on the presence of a detected non-meteorological echo in a given bin:
3.4 Static maps (masks) of echoes – TURBINE algorithm
The algorithm using static maps (masks) of ground clutter of various origins is a very simple but effective tool. However, it requires relatively frequent updating of maps depending on the intensity of obstacle changes in the range of a given radar. Figure 8 shows an example of such a mask for the Legionowo radar located in central Poland. It is near Warszawa (Warsaw) city, which causes a significant number of obstacles to the south of the radar site. Moreover, echoes from various kinds of wind turbines are visible here.
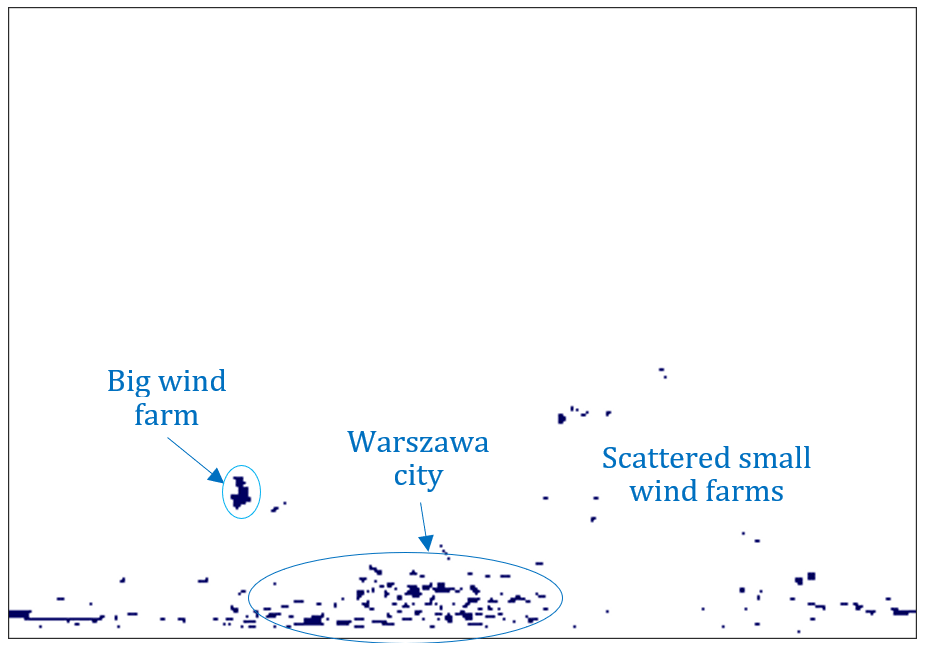
Figure 8Example of a mask of non-meteorological permanent echoes. Legionowo radar, the lowest elevation.
The following algorithm has been developed for the semi-automatic generation of static echo maps from wind turbines and other ground clutter. At the first stage, fields of precipitation are generated for non-rainy time steps (when a number of rainy bins are below a defined threshold) for the lowest elevations of each radar. Every few months they are accumulated, and on this basis maps of permanent echoes from wind farms as well as residential and industrial buildings are generated for bins exceeding a certain threshold value, specific for each radar. At the last stage, the maps are manually corrected by comparing them with the initial fields and with previous masks in order to exclude from the masks echoes such as those from the mountains to avoid significant reduction in precipitation in these areas.
Figure 9 shows the monthly precipitation sums for selected radars of the POLRAD network: from raw data and after processing with the RADVOL-QC system without and with the TURBINE algorithm; the latter stands for the complete system. The RADVOL-QC system proved to be very effective even without the use of the TURBINE algorithm because some other algorithms, especially those based on data from dual-polarization radars, detect echoes from wind turbines as well. This improvement is especially noticeable for radars covering mountainous areas, such as Pastewnik and Ramża, as well as highly urbanized areas, such as Legionowo and Ramża. More effective removal of wind farms employing the TURBINE algorithm for Legionowo can be explained by the fact that this radar is not dual-polarimetric.

Figure 9Comparison of the monthly sums of radar precipitation from (from the left): raw data, data after processing by the RADVOL-QC system without the TURBINE algorithm, and with the TURBINE algorithm (i.e. the complete RADVOL-QC system). Legionowo, Pastewnik, and Ramża radars; the lowest elevations. October 2019.
The individual quality index QITURBINE is lowered in the bins located within the mask of permanent non-meteorological echoes:
3.5 Geometrical algorithms for the removal of RLAN interference – SPIKE algorithm
The Polish radar network POLRAD consists of eight radars, but only three of them are equipped with the functionality of dual polarization of the radar beam. Therefore, algorithms that do not use polarimetric parameters to remove non-meteorological echoes are still very important to ensure the appropriate quality of data, especially as not all measurement disturbances can be removed through applying polarimetric data.
In C-band weather radars, signals generated by external RLAN systems and also from the sun – so-called spike echoes – are interpreted by radar as precipitation echoes. The shape of these echoes is very specific: in Cartesian radar images they have the form of elongated narrow spike-shaped echoes, located along the radar beam, sometimes with high reflectivity. A significant problem with the RLAN-derived echoes is that although they may be partially removed or decreased due to the low threshold of signal quality index (SQI) of radar data, this in fact complicates their removal because gaps or changes in the intensity of these echoes introduced by this filter deform their spatial pattern, which makes the algorithm effectiveness lower.
The algorithm is divided into several sub-algorithms used to remove different types of spike echoes, which are named in simple terms:
-
“wide”,
-
“narrow”,
-
“discontinuous”,
-
“shorter longitudinal”,
-
“inverse”.
The SPIKE algorithm has been an important element of the RADVOL-QC system from the very beginning; it has been described in detail in the earlier work of Ośródka et al. (2014). However, it has undergone major changes since then, so in this paper the sub-algorithms in which the most significant changes took place are described in greater detail.
The sub-algorithm for “wide” spike detection is used for spikes if the echo percentage coverage of a given elevation does not exceed a pre-set threshold value. The echo changeability is examined by means of its local variance across and along the radar beam: echoes are classified as “potential” spikes when the variance of reflectivity across the beam is high and low along the beam. This algorithm was described in an earlier paper by Ośródka et al. (2014).
The sub-algorithm for “narrow” spike detection is used to detect spike echoes of small width, i.e. not wider than 5∘. In the first step, for a given radar bin in which a radar echo is observed, the reflectivity values in the bins located at the angular distance from a given azimuth and at the same distance from the radar site are examined if they are sufficiently weak; in this case a potential spike echo is recognized in this bin. This check is repeated for all possible shorter angular distances as well. This algorithm was also described by Ośródka et al. (2014).
The newly introduced sub-algorithm for “discontinuous” spike detection is applied to spike echoes of generally elongated shape but discontinuous along and across the radar beam. The sub-algorithms described above cannot manage with such spikes due to discontinuities in their pattern.
The algorithm consists of two steps: at first potential azimuths with “discontinuous” spikes are detected, then they are confirmed by appropriate changeability of the radar beam. For the lowest elevation the first step is omitted because this scan can be very rainy, so detection of potential spikes may not be efficient, and the azimuths with potential spikes are taken from the neighbouring higher elevation.
In the below procedure for each azimuth α for a given elevation ε (apart from the lowest one) the echo bins are counted along the whole radar beam to obtain the n(ε,α) values:
where N is the number of samplings along the radar beam.
The p(ε,α) value is determined as the larger of the modulus values of differences between n(ε,α) and the values in the adjacent azimuths α−1 and α+1:
Then for the analysed beam α the two means are calculated – and – within the ranges ±4 and ±40, respectively, and the value P(ε,α) is determined:
Potential “discontinuous” spikes are found in the radar beams on azimuths that meet the following condition.
Due to the specific shape of this type of echo, an additional check is introduced in order to smooth the field of relevant potential spikes: azimuth α is considered a potential spike if azimuths α−1 and α+1 are potential ones.
In the final step, bins in azimuths with such potential spike echoes are confirmed for each elevation employing variances calculated across the radar beam , also taking into account the “no echo” values.
where the variance is calculated for reflectivity in dBZ and for reflectivity in mm6 m−3.
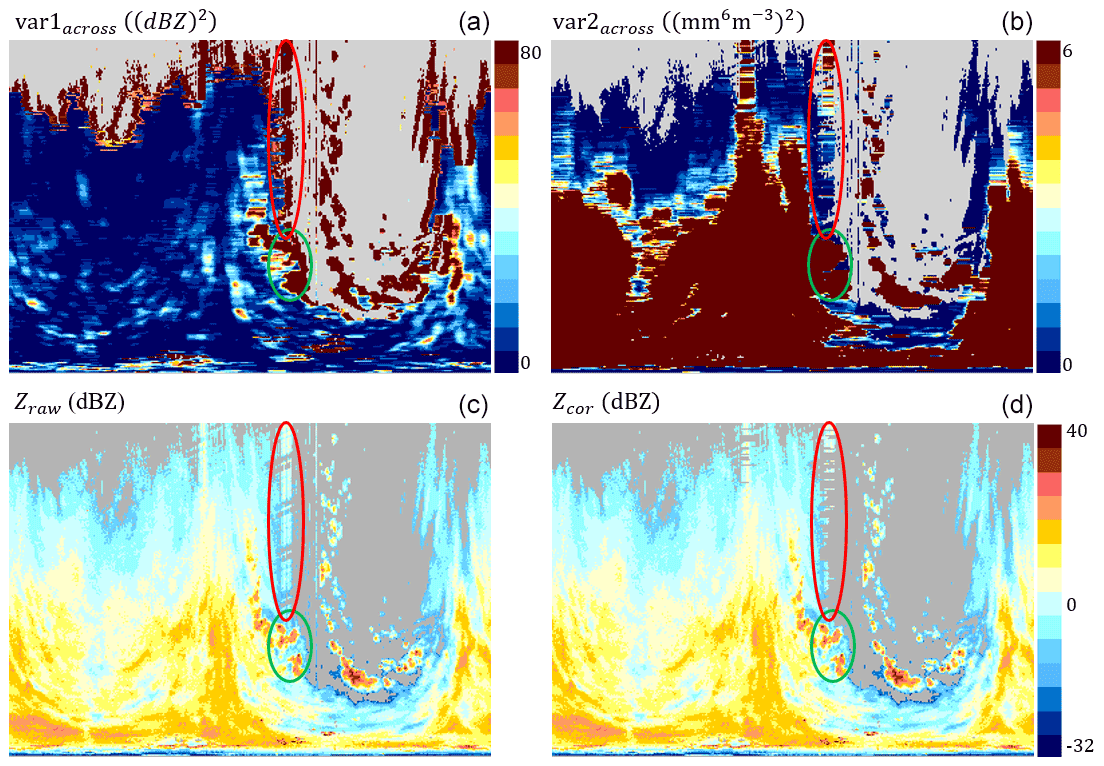
Figure 10Example of the performance of the SPIKE and INTERP algorithms. (a, b) Variances of radar reflectivity across the radar beam calculated (a) in dBZ and (b) mm6 m−3. (c, d) Radar reflectivity in dBZ: (c) raw (Zraw) and (d) corrected (interpolated) (Zcor). In the red ellipse: “discontinuous” spike echoes; in the green ellipse: meteorological echoes correctly not qualified as spikes. Świdwin radar, the lowest elevation, 9 May 2019, 11:00 UTC.
The concept of the above formula is that “discontinuous” spike echoes have a specific variance of radar reflectivity in echoes across the radar beam. The variance calculated in dBZ, hence logarithmic , is high for echoes of this type (Fig. 10, on the left). However, high variance in dBZ is also characteristic of intense meteorological echoes, especially those originating from convective rainfall. On the other hand, in the case of non-logarithmic values (mm6 m−3), the variance of meteorological echoes is relatively high because their values are generally higher and at the same time more internally differentiated than that of spike echoes. Thus, the algorithm for the detection of “discontinuous” spike echoes assumes that they are both characterized by a high variance calculated for reflectivity in dBZ and a relatively low variance calculated for reflectivity in mm6 m−3.
The example in Fig. 10 shows that the criterion associated with high dBZ values clearly indicates radial echoes located south and slightly west as “discontinuous” spikes but also at the edges of clearly meteorological echoes. On the other hand, the criterion based on the values of mm6 m−3 prevents meteorological echoes from classification as potential spike echoes, which could occur in the case of a few small echoes marked by a green ellipse. The red ellipse shows an example of spike echoes. The echoes at the edges of meteorological echoes, which were classified as “potentially” non-meteorological by both conditions, were finally not confirmed as spikes (see paragraph “Verification of potential spike-type echoes”).
The newly introduced sub-algorithm for “shorter longitudinal” spike detection is relatively aggressive, so it is only used for the radars which are extremely burdened with spike echoes, just for the lowest elevation. For the lowest elevation, using the threshold for reflectivity of 7.0 dBZ, for each radar bin , the numbers of successively adjacent bins of reflectivity above the threshold, along size and across size of the given radar beam, are counted. The “shorter longitudinal” spike echo in a bin is detected if the following condition is met.
For the sub-algorithm for “inverse” spike detection, the term “inverse” spike-type echo means an area in this case of decreased reflectivity values in the shape of a spike aimed at the radar site visible on a radar picture. Such echoes are most often the result of beam blocking, but the BLOCK algorithm does not detect them by means of a digital terrain map. This sub-algorithm is used only for the two lowest elevations. For each azimuth the radar bins with potential “inverse” spike echoes are found using the following condition.
This procedure is performed for values of d from 1 to 2.
The SPIKE sub-algorithm verification of potential spike-type echoes is used to check all echoes that have been flagged as “potential” spike echoes, that is, suspected to be non-meteorological echoes. To this aim, for a given azimuth α and elevation ε, the number of bins where “potential” spike echoes have been detected is counted separately for each spike echo type: if a pre-set threshold value has been exceeded, then the bins with “potential” spikes of all types at the azimuth α and elevation ε are recognized as true (confirmed) spikes. An example of detecting spike echoes, including the “wide”, “narrow”, and “inverse”, is shown in Fig. 11. At the locations marked in red (in the bottom figure), where such echoes have been detected, interpolation of the values was performed (see Sect. 5); the result is shown in the picture on the right.
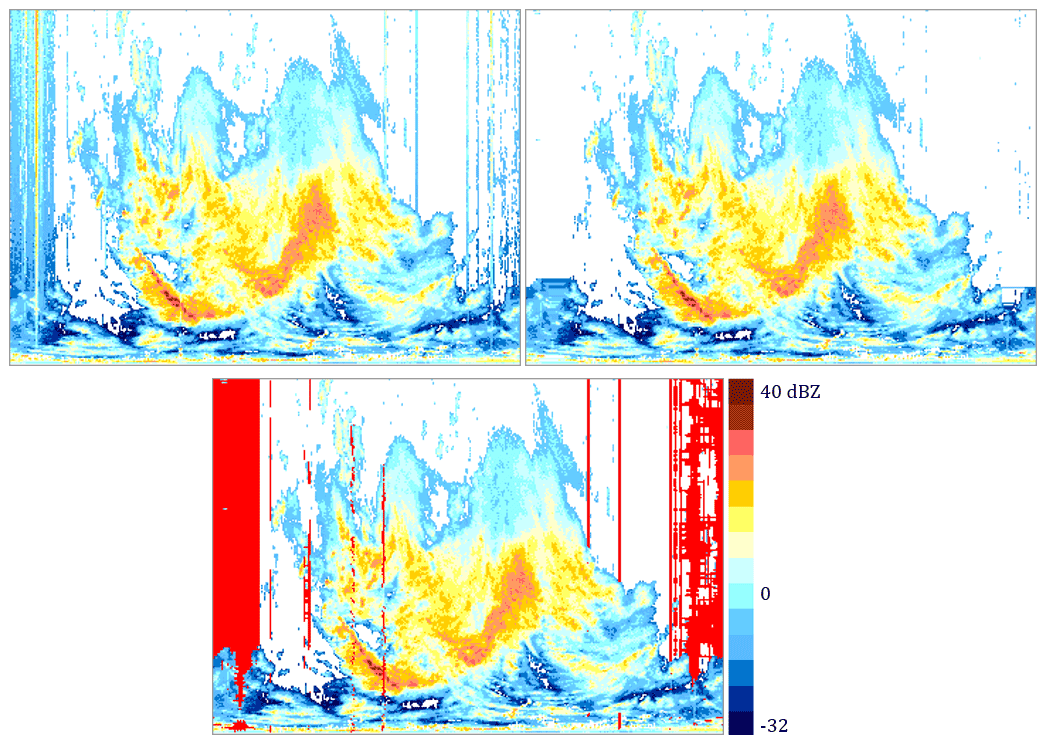
Figure 11An example of detecting spike echoes with the SPIKE algorithm using sub-algorithms for “wide”, “narrow”, and “inverse” spikes (from the top left): raw and corrected data. The bottom shows a mask (in red) of detected spike echoes. Gdańsk radar, the lowest elevation, 30 September 2019, 14:00 UTC.
The QISPIKE quality index for individual radar bins and the whole radar beam in which any type of confirmed spikes has been detected is determined from the following formula, in which the conditions are checked, and after fulfilling the first one from the top, the QI value is decreased, and the procedure is stopped:
Non-meteorological echoes detected with the use of specialized algorithms must be replaced with more reliable values of radar reflectivity. In the RADVOL-QC system this is performed by the INTERP algorithm, which works on radar bins that have been flagged by the algorithms DP.TURBINE, DP.NMET, TURBINE, and SPIKE as being burdened with non-meteorological echoes.
4.1 Removal of RLAN interference detected by the SPIKE algorithm
Values of radar reflectivity flagged as spikes in bins are interpolated in the following way: for a given flagged bin, the bins in adjacent and then the further azimuths (on the left and right) at the same distance to the radar site are checked until unflagged ones are found. The reflectivity value in the analysed bin is determined as an average from both values found on the left and right, but if one of the interpolating values is “no echo” then interpolated value is taken as “no echo” as well.
4.2 Removal of non-meteorological echoes detected by DP.TURBINE, DP.NMET, and TURBINE algorithms
Values in radar bins in which non-meteorological echoes have been detected by algorithm DP.TURBINE, DP.NMET, or TURBINE are spatially interpolated. At the top elevation, echoes in the bins flagged as non-meteorological are removed. At other elevations, flagged adjacent bins are clustered into objects which are divided into ordinary and large ones using a pre-set threshold of 720 bins.
For ordinary objects the interpolation is performed in the following way: for a particular object at elevation ε two values are determined – Zout(ε), the averaged reflectivity in bins closely surrounding the object at a given elevation (ε), and Zin(ε+1), averaged reflectivity from bins corresponding to the position of the object at the neighbouring higher elevation (ε+1). The difference c between the two values
is employed to retrieve corrected data by subtracting this difference from the disturbed values:
For large objects, the difference c is assumed to be zero, and then Eq. (16) takes the simpler form
The verification of the solutions proposed in Sect. 3 is presented along with the descriptions of individual algorithms because the effectiveness of each algorithm should be assessed separately. Moreover, in this section the verification of the performance of the complete RADVOL-QC system is presented.
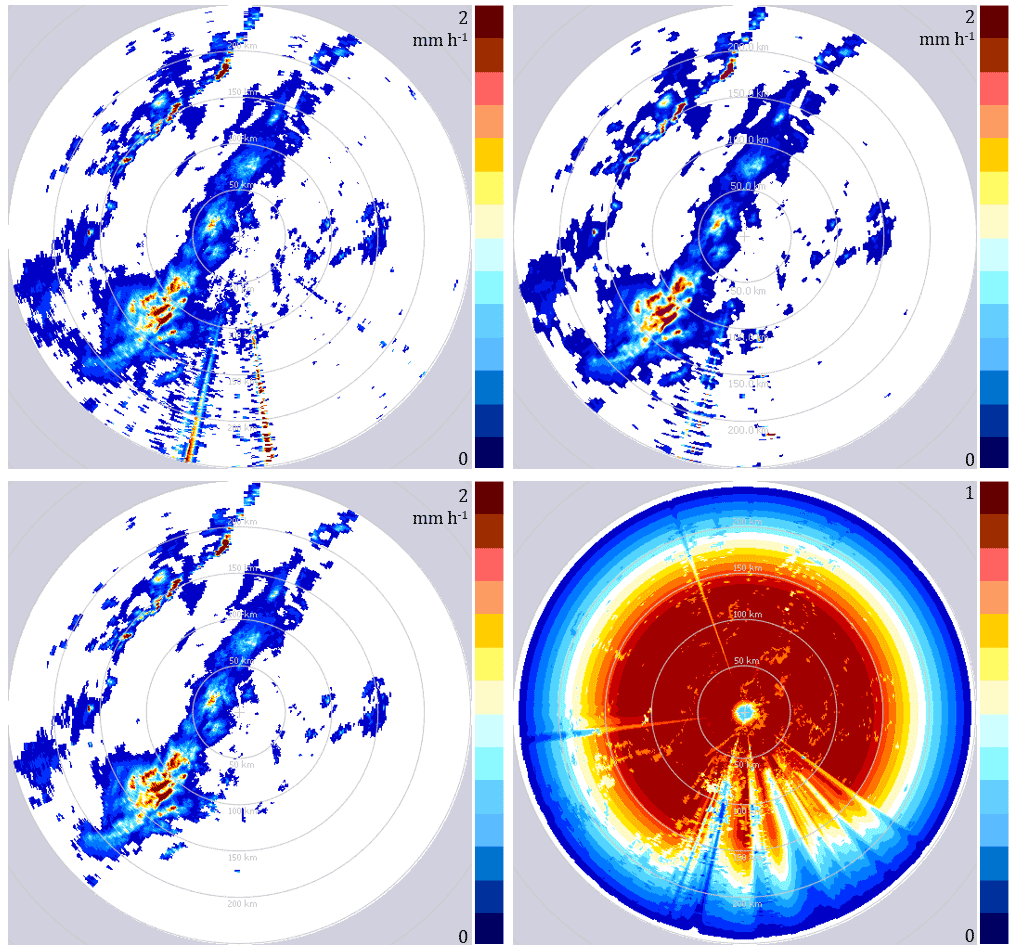
Figure 12Example of RADVOL-QC algorithm performance. From the top left: raw data, data after corrections made with version from 2014; from the bottom left: data after corrections made with current version (2021), and related quality index field. Ramża radar, SRI product, 2 October 2019, 12:10 UTC, range of 250 km.
The effect of disturbances in weather radar data on the uncertainty in the results of the various meteorological and hydrological models ingesting the data, e.g. in assimilation to mesoscale numerical weather prediction models or as an input to hydrological rainfall-runoff models (Sokol et al., 2021), depends on the specific application. It is difficult to carry out one general verification of the effectiveness of algorithms used to quality-control this data.
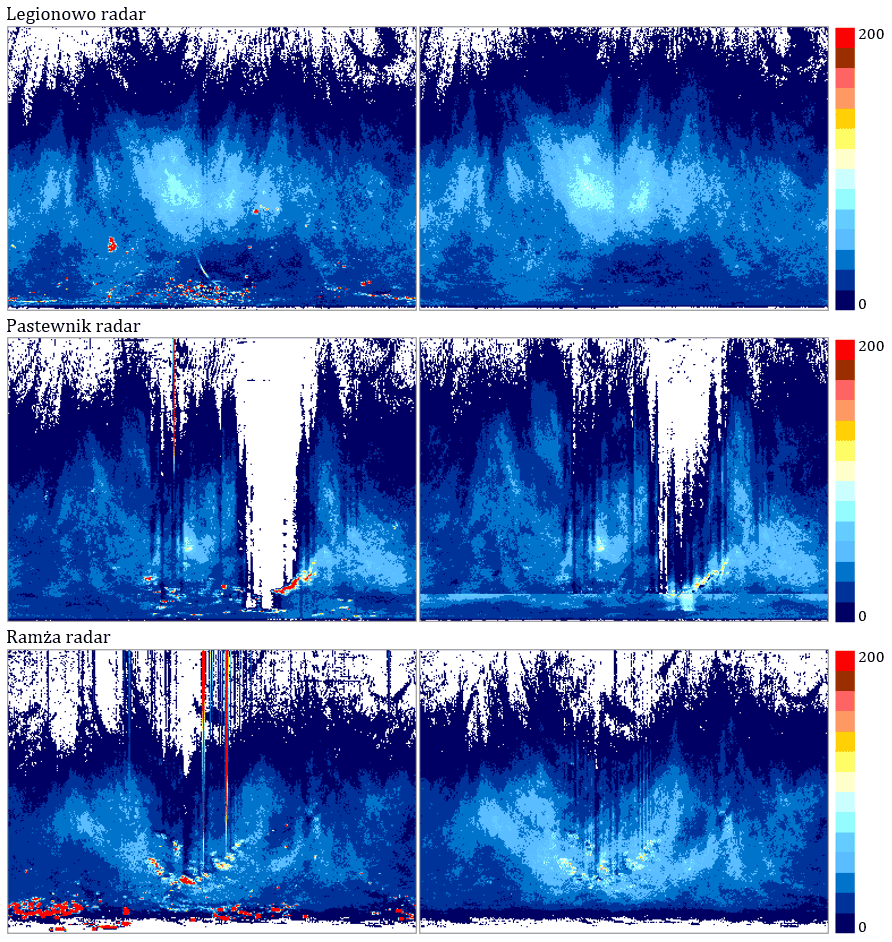
Figure 13The graphs of the number of exceedances of precipitation 1 mm/10 min. From the left: raw data and data after corrections (red denotes over 200 exceedances). POLRAD radars (Legionowo, Pastewnik, and Ramża), the lowest elevations, October 2019.
The simplest form of verification is a visual investigation of the effect of corrections on particular time steps. Figure 12 shows an example of the combined performance of all the algorithms of the RADVOL-QC system. This example is presented in the Cartesian system with the radar site in the centre as the data from a single radar are usually distributed to applications and end users in this form. The surface rainfall intensity (SRI) radar product at the height of 1 km above ground level is employed. In this figure for the Ramża radar, on the left echoes from the following disturbances are visible: several echoes of various types of spikes mainly to the south of the radar site, echoes from the side lobes near the radar, and single non-meteorological echoes observed especially in the eastern part (mainly caused by residential and industrial buildings, hills, and wind farms). In the upper right picture the result of corrections using the RADVOL-QC in the version from 2014 (Ośródka et al., 2014) is shown for comparison, and the lower left picture shows that the current version of the RADVOL-QC system copes with correcting various disturbances in radar data quite effectively.
In the QI field for the same time step, apart from a reduction in the quality of the spike echoes, there is an evident reduction in the QI values in the south – a result of blocking by the mountains at a distance of about 50 km. In addition, worse quality of measurements is clearly visible with increasing distance from the radar site.
The verification can be performed from the perspective of systems issuing warnings about heavy precipitation. The graphs in Fig. 13 show the number of exceedances of the threshold value of 1 mm/10 min at the lowest elevation before and after RADVOL-QC corrections over 1 month; areas with more than 200 alarms are marked in red. It is evident that the corrections prevent the generation of false warnings to a large extent.
All places marked in red can be associated with permanent non-precipitation echoes. These echoes are mainly from mountain areas and large urban centres. For some radars, these are also echoes caused by signals from RLAN antennas (Pastewnik and Ramża radars). The relatively extensive echo visible for the Legionowo radar to the east comes from a large wind farm complex: this is the largest echo from wind turbines visible on the radars of the POLRAD network (see Fig. 8).
Over recent years a significant increase in the number of external disturbances in radar measurements has been observed, especially those related to RLAN signals interfering with C-band radar signals as well as to echoes from turbines and wind farms because their moving parts affect the radar beam in a specific way. On the other hand, a huge advancement in the technology of radar signal processors used in modern weather radars has been observed; these are much better at filtering out non-meteorological echoes than earlier systems, although the problem is still far from being effectively solved.
For these reasons, national meteorological services and various research centres are constantly developing more and more effective algorithms for the detection and removal of non-metrological echoes from radar observations. Software solutions consisting of the analysis of raw 3-D radar data are still an indispensable element of radar data processing systems. Their important feature is that they must be adapted not only to individual types of radars but also to the local conditions in which they are installed. Algorithms that apply an approach to the problem of eliminating non-meteorological echoes involving the detection and correction of each type of disturbance separately must be constantly developed to take into account their new manifestations.
A large part of this study is devoted to such new challenges. This paper does not describe the entire RADVOL-QC system used to quality control data from the Polish weather radar network POLRAD, as it was already published in detail (Ośródka et al., 2014), but only deals with recently introduced new algorithms responding to the increasing importance of various types of disturbances, in particular those resulting from the growing influence of signals from RLAN installations as well as the impact of wind turbines grouped into large farms.
There is no doubt that with the emergence of new sources of disturbance and the intensification of existing ones, sustained work on the development of systems such as RADVOL-QC must be continued in parallel with advances in the technology of radar signal processors.
The weather radar data are processed by the RADVOL-QC software developed at the IMGW-PIB, which owns the economic property rights to the software.
The work described in this article is focused on general processing of weather radar data to improve their quality, not concentrating on a specific data set; thus data have not been attached. Radar data in the form of raw 3D data for individual radars are collected in the EUMETNET OPERA radar database and are available under a license.
KO and JS designed the algorithms of the RADVOL-QC system. KO developed the system code and performed the simulations. JS prepared the manuscript with contributions from the co-author.
The contact author has declared that neither they nor their co-author has any competing interests.
Publisher's note: Copernicus Publications remains neutral with regard to jurisdictional claims in published maps and institutional affiliations.
This paper was edited by Gianfranco Vulpiani and reviewed by two anonymous referees.
Angulo, I., Grande, O., Jenn, D., Guerra, D., and de la Vega, D.: Estimating reflectivity values from wind turbines for analyzing the potential impact on weather radar services, Atmos. Meas. Tech., 8, 2183–2193, https://doi.org/10.5194/amt-8-2183-2015, 2015.
Berenguer, M., Sempere-Torres, D., Corral, C., and Sánchez-Diezma, R.: A fuzzy logic technique for identifying nonprecipitating echoes in radar scans, J. Atmos. Ocean. Tech., 23, 1157–1180, https://doi.org/10.1175/JTECH1914.1, 2006.
Bringi, V. N. and Chandrasekar, V.: Polarimetric Doppler Weather Radar: Principles and Applications, Cambridge University Press, Cambridge, UK, ISBN 978-0-521-62384-1, 2001.
Bringi, V. N., Rico-Ramirez, M. A., and Thurai, M.: Rainfall estimation with an operational polarimetric C-band radar in the United Kingdom: comparison with a gauge network and error analysis, J. Hydrometeorol., 12, 935–954, https://doi.org/10.1175/JHM-D-10-05013.1, 2011.
Cho, Y.-H., Lee, G. W., Kim, K.-E., and Zawadzki, I.: Identification and removal of ground echoes and anomalous propagation using the characteristics of radar echoes, J. Atmos. Ocean. Tech., 23, 1206–1222, https://doi.org/10.1175/JTECH1913.1, 2006.
Einfalt, T., Szturc, J., and Ośródka, K.: The quality index for radar precipitation data – a tower of Babel?, Atmos. Sci. Lett., 11, 139–144, https://doi.org/10.1002/asl.271, 2010.
Fornasiero, A., Alberoni, P. P., Amorati, R., and Marsigli, C.: Improving the radar data mosaicking procedure by means of a quality descriptor, 4th European Conference on Radar in Meteorology and Hydrology, Barcelona, Spain, 18–22 September 2006, 378–381, 2006.
Gourley, J. J., Tabary, P., and Parent du Chatelet, J.: A Fuzzy logic algorithm for the separation of precipitating from nonprecipitating echoes using polarimetric radar observations, J. Atmos. Ocean. Tech., 24, 1439–1451, https://doi.org/10.1175/JTECH2035.1, 2007.
Hood, K., Torres, S., and Palmer, R.: Automatic detection of wind turbine clutter for weather radars, J. Atmos. Ocean. Tech., 27, 1868–1880, https://doi.org/10.1175/2010JTECHA1437.1, 2010.
Huuskonen, A., Saltikoff, E., and Holleman, I.: The operational weather radar network in Europe, B. Am. Meteorol. Soc., 95, 897–907, https://doi.org/10.1175/BAMS-D-12-00216.1, 2014.
Isom, B. M., Palmer, R. D., Secrest, G. S., Rhoton, R. D., Saxion, D., Allmon, T. L., Reed, J., Crum, T., and Vogt, R.: Detailed observations of wind turbine clutter with scanning weather radars, J. Atmos. Ocean. Tech., 26, 894–910, https://doi.org/10.1175/2008JTECHA1136.1, 2009.
Jatho, N., Pluntke, T., Kurbjuhn, C., and Bernhofer, C.: An approach to combine radar and gauge based rainfall data under consideration of their qualities in low mountain ranges of Saxony, Nat. Hazards Earth Syst. Sci., 10, 429–446, https://doi.org/10.5194/nhess-10-429-2010, 2010.
Jurczyk, A., Szturc, J., and Ośródka, K.: Convective cell identification using multi-source data, IAHS Publications, 351, 360–366, 2012.
Jurczyk, A., Szturc, J., and Ośródka, K.: Quality-based compositing of weather radar-derived precipitation, Meteorol. Appl., 27, e1812, https://doi.org/10.1002/met.1812, 2020a.
Jurczyk, A., Szturc, J., Otop, I., Ośródka, K., and Struzik, P.: Quality-based combination of multi-source precipitation data, Remote Sens., 12, 1709, https://doi.org/10.3390/rs12111709, 2020b.
Krajewski, W. F., Vignal, B., Seo, B.-C., and Villarini, G.: Statistical model of the range-dependent error in radar-rainfall estimates due to the vertical profile of reflectivity, J. Hydrol., 402, 306–316, https://doi.org/10.1016/j.jhydrol.2011.03.024, 2011.
Méri, L., Gaál, L., Bartok, J., Gažák, M., Gera, M., Jurašek, M., and Kelemen, M.: Improved radar composites and enhanced value of meteorological radar data using different quality indices, Sustainability, 13, 5285, https://doi.org/10.3390/su13095285, 2021.
Michelson, D., Einfalt, T., Holleman, I., Gjertsen, U., Friedrich, K., Haase, G., Lindskog, M., and Jurczyk, A.: Weather radar data quality in Europe – quality control and characterization, Review, COST Action 717, COST Office, Luxembourg, 87 pp., ISBN 92-898-0018-6, 2005.
Michelson, D., Henja, A., Ernes, S., Haase, G., Koistinen, J., Ośródka, K., Peltonen, T., Szewczykowski, M., and Szturc, J.: BALTRAD advanced weather radar networking, Journal of Open Research Software, 6, 12, https://doi.org/10.5334/jors.193, 2018.
Michelson, D. B., Lewandowski, R., Szewczykowski, M., Beekhuis, H., Haase, G., Mammen, T., and Johnson, D.: EUMETNET OPERA weather radar information model for implementation with the HDF5 file format, Version 2.4, EUMETNET OPERA Document, 2021.
Norin, L.: A quantitative analysis of the impact of wind turbines on operational Doppler weather radar data, Atmos. Meas. Tech., 8, 593–609, https://doi.org/10.5194/amt-8-593-2015, 2015.
Norin, L. and Haase, G.: Doppler weather radars and wind turbines, in: Doppler Radar Observations – Weather Radar, Wind Profiler, Ionospheric Radar, and Other Advanced Applications, edited by: Bech, J. and Chau, J. L., InTech, Rijeka, 333–354, ISBN 978-953-51-0496-4, 2012.
Ośródka, K. and Szturc, J.: Quality-based generation of weather radar Cartesian products, Atmos. Meas. Tech., 8, 2173–2181, https://doi.org/10.5194/amt-8-2173-2015, 2015.
Ośródka, K., Szturc, J., and Jurczyk, A.: Chain of data quality algorithms for 3-D single-polarization radar reflectivity (RADVOL-QC system), Meteorol. Appl., 21, 256–270, https://doi.org/10.1002/met.1323, 2014.
Park, H., Ryzhkov, A. V., Zrnic, D. S., and Kim, K.-E.: The hydrometeor classification algorithm for the polarimetric WSR-88D: description and application to an MCS, Weather Forecast., 24, 730–748, https://doi.org/10.1175/2008WAF2222205.1, 2009.
Peura, M.: Computer vision methods for anomaly removal, 2nd European Conference on Radar Meteorology (ERAD), Delft, Netherlands, Proceedings of ERAD 2002, 312–317, 2002.
Rossa, A., Haase, G., Keil, C., Alberoni, P., Ballard, S., Bech, J., Germann, U., Pfeifer, M., and Salonen, K.: Propagation of uncertainty from observing systems into NWP: COST-731 Working Group 1, Atmos. Sci. Lett., 11, 145–152, https://doi.org/10.1002/asl.274, 2010.
Saltikoff, E., Cho, J. Y., Tristant, P., Huuskonen, A., Allmon, L., Cook, R., Becker, E., and Joe, P.: The threat to weather radars by wireless technology, B. Am. Meteorol. Soc., 97, 1159–1167, https://doi.org/10.1175/BAMS-D-15-00048.1, 2016.
Saltikoff, E., Haase, G., Delobbe, L., Gaussiat, N., Martet, M., Idziorek, D., Leijnse, H., Novák, P., Lukach, M., and Stephan, K.: OPERA the Radar Project, Atmosphere, 10, 320, https://doi.org/10.3390/atmos10060320, 2019.
Sandford, C. and Gaussiat, N.: Use of a radar quality index to mitigate the effects of attenuation at C-band in the UK composite, in: ERAD 2012 – 7th European Conference on Radar in Meteorology and Hydrology, Toulouse, France, 25–29 June 2012.
Seo, B.-C., Krajewski, W. F., and Mishra, K. V.: Using the new dual-polarimetric capability of WSR-88D to eliminate anomalous propagation and wind turbine effects in radar-rainfall, Atmos. Res., 153, 296–309, https://doi.org/10.1016/j.atmosres.2014.09.004, 2015.
Sokol, Z., Szturc, J., Orellana-Alvear, J., Popová, J., Jurczyk, A., and Célleri, R.: The role of weather radar in rainfall estimation and its application in meteorological and hydrological modelling – A review, Remote Sens., 13, 351, https://doi.org/10.3390/rs13030351, 2021.
Steiner, M. and Smith, J. A.: Use of three-dimensional reflectivity structure for automated detection and removal of nonprecipitating echoes in radar data, J. Atmos. Ocean. Tech., 19, 673–686, https://doi.org/10.1175/1520-0426(2002)019<0673:UOTDRS>2.0.CO;2, 2002.
Szturc, J., Ośródka, K., and Jurczyk, A.: Quality control algorithms applied on weather radar reflectivity data, in: Doppler Radar Observations – Weather Radar, Wind Profiler, Ionospheric Radar, and Other Advanced Applications, edited by: Bech, J. and Chau, J. L., InTech, Rijeka, 289–306 ISBN 978-953-51-0496-4, 2012.
Szturc, J., Jurczyk, A., Ośródka, K., Wyszogrodzki, A., and Giszterowicz, M.: Precipitation estimation and nowcasting at IMGW (SEiNO system), Meteorology Hydrology and Water Management, 6, 3–12, https://doi.org/10.26491/mhwm/76120, 2018.
Villarini, G. and Krajewski, W. F.: Review of the different sources of uncertainty in single polarization radar-based estimates of rainfall, Surv. Geophys., 31, 107–129, https://doi.org/10.1007/s10712-009-9079-x, 2010.
Zhang, J., Howard, K., Langston, C., Vasiloff, S., Kaney, B., Arthur, A., Cooten, S. V., Kelleher, K., Kitzmiller, D., Ding, F., Seo, D.-J., Wells, E., and Dempsey, C.: National Mosaic and multi-sensor QPE (NMQ) system: description, results, and future plans, B. Am. Meteorol. Soc., 92, 1321–1338, https://doi.org/10.1175/2011BAMS-D-11-00047.1, 2011.
- Abstract
- Introduction
- Description of the RADVOL-QC system for the Polish weather radar network
- New solutions for the detection of non-meteorological echoes
- Correction of detected non-meteorological echoes – INTERP algorithm
- Verification
- Conclusions
- Code availability
- Data availability
- Author contributions
- Competing interests
- Disclaimer
- Review statement
- References