the Creative Commons Attribution 4.0 License.
the Creative Commons Attribution 4.0 License.
 | 10 May 2022
Identification, monitoring, and reaction kinetics of reactive trace species using time-resolved mid-infrared quantum cascade laser absorption spectroscopy: development, characterisation, and initial results for the CH2OO Criegee intermediate
Zara S. Mir
Matthew Jamieson
Nicholas R. Greenall
Paul W. Seakins
Mark A. Blitz
The chemistry and reaction kinetics of reactive species dominate changes to the composition of complex chemical systems, including Earth's atmosphere. Laboratory experiments to identify reactive species and their reaction products, and to monitor their reaction kinetics and product yields, are key to our understanding of complex systems. In this work we describe the development and characterisation of an experiment using laser flash photolysis coupled with time-resolved mid-infrared (mid-IR) quantum cascade laser (QCL) absorption spectroscopy, with initial results reported for measurements of the infrared spectrum, kinetics, and product yields for the reaction of the CH2OO Criegee intermediate with SO2. The instrument presented has high spectral (< 0.004 cm−1) and temporal (< 5 µs) resolution and is able to monitor kinetics with a dynamic range to at least 20 000 s−1. Results obtained at 298 K and pressures between 20 and 100 Torr gave a rate coefficient for the reaction of CH2OO with SO2 of (3.83 ± 0.63) × 10−11 cm3 s−1, which compares well to the current IUPAC recommendation of × 10−11 cm3 s−1. A limit of detection of 4.0 × 10⁻⁵, in absorbance terms, can be achieved, which equates to a limit of detection of ∼ 2 × 1011 cm−3 for CH2OO, monitored at 1285.7 cm−1, based on the detection path length of (218 ± 20) cm. Initial results, directly monitoring SO3 at 1388.7 cm−1, demonstrate that SO3 is the reaction product for CH2OO + SO2. The use of mid-IR QCL absorption spectroscopy offers significant advantages over alternative techniques commonly used to determine reaction kinetics, such as laser-induced fluorescence (LIF) or ultraviolet absorption spectroscopy, owing to the greater number of species to which IR measurements can be applied. There are also significant advantages over alternative IR techniques, such as step-scan FT-IR, owing to the coherence and increased intensity and spectral resolution of the QCL source and in terms of cost. The instrument described in this work has potential applications in atmospheric chemistry, astrochemistry, combustion chemistry, and in the monitoring of trace species in industrial processes and medical diagnostics.
- Article
(2635 KB) - Full-text XML
- BibTeX
- EndNote


The behaviour of reactive intermediates is critical to understanding the chemistry of complex systems. In the gas phase, reactive intermediates govern the chemistry and composition of planetary atmospheres (Blitz and Seakins, 2012) and the interstellar medium and star-forming regions (Herbst, 2001) as well as control combustion processes and autoignition (Pilling et al., 1995; Zador et al., 2011). In the Earth's atmosphere, the chemistry of reactive intermediates determines the rate at which compounds emitted into the atmosphere are removed and transformed into other species and thus drives changes to air quality and climate (Monks, 2005; Von Schneidemesser et al., 2015).
Experimental investigation of the spectroscopy, kinetics, and reaction mechanisms of reactive intermediates is key to understanding the behaviour of such species, requiring sensitive and specific detection techniques capable of monitoring changes in concentrations during the course of reactions commonly occurring on microsecond to millisecond timescales. Flash photolysis experiments, in which a reactive species is generated rapidly by a brief pulse of light from a flashlamp or, more commonly, a laser and then monitored throughout its subsequent reactions, have enabled the study of many reactions of interest. However, while the flash photolysis method can be coupled to a wide range of techniques to determine the kinetics of a reaction, limitations remain, particularly surrounding the identification of reaction products and measurements of product yields (Seakins, 2007).
For the study of fast reactions, spectroscopic or mass-spectrometric techniques are typically required to provide the necessary time resolution. Laser-induced fluorescence (LIF) spectroscopy has been demonstrated to have both high sensitivity and specificity for the measurement and identification of reactants and products but is not an absolute technique and so requires either calibration or the use of an internal standard to determine yields (Carr et al., 2007). Moreover, LIF can only be applied to the relatively small number of species that exhibit fluorescence spectra. Mass spectrometry can be applied more widely, particularly if soft-ionisation techniques such as photoionisation are employed, but such techniques can be costly and require sampling of a reaction mixture into an ionisation and detection region, which can limit investigations to low-pressure regimes (Fockenberg et al., 1999; Blitz et al., 2007; Osborn et al., 2008; Middaugh et al., 2018). Absorption techniques can therefore be beneficial as these can provide absolute measurements over a wide range of temperatures and pressures.
Absorption measurements based on ultraviolet (UV) spectroscopy have been used successfully to measure the kinetics of a broad variety of reactions, with advantages for radical–radical reactions where absolute concentrations are required. While UV absorption spectra can be relatively broad and featureless (Orlando and Tyndall, 2012), developments in the use of broadband light sources have enabled the separation of multiple absorbing species with overlapping spectra (Cossel et al., 2017), particularly if any of the spectra display a distinctive vibronic structure. Multipass (Lewis et al., 2018) and cavity-enhanced techniques (Cossel et al., 2017) can also offer significant improvements to sensitivity. However, UV absorption experiments are typically employed to monitor changes in reactant concentrations to determine reaction kinetics, but identification of products and measurement of product yields are often not possible owing to a lack of suitable UV absorption features or low UV absorption cross-sections for product species. There is thus interest in the development and use of infrared (IR) techniques which, despite lower absorption cross-sections compared to the UV, have the potential to be implemented more extensively since most species exhibit some features in the IR region of the spectrum, with IR spectroscopy offering the potential for structural determination and unique identification of reactants and products. Infrared absorption techniques are also often advantageous over other spectroscopic methods, particularly at relatively low temperatures and pressures, since IR transitions are typically not dissociative (Taatjes and Hershberger, 2001; Hodgkinson and Tatam, 2013) and as a result do not suffer lifetime broadening or probe-induced photochemistry. Additionally, Doppler broadening in the IR is less problematic than in the UV or visible, leading to better resolution of closely spaced features (Taatjes and Hershberger, 2001; Hodgkinson and Tatam, 2013).
For many reactions of atmospheric interest, products have been determined by long-path Fourier transform infrared (FT-IR) absorption spectroscopy in atmospheric simulation chambers used to study reactions at a mechanistic level (Doussin et al., 1997; Glowacki et al., 2007; Nilsson et al., 2009; Seakins, 2010), but this method has relatively poor time resolution compared to direct studies of elementary reactions. Such studies can be influenced by secondary chemistry and wall reactions, which may transform reactive products into more stable species on the timescale of the experiment. Step-scan FT-IR experiments (Su et al., 2013; Huang et al., 2007), in which spectra are recorded at successive time points during the course of a reaction, offer improved time resolution and aid direct identification of reaction products. However, step-scan FT-IR has relatively poor sensitivity and spectral resolution compared to other techniques and is not typically employed to investigate reaction kinetics owing to the length of time required to record a suitable time profile.
Diode lasers (Taatjes and Hershberger, 2001), quantum cascade lasers (QCLs) (Faist et al., 1994; Hofstetter and Faist, 2003; Yao et al., 2012; Zhang et al., 2014; Pecharroman-Gallego, 2013), and frequency comb lasers (Fleisher et al., 2014; Bjork et al., 2016; Roberts et al., 2020) can be used to give both high spectral resolution and high temporal resolution and can be applied to measurements of transient species. Frequency comb lasers can provide extremely high-resolution spectra, but there are, at present, relatively few examples (Bjork et al., 2016) of their application in chemistry and chemical kinetics owing to relatively high cost and complexity of the experimental set-up. In contrast to mid-IR lead salt diode lasers, mid-infrared QCLs do not require cryogenic operation and do not suffer issues related to mode-hopping, uneven diode quality, or unpredictable tunability (Hodgkinson and Tatam, 2013). The spectral output of QCLs can be tailored to transitions over a wide range, providing access to regions of the spectrum not readily accessible with diode lasers or frequency comb lasers (Shahmohammadi et al., 2019; Yao et al., 2012; Zhang et al., 2014). QCLs have high output powers and can reach several hundred milliwatts to ∼ 1 W (Hodgkinson and Tatam, 2013; Pecharroman-Gallego, 2013; Yao et al., 2012; Zhang et al., 2014), compared to typical powers of a few milliwatts for diode lasers (Hodgkinson and Tatam, 2013), and absorbances on the order of 10−6 have been reported for QCL-based infrared absorption experiments for stable species (Borri et al., 2006). The high resolution, specificity, and sensitivity of QCL-based absorption techniques have led to the development of a number of field instruments for detection of trace species in the atmosphere (Li et al., 2013; Du et al., 2019), including CH4 (McManus et al., 2010; Kostinek et al., 2019), CO2 (Kostinek et al., 2019), OCS (Mcmanus et al., 2010), N2O (Mcmanus et al., 2010; Banik et al., 2017; Kostinek et al., 2019), H2O (Mcmanus et al., 2010), HCOOH (Herndon et al., 2007), and HONO (Cui et al., 2019), which can be challenging to monitor by other methods. The high power and spectral resolution of QCL light sources, enabling sensitive and specific experiments in regions of the spectrum characterised by strong fundamental transitions, have also led to interest from the chemical kinetics community.
QCLs consist of layers of semiconductor material that create a series of coupled quantum wells in which the layer thickness determines the depth of the quantum well and thus the energy of emitted photons (Yao et al., 2012; Faist et al., 1994). In contrast to diode lasers, which involve electronic transitions between conduction and valence bands, laser action in QCLs involves intersub-band transitions within the conduction band, typically via a three-level system (Yao et al., 2012; Gmachl et al., 2001; Curl et al., 2010). In the absence of an electric field, electrons are confined in the quantum wells within an injector region. When an electric field is applied, the quantum wells within the injector region align, and electrons are injected into an upper intersub-band state, creating a population inversion with an intermediate level. Relaxation of electrons to a lower intersub-band state, resulting in photon emission, followed by rapid tunnelling of electrons from the lower intersub-band state into the injector region of the next layer creates a cascade of electrons as the layer structure is traversed, leading to increased photon emission and significant optical gain (Yao et al., 2012). Broadband emission can be achieved using external cavity (EC) QCLs, which can give coverage of several hundred wavenumbers, or Fabry–Perót (FP) QCLs, giving coverage of ∼ 50 cm−1, while single-mode emission relevant to this work is achieved using distributed feedback (DFB) QCLs (Shahmohammadi et al., 2019). For emission in the mid-IR, DFB QCLs can be operated at room temperature, with control of the temperature of the semiconductor and the applied current allowing fine-tuning of the laser output within a range of ∼ 5 cm−1 (Shahmohammadi et al., 2019).
Pulsed QCLs have been used to measure the production of CO in the combustion of n-heptane (Nasir and Farooq, 2019) and have been used to determine the IR absorption spectrum and cross-sections of the Criegee intermediate CH2OO (Chang et al., 2017, 2018b; Luo et al., 2018a). CH2OO is a reactive species produced in the atmosphere during the ozonolysis of unsaturated volatile organic compounds (VOCs) that has been of recent interest as a result of developments in photolytic sources (Welz et al., 2012) for detailed laboratory studies which have revealed a more significant role in atmospheric chemistry than previously expected (Chhantyal-Pun et al., 2020; Percival et al., 2013). Quasi-continuous QCLs, pulsed QCLs in which the pulse period is relatively long compared to the lifetime of the species under investigation, have also been used to investigate the spectra and kinetics of CH2OO (Chang et al., 2018a), and continuous-wave (cw) QCLs have been used to investigate the kinetics of CH2OO (Luo et al., 2018b, 2019; Li et al., 2019, 2020) and other larger Criegee intermediates (Luo et al., 2018b) as well as the spectroscopy and kinetics of the atmospherically important peroxy radicals HO2 (Miyano and Tonokura, 2011; Sakamoto and Tonokura, 2012) and CH3O2 (Chattopadhyay et al., 2018). While mid-IR QCLs have been employed to study the kinetics and spectroscopy of reactive species relevant to atmospheric chemistry, there are still few examples of the use of QCL-based techniques to identify reaction products and to determine product yields.
In this work, we report the development, characterisation, and initial results from a robust and economical experiment using laser flash photolysis coupled with time-resolved mid-infrared QCL absorption spectroscopy that can be applied to a wide range of problems in atmospheric chemistry and beyond. We describe the experimental set-up (Sect. 2), time-averaged measurements of absorption spectra of stable species (Sect. 3), and time-resolved measurements of photolytically generated species and reaction products (Sect. 4) that can be used to determine spectra of reactive species as well as reaction kinetics and product yields. Factors affecting the limit of detection are also discussed (Sect. 5).
A schematic of the experimental set-up is given in Fig. 1. The reaction cell has been used previously in IR diode laser experiments (Qian et al., 2000, 2001; Choi et al., 2006) and consisted of a central cylindrical stainless steel cell 70 cm in length and with an internal diameter of 40 mm, connected via bellows at each end to stainless steel sections 15 cm in length and with an internal diameter of 7 cm, which are furnished with 60 mm diameter UV grade CaF2 windows (Crystran).
Reagent gases, such as NO (BOC special gases, 99.5 %) and SO2 (Sigma-Aldrich, 99.9 %) (Sect. 4), were prepared manometrically at known concentrations in N2 and stored in glass bulbs before mixing with N2 (BOC, 99.99 %), and in some cases O2 (BOC, 99.999 %), in a stainless steel mixing line at known flow rates determined by calibrated mass flow controllers (Tylan, 2900 series). For experiments involving species in the liquid phase at room temperature, such as CH3I (Sigma-Aldrich, 99 %) and CH2I2 (Sigma-Aldrich, 99 %) (Sects. 3 and 4), the liquid was contained within a bubbler held at 0 ∘C and entrained into the vapour phase by passing a known flow of N2 through the bubbler, which was subsequently combined with the main gas flow in the mixing line. Gas mixtures prepared in the mixing line were passed into the reaction cell via one of the end sections, with the other end section connected to a rotary pump (Edwards E2M28). The total pressure in the cell was monitored by a capacitance manometer (MKS Instruments, 626A) and controlled by throttling the exit of the cell to the pump, with cell pressures from < 5 Torr to above atmospheric pressure achievable. Experiments reported in this work were performed at room temperature, although temperature control of the reaction cell is possible by surrounding the cell with ceramic heaters (Watlow, WATROD tubular heater), a bath filled with an appropriate solvent (e.g. methanol) chilled by a refrigerated immersion probe (LabPlant refrigerated immersion probe, RP-100CD), or a dry ice slush bath (Choi et al., 2006), all of which are available in this laboratory.
For experiments involving reactive species generated by photolysis, chemistry within the cell was initiated by the fourth harmonic of an Nd:YAG laser (Continuum Powerlite 8010), giving 266 nm (typical fluence 30 mJ cm−2). The photolysis beam has diameter ∼ 1 cm and was aligned through the centre of the reaction cell using a pair of mirrors (Thorlabs NB1-K04). For all experiments reported in this work, the repetition rate of the photolysis laser was set to 1 Hz, and the flow rate through the reaction cell was sufficiently high to ensure that a fresh gas mixture was photolysed for each photolysis shot.
Infrared probe radiation was provided by one of two cw mid-IR DFB QCLs, depending on the application, providing radiation at wavenumbers of ∼ 1286 cm−1 (∼ 7.77 µm) (Alpes Lasers) and ∼ 1390 cm−1 (∼ 7.19 µm) (Thorlabs) with a tuning range of ∼ 5 cm−1 around each centre. Temperature and current control of the QCL, which determines the precise output wavenumber of a given QCL, were controlled by a combined laser current and thermoelectric (TEC) controller (Thorlabs, ITC4002QCL). The current and TEC controller was operated in constant-current mode, which provides current control up to 2 A in 0.1 mA steps with accuracy ± (0.1 % + 800 µA) and stability < 150 µA, and temperature control between 123 and 423 K in 0.001 K steps with stability < 0.002 K.
QCLs were housed in high heat load (HHL) packages, which were each integrated with a ZnSe aspheric lens to collimate the output beam (divergence < 6 mrad) and mounted on a heat sink (Hamamatsu HHL mount, A117909-1) to dissipate excess heat. Mounted QCLs were positioned on a pitch-and-yaw stage (Thorlabs, PY003/M) on an adjustable-height platform (Thorlabs, C1519/M) to aid alignment through two adjustable aperture irises (Thorlabs, ID8/M) which were separated by >70 cm. A collimated laser diode operating at 635 nm (Thorlabs, CPS635R) was co-aligned through the irises via a mirror (Thorlabs, PF10-03-G01) on a flip mount (Thorlabs, FM90/M) to guide alignment of the QCL beam through the reaction cell. A pair of 1′′ Al mirrors (Thorlabs, PF10-03-G01), situated after the second iris, were used to direct the beam into the reaction cell, with the beam focussed into the centre of the cell by a 1′′ ZnSe plano-convex lens (focal length 1000 mm, Thorlabs, LA7753-G).
The probe IR beam was aligned through the cell in a multipass arrangement to increase the total path length and sensitivity, with the mirrors reflecting the probe beam external to the cell. Custom-built mirror mounts with a central 12 mm hole were located exterior to the cell and were used to mount six Ag mirrors (12 mm diameter, 2.4 m radius of curvature, Knight Optical) in a circular arrangement at each end of the cell, similarly to the arrangement previously described for the multipass UV absorption experiment in this laboratory (Lewis et al., 2018). These mirrors can be aligned independently of each other via three alignment screws for each mirror and enable up to 13 passes through the reaction cell. On the final pass of the IR probe beam through the cell the beam was directed onto a 1′′ Au off-axis parabolic mirror (reflected focal length 4′′, Thorlabs, MPD149-M01) and focussed onto the detector. The detector was a DC-coupled photovoltaic mercury–cadmium–telluride (MCT) detector (Vigo System, PVMI-3TE-8-2x2-TO8-wBaF2-35), integrated with a pre-amplifier (Vigo System, MIP-DC-100k-F-M4) with bandwidth up to 100 kHz.
The signal was transferred to an oscilloscope via a sheathed BNC cable for data collection and processing, with the settings on the oscilloscope dictating the time resolution of the experiment. For measurements of stable species, all spectra reported in this work were recorded using a traditional oscilloscope (LeCroy WaveRunner-2, LT262, 350 MHz, 1 GS s−1 sample rate, 8 bit resolution), while for reactive species produced in photolytic experiments, the use of a PicoScope (Pico Technology, PicoScope 6402C, 250 MHz, 5 GS s−1 sample rate, 12 bit resolution) was also investigated. Data acquisition is discussed further in Sects. 4 and 5.
Synchronisation of the photolysis laser and oscilloscope was achieved using a custom-built digital delay generator based on National Instruments hardware, with the overall experiment and data collection controlled by custom LabVIEW software. In addition to measurements of the probe intensity as a function of time at a fixed QCL output wavenumber, the software enabled stepping of the current applied to the QCL at a set temperature to vary the output wavenumber, which is used to measure the variation in the probe intensity across the tuning range with and without a sample present to determine the spectra of stable species. For reactive species produced by, or following, photolysis, the average pre- and post-photolysis intensities were determined over specified time ranges at each current setting to give the absorption spectrum. Further details are given in Sect. 4.
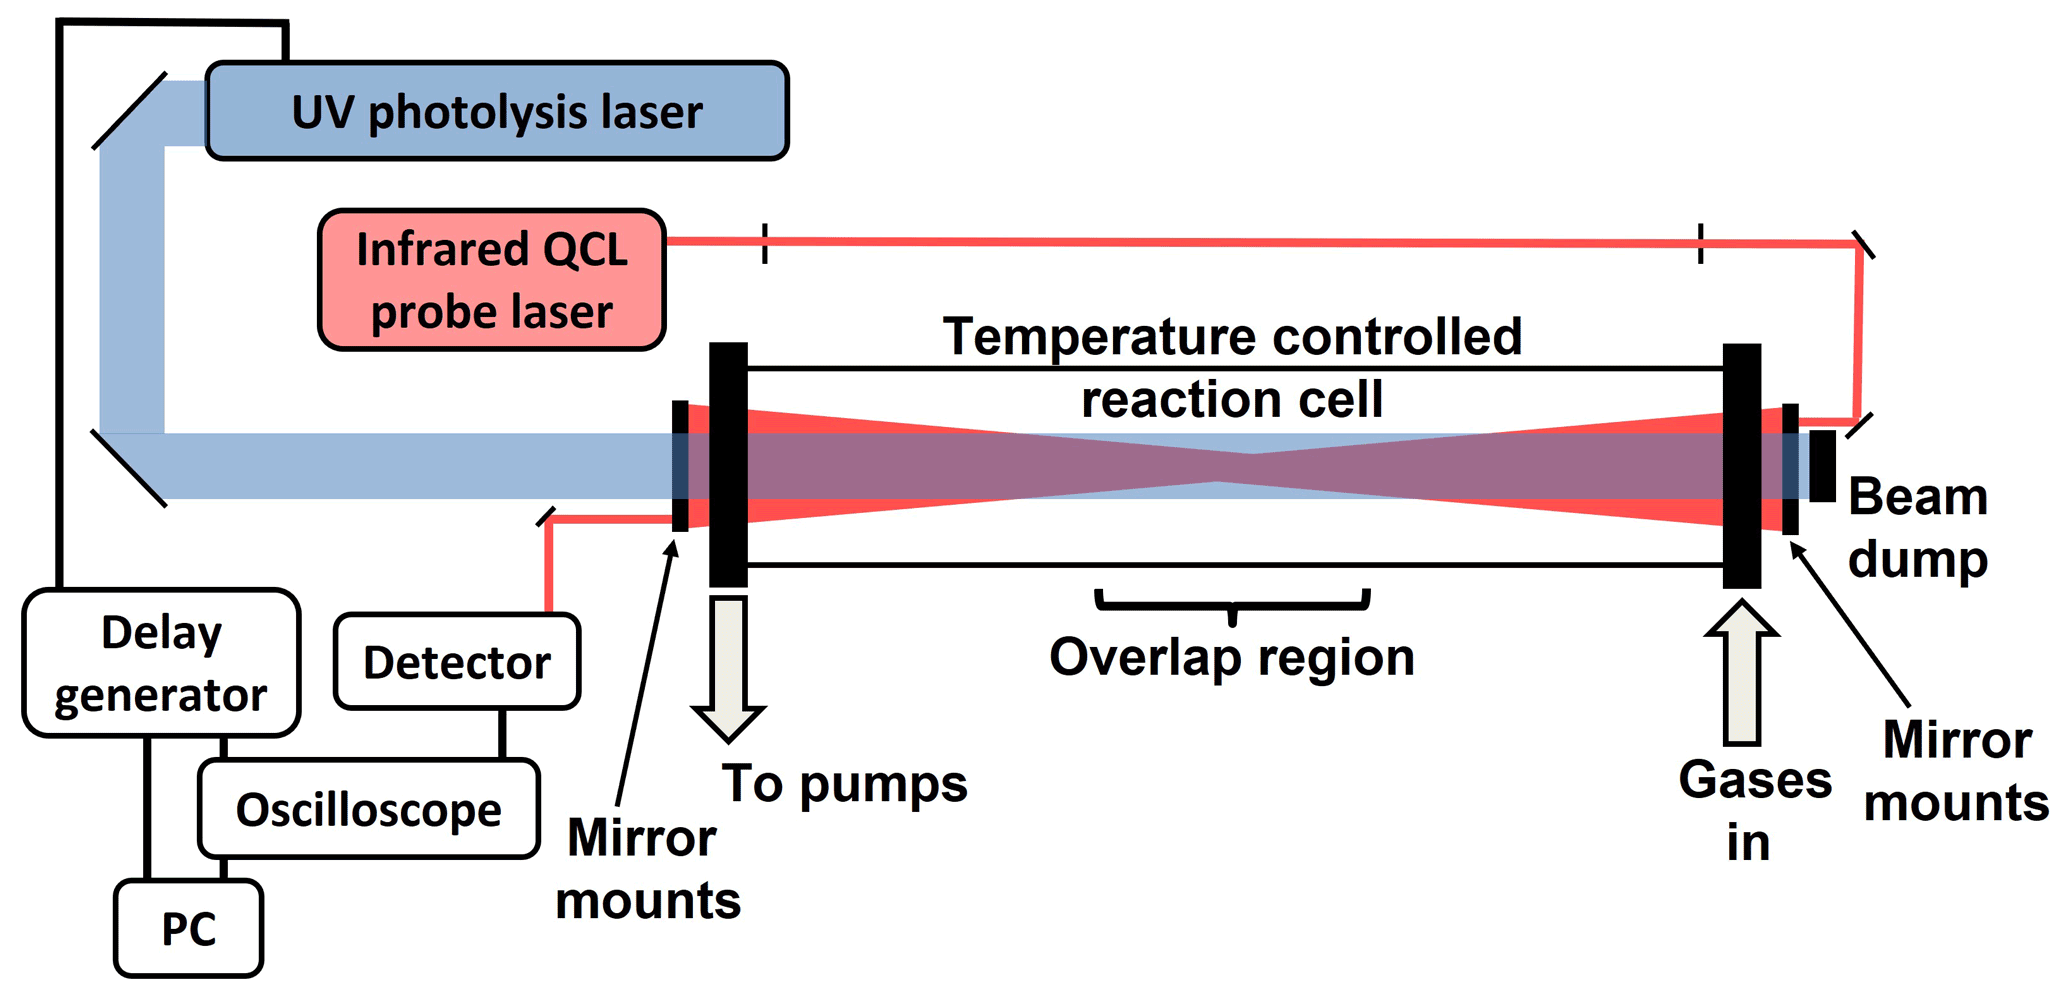
Figure 1Schematic of the experimental apparatus. The probe beam passes through the reaction cell multiple times, with mirrors in a circular arrangement on the mounts positioned at each end of the cell such that the probe passes from the top of the cell to the bottom or from left to right in any individual pass through the cell, resulting in the overlap between the photolysis and probe beams occurring in the centre of the cell.
Characterisation of the output wavenumber of the QCL was achieved through measurement of the absorption spectra of stable species with well-defined rovibrational spectra. Spectra for SO2 and CH3I were recorded by measuring the variation in QCL intensity across the tuning range of the QCL for the cell filled with N2 and for the cell filled with a mixture of N2 and the species of interest under otherwise identical conditions. The absorbance at each wavenumber was calculated from the Beer–Lambert law (Eq. 1):
where and are the intensities at wavenumber without and with the species of interest present, respectively; is the absorption cross-section at wavenumber ; [C] is the concentration; and l is the path length of the IR probe beam through the sample. In measurements of stable species in experiments in which no photolysis takes place, the total path length can be determined from the geometry of the cell and optical arrangement and was ∼ 13 m for the measurements discussed here.
Figure 2 shows the normalised observed absorbance spectrum for SO2 alongside the comparison to the normalised spectrum available on the HITRAN database (Gordon et al., 2017; Kochanov et al., 2019) to illustrate the calibration of the QCL output wavenumber with the current. The measured spectrum indicates the capacity for high-resolution measurements made possible by the narrow laser linewidth.
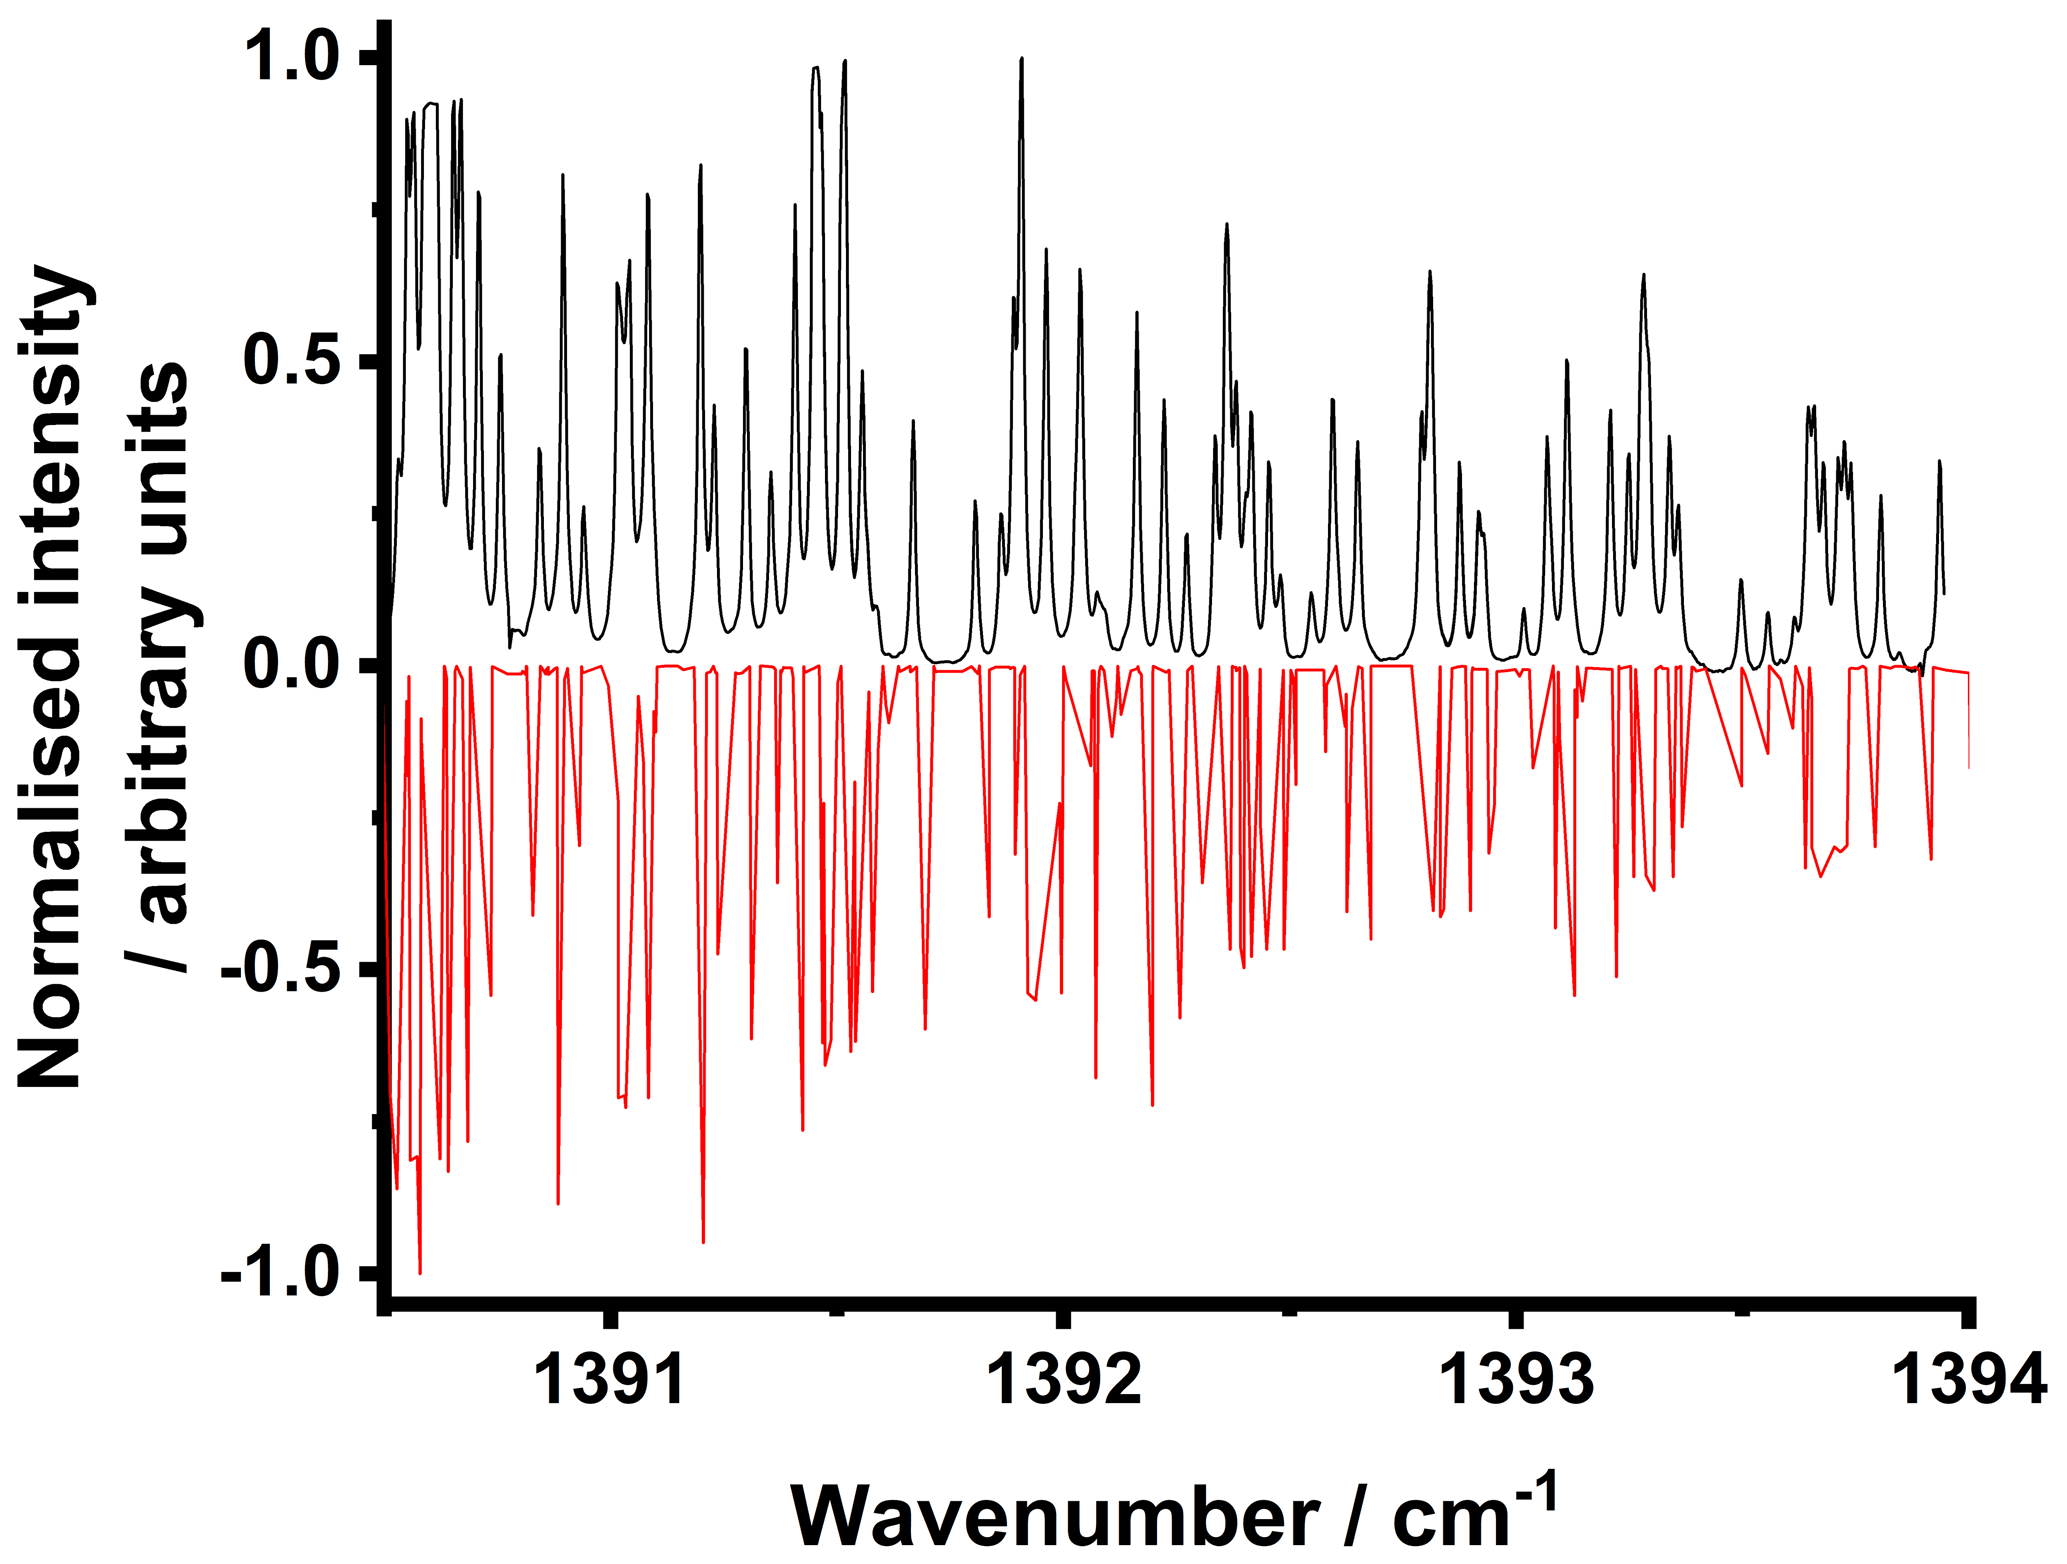
Figure 2Normalised observed spectrum (black) for SO2 with the corresponding normalised spectrum reported on the HITRAN database (Gordon et al., 2017; Kochanov et al., 2019) (multiplied by −1) (red). HITRAN data are given as line intensities and thus do not account for any line broadening.
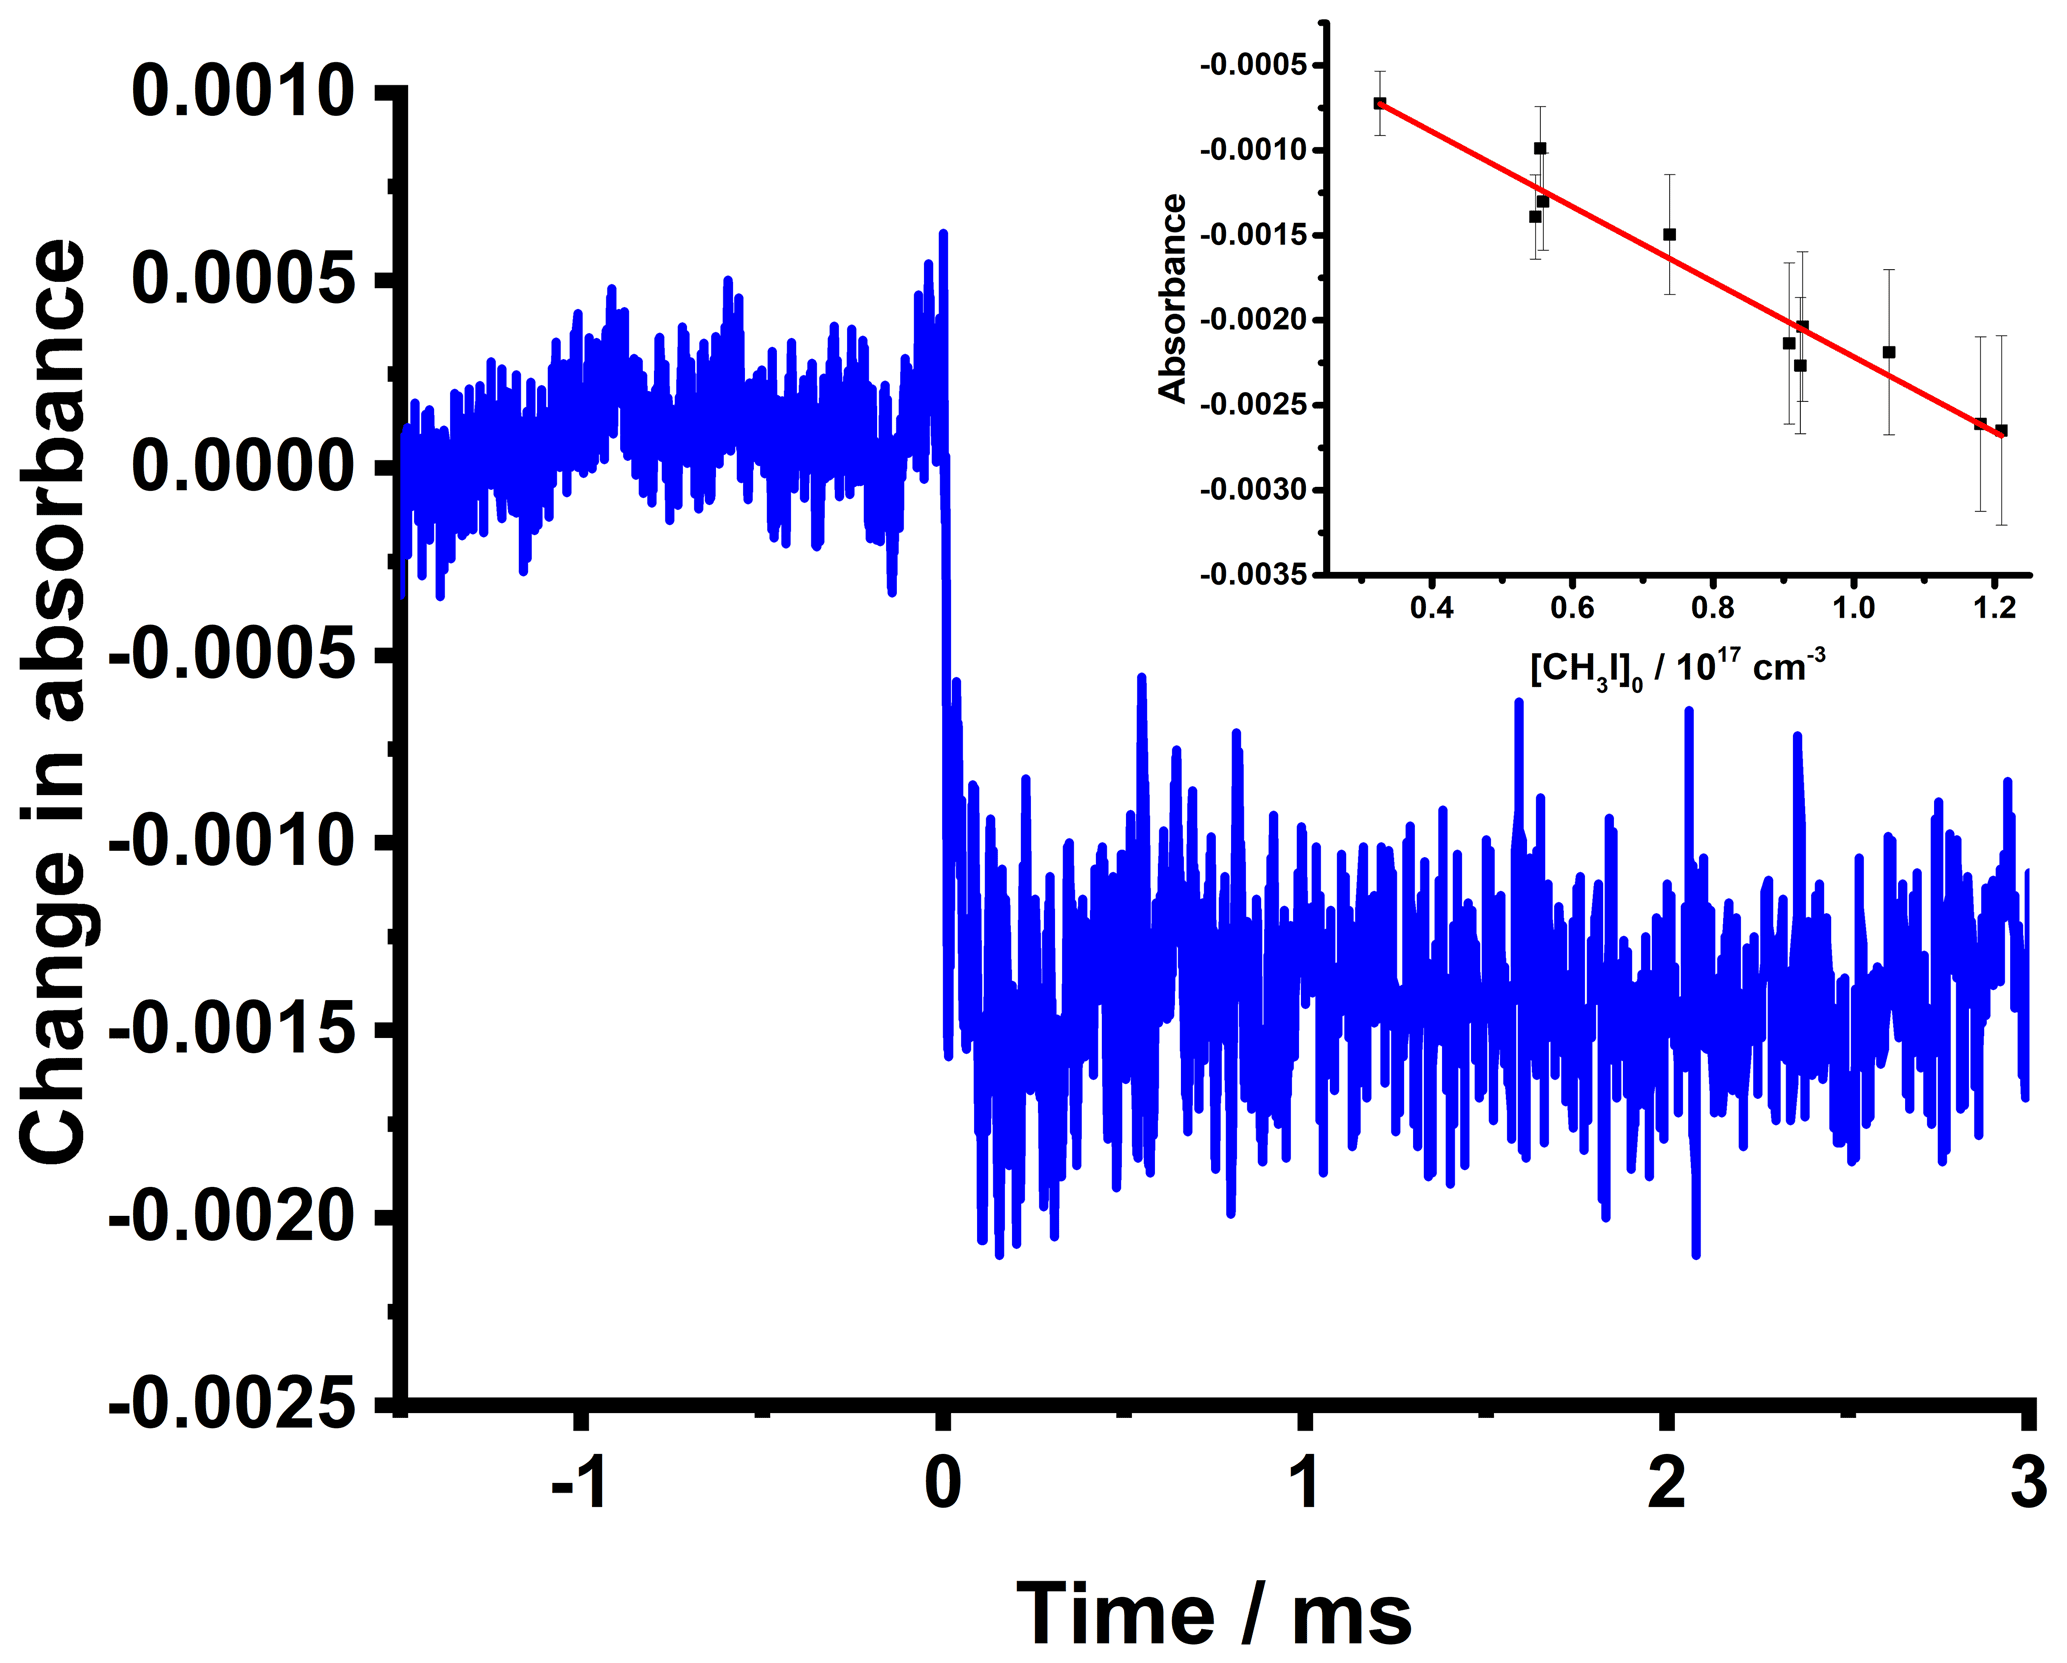
Figure 3Changes in absorbance at ∼ 1287 cm−1 observed on 266 nm photolysis of CH3I. For the data shown in the main figure, [CH3I] cm−3, p=50 Torr, and laser fluence is 30 mJ cm−2. The data shown are the means of 200 photolysis shots. The inset shows the average post-photolysis (0.5 ms 3 ms) change in absorbance as a function of the initial CH3I concentration (black points) with the line of best fit (red). The pre-photolysis region for these experiments was defined as −1.5 ms < ms.
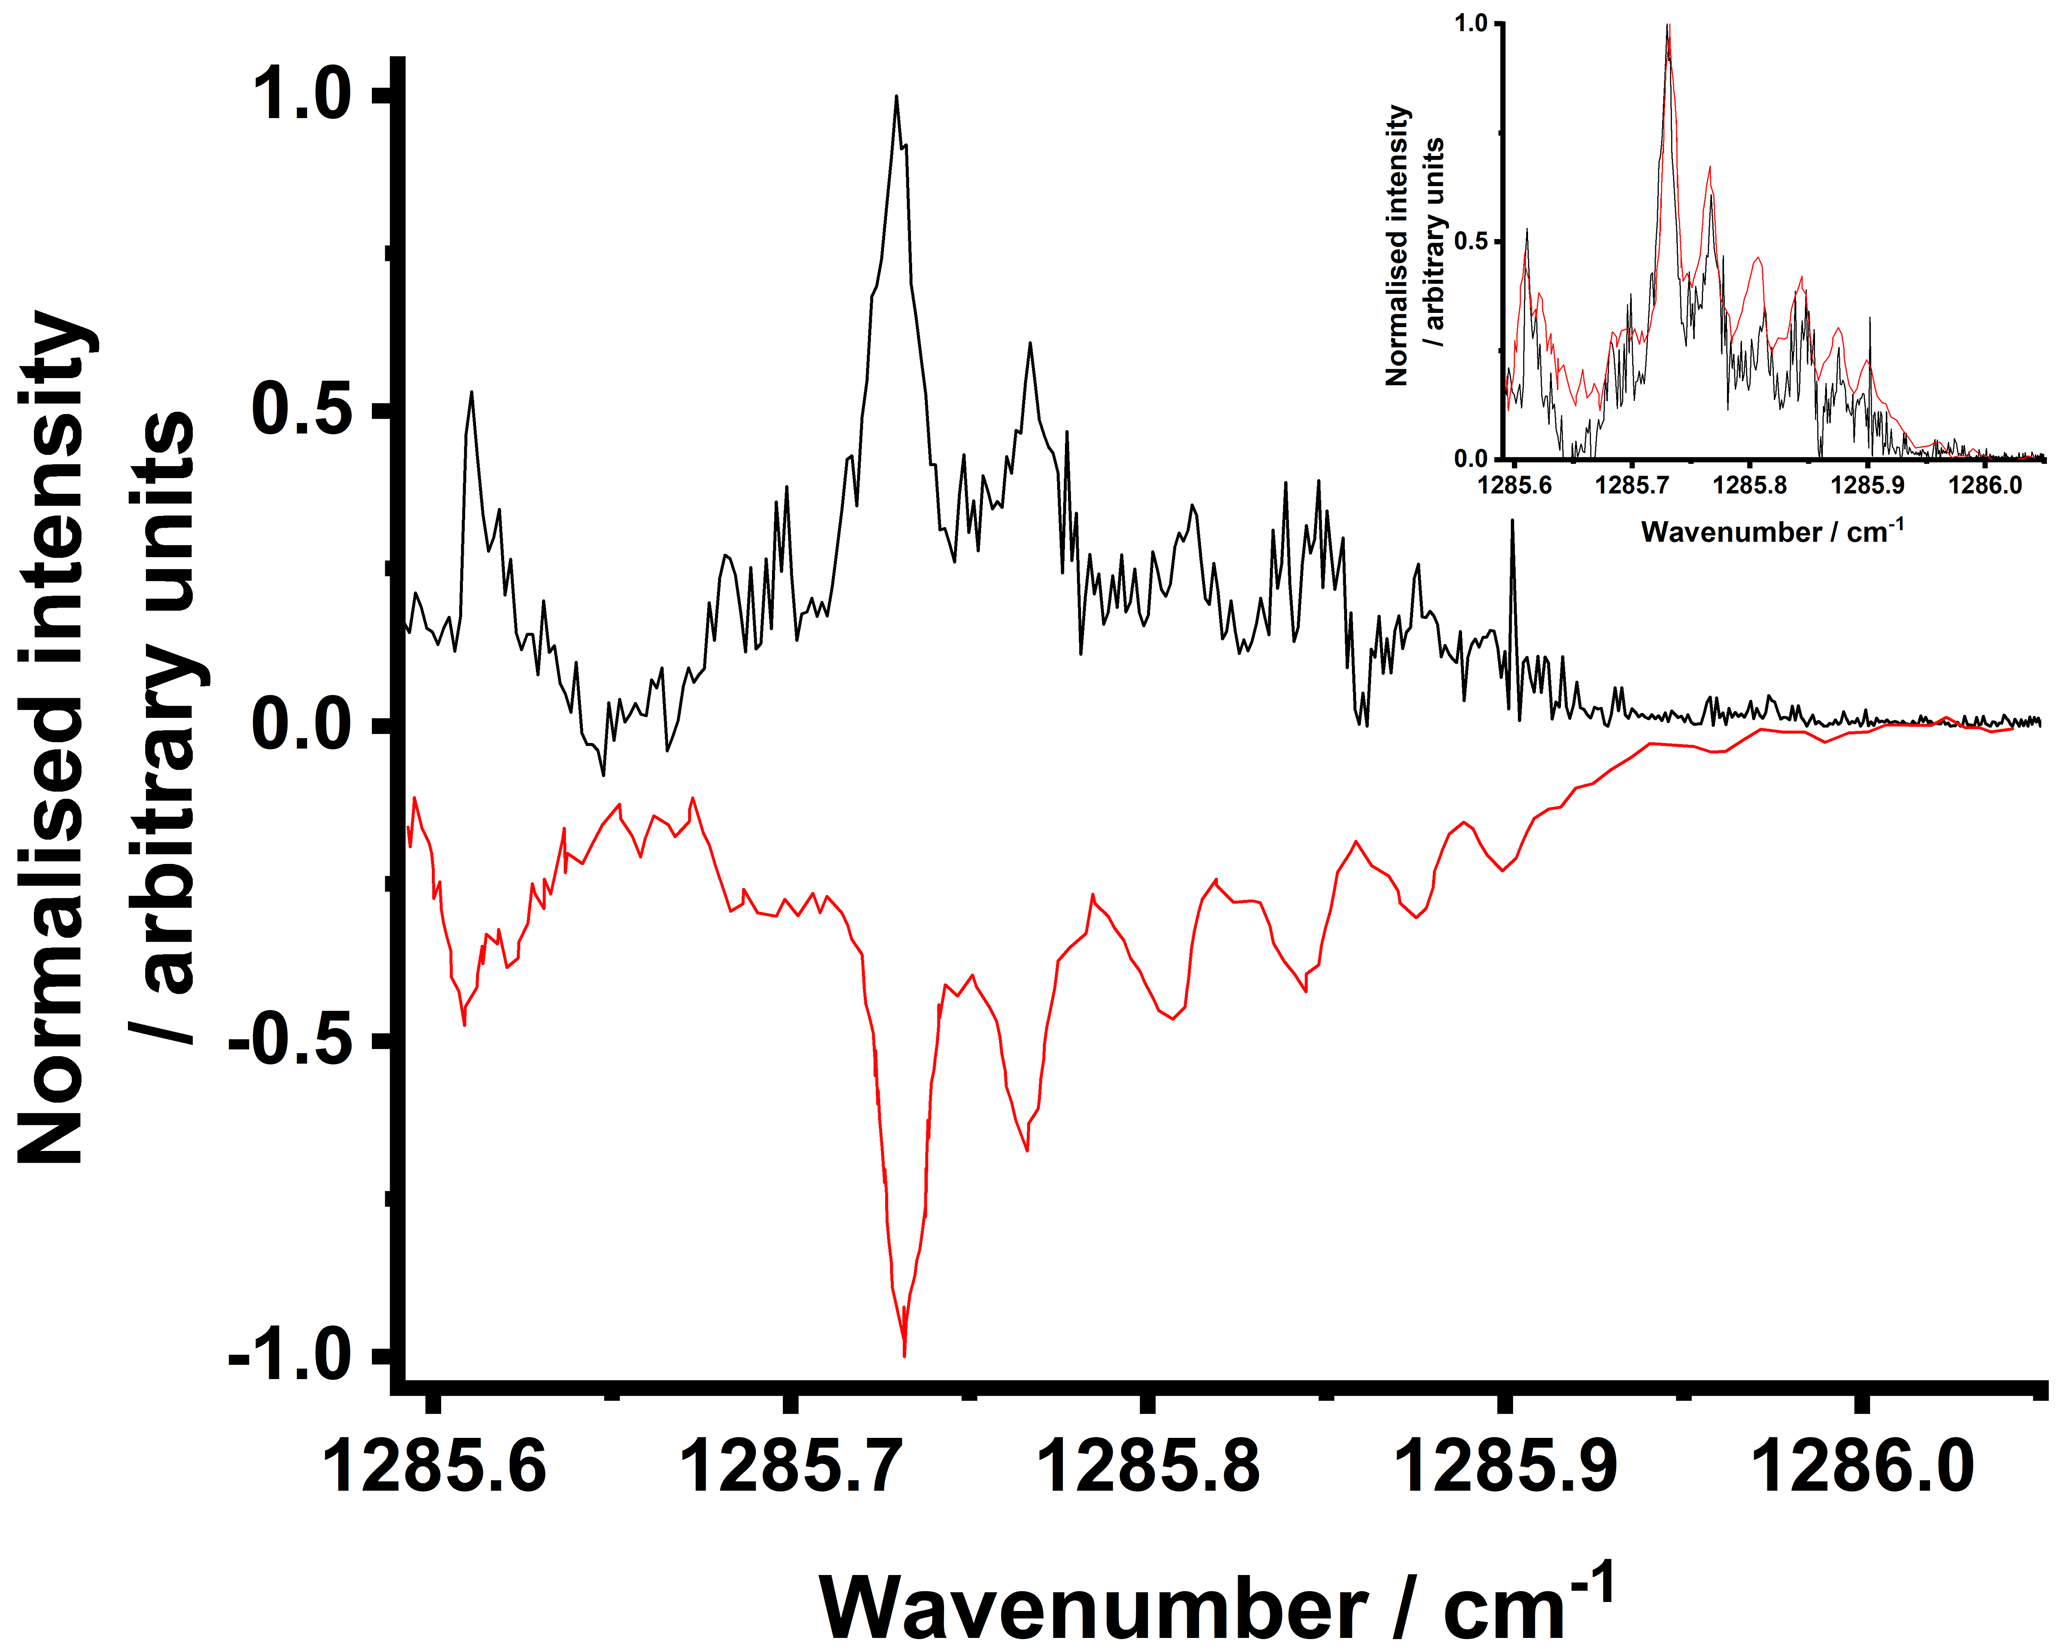
Figure 4Normalised CH2OO spectrum obtained in this work (black) and that reported previously (Chang et al., 2018a) (multiplied by −1) (red). Measurements made in this work were obtained at a total pressure of 50 Torr at 298 K in the absence of SO2, with [CH2I2] ∼ 2 × 1014 cm−3 and a laser fluence of 30 mJ cm−2. The data shown are the means of 1000 photolysis shots at each current setting on the QCL with the wavenumber calibrated using the results reported in previous work (Chang et al., 2018a). The inset plot shows the normalised spectra obtained in this work (black) and by Chang et al. (2018a) (red) on the same scale. The experiments and the HITRAN database indicate that there is no appreciable absorption by CH2I2 in this region of the spectrum.
4.1 Stable species
Photolytic experiments were initially performed for a system demonstrating a step change in the time-resolved signal intensity at a given wavenumber on photolysis, such that photolysis led to the removal of the species under investigation with no significant further chemistry on the timescale of the measurements. Figure 3 shows the time-resolved absorbance observed on 266 nm photolysis of CH3I–N2 mixtures and the average post-photolysis change in absorbance as a function of the initial CH3I concentration. Photolysis of CH3I leads to a decrease in concentration and thus an increase in signal intensity and a negative absorbance. The extent of change in absorbance reflects the absorption cross-section at the measurement wavenumber, the change in concentration, and the effective path length resulting from the overlap between the UV photolysis beam and the IR probe beam. For the 266 nm laser fluence of 30 mJ cm−2 and CH3I absorption cross-section of 9.7 × 10⁻¹⁹ cm2 at the photolysis wavelength (IUPAC) (Atkinson et al., 2008), a change in CH3I concentration of 4 % is expected on photolysis. For the absorbance data shown in Fig. 3 and an estimated infrared cross-section of CH3I at ∼ 1287 cm−1 of cm2 (HITRAN) (Gordon et al., 2017; Kochanov et al., 2019), the effective path length of the IR probe beam for these measurements can thus be estimated as (290 ± 30) cm. The effective path length is discussed further in Sect. 4.2.
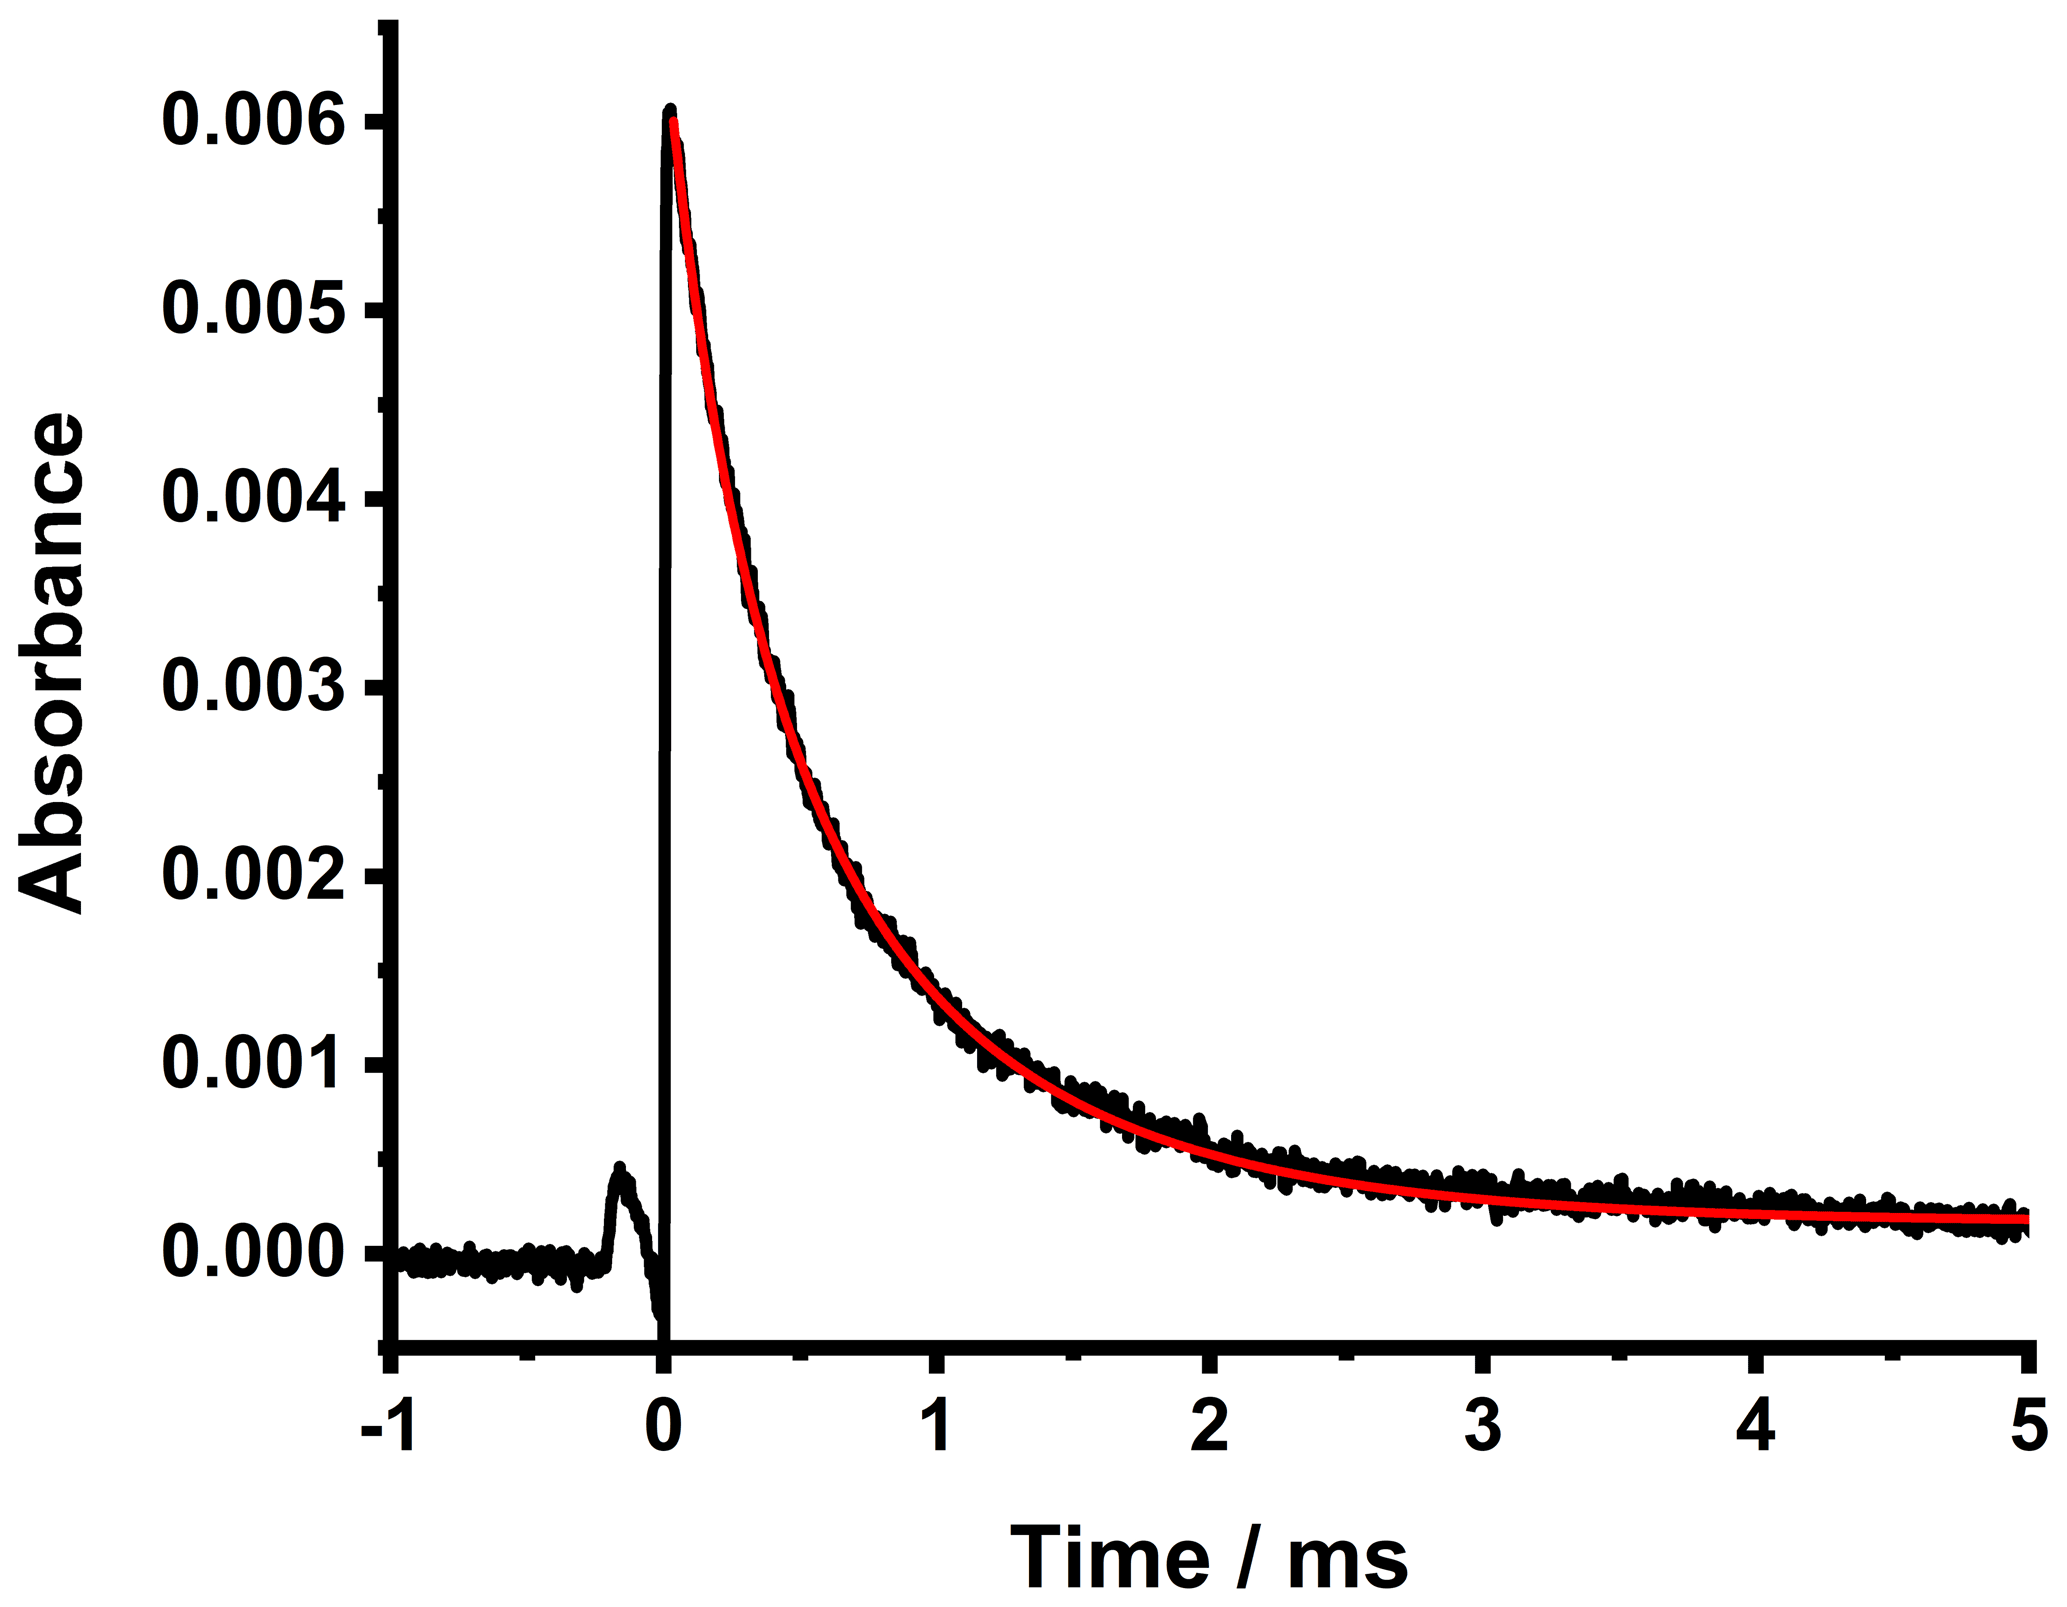
Figure 5Time-resolved absorbance for CH2OO obtained at a wavenumber of ∼ 1285.73 cm−1. Data are the average of 1000 photolysis shots at a total pressure of 50 Torr. For these data, [CH2I2] = 1.6 × 1014 cm−3, and [SO2] = 0. The fit to the data using the model containing the reactions given in Table 1 is shown by the solid red line, which gave kphys = (504±40) s−1 and l = (218 ± 20) cm.
Table 1Reactions and rate coefficients used in the model to fit to experimental observations of CH2OO absorbances to determine the effective path length of the probe beam. The absorbances at time zero, kphys (describing physical losses of CH2OO such as diffusion), and the effective path length were fit in the model. Initial concentrations of CH2I, iodine atoms, and CH2IO2 were determined relative to the initial concentrations determined for CH2OO using the results of our previous measurements of the yields of CH2I + O2, where β indicates the yield of CH2OO from CH2I + O2 (Stone et al., 2013). The rate coefficient kphys represents physical losses of CH2OO such as diffusion out of the probe region and was determined in the fits to this work.
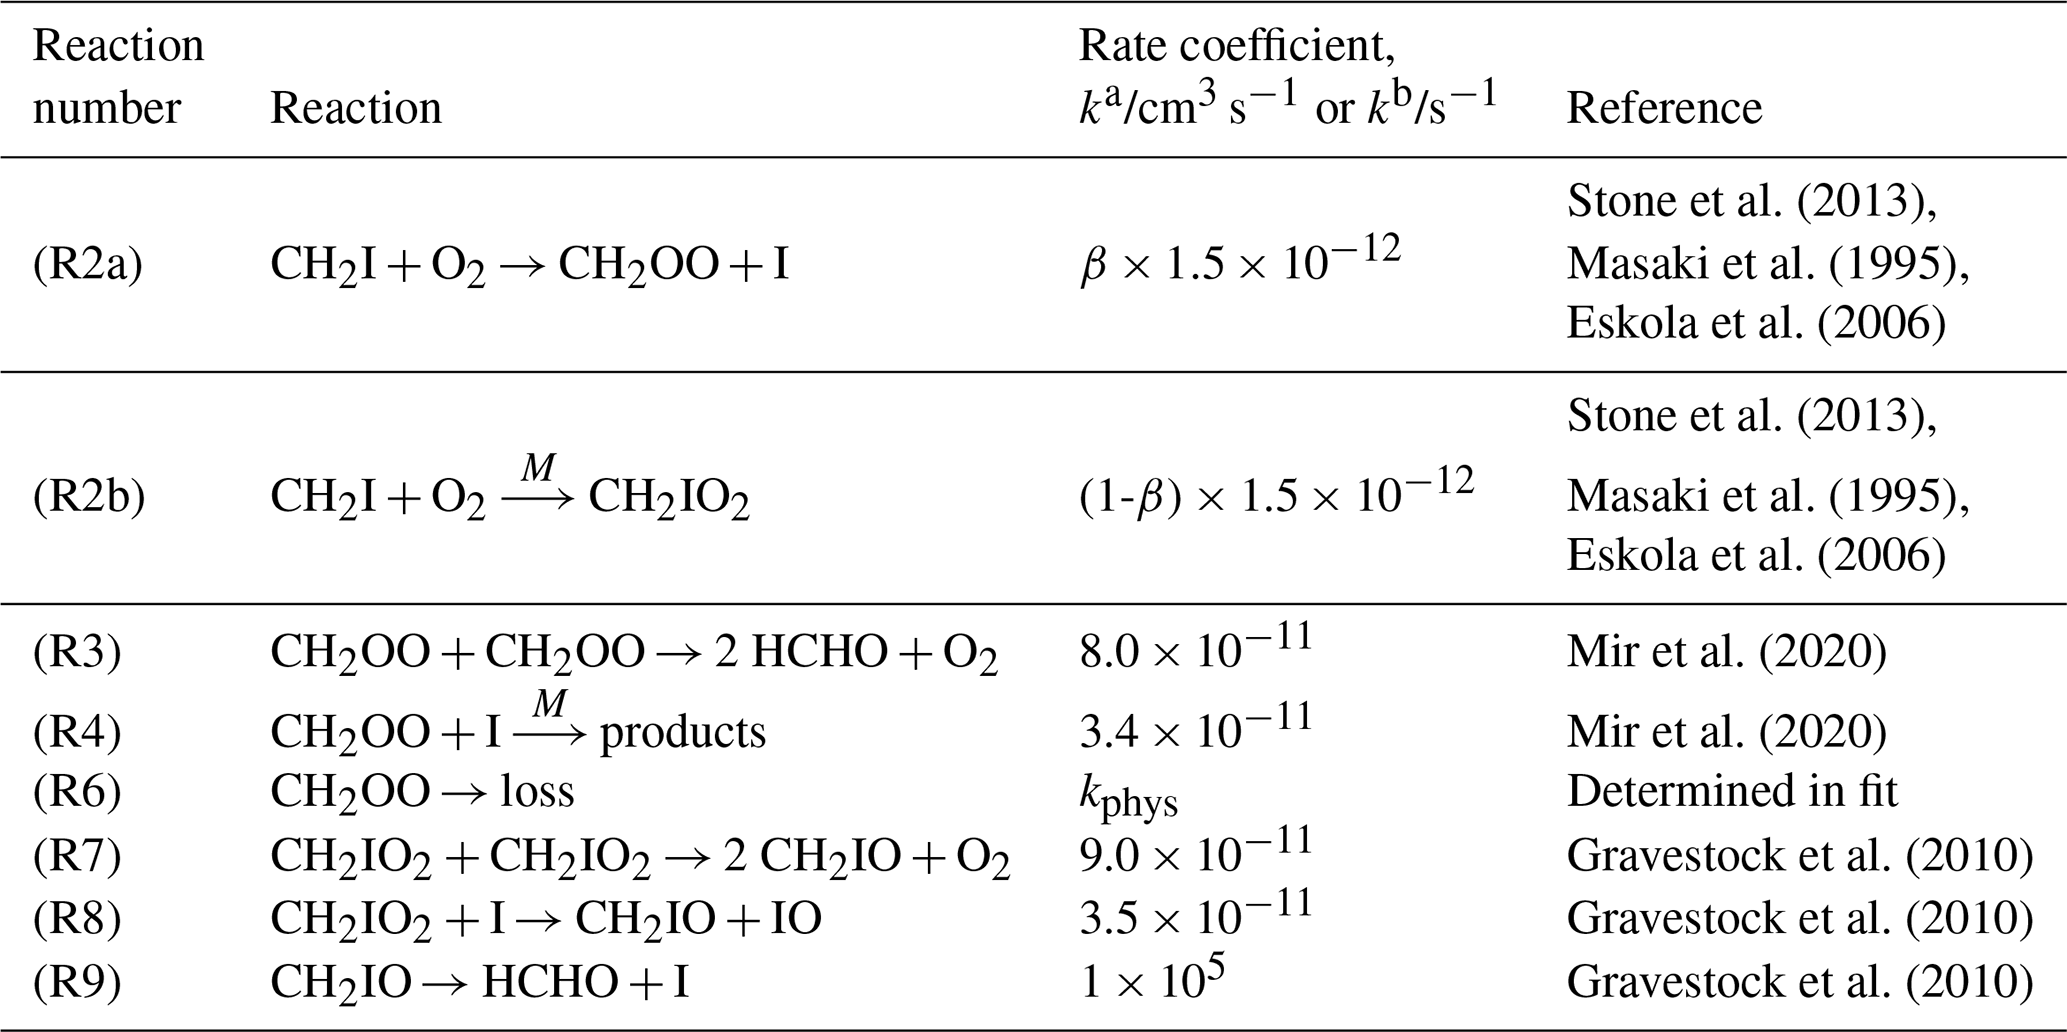
a Second-order reactions. b First-order reactions.
4.2 Reactive species
The behaviour of reactive species was investigated through 266 nm photolysis of CH2I2–O2–N2 and CH2I2–O2–N2–SO2 mixtures (Welz et al., 2012), resulting in the rapid production (kCH2I+O2[O2] s−1) of the Criegee intermediate CH2OO (Reactions R1–R2), followed by its removal through the CH2OO self-reaction (Reaction R3), CH2OO + I (Reaction R4), CH2OO + SO2 (Reaction R5), and physical losses such as diffusion (Reaction R6):
Figure 4 shows the spectrum obtained in the absence of SO2 by measuring the average pre- and post-photolysis absorbances for an observed time profile for a given QCL current setting, and thus a given wavenumber, and then stepping to the next current setting and repeating. The step in current for these experiments was 0.1 mA, the smallest step size available with the current controller used, giving steps of < 0.002 cm−1 across the range investigated. The pre-photolysis region was defined as −4000 to 500 µs, owing to detection of some radiofrequency noise associated with the Q-switch delay of the photolysis laser, which was set to 280 µs (i.e. the Q-switch fires at µs), and the post-photolysis region as 500 to 6000 µs, where t=0 is the time at which the photolysis laser is fired. Experiments were performed at 50 Torr, and each time-resolved trace was averaged for 1000 photolysis shots. The concentration of CH2I2 for these experiments, determined from the flow rates of gases in the cell, the vapour pressure of CH2I2, and measurements of the saturation of the flow with CH2I2 in previous experiments with similar flow rates, was ∼ 2 × 1014 cm−3, and the 266 nm laser fluence was 30 mJ cm−2, giving an expected initial CH2OO concentration of ∼ 7 × 1012 cm−3 using previous measurements of the yield of Reaction (R2a) (Stone et al., 2013). The spectrum measured in this work is in good agreement with that reported previously (Chang et al., 2017, 2018a). The resolution observed in this work is similar to the resolution of < 0.004 cm−1 reported in previous work (Chang et al., 2017) based on the observation of non-overlapped peaks, although the linewidth of the QCLs used in this work and in that in the previous measurement of the spectrum (Chang et al., 2018a) should enable higher resolution of < 0.002 cm−1 when observing species with more closely spaced features.
Kinetics describing the loss of CH2OO were monitored in separate experiments with the QCL set at the peak in the CH2OO spectrum (∼ 1285.73 cm−1). Figure 5 shows an example CH2OO decay obtained at a pressure of 50 Torr in the absence of SO2. The QCL can be tuned to a particular spectral feature and remain tuned to that feature for prolonged periods of time during which kinetics experiments and repeat measurements can be performed without any drift in spectral position. QCLs thus offer significant advantages for kinetics experiments over alternative mid-IR sources such as lead salt diode lasers, which can suffer from mode-hopping, uneven diode quality, and unpredictable tunability (Hodgkinson and Tatam, 2013). Such behaviour of alternative mid-IR sources can require sophisticated techniques to scan over a spectral feature, identify the peak, and then wait until the laser remains stable for a sufficient period of time to perform the desired experiment (Qian et al., 2000).
In the absence of any additional co-reactant such as SO2, the loss of CH2OO (as shown in Fig. 5) is dominated by Reactions (R3) and (R4) (Mir et al., 2020). Since Reactions (R3) and (R4) are not first-order, the kinetics describing the loss of CH2OO are dependent on absolute CH2OO concentrations. The kinetics of Reactions (R3) and (R4) have been determined in our previous work (Mir et al., 2020), and the absorption cross-section of CH2OO has been measured (Chang et al., 2018b) to be (3.9 ± 0.6) × 10−18 cm2 at the peak of its spectrum at ∼ 1285.73 cm−1 at a total pressure of 50 Torr. The numerical integration package FACSIMILE (MCPA Software, 2014) was therefore used to fit to the measured absorbances to determine the physical losses of CH2OO owing to diffusion out of the probe beam (approximated by a first-order rate coefficient kphys) and the effective path length (l) of the probe beam required to convert the absorbances to concentrations compatible with the measured CH2OO absorption cross-section of (3.9 ± 0.6) × 10−18 cm2 (Chang et al., 2018b) and the known kinetics for the mechanism used in the model (Table 1). Fits were performed for experiments in which precursor concentrations were varied in the range 0.1–5.0×1014 cm−3. Initial concentrations of CH2I, iodine atoms, and CH2IO2 were calculated in the model relative to those for CH2OO using the yields of Reactions (R1) and (R2) determined in our previous work (Stone et al., 2013).
The fits to the measured absorbances gave kphys=(504 ± 40) s−1 and an effective path length of (218 ± 20) cm. Figure 5 shows an example fit to the data. While the effective path length determined from experiments involving CH2OO ((218 ± 20) cm) is lower than that determined from experiments involving CH3I (290 ± 30) cm; Sect. 4.1), the results are in broad agreement, and the system was realigned between experiments, which may explain the difference.
In the presence of excess SO2 the observed decays of CH2OO are dominated by Reaction (R5), and the loss of CH2OO can be described by pseudo-first-order kinetics (Eq. 2).
where At is the absorbance at time t; A0 is the absorbance at time zero; and k′ is the pseudo-first-order rate coefficient, given by [SO2] +kphys, where k5 is the bimolecular rate coefficient for reaction between CH2OO and SO2, and kphys is the rate coefficient representing physical losses of CH2OO such as diffusion out of the probe region.
Fits of Eq. (2) to the observed CH2OO decays obtained in the presence of SO2 were performed to determine the pseudo-first-order rate coefficients, k′, which can be plotted against the known SO2 concentration (Sect. 2) to give the bimolecular rate coefficient k5. Figure 6 shows typical bimolecular plots of k′ against the SO2 concentration, giving k5 = (3.73 ± 0.19) × 10−11 cm3 s−1 at 20 Torr, k5 = (3.84 ± 0.27) × 10−11 cm3 s−1 at 50 Torr, and k5 = (3.95 ± 0.28) × 10−11 cm3 s−1 at 100 Torr, in good agreement with the current IUPAC-recommended value of × 10−11 cm3 s−1 (Cox et al., 2020). The data shown in Fig. 6 indicate that the experiment developed in this work is able to measure the spectra and kinetics of reactive species to a high degree of accuracy and precision and that a high dynamic range up to at least 20 000 s−1 can be achieved.
Further experiments were performed with the CH2I2–O2–N2–SO2 system to monitor the production of SO3 at ∼ 1388.7 cm−1. Previous work in this laboratory has demonstrated that HCHO is produced in Reaction (R5) (Stone et al., 2014), and theory has predicted the co-production of SO3 (Vereecken et al., 2012; Kuwata et al., 2015). Experimental work using step-scan FT-IR spectroscopy with a resolution of 1–4 cm−1 has indicated the production of SO3 following photolysis of CH2I2–O2–N2–SO2 mixtures (Wang et al., 2018), but kinetics of SO3 production have yet to be reported to confirm direct production through Reaction (R5).
The QCL operating at ∼ 1390 cm−1 was tuned to an absorption feature in the SO3 spectrum using a sample of gaseous SO3–N2 in an infrared absorption cell prepared from solid SO3 (Sigma-Aldrich, >99 %) in a glove box purged with N2. For experiments to monitor the kinetics of SO3 production following photolysis of CH2I2–O2–N2–SO2 mixtures, a PicoScope was used to collect the signal owing to lower absorbance signals for SO3 compared to CH2OO for given experimental conditions. The faster sampling rate and memory (5 Gs s−1 and 12 bit, respectively) of the PicoScope compared to the traditional LeCroy oscilloscope (sampling rate 1 Gs s−1 and 8 bit memory) effectively decrease the limit of detection. Factors affecting the limit of detection and the comparison between the PicoScope and the traditional oscilloscope are discussed further in Sect. 5.
Figure 7 shows examples of the time-resolved SO3 absorbance, which can be described by a pseudo-first-order growth combined with a first-order loss (Eq. 3) and used to provide an alternative determination of k5.
where At is the absorbance at time t; A0 refers to the maximum absorbance, which relates to the initial radical concentration and yield of SO3; kgrowth is the pseudo-first-order rate coefficient describing the growth of SO3, which is equal to k5[SO2]; and kloss is the first-order rate coefficient describing the loss of SO3, which is expected to be dominated by physical losses such as diffusion out of the probe region.
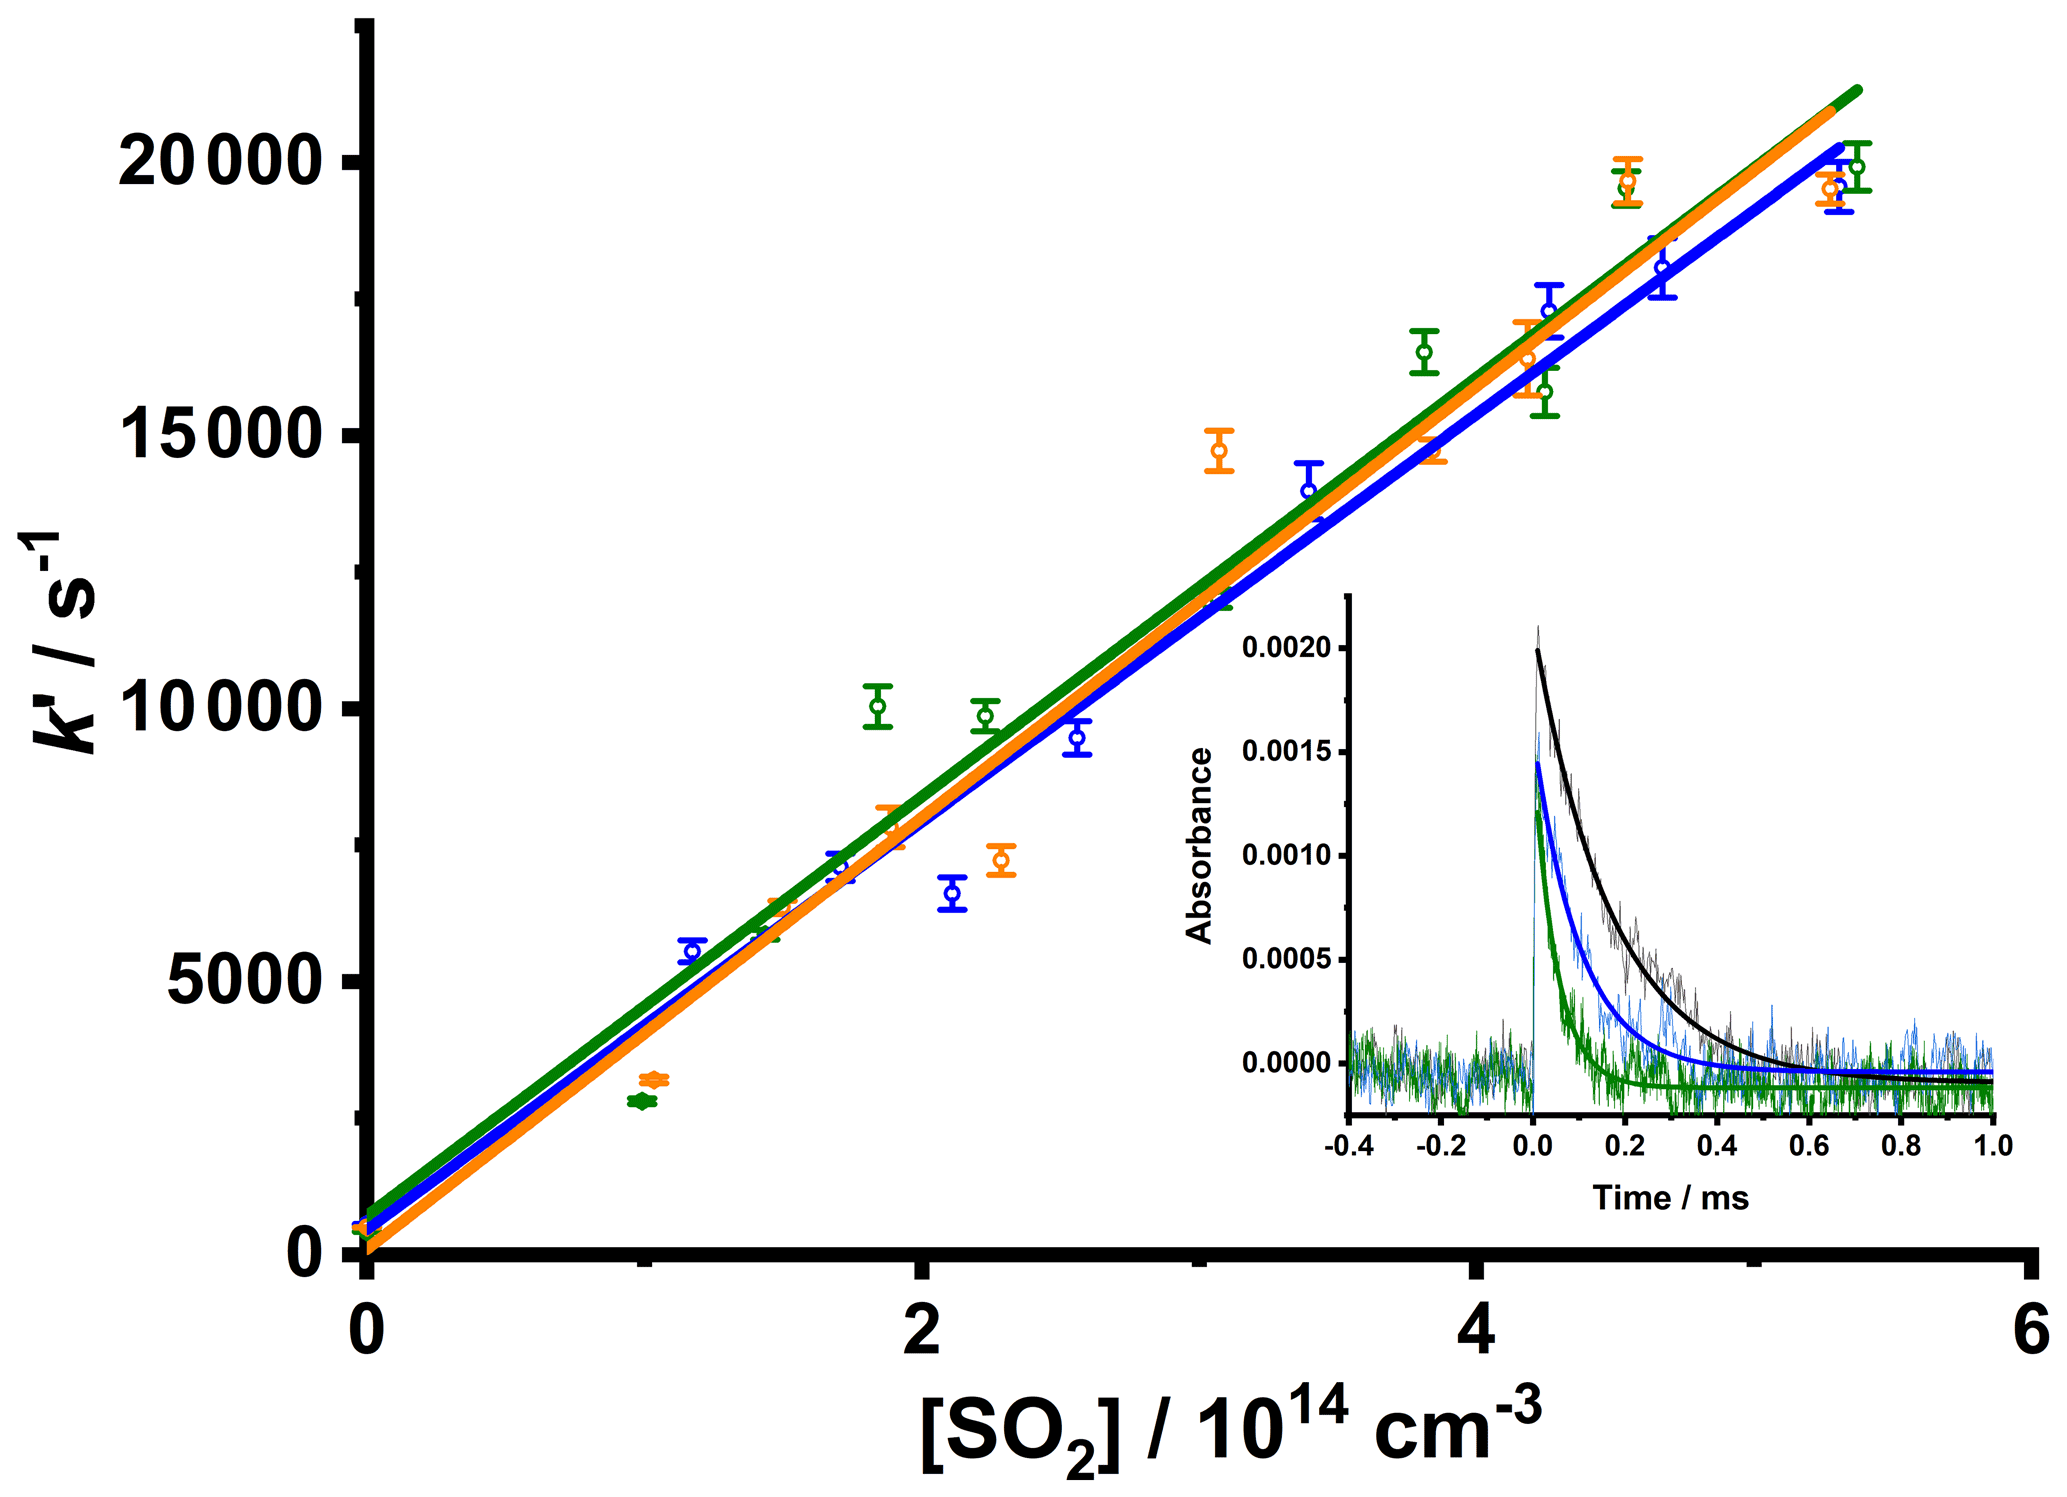
Figure 6Bimolecular plots of the pseudo-first-order rate coefficients, k′, determined from fits of Eq. (2), to observed CH2OO decays as a function of [SO2] at total pressures of 20 Torr (blue points and line; giving k5 (3.73 ± 0.19) × 10−11 cm3 s−1, intercept = (500 ± 600 s−1)), 50 Torr (green points and line; giving k5 = (3.84 ± 0.27) × 10−11 cm3 s−1, intercept = (700 ± 900 s−1)), and 100 Torr (orange points and line; giving k5 = (3.95 ± 0.28) × 10−11 cm3 s−1, intercept = (100 ± 900 s−1)). The data compare well to the current IUPAC recommendation of × 10−11 cm3 s−1 (Cox et al., 2020). For these data T=298 K, and initial CH2I2 concentrations were in the range 2.1–9.5 × 1014 cm−3. Error bars are 1σ from the fits to Eq. (2). The inset plot shows typical plots obtained for 250 photolysis shots at p=50 Torr with the fits to Eq. (2) (for the data shown in black, [SO2] = 1.4 × 1014 cm−3, and (5860 ± 90) s−1; for the data shown in blue, [SO2] = 2.2 × 1014 cm−3, and (9860 ± 280) s−1; and for the data shown in green, [SO2] = 5.4 × 1014 cm−3, and (19 920±440) s−1).
The bimolecular plots obtained through SO3 measurements at total pressures of 20, 50, and 100 Torr are shown in Fig. 8 and demonstrate the capability of the instrument to measure the kinetics describing product formation to at least 25 000 s−1. The bimolecular plots give k5= (3.55 ± 0.35) × 10−11 cm3 s−1 at 20 Torr, (3.87 ± 0.28) × 10−11 cm3 s−1 at 50 Torr, and (4.05 ± 0.19) × 10−11 cm3 s−1 at 100 Torr, in excellent agreement with that determined through measurements of CH2OO described above and the current IUPAC recommendation (Cox et al., 2020). These results thus demonstrate direct production of SO3 through Reaction (R5) and the capability of the experiment to identify and monitor reaction products.

Figure 7Time-resolved absorbance signals for SO3 obtained at a wavenumber of ∼1388.7 cm−1. Data are averages of 250 photolysis shots at a total pressure of 50 Torr at 298 K with [SO2] = 2.1 × 1014 cm−3 and [CH2I2] = 1.6 × 1014 cm−3. The fit to Eq. (3) to determine the kinetics describing the production and loss of SO3 (red) gave kgrowth= (8250 ± 60) s−1 and kloss= (300 ± 10) s−1.
The limit of detection can be determined from the variability in the baseline absorbance (i.e. in the absence of any absorbing species), which should be equal to zero and for which deviations from zero are determined only by noise. In order to detect an absorbance signal above the baseline, the signal must be greater than the noise (i.e. the signal-to-noise ratio must be greater than 1), and the limit of detection can thus be defined as the standard deviation of the noise. Figure 9 shows how the 1σ limit of detection varies with the number of samples, which for measurements involving reactive species (Sect. 4) is equal to the number of photolysis shots and is determined for the baseline given for the pre-photolysis period (−4000 to −500 µs, where t=0 is the time at which the photolysis laser is fired).
The limit of detection is given for measurements with the traditional oscilloscope and the PicoScope, with some improvement to the limit of detection achieved when using the PicoScope, owing to greater memory and sampling rate (12 bit and 5 Gs s−1) compared to the traditional oscilloscope (8 bit and 1 G s−1), which effectively increases the number of measurement points within a sample within a given time period. For the traditional oscilloscope, a limit of detection of 8.3 × 10⁻⁵, in absorbance terms, is achieved for 250 samples, which is reduced to for 1000 samples. For the estimated path length of (218±20) cm and typical IR absorption cross-sections of ∼ 10−19 cm2, the limit of detection for these data in terms of concentration can thus be estimated as ∼ 3.8 × 1012 cm−3 for 250 samples and cm−3 for 1000 samples, which compares well with alternative IR-based techniques (Taatjes and Hershberger, 2001; Roberts et al., 2020). For measurements of CH2OO, which has relatively high-IR-absorption cross-sections on the order of 10−18 cm2 at ∼ 1286 cm−1, the limit of detection for 250 samples using the traditional oscilloscope is thus ∼ 2.5 × 1011 cm−3. For the PicoScope, the limit of detection is significantly better than that for the traditional oscilloscope when the number of samples is low, with the limits of detection becoming more comparable as the number of samples is increased. For 1000 measurements, the PicoScope gives a limit of detection of 4.0 × 10⁻⁵ in absorbance terms, which for species with IR cross-sections on the order of ∼ 10−19 cm2 gives a limit of detection of ∼ 1.8 × 1012 cm−3 in terms of concentration. For CH2OO, with relatively high IR cross-sections of ∼ 10−18 cm2 at ∼ 1286 cm−1, the limit of detection is thus on the order of ∼ 1.8 × 1011 cm−3.
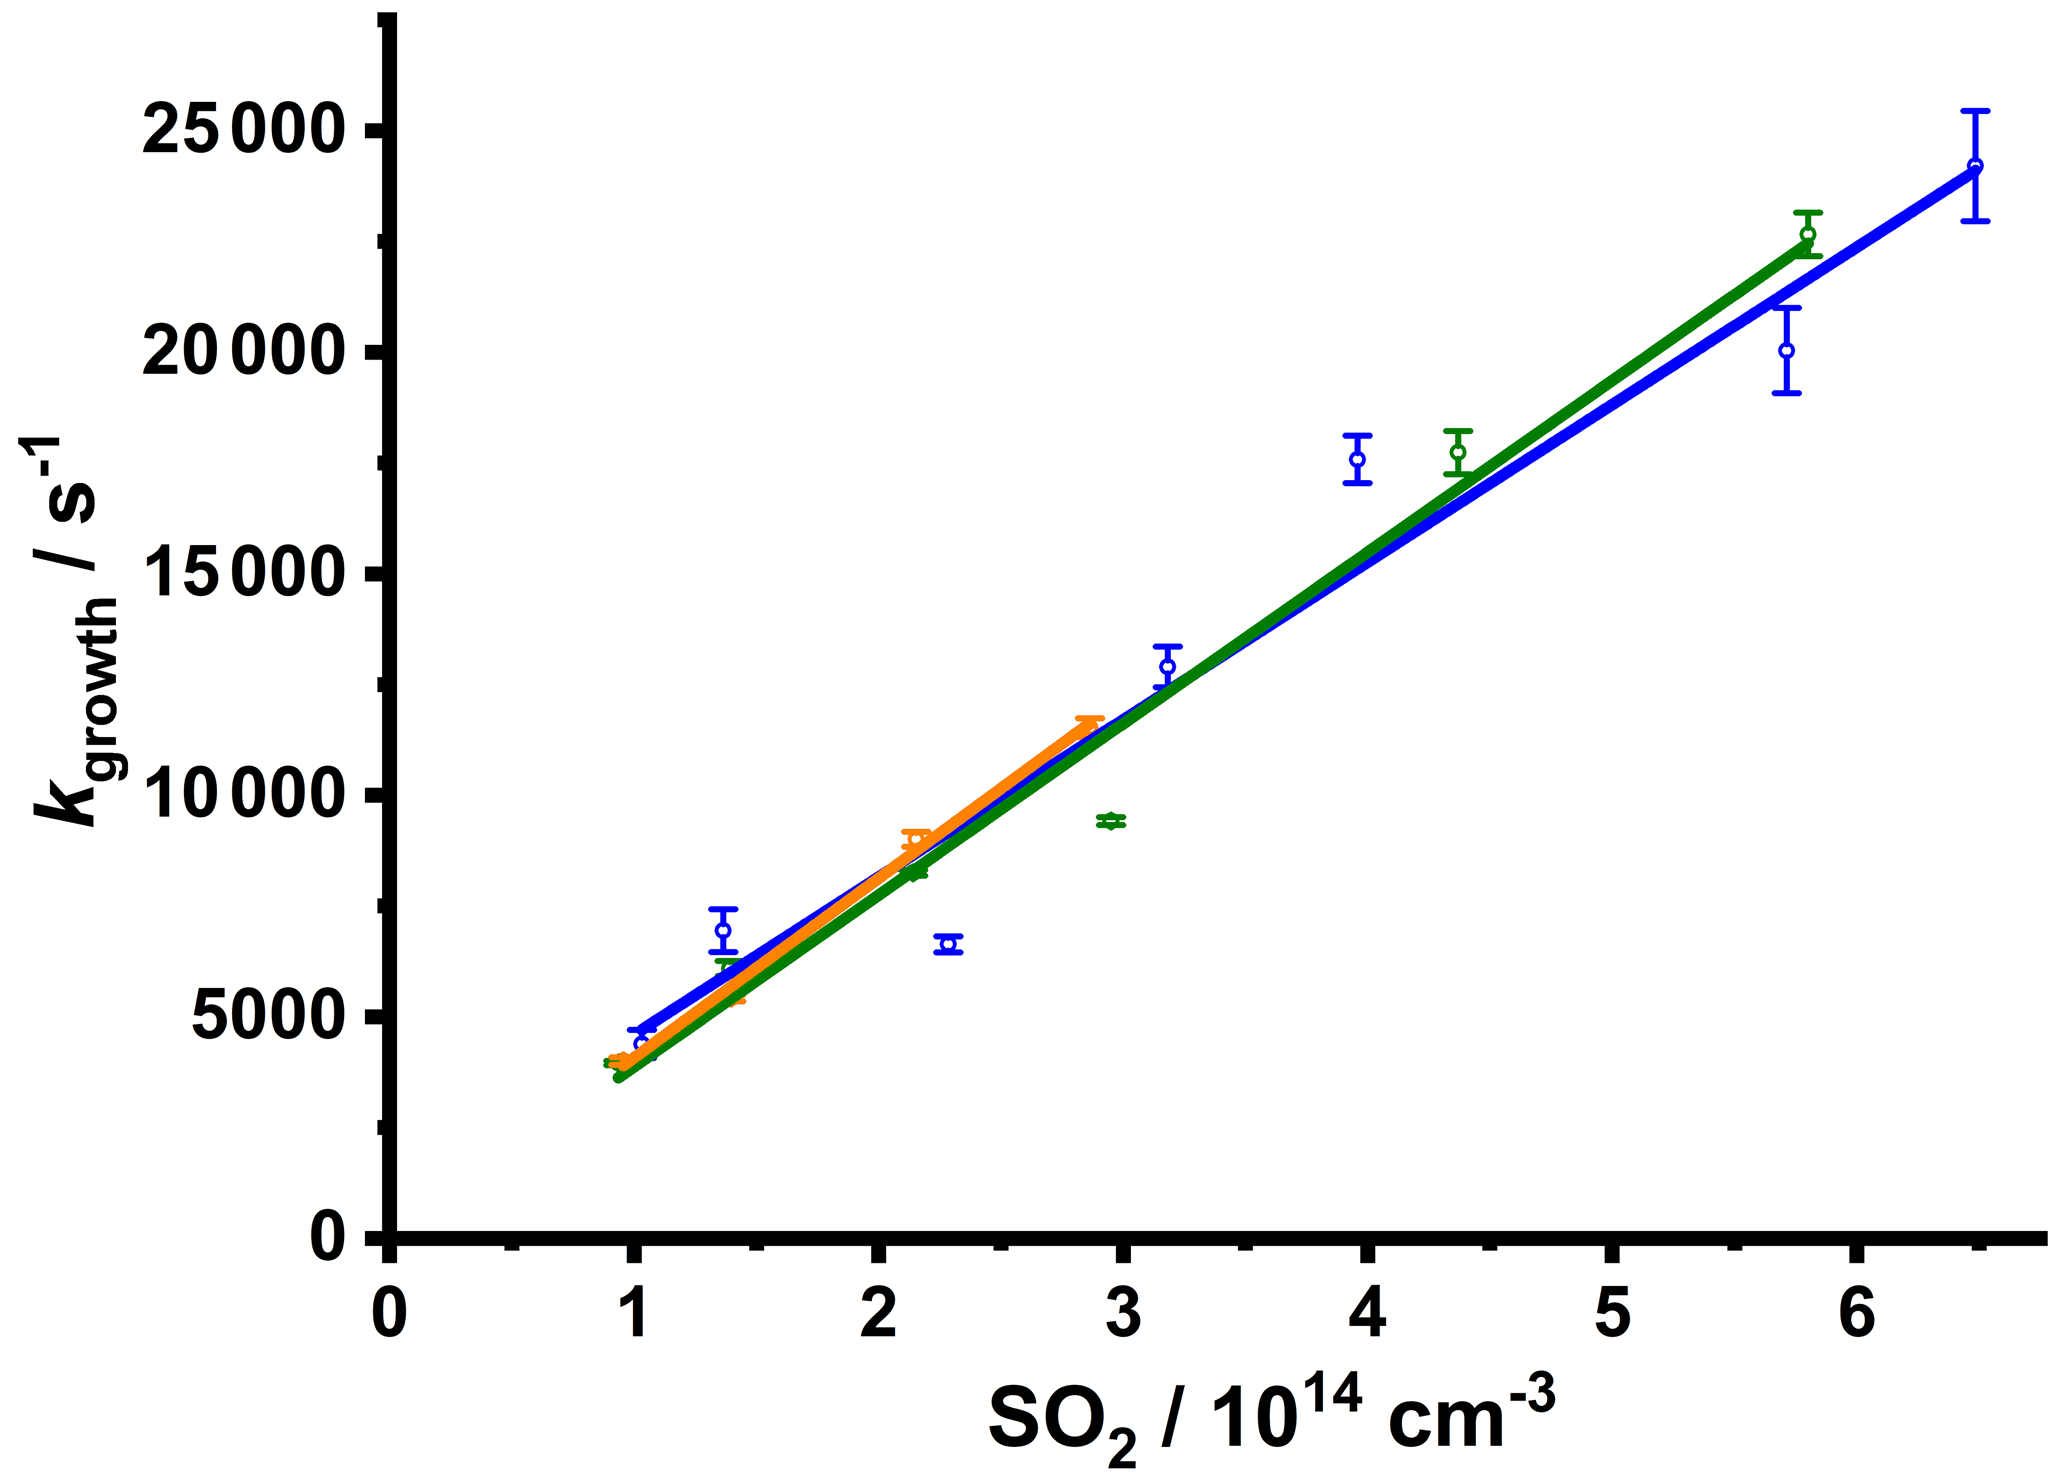
Figure 8Bimolecular plots of the pseudo-first-order rate coefficients, kgrowth, determined from the observed SO3 profiles as a function of [SO2]. Data were obtained at total pressures of 20 Torr (blue points and line; giving k5= (3.55 ± 0.35) × 10−11 cm3 s−1, intercept = (1000 ± 1400 s−1)), 50 Torr (green points and line; giving k5= (3.87 ± 0.28) × 10−11 cm3 s−1, intercept = (100 ± 900 s−1)), and 100 Torr (orange points and line; giving k5= (4.05 ± 0.19) × 10−11 cm3 s−1, intercept = (400 ± 400 s−1)). The data compare well to the current IUPAC recommendation of × 10−11 cm3 s−1 (Cox et al., 2020). Error bars are 1σ from the fits to Eq. (3).
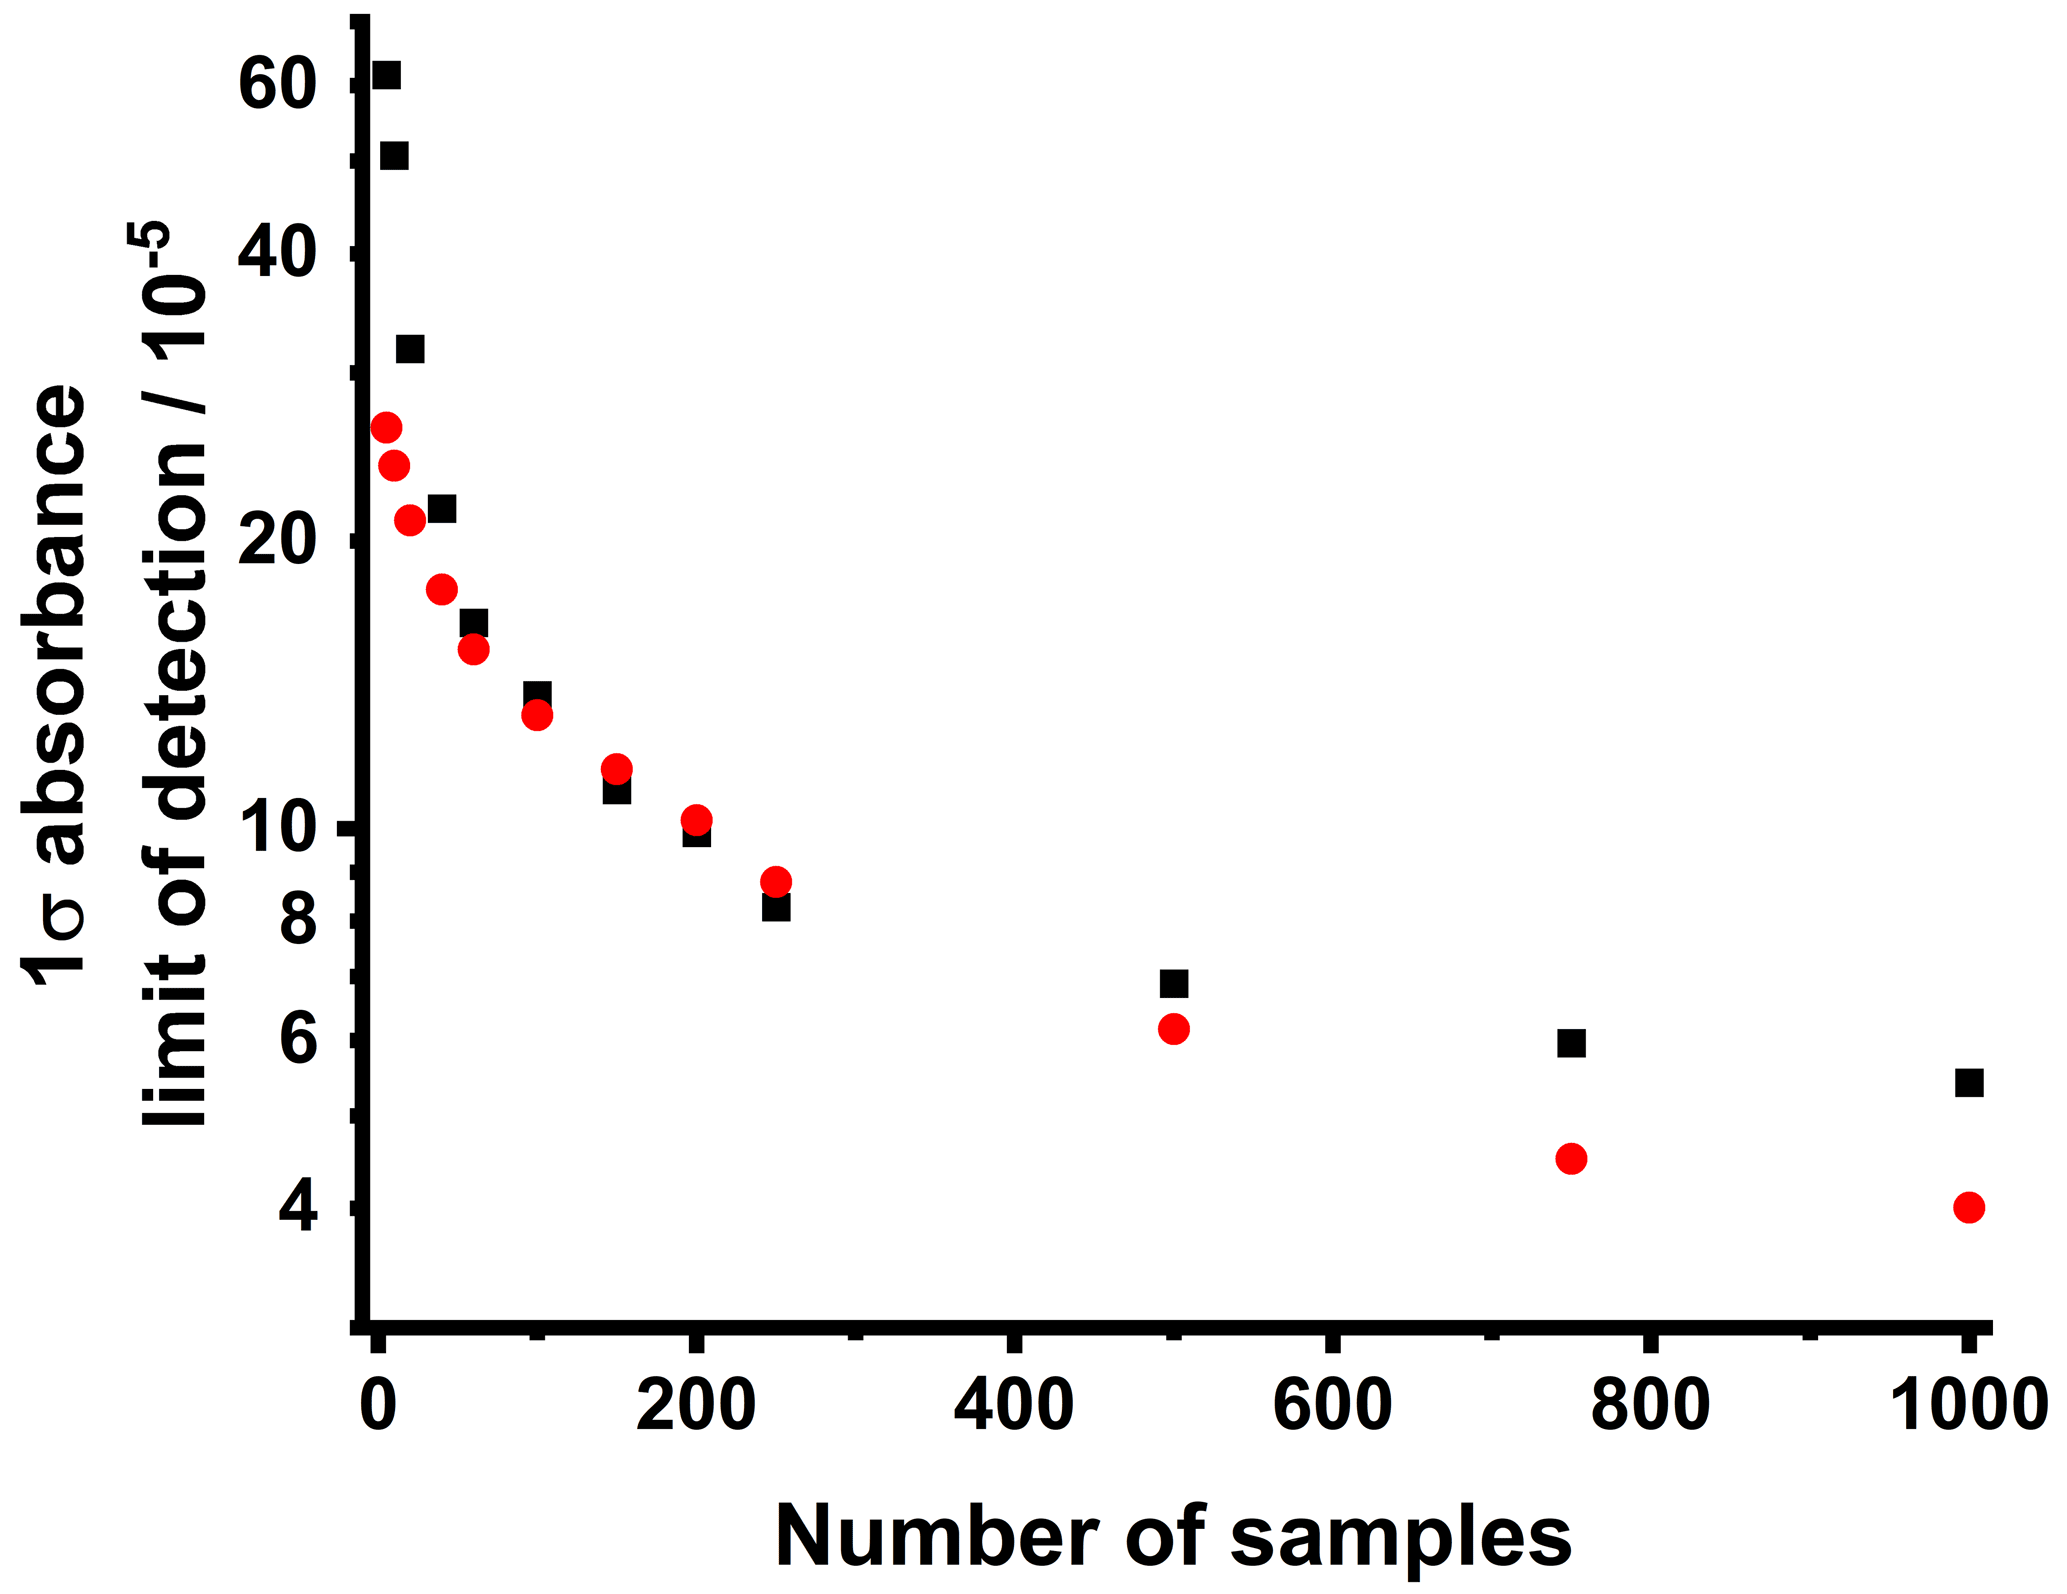
Figure 9Variation in the 1σ limit of detection with the number of samples, which is equivalent to the number of photolysis shots for measurements involving reactive species. The 1σ limit of detection is defined as the standard deviation of the baseline absorbance and is given for the time period equivalent to the pre-photolysis period (−4000 to −500 µs, where t=0 is the time at which the photolysis laser is fired) for measurements of reactive species. Measurements are shown for the traditional oscilloscope (LeCroy WaveRunner-2, LT262, 350 MHz, 1 GS s−1 sample rate, 8 bit resolution) in black and the PicoScope (Pico Technology, PicoScope 6402C, 250 MHz, 5 GS s−1 sample rate, 12 bit resolution) in red.
This work presents the characterisation and initial experiments performed using a new instrument based on mid-infrared QCL absorption spectroscopy to investigate the chemistry of reactive species with high spectral and temporal resolution. We present details of the experimental set-up (Sect. 2), results obtained for time-averaged measurements of stable species (Sect. 3), and results for time-resolved measurements of reactive species (Sect. 4).
We have demonstrated the application of the instrument to measurements of the IR spectra of reactive species which can be used to identify reactive species and their reaction products as well as to monitor reaction kinetics. The capabilities of the instrument have been demonstrated through measurements of the ν4 band of the infrared spectrum of the CH2OO Criegee intermediate, produced by laser flash photolysis of CH2I2–O2–N2 gas mixtures at λ=266 nm, and through measurements of the kinetics of the reaction between CH2OO and SO2 under a range of conditions. The results have demonstrated the ability to measure reaction kinetics through monitoring of either reactants or reaction products, with the potential for the identification of reaction products and measurements of product yields. Results have shown that SO3 is a reaction product in the reaction of CH2OO with SO2, with preliminary results indicating that there is no pressure dependence in the yield of SO3.
The instrument described in this work has applications in atmospheric chemistry and chemical kinetics, with wider potential uses in trace gas analysis in industrial processes and medical diagnostics. Future development of the instrument will focus on improvements in the signal-to-noise ratio and limit of detection. Improvements to the limit of detection could be achieved through further increases to the sampling rate and through the use of a balanced detector or lock-in amplification techniques to improve the signal-to-noise ratio. Additional improvements to the limit of detection in concentration terms are achievable through the use of a mirror arrangement for the probe beam in which the optics are internal to the reaction cell, thereby reducing intensity losses as the probe beam passes through the cell windows on each pass through the cell and enabling significant increases to the effective path length.
Code can be provided on request.
Data can be provided on request.
ZSM, MJ, and DS performed the experiments and analysed the data, with support from MAB and PWS. NRG developed the custom LabVIEW software to operate the instrument. DS wrote the manuscript. All authors provided comments on the analysis and the manuscript.
The contact author has declared that neither they nor their co-authors have any competing interests.
Publisher’s note: Copernicus Publications remains neutral with regard to jurisdictional claims in published maps and institutional affiliations.
The authors would like to thank the Natural Environment Research Council (NERC) for funding (grant references NE/L010798/1 and NE/P012876/1) and for the award of a studentship as part of the SPHERES DTP scheme.
This research has been supported by the Natural Environment Research Council (grant nos. NE/L010798/1 and NE/P012876/1).
This paper was edited by Hartwig Harder and reviewed by two anonymous referees.
Atkinson, R., Baulch, D. L., Cox, R. A., Crowley, J. N., Hampson, R. F., Hynes, R. G., Jenkin, M. E., Rossi, M. J., Troe, J., and Wallington, T. J.: Evaluated kinetic and photochemical data for atmospheric chemistry: Volume IV – gas phase reactions of organic halogen species, Atmos. Chem. Phys., 8, 4141–4496, https://doi.org/10.5194/acp-8-4141-2008, 2008.
Banik, G. D., Som, S., Maity, A., Pal, M., Maithani, S., Mandal, S., and Pradhan, M.: An EC-QCL based N2O sensor at 5.2 µm using cavity ring-down spectroscopy for environmental applications, Anal. Meth., 9, 2315–2320, https://doi.org/10.1039/c7ay00482f, 2017.
Bjork, B. J., Bui, T. Q., Heckl, O. H., Changala, P. B., Spaun, B., Heu, P., Follman, D., Deutsch, C., Cole, G. D., Aspelmeyer, M., Okumura, M., and Ye, J.: Direct frequency comb measurement of OD plus CO DOCO kinetics, Science, 354, 444–448, https://doi.org/10.1126/science.aag1862, 2016.
Blitz, M. A. and Seakins, P. W.: Laboratory studies of photochemistry and gas phase radical reaction kinetics relevant to planetary atmospheres, Chem. Soc. Rev., 41, 6318–6347, https://doi.org/10.1039/c2cs35204d, 2012.
Blitz, M. A., Goddard, A., Ingham, T., and Pilling, M. J.: Time-of-flight mass spectrometry for time-resolved measurements, Rev. Sci. Instr., 78, 1–9, https://doi.org/10.1063/1.2712797, 2007.
Borri, S., Bartalini, S., De Natale, P., Inguscio, M., Gmachl, C., Capasso, F., Sivco, D. L., and Cho, A. Y.: Frequency modulation spectroscopy by means of quantum-cascade lasers, Appl. Phys. B., 85, 223–229, https://doi.org/10.1007/s00340-006-2343-6, 2006.
Carr, S. A., Baeza-Romero, M. T., Blitz, M. A., Pilling, M. J., Heard, D. E., and Seakins, P. W.: OH yields from the CH3CO+O2 reaction using an internal standard, Chem. Phys. Lett., 445, 108–112, https://doi.org/10.1016/j.cplett.2007.07.099, 2007.
Chang, Y. P., Chang, H. H., and Lin, J. J. M.: Kinetics of the simplest Criegee intermediate reaction with ozone studied using a mid-infrared quantum cascade laser spectrometer, Phys. Chem. Chem. Phys., 20, 97–102, https://doi.org/10.1039/c7cp06653h, 2018a.
Chang, Y. P., Li, Y. L., Liu, M. L., Ou, T. C., and Lin, J. J. M.: Absolute Infrared Absorption Cross Section of the Simplest Criegee Intermediate Near 1285.7 cm−1, J. Phys. Chem. A, 122, 8874–8881, https://doi.org/10.1021/acs.jpca.8b06759, 2018b.
Chang, Y. P., Merer, A. J., Chang, H. H., Jhang, L. J., Chao, W., and Lin, J. J. M.: High resolution quantum cascade laser spectroscopy of the simplest Criegee intermediate, CH2OO, between 1273 cm−1 and 1290 cm−1, J. Chem. Phys., 146, 1–9, https://doi.org/10.1063/1.4986536, 2017.
Chattopadhyay, A., Samanta, M., Mondal, K., and Chakraborty, T.: Mid-infrared quantum cascade laser spectroscopy probing of the kinetics of an atmospherically significant radical reaction, CH3O2+ NO2+ M ->CH3O2NO2+ M, in the gas phase, J. Chem. Sci., 130, 1–10, https://doi.org/10.1007/s12039-018-1451-2, 2018.
Chhantyal-Pun, R., Khan, M. A. H., Taatjes, C. A., Percival, C. J., Orr-Ewing, A. J., and Shallcross, D. E.: Criegee intermediates: production, detection and reactivity, Int. Rev. Phys. Chem., 39, 383–422, https://doi.org/10.1080/0144235x.2020.1792104, 2020.
Choi, N., Pilling, M. J., Seakins, P. W., and Wang, L.: Studies of site selective hydrogen atom abstractions by Cl atoms from isobutane and propane by laser flash photolysis/IR diode laser spectroscopy, Phys. Chem. Chem. Phys., 8, 2172–2178, https://doi.org/10.1039/b516531h, 2006.
Cossel, K. C., Waxman, E. M., Finneran, I. A., Blake, G. A., Ye, J., and Newbury, N. R.: Gas-phase broadband spectroscopy using active sources: progress, status, and applications, J. Optic. Soc. Am. B, 34, 104–129, https://doi.org/10.1364/josab.34.000104, 2017.
Cox, R. A., Ammann, M., Crowley, J. N., Herrmann, H., Jenkin, M. E., McNeill, V. F., Mellouki, A., Troe, J., and Wallington, T. J.: Evaluated kinetic and photochemical data for atmospheric chemistry: Volume VII – Criegee intermediates, Atmos. Chem. Phys., 20, 13497–13519, https://doi.org/10.5194/acp-20-13497-2020, 2020.
Cui, X. J., Yu, R. Q., Chen, W. D., Zhang, Z. R., Pang, T., Sun, P. S., Xia, H., Wu, B., and Dong, F. Z.: Development of a Quantum Cascade Laser-Based Sensor for Environmental HONO Monitoring in the Mid-Infrared at 8 µm, J. Lightwave Tech., 37, 2784–2791, https://doi.org/10.1109/jlt.2018.2876672, 2019.
Curl, R. F., Capasso, F., Gmachl, C., Kosterev, A. A., McManus, B., Lewicki, R., Pusharsky, M., Wysocki, G., and Tittel, F. K.: Quantum cascade lasers in chemical physics, Chem. Phys. Lett., 487, 1–18, https://doi.org/10.1016/j.cplett.2009.12.073, 2010.
Doussin, J. F., Ritz, D., DurandJolibois, R., Monod, A., and Carlier, P.: Design of an environmental chamber for the study of atmospheric chemistry: New developments in the analytical device, Analusis, 25, 236–242, 1997.
Du, Z. H., Zhang, S., Li, J. Y., Gao, N., and Tong, K. B.: Mid-Infrared Tunable Laser-Based Broadband Fingerprint Absorption Spectroscopy for Trace Gas Sensing: A Review, Appl. Sci., 9, 1–33, https://doi.org/10.3390/app9020338, 2019.
Eskola, A. J., Wojcik-Pastuszka, D., Ratajczak, E., and Timonen, R. S.: Kinetics of the reactions of CH2Br and CH2I radicals with molecular oxygen at atmospheric temperatures, Phys. Chem. Chem. Phys., 8, 1416–1424, https://doi.org/10.1039/b516291b, 2006.
FACSIMILE: MCPA Software Ltd., https://www.mcpa-software.com/ (last access: 8 October 2021), 2014.
Faist, J., Capasso, F., Sivco, D. L., Sirtori, C., Hutchinson, A. L., and Cho, A. Y.: Quantum Cascade Laser, Science, 264, 553–556, https://doi.org/10.1126/science.264.5158.553, 1994.
Fleisher, A. J., Bjork, B. J., Bui, T. Q., Cossel, K. C., Okumura, M., and Ye, J.: Mid-Infrared Time-Resolved Frequency Comb Spectroscopy of Transient Free Radicals, J. Phys. Chem. Lett., 5, 2241–2246, https://doi.org/10.1021/jz5008559, 2014.
Fockenberg, C., Bernstein, H. J., Hall, G. E., Muckerman, J. T., Preses, J. M., Sears, T. J., and Weston, R. E.: Repetitively sampled time-of-flight mass spectrometry for gas-phase kinetics studies, Rev. Sci. Instr., 70, 3259–3264, https://doi.org/10.1063/1.1149944, 1999.
Glowacki, D. R., Goddard, A., Hemavibool, K., Malkin, T. L., Commane, R., Anderson, F., Bloss, W. J., Heard, D. E., Ingham, T., Pilling, M. J., and Seakins, P. W.: Design of and initial results from a Highly Instrumented Reactor for Atmospheric Chemistry (HIRAC), Atmos. Chem. Phys., 7, 5371–5390, https://doi.org/10.5194/acp-7-5371-2007, 2007.
Gmachl, C., Capasso, F., Sivco, D. L., and Cho, A. Y.: Recent progress in quantum cascade lasers and applications, Rep. Prog. Phys., 64, 1533–1601, https://doi.org/10.1088/0034-4885/64/11/204, 2001.
Gordon, I. E., Rothman, L. S., Hill, C., Kochanov, R. V., Tan, Y., Bernath, P. F., Birk, M., Boudon, V., Campargue, A., Chance, K. V., Drouin, B. J., Flaud, J. M., Gamache, R. R., Hodges, J. T., Jacquemart, D., Perevalov, V. I., Perrin, A., Shine, K. P., Smith, M. A. H., Tennyson, J., Toon, G. C., Tran, H., Tyuterev, V. G., Barbe, A., Csaszar, A. G., Devi, V. M., Furtenbacher, T., Harrison, J. J., Hartmann, J. M., Jolly, A., Johnson, T. J., Karman, T., Kleiner, I., Kyuberis, A. A., Loos, J., Lyulin, O. M., Massie, S. T., Mikhailenko, S. N., Moazzen-Ahmadi, N., Muller, H. S. P., Naumenko, O. V., Nikitin, A. V., Polyansky, O. L., Rey, M., Rotger, M., Sharpe, S. W., Sung, K., Starikova, E., Tashkun, S. A., Vander Auwera, J., Wagner, G., Wilzewski, J., Wcislo, P., Yu, S., and Zak, E. J.: The HITRAN2016 molecular spectroscopic database, J. Quant. Spec. Rad. Trans., 203, 3–69, https://doi.org/10.1016/j.jqsrt.2017.06.038, 2017.
Gravestock, T. J., Blitz, M. A., Bloss, W. J., and Heard, D. E.: A Multidimensional Study of the Reaction CH2I + O2: Products and Atmospheric Implications, Chem. Phys. Chem, 11, 3928–3941, https://doi.org/10.1002/cphc.201000575, 2010.
Herbst, E.: The chemistry of interstellar space, Chem. Soc. Rev., 30, 168–176, https://doi.org/10.1039/a909040a, 2001.
Herndon, S. C., Zahniser, M. S., Nelson, D. D., Shorter, J., McManus, J. B., Jimenez, R., Warneke, C., and de Gouw, J. A.: Airborne measurements of HCHO and HCOOH during the New England Air Quality Study 2004 using a pulsed quantum cascade laser spectrometer, J. Geophys. Res. Atmos., 112, 1–15, https://doi.org/10.1029/2006jd007600, 2007.
Hodgkinson, J. and Tatam, R. P.: Optical gas sensing: a review, Meas. Sci. Technol., 24, 1–59, https://doi.org/10.1088/0957-0233/24/1/012004, 2013.
Hofstetter, D. and Faist, J.: High Performance Quantum Cascade Lasers and Their Applications, in: Solid-State Mid-Infrared Laser Sources. Topics in Applied Physics, edited by: Sorokina, I. T. and Vodopyanov, K. L., Vol 89. Springer, Berlin, Heidelberg, https://doi.org/10.1007/3-540-36491-9_2, 2003.
Huang, D. R., Chu, L. K., and Lee, Y. P.: Infrared absorption of gaseous CH3OO detected with a step-scan Fourier-transform spectrometer, J. Chem. Phys., 127, 1–7, https://doi.org/10.1063/1.2807241, 2007.
Kochanov, R. V., Gordon, I. E., Rothman, L. S., Shine, K. P., Sharpe, S. W., Johnson, T. J., Wallington, T. J., Harrison, J. J., Bernath, P. F., Birk, M., Wagner, G., Le Bris, K., Bravo, I., and Hill, C.: Infrared absorption cross-sections in HITRAN2016 and beyond: Expansion for climate, environment, and atmospheric applications, J. Quant. Spec. Rad. Trans., 230, 172–221, https://doi.org/10.1016/j.jqsrt.2019.04.001, 2019.
Kostinek, J., Roiger, A., Davis, K. J., Sweeney, C., DiGangi, J. P., Choi, Y., Baier, B., Hase, F., Groß, J., Eckl, M., Klausner, T., and Butz, A.: Adaptation and performance assessment of a quantum and interband cascade laser spectrometer for simultaneous airborne in situ observation of CH4, C2H6, CO2, CO and N2O, Atmos. Meas. Tech., 12, 1767–1783, https://doi.org/10.5194/amt-12-1767-2019, 2019.
Kuwata, K. T., Guinn, E. J., Hermes, M. R., Fernandez, J. A., Mathison, J. M., and Huang, K.: A Computational Re-examination of the Criegee Intermediate-Sulfur Dioxide Reaction, J. Phys. Chem. A, 119, 10316–10335, https://doi.org/10.1021/acs.jpca.5b06565, 2015.
Lewis, T., Heard, D. E., and Blitz, M. A.: A novel multiplex absorption spectrometer for time-resolved studies, Rev. Sci. Instr., 89, 1–8, https://doi.org/10.1063/1.5006539, 2018.
Li, J. S., Chen, W., and Fischer, H.: Quantum Cascade Laser Spectrometry Techniques: A New Trend in Atmospheric Chemistry, Appl. Spec. Rev., 48, 523–559, https://doi.org/10.1080/05704928.2012.757232, 2013.
Li, Y. L., Lin, C. Y., Lin, Y. H., and Lin, J. J. M.: Temperature-dependent kinetics of the simplest Criegee intermediate reaction with dimethyl sulfoxide, J. Chin. Chem. Soc., 67, 1563–1570, https://doi.org/10.1002/jccs.202000206, 2020.
Li, Y. L., Lin, Y. H., Yin, C. T., Takahashi, K., Chiang, C. Y., Chang, Y. P., and Lin, J. J. M.: Temperature-Dependent Rate Coefficient for the Reaction of CH3SH with the Simplest Criegee Intermediate, J. Phys. Chem. A, 123, 4096–4103, https://doi.org/10.1021/acs.jpca.8b12553, 2019.
Luo, P. L., Chung, C. A., and Lee, Y. P.: Rate coefficient of the reaction CH2OO + NO2 probed with a quantum-cascade laser near 11 µm, Phys. Chem. Chem. Phys., 21, 17578–17583, https://doi.org/10.1039/c9cp03333e, 2019.
Luo, P. L., Endo, Y., and Lee, Y. P.: High-resolution vibration-rotational spectra and rotational perturbation of the OO-stretching (ν(6)) band of CH2OO between 879.5 and 932.0 cm−1, Phys. Chem. Chem. Phys., 20, 25806–25811, https://doi.org/10.1039/c8cp04780d, 2018a.
Luo, P. L., Endo, Y., and Lee, Y. P.: Identification and Self-Reaction Kinetics of Criegee Intermediates syn-CH3CHOO and CH2OO via High-Resolution Infrared Spectra with a Quantum-Cascade Laser, J. Phys. Chem. Lett., 9, 4391–4395, https://doi.org/10.1021/acs.jpclett.8b01824, 2018b.
Masaki, A., Tsunashima, S., and Washida, N.: Rate constants for reactions of substituted methyl radicals (CH2OCH3, CH2NH2, CH2I, and CH2CN) with O2, J. Phys. Chem., 99, 13126–13131, https://doi.org/10.1021/j100035a014, 1995.
McManus, J. B., Zahniser, M. S., Nelson, D. D., Shorter, J. H., Herndon, S., Wood, E., and Wehr, R.: Application of quantum cascade lasers to high-precision atmospheric trace gas measurements, Opt. Eng., 49, 1–11, https://doi.org/10.1117/1.3498782, 2010.
Middaugh, J. E., Buras, Z. J., Matrat, M., Chu, T. C., Kim, Y. S., Alecu, I. M., Vasiliou, A. K., Goldsmith, C. F., and Green, W. H.: A combined photoionization time-of-flight mass spectrometry and laser absorption spectrometry flash photolysis apparatus for simultaneous determination of reaction rates and product branching, Rev. Sci. Instr., 89, 1–19, https://doi.org/10.1063/1.5024399, 2018.
Mir, Z. S., Lewis, T. R., Onel, L., Blitz, M. A., Seakins, P. W., and Stone, D.: CH2OO Criegee intermediate UV absorption cross-sections and kinetics of CH2OO + CH2OO and CH2OO + I as a function of pressure, Phys. Chem. Chem. Phys., 22, 9448–9459, https://doi.org/10.1039/d0cp00988a, 2020.
Miyano, S. and Tonokura, K.: Measurements of nitrogen-broadening coefficients in the nu(3) band of the hydroperoxyl radical using a continuous wave quantum cascade laser, J. Mol. Spec., 265, 47–51, https://doi.org/10.1016/j.jms.2010.10.010, 2011.
Monks, P. S.: Gas-phase radical chemistry in the troposphere, Chem. Soc. Rev., 34, 376–395, doiL:10.1039/b307982c, 2005.
Nasir, E. F. and Farooq, A.: Cavity-enhanced absorption sensor for carbon monoxide in a rapid compression machine, Proc. Combust. Inst., 37, 1297–1304, https://doi.org/10.1016/j.proci.2018.05.015, 2019.
Nilsson, E. J. K., Eskebjerg, C., and Johnson, M. S.: A photochemical reactor for studies of atmospheric chemistry, Atmos. Environ., 43, 3029–3033, https://doi.org/10.1016/j.atmosenv.2009.02.034, 2009.
Orlando, J. J. and Tyndall, G. S.: Laboratory studies of organic peroxy radical chemistry: an overview with emphasis on recent issues of atmospheric significance, Chem. Soc. Rev., 41, 6294–6317, diu:10.1039/c2cs35166h, 2012.
Osborn, D. L., Zou, P., Johnsen, H., Hayden, C. C., Taatjes, C. A., Knyazev, V. D., North, S. W., Peterka, D. S., Ahmed, M., and Leone, S. R.: The multiplexed chemical kinetic photoionization mass spectrometer: A new approach to isomer-resolved chemical kinetics, Rev. Sci. Instr., 79, 1–10, https://doi.org/10.1063/1.3000004, 2008.
Pecharroman-Gallego, R.: Quantum Cascade Lasers: Review, Applications and Prospective Development, Lasers Engin., 24, 277–314, 2013.
Percival, C. J., Welz, O., Eskola, A. J., Savee, J. D., Osborn, D. L., Topping, D. O., Lowe, D., Utembe, S. R., Bacak, A., McFiggans, G., Cooke, M. C., Xiao, P., Archibald, A. T., Jenkin, M. E., Derwent, R. G., Riipinen, I., Mok, D. W. K., Lee, E. P. F., Dyke, J. M., Taatjes, C. A., and Shallcross, D. E.: Regional and global impacts of Criegee intermediates on atmospheric sulphuric acid concentrations and first steps of aerosol formation, Farad. Discuss., 165, 45–73, 10.1039/c3fd00048f, 2013.
Pilling, M. J., Robertson, S. H., and Seakins, P. W.: Elementary radical reactions and autoignition, J. Chem. Soc. Farad. Trans., 91, 4179–4188, https://doi.org/10.1039/ft9959104179, 1995.
Qian, H. B., Turton, D., Seakins, P. W., and Pilling, M. J.: Dynamic frequency stabilization of infrared diode laser for kinetic studies, Chem. Phys. Lett., 322, 57–64, https://doi.org/10.1016/s0009-2614(00)00395-x, 2000.
Qian, H. B., Turton, D., Seakins, P. W., and Pilling, M. J.: A laser flash photolysis/IR diode laser absorption study of the reaction of chlorine atoms with selected alkanes, Int. J. Chem. Kinet., 34, 86–94, 2001.
Roberts, F. C., Lewandowski, H. J., Hobson, B. F., and Lehman, J. H.: A rapid, spatially dispersive frequency comb spectrograph aimed at gas phase chemical reaction kinetics, Mol. Phys., 118, 1–9, https://doi.org/10.1080/00268976.2020.1733116, 2020.
Sakamoto, Y. and Tonokura, K.: Measurements of the Absorption Line Strength of Hydroperoxyl Radical in the nu(3) Band using a Continuous Wave Quantum Cascade Laser, J. Phys. Chem. A, 116, 215–222, https://doi.org/10.1021/jp207477n, 2012.
Seakins, P. W.: Product branching ratios in simple gas phase reactions, Ann. Rep. Sect. C Phys. Chem., 103, 173–222, https://doi.org/10.1039/B605650B, 2007.
Seakins, P. W.: A brief review of the use of environmental chambers for gas phase studies of kinetics, chemical mechanisms and characterisation of field instruments, in: Erca 9: From the Global Mercury Cycle to the Discoveries of Kuiper Belt Objects, edited by: Boutron, C., EPJ Web of Conferences, 143–163, https://doi.org/10.1051/epjconf/201009012, 2010.
Shahmohammadi, M., Kapsalidis, F., Suess, M. J., Gini, E., Beck, M., Hundt, M., Tuzson, B., Emmenegger, L., and Faist, J.: Multi-wavelength distributed feedback quantum cascade lasers for broadband trace gas spectroscopy, Semicond. Sci. Technol., 34, 1–14, https://doi.org/10.1088/1361-6641/ab2838, 2019.
Stone, D., Blitz, M., Daubney, L., Howes, N. U. M., and Seakins, P.: Kinetics of CH2OO reactions with SO2, NO2, NO, H2O and CH3CHO as a function of pressure, Phys. Chem. Chem. Phys., 16, 1139–1149, https://doi.org/10.1039/c3cp54391a, 2014.
Stone, D., Blitz, M., Daubney, L., Ingham, T., and Seakins, P.: CH2OO Criegee biradical yields following photolysis of CH2I2 in O2, Phys. Chem. Chem. Phys., 15, 19119–19124, https://doi.org/10.1039/c3cp52466c, 2013.
Su, Y. T., Huang, Y. H., Witek, H. A., and Lee, Y. P.: Infrared Absorption Spectrum of the Simplest Criegee Intermediate CH2OO, Science, 340, 174–176, https://doi.org/10.1126/science.1234369, 2013.
Taatjes, C. A. and Hershberger, J. F.: Recent progress in infrared absorption techniques for elementary gas-phase reaction kinetics, Ann. Rev. Phys. Chem., 52, 41–70, https://doi.org/10.1146/annurev.physchem.52.1.41, 2001.
Vereecken, L., Harder, H., and Novelli, A.: The reaction of Criegee intermediates with NO, RO2, and SO2, and their fate in the atmosphere, Phys. Chem. Chem. Phys., 14, 14682–14695, https://doi.org/10.1039/c2cp42300f, 2012.
von Schneidemesser, E., Monks, P. S., Allan, J. D., Bruhwiler, L., Forster, P., Fowler, D., Lauer, A., Morgan, W. T., Paasonen, P., Righi, M., Sindelarova, K., and Sutton, M. A.: Chemistry and the Linkages between Air Quality and Climate Change, Chem. Rev., 115, 3856–3897, https://doi.org/10.1021/acs.chemrev.5b00089, 2015.
Wang, Y. Y., Dash, M. R., Chung, C. Y., and Lee, Y. P.: Detection of transient infrared absorption of SO3 and 1,3,2-dioxathietane-2,2-dioxide cyc-(CH2)O(SO2)O in the reaction CH2OO+SO2, J. Chem. Phys., 148, 1–9, https://doi.org/10.1063/1.5019205, 2018.
Welz, O., Savee, J. D., Osborn, D. L., Vasu, S. S., Percival, C. J., Shallcross, D. E., and Taatjes, C. A.: Direct Kinetic Measurements of Criegee Intermediate (CH2OO) Formed by Reaction of CH2I with O2, Science, 335, 204–207, https://doi.org/10.1126/science.1213229, 2012.
Yao, Y., Hoffman, A. J., and Gmachl, C. F.: Mid-infrared quantum cascade lasers, Nature Photonics, 6, 432–439, https://doi.org/10.1038/nphoton.2012.143, 2012.
Zador, J., Taatjes, C. A., and Fernandes, R. X.: Kinetics of elementary reactions in low-temperature autoignition chemistry, Prog. Ener. Combust. Sci., 37, 371–421, https://doi.org/10.1016/j.pecs.2010.06.006, 2011.
Zhang, L. Z., Tian, G., Li, J. S., and Yu, B. L.: Applications of Absorption Spectroscopy Using Quantum Cascade Lasers, Appl. Spec., 68, 1095–1107, https://doi.org/10.1366/14-00001, 2014.