the Creative Commons Attribution 4.0 License.
the Creative Commons Attribution 4.0 License.
 | 02 Jun 2022
Relative errors in derived multi-wavelength intensive aerosol optical properties using cavity attenuated phase shift single-scattering albedo monitors, a nephelometer, and tricolour absorption photometer measurements
Patrick Weber
Andreas Petzold
Oliver F. Bischof
Benedikt Fischer
Marcel Berg
Andrew Freedman
Timothy B. Onasch
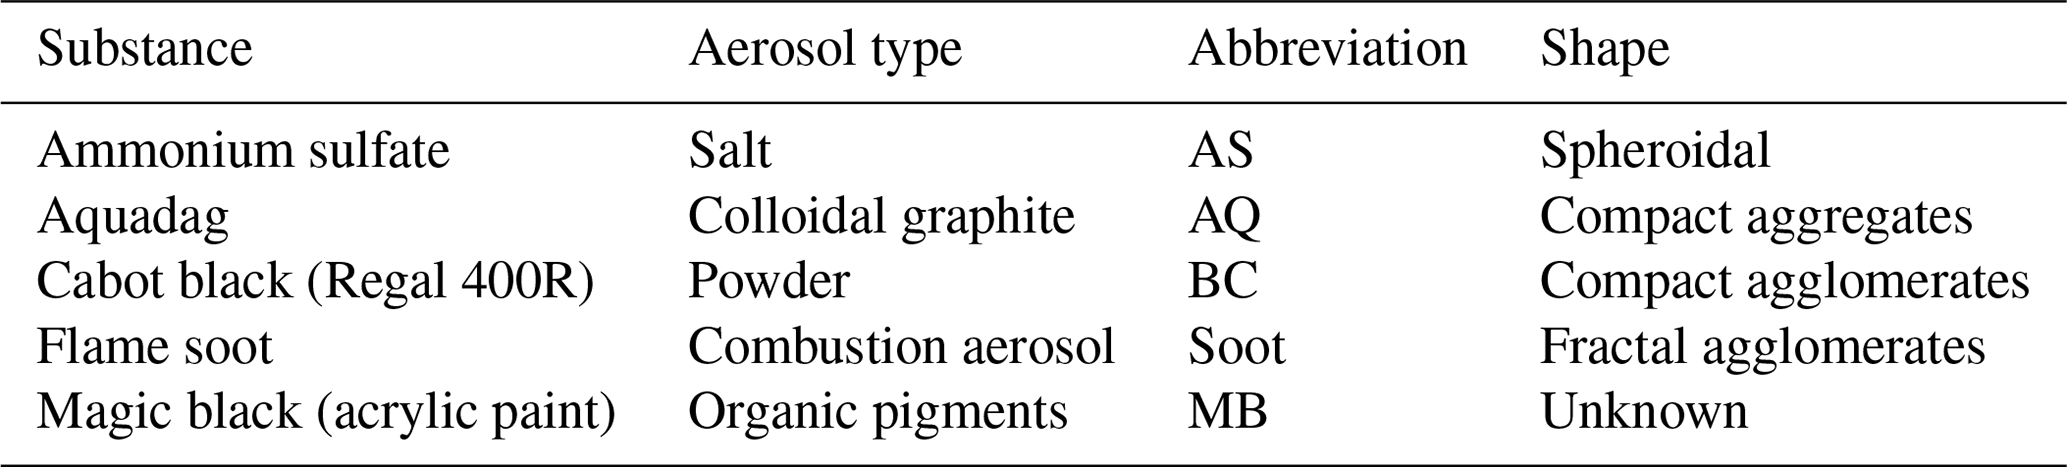
Aerosol intensive optical properties, including Ångström exponents for aerosol light extinction (EAEs), scattering (SAEs) and absorption (AAEs) as well as and the single-scattering albedo (SSA), are indicators for aerosol size, chemical composition, radiative behaviour and particle sources. Derivation of these parameters requires the measurement of aerosol optical properties at multiple wavelengths, which usually involves the use of several instruments. Our study aims to quantify the uncertainties in the determination of these intensive properties using an optical closure approach. In our laboratory closure study, we measured the full set of optical properties for a range of light-absorbing particles with different properties externally mixed with ammonium sulfate to generate aerosols with controlled SSA values. The investigated absorbing particle types were fresh combustion soot emitted by an inverted flame soot generator (SOOT; fractal agglomerates), Aquadag (AQ; compact aggregates), Cabot black (BC; compact agglomerates) and an acrylic paint (magic black, shape unknown). The instruments used in this study were two cavity attenuated phase shift particle monitors for single-scattering albedo (CAPS PMSSA's; λ=450, 630 nm) for measuring light-extinction and light-scattering coefficients, one integrating nephelometer (λ=450, 550, 700 nm) for light-scattering coefficients, and one tricolour absorption photometer (TAP; λ=467, 528, 652 nm) for filter-based light-absorption coefficients.
One key finding is that the coefficients of light absorption, scattering and extinction derived from combing the measurements of two independent instruments agree with measurements from single instruments; the slopes of regression lines are equal within reported uncertainties (i.e. closure is observed). Despite closure for measured absorption coefficients, we caution that the estimated uncertainties for absorption coefficients, propagated for the differential method (DM; absorption = extinction minus scattering), can exceed 100 % for atmospherically relevant SSA values (>0.9). This increasing estimated uncertainty with increasing SSA yields AAE values that may be too uncertain for measurements in the range of atmospheric aerosol loadings. We recommend using the DM for measuring AAE values when the SSA < 0.9. EAE- and SAE-derived values achieved closure during this study within stated uncertainties for extinction coefficients greater than 15 Mm−1. SSA values for 450 and 630 nm wavelengths internally agreed with each other within 10 % uncertainty for all instrument combinations and sampled aerosol types, which fulfils the defined goals for measurement uncertainty of 10 % proposed by Laj et al. (2020) for GCOS (Global Climate Observing System) applications.
- Article
(4214 KB) - Full-text XML
- BibTeX
- EndNote


The precise determination of aerosol optical properties is crucial for the provision of reliable input data for chemistry transport models, climate models and radiative forcing calculations (Myhre et al., 2013). This applies, in particular, to light-absorbing particles like black carbon (Petzold et al., 2013), which are produced by incomplete combustion processes and absorb visible light very efficiently. Aerosol light-absorbing properties are also relevant for source appointment studies and the determination of anthropogenic influences on atmospheric aerosols (Sandradewi et al., 2008). There are two common methods to generate aerosol light-absorption values for long-term and short-term monitoring, each with its own disadvantages. One method is a filter-based technique, which operates by deriving light-absorbing values from the attenuation of light through particle-loaded filters (Rosen et al., 1978). A disadvantage of all filter-based methods is linked to artefacts like multiple scattering inside the filter matrix, shadowing of light-absorbing particles in highly loaded filters and humidity effects on the filter substrate (Moosmüller et al., 2009). Widely deployed filter-based light-absorption instruments include the particle soot absorption photometer (PSAP; Bond et al., 1999), the tricolour absorption photometer (TAP), the continuous light-absorption photometer (CLAP; Ogren et al., 2017), the aethalometer (Hansen et al., 1984) and the multi-angle absorption photometer (MAAP) (Petzold et al., 2005). The PSAP, TAP, CLAP and aethalometer share their measurement principle, utilize a reference spot technique and require complex correction algorithms (Collaud Coen et al., 2010; Virkkula, 2010; Virkkula et al., 2005). The MAAP utilizes a different approach, a two-stream radiative transport model, made possible by its measurement of both direct transmission and backscatter from the particle-loaded filter substrate. Another method for deriving aerosol light absorption is the differential method, based on the subtraction of light scattering from extinction. This method is commonly conducted by comparing measurements from two separate instruments, which results in large precision errors particularly for low light-absorption and/or high single-scattering albedo (SSA) values. In laboratory studies, however, the differential method is widely used as a reference technique because the applied light-scattering and light-extinction instruments make measurements on freely floating particles (i.e. no filter-based artefacts) and are well characterized (Bond et al., 1999; Schnaiter et al., 2005; Sheridan et al., 2005). A significant improvement of aerosol measurement capacities is achieved by the recently developed cavity attenuated phase shift particle monitor for single-scattering albedo (CAPS PMSSA) (Onasch et al., 2015), which is able to measure light extinction and scattering simultaneously and is the focus of recent studies (Perim de Faria et al., 2021; Modini et al., 2021).
Intensive aerosol parameters like the single-scattering albedo (SSA) or Ångström exponents are often not directly measured but calculated from multiple instrument datasets, which could lead to an increase in errors and uncertainties. The importance of measuring reliable intensive parameters is undisputable, especially when their use is required for an experiment or sensitive climate-related modelling. The Ångström exponents are widely used to adjust extensive parameters to a desired wavelength (Ångström, 1929) for instrument comparisons (Foster et al., 2019), for aerosol characterization (Russell et al., 2010) like the refraction index determination of mineral dust (Petzold et al., 2009) or black carbon (Kim et al., 2015), or for source identification of mineral dust (Formenti et al., 2011). Ångström exponents vary with particle size, shape and chemical composition, though the relative importance of these factors differs for each optical property. The scattering Ångström exponent (SAE) is most sensitive to particle size and, therefore, used as an indication of the size distribution of measured aerosols. An SAE value of 4 indicates either gaseous Rayleigh scattering or nanometre-sized particles, whereas a value of 0 indicates coarse particles (Kokhanovsky, 2008). The absorption Ångström exponents (AAEs) are sensitive to the chemical composition and size of the aerosol particles. A value of 1 indicates an aerosol which absorbs light strongly across the entire visible spectral range and is composed of nanometre-sized spherules (Berry and Percival, 1986). This behaviour is characteristic for fresh soot or black carbon fractal agglomerates (Kirchstetter and Thatcher, 2012; Xu et al., 2015). AAE values higher than unity indicate the presence of brown carbon (Kim et al., 2015) or mineral dust (Formenti et al., 2011), both of which are characterized by a stronger absorption in the blue and ultraviolet compared to the red spectral range. AAE values >1 may also occur for coated light-absorbing particles (e.g. coated soot) or larger, more compact light-absorbing particles (Lack and Cappa, 2010). The extinction Ångström exponent (EAE) is often used for aerosol classification by remote sensing methods such as lidar and depends on particle size and chemical composition (Veselovskii et al., 2016; Kaskaoutis et al., 2007). Combining these Ångström exponents in cluster plots is a reliable method for classifying aerosol sources (Russell et al., 2010). The SSA of an aerosol is the key parameter for its direct and semi-direct impact on climate (Penner, 2001). The SSA describes the ratio of scattering to total extinction of a measured aerosol. An SSA value of 1 indicates that light extinction occurs exclusively due to light scattering. In contrast, SSA values >1 indicate an aerosol with a significant fraction of light-absorbing components, which may cause heating of the atmosphere. The intensive parameters are commonly available only through multiple-instrument approaches at different wavelengths, which calls for a detailed analysis of their measurement uncertainties. Our study contributes to this topic with a detailed optical closure study, in which we deploy standard and advanced instrumentation for measuring aerosol optical properties and sample mixtures of light-absorbing and light-scattering aerosol to assess method uncertainties and precision errors.
2.1 Experimental design
A schematic of the experimental set-up is shown in Fig. 1. Briefly, aerosol flows, generated using two nebulizers or an inverted flame generator, are dehumidified (generally to below 7 %) using diffusion driers filled with silica gel and sent to a mixing chamber to ensure homogeneous mixing prior to being sampled using a suite of optical instruments. In order to avoid particle losses caused by electrostatic forces, all tubing and chambers are constructed of either stainless steel or conductive silicone tubing. The individual optical instruments are connected using an iso-axial-orientated and isokinetically operated nozzle located in the centreline of the supply line. As shown in Fig. 1, aerosol production was controlled by multiple mass flow controllers (MFCs; Bronkhorst High-Tech B.V., Ruurlo, Netherlands). A LabVIEW-based program controlled the complete measurement system and centrally recorded all data from the individual instruments. Pressures in the aerosol delivery lines were maintained at that of the ambient atmosphere at all times. Aerosol flow rates to the individual instruments were provided at their specified levels (0.6–3.0 L min−1) except for that of the TSI nephelometer. Given the limitations of the aerosol supply system, the flow to the nephelometer was reduced from 20 to 2.2 L min−1, causing the physical response time of that instrument to be increased to 10 min. Complete details of the generation of aerosols are provided in the following section.

Figure 1Experimental set-up for the measurements. Flame soot measurements were done with a combustion flame source replacing nebulizer no. 2.
The generated aerosol size distributions were characterized and monitored with either a scanning mobility particle sizer (SMPS) composed of the combination of a differential mobility analyser (DMA 5.400, Grimm Aerosol Technik GmbH Co & KG Germany) and condensation particle counter (CPC 5.411, Grimm Aerosol Technik) system in a sequential mode of operation or a Grimm optical particle size spectrometer (SKY-OPC, model 1.129, Grimm Aerosol GmbH & Co. KG, Ainring, Germany).
2.2 Optical instruments and uncertainties
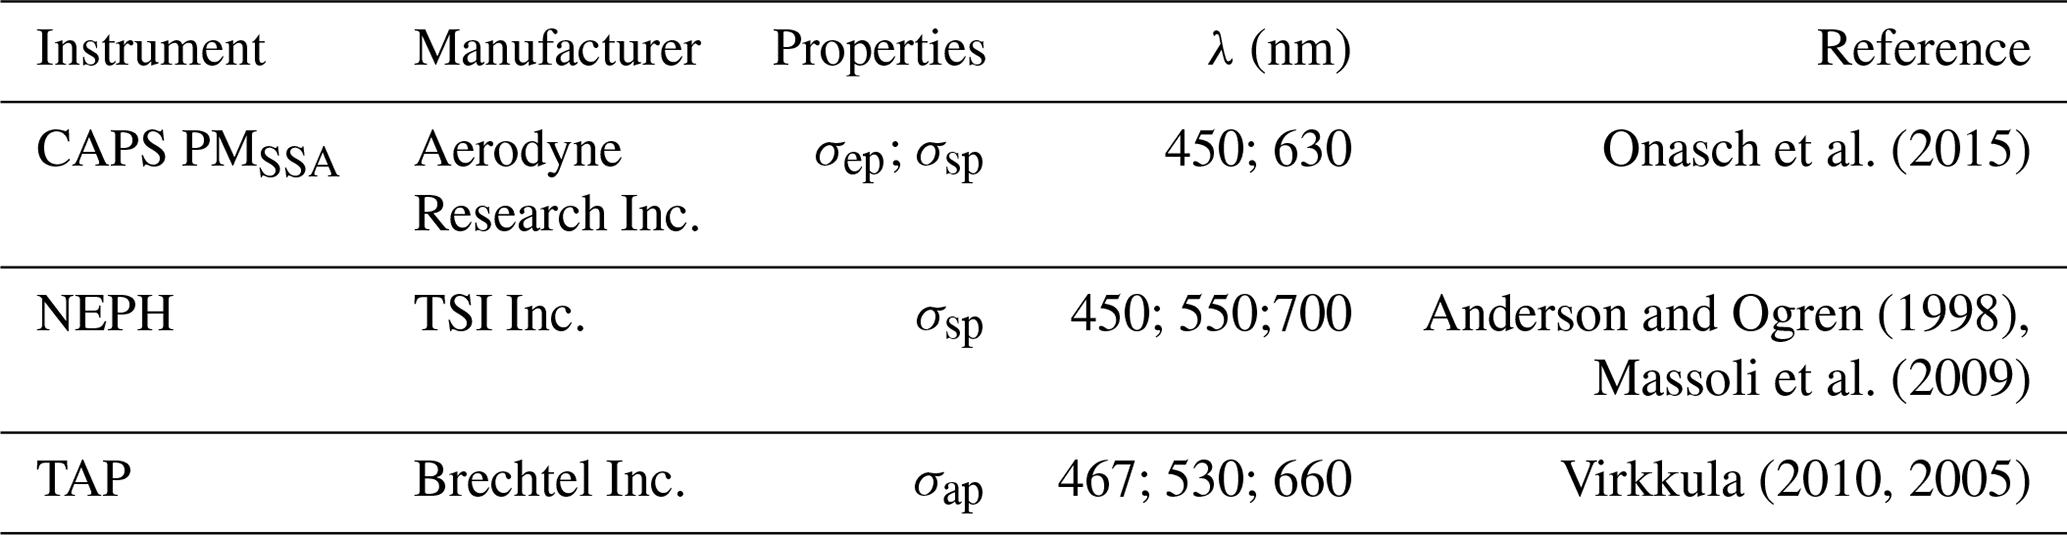
The suite of optical instruments used in this study included the following instruments. The particle-scattering coefficient, σsp, was measured with an integrating multi-wavelength nephelometer (NEPH; Model 3563, TSI Inc., Shoreview, MN, USA; (Bodhaine et al., 1991) and with the scattering channel of the CAPS PMSSA (CAPS PMSSA, Aerodyne Research Inc., Billerica, MA, USA; Onasch et al. (2015), which is derived from a measurement of the total extinction and single-scattering albedo. For the particle light-absorption coefficient, σap, we used the tricolour absorption photometer (TAP; Brechtel Inc., Hayward, CA, USA), which is based on the well-known particle soot absorption photometer (PSAP; ARM Research) and the continuous light-absorption photometer (CLAP) developed by the NOAA (Ogren et al., 2017). The particle light-extinction coefficient, σep, was directly measured with the phase shift channel of the CAPS PMSSA.
The light-extinction channel of the CAPS instrument has an uncertainty of 5 % and a precision of 2 % and a scattering uncertainty of 8 % and 2 % precision, respectively (Onasch et al., 2015). The TAP has an uncertainty of around 8 %, with a precision of 4 % (Müller et al., 2014; Ogren et al., 2017), while the NEPH has an uncertainty of less than 10 % and a precision of about 3 % (Anderson and Ogren, 1998; Massoli et al., 2009). These literature-derived uncertainty estimates for measurement accuracy will be used in this study for instrument closure, either directly or via error propagation. Individual point averages will be shown with corresponding precision variances.
2.3 Aerosol generation
Table 1 provides a complete list of all aerosol types used in the study. Solutions of known concentrations of Aquadag (AQ; aqueous deflocculated Acheson graphite; Acheson Industries, Inc., Port Huron, MI, USA), Cabot black (BC) and magic black (MB; an acrylic based paint) were prepared on a daily basis by ultra-sonication before nebulization in a constant output atomizer (Model 3076, TSI Inc.). The count median diameter (CMD) and geometric standard deviation (GSD) of the ammonium sulfate nebulized by the constant output atomizer depends on the concentration of the salt solution and the flow through the atomizer. Use of constant flow rates and particle concentrations produced constant size distributions (Liu and Pui, 1975). The inverted flame soot generator (Argonaut Scientific Corporation, Edmonton, AB, Canada) was operated with a pre-determined oxidation-air-to-propane ratio of 7.5 L min−1 air to 0.0625 L min−1 propane so that the flame produced a stable and low-organic-carbon soot. It has previously been shown that at least 30 min was necessary for the Argonaut flame to reach stable aerosol concentrations (Bischof et al., 2019; Kazemimanesh et al., 2018).
Initially, pure aerosol types were generated independently and measured to quantify their size distributions and optical properties. The main part of the study was focused on making external mixtures of ammonium sulfate and each of the absorbing particle types, separately. These mixtures were controlled to provide a stable aerosol with varying intensive optical properties.
2.4 Data treatment
2.4.1 Instrument corrections and calibrations
The CAPS PMSSA instrument extinction channel was calibrated using polystyrene latex bead (PSL) particles as a reference standard and Mie theory using a BHMIE Python code derived from Bohren and Hoffman (1983). Additionally, the 450 nm wavelength CAPS PMSSA calibration was validated using measurements of CO2 Rayleigh scattering. The scattering channel of the CAPS PMSSA was internally adjusted to the extinction channel using ammonium sulfate as a light-scattering aerosol, assuming a single-scattering albedo of 1.0. A truncation error correction was not necessary regarding the size of the aerosols used (Onasch et al., 2015a) since all the aerosols used had a median diameter smaller than 200 nm. The CAPS PMSSA, which is subject to baseline drift as the system heats up, stabilized after 30 min of operation (Faria et al., 2019).
The NEPH was calibrated using CO2 (Modini et al., 2021; Anderson and Ogren, 1998). Truncation corrections were made using the approaches developed by Anderson and Ogren (1998) for purely scattering aerosols and by Massoli et al. (2009) for aerosol mixtures containing light-absorbing particles. The truncation corrections applied were always equal to or less than 5 %. Because of the reduced airflow, the NEPH needed at least 15 min to reach a stable plateau after changing aerosol generation settings.
A new filter spot for the TAP was selected for each measurement in order to minimize measurement uncertainties due to particle-loaded filters. The first correction regarding truncation is done by the included software. The software has the capability to choose the Ogren correction scheme based on the filter type used (quartz fibre, BT-TAP-FIL100, ENVILYSE). Further corrections were made according to Virkkula (2010).
Table 2List of applied correction algorithms to optical instruments.
2.4.2 Aerosol optical properties derived from primary measurements
The extensive parameters for aerosol light interactions are extinction, scattering and absorption. When two of them are known, the missing one can be calculated with the help of this equation:
where σep is the extinction coefficient, σsp the light-scattering coefficient and σap the coefficient for light absorption by particles. The unit of all these parameters is inverse megametres (Mm−1; 1 Mm m−1). When solving Eq. 1 for σap, it is possible to derive the absorption coefficient by combining CAPS PMSSA extinction measurements with either CAPS PMSSA or NEPH scattering measurements (σap(CAPS, CAPS) or σap (CAPS, NEPH)) for comparison. In the following, this is called the differential method (DM).
To calculate the single-scattering albedo (SSA), the particle light scattering must be divided by the particle light extinction:
The Ångström exponents (AEs) are calculated from
By solving Eq. (3) for σp(λ1) and assuming a valid Ångström exponent the resulting Eq. (3a) is used for wavelength adjustments
For the particle coefficient σxp, the corresponding σsp, σep, or σap could be put into calculations (Eq. 3) to obtain the absorption Ångström exponent (AAE), extinction Ångström exponent (EAE) and scattering Ångström exponent (SAE), accordingly.
2.4.3 Error propagation
Error propagation is determined by Gaussian error propagation:
where
Those equations could be expanded if the instruments where not calibrated properly, as Sherman (2015) proposed, but are in accordance with the BIPM (Bureau International des Poids et Mesures).
2.4.4 Data averaging
For each experiment run, a different aerosol mixture was generated with different optical properties and allowed a steady state to be reached, including waiting ∼15 min due to the slow time response of the low-flow NEPH. At steady-state conditions, we measured size and optical properties fluctuating <2 % over time with the OPC, CAPS PMSSA and NEPH. All instruments recorded data at a 1 s rate. Reported data points are given as averages of 100 s of stable-aerosol production. This value was chosen to obtain a minimum in data precision and detection limits as determined from Allan standard deviation plots by Massoli et al. (2010) for the CAPS extinction measurements and Ogren et al. (2017) for filter-based absorption measurements. Averaging for longer periods would only increase variances due to transmission (TAP) and baseline drift (CAPS).
3.1 Pure aerosol types
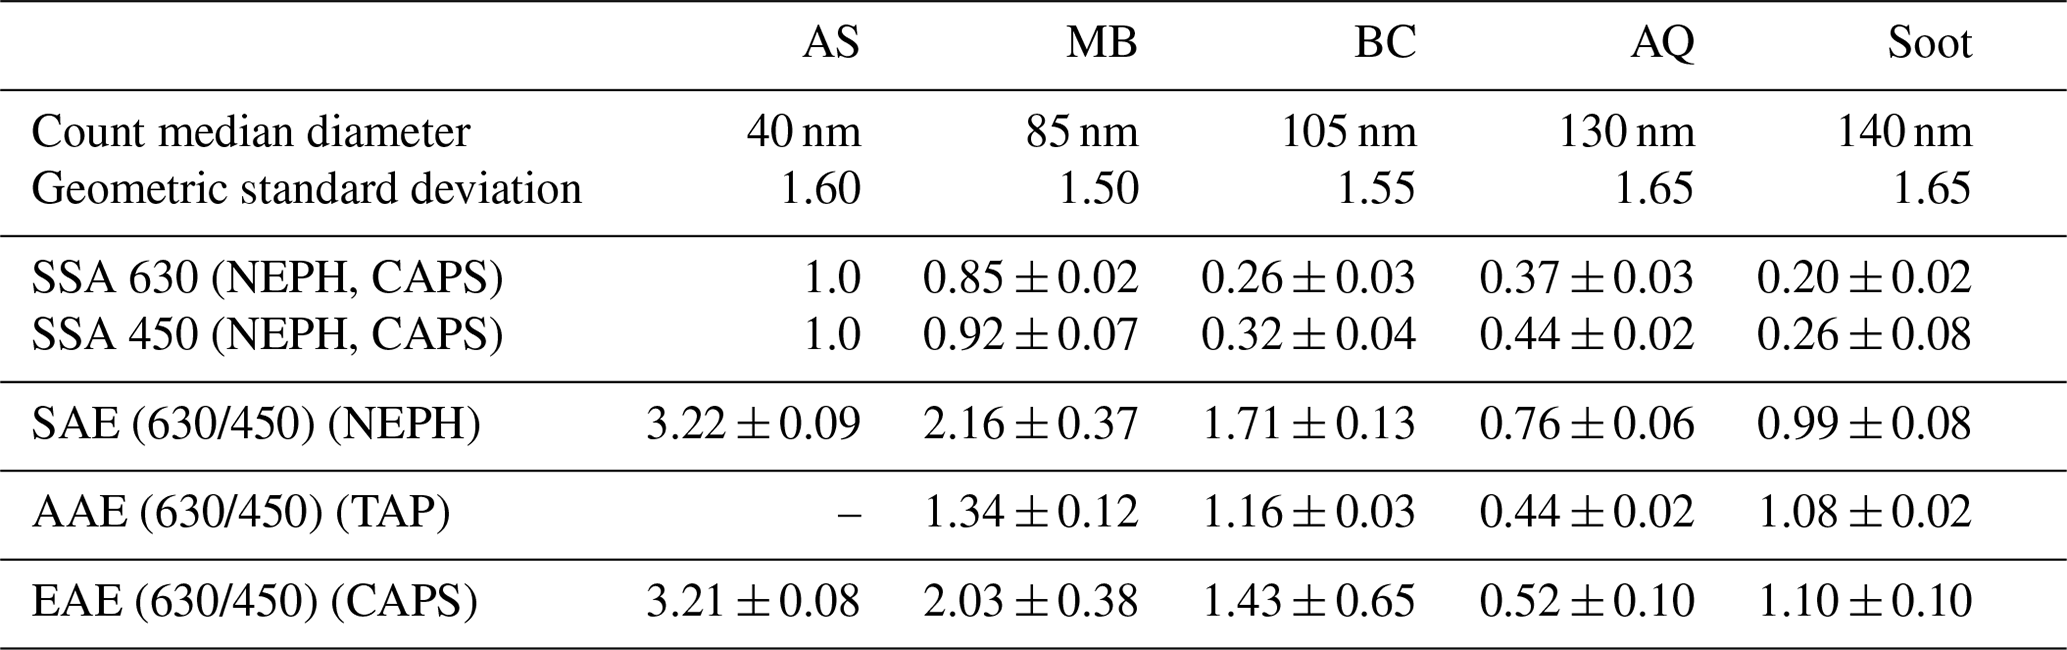
The measured size parameters and calculated intensive parameters of the pure aerosol types are summarized in Table 3. The errors reported in Table 3 are calculated from error propagation. The size distributions of the different aerosol types were measured with a Grimm SMPS and are shown in Fig. 2 normalized to 1000 particles per cubic centimetre. The Ångström exponents for the pure substances fall within typical ranges for these types of aerosols and size distributions reported in the literature. For example, the SAE decreases from a value of 3.22 for 40 nm AS particles, which is close to the SAE value of 4 for air molecules with increasing particle diameter. Thus, the SAE drops to 0.76 for 130 nm compact AQ particles but increases to 0.99 for 140 nm fractal agglomerate soot. The shape of AQ is assumed to be more compact than the soot agglomerates, such that their scattering and electrical mobility behaviours are dependent mainly upon their physical diameters. In contrast, the scattering behaviour of the fractal soot agglomerates is due mainly to the distribution of primary particles, whereas their electrical mobility diameter is more dependent upon the major axis of the agglomerate. As expected by Eq. (3a), the SSA increases with decreasing wavelength (Bohren and Huffman, 1983). The AAE for fractal combustion soot is close to 1, as reported by Török et al. (2018) for the mini-CAST soot generator.
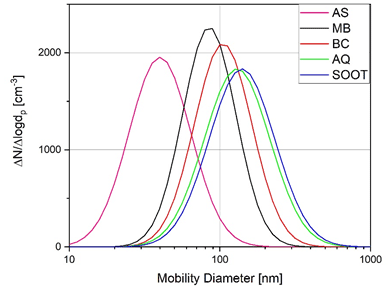
Figure 2Measured size distributions by SMPS for the pure aerosol types used, normalized to an assumed total concentration.
Table 3Overview of the measured intensive optical properties of the pure aerosol types.
3.2 Extensive parameters of aerosol mixtures
First, the extensive parameters must be validated for all instrument combinations to ensure the reliability of the intensive parameters derived from them. We have chosen to use external mixtures of AS and AQ particles for these studies as they are both readily atomized, generating highly stable aerosols for the necessary time periods for averaging. We note that AQ-absorbing aerosols are commonly used as a reference material for instrument comparisons (Foster et al., 2019). The results for mixtures of AS with the other absorbing aerosol types are included in Tables 6–9.
The two CAPS PMSSA's (450 and 630 nm wavelengths) measured the extinction coefficient of particles directly with a small precision error of around 2 % (Modini et al., 2021). In Fig. 3, we show scatter plots of these direct extinction coefficient measurements (x axis) in comparison to the absorption coefficient measured using the TAP and the scattering coefficient measured using the NEPH combined using Eq. 1 in the form (y axis) for wavelengths of 450 nm (Fig. 3b) and 630 nm (Fig. 3a).
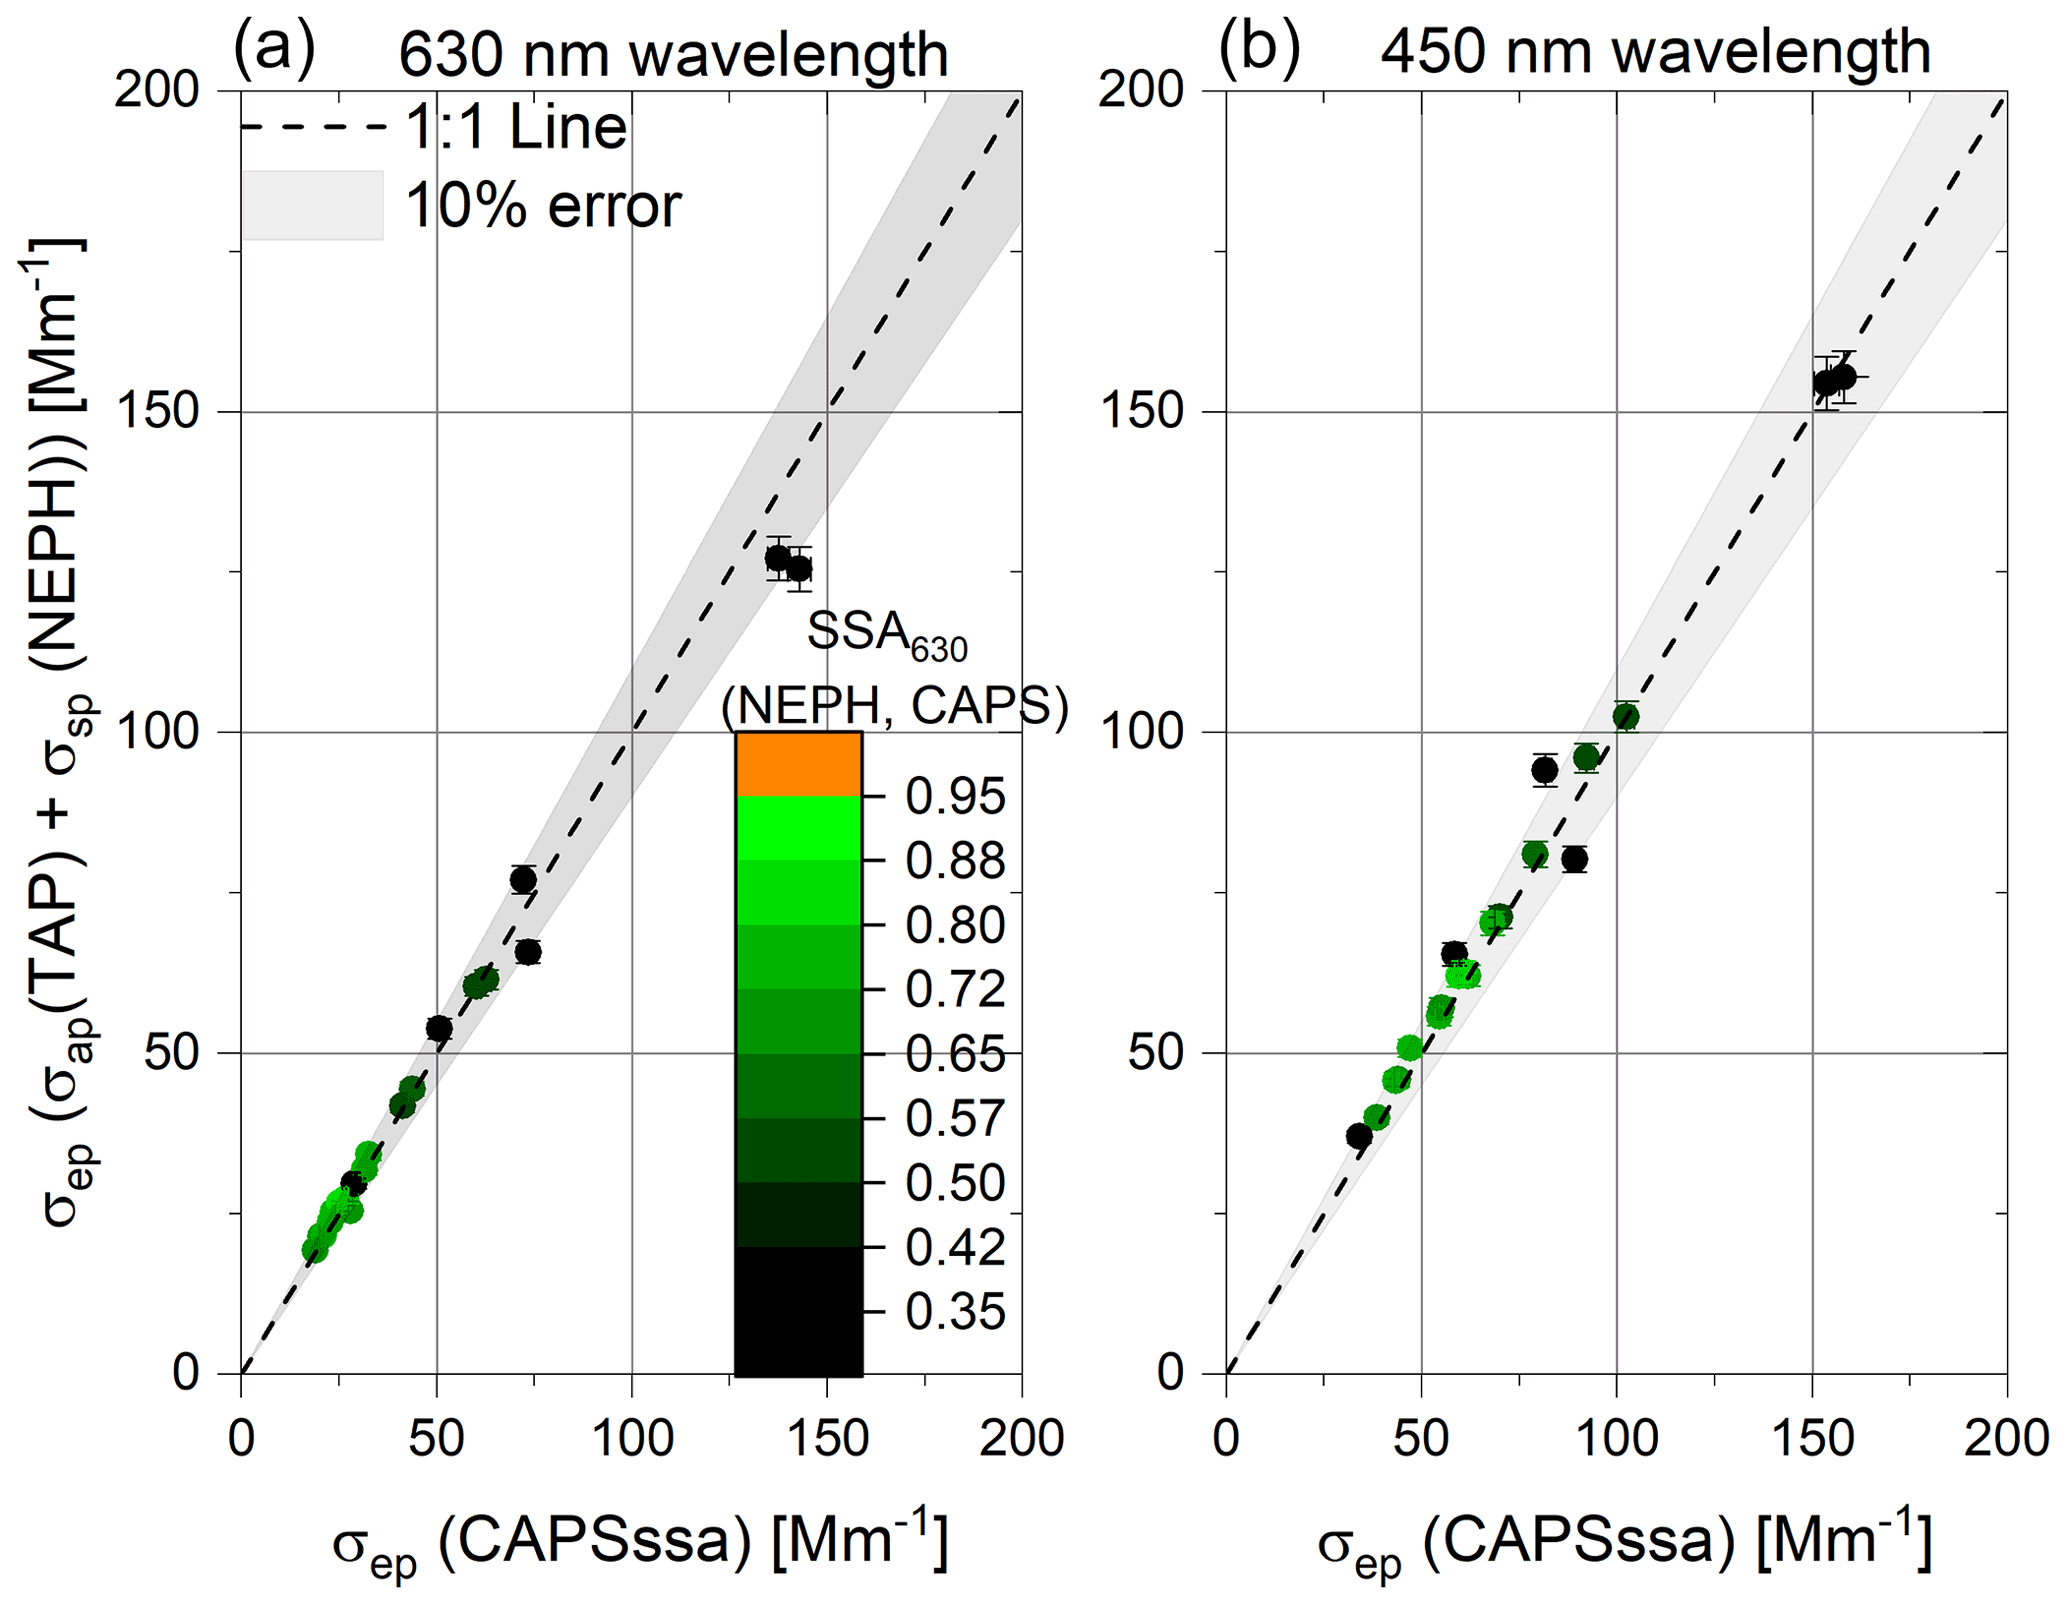
Figure 3Scatter plots of the extinction coefficients for different AQ–AS external mixtures at 630 nm (a) and 450 nm wavelengths (b). The y axes show the extinction coefficients derived by combining TAP absorption and NEPH scattering coefficients versus the CAPS PMSSA direct extinction coefficient measurements. The colour code represents the SSA of the analysed mixed aerosol measured at 630 nm wavelength. In addition, an error band of ±10 % was added to the 1:1 line.
Here, the measured 630 nm SSA colour code serves as a proxy for the mixing ratio of the external mixtures of nebulized AQ and AS particles. The measured 630 and 450 nm extinction coefficients align with the 1:1 line within 10 % across a broad range of extinction values as well as SSA values ranging from 0.3 to close to 1. The 10 % was chosen to show the fulfilment of the requirements of Laj (2020) for aerosol properties. This shows that the instruments are not sensitive to the SSA of the particle type used at either wavelength of interest.
The measured scattering coefficients at 450 and 630 nm wavelengths are compared using scatter plots for the different techniques in Fig. 4. Here, we use the NEPH and the integrating sphere channel of the CAPS PMSSA instrument capable of measuring the scattering coefficient directly. In addition, we calculated the scattering coefficients using a differential method (DM), solving Eq. (1) for the scattering coefficient by subtracting the absorption coefficient measured by the TAP from the extinction coefficient measured by CAPS PMSSA. The NEPH is used as a reference because it has well-proven correction functions for light-absorption particles, as described in Sect. 2.4.1.
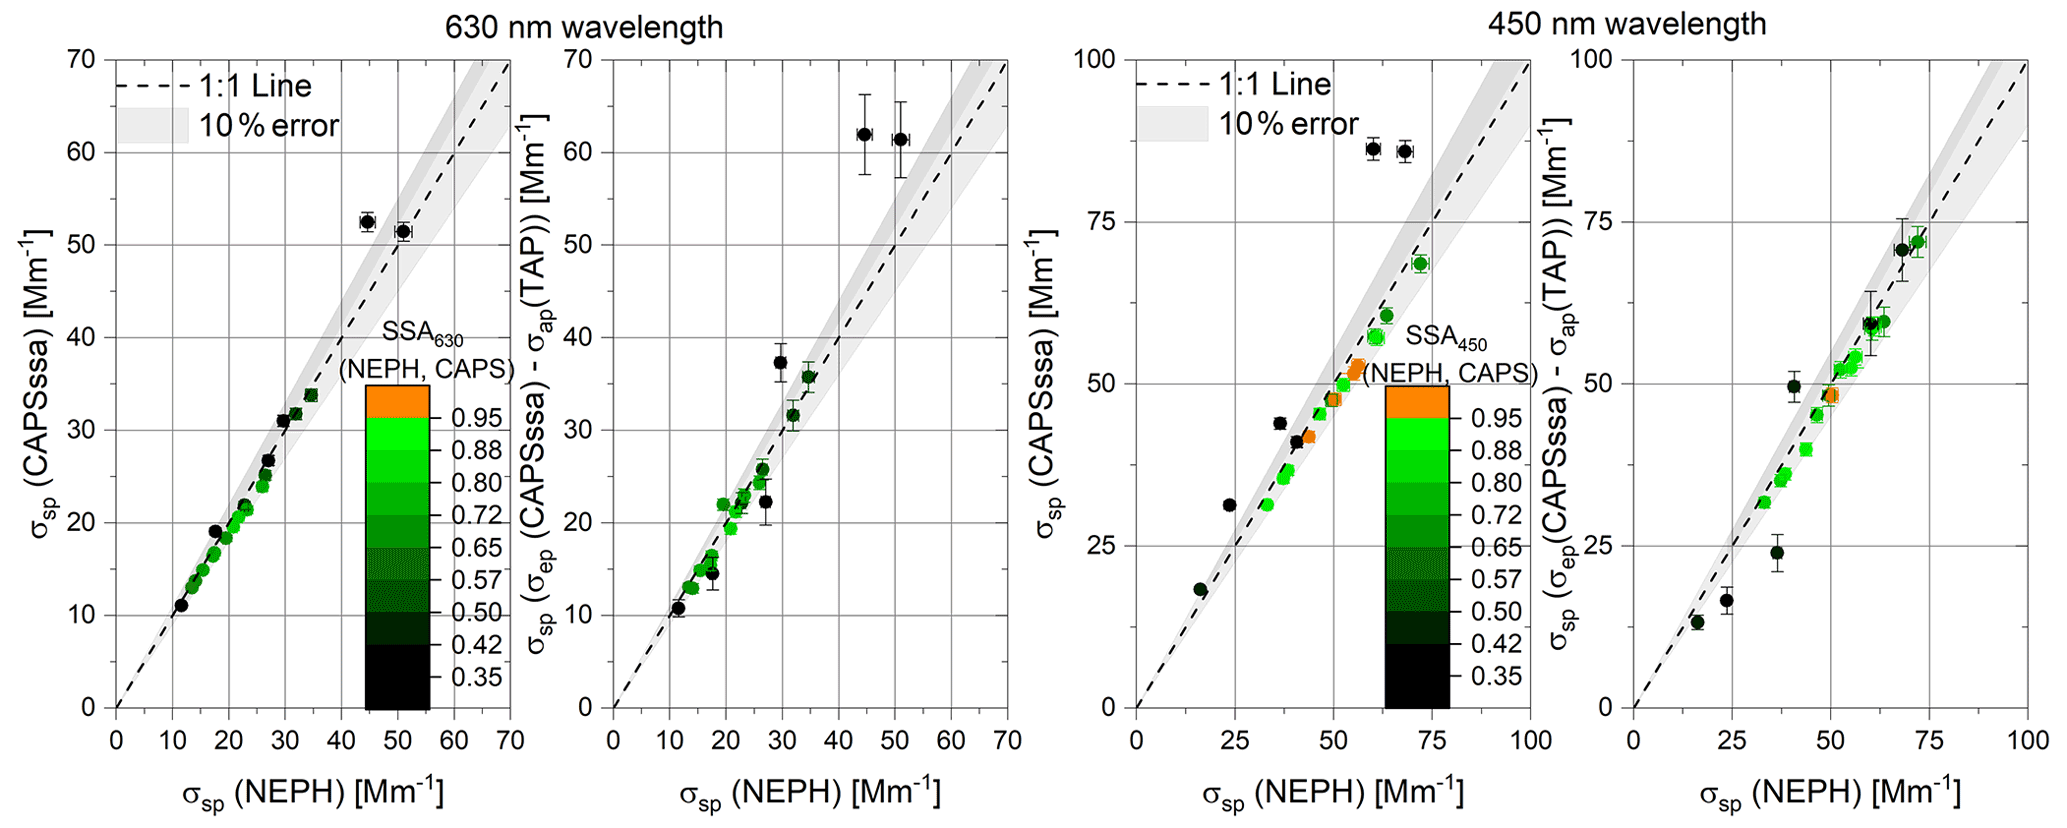
Figure 4Comparisons of measured light-scattering coefficients at 450 and 630 nm wavelengths for mixtures of AQ and AS aerosols. The y axes show the CAPS PMSSA (integrating sphere) or the differential method (CAPS extinction minus TAP absorption) scattering versus NEPH scattering measurements at 450 and 630 nm wavelengths. The colour code represents the SSA value of the measured aerosol mixture. An error band of ±10 % was applied to the 1:1 line. Error bars shown represent instrument precisions (1σ).
The measured scattering coefficients at both 450 and 630 nm wavelengths agree within 10 % for the majority of measurements. There is no apparent dependence of measured scattering coefficients with scattering coefficient magnitude (over the range measured) nor with aerosol SSA, an indicator of the external mixing ratio. Several outliers are visible, particularly for points with SSA values ∼0.35, indicating nearly pure AQ aerosols. For the scattering coefficients derived using the differential method (CAPS extinction minus TAP absorption), some of the scatter may be due to the larger uncertainties associated with the filter-based absorption measurements, as discussed in the Reno study (Sheridan et al., 2005). The outliers in the CAPS vs. NEPH plots, especially at 450 nm wavelength, are currently unexplained and are likely due to apparent stability issues for these points.
Particle light-absorption coefficient measurements are the most complicated as none of our optical instrument techniques directly measure absorption. We have two methods for measuring absorption coefficients: (1) the differential method following Eq. (1), using either σap (CAPS, NEPH) = σep (CAPS) – σsp (NEPH) or σap (CAPS, CAPS) = σep (CAPS) – σsp (CAPS), and (2) filter-based TAP measurements. As the filter-based method requires the application of multiple, empirical correction schemes, we have chosen σap (CAPS, NEPH) as the reference for the comparison of the σap (TAP) and σap (CAPS, CAPS) values.
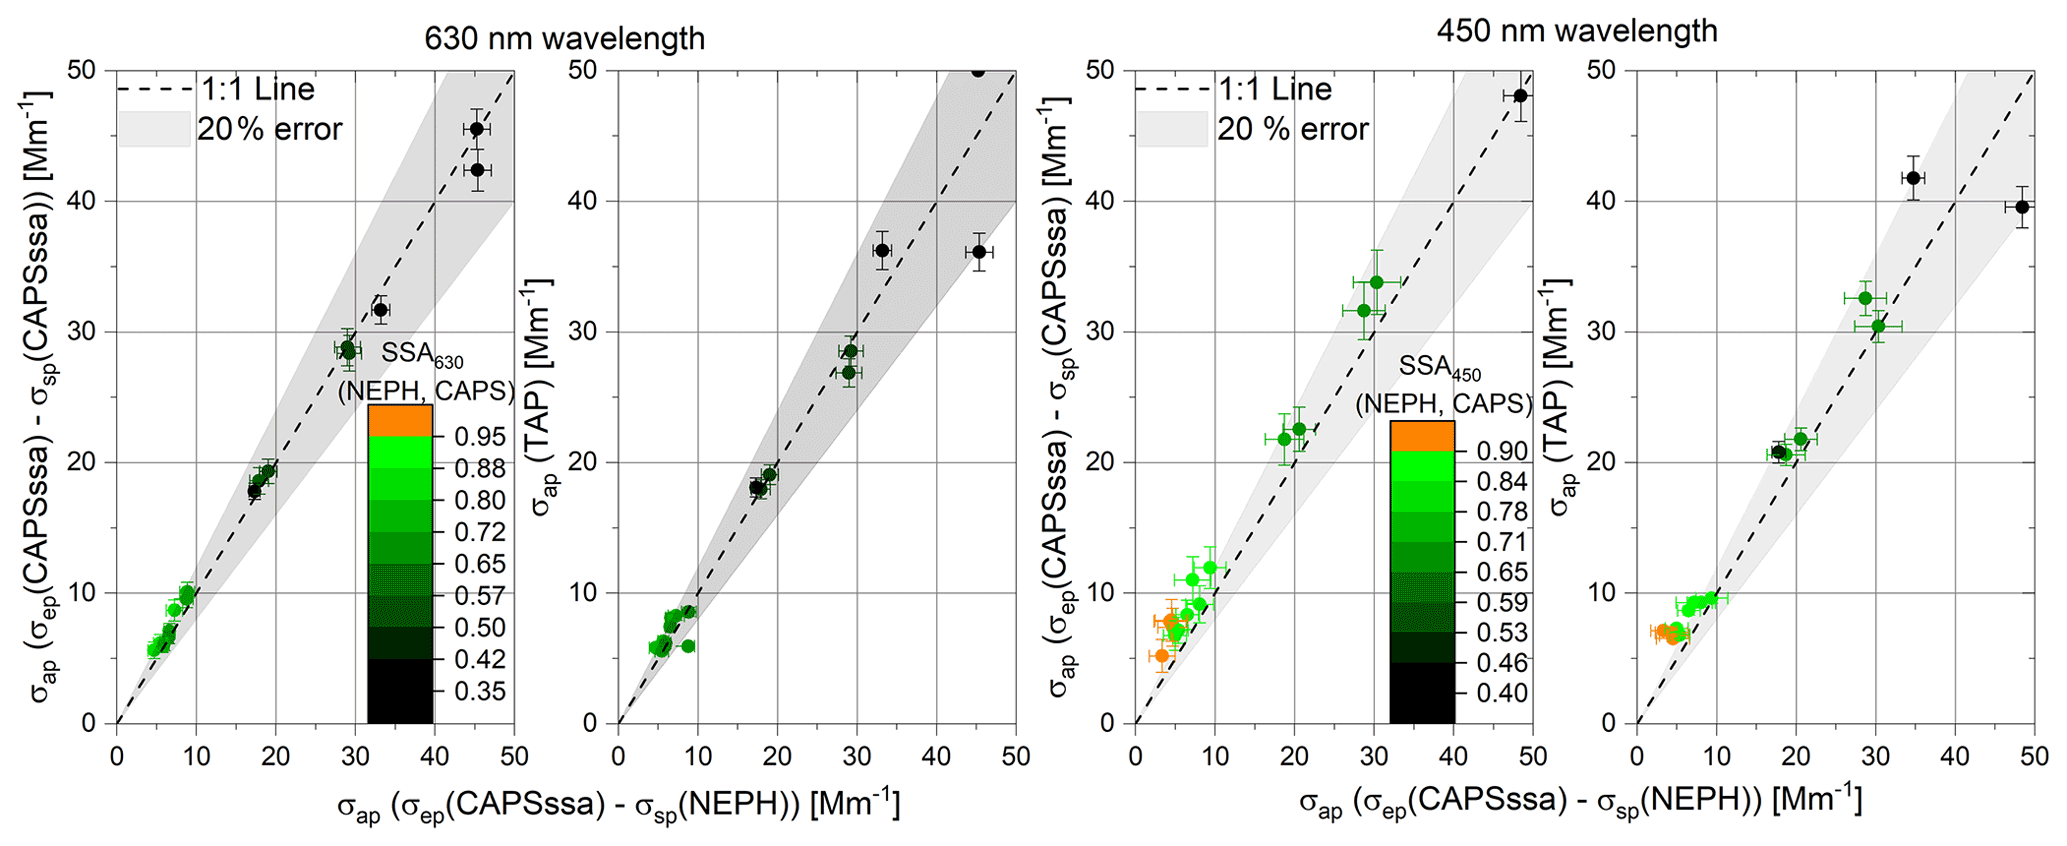
Figure 5Scatter plots of measured 450 and 630 nm wavelength absorption coefficients of external mixtures of AQ and AS for different instrument combinations. The colour code represents the SSA value of the respective data point. An error band of ±20 % was applied to the 1:1 line, which is required by Laj (2020) for light-absorption measurements. Error bars shown represent propagated instrument precisions (1σ).
In Fig. 5, the light-absorption measurements at wavelengths of 450 and 630 nm are compared. We chose to include 20 % error bands for these comparisons, though the overall uncertainty for filter-based absorption measurements is often estimated to be 30 % (Bond et al., 1999). Most of the data points shown fall within the 20 % error band, with some exceptions for aerosols with low absorption and high SSA values.
Table 4Linear regression results of scattering (σsp), extinction (σep) and absorption (σap) coefficients from Figs. 3–5 for external mixtures of AQ and AS particles, given as slopes (m), Pearson R and y axis intercepts (b).
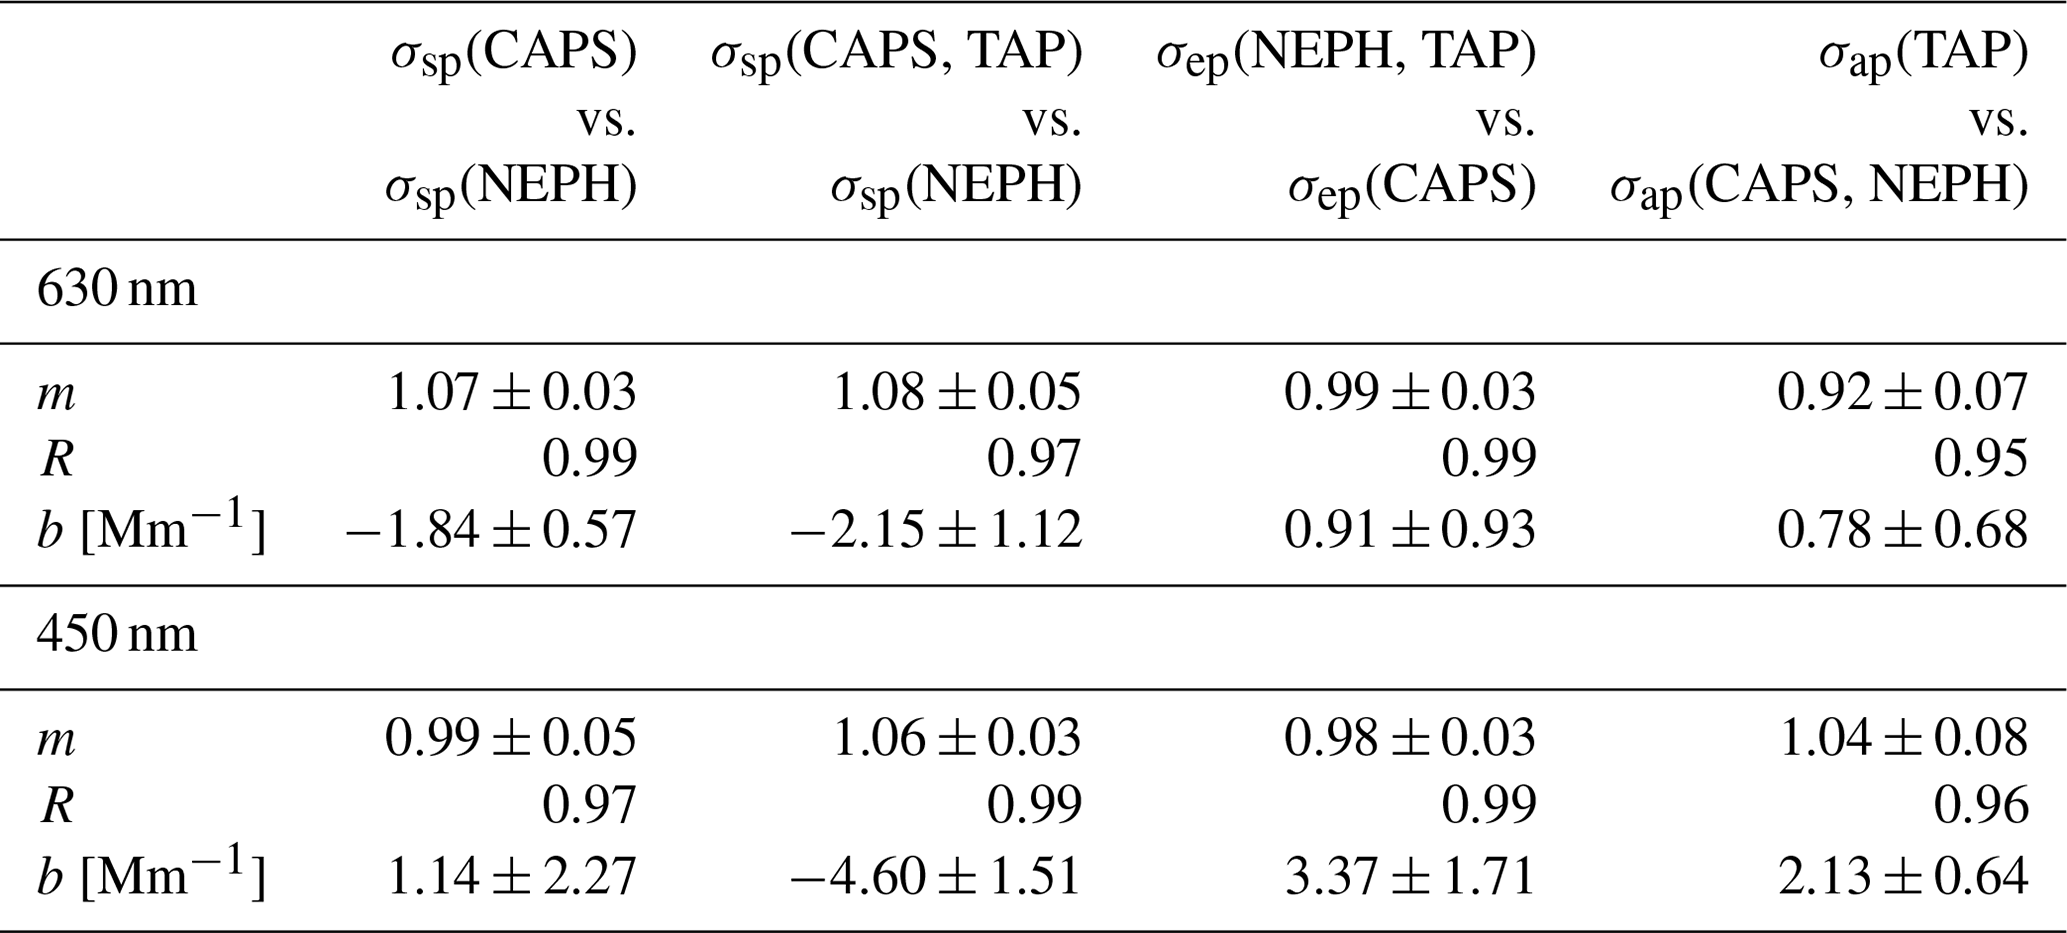
The high Pearson correlation (R>0.95) coefficients in Table 4 indicate that the correlations are highly linear. The primary focus for this study was to have most of the experimental runs exhibit light extinctions between 5 and 150 Mm−1, representative of atmospheric conditions. The slopes are all close to unity within the expected errors ranges, or at least single-instrument uncertainty, indicating closure has been achieved for these optical measurements. Thus, the extensive parameters can be trusted for instrument comparison, especially for the light-scattering and light-extinction information. We provide regression analyses for all other absorbing aerosol types externally mixed with AS in Tables 7–9.
Excellent agreement (R>0.97) is shown for σsp measurements of the NEPH and the CAPS PMSSA scattering channel, indicating that the CAPS PMSSA scattering channel be considered as a substitute for the nephelometer scattering measurement. Trade-offs in the CAPS PMSSA versus NEPH comparison include the three wavelengths and backscatter measurements of the NEPH versus the single wavelength of the CAPS PMSSA, countered by the additional extinction measurement of the CAPS PMSSA allowing for absorption and SSA values to be simultaneously measured.
In addition to regression analyses, where outliers and/or high values can dominate the fitted slope of the regression, another statistical approach is to investigate the ensemble-averaged instrumental ratios (σap (instrument 1)/σap (instrument 2)), which is more sensitive to errors at low values. Resulting 630 and 450 nm wavelength absorption coefficient ratios are tabulated in Tables 5 and 6, respectively. The average ratios are calculated from the points shown in Fig. 5 for AQ and AS mixtures and from results obtained for the other absorbing particle types externally mixed with AS particles.
Table 5Ensemble-average ratios of σap (TAP)/σap (CAPS, NEPH) at 630 nm wavelength. N denotes the number of experiments used for the average.
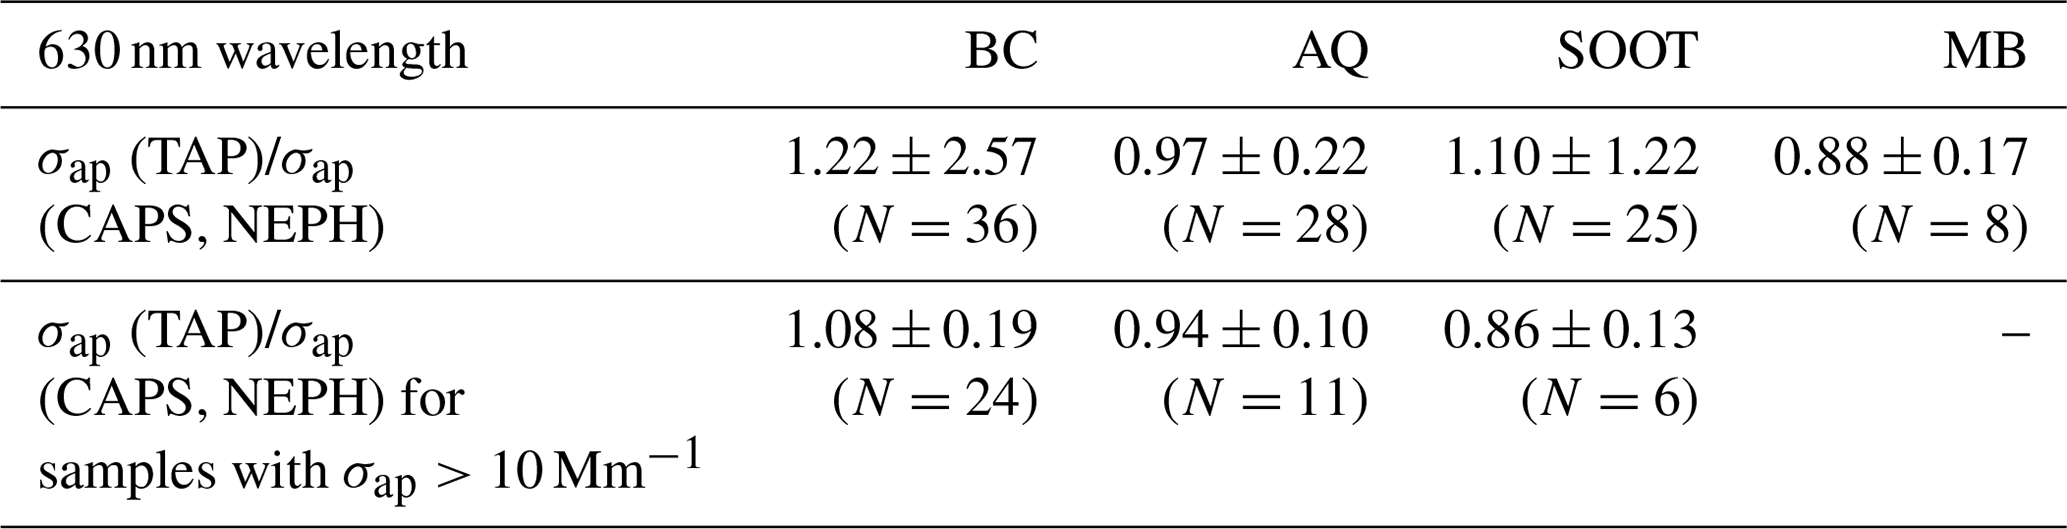
Table 5 demonstrates that the light-absorption values agree for the different methods in general. With an ensemble average for the ratio σap (TAP)/σap (CAPS, NEPH) of 0.97±0.22, good agreement is confirmed, with over 60 % of all data points for external mixtures of AQ and AS falling within a range of σap (TAP)/σap (CAPS, NEPH) = {0.8–1.2}. These results support the linear regression results in Table 4, though they exhibit larger scatter due to the greater sensitivity to small errors at low values.
The average ratios for other externally mixed absorbing aerosol types deviate more from unity than AQ mixtures. Most of this scatter can be ascribed to the greater sensitivity of the ratio to small errors at low values. By filtering these ratios for points with σap>10 Mm−1, approximately 80 % of the data are within the range of 0.8–1.2. The ratios for σap<10 Mm−1 exhibited almost no modal value in the relative frequency distributions, confirming that scatter in low values significantly affects the average ratios.
Table 6Ensemble-average ratios of σap (TAP)/σap (CAPS, NEPH) at 450 nm wavelength. N denotes the number of experiments used for the average.
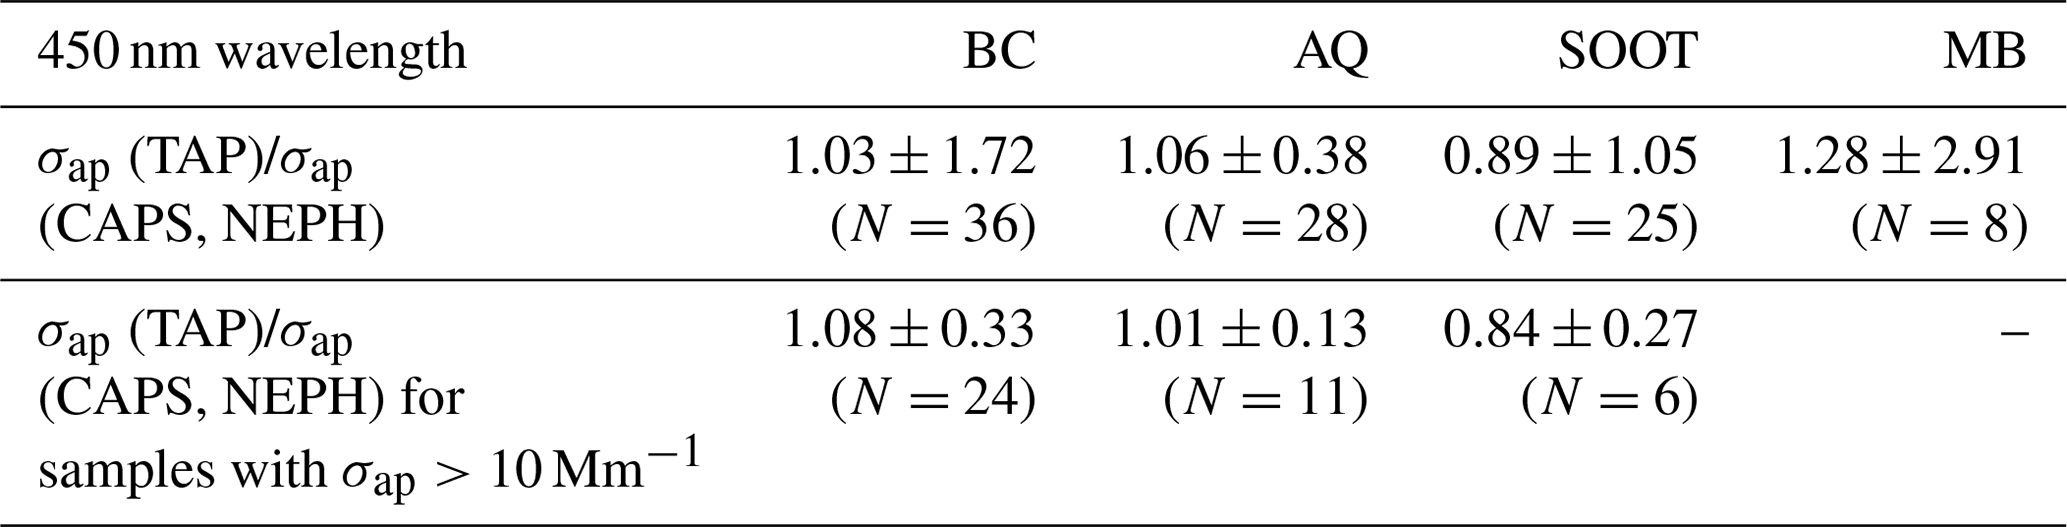
Redoing this analysis for 450 nm wavelength, the light extinction and scattering of smaller particles increases compared to the values at 630 nm wavelength. As a result, the errors in calculating the 450 nm wavelength absorption coefficients from the differential method also increase. As demonstrated in Table 6, only the variance for the ratio σap (TAP)/σap (CAPS, NEPH) for compact AQ particles was less than 1 (i.e. <100 %), with over 50 % of the data being within the range of 0.8–1.2. All ensemble-average ratios were close to 1; however, with an associated error of up to ±1.7 (i.e. ±170 %), these values are not significant, which means that the ratios scatter widely with no clear modal value. Again, filtering the 450 nm data for σap>10 Mm−1 greatly improves the results, with ratios σap (TAP) (CAPS, NEPH) = 1.08±0.33 for BC. The best instrumental ratio of 1.01±0.13 is shown for AQ mixtures in Table 6 at 450 nm wavelength.

Figure 6Variance of the measured absorption coefficients (σap (CAPS, CAPS)/σap (TAP)) for differential method calculations relative to TAP measurements for AQ and AS external mixtures. The ratios are plotted against the aerosol measured SSA values (SSA(CAPS, CAPS)). The red line represents the calculated relative errors using Gaussian error propagation of the uncertainties in the DM with 1 as 100 %.
In order to demonstrate the dependency of the uncertainties associated with the differential methods for deriving σap values on the SSA, the ensemble variance ratios of σap (CAPS, CAPS)/σap (TAP) are shown as functions of SSA in Fig. 6. For SSA values greater than 0.9, light-absorption coefficients derived for the DMs have propagated uncertainties over 100 % independently of their load. The experimental data align within these calculated relative uncertainties.
Table 7Linear regression results of scattering (σsp), extinction (σep) and absorption (σap) coefficients for external mixtures of BC and AS particles, given as slopes (m), Pearson R and y axis intercepts (b).

Table 8Linear regression results of scattering (σsp), extinction (σep) and absorption (σap) coefficients for external mixtures of SOOT and AS particles, given as slopes (m), Pearson R and y axis intercepts (b).
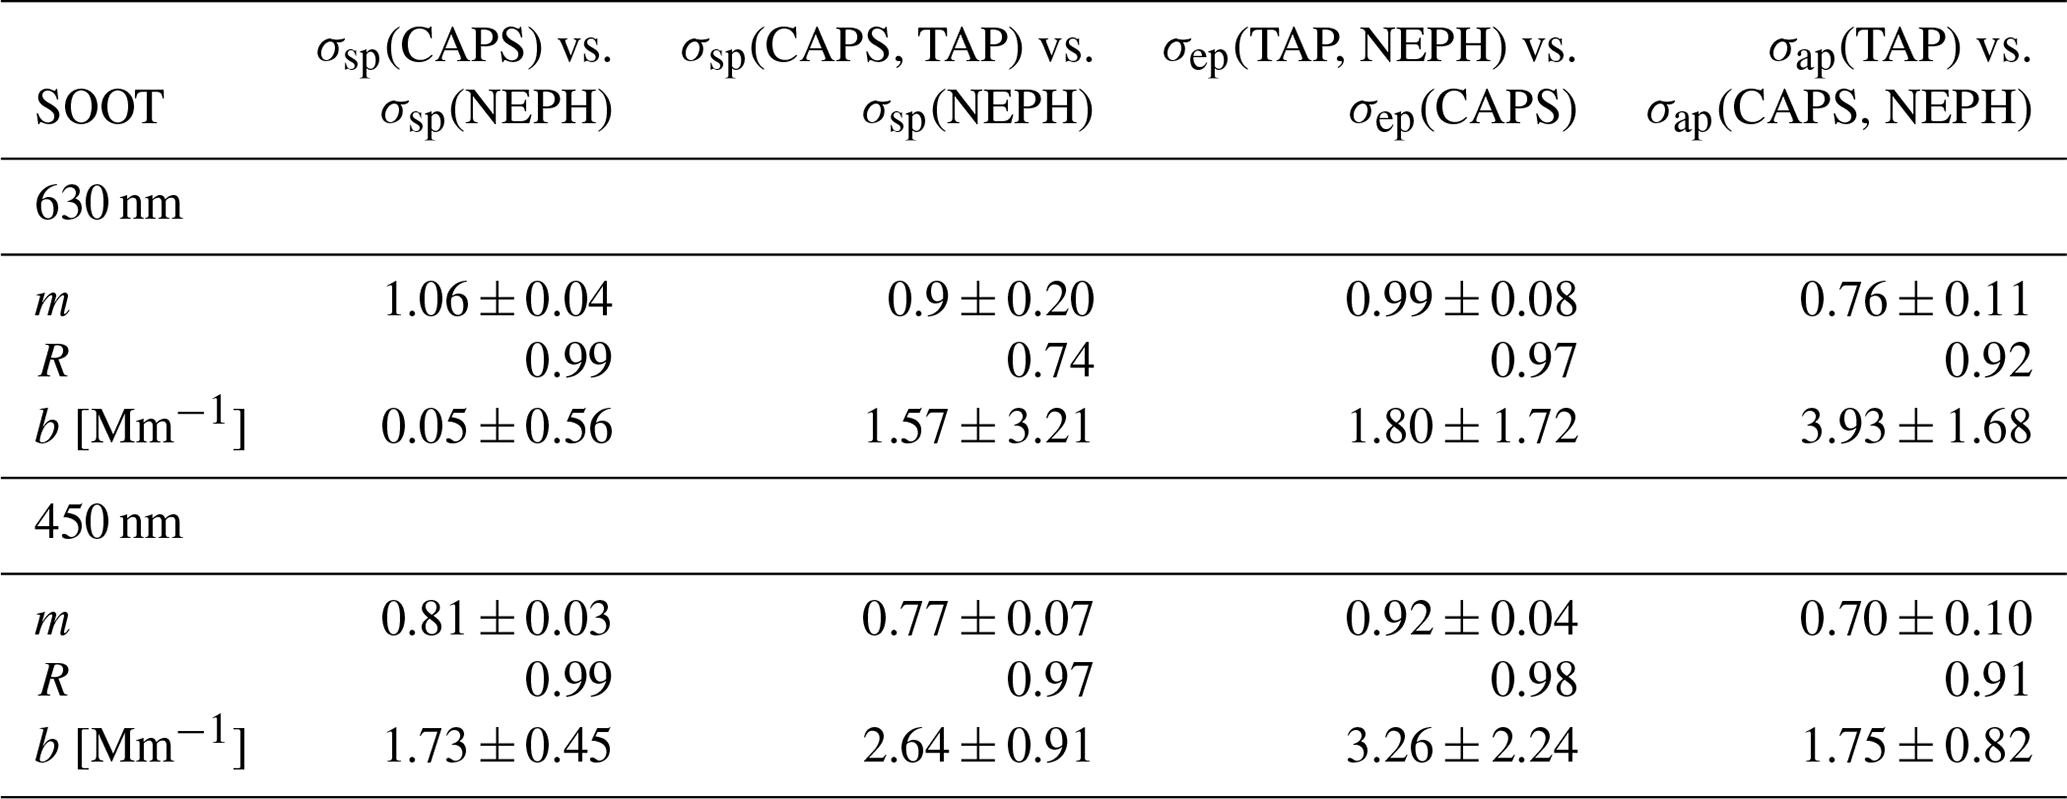
Table 9Linear regression results of scattering (σsp), extinction (σep) and absorption (σap) coefficients for external mixtures of MB and AS particles, given as slopes (m), Pearson R and y axis intercepts (b).
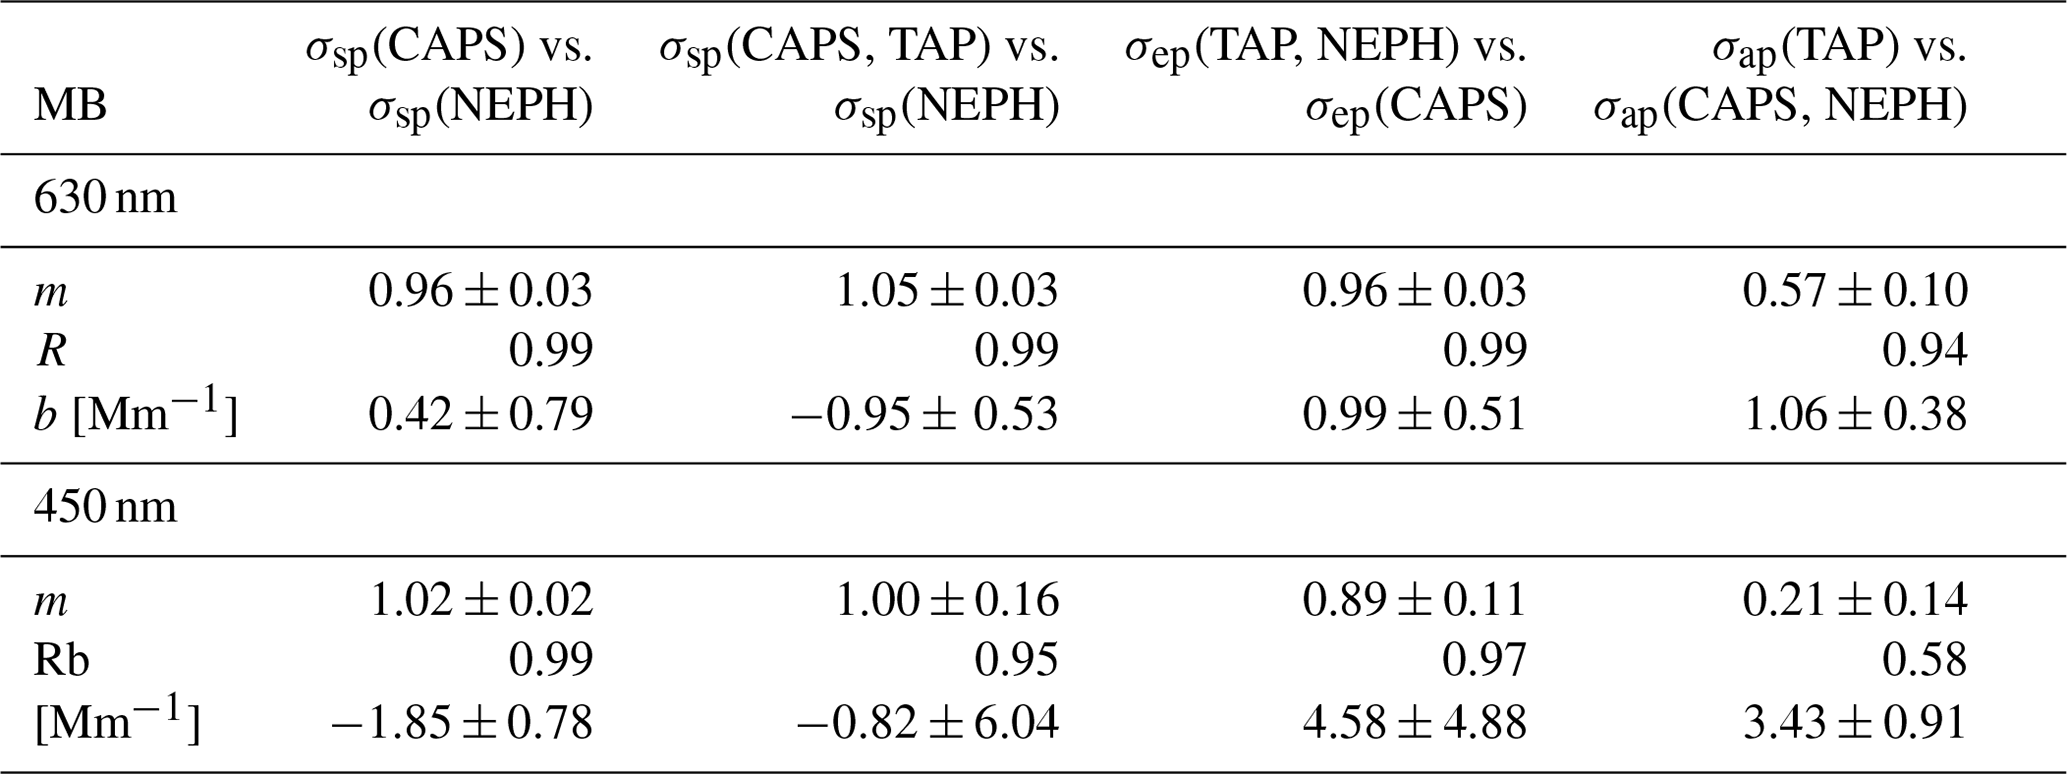
The linear regression analyses reporting fitted slopes, Pearson coefficients, and y offsets for attenuation coefficients for external mixtures of AS and the different light-absorbing aerosol types are presented in Table 7 (BC), Table 8 (SOOT) and Table 9 (MB). For 630 nm wavelength results, high Pearson coefficients (R>0.96) with negligible offsets (b<1 Mm−1) and slopes ranging from 0.90 to 1.05 demonstrate good agreement (i.e. closure) for scattering and extinction coefficient measurements. Especially for MB and SOOT, the TAP measurements tend to overshoot the differential method value by 20 %–40 %, whereas for BC the difference is only 10 %. The reason could be that soot is a fractal agglomerate, and in situ methods as well as filter-based methods give different results as a function of the primary particle size (Sorensen, 2010) as well as of the previously mentioned filter-based artefacts, including changes in the slope at higher σap (TAP) values. We measured values for BC ranging from 14 to 400 Mm−1 for σep,630 nm, 1 to 322 Mm−1 for σap,630nm and 12 to 174 Mm−1 for σsp,630 nm. For SOOT, we measured values ranging from 12 to 158 Mm−1 for σep,630 nm, 1 to 322 Mm−1 for σap,630 nm and 5 to 80 Mm−1 for σsp,630 nm.
For 450 nm wavelength results, similar slopes, Pearson R and y offset values are reported. Linear regression slopes for SOOT decrease at the lower wavelength to a value of 0.77 for light scattering and 0.7 for light absorption. This decrease may well be an effect of the primary particle size of agglomeration since those relationships change with the wavelength. For MB, the light-absorption measurements using the DM show the highest difference compared to the TAP measurement, with a regression slope of 0.21±0.14. The reasons could include different absorption behaviour (i.e. filter-based artefacts) for the filter-based method relative to in situ measurements (Lack et al., 2008). Unfortunately, no clear understanding of the MB particle shape, phase or uniformity could be made during this study.
3.3 Intensive parameters of aerosol mixtures
3.3.1 Single-scattering albedo (SSA)
The single-scattering albedo (SSA), an important climate parameter, is investigated here as a relative measurement using multiple different methods of derivation to determine if closure between the different methods can be achieved.
The SSAs for different combinations of instruments are derived using Eq. (2), with the instruments used denoted in parentheses in Eqs. (7)–(10).
We have chosen to use the SSA(NEPH, CAPS)-derived SSA values as a reference for these studies as this method allows us to test the CAPS-measured SSA with an independent, established method (Sheridan et al., 2005). However, a strong argument could be made that the CAPS PMSSA-derived SSA values should be the true reference here as the CAPS-derived SSA values were obtained by simultaneously measuring the scattering and extinction of same aerosol sample within a single instrument.
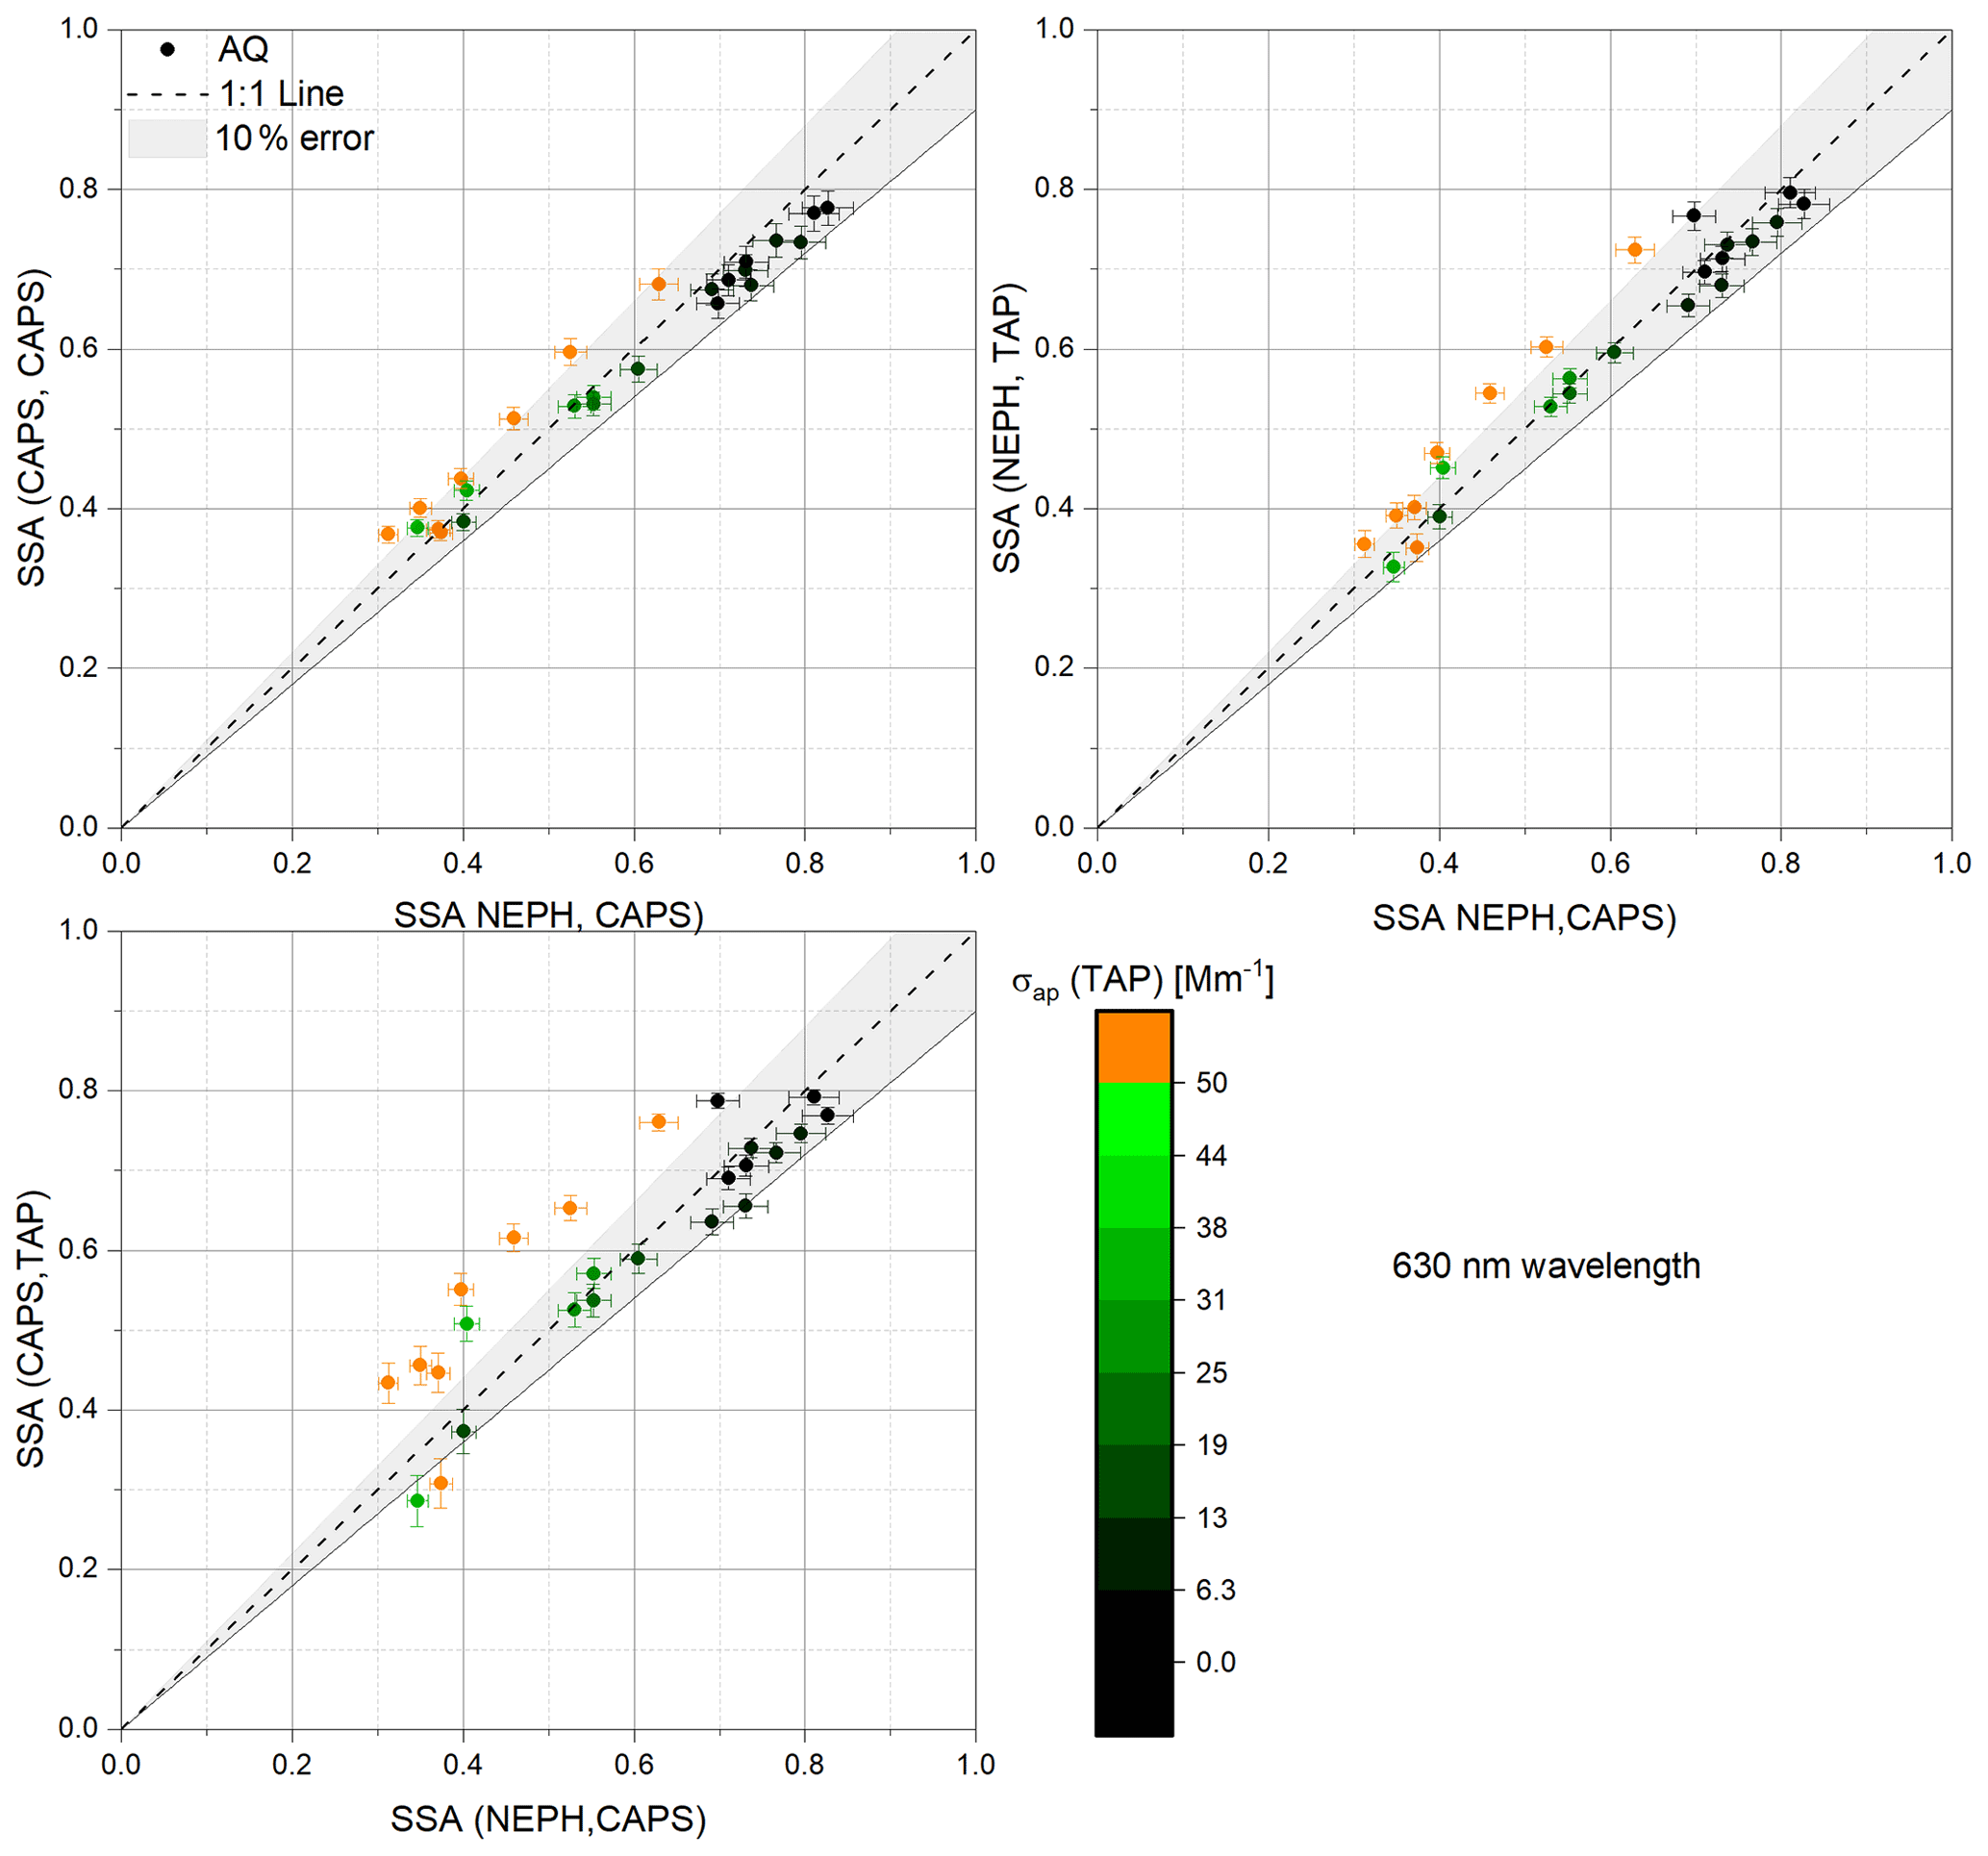
Figure 7Scatter plots of derived SSA values from various combinations of measurements at 630 nm wavelength obtained for AQ–AS mixtures (y axis) versus SSA(NEPH, CAPS) as the reference on the x axis. The colour code indicates σap (TAP) values shown in inverse megametres (Mm−1).
Figure 7 shows the SSA values obtained by the three combinations of measurements at 630 nm wavelength. The correlations show reasonable results relative to a ±10 % error band, with the best correlation obtained for the SSA(CAPS, CAPS) versus SSA(NEPH, CAPS) measurements. In general, the higher the SSA values, the lower the measured absorption coefficients, σap, reflecting the fact that there are just fewer particles of Aquadag in the external aerosol mixture. The exception to this trend and the points exhibiting the greatest number of outliers (>10 % from 1:1 line) are the points with high absorption coefficients (>50 Mm−1). The largest outliers are observed in the instrument combinations that include the TAP and may be due to a nonlinear response in the TAP under high aerosol loadings.
Similar to the previous section, we calculated the ensemble instrument-to-instrument measurement ratio averages, using the SSA(NEPH, CAPS) values for reference, as another way of examining the correlations. The SSA values for all absorbing aerosol types (externally mixed with AS) are summarized in Table 10. The largest variance deviation is visible with combustion soot for TAP-related data. The deviations of the reported mean from 1 are less than the relative uncertainties, which are around 0.09.
Table 10Ensemble instrument-to-instrument measurement ratio averages and standard deviations for different instrument combinations used to derive SSA values at 630 nm wavelength using SSA(NEPH, CAPS) as a reference.
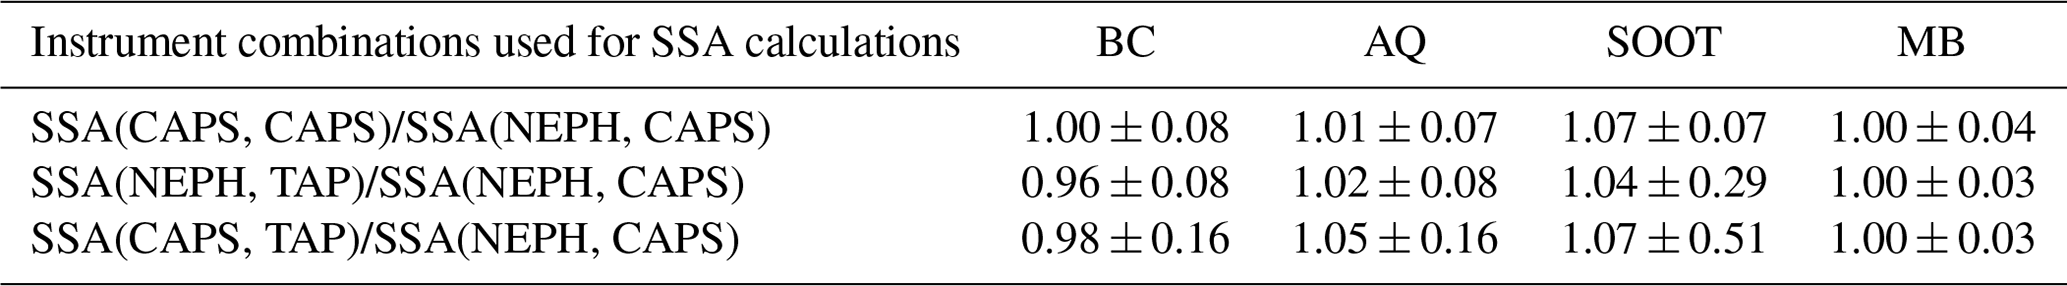

Figure 8Scatter plots of differential-method-derived SSA values for different instrument combinations at 450 nm wavelength using AQ–AS mixtures versus SSA(NEPH, CAPS). The colour code indicates σap (TAP) values shown in inverse megametres (Mm−1).
Figure 8 shows the SSA values obtained by the three combinations of measurements at 450 nm wavelength for all AQ–AS external mixtures. Observed patterns are comparable to the 630 nm wavelength results in Fig. 7. For absorption coefficients up to 50 Mm−1, all methods agree within 10 %. Above 50 Mm−1, the largest outliers are again observed in the instrument combinations that include the TAP instrument.
Table 11Ensemble instrument-to-instrument measurement ratio averages and standard deviations for different instrument combinations used to derive SSA values at 450 nm wavelength using SSA(NEPH, CAPS) as a reference.
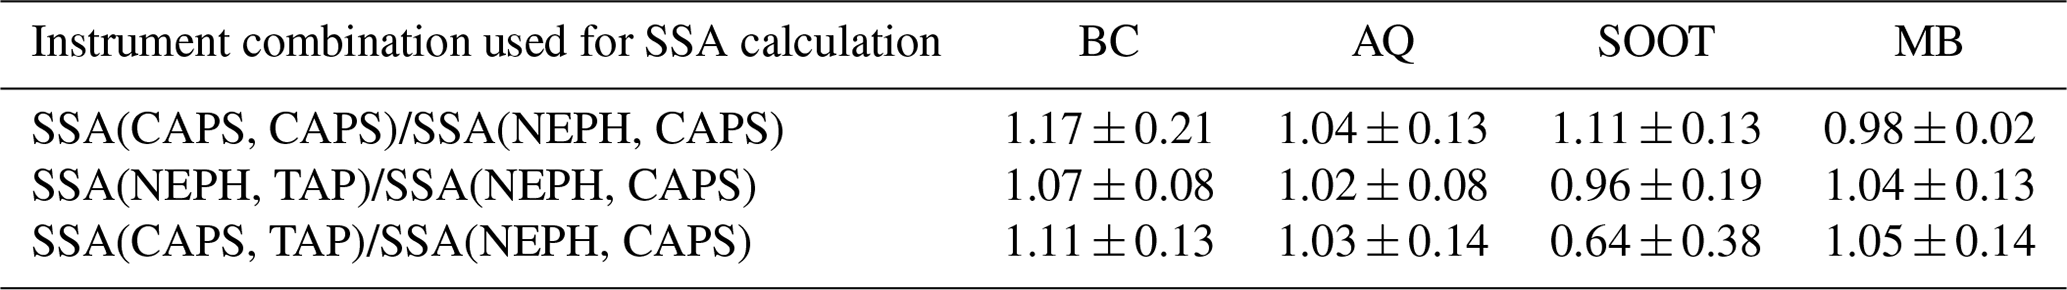
Table 11 summarizes the 450 nm wavelength ensemble instrument-to-instrument measurement ratio averages, using the SSA(NEPH, CAPS) values for reference. The pattern that fractal aerosol optical properties appear to differ most from the reference values as the wavelength decreases is visible here, too. The fresh combustion soot aerosol shows the largest deviation from 1 (0.64±0.38) for SSA(CAPS, TAP) measurements. But, overall, all the instrument-to-instrument ratios are unity within the observed variances.
3.3.2 Ångström exponents
Ångström exponents are calculated from extensive parameters measured at different wavelengths. Even a small error in the extensive parameter measurements can result in a significant uncertainty in the derived Ångström exponents, considering error propagation. Some of optical instruments used in the current study operated at slightly different wavelengths such that the derived Ångström exponents will exhibit slight biases due to these wavelength differences; these biases are small relative to the observed variances and are thus assumed negligible.
The following equations, based on Eq. (3), are used to derive the Ångström exponents for extinction, scattering and absorption using different instrument combinations with their specific wavelengths indicated:
3.3.3 Extinction Ångström exponents (EAEs)
The derived EAE(NEPH, TAP) and EAE(CAPS) values are shown in Fig. 9 as a scatter plot and in Fig. 10 as a ratio versus the 630 nm wavelength SSA(NEPH, CAPS) values. The EAE(CAPS) values were used as the reference measurement. When directly comparing EAE(NEPH, TAP) to EAE(CAPS), the EAE values agree within 10 % variance. The highest measured EAE values for the AQ and AS mixtures, ∼3, were close to the EAE values measured for the pure AS particle distributions with CMD ∼40 nm (Table 3). The measured EAE(NEPH, TAP)/EAE(CAPS) ratios exhibited no systematic dependence on the σap(TAP) (Fig. 9) or SSA(NEPH, CAPS) (Fig. 10) values. Measured EAE(NEPH, TAP)/EAE(CAPS) ratios for all absorbing aerosol types (externally mixed with AS) are listed in Table 12.
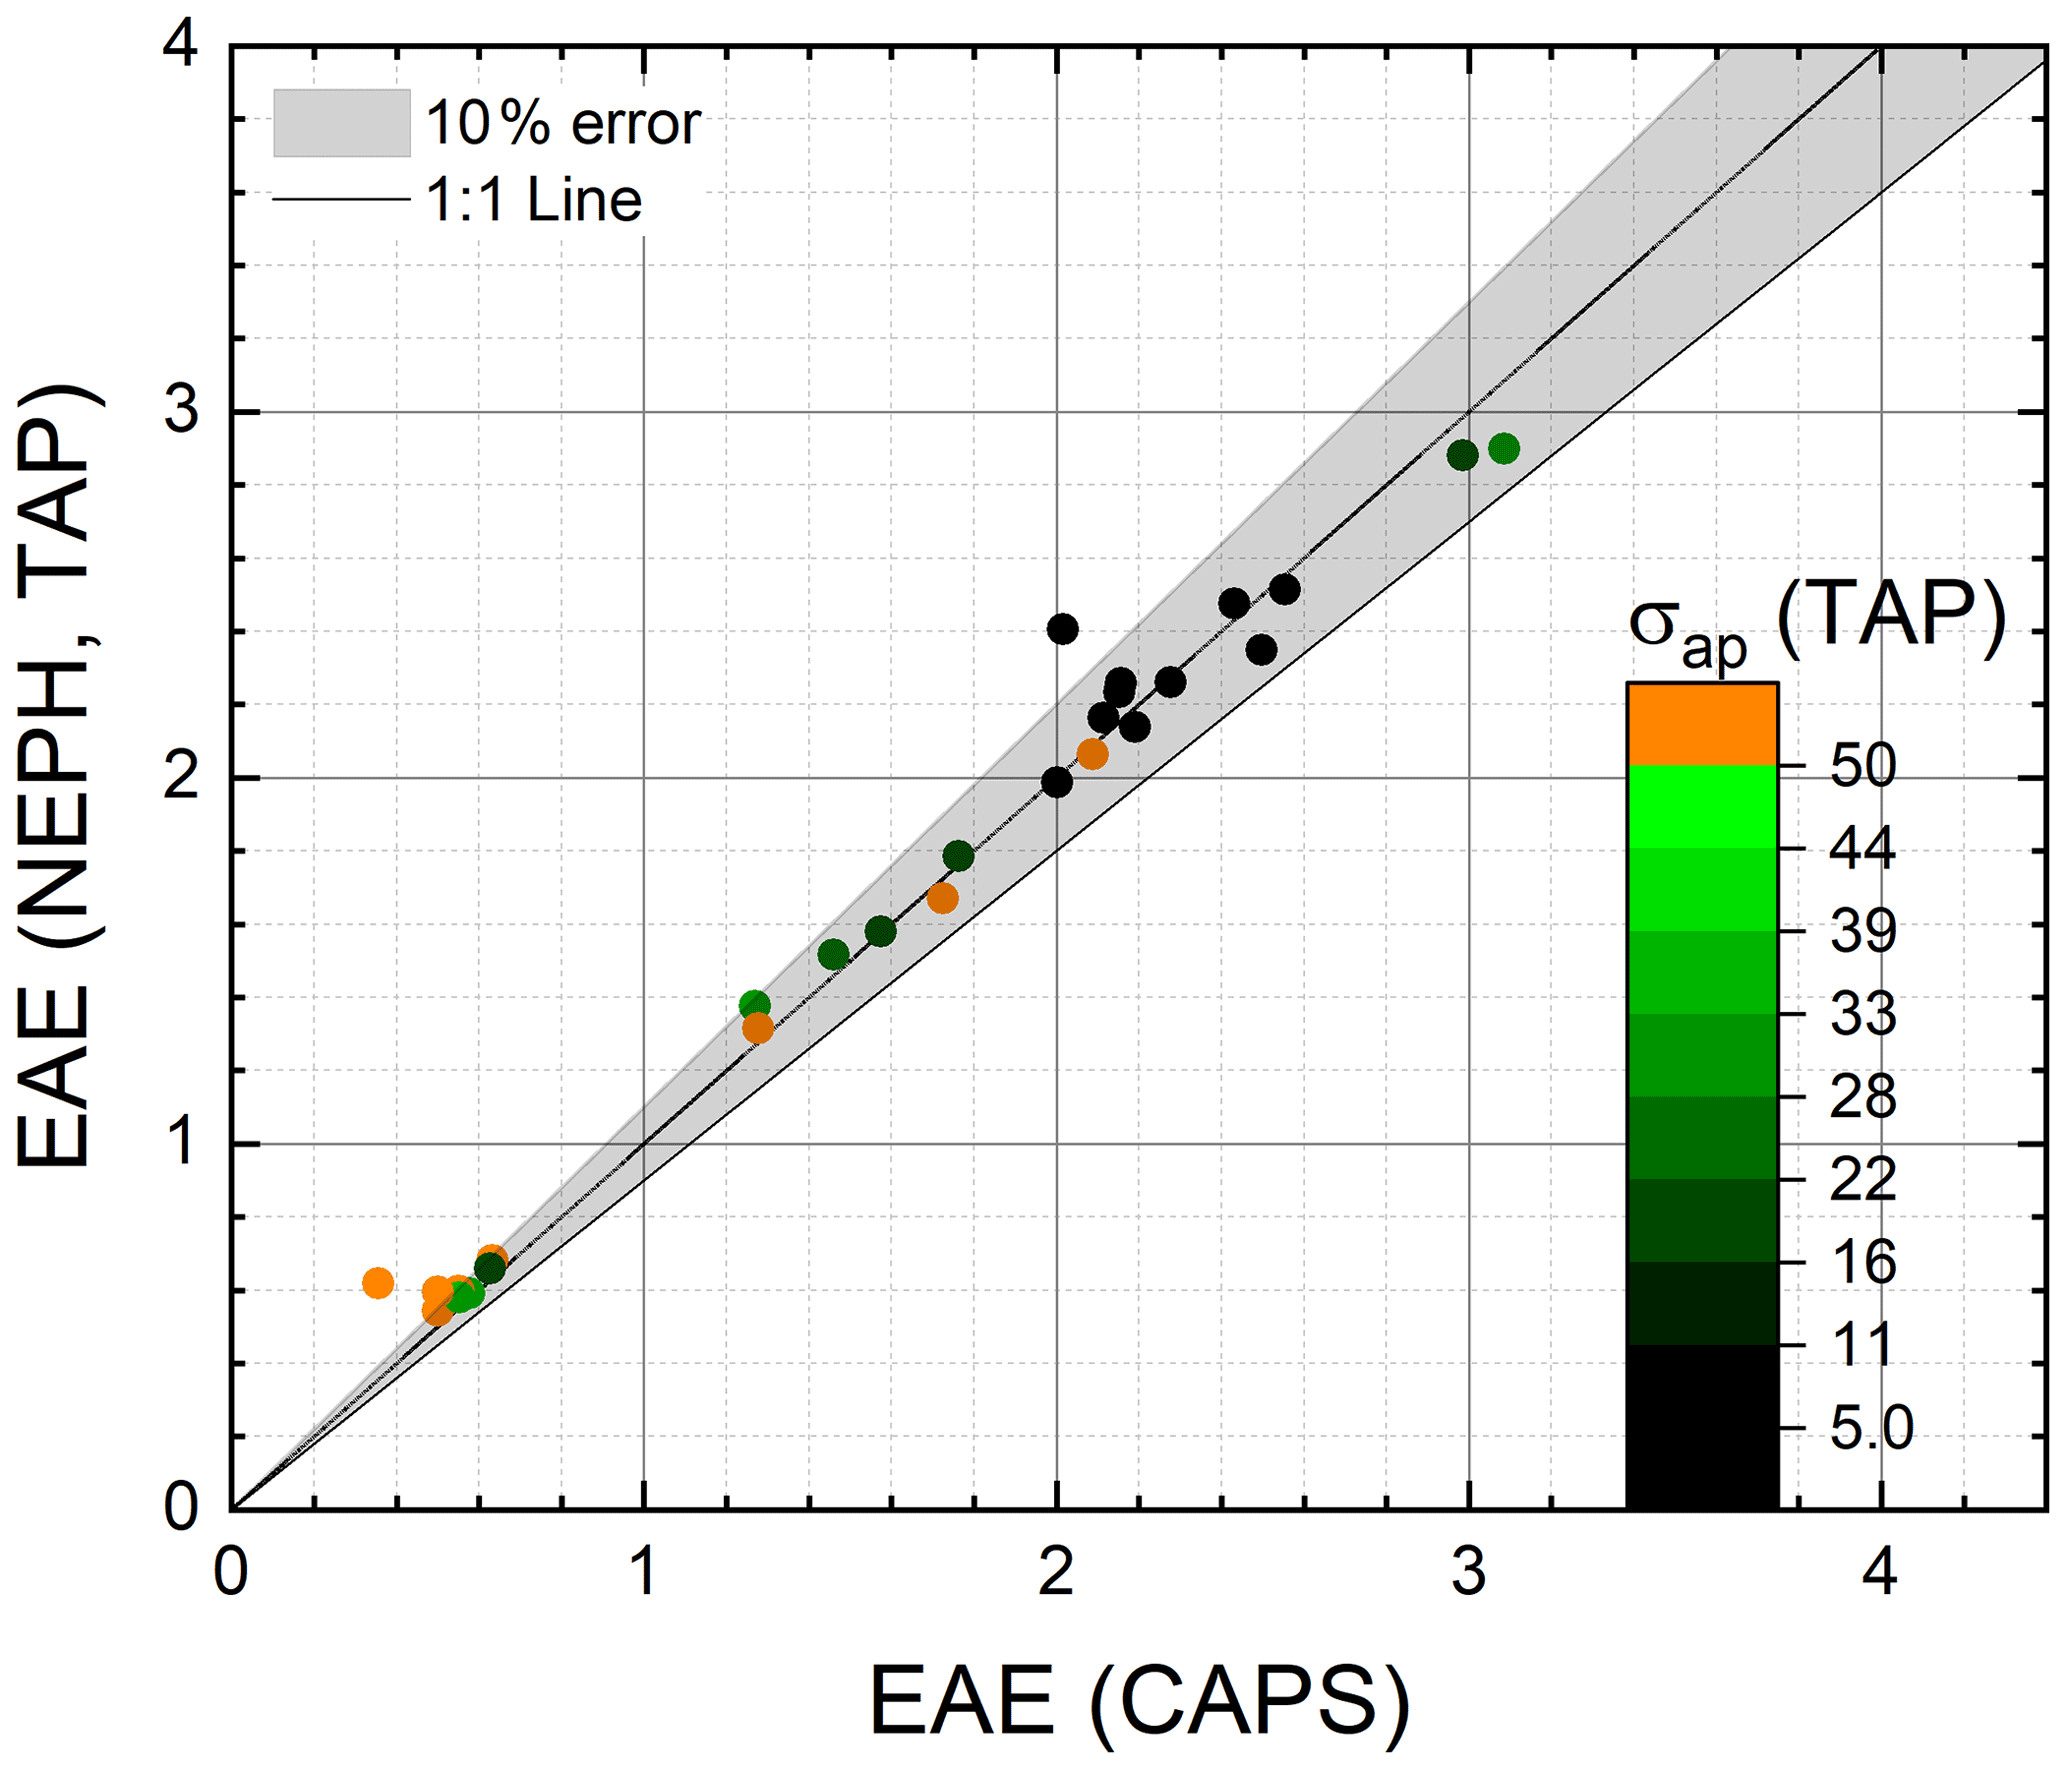
Figure 9Scatter plot of EAE(NEPH, TAP) measurements compared to EAE(CAPS) measurements for AQ–AS mixtures. An error band of 10 % is shown.

Figure 10The extinction Ångström exponent EAE(NEPH, TAP)/EAE(CAPS) ratios as a function of 630 nm wavelength SSA(NEPH, CAPS) values for AQ–AS mixtures. The 630 nm wavelength light-absorption coefficient, σep(CAPS), is used as the colour code.
3.3.4 Scattering Ångström exponent (SAE)
The derived SAE(CAPS, TAP) and SAE(NEPH) values are shown in Fig. 11 as a scatter plot and in Fig. 12 as a ratio versus the 630 nm wavelength SSA(NEPH, CAPS) values. The SAE(NEPH) values were used as the reference measurement. All SAE(CAPS, TAP) and SAE(NEPH) values agree within 10 % variance, and the measured SAE(CAPS, TAP)/SAE(NEPH) ratios exhibited no systematic dependence on the σsp(CAPS) for 630 nm wavelength (Fig. 11) or SSA(NEPH, CAPS) (Fig. 12) values. The measured SAE(CAPS, TAP)/SAE(NEPH) ratios for all absorbing aerosol types (externally mixed with AS) are listed in Table 12.
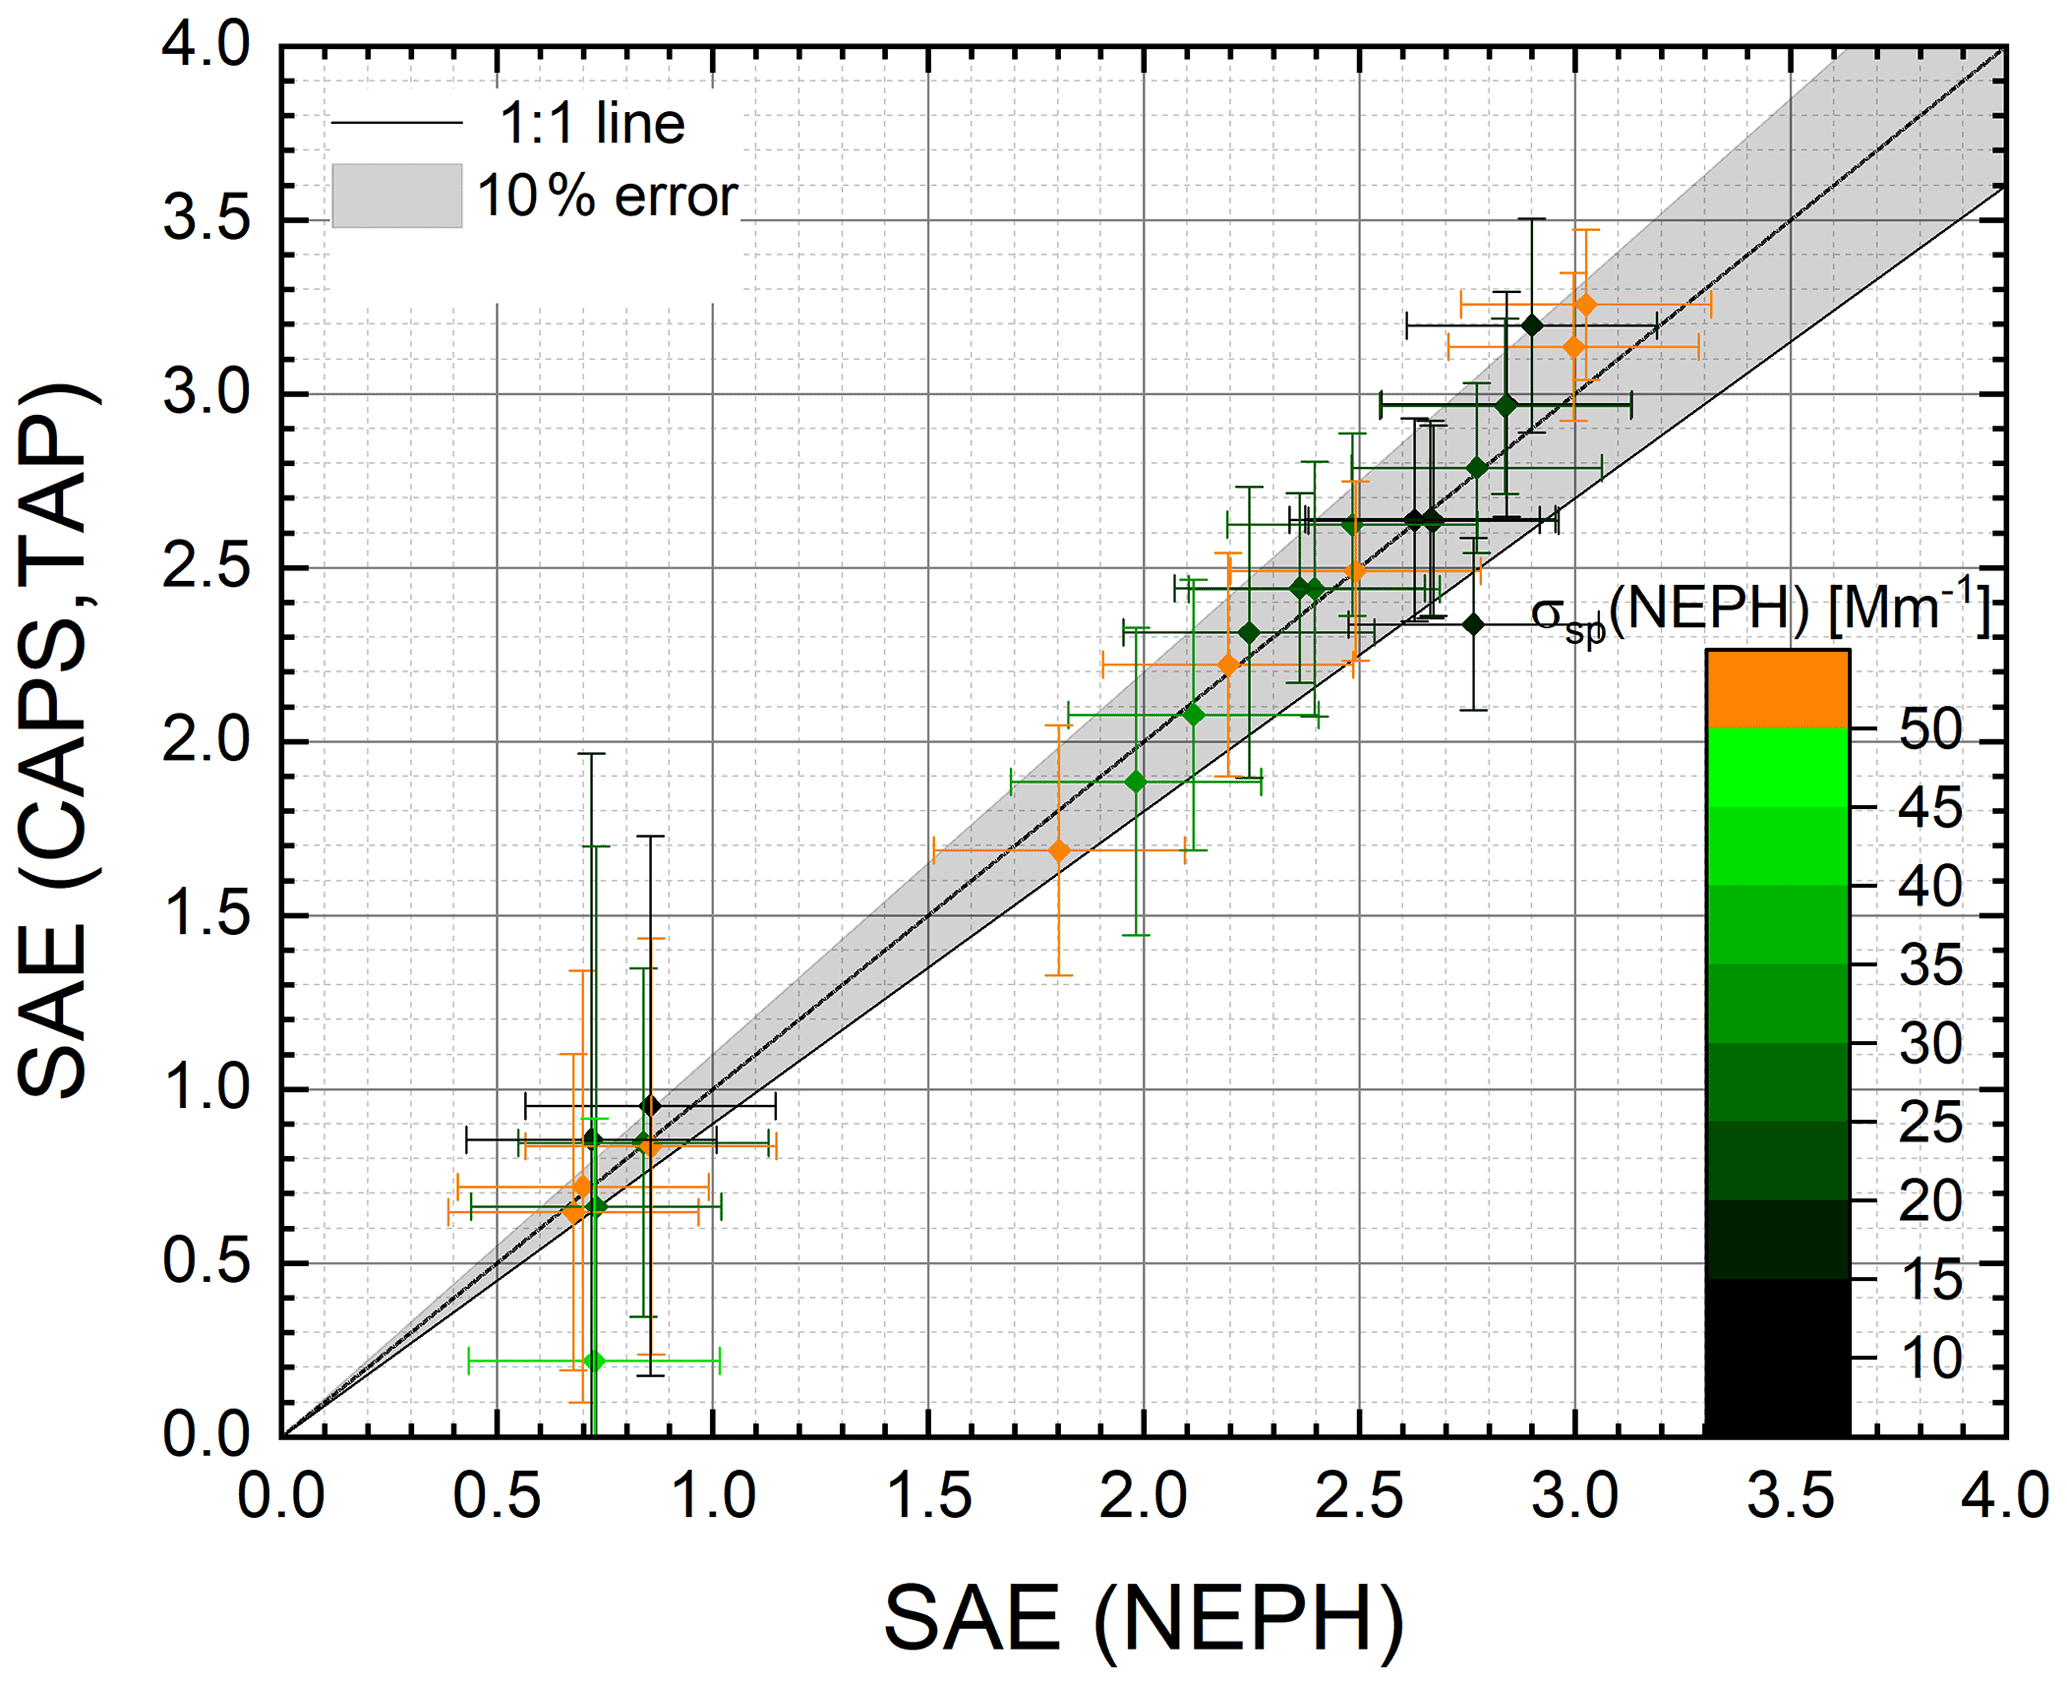
Figure 11Scatter plot of SAE(CAPS, TAP) measurements compared to SAE(NEPH) measurements for AQ–AS mixtures. An error band of 10 % is shown.
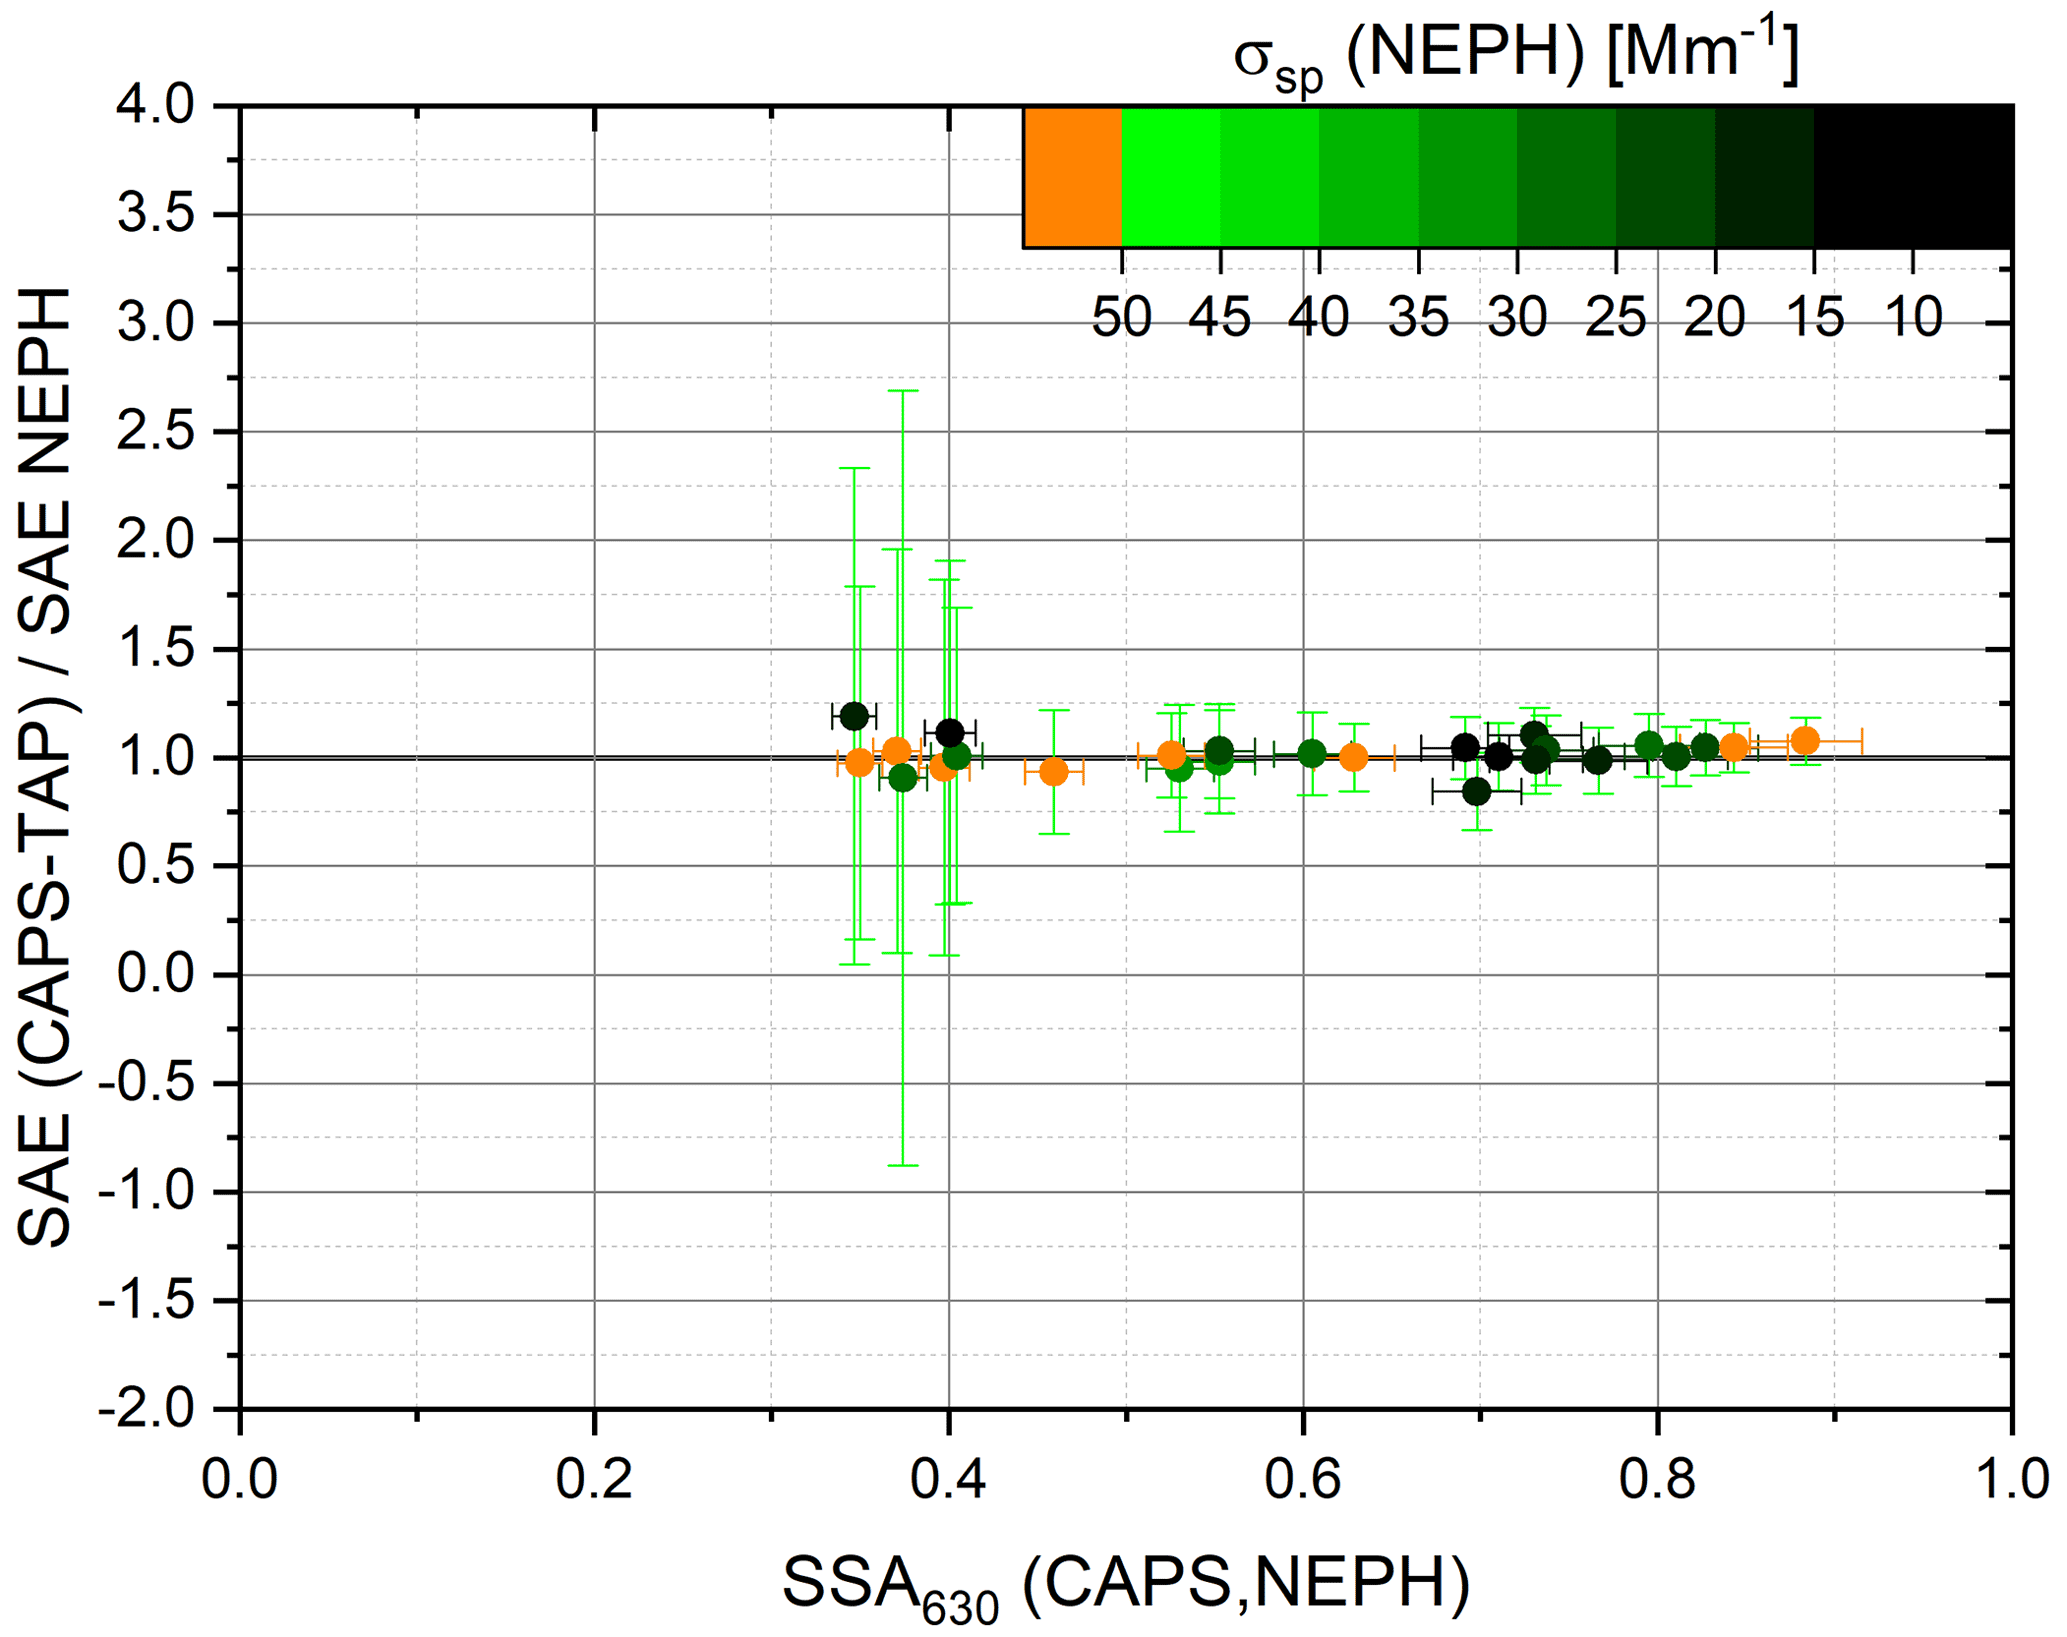
Figure 12The scattering Ångström exponent ratio, SAE(CAPS, TAP)/SAE(NEPH), as a function of 630 nm wavelength SSA(NEPH, CAPS) values for AQ–AS mixtures. The 630 nm wavelength light-absorption coefficient, σap(TAP), is used as the colour code.
3.3.5 Absorbing Ångström exponent (AAE)
The absorption Ångström exponent (AAE) depends entirely on the absorbing particle type and coatings and should not differ when the light absorbing particles are externally mixed with non-light-absorbing particles. Thus, scatter plots of AAE values should exhibit a single point. Figure 13 shows the derived AAE(CAPS, NEPH) values relative to the derived AAE(TAP) values for pure AQ and for AQ–AS external mixtures. The AAE(TAP) values were chosen as the reference measurements here, despite the potential for known filter-based artefacts. The pure AQ measurements in Fig. 13 exhibit a compact cluster around AAE ∼ 0.4, indicating that a well-defined (i.e. small variance) set of AAE measurements were obtained for both AAE measurements. The measured AAE for pure AQ particles of 0.4 is consistent with the “close-to-zero” result reported by Aiken (2016).
The externally mixed AQ–AS results show a significantly different result. For the AQ–AS mixtures, the AAE(TAP) exhibited a similar variance as for the pure AQ aerosols, while the AAE(CAPS, NEPH) values exhibited a much larger variance, including unphysical negative values. One reason for the larger AAE(CAPS, NEPH) variances observed for the external AQ–AS mixtures relative to the pure AQ is that the mixed AQ–AQ samples were conducted at significantly lower AQ loadings (i.e. lower σap values). Another reason is that the pure AQ aerosols exhibited the lowest SSA values (∼0.37 from Table 3) relative to the AQ–AS external mixtures.
Figure 14 shows the ratio AAE(CAPS, NEPH)/AAE(TAP) versus the 630 nm wavelength SSA(NEPH, CAPS) values. As predicted in the propagated error analysis shown in Fig. 6, higher SSA values cause higher uncertainties in differential-method-calculated light-absorption coefficients, σap (DM), and, therefore, the derived AAE(CAPS, NEPH) values. In fact, since the derived AAE(CAPS, NEPH) values depend upon σap (DM) measurements at two different wavelengths, the AAE uncertainties will be significantly higher than the corresponding σap (DM) uncertainties, especially at high SSA values. Figure 14 indicates that when lowering the absorption coefficients below 50 Mm−1 or increasing the SSA above 0.5, the derived AAE (CAPS, NEPH) values begin to vary strongly relative to the AAE (TAP) values. For laboratory studies, aerosols with similarly low SSA values and high absorbing particle concentrations can be readily achieved but are rarely present in the ambient atmosphere. Therefore, extreme caution is justified when attempting to derive AAE(CAPS, NEPH) values for atmospheric measurements.
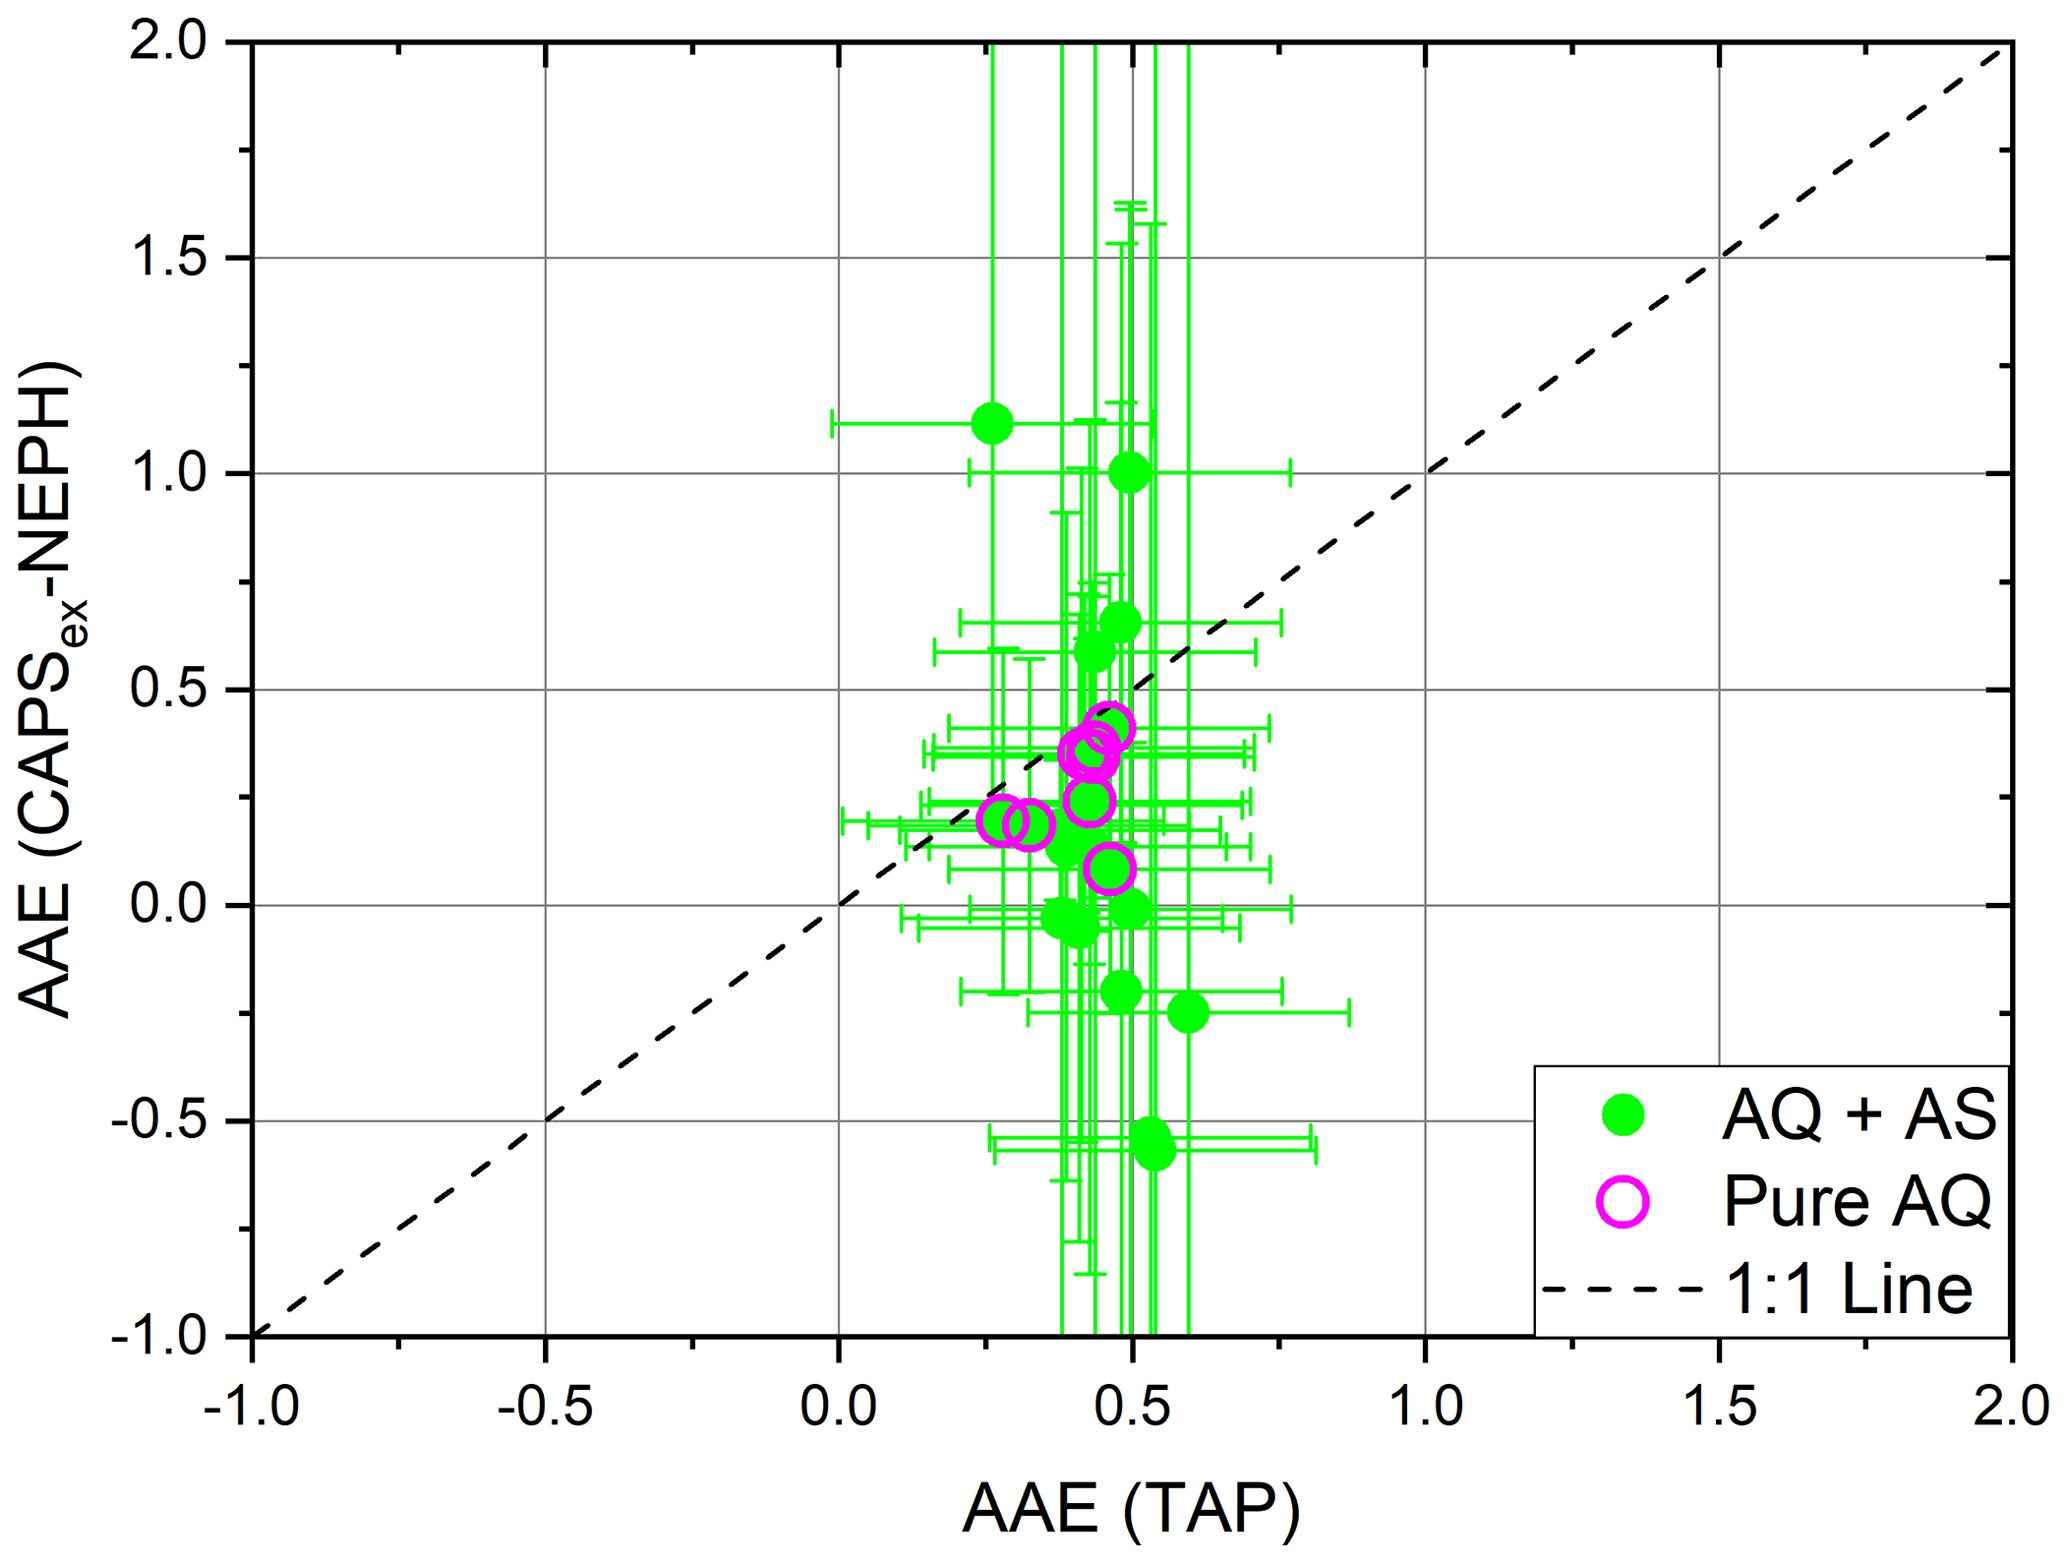
Figure 13Scatter plot of AAE(CAPS, NEPH) measurements compared to AAE(TAP) measurements for pure AQ and AQ–AS external mixtures. Measured precision error bars are shown for individual externally mixed AQ–AS measurements.
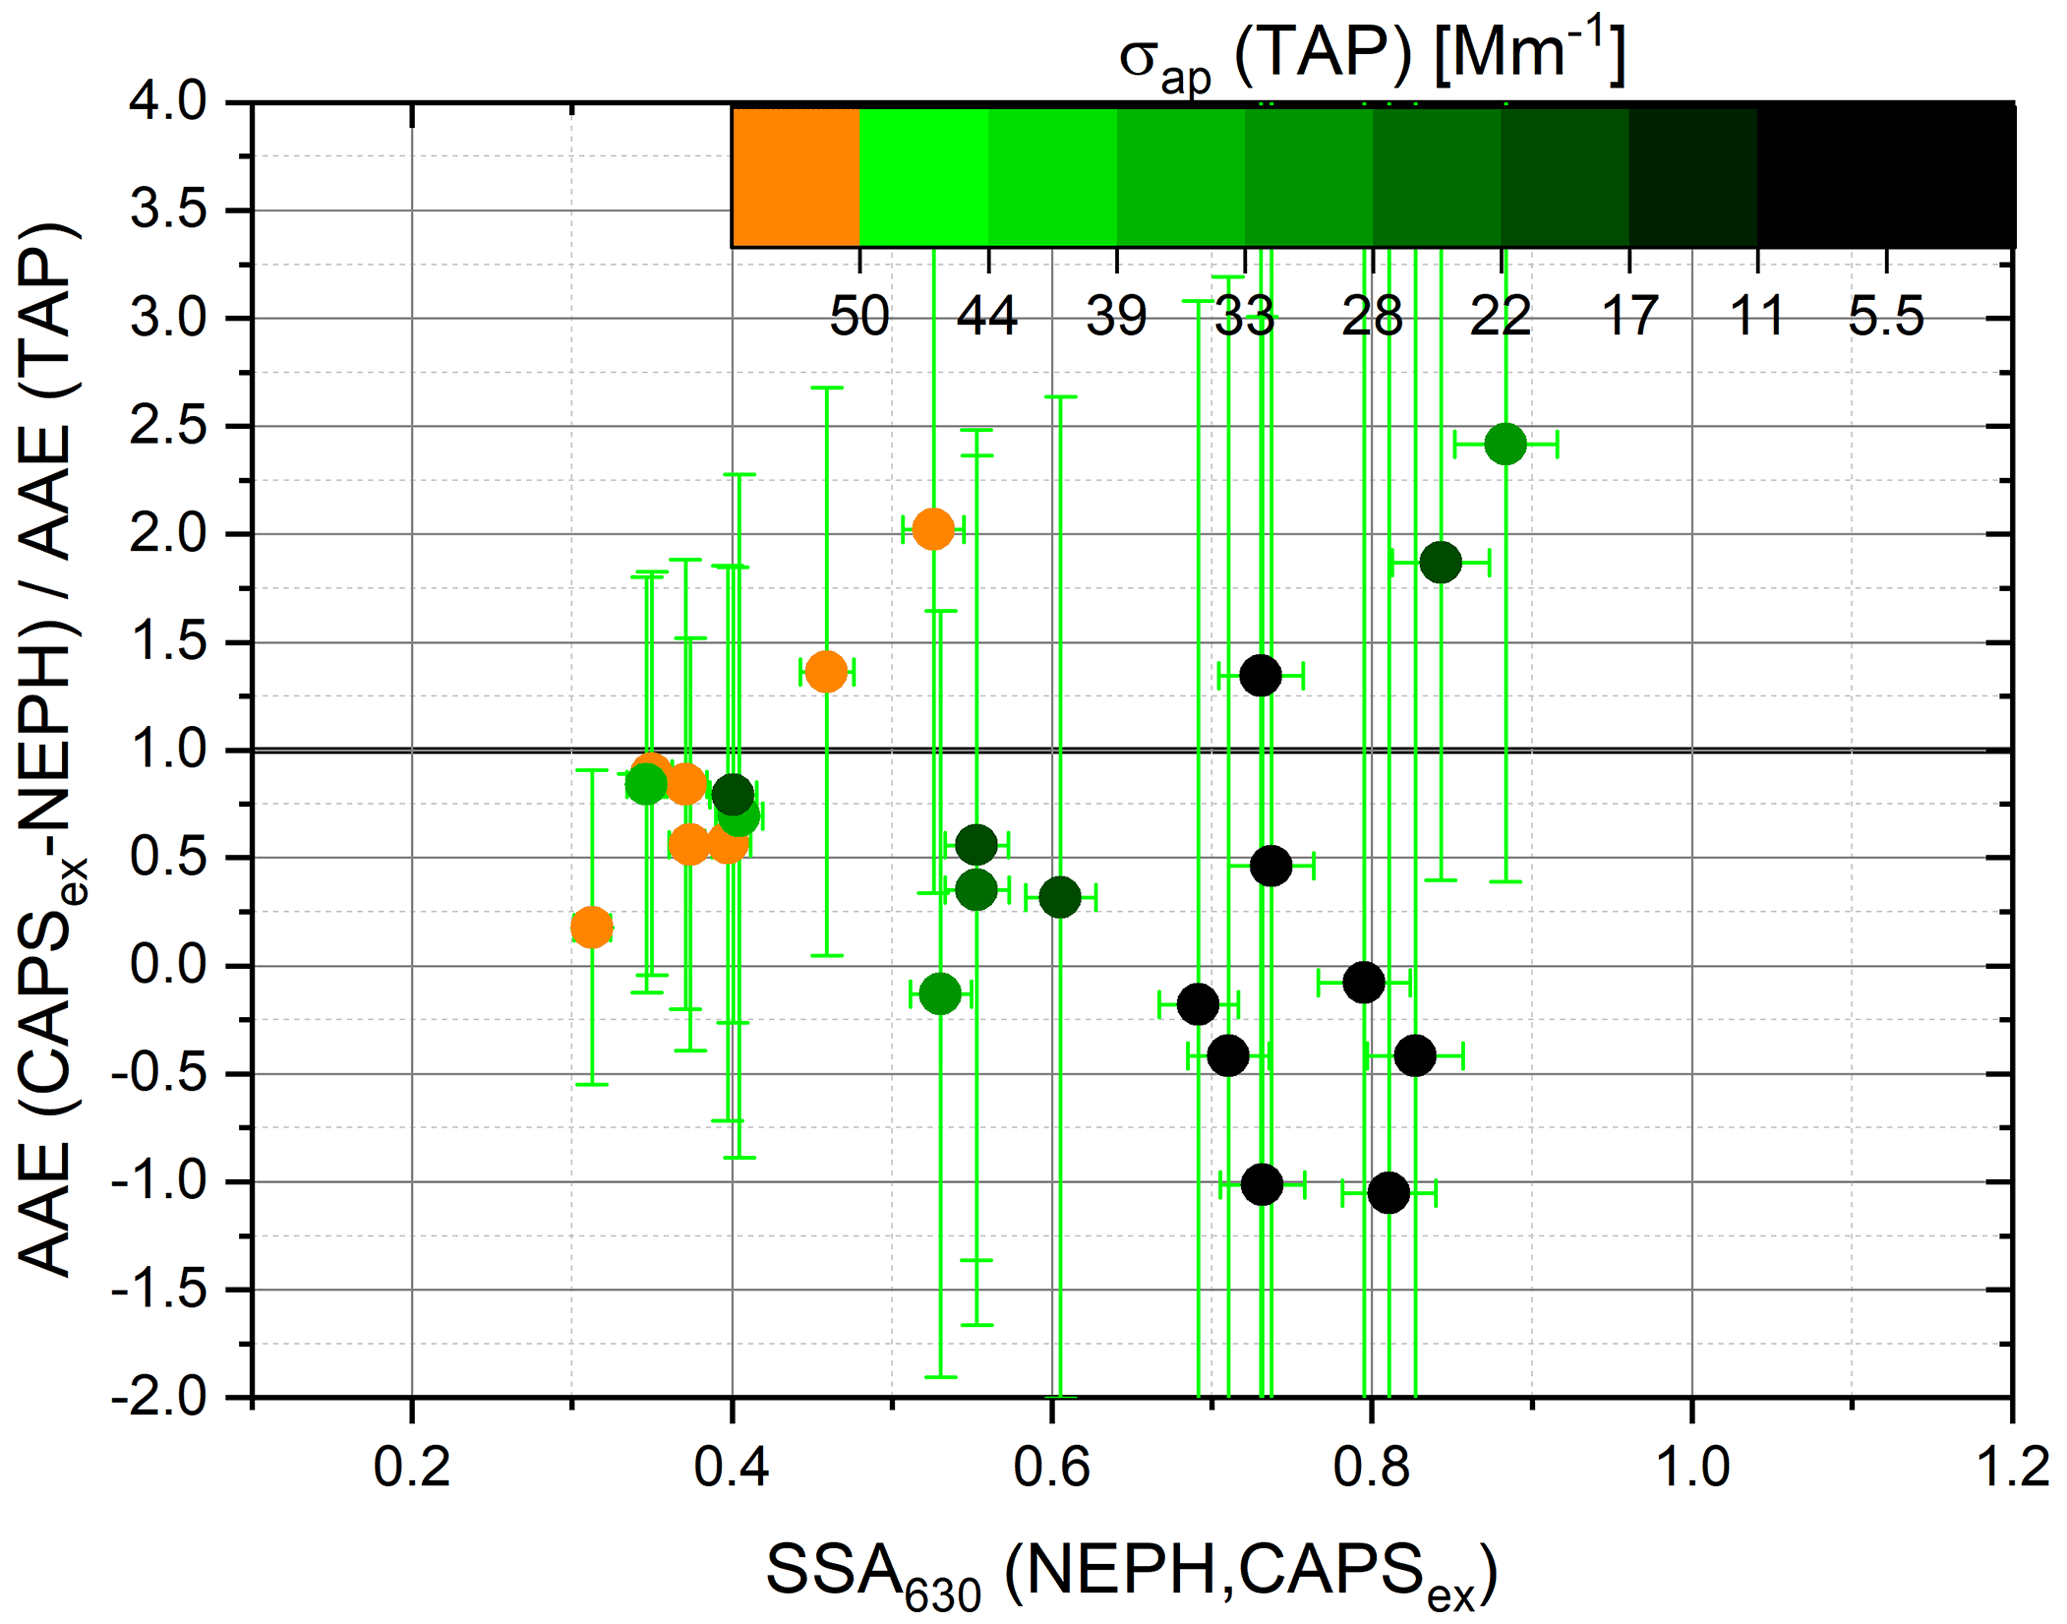
Figure 14The absorbing Ångström exponent ratio, AAE(CAPS, NEPH)/AAE(TAP), as a function of 630 nm wavelength SSA(NEPH, CAPS) values for AQ–AS mixtures. The 630 nm wavelength light-absorption coefficient, σap (TAP), is used as the colour code. Measured precision error bars are shown for individual measurements.
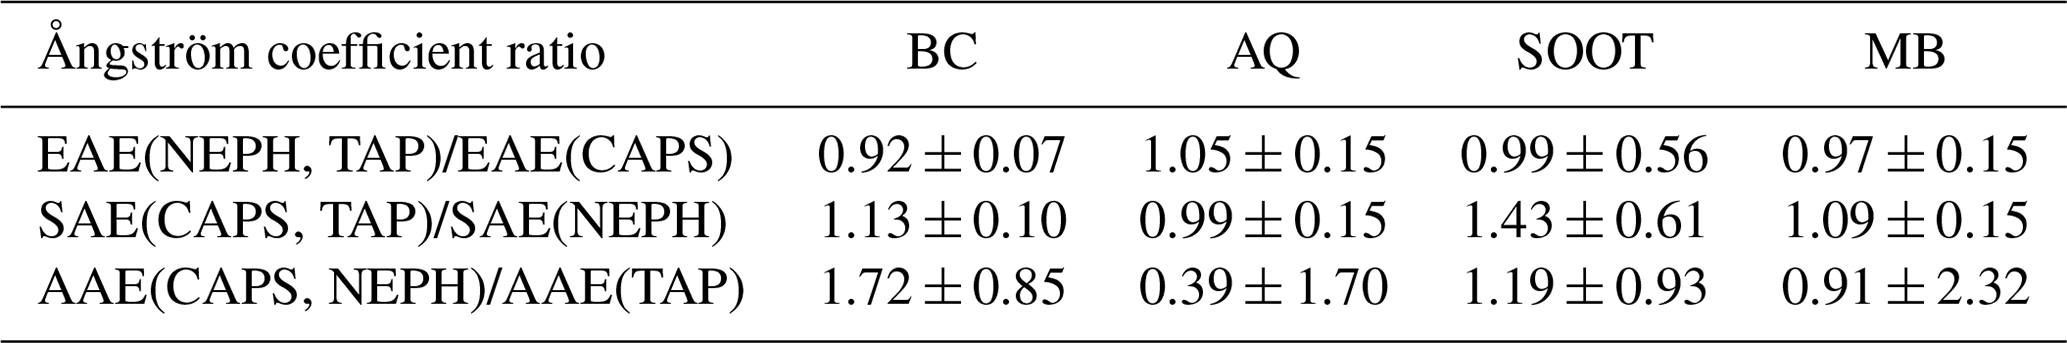
Table 12 summarizes the averages and standard deviations of the measured Ångström exponent ratios, EAE(NEPH, TAP)/EAE(CAPS), SAE(CAPS, TAP)/SAE(NEPH) and AAE(CAPS, NEPH)/AAE(TAP). The average Ångström exponent ratios for light extinction (EAE) and scattering (SAE) fall within 10 % of unity, with SOOT exhibiting large variances. The average Ångström exponent ratios for light absorption (AAE) exhibit large deviations from unity with even larger variances. A large deviation for the AAE ratio value is associated with weak absorption coefficients of the aerosol mixtures used. Therefore, the AAE values show the biggest differences within the instrument-to-instrument ratio analysis.
Table 12Ensemble averages and standard deviations for the instrument-to-instrument ratios of the Ångström exponents (EAE, SAE, AAE) derived from multiple instruments relative to those derived from single instruments as a reference.
A major goal of this study was to determine if the intensive optical aerosol parameters, single-scattering albedo and Ångström exponents for externally mixed absorbing and non-absorbing aerosols could be measured within reported optical instrument extensive measurement uncertainties (i.e. optical closure). Closure within reported instrument uncertainties was achieved for all measured extensive optical properties (i.e. extinction, scattering and absorption) and most intensive optical properties (i.e. single-scattering albedo, extinction Ångström exponent and scattering Ångström exponent). Unsurprisingly, the measurements with the largest variances were the absorption coefficient measurements derived from the differential method (i.e. absorption = extinction minus scattering) and the related absorbing Ångström exponent (AAE). While the absorption coefficient measurements were within reported uncertainties, the derived AAE values exhibited average values and standard deviations far greater than the other Ångström exponent but are within the expected range.
We conducted an instrument intercomparison laboratory study employing several widely used measurement techniques suitable for long-term ambient observations. The optical instrument suite included two CAPS PMSSA's measuring extinction and scattering at 450 and 630 nm; a TSI integrating nephelometer (NEPH) measuring scattering at 450, 550 and 700 nm; and a Brechtel tricolour absorption photometer (TAP) measuring absorption at 467, 528 and 652 nm. External mixtures of absorbing (Aquadag, combustion soot from a laboratory flame generator, Cabot carbon black and acrylic magic black paint) particles and non-absorbing ammonium sulfate particles were generated with single-scattering albedo (SSA) values between 0.2 and 1.0 and extinction values between 15 and 150 Mm−1, representative of atmospheric aerosols. However, our study does not explicitly address real-world ambient aerosols that can be internally or externally mixed or both; contain particles with liquid, solid and/or semi-solid phases; and may contain multiple sources of absorbing material.
Overall, we were able to show that measured extensive optical parameters agree within the limits of uncertainty for the individual or combined instruments. In particular, we report that the scattering coefficient measurement by the CAPS PMSSA agrees with the TSI integrating nephelometer within 10 % relative error (i.e. optical closure). Therefore, the CAPS PMSSA could be considered as a replacement for the TSI nephelometer as the NEPH is no longer produced. Trade-offs in the CAPS PMSSA versus NEPH comparison include the three wavelengths and backscatter measurements of the NEPH versus the single wavelength of the CAPS PMSSA, countered by the additional extinction measurement of the CAPS PMSSA allowing for absorption and SSA values to be simultaneously measured.
Measurement differences were observed as a function of absorbing particle type. For light-absorbing compact aggregates, we achieved the highest correlations for light-extinction, light-scattering and light-absorption coefficients. For fractal-like absorbing combustion soot particles, the correlation for light absorption between the in situ and filter methods weakened but stayed within instrument uncertainty ranges. These observed differences might be due to the combined effects of small flickers from the inverted flame generator during the experiment, the overall filter correction schemes and/or the physical behaviour of agglomerates. For more compact particles, the scattering is stronger (Radney et al., 2014). For the TAP filtered-based method, changes in the backscattering of light are not considered in the correction schemes, which might be responsible for the disagreement.
Uncertainties increased for intensive optical parameters, especially for the absorption Ångström exponent (AAE) parameter that relied on the differential method to calculate light absorption as the difference between light extinction and light scattering. The intensive parameters for the scattering and extinction Ångström exponent were within 10 % relative error (i.e. optical closure), regardless of which instrument combination was used for parameter derivation. In contrast, absorption Ångström exponent (AAE) values required low SSA values (<0.5), and high particulate-absorption values (>50 Mm−1) were necessary to reach satisfactory levels of measurement uncertainty. Similar AAE results were recently reported for rural background sampling (Asmi et al., 2021).
Finally, Laj et al. (2020) recently stated measurement requirements for GCOS (Global Climate Observing System) applications for attributing and detecting changes to climate feedback. The reported requirements for the climate-critical intensive optical properties, specifically the single-scattering albedo (SSA), are measurement techniques with relative measurement uncertainties less than 20 %. In our study, SSA values were measured for all instrument combinations of CAPS, TAP and NEPH within 10 % relative error at 630 nm wavelength and within 15 % at 450 nm wavelength. Therefore, the measured SSA averages and variances using our optical instrument suite for externally mixed laboratory particles indicate that these instruments meet these proposed requirements.
Data are available at Zenodo: https://doi.org/10.5281/zenodo.6531472.
PW performed all instrument calibrations, the instrumental set-up and the data analysis. UB and BF designed the LabVIEW environment of the experimental set-up. MB helped during instrument preparations. AF and TBO provided technical details of the instrumentation. PW, OFB, AF, TBO, UB and AP contributed to the manuscript and the interpretation of the results.
The contact author has declared that neither they nor their co-authors have any competing interests.
Publisher’s note: Copernicus Publications remains neutral with regard to jurisdictional claims in published maps and institutional affiliations.
Parts of this work were supported by IAGOS-D (grant agreement no. 01LK1301A), the EU H2020 project ENVRIplus (grant no. 654182), and HITEC Graduate School for Energy and Climate. A special thanks to Paola Formenti for her assistance with the manuscript.
This research has been supported by the Bundesministerium für Bildung, Wissenschaft, Forschung und Technologie (grant no. 01LK1301A); the Horizon 2020 ENVRIplus project (grant no. 654182); and the Forschungszentrum Jülich (HITEC Graduate School for Energy and Climate grant).
The article processing charges for this open-access publication were covered by the Forschungszentrum Jülich.
This paper was edited by Hang Su and reviewed by two anonymous referees.
Anderson, T. L. and Ogren, J. A.: Determining aerosol radiative properties using the TSI 3563 integrating nephelometer, Aerosol Sci. Technol., 29, 57–69, https://doi.org/10.1080/02786829808965551, 1998.
Ångström, A.: On the Atmospheric Transmission of Sun Radiation and on Dust in the Air, Geograf. Annal., 11, 156–166, https://doi.org/10.2307/519399, 1929.
Asmi, E., Backman, J., Servomaa, H., Virkkula, A., Gini, M. I., Eleftheriadis, K., Müller, T., Ohata, S., Kondo, Y., and Hyvärinen, A.: Absorption instruments inter-comparison campaign at the Arctic Pallas station, Atmos. Meas. Tech., 14, 5397–5413, https://doi.org/10.5194/amt-14-5397-2021, 2021.
Berry, M. V. and Percival, I. C.: Optics of Fractal Clusters Such as Smoke, Optica Acta, Int. J. Opt., 33, 577–591, doi:10.1080/713821987, 1986.
Bischof, O., Weber, P., Bundke, U., Petzold, A., and Kiendler-Scharr, A.: Characterization of the Miniaturized Inverted Flame Burner as a Combustion Source to Generate a Nanoparticle Calibration Aerosol, Emiss. Control Sci. Technol., 6, 37–46, https://doi.org/10.1007/s40825-019-00147-w, 2019.
Bodhaine, B. A., Ahlquist, N. C., and Schnell, R. C.: Three-wavelength nephelometer suitable for aircraft measurement of background aerosol scattering coefficient, Atmos. Environ. Part A., 25, 2267–2276, doil:10.1016/0960-1686(91)90102-D, 1991.
Bohren, C. F. and Huffman, D. R.: Absorption and scattering of light by small particles, WILEY-VCH Verlag GmbH & Co. KGaA, ISBN 9780471293408 https://doi.org/10.1002/9783527618156, 1983.
Bond, T. C., Anderson, T. L., and Campbell, D.: Calibration and intercomparison of filter-based measurements of visible light absorption by aerosols, Aerosol Sci. Technol., 30, 582–600, 1999.
Collaud Coen, M., Weingartner, E., Apituley, A., Ceburnis, D., Fierz-Schmidhauser, R., Flentje, H., Henzing, J. S., Jennings, S. G., Moerman, M., Petzold, A., Schmid, O., and Baltensperger, U.: Minimizing light absorption measurement artifacts of the Aethalometer: evaluation of five correction algorithms, Atmos. Meas. Tech., 3, 457–474, https://doi.org/10.5194/amt-3-457-2010, 2010.
Formenti, P., Schütz, L., Balkanski, Y., Desboeufs, K., Ebert, M., Kandler, K., Petzold, A., Scheuvens, D., Weinbruch, S., and Zhang, D.: Recent progress in understanding physical and chemical properties of African and Asian mineral dust, Atmos. Chem. Phys., 11, 8231–8256, https://doi.org/10.5194/acp-11-8231-2011, 2011.
Foster, K., Pokhrel, R., Burkhart, M., and Murphy, S.: A novel approach to calibrating a photoacoustic absorption spectrometer using polydisperse absorbing aerosol, Atmos. Meas. Tech., 12, 3351–3363, https://doi.org/10.5194/amt-12-3351-2019, 2019.
Hansen, A. D. A., Rosen, H., and Novakov, T.: The aethalometer – An instrument for the real-time measurement of optical absorption by aerosol particles, Sci. Total Environ., 36, 191–196, https://doi.org/10.1016/0048-9697(84)90265-1, 1984.
Kaskaoutis, D. G., Kambezidis, H. D., Hatzianastassiou, N., Kosmopoulos, P. G., and Badarinath, K. V. S.: Aerosol climatology: on the discrimination of aerosol types over four AERONET sites, Atmos. Chem. Phys. Discuss., 7, 6357–6411, https://doi.org/10.5194/acpd-7-6357-2007, 2007.
Kazemimanesh, M., Moallemi, A., Thomson, K., Smallwood, G., Lobo, P., and Olfert, J.: A novel miniature inverted-flame burner for the generation of soot nanoparticles, Aerosol Sci. Technol., 53, 184–195, https://doi.org/10.1080/02786826.2018.1556774, 2018.
Kim, J., Bauer, H., Doboviènik, T., Hitzenberger, R., Lottin, D., Ferry, D., and Petzold, A.: Assessing Optical Properties and Refractive Index of Combustion Aerosol Particles Through Combined Experimental and Modeling Studies, Aerosol Sci. Technol., 49, 340–350, https://doi.org/10.1080/02786826.2015.1020996, 2015.
Kirchstetter, T. W. and Thatcher, T. L.: Contribution of organic carbon to wood smoke particulate matter absorption of solar radiation, Atmos. Chem. Phys., 12, 6067–6072, https://doi.org/10.5194/acp-12-6067-2012, 2012.
Kokhanovsky, A.: Aerosol Optics: Light Absorption and Scattering by Particles in the Atmosphere, Springer, Berlin, Heidelberg, https://doi.org/10.1007/978-3-540-49909-1, 2008.
Lack, D. A. and Cappa, C. D.: Impact of brown and clear carbon on light absorption enhancement, single scatter albedo and absorption wavelength dependence of black carbon, Atmos. Chem. Phys., 10, 4207–4220, https://doi.org/10.5194/acp-10-4207-2010, 2010.
Lack, D. A., Cappa, C. D., Covert, D. S., Baynard, T., Massoli, P., Sierau, B., Bates, T. S., Quinn, P. K., Lovejoy, E. R., and Ravishankara, A. R.: Bias in Filter-Based Aerosol Light Absorption Measurements Due to Organic Aerosol Loading: Evidence from Ambient Measurements, Aerosol Sci. Technol., 42, 1033–1041, https://doi.org/10.1080/02786820802389277, 2008.
Laj, P., Bigi, A., Rose, C., Andrews, E., Lund Myhre, C., Collaud Coen, M., Lin, Y., Wiedensohler, A., Schulz, M., Ogren, J. A., Fiebig, M., Gliß, J., Mortier, A., Pandolfi, M., Petäja, T., Kim, S.-W., Aas, W., Putaud, J.-P., Mayol-Bracero, O., Keywood, M., Labrador, L., Aalto, P., Ahlberg, E., Alados Arboledas, L., Alastuey, A., Andrade, M., Artíñano, B., Ausmeel, S., Arsov, T., Asmi, E., Backman, J., Baltensperger, U., Bastian, S., Bath, O., Beukes, J. P., Brem, B. T., Bukowiecki, N., Conil, S., Couret, C., Day, D., Dayantolis, W., Degorska, A., Eleftheriadis, K., Fetfatzis, P., Favez, O., Flentje, H., Gini, M. I., Gregorič, A., Gysel-Beer, M., Hallar, A. G., Hand, J., Hoffer, A., Hueglin, C., Hooda, R. K., Hyvärinen, A., Kalapov, I., Kalivitis, N., Kasper-Giebl, A., Kim, J. E., Kouvarakis, G., Kranjc, I., Krejci, R., Kulmala, M., Labuschagne, C., Lee, H.-J., Lihavainen, H., Lin, N.-H., Löschau, G., Luoma, K., Marinoni, A., Martins Dos Santos, S., Meinhardt, F., Merkel, M., Metzger, J.-M., Mihalopoulos, N., Nguyen, N. A., Ondracek, J., Pérez, N., Perrone, M. R., Petit, J.-E., Picard, D., Pichon, J.-M., Pont, V., Prats, N., Prenni, A., Reisen, F., Romano, S., Sellegri, K., Sharma, S., Schauer, G., Sheridan, P., Sherman, J. P., Schütze, M., Schwerin, A., Sohmer, R., Sorribas, M., Steinbacher, M., Sun, J., Titos, G., Toczko, B., Tuch, T., Tulet, P., Tunved, P., Vakkari, V., Velarde, F., Velasquez, P., Villani, P., Vratolis, S., Wang, S.-H., Weinhold, K., Weller, R., Yela, M., Yus-Diez, J., Zdimal, V., Zieger, P., and Zikova, N.: A global analysis of climate-relevant aerosol properties retrieved from the network of Global Atmosphere Watch (GAW) near-surface observatories, Atmos. Meas. Tech., 13, 4353–4392, https://doi.org/10.5194/amt-13-4353-2020, 2020.
Liu, B. Y. H. and Pui, D. Y. H.: On the performance of the electrical aerosol analyzer, J. Aerosol Sci., 6, 249–254, doi:10.1016/0021-8502(75)90093-2, 1975.
Massoli, P., Murphy, D. M., Lack, D. A., Baynard, T., Brock, C. A., and Lovejoy, E. R.: Uncertainty in Light Scattering Measurements by TSI Nephelometer: Results from Laboratory Studies and Implications for Ambient Measurements, Aerosol Sci. Technol., 42, 1064–1074, https://doi.org/10.1080/02786820903156542, 2009.
Massoli, P., Kebabian, P. L., Onasch, T. B., Hills, F. B., and Freedman, A.: Aerosol Light Extinction Measurements by Cavity Attenuated Phase Shift (CAPS) Spectroscopy: Laboratory Validation and Field Deployment of a Compact Aerosol Particle Extinction Monitor, Aerosol Sci. Technol., 44, 428–435, https://doi.org/10.1080/02786821003716599, 2010.
Modini, R. L., Corbin, J. C., Brem, B. T., Irwin, M., Bertò, M., Pileci, R. E., Fetfatzis, P., Eleftheriadis, K., Henzing, B., Moerman, M. M., Liu, F., Müller, T., and Gysel-Beer, M.: Detailed characterization of the CAPS single-scattering albedo monitor (CAPS PMssa) as a field-deployable instrument for measuring aerosol light absorption with the extinction-minus-scattering method, Atmos. Meas. Tech., 14, 819–851, https://doi.org/10.5194/amt-14-819-2021, 2021.
Moosmüller, H., Chakrabarty, R. K., and Arnott, W. P.: Aerosol light absorption and its measurement: A review, J. Quant. Spectrosc. Ra. Transf., 110, 844–878, https://doi.org/10.1016/j.jqsrt.2009.02.035, 2009.
Müller, T., Virkkula, A., and Ogren, J. A.: Constrained two-stream algorithm for calculating aerosol light absorption coefficient from the Particle Soot Absorption Photometer, Atmos. Meas. Tech., 7, 4049–4070, https://doi.org/10.5194/amt-7-4049-2014, 2014.
Myhre, G., Shindell, D., Breìon, F.-M., Collins, W., Fuglestvedt, J., Huang, J., Koch, D., Lamarque, J.-F., Lee, D., Mendoza, B., Nakajima, T., Robock, A., Stephens, G., Takemura, T., and Zhang, H.: Anthropogenic and Natural Radiative Forcing, in: Climate Change 2013: The Physical Science Basis. Contribution of Working Group I to the Fifth Assessment Report of the Intergovernmental Panel on Climate Change, edited by: Stocker, T. F., Qin, D., Plattner, G.-K., Tignor, M., Allen, S. K., Boschung, J., Nauels, A., Xia, Y., Bex, V., and Midgley, P. M., Cambridge University Press, Cambridge, United Kingdom and New York, NY, USA, 659–740, https://doi.org/10.1017/CBO9781107415324.018, 2013.
Ogren, J. A., Wendell, J., Andrews, E., and Sheridan, P. J.: Continuous light absorption photometer for long-term studies, Atmos. Meas. Tech., 10, 4805–4818, https://doi.org/10.5194/amt-10-4805-2017, 2017.
Onasch, T., Massoli, P., Kebabian, P., Hills, F. B., Bacon, F., and Freedman, A.: Single Scattering Albedo Monitor for Airborne Particulates, Aerosol Sci. Technol., 49, 267–279, 2015.
Penner, J.: “Aerosols, their Direct and Indirect Effects.” Climate Change 2001: The Scientific Basis, Contribution of Working Group I to the Third Assessment Report of the Intergovernmental Panel on Climate Change, 289–348, 2001.
Petzold, A., Schloesser, H., Sheridan, P., Arnott, W., Ogren, J., and Virkkula, A.: Evaluation of Multiangle Absorption Photometry for Measuring Aerosol Light Absorption, Aerosol Sci. Technol., 39, 40–51, https://doi.org/10.1080/027868290901945, 2005.
Petzold, A., Rasp, K., Weinzierl, B., Esselborn, M., Hamburger, T., DöRnbrack, A., Kandler, K., SchuüTz, L., Knippertz, P., Fiebig, M., and Virkkula, A.: Saharan dust absorption and refractive index from aircraft-based observations during SAMUM 2006, Tellus B: Chem. Phys. Meteorol., 61, 118–130, https://doi.org/10.1111/j.1600-0889.2008.00383.x, 2009.
Petzold, A., Ogren, J. A., Fiebig, M., Laj, P., Li, S.-M., Baltensperger, U., Holzer-Popp, T., Kinne, S., Pappalardo, G., Sugimoto, N., Wehrli, C., Wiedensohler, A., and Zhang, X.-Y.: Recommendations for reporting ”black carbon” measurements, Atmos. Chem. Phys., 13, 8365–8379, https://doi.org/10.5194/acp-13-8365-2013, 2013.
Perim de Faria, J., Bundke, U., Freedman, A., Onasch, T. B., and Petzold, A.: Laboratory validation of a compact single-scattering albedo (SSA) monitor, Atmos. Meas. Tech., 14, 1635–1653, https://doi.org/10.5194/amt-14-1635-2021, 2021.
Radney, J. G., You, R., Ma, X., Conny, J. M., Zachariah, M. R., Hodges, J. T., and Zangmeister, C. D.: Dependence of Soot Optical Properties on Particle Morphology: Measurements and Model Comparisons, Environ. Sci. Technol., 48, 3169–3176, https://doi.org/10.1021/es4041804, 2014.
Rosen, H., Hansen, A. D. A., Gundel, L., and Novakov, T.: Identification of the optically absorbing component in urban aerosols, Appl. Opt., 17, 3859–3861, https://doi.org/10.1364/AO.17.003859, 1978.
Russell, P. B., Bergstrom, R. W., Shinozuka, Y., Clarke, A. D., DeCarlo, P. F., Jimenez, J. L., Livingston, J. M., Redemann, J., Dubovik, O., and Strawa, A.: Absorption Angstrom Exponent in AERONET and related data as an indicator of aerosol composition, Atmos. Chem. Phys., 10, 1155–1169, https://doi.org/10.5194/acp-10-1155-2010, 2010.
Sandradewi, J., Prévôt, A. S. H., Szidat, S., Perron, N., Alfarra, M. R., Lanz, V. A., Weingartner, E., and Baltensperger, U.: Using Aerosol Light Absorption Measurements for the Quantitative Determination of Wood Burning and Traffic Emission Contributions to Particulate Matter, Environ. Sci. Technol., 42, 3316–3323, https://doi.org/10.1021/es702253m, 2008.
Schnaiter, M., Schmid, O., Petzold, A., Fritzsche, L., Klein, K. F., Andreae, M. O., Helas, G., Thielmann, A., Gimmler, M., Mohler, O., Linke, C., and Schurath, U.: Measurement of wavelength-resolved light absorption by aerosols utilizing a UV-VIS extinction cell, Aerosol Sci. Technol., 39, 249–260, 2005.
Sheridan, P. J., Arnott, W. P., Ogren, J. A., Andrews, E., Atkinson, D. B., Covert, D. S., Moosmüller, H., Petzold, A., Schmid, B., Strawa, A. W., Varma, R., and Virkkula, A.: The Reno Aerosol Optics Study: An Evaluation of Aerosol Absorption Measurement Methods, Aerosol Sci. Technol., 39, 1–16, https://doi.org/10.1080/027868290901891, 2005.
Sherman, J. P., Sheridan, P. J., Ogren, J. A., Andrews, E., Hageman, D., Schmeisser, L., Jefferson, A., and Sharma, S.: A multi-year study of lower tropospheric aerosol variability and systematic relationships from four North American regions, Atmos. Chem. Phys., 15, 12487–12517, https://doi.org/10.5194/acp-15-12487-2015, 2015.
Sorensen, C. M.: Light Scattering by Fractal Aggregates: A Review, Aerosol Sci. Technol., 35, 648–687, https://doi.org/10.1080/02786820117868, 2001.
Török, S., Malmborg, V. B., Simonsson, J., Eriksson, A., Martinsson, J.,Mannazhi, M., Pagels, J., and Bengtsson, P.-E.: Investigation of the absorption Ångström exponent and its relation to physicochemical properties for mini-CAST soot, Aerosol Sci. Technol., 52, 757–767, https://doi.org/10.1080/02786826.2018.1457767, 2018.
Veselovskii, I., Goloub, P., Podvin, T., Bovchaliuk, V., Derimian, Y., Augustin, P., Fourmentin, M., Tanre, D., Korenskiy, M., Whiteman, D. N., Diallo, A., Ndiaye, T., Kolgotin, A., and Dubovik, O.: Retrieval of optical and physical properties of African dust from multiwavelength Raman lidar measurements during the SHADOW campaign in Senegal, Atmos. Chem. Phys., 16, 7013–7028, https://doi.org/10.5194/acp-16-7013-2016, 2016.
Virkkula, A.: Correction of the Calibration of the 3-wavelength Particle Soot Absorption Photometer (3 PSAP), Aerosol Sci. Technol., 44, 706–712, https://doi.org/10.1080/02786826.2010.482110, 2010.
Virkkula, A., Ahlquist, N. C., Covert, D. S., Sheridan, P. J., Arnott, W. P., and Ogren, J. A.: A three-wavelength optical extinction cell for measuring aerosol light extinction and its application to determining light absorption coefficient, Aerosol Sci. Technol., 39, 52–67, https://doi.org/10.1080/027868290901918, 2005.
Weber, P., Petzold, A., Bischof, O., Fischer, B., Berg, M., Freedman, A., Onasch, T., and Bundke, U.: Data of Relative errors in derived multi-wavelength intensive aerosol optical proberties, Zenodo [data set], https://doi.org/10.5281/zenodo.6531472, 2022.
Xu, L., Suresh, S., Guo, H., Weber, R. J., and Ng, N. L.: Aerosol characterization over the southeastern United States using high-resolution aerosol mass spectrometry: spatial and seasonal variation of aerosol composition and sources with a focus on organic nitrates, Atmos. Chem. Phys., 15, 7307–7336, https://doi.org/10.5194/acp-15-7307-2015, 2015.