the Creative Commons Attribution 4.0 License.
the Creative Commons Attribution 4.0 License.
 | 09 Jun 2022
Ground-based validation of the MetOp-A and MetOp-B GOME-2 OClO measurements
Michel Van Roozendael
François Hendrick
Andreas Richter
Pieter Valks
Ramina Alwarda
Kristof Bognar
Udo Frieß
José Granville
Myojeong Gu
Paul Johnston
Cristina Prados-Roman
Richard Querel
Kimberly Strong
Thomas Wagner
Folkard Wittrock
Margarita Yela Gonzalez
This paper reports on ground-based validation of the atmospheric OClO data record produced within the framework of EUMETSAT's Satellite Application Facility on Atmospheric Chemistry Monitoring (AC SAF) using the Global Ozone Monitoring Experiment (GOME)-2A and GOME-2B instrument measurements, covering the 2007–2016 and 2013–2016 periods, respectively. OClO slant column densities are compared to correlative measurements collected from nine Zenith-Scattered-Light Differential Optical Absorption Spectroscopy (ZSL-DOAS) instruments from the Network for the Detection of Atmospheric Composition Change (NDACC) distributed in both the Arctic and Antarctic. Sensitivity tests are performed on the ground-based data to estimate the impact of the different OClO DOAS analysis settings. On this basis, we infer systematic uncertainties of about 25 % (i.e., about 3.75×10¹³ molec. cm−2) between the different ground-based data analyses, reaching total uncertainties ranging from about 26 % to 33 % for the different stations (i.e., around 4 to 5×10¹³ molec. cm−2). Time series at the different sites show good agreement between satellite and ground-based data for both the inter-annual variability and the overall OClO seasonal behavior. GOME-2A results are found to be noisier than those of GOME-2B, especially after 2011, probably due to instrumental degradation effects. Daily linear regression analysis for OClO-activated periods yield correlation coefficients of 0.8 for GOME-2A and 0.87 for GOME-2B, with slopes with respect to the ground-based data ensemble of 0.64 and 0.72, respectively. Satellite minus ground-based offsets are within 8×10¹³ molec. cm−2, with some differences between GOME-2A and GOME-2B depending on the station. Overall, considering all the stations, a median offset of about molec. cm−2 is found for both GOME-2 instruments.
- Article
(3336 KB) - Full-text XML
- BibTeX
- EndNote


The increase in the chlorine and bromine species in the stratosphere due to the anthropogenic release of long-lived halogenated compounds led to dramatic ozone losses in the polar winter stratosphere starting in the 1980s (e.g., Solomon et al., 1988, 1990; Solomon, 1999).
In polar regions, the chemical destruction of ozone is strongly influenced by the polar vortex, which results from the large-scale descent of cold air masses during winter. The polar vortex is also associated with strong Coriolis-related circumpolar winds that prevent air mixing with lower latitudes. In the Northern Hemisphere (NH), due to the inhomogeneous distribution of land masses, disturbances of the Arctic vortex by vertical propagation of planetary waves is frequent, while the Antarctic vortex usually remains stable and more or less symmetric until at least late spring (November).
During winter, temperatures inside the vortex can drop below the threshold for the formation of polar stratospheric clouds (PSCs), and heterogeneous reactions on PSC particles convert ozone-inert chlorine reservoirs (mainly ClONO2 and HCl) into ozone-destroying species (active chlorine, mainly Cl, ClO and ClOOCl); see, e.g., Solomon (1999). This chlorine activation is the prerequisite for ozone destruction by catalytic cycles like the ClO–ClO and the ClO–BrO cycle (McElroy et al., 1986; Molina and Molina, 1987) after the return of sunlight in the polar spring. OClO is mostly created by the reaction between ClO and BrO (ClO + BrO → OClO + Br) (Solomon et al., 1987; Toumi, 1994; Renard et al., 1997). OClO has a very short lifetime of a few seconds in the sunlit atmosphere due to its photolysis (OClO + hν→ ClO + O), which prevents the buildup of significant amounts until large solar zenith angles (SZAs) are reached. Nighttime and twilight OClO are thus a good indicator of chlorine activation (Sessler et al., 1995; Renard et al., 1997; Tørnkvist et al., 2002). Although OClO is only formed in sizable quantities during the night, solar backscatter measurements of OClO columns can be performed from space near the terminator where the photolysis efficiency is reduced.
The emission of long-lived chlorine and bromine containing substances has been regulated since 1987 after the implementation of the Montreal Protocol and its Amendments. As a result, atmospheric levels of the ozone-destroying precursor substances have decreased over the last few decades. Monitoring of stratospheric chlorine and bromine contents remains important to assess the effectiveness of the regulatory measures taken, in particular in the context of climate change and its impact on ozone recovery.
Halogen oxides such as BrO and OClO can be measured using the Differential Optical Absorption Spectroscopy (DOAS) method (Platt and Stutz, 2008) owing to their structured absorption cross sections in the UV and visible parts of the spectrum. For OClO, the first detection from the ground was reported by Solomon et al. (1987) in Antarctica and subsequently by many other measurements in both hemispheres (Solomon et al., 1988, 1990; Gil et al., 1996; Kreher et al., 1996; Otten et al., 1998; Richter et al., 1999; Tørnkvist et al., 2002; Vandaele et al., 2005; Frieß et al., 2005). Observations from aircraft (Schiller et al., 1990) and from balloons (Pommereau and Piquard, 1994; Renard et al., 1997) followed.
The first OClO retrievals from nadir satellite data were performed using the Global Ozone Monitoring Experiment (GOME) by Wagner et al. (2001, 2002); Burrows et al. (1999); Kühl et al. (2004) and Richter et al. (2005). This was followed by measurements from the Scanning Imaging Spectrometer for Atmospheric Chartography (SCIAMACHY, Kühl et al., 2006), the Ozone Monitoring Instrument (OMI, OMOCLOv3, 2021), GOME-2 (Richter et al., 2015; Valks et al., 2019a, b), and the TROPOspheric Monitoring Instrument (TROPOMI, Meier et al., 2020; Puķīte et al., 2021, 2022).
Richter et al. (2015) illustrated the possibility of retrieving consistent datasets of OClO slant column densities (SCDs) from both GOME-2A and GOME-2B sensors. Settings proposed by Richter et al. (2015) were implemented at DLR for the EUMETSAT Satellite Application Facility on Atmospheric Chemistry Monitoring (AC SAF) data products (Hassinen et al., 2016) within the GOME data processor (GDP) 4.8 (Valks et al., 2019a, b) for the period 2007 to 2016 and are the focus of this study.
These global long-term nadir satellite datasets offer interesting perspectives to study inter-hemispheric and inter-annual differences in the activation of halogens, their dependence on meteorological parameters, and their long-term trends. To allow for reliable exploitation of the long time series (starting in 1995 with GOME), it is essential to validate the different datasets. At present, to our knowledge only a small number of studies quantitatively intercompared OClO datasets, and these mostly cover only a few seasons, episodes, or years (Oetjen et al., 2011; Richter et al., 2015; Kühl et al., 2006; Puķīte et al., 2021, 2022).
In this paper, we present a validation approach focusing on polar regions by addressing the quality of the GOME-2A and GOME-2B OClO AC SAF data records over eight stations from 2007 to 2016. The satellite slant columns are compared to correlative observations acquired by independent ground-based DOAS spectrometers in zenith-sky geometry, and the results for both satellites are compared and discussed. The paper is organized as follows: Sect. 2 presents the OClO algorithm applied to GOME-2, while Sect. 3 presents the ground-based ZSL-DOAS datasets and the comparison method. The validation results are discussed in Sect. 4, and conclusions are given in Sect. 5.
The second Global Ozone Monitoring Instrument (GOME-2) is a nadir-looking UV–visible (UV–VIS) spectrometer measuring the solar radiation backscattered by the atmosphere and reflected by the Earth surface and clouds in the 240–790 nm wavelength interval at a spectral resolution of 0.2–0.5 nm full width at half maximum (FWHM) (Munro et al., 2016). There are three GOME-2 instruments flying on sun-synchronous polar orbits onboard the Meteorological Operational satellites (MetOp-A, MetOp-B, and MetOp-C, launched in October 2006, September 2012, and November 2018, respectively). They have an Equator crossing time of 09:00–09:30 LT (local time) in the descending node. The default swath width of the GOME-2 across-track scan is 1920 km, allowing global Earth coverage within 1.5–3 d at the Equator, with a nominal ground pixel size of 80×40 km2. Since 15 July 2013, GOME-2A has been measuring on a reduced swath mode of 960 km with a ground pixel size of 40×40 km2.
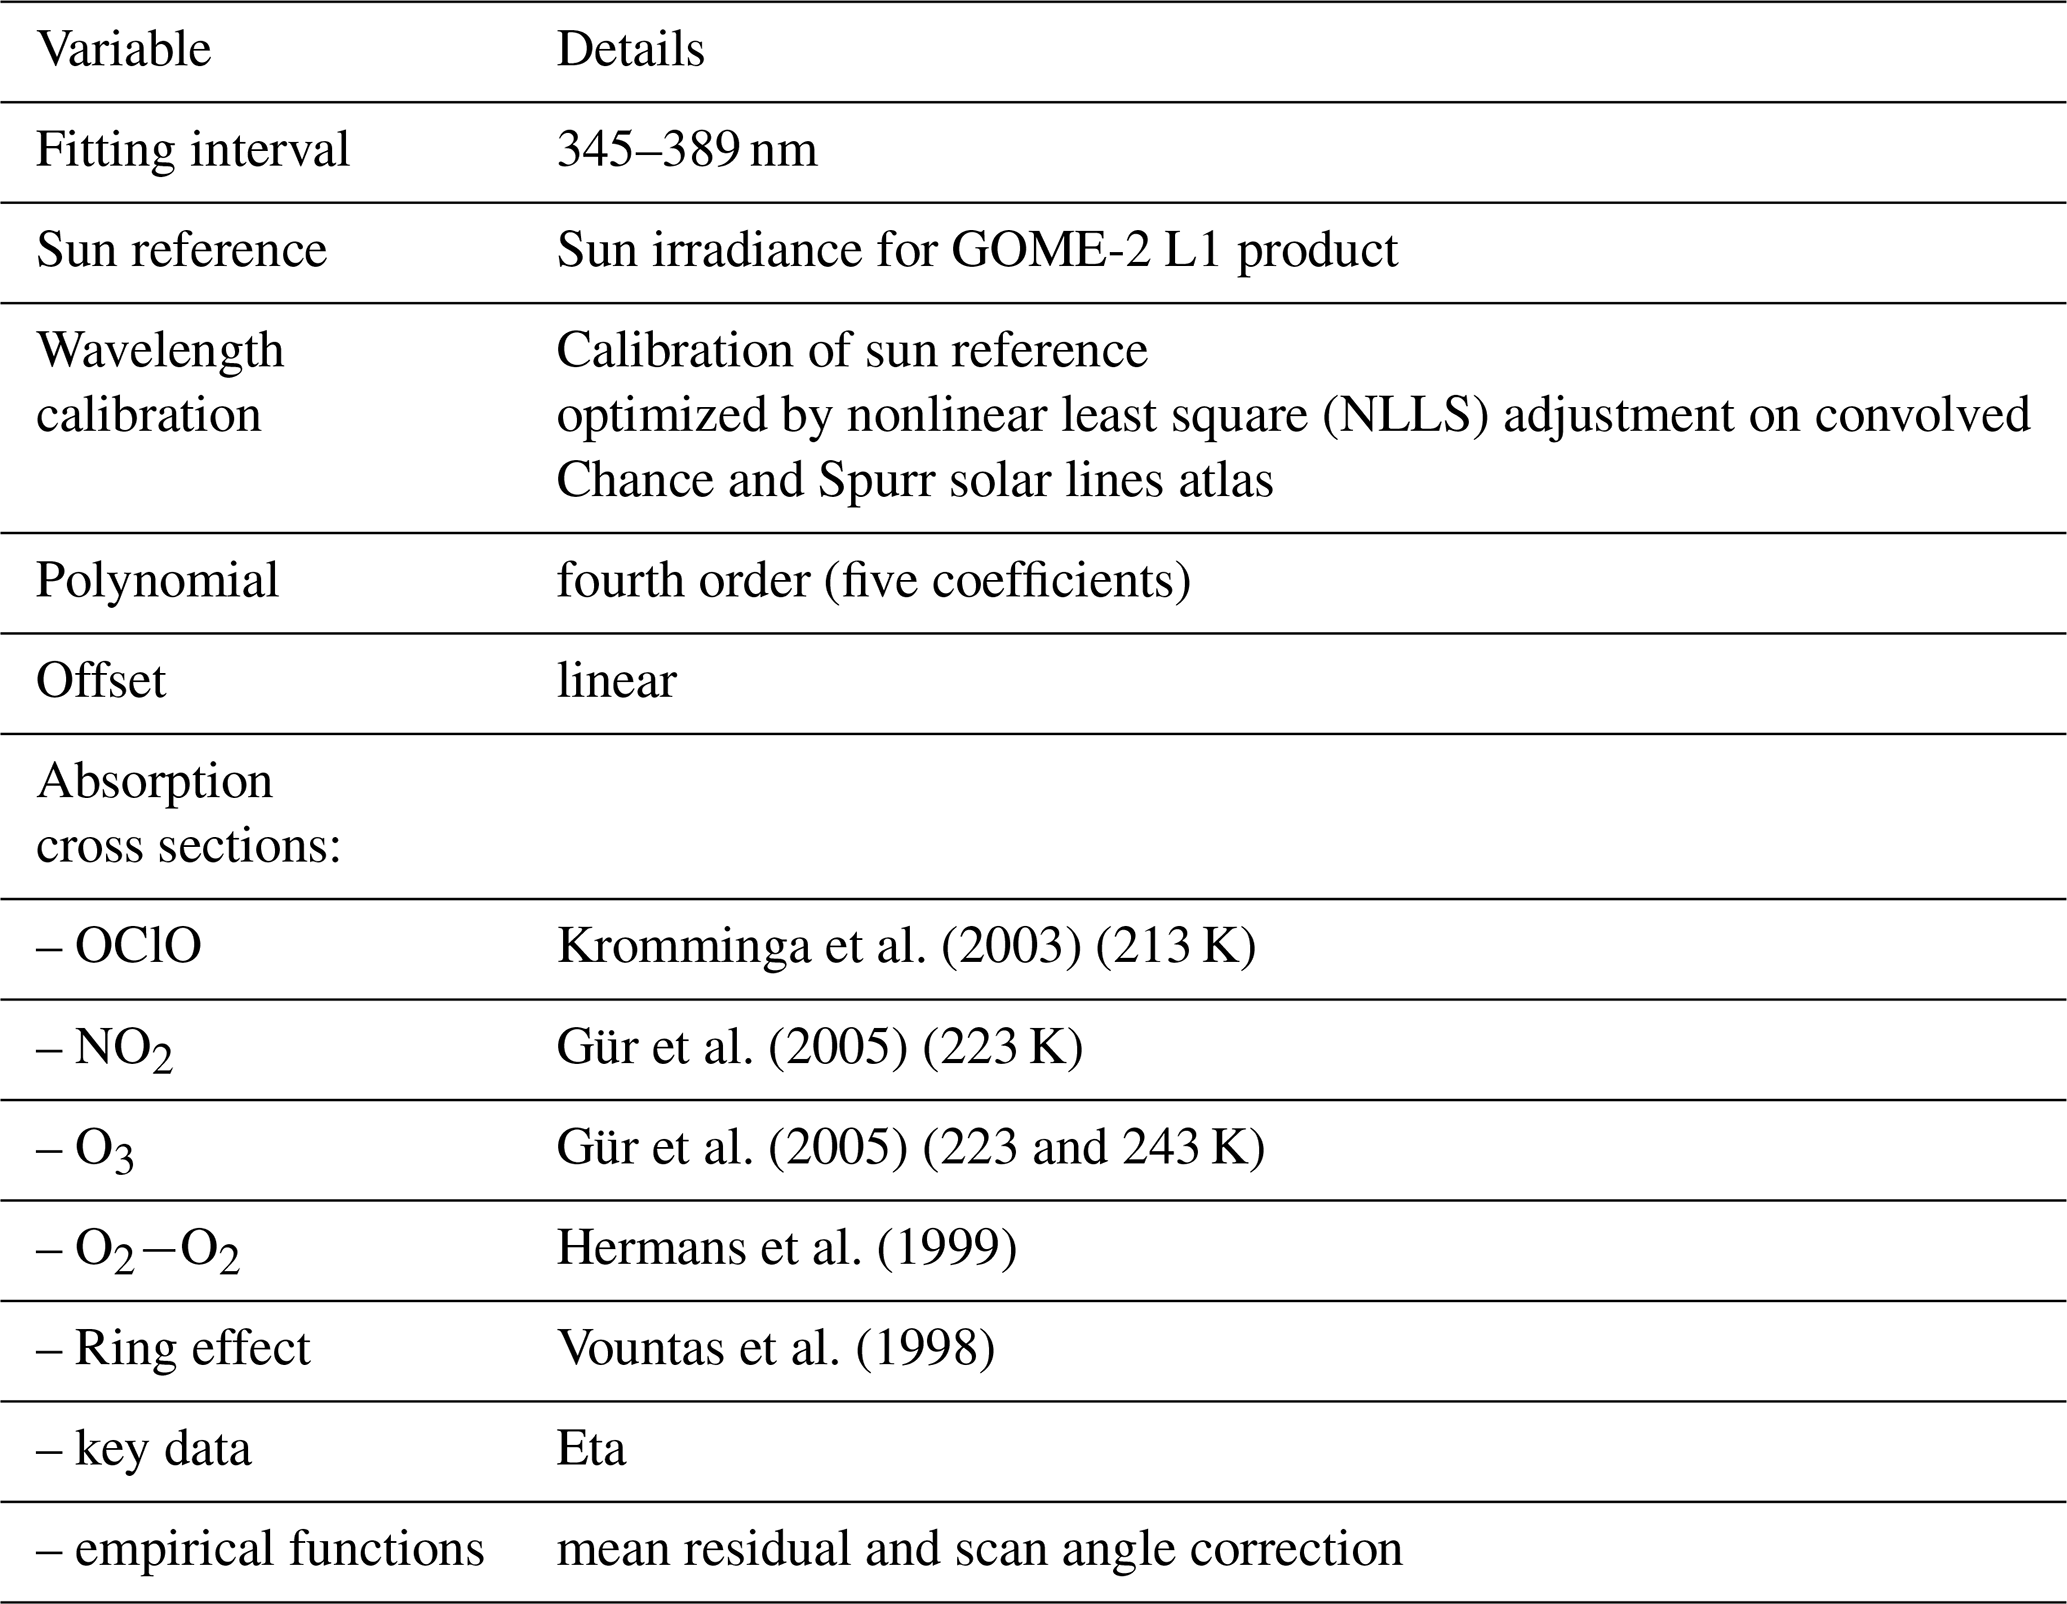
Following the initial study of Richter et al. (2009), an improved OClO slant column retrieval algorithm was developed for both GOME-2A and -B in the framework of an AC SAF Visiting Scientist project (Richter et al., 2015). This led to a clear improvement compared to earlier results. The settings, summarized in Table 1, were implemented by DLR in the AC SAF product portfolio as GDP 4.8 data records for GOME-2A (2007–2016) and GOME-2B (2012–2016). These data products can be found on the ftp://acsaf.eoc.dlr.de FTP server (last access: 28 June 2021, OClO ACSAF, 2017).
The GOME-2 GDP 4.8 OClO retrieval algorithm is fully described in the corresponding Algorithm Theoretical Basis Document (Valks et al., 2019a), and detailed information about the development of the analysis can be found in Richter et al. (2015).
The DOAS retrieval is performed in the UV wavelength range 345–389 nm, which was found to minimize both bias and noise in retrieved OClO slant columns. The fit includes NO2, O3, O2-O2, and the Ring effect (see Table 1). The GOME-2 key data parameter Eta (Valks et al., 2019a) is included as another effective cross section to correct for residual polarization errors in the level 1 product. This inclusion significantly improves the OClO fitting residuals. Two empirical correction functions (derived from mean DOAS fit residuals) are also included as additional (pseudo-) absorption cross sections in the DOAS fit: a mean residual and a scan angle correction function. These two empirical functions correct for positive offsets and scan angle dependencies in the OClO columns. Remaining biases in the OClO columns (e.g., non-zero OClO columns over areas without chlorine activation), with temporal drifts observed mainly in the OClO data from GOME-2A (see Richter et al., 2015), need to be treated using an additional offset correction. A simple normalization is thus applied on an orbital basis. The mean OClO slant column for the area between 50∘ N and 50∘ S (a latitude region without chlorine activation) is determined for each GOME-2 orbit and subtracted from the retrieved OClO slant columns for the complete orbit, leading to normalized OClO SCDs. Typically, the offset can be can be ∼ 1–4×10¹³ molec. cm−2.
Kromminga et al. (2003)Gür et al. (2005)Gür et al. (2005)Hermans et al. (1999)Vountas et al. (1998)Table 1DOAS settings used for the GOME-2 OClO retrieval in GDP 4.8.
An illustration of OClO SCD maps for the Arctic in February 2011 and the Antarctic in August 2015 is given in Fig. 1.
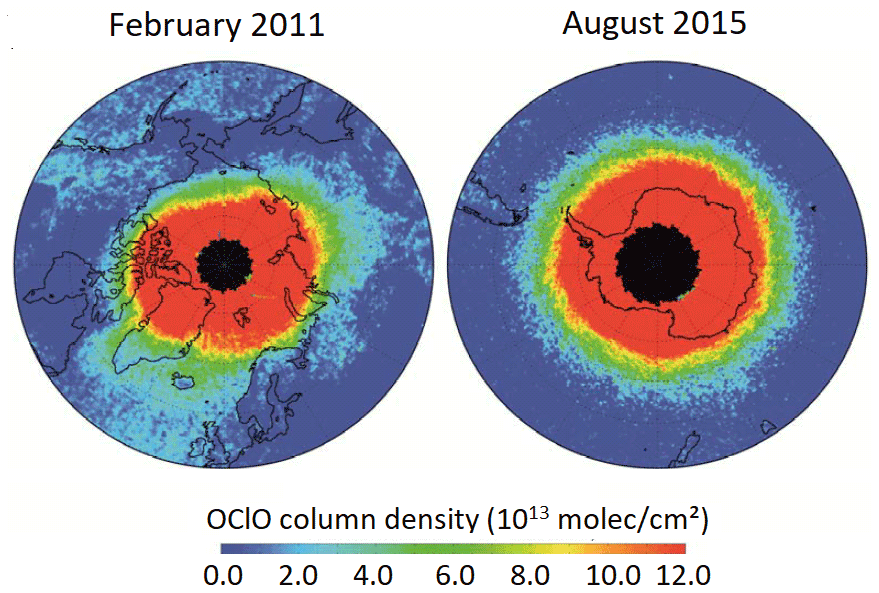
Figure 1GOME-2 OClO SCD maps for February 2011 and August 2015.
As OClO photolyzes rapidly, it can only be observed at large solar zenith angles close to the terminator. Under these circumstances, the calculation of an air mass factor (AMF) and a vertical column is not trivial. It is complicated by rapid photolysis, the change in SZA along the line of sight, and the uncertainty in the OClO vertical profile (Richter et al., 2005; Oetjen et al., 2011). Therefore, as has been done in previous studies, the GOME-2 GDP data product only contains (normalized) OClO SCDs.
A flag indicates when valid (enhanced) OClO column values can be expected from the GOME-2 data. The OClO flag is set to 1 for daylight measurements with a large solar zenith angle (), and it is set to 2 for measurements during twilight (); see Valks et al. (2019b).
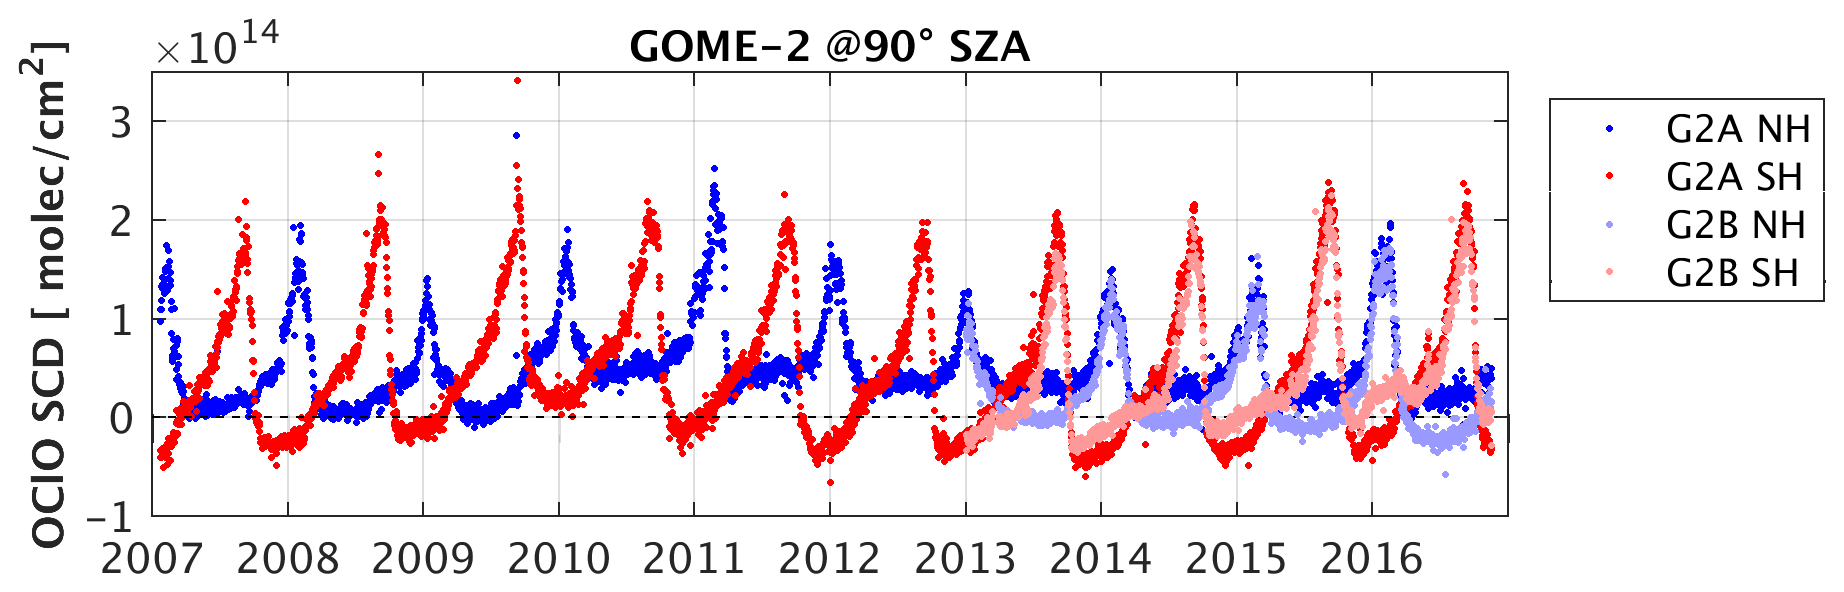
Figure 2 illustrates the GOME-2A and B datasets by presenting the daily 90∘ SZA OClO SCD averages of both instruments separated into hemispheres. As expected, OClO levels in the Southern Hemisphere (SH) are usually larger than in the Northern Hemisphere, and the year-to-year variability is larger in the latter. For example, lower chlorine activation levels are found in 2009 and 2013 in the Northern Hemisphere compared to other years. Outside the chlorine activation period, values should be very close to 0 in both hemispheres. This is partly the case in the first years of measurements of each instrument, especially in the Northern Hemisphere, although some negative or positive offsets (of up to 4 to 5×10¹³ molec. cm−2) and drifts appear for some of the years (e.g., 2010 in the Northern Hemisphere for GOME-2A). In particular, GOME-2A for the Northern Hemisphere starts with a baseline close to 0 for the first 3 years and jumps up in 2010 before slowly drifting down again to a 0 baseline in 2016. For the Southern Hemisphere, GOME-2A starts negative, drifts up until it is in the positive in 2010/2011, and jumps straight down again in 2011/12 and stays in the negative. These results suggest that there is still room for improvement in the current GOME-2 analysis.
3.1 Ground-based NDACC ZSL-DOAS data
As stated in Sect. 1, OClO columns have been retrieved from the ground since 1986 using the DOAS technique. For this study we selected eight stations operating Zenith-Scattered-Sunlight (ZSL)-DOAS UV–VIS spectrometers from the Network for the Detection of Atmospheric Composition Change (NDACC, https://www.ndaccdemo.org/, last access: 28 June 2021), located above 60∘ latitude in both hemispheres and performing OClO SCD data retrievals. The geographical distribution of these instruments is represented in Fig. 3, and a more extensive description of the sites is given in Appendix A1. This dataset provides a good temporal coverage, with some of the stations reporting observations over the whole MetOp-A operation period (2007–2016). A good coverage of the Arctic and Antarctic region is also achieved, with half of the stations located in the Northern Hemisphere and the other half located in the Southern Hemisphere. This ensemble of stations was also recently used for the validation of TROPOMI OClO SCDs (Pinardi et al., 2020).
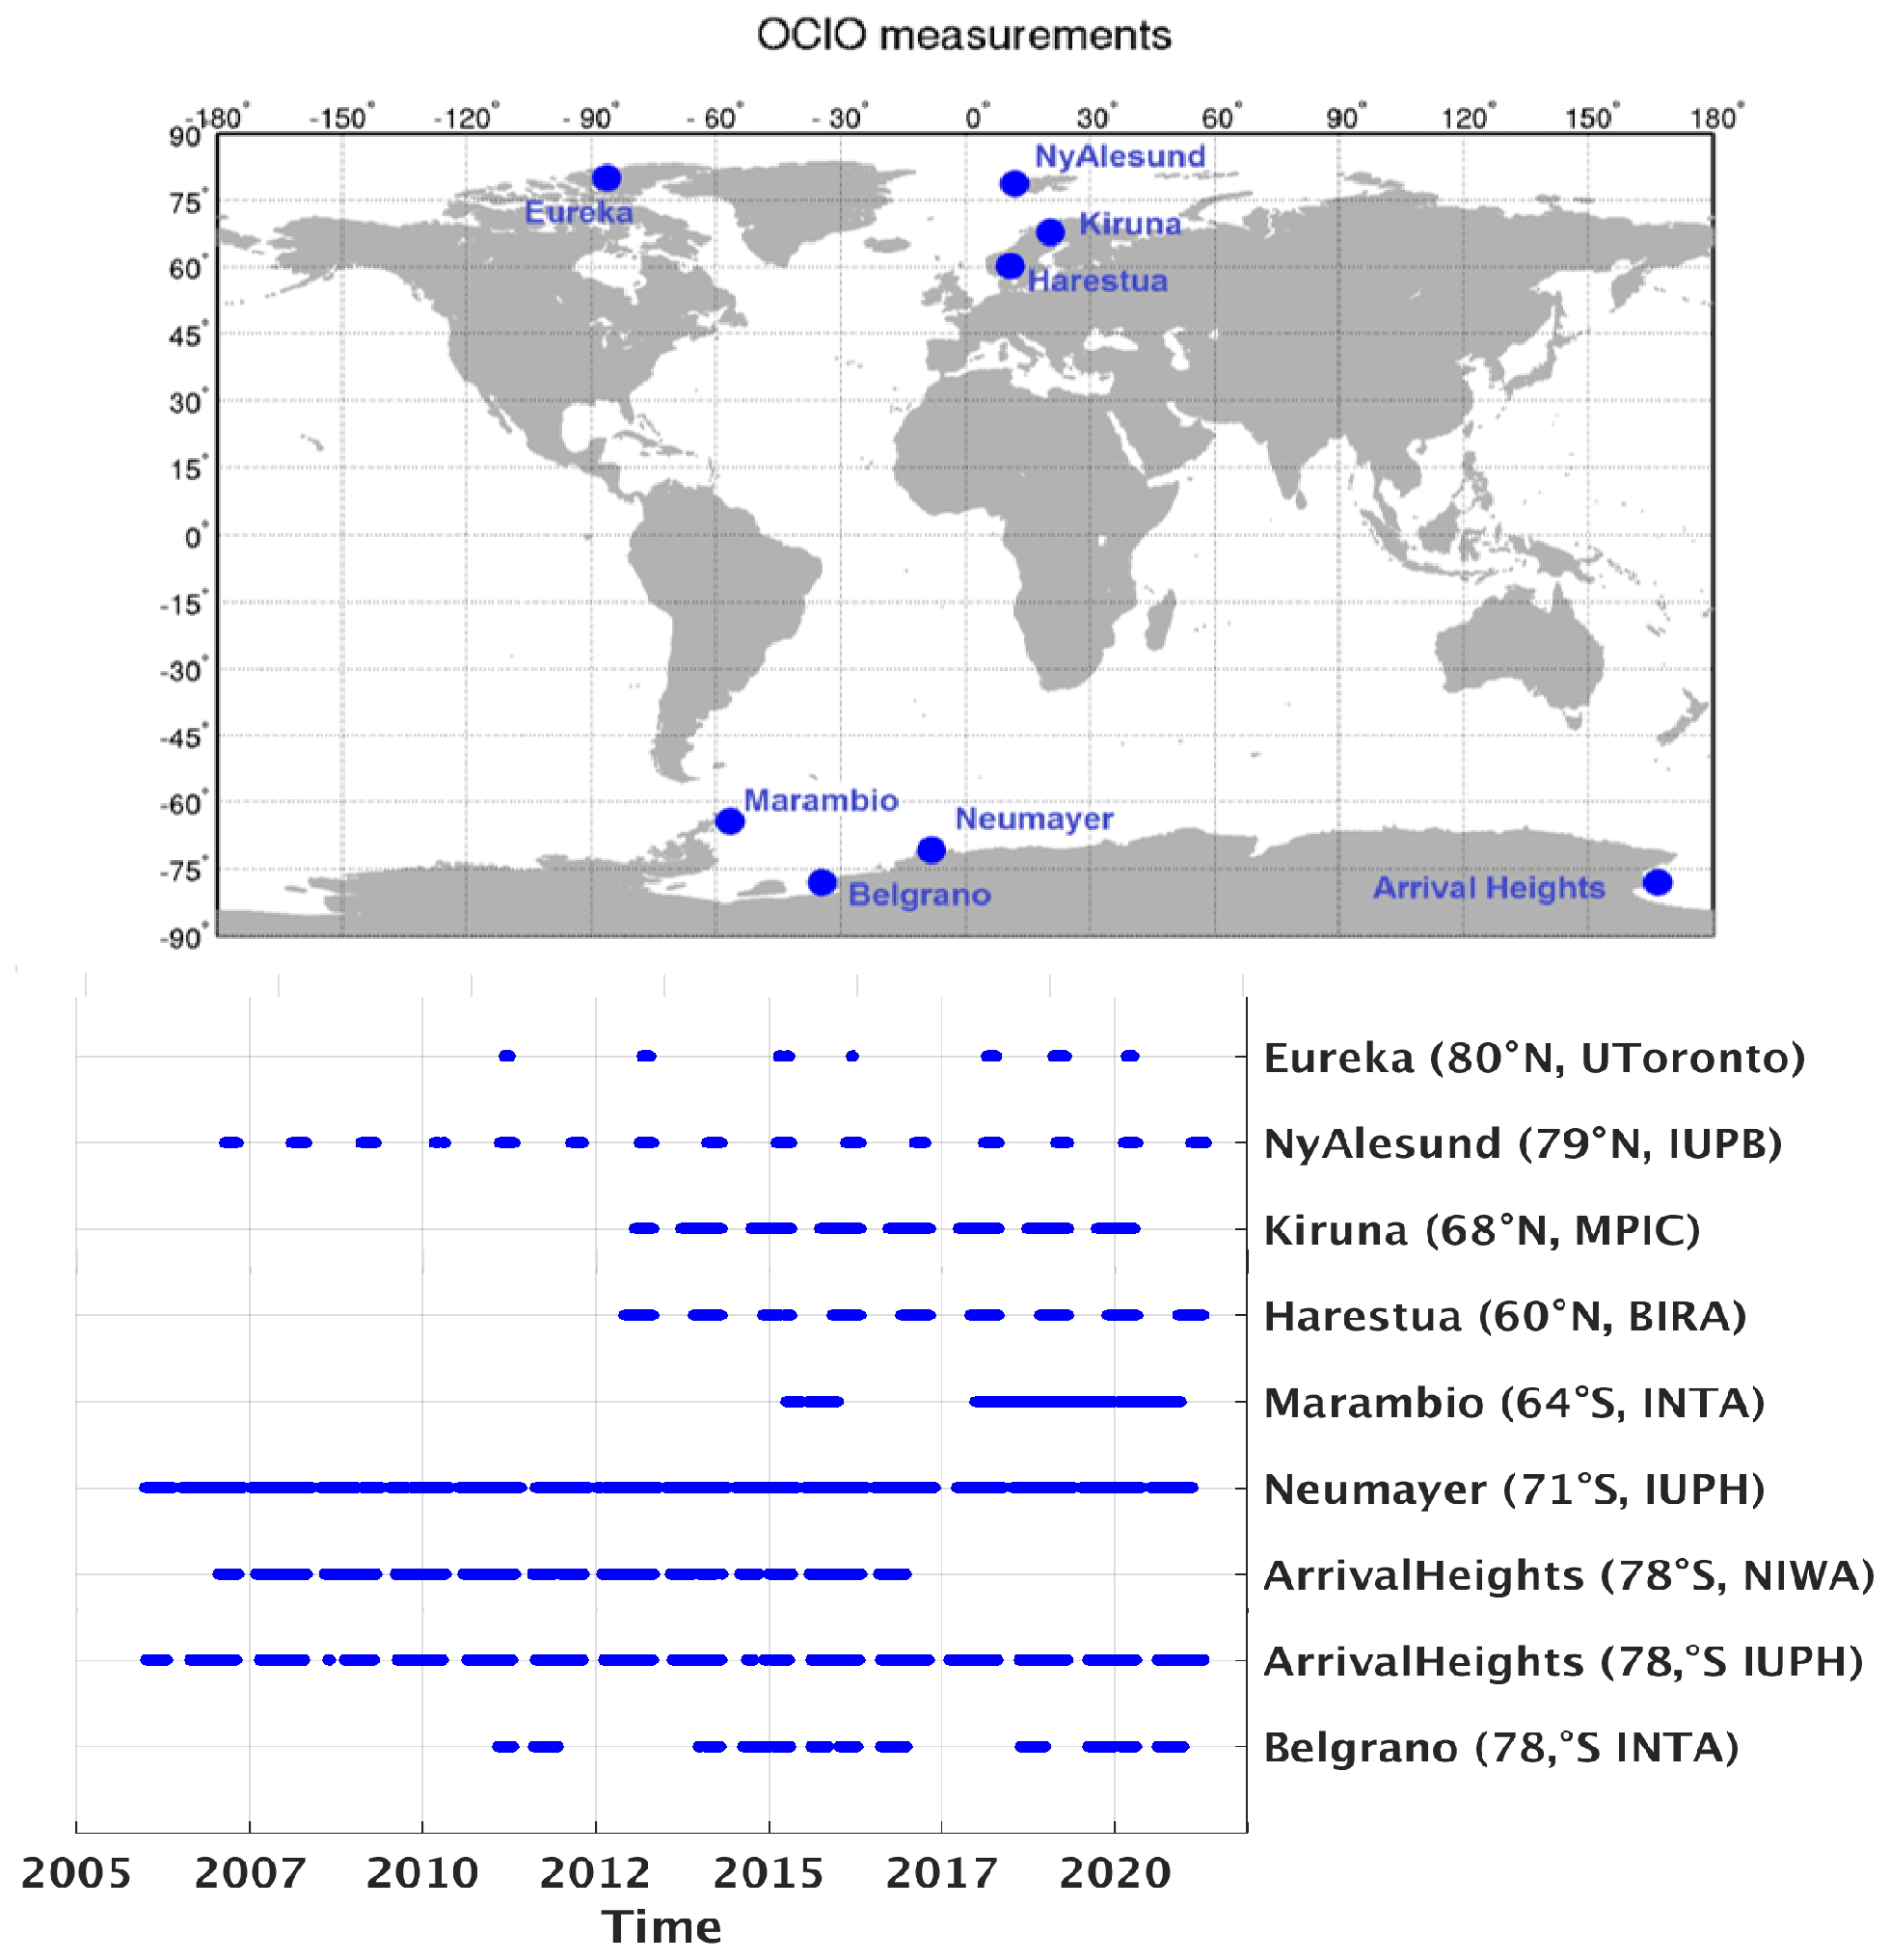
Figure 3Geographical distribution and measurement time periods of the UV–VIS NDACC ZSL-DOAS instruments providing the correlative OClO measurements.
Specific details on the OClO SCD analysis are given in Table 2. As is further described in Sect. 3.2, ground-based measurements are extracted at the solar zenith angle of the recorded GOME-2 pixels for optimal photochemical coincidence with satellite observations. A fixed reference spectrum selected outside of the activated vortex period ensures that no OClO contribution comes from the reference, providing in this way absolute slant columns. For the UToronto instrument at Eureka, some instrumental instabilities prevented the use of a single yearly fixed spectrum for the analysis of some of the years, leading to a reduced temporal coverage of the comparisons (see Figs. 13 and 14).
Table 2Description of the different ground-based OClO datasets used in this study. Dashes are used to indicate instances where data were not used.
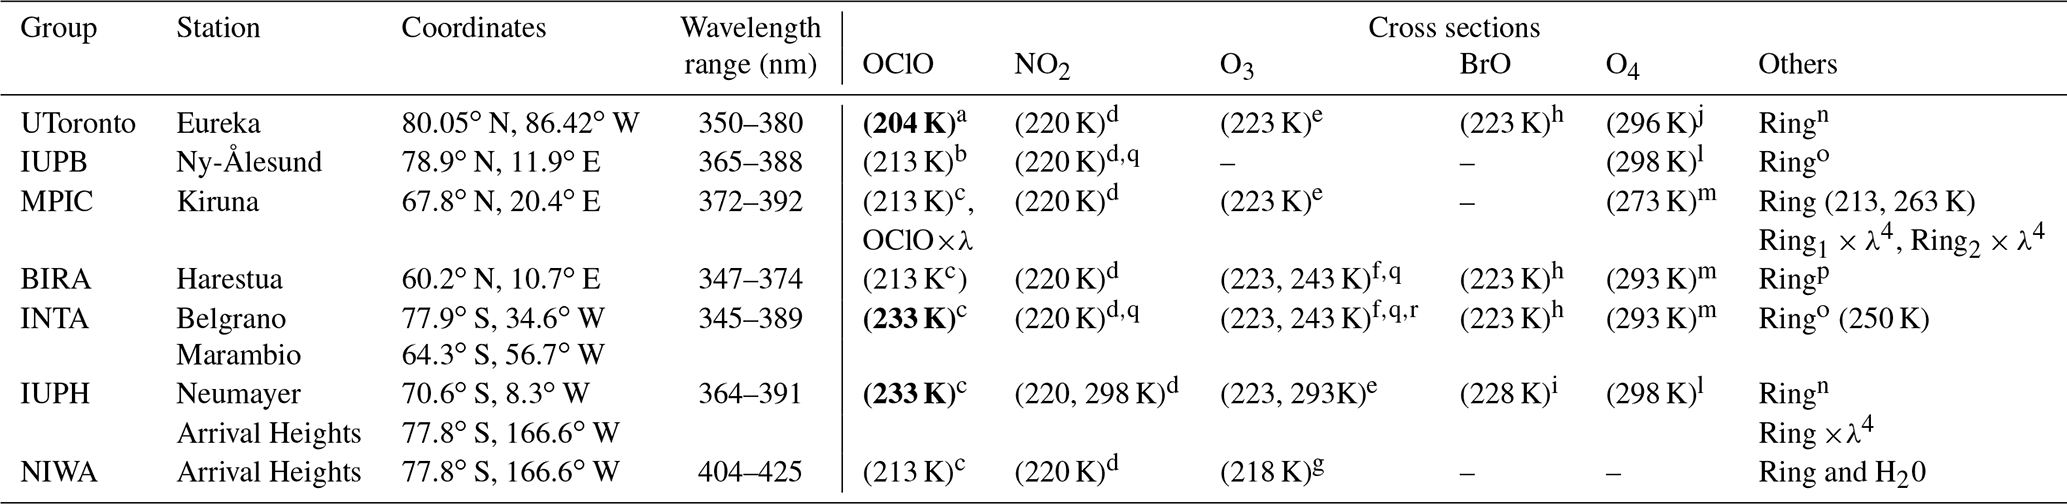
a Wahner et al. (1987). b Kromminga et al. (1999). c Kromminga et al. (2003). d Vandaele et al. (1998). e Bogumil et al. (2003). f Serdyuchenko et al. (2014). g Brion et al. (1998).
h Fleischmann et al. (2004). i Wilmouth et al. (1999).
j Greenblatt et al. (1990). k Hermans et al. (2003). l Hermans et al. (1999). m Thalman and Volkamer (2013).
n Chance and Spurr (1997). o QDOAS (https://uv-vis.aeronomie.be/software/QDOAS/, last access: 2 June 2022) high-resolution Ring data based on Smithsonian Astrophysical Observatory
(SAO) solar spectra (Chance and Kurucz, 2010). p SCIATRAN.
q I0 correction (Aliwell et al., 2002). r Uses the Puķīte et al. (2010) approach.
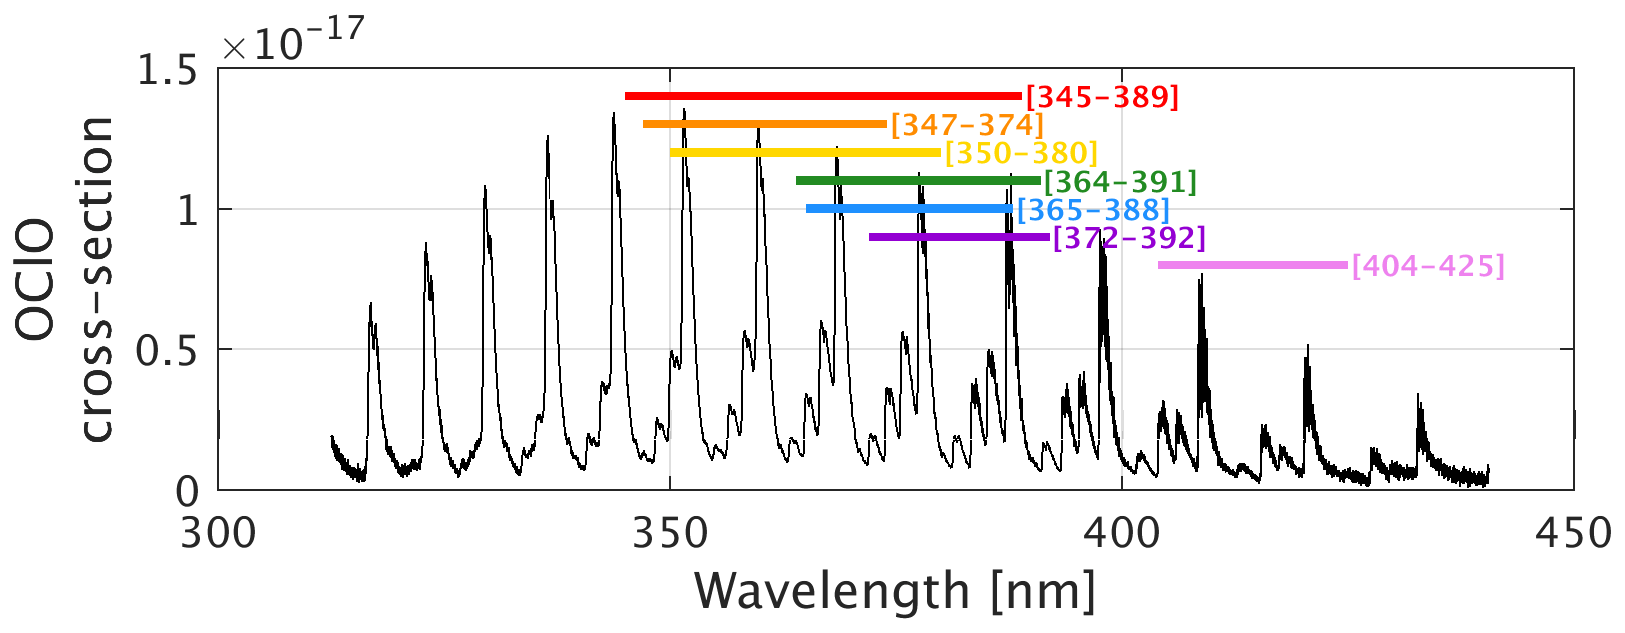
Figure 4OClO absorption cross section at 213 K from Kromminga et al. (2003) and the different DOAS analysis intervals used in this study by GOME-2 and INTA (red), BIRA (orange), UToronto (yellow), IUPH (green), IUPB (blue), MPIC (purple), and NIWA (pink).
From Table 2, it is clear that the ensemble of ground-based datasets is an aggregate of existing measurements and there is no harmonization in the retrieval choices of the different groups processing the OClO data. Different wavelength regions were used by each group for the OClO analysis, depending mainly on the spectral range covered by the respective instruments (see Table A1 for the instrumental details). In most cases, retrievals were performed in the UV region between 345 and 392 nm. One exception is NIWA who analyzed its data in the visible spectral range (404–425 nm, Kreher et al., 1996). An illustration of the different OClO bands used in the different intervals is presented in Fig. 4.
Another important difference is related to the OClO cross section used and its temperature. It can be seen that most of the groups use the Kromminga et al. (2003) cross sections, while IUPB adopted the Kromminga et al. (1999) dataset and UToronto used the Wahner et al. (1987) dataset at 204 K. Moreover, within groups having adopted the Kromminga et al. (2003) data, most of them used the 213 K dataset, while INTA and IUPH used the 233 K dataset.
Depending on the selected DOAS interval, the different groups include several other trace gas cross sections (NO2, O3, BrO, O4) in addition to OClO in their DOAS fit. In addition, they treat the Ring effect as a pseudo-absorber. Not all the absorbers are necessarily needed, especially when a small wavelength interval is considered. For example, the Ny-Ålesund IUPB analysis (365–388 nm) does not include O3 and BrO, whereas the Kiruna MPIC analysis (372–392 nm) does not include BrO. For the NIWA visible interval these two gases are also not necessary, whereas the water vapor cross section is considered.
In order to assess the uncertainties related to the use of different OClO DOAS fit settings by the different groups, we performed a series of sensitivity tests that are reported in the next subsection.
3.1.1 SCD error estimation
In this section, we summarize the ground-based SCD error estimation. The random component of the uncertainty is evaluated using results from DOAS retrievals performed by each group, and for the systematic uncertainty we perform sensitivity tests to evaluate the impact of applying different retrieval settings, as presented in Table 2. The details of the different sensitivity tests are presented in Appendix A2, and the results are summarized here and in the different tables.
Random errors
Random errors of SCDs are estimated by each group as part of their DOAS analysis. As summarized in Table 3, median values for the different datasets range from 6 % to 22 % (i.e., between 1 and 3.3×10¹³ molec. cm−2) for SCD values of about molec. cm−2 (representative of OClO measurements in activated conditions and median values of the SZA in between 86 and 90∘, depending on the station). These values are globally consistent with past literature estimations (about 2×10¹³ molec. cm−2 for Neumayer and Arrival Heights, Frieß et al., 2005; 4 %–10 % at 90∘ SZA for the NIWA Arrival Heights, Kreher et al., 1996; and 20 % for Ny-Ålesund data at 90∘ SZA, Oetjen et al., 2011).
Systematic errors
Systematic errors of OClO SCDs are estimated based on sensitivity tests performed using spectra recorded with the IUPB instrument at Ny-Ålesund during a few days in February 2014. As presented in Appendix A2, we investigated the impact of main differences that can be identified in Table 2; i.e., we first investigated the choice of the OClO cross section source and its temperature, and second we investigated the different wavelength ranges.
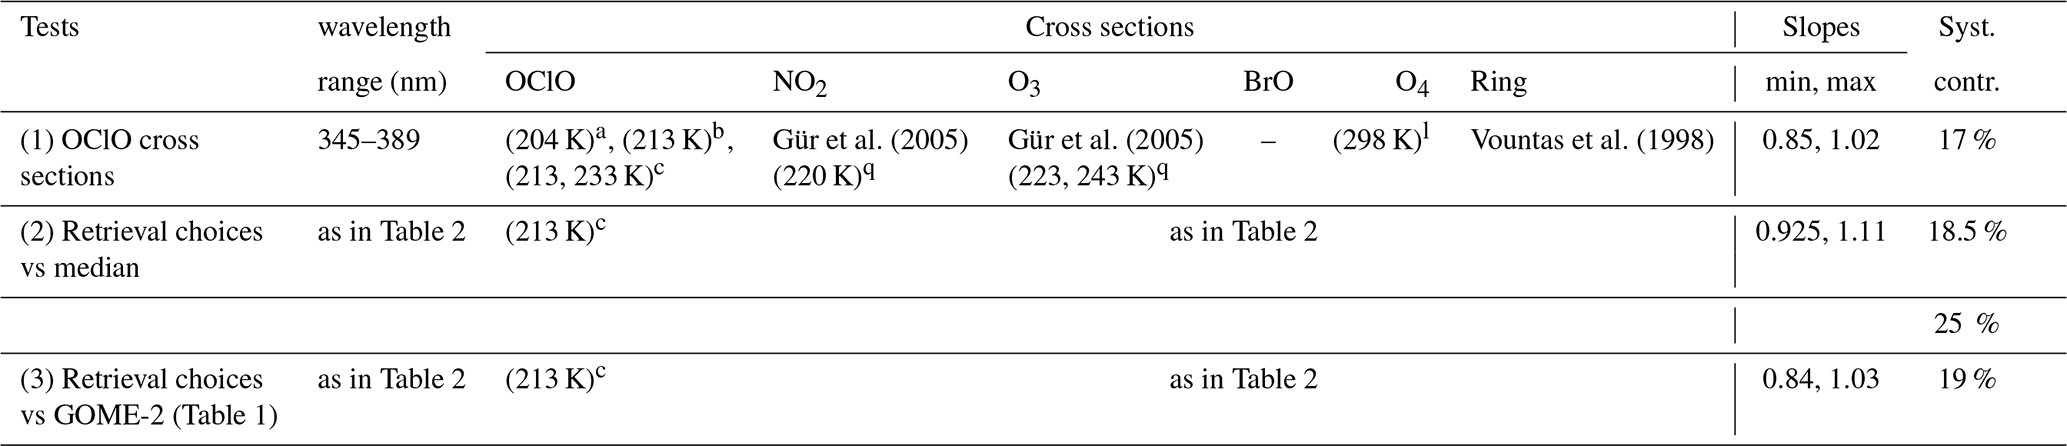
The estimated systematic errors range between 2 % and 15 % for the uncertainty related to the OClO cross section (see Fig. A1) and show a total uncertainty of about 17 % (Table A2). The values corresponding to each group's choice are indicated in the first column of the systematic uncertainty contributions in Table 3.
The errors due to the different group's retrieval choices are estimated through regression analysis of each setting with respect to the median OClO SCD values of all the settings together (see Fig. A2). The results present compact regression with a root mean square (rms) that is generally smaller than 2×10¹³ molec. cm−2, except in the cases of IUPH and MPIC. As discussed in Appendix A2, results for the latter two cases are likely biased due to the limited wavelength range (up to about 390.4 nm) of the Ny-Ålesund spectra. All intercepts except for IUPH are small (smaller than 1×10¹³ molec. cm−2; see Fig. A2), and the differences between the measurements reside mostly in the slope, meaning that those differences are mostly multiplicative. The values corresponding to each group's choice are indicated in the second column of the systematic uncertainty contributions in Table 3. The largest impact on the slope is obtained for the MPIC and UToronto cases, leading to a difference between all cases of about 18.5 % (see Table A2). This value is considered the maximum systematic uncertainty of the retrieval choice for the systematic uncertainty contribution in Table A2, leading to a total maximum systematic uncertainty of about 25 % (i.e., about 3.75×10¹³ molec. cm−2 for a SCD value of about 15×1013 molec. cm−2) when adding the contribution related to the OClO cross section source.
Expected systematic bias against GOME-2
The expected systematic bias due to differences between each group's analysis and the GOME-2 OClO retrieval settings is investigated in a third test. This test (presented in Fig. A3) uses a similar methodology to the second test presented above, but we now compare the SCDs obtained by applying to the Ny-Ålesund spectra the DOAS settings from the different groups and the GOME-2 settings defined in Table 1.
For each group, the total expected systematic bias of OClO SCD consists of a first component that is due to the difference in the used OClO cross section compared to Kromminga et al. (2003) (reported as the first number of the last column of Table 3) and a second component that comes from the impact of other settings, as obtained in Fig. A3.
The total expected systematic bias of OClO SCDs with respect to the GOME-2 analysis ranges between 4 % and 16 % for the different stations (i.e., between 0.6 and 2.4×10¹³ molec. cm−2 for a SCD value of about 15×1013 molec. cm−2).
Table 3Error estimates for the different OClO analysis at each station (in percent). The random uncertainty is estimated from the DOAS fit uncertainty for an OClO SCD of molec. cm−2. The systematic uncertainty is evaluated considering the impact of using different OClO cross sections and different retrieval settings (see Sect. 3.1.1., Figs. A1 and A2, and Table A2). The total uncertainty is calculated as the quadrature sum of random and systematic contributions. Estimation of the expected systematic bias with respect to the GOME-2 analysis setting is given in the right-hand column (see Sect. 3.1.1. and Fig. A3).
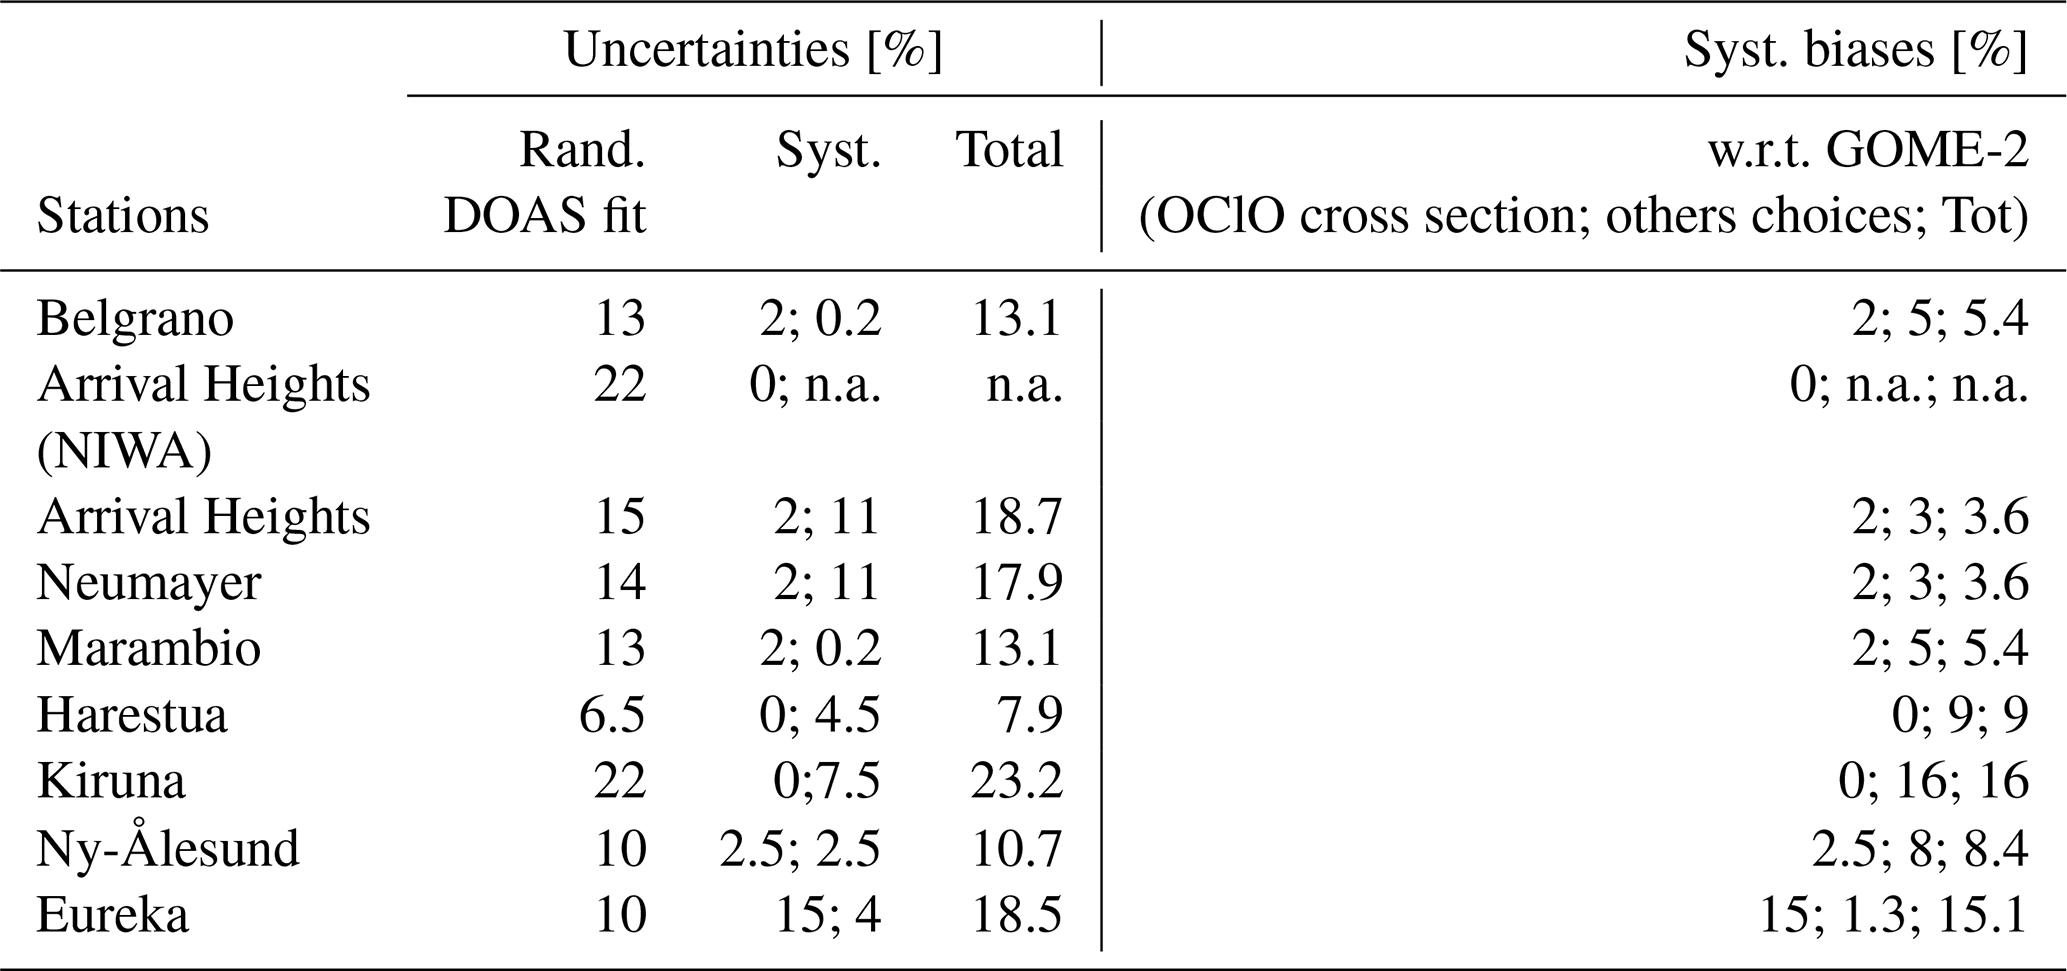
The total uncertainty of the ground-based OClO SCDs, calculated as the sum in quadrature of the random uncertainty at each station and the maximum systematic uncertainty (25 %; see Table A2), thus ranges from 26 % to 33 %, i.e., between 4 and 5×10¹³ molec. cm−2.
3.1.2 SCD offset correction
Although OClO SCD measurements used in this study are obtained using a fixed reference spectrum selected outside of the activated period to make sure that no residual OClO is contained in this reference, OClO SCD offsets are often observed in actual measurements due to instrumental effects, leading to systematic spectral interferences with OClO absorption structures (e.g., thermal instabilities leading to changes in instrumental spectral response), or due to possible unknown atmospheric effects interfering with the OClO retrieval.
Such effects generally lead to a systematic bias in the retrieved OClO SCDs that can vary in time but usually have a time constant that exceeds the duration of a twilight period.
To further mitigate the impact of such biases, an empirical correction was designed and systematically applied to the ground-based datasets.
The principle of this correction relies on the assumption that OClO bias sources are constant during a twilight period and therefore lead to an offset on the retrieved OClO SCDs. For each morning and evening twilight, we draw a Langley plot, i.e., a plot of the SCDs reported as a function of the OClO AMF. One example of such a plot is represented in Fig. 5 for the Harestua station on 13 January 2013. The AMF used for this purpose was empirically estimated from observed OClO SCDs recorded during a series of chlorine activation events of various strengths (see Fig. 6). The AMF is here defined as the ratio of the measured slant column to the vertical column estimated at 70∘ of SZA, assuming that at this solar elevation a simple geometrical AMF can be used. The grey area in Fig. 6 indicates the range of the measured OClO AMFs, while the blue and green curves show photochemical AMFs calculated using the DISORT radiative transfer model coupled PSCBOX and initialized with SLIMCAT 3-D chemical transport model (CTM) simulations, as explained in Hendrick et al. (2007). The red line represents the median value of the measured AMFs, which was used as input for the present analysis.
As can be seen in Fig. 5, a linear relationship is obtained between the empirical AMFs and the measured SCDs over a large range of SZA values. We also note that although the reference spectrum used to analyze these data was recorded well outside the activated period (in late April in this case) and therefore does not contain any sizable OClO amount, the observed SCDs present an offset, i.e., the measured SCDs do not converge to zero for low AMF values. This offset is necessarily an artifact and should be removed to restore physically consistent SCD values.
It must be noted here that this approach is only applicable for observations covering a sufficiently large range of SZAs. The limit on the minimum solar zenith angle has been empirically set to 86∘. For high-latitude observations during polar night conditions, when the SZA constantly exceeds 86∘, an estimate of the offset was obtained by fitting a polynomial function to offsets derived during the illuminated periods.
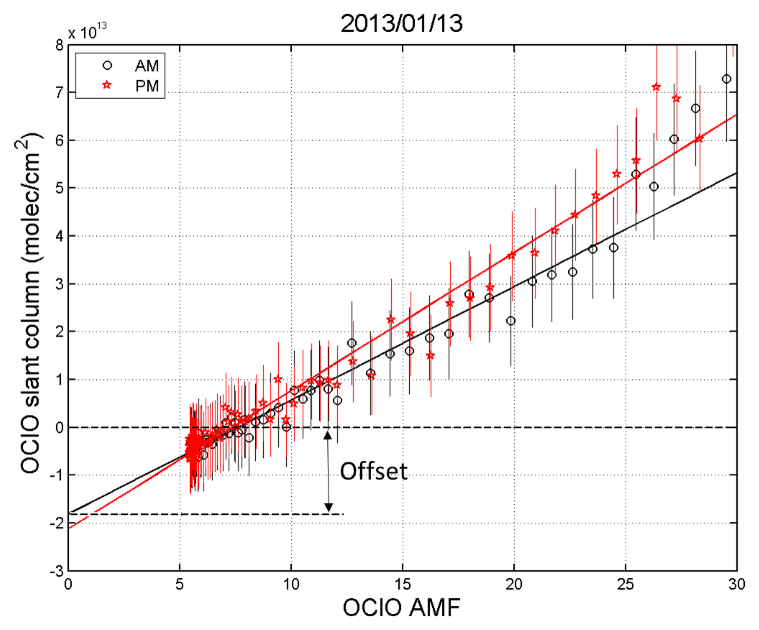
Figure 5Illustration of the Langley plot method used to estimate offset artifacts on OClO SCD measurements. This case was obtained in Harestua on 13 January 2013.
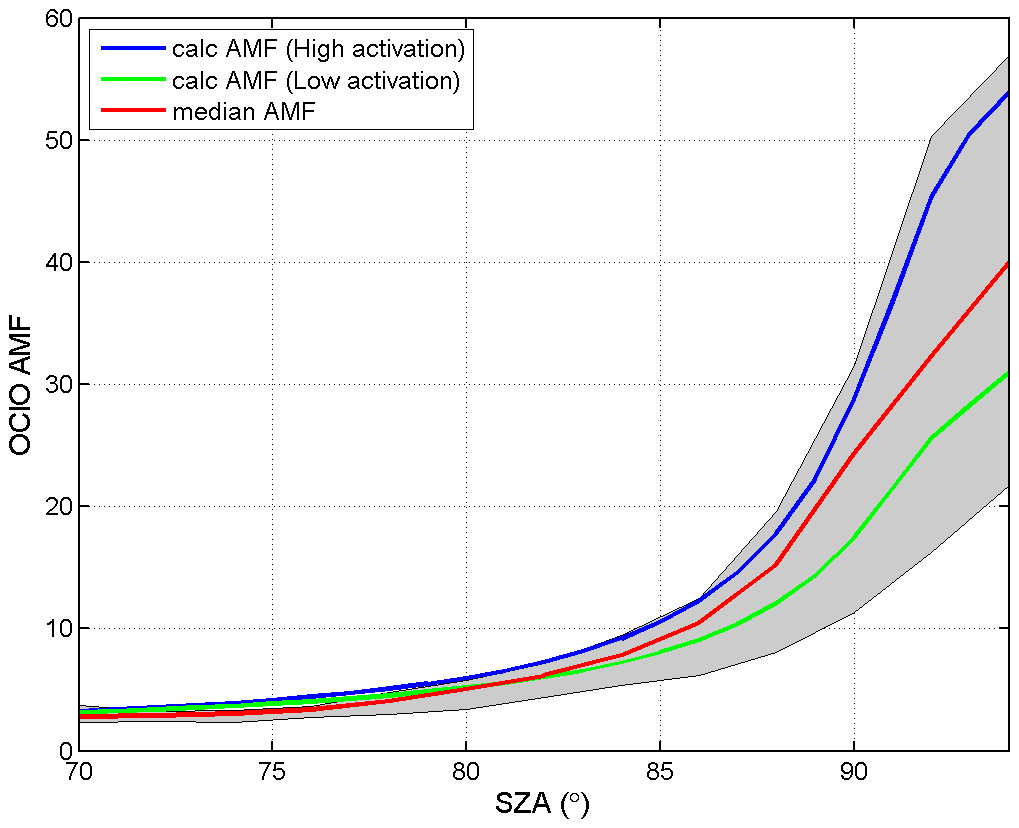
Figure 6Illustration of the AMFs used for the Langley plots. The grey area indicates the range of the measured OClO AMFs, the red curve shows their median value, and the blue and green curves are AMFs calculated using the DISORT radiative transfer model coupled PSCBOX and initialized with SLIMCAT 3-D chemical transport model simulations.
Despite its empirical nature, this offset correction, which was derived independently for morning and evening data on each day, can be considered objective as (i) it is not linked to the satellite data and (ii) it is not based on subjective criteria such as the smoothness of the OClO time series.
This correction was applied to all ground-based datasets used in this study, except for NIWA measurements at Arrival Heights. At this site, the method could not be used due to the unavailability of daily sequences of OClO measurements covering a suitable range of SZAs.
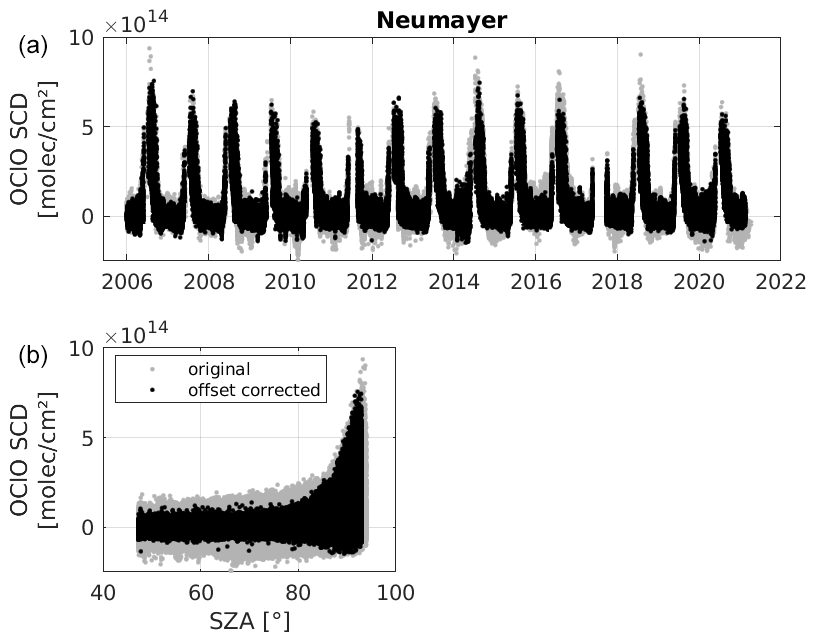
Figure 7Illustration of the offset correction impact on Neumayer data from the (a) time series and (b) SZA dependence.
Figure 7 presents an illustration of the impact of the correction for the Neumayer ground-based dataset time series. The original data are displayed in light grey and the corrected data are shown in black. The same dataset is also represented as a function of the SZA in the lower panel. As can be seen in this case, the main impact of the offset correction is to reduce the apparent noise on the low values of the OClO SCD. During periods of strong activations, changes are generally minor.
3.2 Comparison method
For the comparison of GOME-2 and ZSL-DOAS data, a method similar to Richter et al. (2015) and Oetjen et al. (2011) was adopted. The GOME-2 GDP 4.8 OClO SCD data are extracted within 200 km of the different stations listed in Table 2. The mean value of the valid OClO SCD (oclo_flag value set to 1 or 2, i.e., between 85 and 92∘ SZA, Valks et al., 2019a, b) is then calculated for each day in order to improve the signal to noise ratio. Coincidences are obtained by selecting ground-based data that are within ±1∘ SZA of the mean daily satellite value. Error-weighted averages are performed using provided ground-based and satellite errors.
Comparisons of the daily coincidences are performed at each station for the whole available time series. It should be noted that there is a non-constant number of points at SZA >85∘ throughout the year at some stations. This is even more the case after the reduced swath configuration was adopted for GOME-2A in July 2013. During several periods of the year (depending on the location) no valid OClO SCD can be found, and such periods tend to be longer after 2013.
The approach of comparing slant columns (instead of vertical columns) relies on the assumption that satellite nadir and ground-based zenith-sky light paths are comparable at large SZA (Oetjen et al., 2011). In other words, satellite AMFs (AMFsat_nadir) and ground-based AMFs (AMFgb_zenith) are assumed to be similar. Oetjen et al. (2011) calculated differences of up to 4 % for the two observation geometries between 89 and 91∘ SZA and of 13 % at 80∘ SZA in Ny-Ålesund.
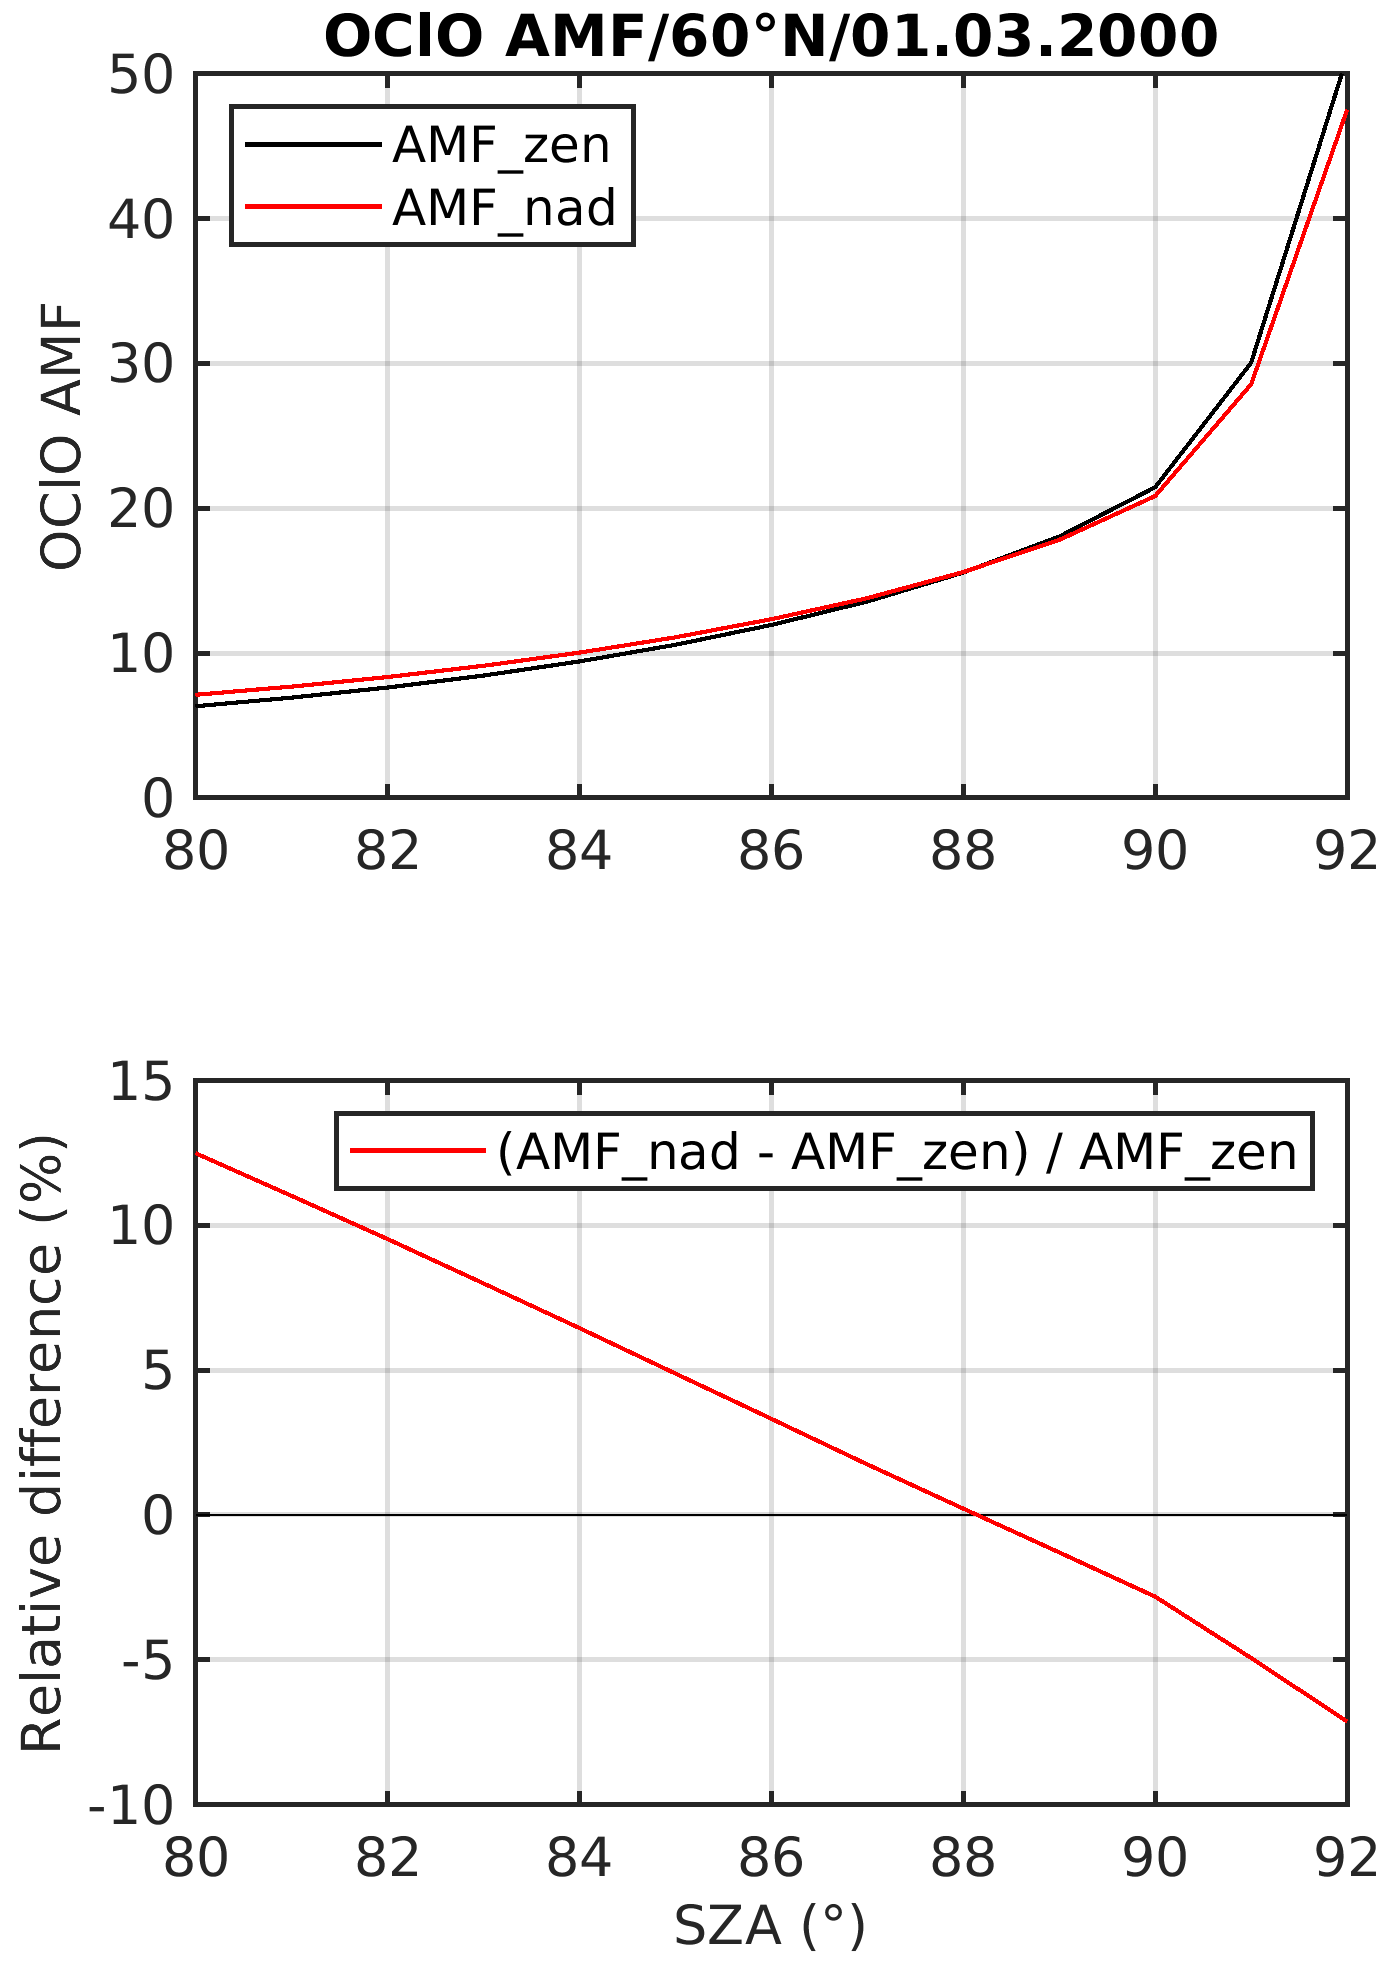
Figure 8OClO AMF calculations for 60∘ N from ground-based zenith and satellite nadir geometries.
Zenith and nadir AMF calculations for a single OClO-activated day were performed here for conditions corresponding to 60∘ N, as shown in Fig. 8. The simulations were performed using an implementation of the DISORT radiative transfer code accounting for the impact of photochemical enhancements along the light path at twilight (Hendrick et al., 2007). They confirm the Oetjen et al. (2011) results, with differences of up to 13 % for SZA between 80 and 88∘ and differences of up to −8 % between 88.5 and 92∘ SZA. On average, the AMF difference is close to zero over the 85 to 92∘ SZA range.
Figures 9 to 14 present the time series of the GOME-2A (2007-2016) and GOME-2B (2013–2016), respectively, together with ground-based OClO SCD measurements performed in each hemisphere. As expected, the data from the four Antarctic stations (Figs. 9 and 10) show a stronger OClO signal in the winter months, with values up to 50–100×1013 molec. cm−2, when the stations are under the influence of the polar vortex.
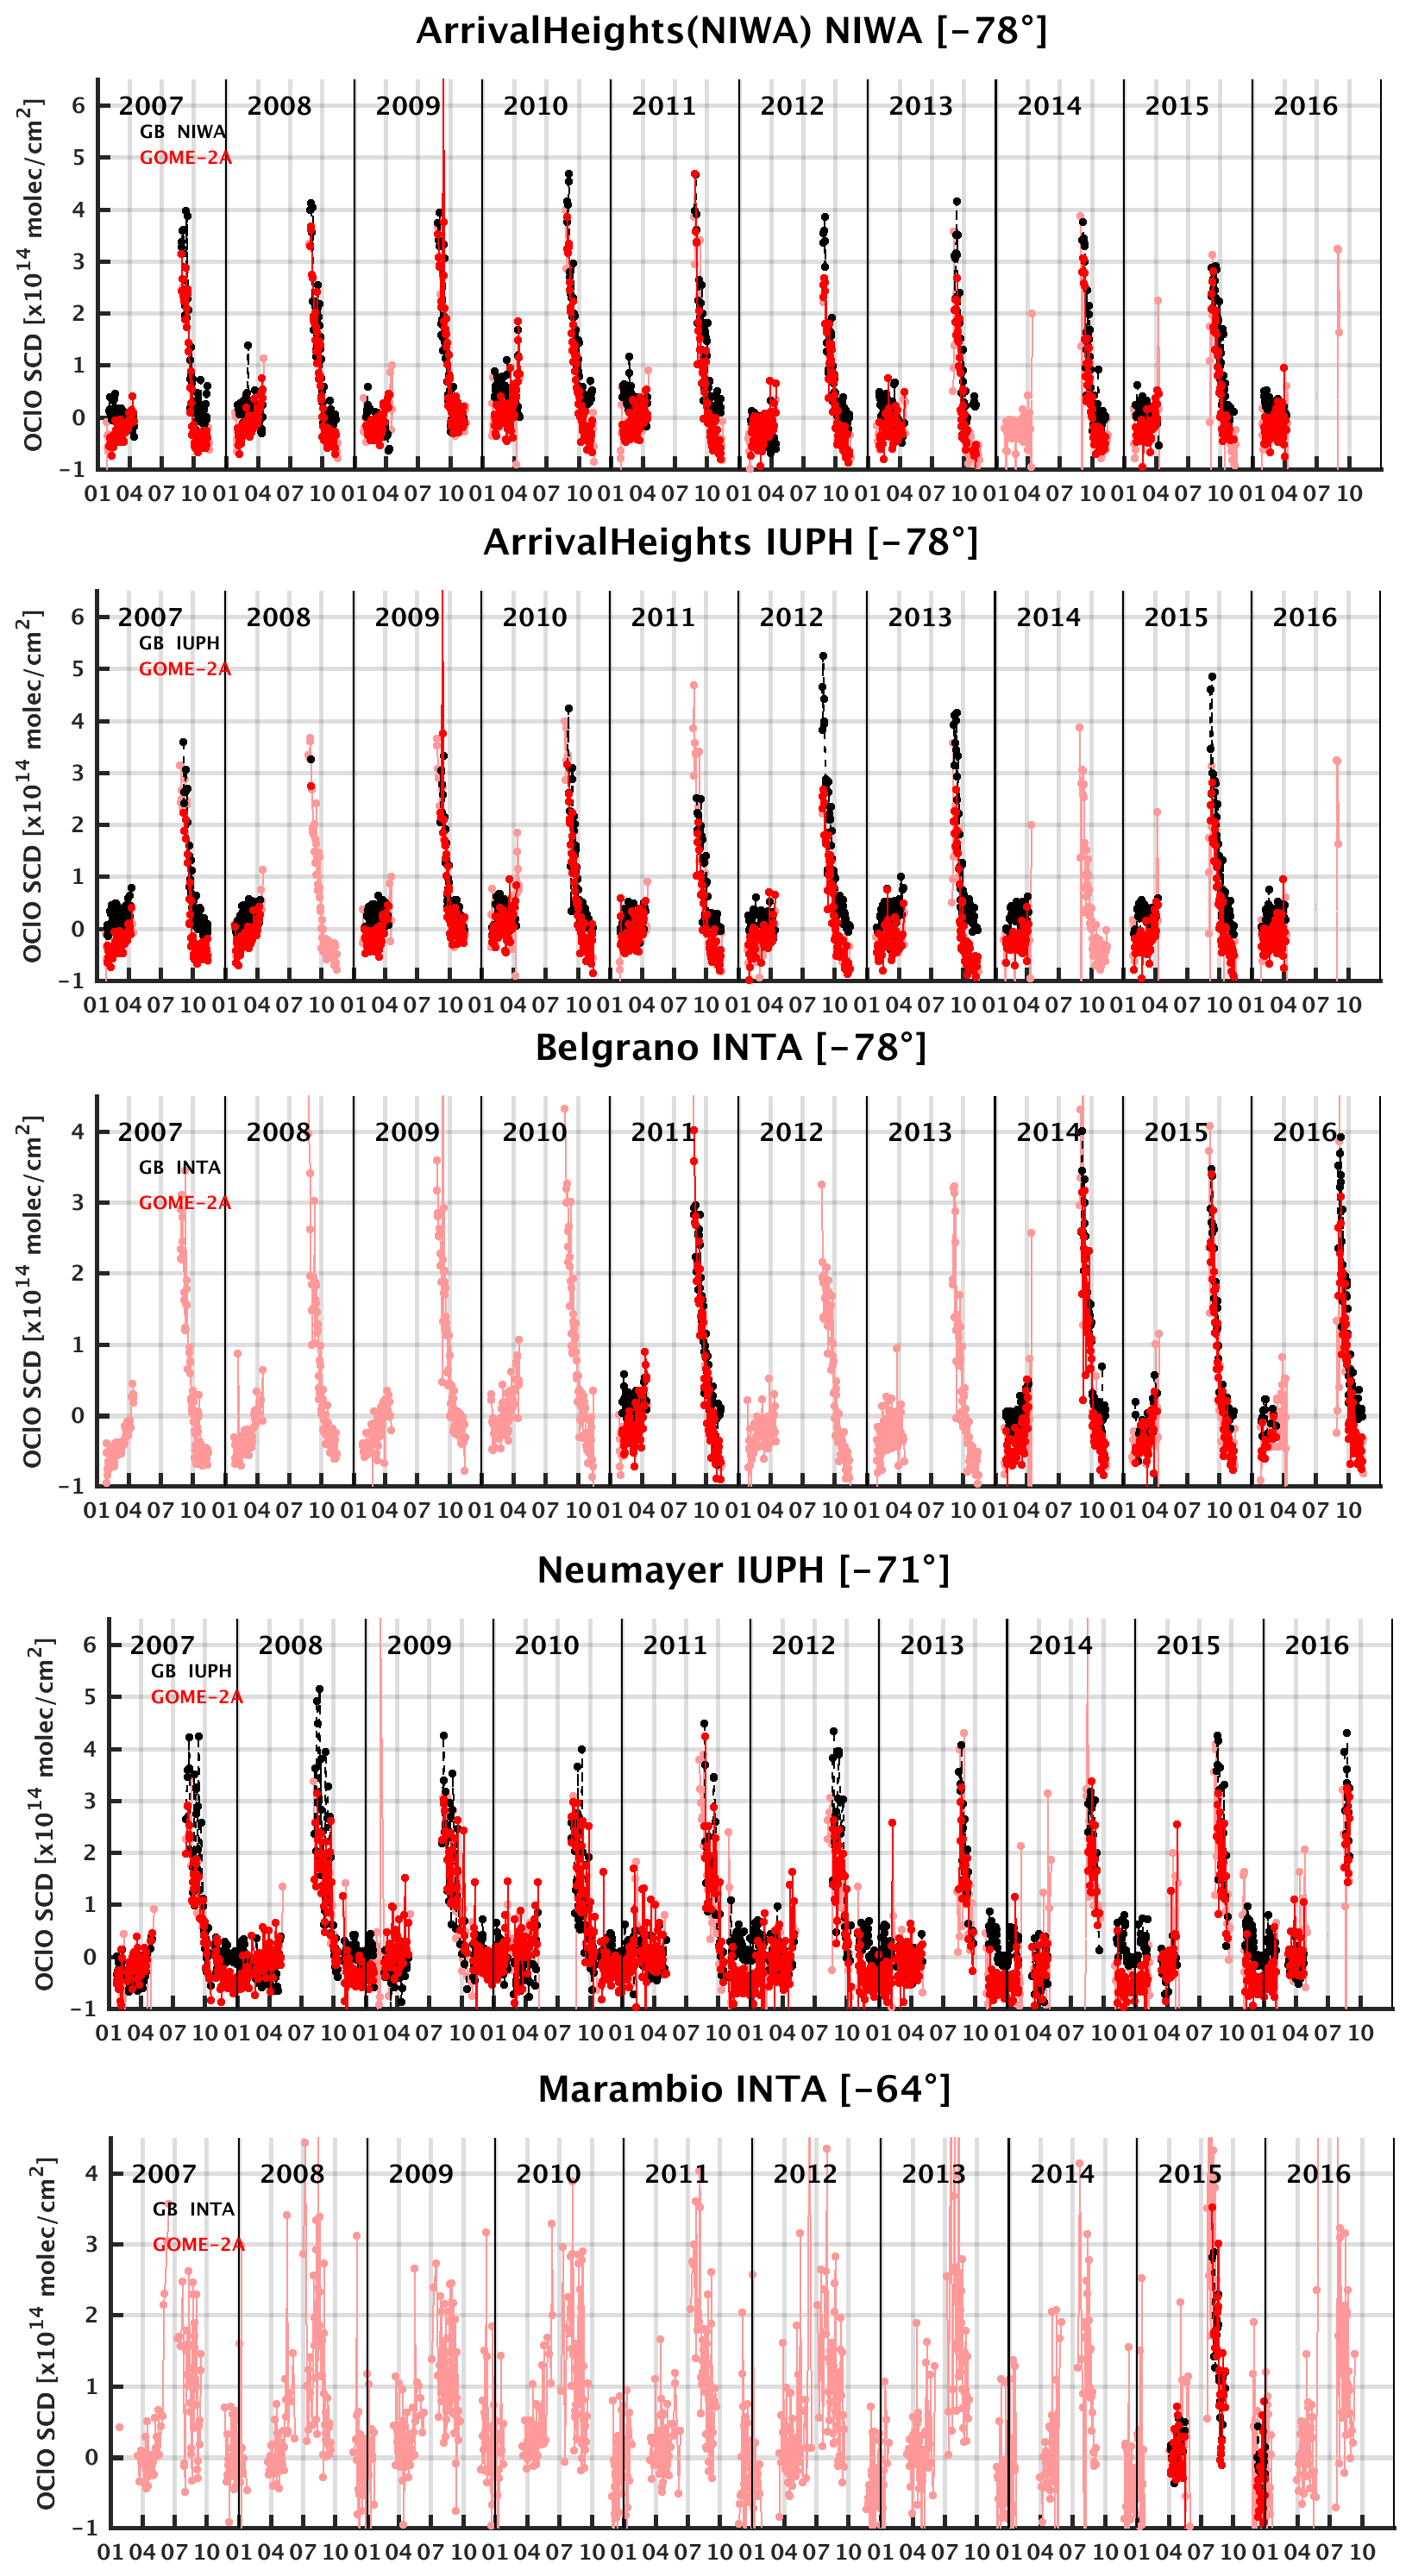
Figure 9Time series of GOME-2A (red) OClO daily mean slant column data co-located with ground-based (black) measurements performed at each Antarctic station.The lighter transparent red color is used for GOME-2A when there are no ground-based measurements. Please note that in some cases some GOME-2A points lie below the x axis limit of and down to molec. cm−2, especially from 2011 onward (e.g., in the case of Neumayer, this represents 27 data points over a total of 1536).

Figure 10Time series of GOME-2B (green) OClO daily mean slant column data co-located with ground-based (black) measurements performed at each Antarctic station. The lighter transparent green color is used for GOME-2B when there are no ground-based measurements.
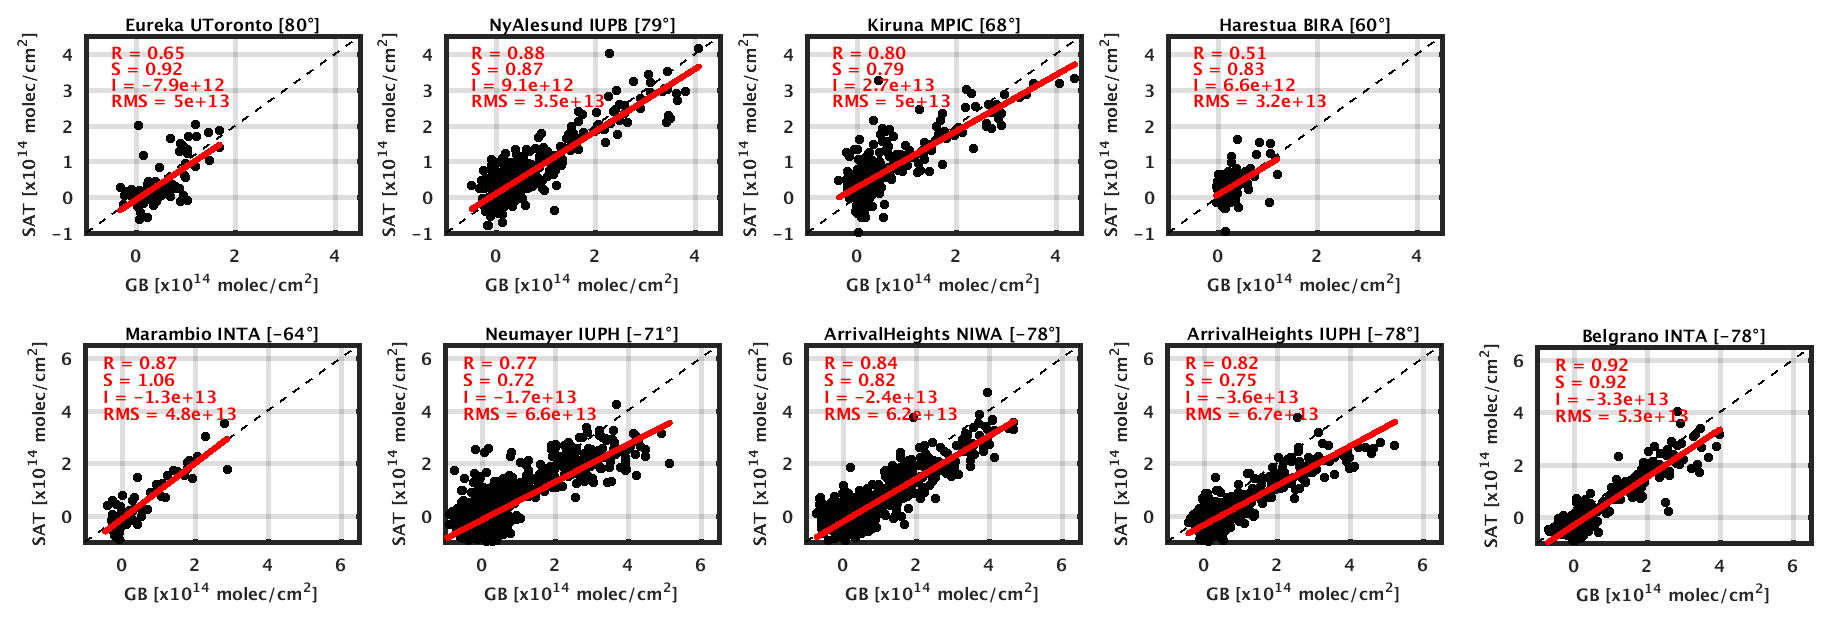
Figure 11Scatter plot of GOME-2A OClO slant column data co-located with ground-based measurements at each station.
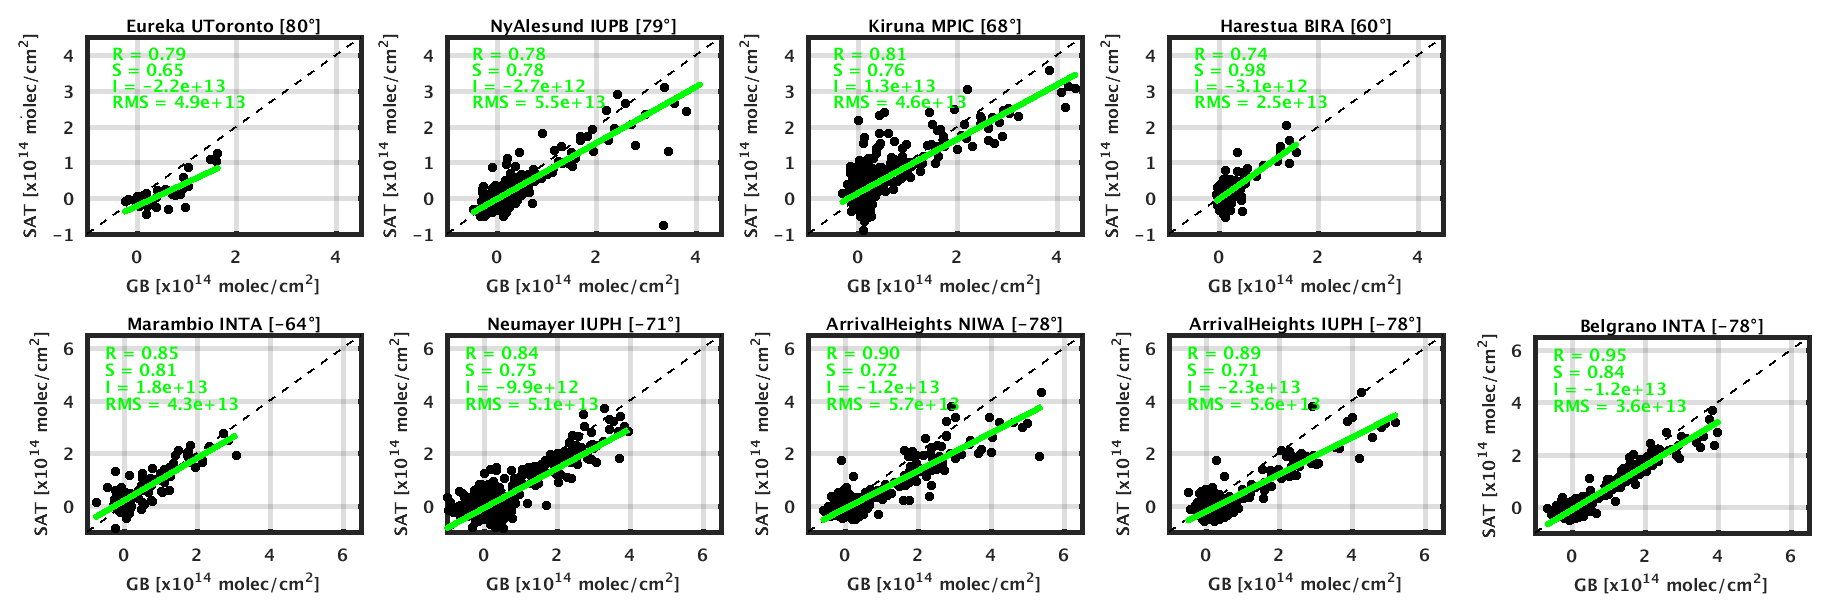
Figure 12Scatter plot of GOME-2B OClO slant column data co-located with ground-based measurements at each station.
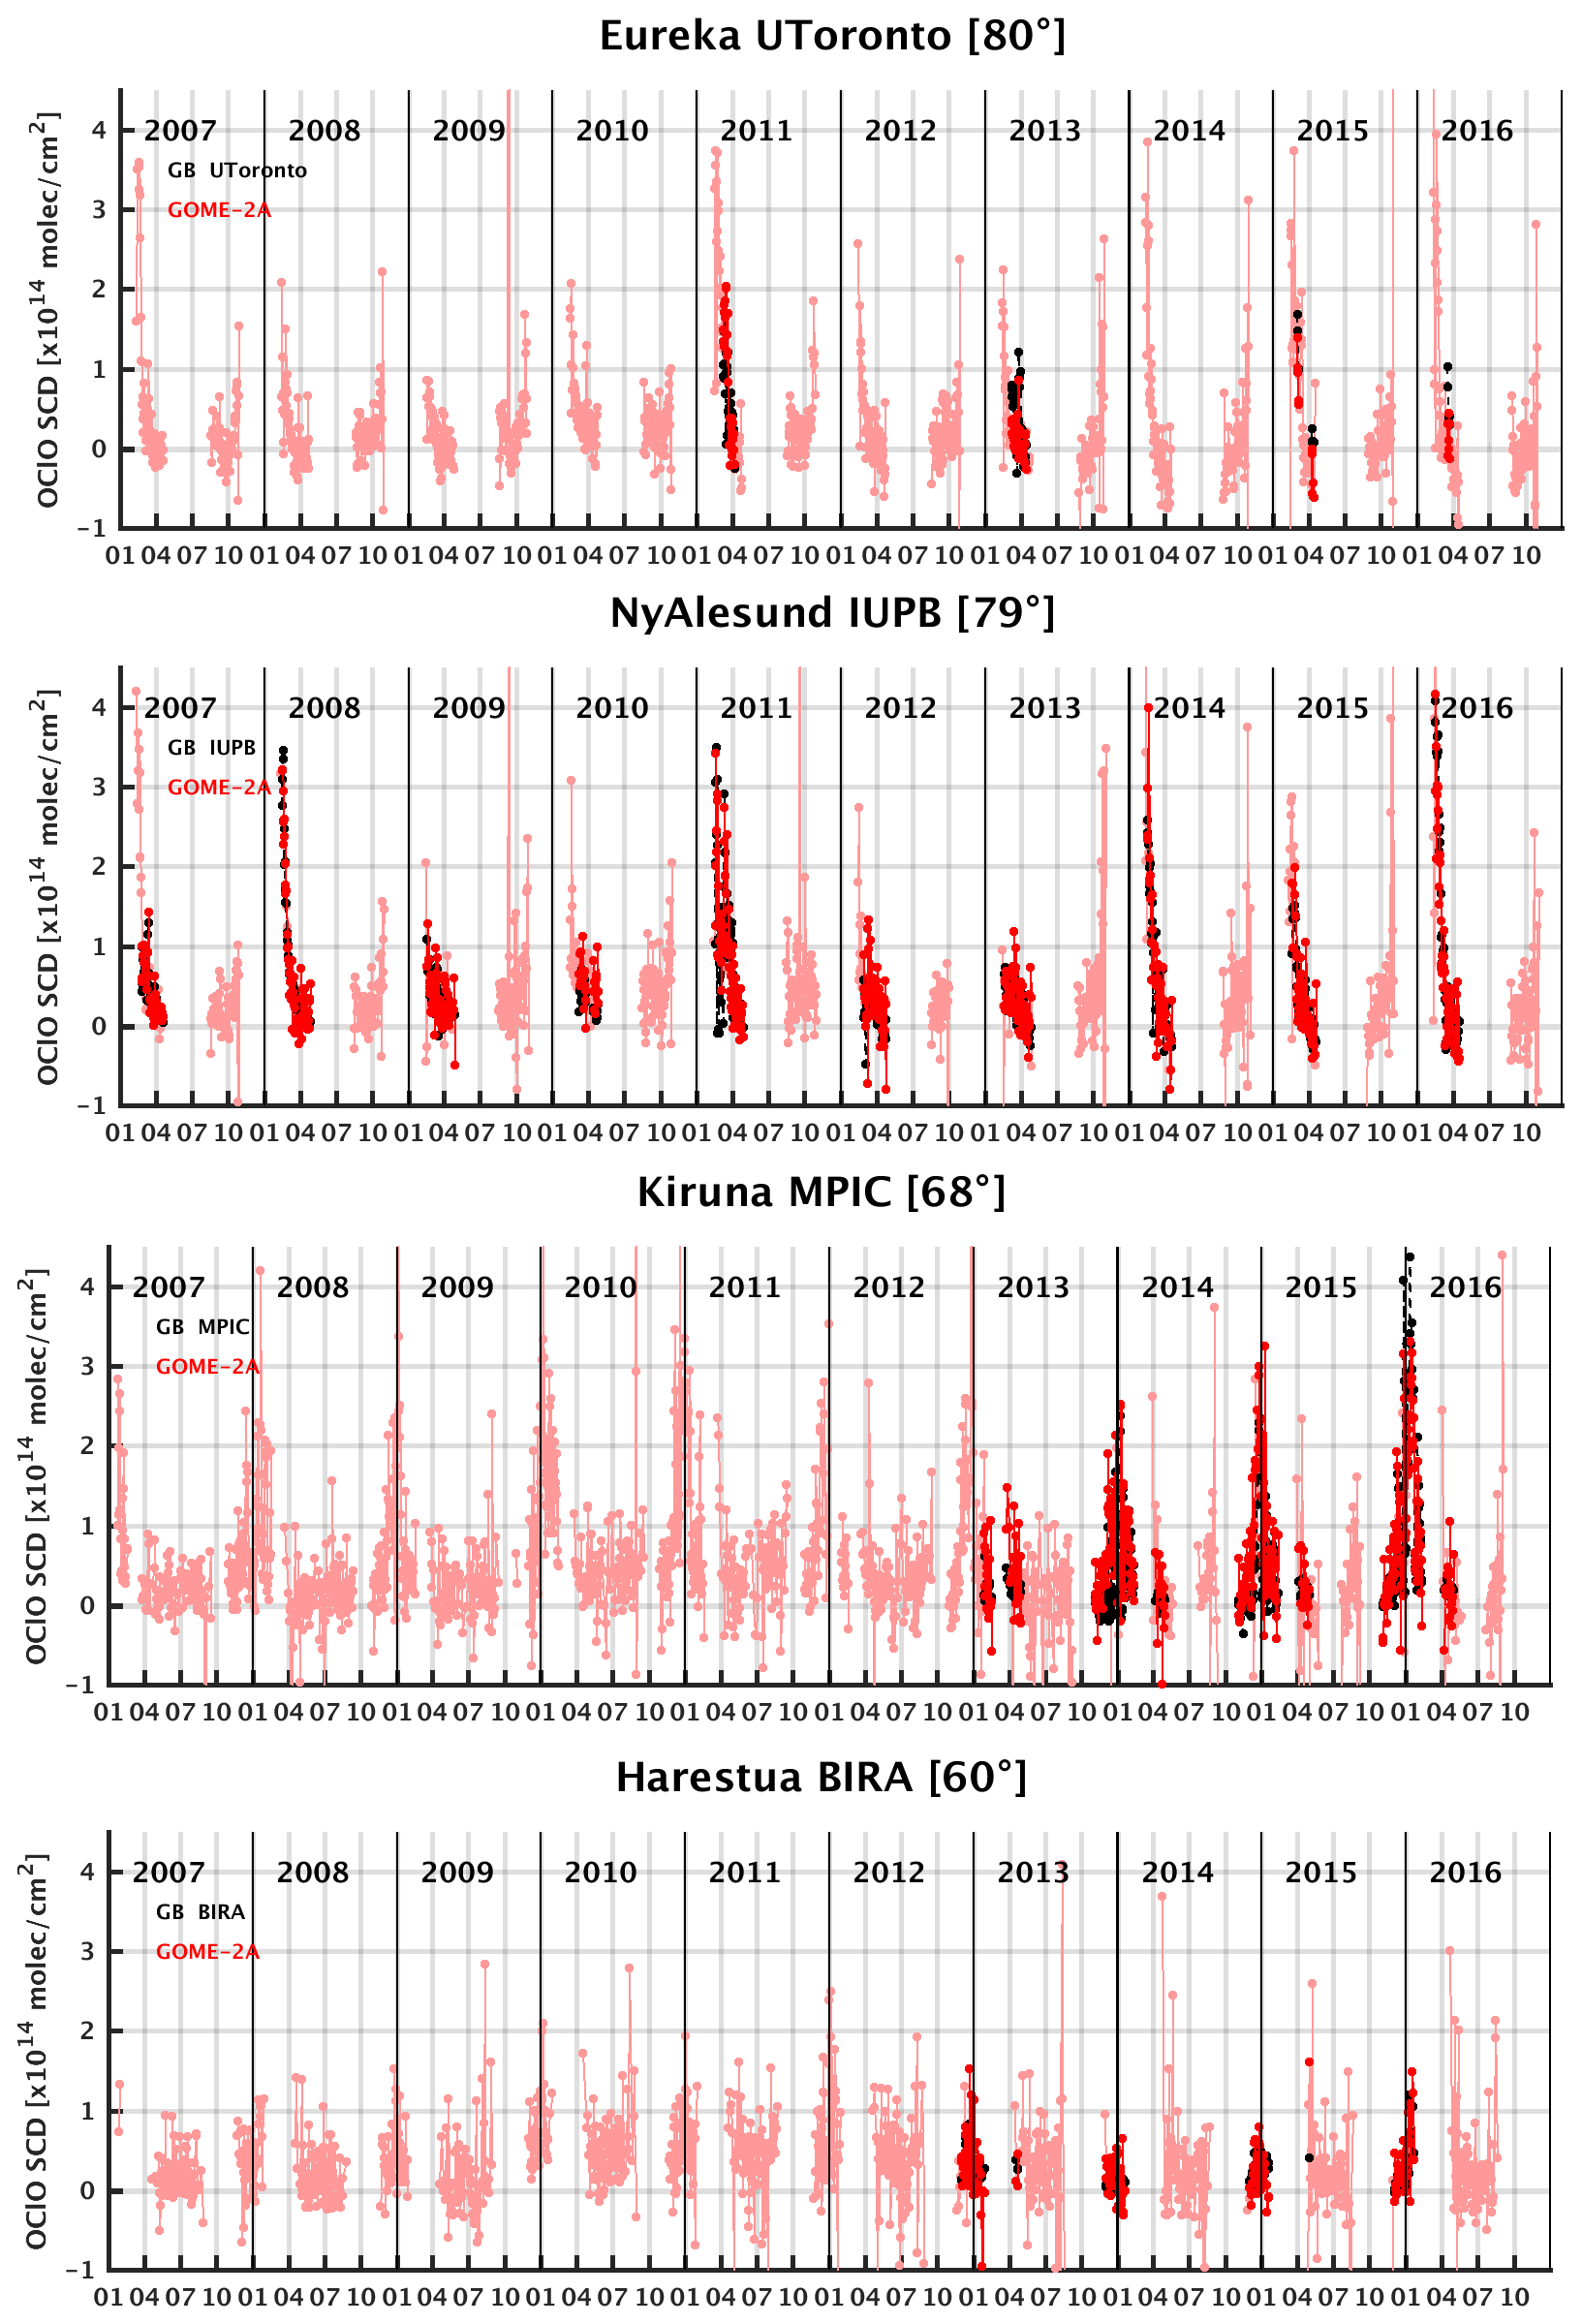
Figure 13Time series of GOME-2A (red) OClO daily mean slant column data co-located with ground-based (black) measurements performed at each Arctic station. The lighter transparent red color is used for GOME-2A when there are no ground-based measurements.
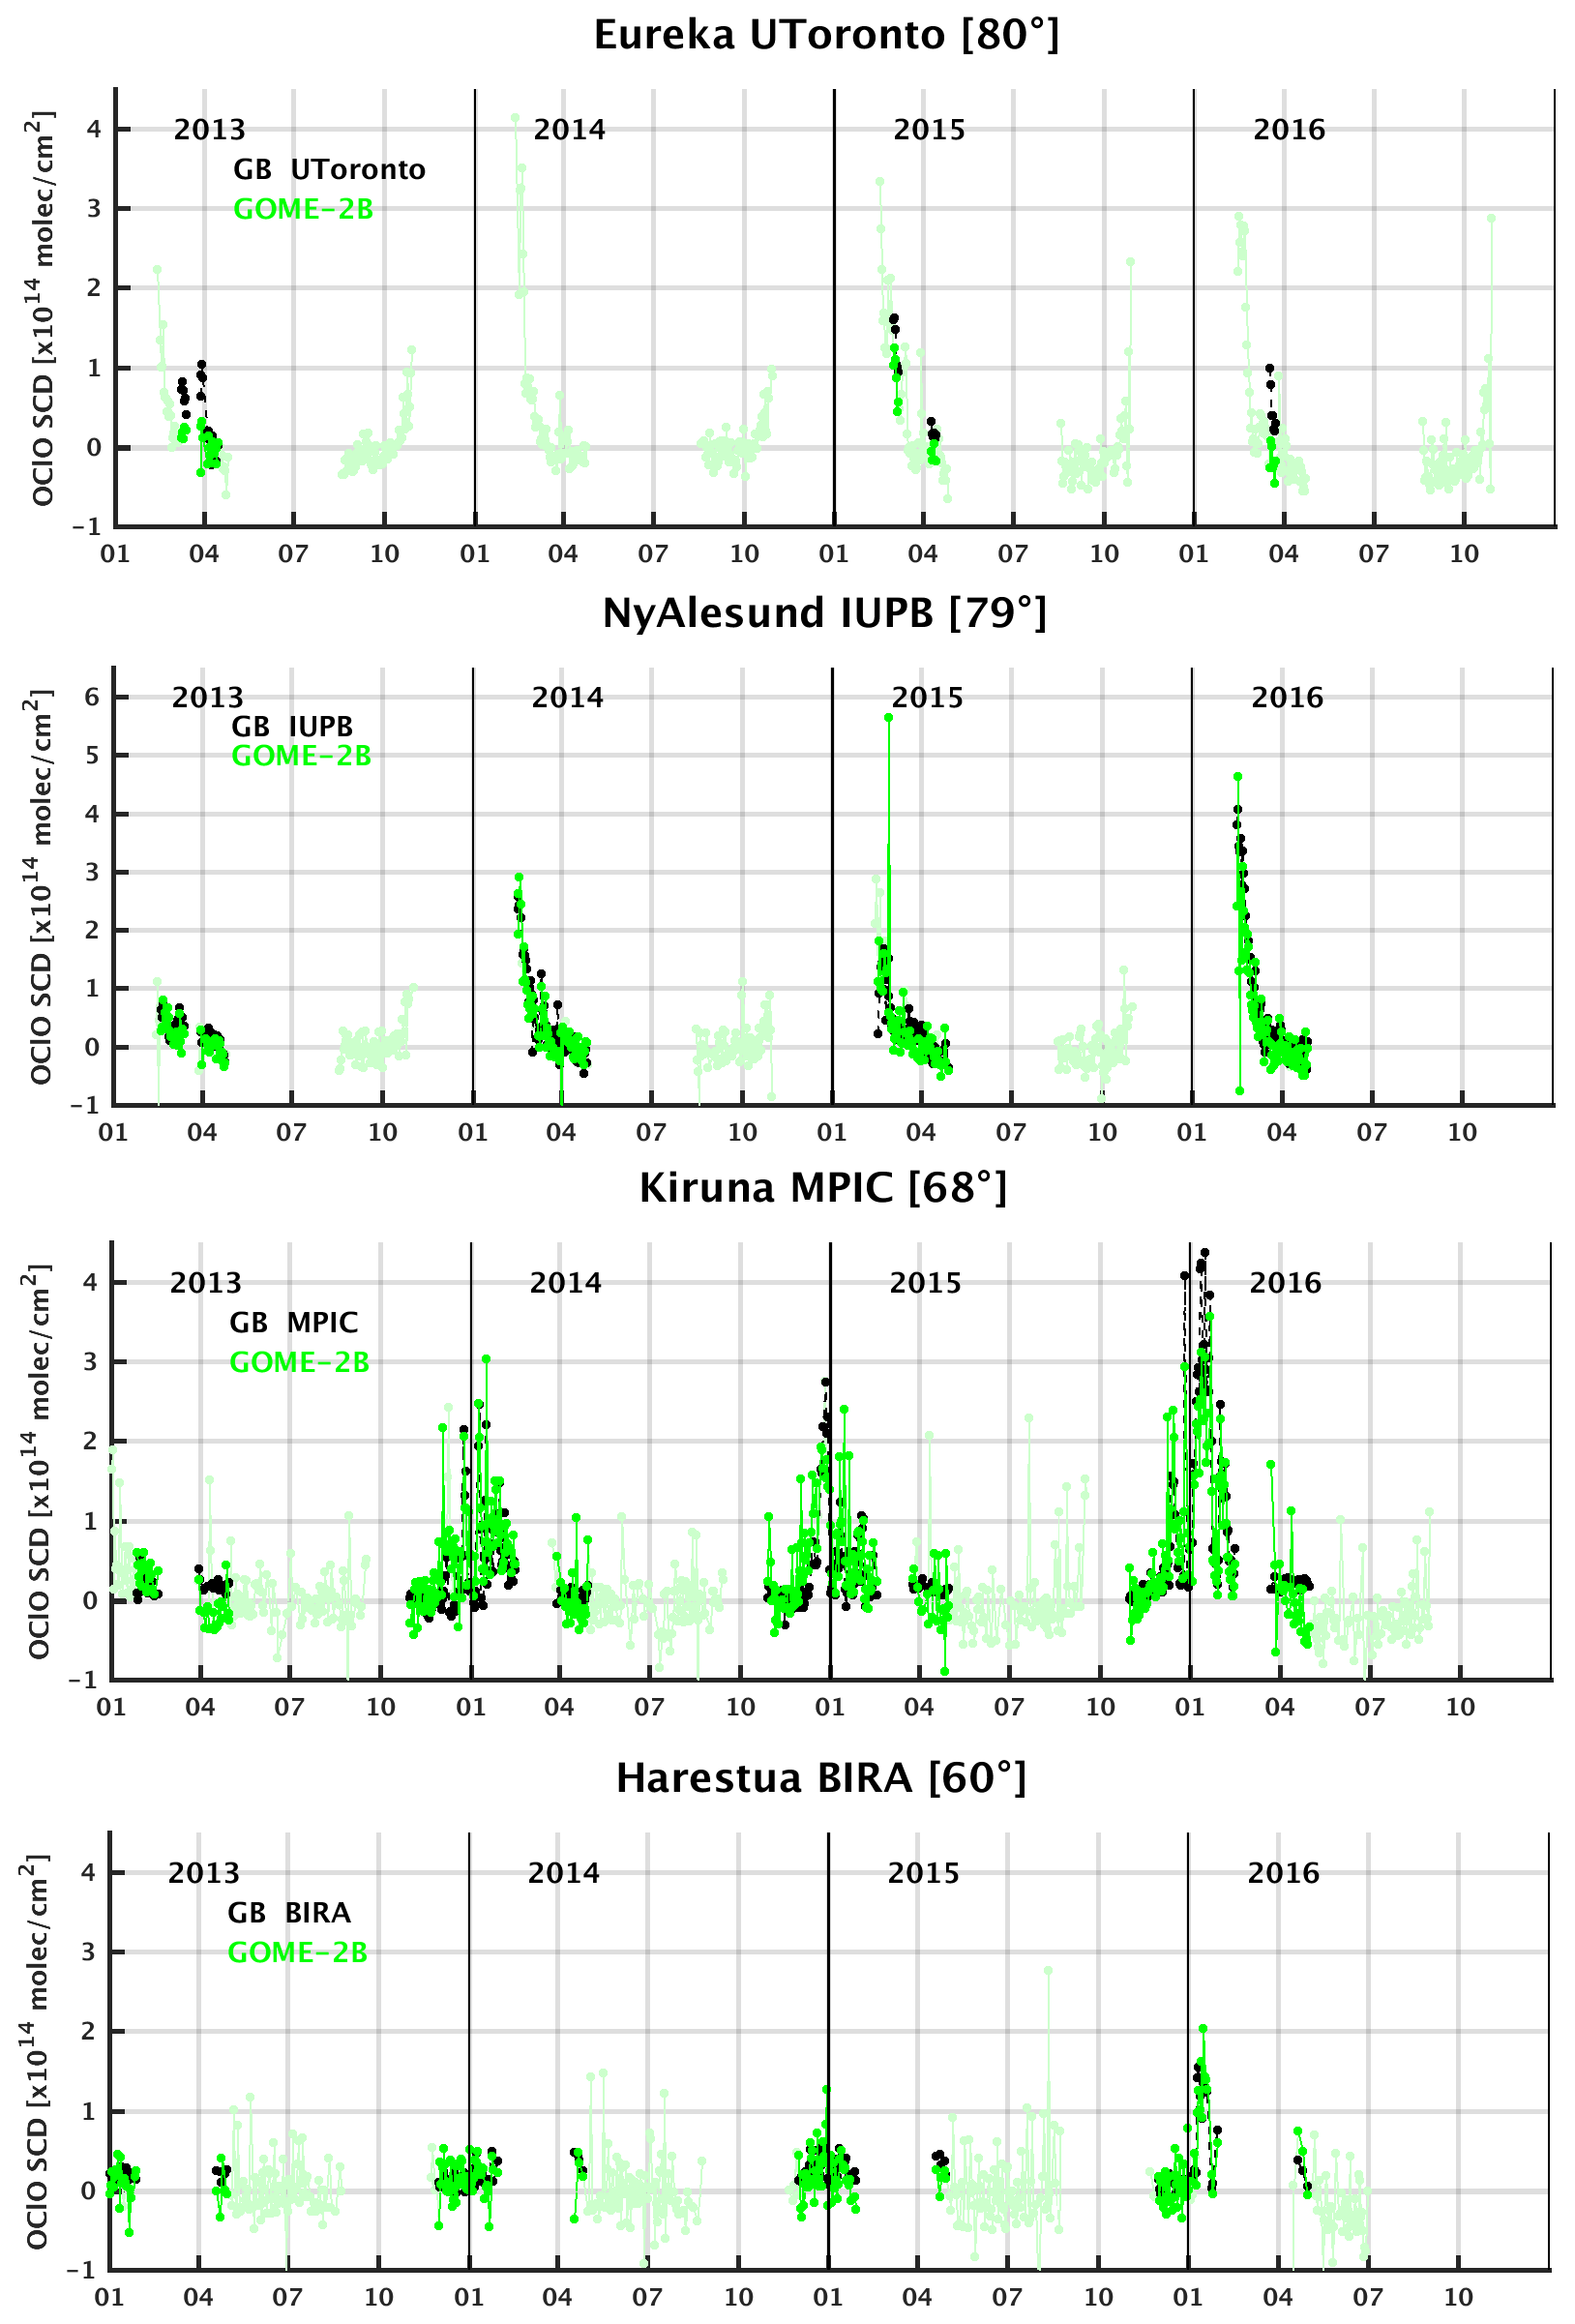
Figure 14Time series of GOME-2B (green) OClO daily mean slant column data co-located with ground-based (black) measurements performed at each Arctic station. The lighter transparent green color is used for GOME-2B when there are no ground-based measurements.
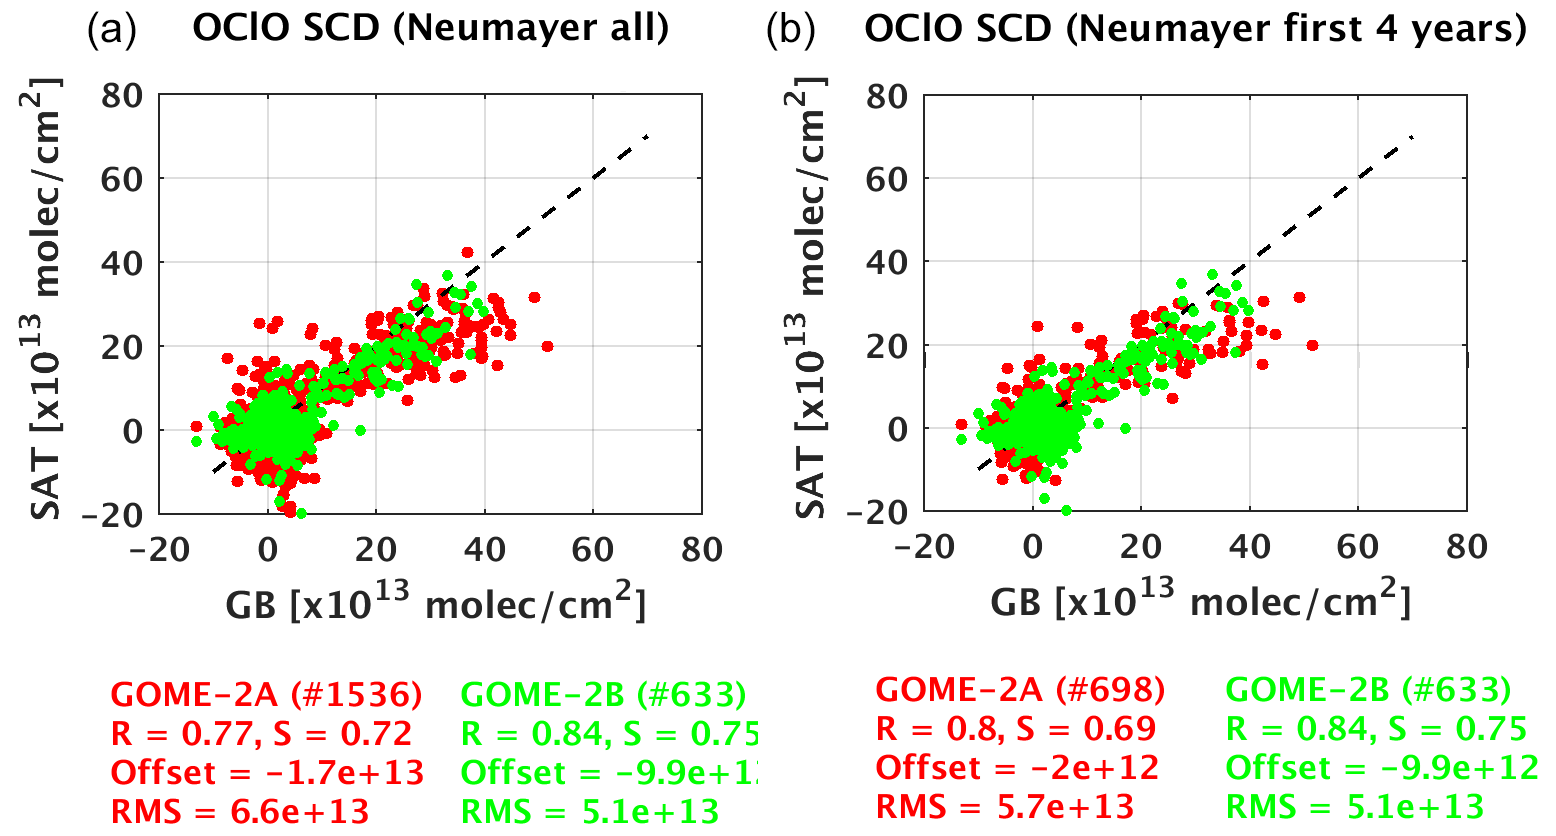
Figure 15Scatter plot between daily GOME-2A (red) and GOME-2B (green) GDP 4.8 satellite data and ground-based data at Neumayer station for all data (a) and the first 4 years of operation (b) of each satellite.
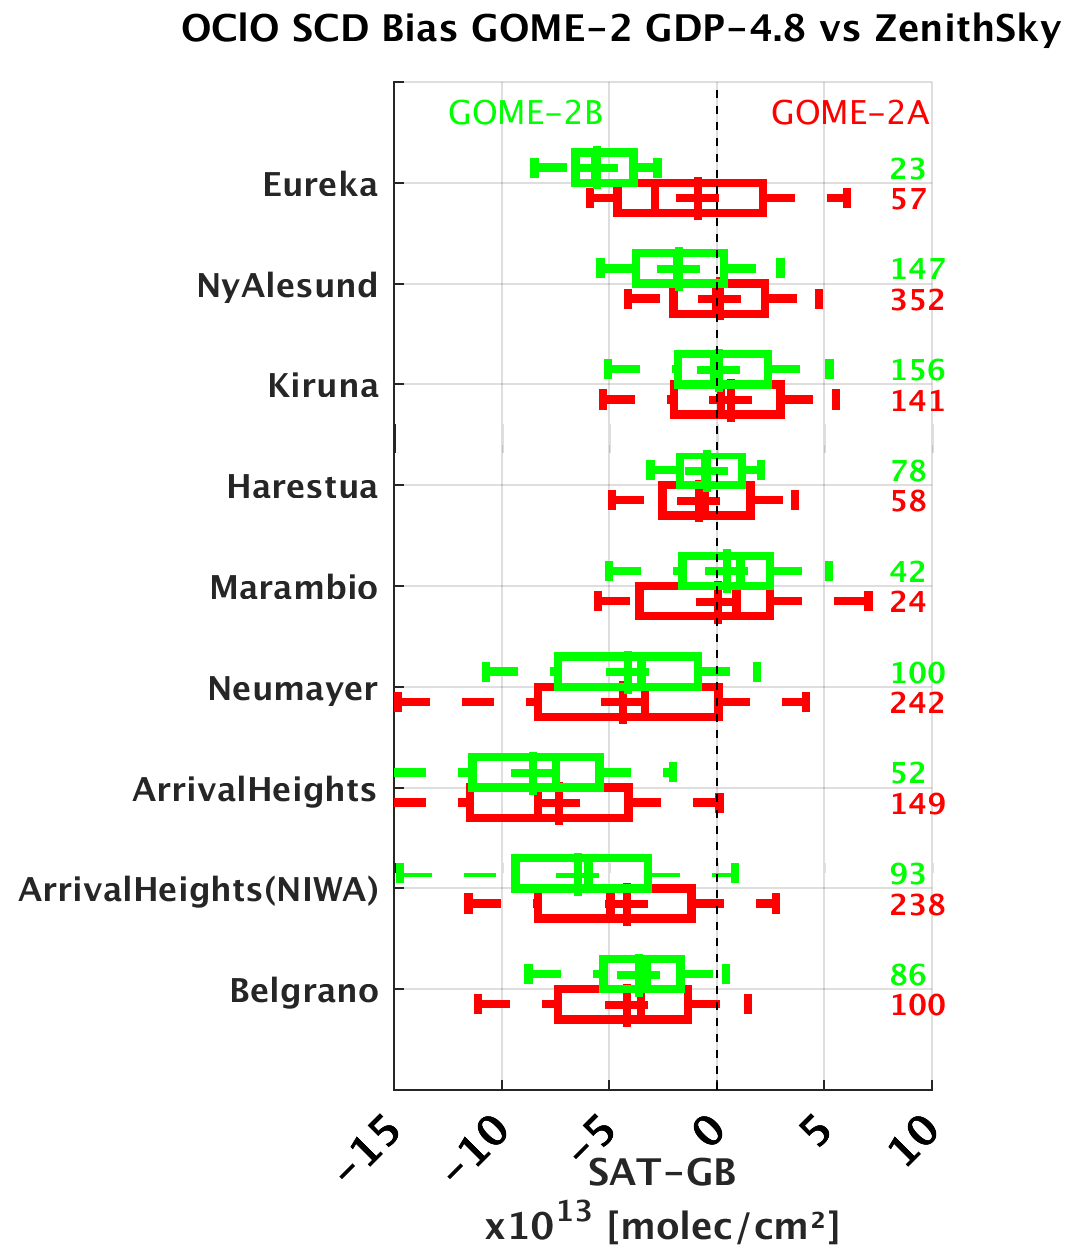
Figure 16Box and whisker plot of the difference between all the GOME-2 and ZSL-DOAS OClO SCD pairs during active period months. Stations are ordered by decreasing latitude (the most southern being at the bottom). The box and whisker plots are defined as follows: crosses and lines for the mean and median values, respectively, boxes for the 25th and 75th percentiles, and dashed lines for the 9th and 91st percentiles. Numbers on the right correspond to the number of days considered in the analysis.
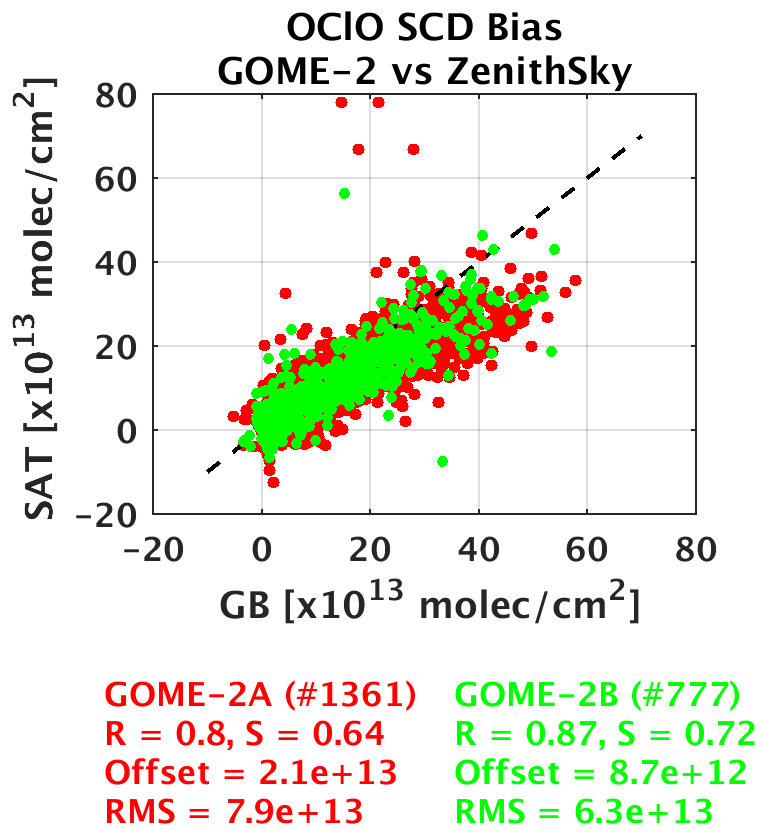
Figure 17Scatter plot between daily GOME-2A (red) and GOME-2B (green) GDP 4.8 satellite data and ground-based data for all the stations included in the study during the active months.

Figure 18Scatter plot between daily GOME-2A (a) and GOME-2B (b) GDP 4.8 satellite data and ground-based data at the different stations included in the study for the activated months (July, August, and September (JAS) for stations in the SH and January, February, and March (JFM) for stations in the NH). The stations are color coded, and the total regression statistics are given in each panel.
The presence of larger OClO columns in the austral winter and spring compared to the Northern Hemisphere was highlighted in past satellite studies (Wagner et al., 2001, 2002; Wittrock et al., 1999). Above the Antarctic, high OClO SCDs are usually observed after mid-May, with a large increase within a few days, reaching a maximum by mid-September and then quickly decreasing until the chlorine activation stops by late October (Wagner et al., 2001; Richter et al., 2005). Due to a less stable polar vortex, the year-to-year variability of OClO is larger in the Northern Hemisphere, and thus only few years are characterized by large activation events (Richter et al., 2005). The yearly variability in OClO SCDs is anti-correlated with the temperature variations and modulated by PSC formation (Weber et al., 2003).
4.1 Antarctic
Figure 9 presents the daily comparisons between GOME-2A and ground-based data at the four Antarctic stations. At the Neumayer station, the ground-based OClO SCDs are available for the complete period of GOME-2A observations (2007–2016), showing enhanced OClO signals between August and October when the polar vortex is above the station. At Arrival Heights, comparisons during the activated periods are missing for 2 years (2008 and 2014) in the IUPH dataset but are covered by the NIWA measurements, while at Belgrano 4 years of data outside of the polar night period (mid-April to end of August) are available for the GOME-2 comparisons, and at Marambio only 1 year is available (2015). When ground-based data are not available, the satellite daily mean overpasses are displayed in light red. Figure 10 similarly presents the time series of the GOME-2B comparisons for 2013–2016. It can be noted that in the case of GOME-2A some daily mean points are negative and smaller than the lower x axis limit in Fig. 9, especially the case from 2011 onward where data are more negative, as also seen in Fig. 2 and discussed at the end of Sect. 2.
Each year, an enhanced OClO signal (from 20 and up to 40 and 60×1013 molec. cm−2) is observed in August and September, followed by a decrease. The largest OClO columns are measured at Arrival Heights in 2012, 2013, and 2015; at Neumayer in 2013, 2014, and 2015; and at Belgrano in 2011, 2014, and 2015. There is some variability in the strength of the signal from year to year, but the daily variations are sampled in a coherent way from the ground and from space, with a general tendency for smaller (sometimes negative, especially for GOME-2A) OClO SCDs retrieved by the satellites during November to April outside of the chlorine activation period.
A gap in the GOME-2A data is observed in October at the Neumayer station since 2013 due to the reduced swath of the satellite instrument. There are no satellite measurements within 200 km for both sensors between May and end of July, which results in missing the start of the chlorine activation. Some more pronounced negative slant columns appear in the GOME-2A dataset after mid-2011, probably related to the degradation of the instrument. A quantitative comparison for different GOME-2A periods is also shown in Fig. 15 and discussed later on.
At Marambio an enhanced OClO signal is observed in June, August, and September, with a data gap in July. A day-to-day variability of several 10×1013 molec. cm−2 is visible in GOME-2B data (Fig. 10) during the activated period. This behavior is related to the intermittent probing of air masses that are on the edge of the Antarctic polar vortex. The ground-based data seem more sensitive to these rapid changes, resulting in higher peaks than observed with GOME-2A and GOME-2B. For this station, the averaging of the satellite data within 200 km could mix air from inside and outside the vortex. Tests with a smaller co-location radius were performed for this station but with similar results and less co-located points.
The statistical analysis (presented in Figs. 11 and 12) leads to correlation coefficients from 0.77 (Neumayer) to 0.92 (Belgrano) for GOME-2A and from 0.84 to 0.95 for GOME-2B daily comparisons, with linear regression slopes in the range of 0.72–1.06 and 0.71–0.84 for GOME-2A and GOME-2B, respectively.
4.2 Arctic
Comparisons at the four Arctic stations are shown in Figs. 13 and 14. It should be noted that Eureka and Ny-Ålesund are in the polar night until about February or March, and thus ground-based measurements can only be made during April and May. After that period, SZAs are too low (smaller than 88∘) to perform ground-based measurements of OClO.
At all stations GOME-2A, GOME-2B, and the zenith-sky DOAS instruments similarly capture the seasonal cycle of the OClO SCDs and its day-to-day variations. Differences from year to year and station to station exist, but enhanced OClO slant columns are typically found at the four sites between October and March, with large values in 2007, 2008, 2011, 2014, 2015, and 2016 and of up to 40×1013 molec. cm−2, e.g., at Ny-Ålesund and Kiruna during the 2015–2016 winter.
For Ny-Ålesund and Kiruna, years 2014, 2015, and 2016 show an enhanced OClO signal (with peaks larger than 20–30×1013 molec. cm−2), while 2013 does not seem to show any chlorine activation. Unlike Ny-Ålesund and Kiruna, the chlorine activation in 2014 and 2015 cannot be seen at Harestua, probably due to the lack of polar vortex excursions at latitudes as low as 60∘. In 2016, on the other hand, a clear enhancement is visible from the ground and from GOME-2A and GOME-2B in January (with a peak of 13–15×1013 molec. cm−2). Due to the low SZA values (systematically smaller than 85∘ SZA) around the sites between February and May, no valid OClO SCDs could be retrieved by GOME-2, while some OClO activation peaks are detected during this period by the ground-based instruments measuring at twilight.
The large OClO peak at Ny-Ålesund and Kiruna in early 2008 can be understood by taking into account the very cold stratospheric temperatures in the winter of 2007/2008. According to Kuttippurath et al. (2009), the temperature started to decrease in November 2007 and remained low until a major stratospheric warming in late February 2008. At this time, temperatures were below the PSC formation threshold inside the polar vortex. According to Tétard et al. (2009) in January 2008, the polar vortex was not centered on the geographical north pole and was gradually moving towards Europe. This would bring the vortex over Ny-Ålesund and Kiruna and allow for the measurement of high OClO SCDs over these stations.
GOME-2A is more noisy than GOME-2B, especially outside the chlorine activation period (e.g., negative points in January to April and after September in 2013 and following years), but both sensors nicely follow the enhanced OClO signals in winter periods. As for GOME-2A, the gap in the comparisons around February, March, and part of April is related to the GOME-2A and GOME-2B SZA being smaller than 85∘ in that period, leading to the exclusion of these data (see Sect. 2).
Differences between GOME-2A and GOME-2B are related to the smaller GOME-2A swath after July 2013 and the 30 min difference between both instruments. Moreover, the GOME-2A degradation and the possible different impact of the mean residual, the scan angle empirical correction functions, and the additional offset correction, as discussed in Sect. 2, could also play a role in enhancing the noise of GOME-2A OClO columns in comparison to GOME-2B.
An illustration of this time degradation effect is given in Fig. 15. In Fig. 15a, all of the Neumayer data are presented, while in Fig. 15b only the first 4 years are displayed for each instrument (2007–2011 and 2013–2016, respectively). The rms values given below the figures clearly demonstrate that both GOME-2A and GOME-2B had a similar level of noise during their first 4 years of operation.
The statistical analysis (presented in Figs. 11 and 12) leads to correlation coefficients from 0.51 (Harestua) to 0.88 (Ny-Ålesund) for GOME-2A and 0.74 to 0.81 for GOME-2B daily comparisons, with linear regression slopes around 0.79–0.92 and 0.65–0.98 for GOME-2A and GOME-2B, respectively.
4.3 Comparison summary
We now consider all the stations and focus only on the activated periods (July–August–September in the Southern Hemisphere and January–February–March in the Northern Hemisphere). Figure 16 summarizes the biases (offsets) between GOME-2 and ground-based ZSL-DOAS time series using box and whisker plots of their differences at each site. Stations are ordered by latitude from the Arctic (top) to the Antarctic (bottom). It is worth mentioning that although Eureka and Ny-Ålesund are close to each other in latitude (80 and 79∘ N), they are far away in longitude (Canada and northern Europe), which implies that they have very different positions with respect to the polar vortex. This is also true for Arrival Heights and Belgrano, which are both at a latitude of 78∘ S but located at opposite sides of the Antarctic continent (see map in Fig. 3). Figure 16 indicates a general negative bias (up to around molec. cm−2) for both GOME-2 instruments at most stations except for Kiruna and Marambio. The differences between GOME-2A and GOME-2B are of a few 1013 molec. cm−2. Differences of the same order of magnitude are found, e.g., between the two Arrival Heights instruments. The median bias statistics of the individual comparisons are reported in Table 4 for each station and for both hemispheres, together with regression analysis statistics. In relative values, the station biases range from −53 % to 8 % for GOME-2A and −78 % to 13 % for GOME-2B for Eureka and Marambio.
Table 4Summary of the regression parameters (correlation coefficient R, slope S, intercept I, and rms) and bias between GOME-2A and B and zenith-sky OClO SCDs daily mean comparisons for the active months (JFM for the Northern Hemisphere and JAS for the Southern Hemisphere). Intercept, rms, and absolute biases (median (SAT-GB)) are given in values of ×1013 molec. cm−2.
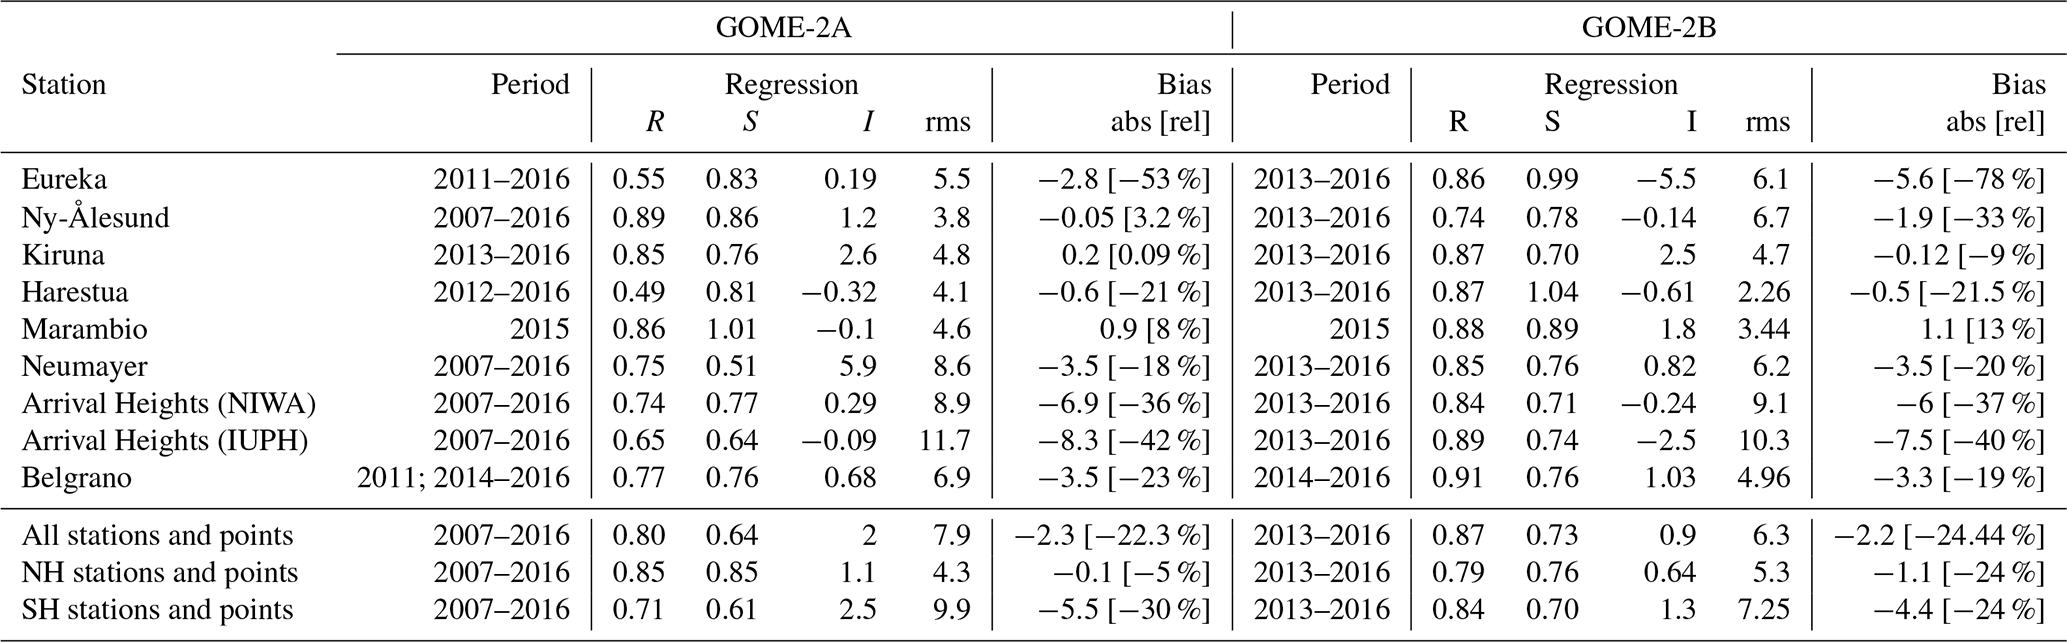
Figure 17 presents the results as a scatter plot, with GOME-2A values in red and GOME-2B values in green. It can be seen that GOME-2A results are slightly noisier than GOME-2B, with several outliers, a smaller correlation coefficient (0.8 versus 0.87), and larger rms values. As already mentioned, this is likely related to instrumental degradation effects and/or the different empirical corrections used for GOME-2A. Regression slopes are about 0.64 for GOME-2A and 0.72 for GOME-2B, with an intercept of about 2×10¹³ molec. cm−2 for GOME-2A and half that for GOME-2B. Figure 18 presents the same data but color coded according to the different stations. The small intercepts are representative of small additive biases, while the slopes smaller than unity are the largest contributors to the negative multiplicative bias. The small intercept can potentially be explained by the GOME-2 normalization correction (see Sect. 2), which subtracts any remaining positive OClO SCD in region where no OClO is expected. The slope can potentially be explained by the different GOME-2 and ground-based DOAS fit settings and the corresponding SCD uncertainties (see Sect. 3.1.1). For GOME-2 there is, e.g., the impact of the mean residual or the scan angle empirical correction functions (see Sect. 2). The impact of the AMF differences highlighted in Fig. 8 also has a multiplicative effect. The smaller satellite SCDs for valid flags (i.e., SZA) found here compared to the ground-based ones could be potentially compensated for in the vertical column densities (VCDs) by the AMF. However, Fig. 8 shows that AMFsat is only smaller than AMFgb for SZA .
Concentrating on the slopes of daily linear regressions at each station (Table 4), values around or better than 0.7 are found for GOME-2B, and often slightly smaller for GOME-2A. The intercepts are generally smaller than 2×10¹³ molec. cm−2, except at Kiruna (for both instruments) and at Neumayer for GOME-2A. The rms values are generally larger for Antarctic stations.
These results are to be put in perspective with the systematic bias estimated in Sect. 3.1.1 and summarized in Table 3. Some stations have larger expected biases than others (e.g., up to 15 % at Eureka) due to their DOAS settings choices, and in general there is a total uncertainty within the ground-based datasets of about 26 % to 33 %, which is close to the remaining 36 % and 28 % multiplicative biases from the slope (slope values of 0.64 and 0.72 for GOME-2A and GOME-2B, respectively).
When considering results grouped by hemisphere, the slope is larger in the Northern Hemisphere for GOME-2A (0.85 versus 0.61), while for GOME-2B results are more coherent (0.76 versus 0.7). For GOME-2B the relative bias is very similar in both hemispheres (around −24 %), while for GOME-2A it is about −5 % in the Northern Hemisphere and −30 % in the Southern Hemisphere. These numbers are within the EUMETSAT AC SAF GDP OClO product target accuracy of 50 % and close to the optimal accuracy of 30 % (Hovila and Hassinen, 2021).
To summarize, we can make the following conclusions.
-
The variability of the OClO column, from day-to-day fluctuations to the annual cycle, is captured consistently by all instruments.
-
GOME-2A tends to be noisier than GOME-2B after late 2011.
We investigated the quality of the GOME-2A (2007–2016) and GOME-2B (2012–2016) OClO GDP 4.8 slant column datasets by comparing them to ground-based ZSL-DOAS measurements at a selection of eight stations located in the Arctic and Antarctic regions: Eureka (80∘ N), Ny-Ålesund (79∘ N), Kiruna (68∘ N), Harestua (60∘ N), Marambio (64∘ S), Neumayer (71∘ S), Belgrano (78∘ S), and Arrival Heights (78∘ S).
For the ground-based instruments, OClO spectral analyses were performed using fixed noon spectra recorded at low SZA in the absence of chlorine activation. Different DOAS analysis settings are used by different instrument teams, and the impact of these differences are quantified through dedicated sensitivity tests. This leads to an estimation of systematic uncertainties with a maximum of about 25 %. Depending on the different instruments, the random noise error was estimated to be between 6 % and 22 %. The total uncertainty from each ground-based dataset is estimated to be between 26 % and 33 % depending on the site.
At each station, daily comparisons were performed by selecting satellite and ground-based SCD data pairs corresponding to similar SZA conditions, assuming similar AMFs in both nadir and zenith geometries. Using radiative transfer simulations, this assumption was shown to be valid within the SZA range of the measurements, confirming estimations from previous studies.
Daily mean OClO SCD time series show that satellite and ground-based observations agree well at all stations and display consistent seasonal and inter-annual variabilities. GOME-2A tends to be noisier than GOME-2B, especially after 2011, which is likely related to instrumental degradation effects combined with the possible impact of the different instrumental corrections applied to the two instruments.
Daily scatterplots based on data selected during chlorine-activated periods give correlation coefficients of 0.8 for GOME-2A and 0.87 for GOME-2B, and regression slopes are 0.64 for GOME-2A and 0.72 for GOME-2B. These results fulfill the GOME-2 accuracy requirements for OClO, as stated in the EUMETSAT AC SAF product requirement document, i.e., a target accuracy of 50 % and an optimal accuracy of 30 %.
Biases at each station are generally negative and close to molec. cm−2 in the worst case (Arrival Heights IUPH). Those biases do not seem to originate from the ground-based datasets since these were also recently used for TROPOMI OClO validation (Pinardi et al., 2020), showing excellent agreement. Overall, comparison measurements at all the stations display a median bias of about molec. cm−2 for both GOME-2 instruments.
We conclude that the AC SAF 2007–2016 GOME-2 GDP 4.8 OClO SCD data records (OClO ACSAF, 2017; publicly available through the ftp://acsaf.eoc.dlr.de FTP server, last access: 28 June 2021) meet AC SAF mission requirements (Hovila and Hassinen, 2021) for both OClO GOME2 products but show an underestimation of about 20 %–25 % with respect to ground-based reference data.
Room exists for further improvement of both satellite and ground-based datasets. A harmonization of ground-based zenith-sky analysis, e.g., by NDACC, would be desirable when possible, considering the different spectral ranges covered by the different instruments. Moreover, 3-D chemistry transport model output coupled to a suitable radiative transport model could allow for creating meaningful OClO AMFs to transform the SCD OClO product into a more directly exploitable VCD product.
A1 Ground-based site description
For this study, stations operating ZSL-DOAS UV–VIS spectrometers from the Network for the Detection of Atmospheric Composition Change (NDACC, https://www.ndaccdemo.org/, last access: 28 June 2021), situated above 60∘ latitude (both north and south) and performing OClO SCD data retrievals, have been selected.
The following stations were used in the Arctic.
-
UToronto operates the PEARL UV–VIS spectrometer at Eureka (80∘ N, 85.93∘ W, Nunavut, northern Canada). OClO SCD data have been analyzed since 2011.
-
IUP-Bremen has operated a UV–VIS spectrometer at Ny-Ålesund (78.9∘ N, 11.9∘ E, Spitsbergen) since 1995 (Wittrock et al., 2004; Tørnkvist et al., 2002). OClO SCDs have been analyzed since 2007 using one fixed reference for each season.
-
MPIC has operated a UV–VIS spectrometer at Kiruna (67.8∘ N, 20.4∘ E, Sweden) since 1996 (Gu, 2019; Bugarski, 2003; Gottschalk, 2013). OClO SCDs have been analyzed since 2007, but between 2007 and 2013 the instrument was not operated on many days due to detector problems that prevented the OClO analysis.
-
BIRA-IASB has operated a UV–VIS spectrometer at Harestua (60.22∘ N, 10.75∘ E, Norway) since the 1990s (Hendrick et al., 2007). At the end of 2012, a new instrument was installed with an improved signal to noise ratio, and OClO SCDs have been analyzed since then using annual reference spectra.
The following stations were used in the Antarctic.
-
IUP-Heidelberg has operated a UV–VIS spectrometer at the German Antarctic research station Neumayer (70.62∘ S, 8.27∘ W, on the ice shelf in the Atlantic sector of the Antarctic continent) since 1999 (Frieß et al., 2004, 2005). OClO SCDs have been analyzed since 2007 using several fixed reference spectra. Generally, enhanced OClO signals are observed between August and October, which is when the polar vortex is over the station.
-
IUP-Heidelberg and NIWA have jointly operated a UV–VIS spectrometer at Arrival Heights (77.83∘ S, 166.65∘ W), which is part of the New Zealand station Scott Base on Ross Island, since 1998 (Frieß et al., 2005). Another instrument was present at the station, operated by NIWA (Kreher et al., 1996), but stopped measurements in 2017. Both instruments provide OClO SCDs from 2007 onwards.
-
In 1995, INTA installed a ZSL-DOAS VIS at Belgrano II station (77.9∘ S, 34.6∘ W), an Argentinian station situated on the coast of the Antarctic continent in the Weddell Sea area (Yela et al., 2005, 2017). Belgrano is representative of an in-polar vortex station during the winter and spring seasons until vortex breakdown (Yela et al., 2005, 2017). In 2011, a UV–VIS MAX-DOAS was installed at Belgrano II (Prados-Roman et al., 2018; Gomez-Martin et al., 2021). Ground-based SCD measurements are made for SZA <92∘, with no measurements during the polar night period (mid-April to mid-August). OClO SCDs have been analyzed in the UV channel for 2011, 2014, 2015, 2016, 2018 and 2019.
-
In 1994, INTA installed a ZSL-DOAS VIS at Marambio station (64.3∘ S, 56.7∘ W) on Marambio Island (Yela et al., 2017). In 2015, a UV–VIS MAX-DOAS was installed at the same site (Prados-Roman et al., 2018). Marambio is frequently located in the vortex edge region and affected by both vortex air masses and midlatitude air masses (Aun et al., 2020). OClO SCDs have been analyzed in the UV channel for 2015 and for 2018 onward.
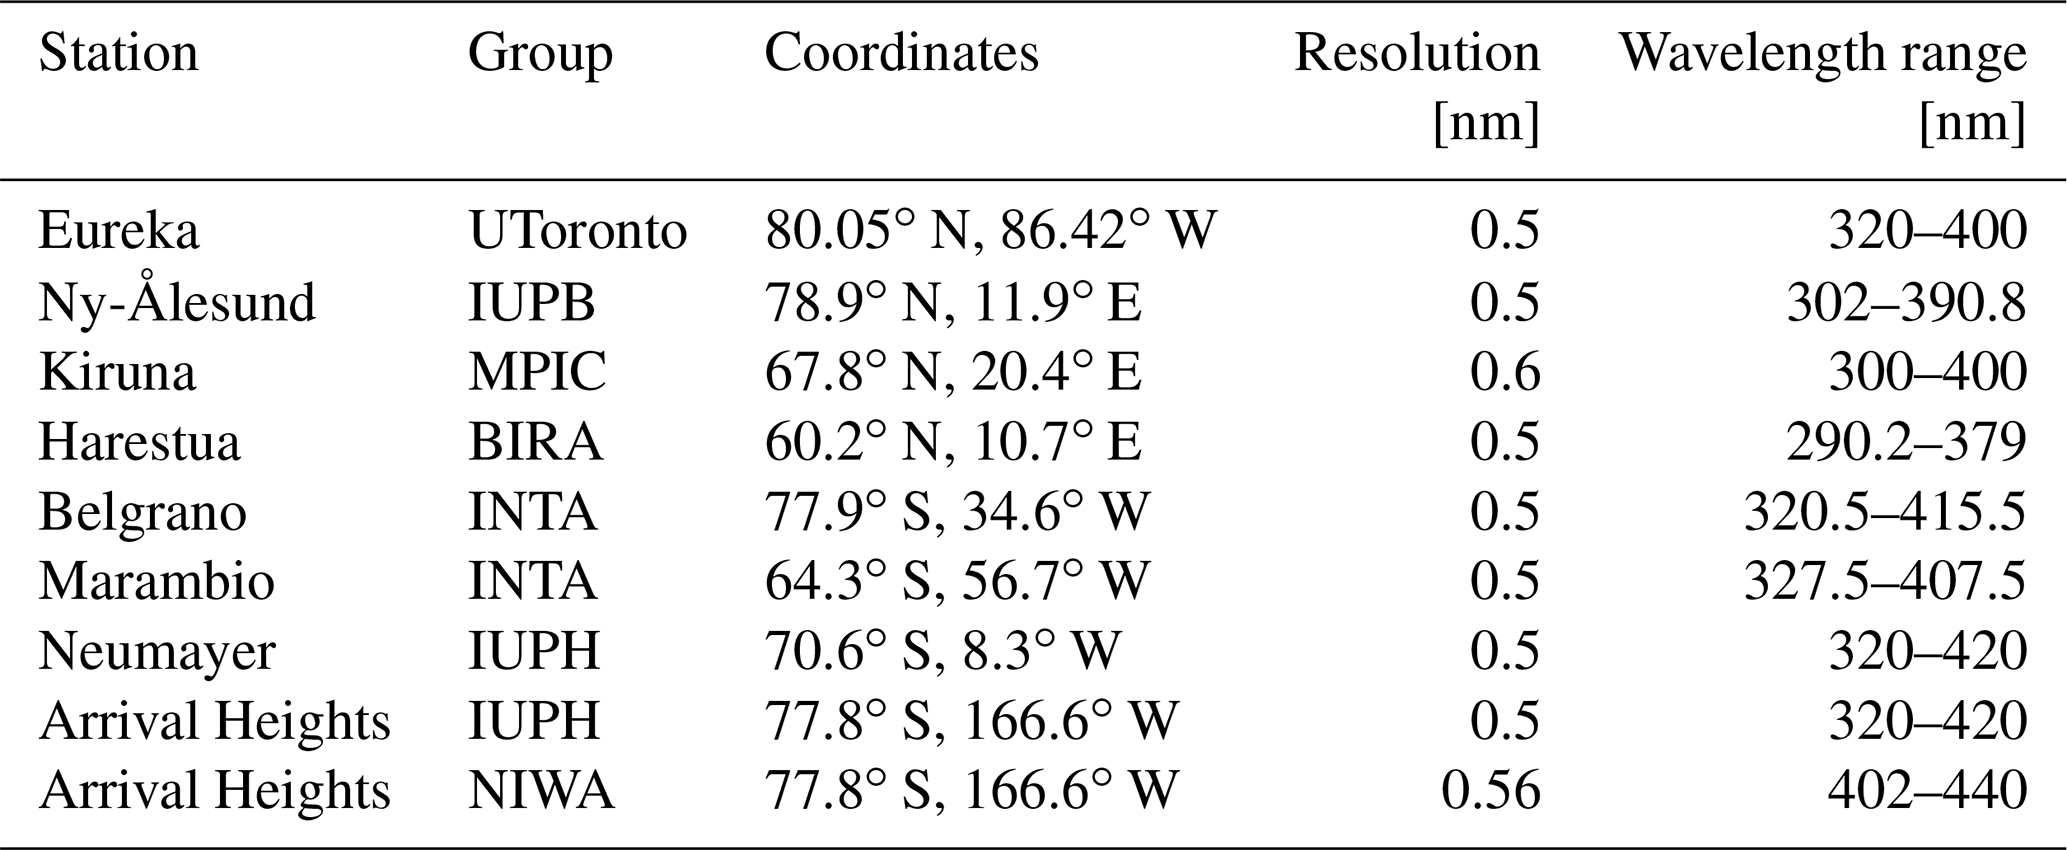
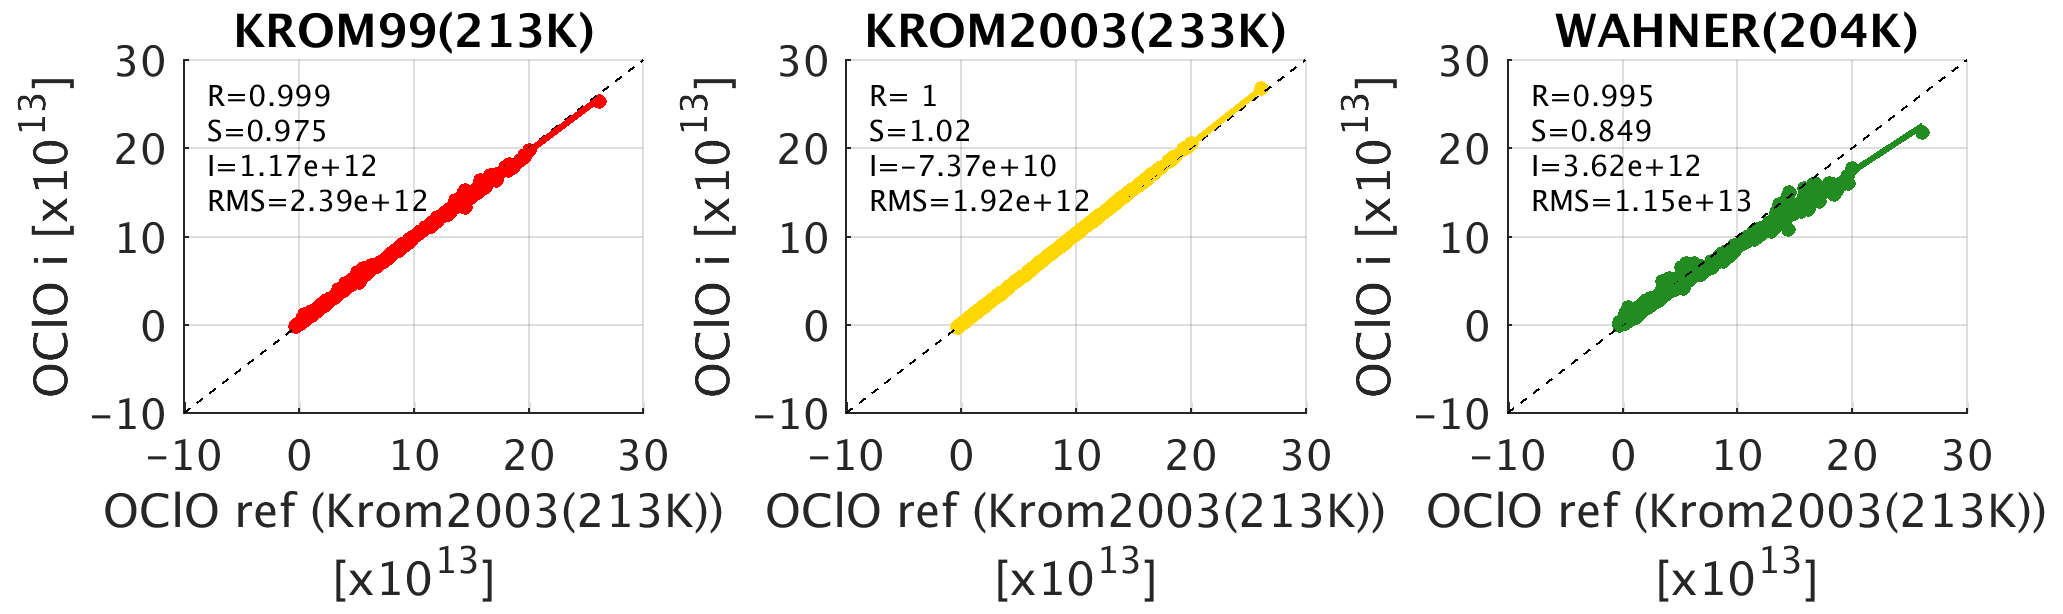
Figure A1Regression analysis of OClO SCDs retrieved from a common set of Ny-Ålesund spectra to investigate the sensitivity of OClO results for the cross sections used. The different DOAS analyses used correspond to what is described in Table A2, for test set (1) with respect to OClO values obtained using the Kromminga et al. (2003) cross section at 213 K as in GOME-2.
A2 Sensitivity tests
A2.1 Systematic errors
In a first test, OClO SCD analyses are performed in the 345–389 nm range (as was done for the GOME-2 analysis window) with varying OClO cross section sources (using the Wahner et al., 1987, Kromminga et al., 1999, and Kromminga et al., 2003, cross sections at several temperatures) and the other inputs fixed, as summarized in Table A2. With respect to Kromminga et al. (2003) at 213 K (used for GOME-2 analysis), regression analysis reveals slopes of 1.02 for the Kromminga et al. (2003) data at 233 K, 0.97 for the Kromminga et al. (1999) data also at 213 K and 0.85 for the Wahner et al. (1987) data at 204 K (see Fig. A1), and thus a total uncertainty of about 15 % with respect to what is used for GOME-2 retrievals is found. This is coherent with Kromminga et al. (2003), who report cross section band peaks about 8 % smaller than Wahner et al. (1987).
Considering the largest impact between results obtained with the different OClO cross sections, we come to a difference of about 17 % (corresponding to slopes ranging from 0.85 to 1.02). This value is used to quantify the first component of the systematic uncertainty in Table A2. The expected bias for each group's OClO cross section choice is also reported for each station in Table 3.
For the second test (see Table A2), we fixed the OClO cross section to Kromminga et al. (2003) at 213 K and varied the other DOAS fit parameters in an attempt to match the different settings used by each group (wavelength interval, interfering species, and their cross section references as in Table 2). Unfortunately, the Ny-Ålesund instrument does not cover the visible range and stops at 390.4 nm, and thus the MPIC wavelength choice (interval 372–392 nm) cannot be entirely covered. It should be noted that no analysis could be done in the visible interval used by NIWA.
Results of the regression analysis for each group's choice with respect to the median OClO SCD values are presented in Fig. A2. In most cases, the regression is compact (correlation R larger than 0.945) except for MPIC (R=0.893), and the rms is generally smaller than 2×10¹³ molec. cm−2, with the exception of IUPH and MPIC. Results for the latter two cases are likely biased due to the limited wavelength range (up to about 390.4 nm) of the Ny-Ålesund spectra. As a result, in these cases the upper part of the wavelength interval is not covered. Depending on the setting choices, the difference compared to the median OClO SCD can take the form of a multiplicative bias (slope different than 1) and/or an additive bias (non-zero intercept). In the tested cases, all intercepts except for IUPH are smaller than 1×10¹³ molec. cm−2, and thus the observed bias is mostly multiplicative. The largest impact on the slope is obtained for the MPIC case (slope of 0.925) and for UToronto (1.04), leading to a difference between all cases of about 18.5 % (slopes from 0.925 to 1.11). This value is considered the maximum systematic uncertainty of the retrieval choice for the systematic uncertainty contribution in Table A2, leading to a total maximum systematic uncertainty of about 25 % (see Table A2).
A2.2 Expected systematic bias against GOME-2
A third test has been carried out (see Table A2) comparing each group's analysis to the OClO SCD obtained using the GOME-2 data retrieval settings (345–389 nm range; see Table 1), as illustrated in Fig. A3. From this sensitivity test, the expected systematic bias for each group is estimated in comparison to the GOME-2 retrieval settings, ranging between 4 % and 16 % for the different stations.
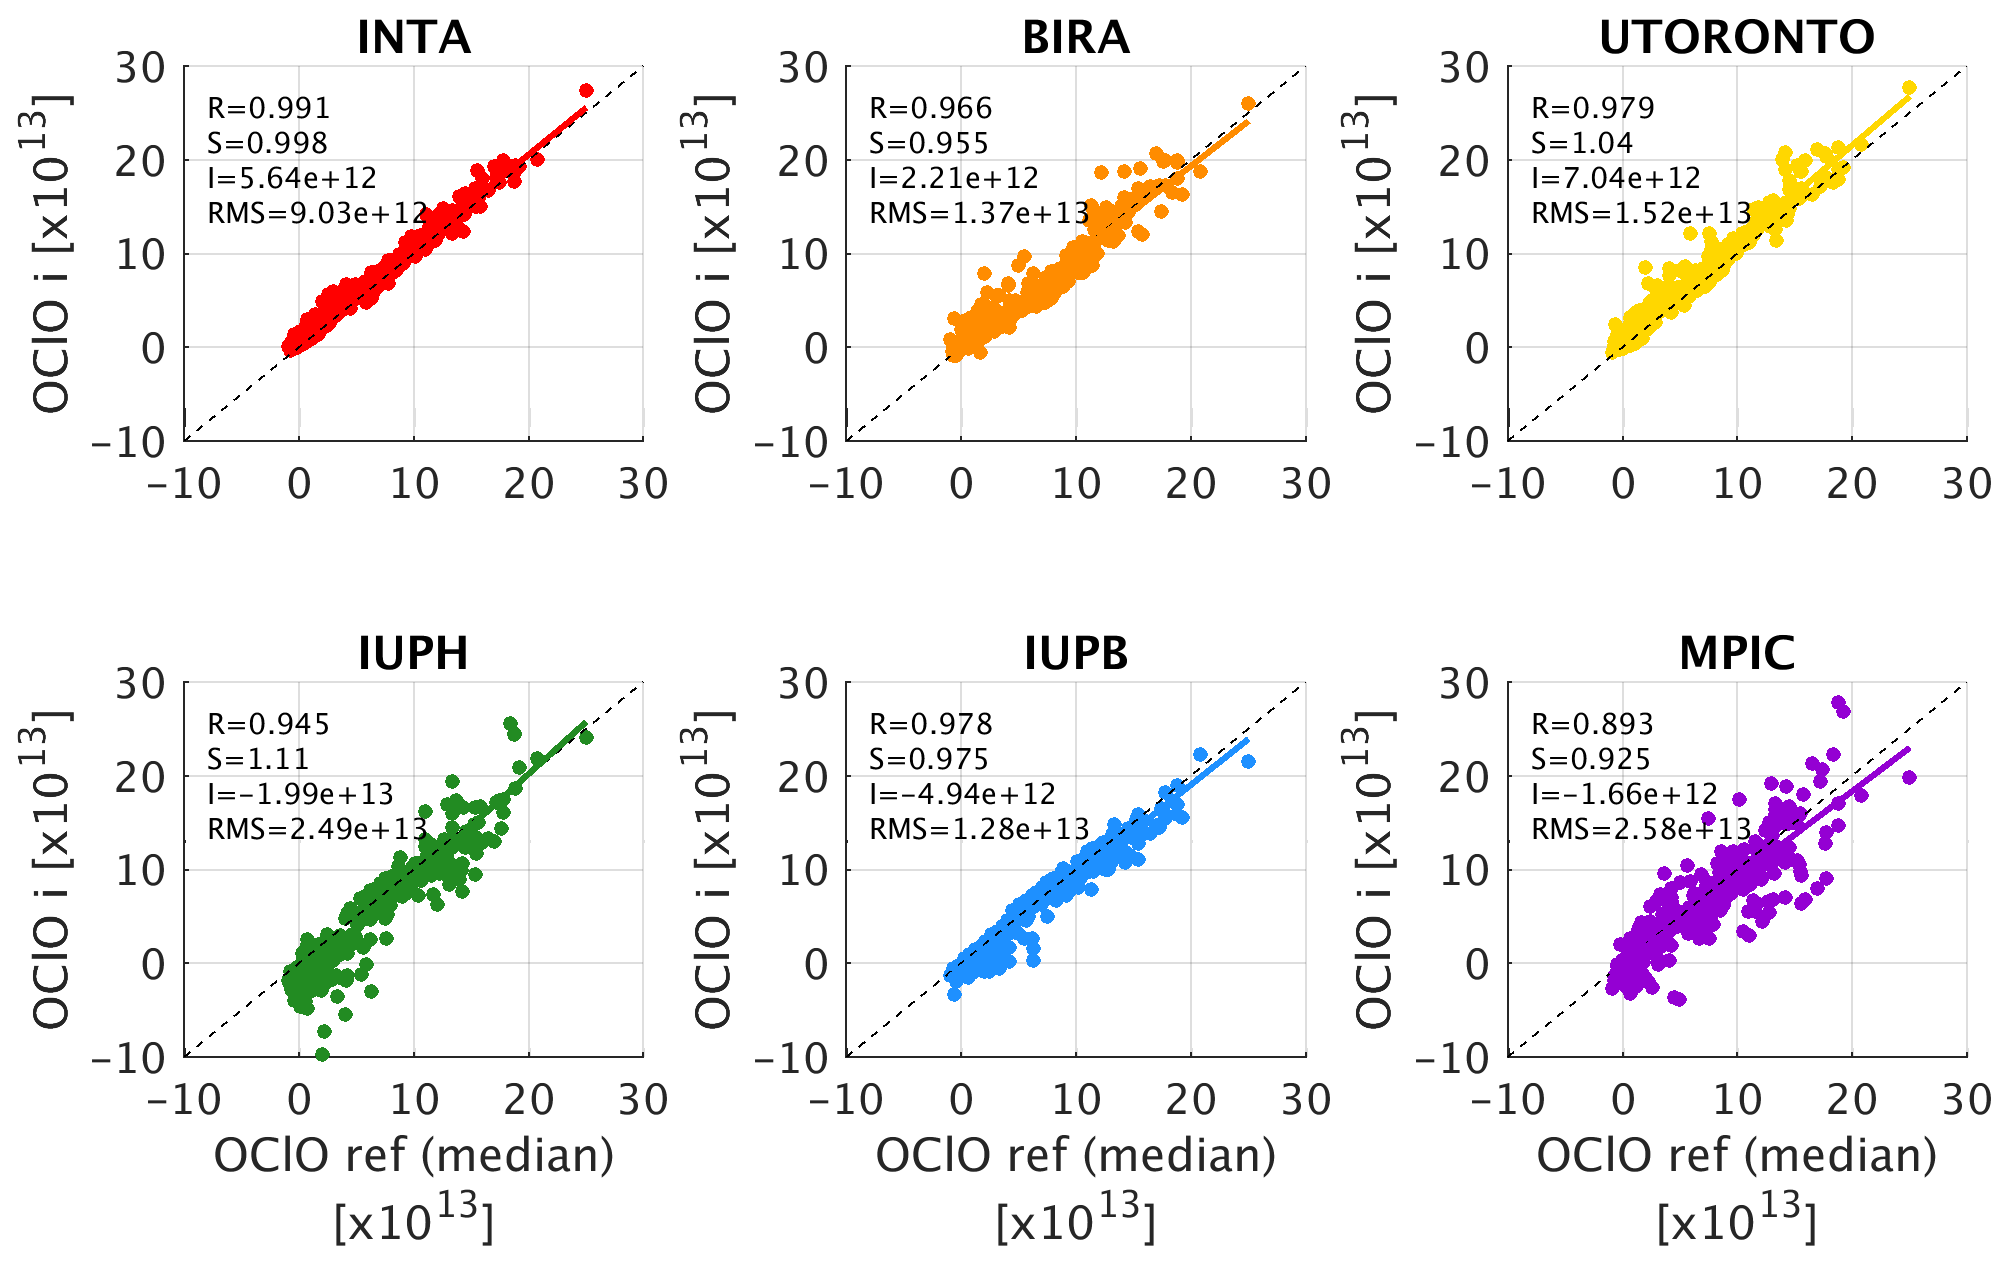
Figure A2Regression analysis of OClO SCDs retrieved from a common set of Ny-Ålesund spectra to investigate the sensitivity of OClO results in different settings. The different DOAS analyses used correspond to those used by each group for their own station analysis, as described in Tables 2 and A2 in test set (2). Each set of OClO SCDs is compared against median OClO values, and regression statistics are given as an inset in each plot.
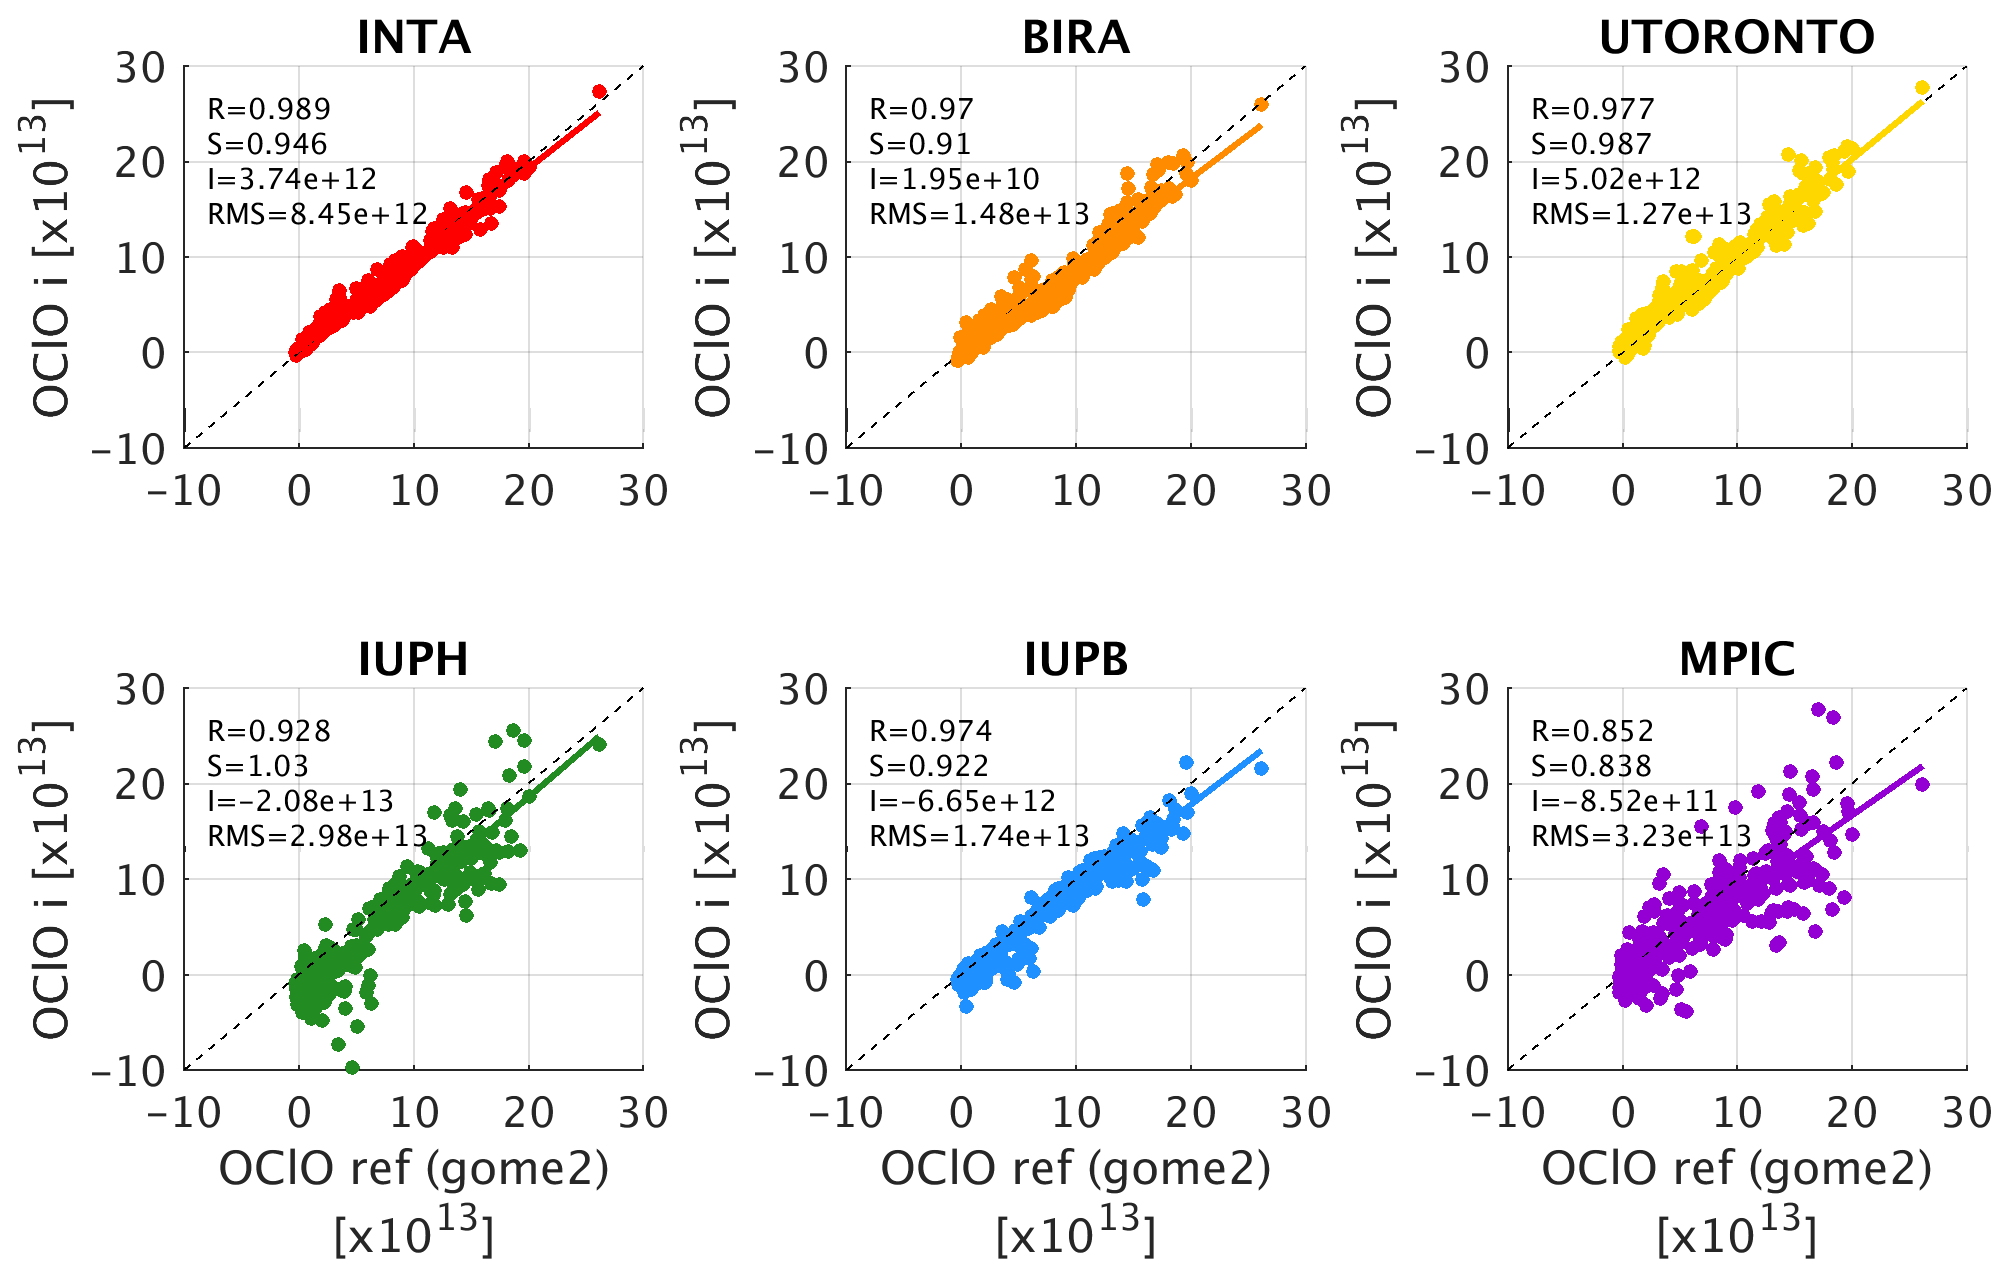
Figure A3Regression analysis of OClO SCDs retrieved from a common set of Ny-Ålesund spectra to investigate the sensitivity of OClO results in different settings. The different DOAS analyses used correspond to what each group used for their own station analysis, as described in Tables 2 and A2 in test set (3). Each set of OClO SCDs is compared against the OClO values obtained using the GOME-2 retrieval settings described in Table 1, and regression statistics are given as inset for each plot.
Table A2Description of the different sensitivity tests performed and a summary of the main results. The letters refer to the footnotes of Table 2.
The GOME-2A and GOME-2B OClO SCD data (OClO AC SAF, 2017) are available from the ftp://acsaf.eoc.dlr.de/ FTP server (last access: 28 June 2021). The whole offset-corrected ground-based dataset created and used in this publication is available on the BIRA repository (Pinardi and Van Roozendael, 2022).
GP carried out the validation analysis, the associated investigations, and wrote the manuscript. MVR and FH contributed input and advice at all stages of the scientific discussion and during the writing of the manuscript. MVR prepared the ground-based offset correction, FH performed the AMF calculations, and JG pre-processed the satellite data. AR and PV developed the GOME-2 OClO data processor. MVR, FH, AR, FW, UF, RQ, PJ, KB, KS, MG, TW, MYG, and CPR analyzed the ground-based data and/or supervised the instrument operation. All co-authors revised and commented on the manuscript.
At least one of the (co-)authors is a member of the editorial board of Atmospheric Measurement Techniques. The peer-review process was guided by an independent editor, and the authors also have no other competing interests to declare.
Publisher's note: Copernicus Publications remains neutral with regard to jurisdictional claims in published maps and institutional affiliations.
Part of the reported work was carried out in the framework of the EUMETSAT AC SAF Continuous Development and Operations Phase (CDOP-2 and CDOP-3) and by the Belgian Federal Science Policy Office (BELSPO) via the ProDEx B-ACSAF contribution to the AC-SAF. EUMETSAT and the AC SAF are acknowledged for the production of GOME-2 GDP 4.8 data.
The authors are also grateful to Olivier Rasson for valuable IT support and for their dedication to the AC SAF operational validation.
We thank Martyn Chipperfield (University of Leeds) for providing us with the SLIMCAT 3-D-CTM output used in the present study for simulating OClO AMFs.
The ZSL-DOAS data used in this publication were obtained from the principal investigators (PIs), and the stations used are part of the Network for the Detection of Atmospheric Composition Change (NDACC, https://ndacc.org, last access: 28 June 2021). The ZSL-DOAS instrument PIs and staff at the stations are warmly thanked for their sustained effort maintaining high-quality measurements and for providing valuable scientific discussions. MPIC wish to thank Carl-Fredrik Enell and Uwe Raffalksi for operating the Kiruna DOAS instrument. The ZSL-DOAS measurements at Eureka were made at the Polar Environment Atmospheric Research Laboratory (PEARL) by the Canadian Network for the Detection of Atmospheric Change (CANDAC), primarily supported by the Canadian Space Agency, the Natural Sciences and Engineering Research Council, and Environment and Climate Change Canada. INTA's observations were funded by the Spanish Ministry of Science and Innovation under the projects VHODCA (grant no. CTM2017-83199P), HELADO (grant no. CTM2013-41311P), and VIOLIN (grant no. CGL2010-20353). NIWA measurements at Arrival Heights are supported through New Zealand's Ministry of Business, Innovation, and Employment (MBIE) Strategic Science Investment Fund (SSIF).
This research has been supported by the European Organization for the Exploitation of Meteorological Satellites (grant nos. AC SAF CDOP-2 and CDOP-3) and the Belgian Federal Science Policy Office (grant no. ProDEx B-ACSAF).
This paper was edited by William R. Simpson and reviewed by two anonymous referees.
Aliwell, S. R., Van Roozendael, M., Johnston, P. V., Richter, A., Wagner, T., Arlander, D. W., Burrows, J. P., Fish, D. J., Jones, R. L., Tørnkvist, K. K., Lambert, J.-C., Pfeilsticker, K., and Pundt, I.: Analysis for BrO in zenith-sky spectra: An intercomparison exercise for analysis improvement, J. Geophys. Res.-Atmos., 107, ACH 10-1–ACH 10-20, https://doi.org/10.1029/2001JD000329, 2002. a
Aun, M., Lakkala, K., Sanchez, R., Asmi, E., Nollas, F., Meinander, O., Sogacheva, L., De Bock, V., Arola, A., de Leeuw, G., Aaltonen, V., Bolsée, D., Cizkova, K., Mangold, A., Metelka, L., Jakobson, E., Svendby, T., Gillotay, D., and Van Opstal, B.: Solar UV radiation measurements in Marambio, Antarctica, during years 2017–2019, Atmos. Chem. Phys., 20, 6037–6054, https://doi.org/10.5194/acp-20-6037-2020, 2020. a
Bogumil, K., Orphal, J., Homann, T., Voigt, S., Spietz, P., Fleischmann, O., Vogel, A., Hartmann, M., Bovensmann, H., Frerik, J., and Burrows, J. P.: Measurements of molecular absorption spectra with the SCIAMACHY pre-flight model: instrument characterization and reference data for atmospheric remote-sensing in the 230–2380 nm region, J. Photoch. Photobio. A, 157, 167–184, https://doi.org/10.1016/S1010-6030(03)00062-5, 2003. a
Brion, J., Chakir, A., Charbonnier, J., Daumont, D., Parisse, C., and Malicet, J.: Absorption spectra measurements for the ozone molecule in the 350–830 nm region, J. Atmos. Chem., 30, 291–99, https://doi.org/10.1023/A:1006036924364, 1998. a
Bugarski, S.: Spektroskopische Messungen der stratosphärischen Spurengase BrO und OClO in Kiruna (Schweden), Diploma thesis, institute for applied physics of the technical, University of Darmstadt, 2003. a
Burrows, J. P., Weber, M., Buchwitz, M., Rozanov, V., Ladstätter-Weißenmayer, A., Richter, A., Debeek, R., Hoogen, R., Bramstedt, K., Eichmann, K. U., Eisinger, M., and Perner, D.: The Global Ozone Monitoring Experiment (GOME): Mission Concept and First Scientific Results, J. Atmos. Sci., 56, 151–175, 1999. a
Chance, K. and Kurucz, R.: An improved high-resolution solar reference spectrum for earth's atmosphere measurements in the ultraviolet, visible, and near infrared, J. Quant. Spectrosc. Ra., 111, 1289–1295, https://doi.org/10.1016/j.jqsrt.2010.01.036, 2010. a
Chance, K. V. and Spurr, R. J. D.: Ring effect studies: Rayleigh scattering, including molecular parameters for rotational Raman scattering, and the Fraunhofer spectrum, Appl. Opt., 36, 5224–5230, https://doi.org/10.1364/AO.36.005224, 1997. a
Fleischmann, O. C., Hartmann, M., Burrows, J. P., and Orphal, J.: New ultraviolet absorption cross-sections of BrO at atmospheric temperatures measured by time-windowing Fourier transform spectroscopy, J. Photoch. Photobio. A, 168, 117–132, https://doi.org/10.1016/j.jphotochem.2004.03.026, 2004. a
Frieß, U., Hollwedel, J., König-Langlo, G., Wagner, T., and Platt, U.: Dynamics and chemistry of tropospheric bromine explosion events in the Antarctic coastal region, J. Geophys. Res.-Atmos., 109, D6, https://doi.org/10.1029/2003JD004133, 2004. a
Frieß, U., Kreher, K., Johnston, P. V., and Platt, U.: Ground-Based DOAS Measurements of Stratospheric Trace Gases at Two Antarctic Stations during the 2002 Ozone Hole Period, J. Atmos. Sci., 62, 765–777, https://doi.org/10.1175/JAS-3319.1, 2005. a, b, c, d
Gil, M., Puentedura, O., Yela, M., Parrondo, C., Jadhav, D. B., and Thorkelsson, B.: OClO, NO2 and O3 total column observations over Iceland during the winter 1993/94, Geophys. Res. Lett., 23, 3337–3340, https://doi.org/10.1029/96GL03102, 1996. a
Gomez-Martin, L., Toledo, D., Prados-Roman, C., Adame, J. A., Ochoa, H., and Yela, M.: Polar Stratospheric Clouds Detection at Belgrano II Antarctic Station with Visible Ground-Based Spectroscopic Measurements, Remote Sens., 13, 1412, https://doi.org/10.3390/rs13081412, 2021. a
Gottschalk, M.: Characterisation of a new CCD-Detector for the Zenith-DOAS in Kiruna, Sweden, Bachelor thesis, Johannes Gutenberg-University of Mainz, 2013. a
Greenblatt, G. D., Orlando, J. J., Burkholder, J. B., and Ravishankara, A. R.: Absorption measurements of oxygen between 330 and 1140 nm, J. Geophys. Res.-Atmos., 95, 18577–18582, https://doi.org/10.1029/JD095iD11p18577, 1990. a
Gu, M.: Long term trends of Stratospheric trace gases from ground-based DOAS observations of Kiruna, Sweden, PhD thesis, University of Heidelberg, http://www.ub.uni-heidelberg.de/archiv/25980 (last access: 28 June 2021), 2019. a
Gür, B., Spietz, P., Orphal, J., and Burrows, J.: Absorption Spectra Measurements with the GOME-2 FMs using the IUP/IFE-UB´s Calibration Apparatus for Trace Gas Absorption Spectroscopy CATGAS, Final Report, Contract no. 16007/02/NL/SF, ESA/EUMETSAT, IUP University of Bremen, Bremen, Germany, http://www.iup.uni-bremen.de/doas/reports/Gur_et_al_2015_CATGAS_GOME-2_Final_Report.pdf (last access: 3 June 2022), 2005. a, b, c, d
Hassinen, S., Balis, D., Bauer, H., Begoin, M., Delcloo, A., Eleftheratos, K., Gimeno Garcia, S., Granville, J., Grossi, M., Hao, N., Hedelt, P., Hendrick, F., Hess, M., Heue, K.-P., Hovila, J., Jønch-Sørensen, H., Kalakoski, N., Kauppi, A., Kiemle, S., Kins, L., Koukouli, M. E., Kujanpää, J., Lambert, J.-C., Lang, R., Lerot, C., Loyola, D., Pedergnana, M., Pinardi, G., Romahn, F., van Roozendael, M., Lutz, R., De Smedt, I., Stammes, P., Steinbrecht, W., Tamminen, J., Theys, N., Tilstra, L. G., Tuinder, O. N. E., Valks, P., Zerefos, C., Zimmer, W., and Zyrichidou, I.: Overview of the O3M SAF GOME-2 operational atmospheric composition and UV radiation data products and data availability, Atmos. Meas. Tech., 9, 383–407, https://doi.org/10.5194/amt-9-383-2016, 2016. a
Hendrick, F., Van Roozendael, M., Chipperfield, M. P., Dorf, M., Goutail, F., Yang, X., Fayt, C., Hermans, C., Pfeilsticker, K., Pommereau, J.-P., Pyle, J. A., Theys, N., and De Mazière, M.: Retrieval of stratospheric and tropospheric BrO profiles and columns using ground-based zenith-sky DOAS observations at Harestua, 60∘ N, Atmos. Chem. Phys., 7, 4869–4885, https://doi.org/10.5194/acp-7-4869-2007, 2007. a, b, c
Hermans, C., Vandaele, A. C., Carleer, M., Fally, S., Colin, R., Jenouvrier, A., Coquart, B., and Mérienne, M.-F.: Absorption cross-sections of atmospheric constituents: NO2, O2, and H2O, Environ. Sci. Pollut. R., 6, 151–158, https://doi.org/10.1007/BF02987620, 1999. a, b
Hermans, C., Vandaele, A. C., Fally, S., Carleer, M., Colin, R., Coquart, B., Jenouvrier, A., and Merienne, M.-F.: Fourier transform measurements of SO2 absorption cross sections: I. Temperature dependence in the 24000–29000 cm−1 (345–420 nm) region, Proceedings of the NATO Advanced Research Workshop, Weakly Interacting Molecular Pairs: Unconventional Absorbers of Radiation in the Atmosphere, NATO Sci. S. IV Ear. En., 27, 193–202, http://spectrolab.aeronomie.be/o2.htm (last access: 28 June 2021), 2003. a
Hovila, J. and Hassinen, S.: Service Specification, Issue 1.5, Tech. rep., SAF/AC/FMI/RQ/SESP/001, https://acsaf.org/docs/AC_SAF_Service_Specification.pdf (last access: 31 May 2022), 2021. a, b
Kreher, K., Keys, J. G., Johnston, P. V., Platt, U., and Liu, X.: Ground-based measurements of OClO and HCl in austral spring 1993 at Arrival Heights, Antarctica, Geophys. Res. Lett., 23, 1545–1548, https://doi.org/10.1029/96GL01318, 1996. a, b, c, d
Kromminga, H., Orphal, J., Voigt, S., and Burrows, J. P.: Fourier-transform-spectroscopy of symmetric chlorine dioxide (OClO), Proc. EC Advanced Study Course “Atmospheric Effects of aircraft emissions in the upper troposphere and lower stratosphere” (ASTAIRE 1999), Bergen, Norway, 1999. a, b, c, d
Kromminga, H., Orphal, J., Spietz, P., Voigt, S., and Burrows, J.: New measurements of OClO absorption cross-sections in the 325–435 nm region and their temperature dependence between 213 and 293 K, J. Photoch. Photobio. A, 157, 149–160, https://doi.org/10.1016/S1010-6030(03)00071-6, 2003. a, b, c, d, e, f, g, h, i, j, k
Kuttippurath, J., Godin-Beekmann, S., Lefèvre, F., and Pazmiño, A.: Ozone depletion in the Arctic winter 2007–2008, Int. J. Remote Sens., 30, 4071–4082, https://doi.org/10.1080/01431160902821965, 2009. a
Kühl, S., Wilms-Grabe, W., Beirle, S., Frankenberg, C., Grzegorski, M., Hollwedel, J., Khokhar, F., Kraus, S., Platt, U., Sanghavi, S., von Friedeburg, C., and Wagner, T.: Stratospheric chlorine activation in the Arctic winters 1995/96–2001/02 derived from GOME OClO measurements, Adv. Space Res., 34, 798–803, https://doi.org/10.1016/j.asr.2003.08.069, 2004. a
Kühl, S., Wilms-Grabe, W., Frankenberg, C., Grzegorski, M., Platt, U., and Wagner, T.: Comparison of OClO nadir measurements from SCIAMACHY and GOME, Adv. Space Res., 37, 2247–2253, https://doi.org/10.1016/j.asr.2005.06.061, 2006. a, b
McElroy, M. B., Salawitch, R. J., Wofsy, S. C., and Logan, J. A.: Reductions of Antarctic ozone due to synergistic interactions of chlorine and bromine, Nature, 321, 759–762, https://doi.org/10.1038/321759a0, 1986. a
Meier, A., Richter, A., Pinardi, G., and Lerot, C.: Monitoring Stratospheric OClO with Sentinel-5p (S5pOClO), Algorithm Theoretical Baseline Document, Tech. rep., S5p+I_OCLO_IUP-UB_ATBD v2, http://www.doas-bremen.de/projects/s5p_oclo/S5p+I_OClO_IUP-UB_ATBD_V2-2_final.pdf (last access: 28 June 2021), 2020. a
Molina, L. T. and Molina, M. J.: Production of chlorine oxide (Cl2O2) from the self-reaction of the chlorine oxide (ClO) radical, J. Phys. Chem., 91, 433–436, https://doi.org/10.1021/j100286a035, 1987. a
Munro, R., Lang, R., Klaes, D., Poli, G., Retscher, C., Lindstrot, R., Huckle, R., Lacan, A., Grzegorski, M., Holdak, A., Kokhanovsky, A., Livschitz, J., and Eisinger, M.: The GOME-2 instrument on the Metop series of satellites: instrument design, calibration, and level 1 data processing – an overview, Atmos. Meas. Tech., 9, 1279–1301, https://doi.org/10.5194/amt-9-1279-2016, 2016. a
OClO AC SAF: GOME-2 OClO Total Column Density Data Record Release 1 – Metop, EUMETSAT SAF on Atmospheric Composition Monitoring, EUMETSAT [data set], https://doi.org/10.15770/EUM_SAF_O3M_0015, 2017.
Oetjen, H., Wittrock, F., Richter, A., Chipperfield, M. P., Medeke, T., Sheode, N., Sinnhuber, B.-M., Sinnhuber, M., and Burrows, J. P.: Evaluation of stratospheric chlorine chemistry for the Arctic spring 2005 using modelled and measured OClO column densities, Atmos. Chem. Phys., 11, 689–703, https://doi.org/10.5194/acp-11-689-2011, 2011. a, b, c, d, e, f, g
OMOCLOv3: Harvard-Smithsonian Center for Astrophysics, OMOCLO v3.0, https://www.cfa.harvard.edu/atmosphere/Instruments/OMI/PGEReleases/, last access: 28 June 2021. a
Otten, C., Ferlemann, F., Platt, U., Wagner, T., and Pfeilsticker, K.: Groundbased DOAS UV/visible measurements at Kiruna (Sweden) during the SESAME winters 1993/94 and 1994/95, J. of Atm. Chem., 30, 141–162, 1998. a
Pinardi, G. and Van Roozendael, M.: Ground-based zenith-sky DOAS dataset of stratospheric OClO, BIRA-IASB [data set], https://doi.org/10.18758/71021080, 2022.
Pinardi, G., Richter, A., Meier, A., and Roozendael, M. V.: Monitoring Stratospheric OClO with Sentinel-5p (S5pOClO), Validation Report, Tech. rep., S5p+I_OCLO_BIRA_VR, http://www.doas-bremen.de/projects/s5p_oclo/S5p+I_OClO_BIRA_VR_20201207_v1.1.pdf (last access: 28 June 2021), 2020. a, b
Platt, U. and Stutz, J.: Differential Optical Absorption Spectroscopy: Principles and Applications, Physics of Earth and Space Environments, Springer, Berlin and Heidelberg, ISBN: 978-3-540-75776-4, 2008. a
Pommereau, J.-P. and Piquard, J.: Ozone and nitrogen dioxide vertical distributions by UV-visible solar occultation from balloons, Geophys. Res. Lett., 21, 1227–1230, https://doi.org/10.1029/94GL00389, 1994. a
Prados-Roman, C., Gómez-Martín, L., Puentedura, O., Navarro-Comas, M., Iglesias, J., de Mingo, J. R., Pérez, M., Ochoa, H., Barlasina, M. E., Carbajal, G., and Yela, M.: Reactive bromine in the low troposphere of Antarctica: estimations at two research sites, Atmos. Chem. Phys., 18, 8549–8570, https://doi.org/10.5194/acp-18-8549-2018, 2018. a, b
Puķīte, J., Kühl, S., Deutschmann, T., Platt, U., and Wagner, T.: Extending differential optical absorption spectroscopy for limb measurements in the UV, Atmos. Meas. Tech., 3, 631–653, https://doi.org/10.5194/amt-3-631-2010, 2010. a
Puķīte, J., Borger, C., Dörner, S., Gu, M., Frieß, U., Meier, A. C., Enell, C.-F., Raffalski, U., Richter, A., and Wagner, T.: Retrieval algorithm for OClO from TROPOMI (TROPOspheric Monitoring Instrument) by differential optical absorption spectroscopy, Atmos. Meas. Tech., 14, 7595–7625, https://doi.org/10.5194/amt-14-7595-2021, 2021. a, b
Puķīte, J., Borger, C., Dörner, S., Gu, M., and Wagner, T.: OClO as observed by TROPOMI: a comparison with meteorological parameters and polar stratospheric cloud observations, Atmos. Chem. Phys., 22, 245–272, https://doi.org/10.5194/acp-22-245-2022, 2022. a, b
Renard, J. B., Lefevre, F., Pirre, M., Robert, C., and Huguenin, D.: Verticle profile of night-time stratospheric OClO, J. Atmos. Chem., 26, 65–76, https://doi.org/10.1023/A:1005757321761, 1997. a, b, c
Richter, A., Eisinger, M., Ladstätter-Weißenmayer, A., and Burrows, J.: DOAS Zenith Sky Observations: 2. Seasonal Variation of BrO Over Bremen (53∘ N) 1994–1995, J. Atmos. Chem., 32, 83–99, https://doi.org/10.1023/A:1006077725894, 1999. a
Richter, A., Wittrock, F., Weber, M., Beirle, S., Kühl, S., Platt, U., Wagner, T., Wilms-Grabe, W., and Burrows, J. P.: GOME Observations of Stratospheric Trace Gas Distributions during the Splitting Vortex Event in the Antarctic Winter of 2002. Part I: Measurements, J. Atmos. Sci., 62, 778–785, https://doi.org/10.1175/JAS-3325.1, 2005. a, b, c, d
Richter, A., Slijkhuis, S., and Loyola, D.: Offline Total OClO validation report, O3M-11, Tech. rep., SAF/O3M/IUP/OClO/2, http://www.iup.uni-bremen.de/doas/reports/o3saf_vs_gome-2_oclo_finalreport_091208.pdf (last access: 28 June 2021), 2009. a
Richter, A., Wittrock, F., and Valks, P.: Evaluation of the possibility to derive reliable OClO slant columns from GOME-2B and GOME-2A spectra, O3M SAF Visiting Scientist Activity, ID 03_AS14_02, Final Report, Tech. rep., SAF/O3M/IUP/OClO/2, http://www.iup.uni-bremen.de/doas/reports/o3m-saf_oclo_2_report_160427.pdf (last access: 28 June 2021), 2015. a, b, c, d, e, f, g
Schiller, C., Wahner, A., Platt, U., Dorn, H.-P., Callies, J., and Ehhalt, D. H.: Near UV atmospheric absorption measurements of column abundances during Airborne Arctic Stratospheric Expedition, January–February 1989: 2. OClO observations, Geophys. Res. Lett., 17, 501–504, https://doi.org/10.1029/GL017i004p00501, 1990. a
Serdyuchenko, A., Gorshelev, V., Weber, M., Chehade, W., and Burrows, J. P.: High spectral resolution ozone absorption cross-sections – Part 2: Temperature dependence, Atmos. Meas. Tech., 7, 625–636, https://doi.org/10.5194/amt-7-625-2014, 2014. a
Sessler, J., Chipperfield, M. P., Pyle, J. A., and Toumi, R.: Stratospheric OClO measurements as a poor quantitative indicator of chlorine activation, Geophys. Res. Lett., 22, 687–690, https://doi.org/10.1029/95GL00202, 1995. a
Solomon, S.: Stratospheric ozone depletion: A review of concepts and history, Rev. Geophys., 37, 275–316, https://doi.org/10.1029/1999RG900008, 1999. a, b
Solomon, S., Mount, G. H., Sanders, R. W., and Schmeltekopf, A. L.: Visible spectroscopy at McMurdo Station, Antarctica: 2. Observations of OClO, J. Geophys. Res.-Atmos., 92, 8329–8338, https://doi.org/10.1029/JD092iD07p08329, 1987. a, b
Solomon, S., Mount, G. H., Sanders, R. W., Jakoubek, R. O., and Schmeltekopf, A. L.: Observations of the Nighttime Abundance of OClO in the Winter Stratosphere Above Thule, Greenland, Science, 242, 550–555, https://doi.org/10.1126/science.242.4878.550, 1988. a, b
Solomon, S., Sanders, R. W., and Miller Jr., H. L.: Visible and near-ultraviolet spectroscopy at McMurdo Station, Antarctica 7. OClO diurnal photochemistry and implications for ozone destruction, J. Geophys. Res.-Atmos., 95, 13807–13817, https://doi.org/10.1029/JD095iD09p13807, 1990. a, b
Tétard, C., Fussen, D., Bingen, C., Capouillez, N., Dekemper, E., Loodts, N., Mateshvili, N., Vanhellemont, F., Kyrölä, E., Tamminen, J., Sofieva, V., Hauchecorne, A., Dalaudier, F., Bertaux, J.-L., Fanton d'Andon, O., Barrot, G., Guirlet, M., Fehr, T., and Saavedra, L.: Simultaneous measurements of OClO, NO2 and O3 in the Arctic polar vortex by the GOMOS instrument, Atmos. Chem. Phys., 9, 7857–7866, https://doi.org/10.5194/acp-9-7857-2009, 2009. a
Thalman, R. and Volkamer, R.: Temperature dependent absorption cross-sections of O2–O2 collision pairs between 340 and 630 nm and at atmospherically relevant pressure, Phys. Chem. Chem. Phys., 15, 15371–15381, https://doi.org/10.1039/C3CP50968K, 2013. a
Toumi, R.: Reaction of ClO with NO3: OClO formation and night-time O3 loss, Geophys. Res. Lett., 21, 1487–1490, https://doi.org/10.1029/93GL01675, 1994. a
Tørnkvist, K. K., Arlander, D. W., and Sinnhuber, B.-M.: Ground-Based UV Measurements of BrO and OClO over Ny-Ålesund during Winter 1996 and 1997 and Andøya during Winter 1998/99, J. Atmos. Chem., 43, 75–106, https://doi.org/10.1023/A:1019905006390, 2002. a, b, c
Valks, P., Chan, L., Hedelt, P., Slijkhuis, S., and Lutz, R.: Algorithm Theoretical Basis Document for GOME-2 Total Column Products of Ozone, NO2, BrO, HCHO, SO2, H2O, OClO and Cloud Properties (GDP 4.8 for GOME-2 on MetOp-A and -B, GDP 4.9 for GOME-2 on MetOp-C), Tech. rep., DLR/GOME-2/ATBD/01, https://acsaf.org/docs/atbd/Algorithm_Theoretical_Basis_Document_NTO_OTO_Nov_2019.pdf (last access: 28 June 2021), 2019a. a, b, c, d, e
Valks, P., Chan, L., Hedelt, P., Slijkhuis, S., and Lutz, R.: Product User Manual for GOME-2 Total Column Products of Ozone, NO2, BrO, HCHO, SO2, H2O, OClO and Cloud Properties (GDP 4.8 for GOME-2 on MetOp-A and -B, GDP 4.9 for GOME-2 on MetOp-C), Tech. rep., DLR/GOME-2/PUM/01, https://acsaf.org/docs/pum/Product_User_Manual_NTO_OTO_Nov_2019.pdf (last access: 28 June 2021), 2019b. a, b, c, d
Vandaele, A. C., Hermans, C., Simon, P. C., Carleer, M., Colin, R., Fally, S., Mérienne, M. F., Jenouvrier, A., and Coquart, B.: Measurements of the NO2 absorption cross-section from 42 000 cm−1 to 10 000 cm−1 (238–1000 nm) at 220 K and 294 K, J. Quant. Spectrosc. Radiat. Transf., 59, 171–184, https://doi.org/10.1016/S0022-4073(97)00168-4, 1998. a
Vandaele, A. C., Fayt, C., Hendrick, F., Hermans, C., Humbled, F., Van Roozendael, M., Gil, M., Navarro, M., Puentedura, O., Yela, M., Braathen, G., Stebel, K., Tørnkvist, K., Johnston, P., Kreher, K., Goutail, F., Mieville, A., Pommereau, J.-P., Khaikine, S., Richter, A., Oetjen, H., Wittrock, F., Bugarski, S., Frieß, U., Pfeilsticker, K., Sinreich, R., Wagner, T., Corlett, G., and Leigh, R.: An intercomparison campaign of ground-based UV-visible measurements of NO2, BrO, and OClO slant columns: Methods of analysis and results for NO2, J. Geophys. Res.-Atmos., 110, D08305, https://doi.org/10.1029/2004JD005423, 2005. a
Vountas, M., Rozanov, V. V., and Burrows, J. P.: Ring effect: impact of rotational Raman scattering on radiative transfer in Earth's atmosphere, J. Quant. Spectrosc. Ra., 60, 943–961, https://doi.org/10.1016/S0022-4073(97)00186-6, 1998. a, b
Wagner, T., Leue, C., Pfeilsticker, K., and Platt, U.: Monitoring of the stratospheric chlorine activation by Global Ozone Monitoring Experiment (GOME) OClO measurements in the austral and boreal winters 1995 through 1999, J. Geophys. Res.-Atmos., 106, 4971–4986, https://doi.org/10.1029/2000JD900458, 2001. a, b, c
Wagner, T., Wittrock, F., Richter, A., Wenig, M., Burrows, J. P., and Platt, U.: Continuous monitoring of the high and persistent chlorine activation during the Arctic winter 1999/2000 by the GOME instrument on ERS-2, J. Geophys. Res.-Atmos., 107, SOL 3-1–SOL 3-10, https://doi.org/10.1029/2001JD000466, 2002. a, b
Wahner, A., Tyndall, G. S., and Ravishankara, A. R.: Absorption cross sections for symmetric chlorine dioxide as a function of temperature in the wavelength range 240–480 nm, J. Phys. Chem., 91, 2734–2738, https://doi.org/10.1021/j100295a018, 1987. a, b, c, d, e
Weber, M., Dhomse, S., Wittrock, F., Richter, A., Sinnhuber, B.-M., and Burrows, J. P.: Dynamical control of NH and SH winter/spring total ozone from GOME observations in 1995–2002, Geophys. Res. Lett., 30, 1583, https://doi.org/10.1029/2002GL016799, 2003. a
Wilmouth, D. M., Hanisco, T. F., Donahue, N. M., and Anderson, J. G.: Fourier Transform Ultraviolet Spectroscopy of the A Transition of BrO, J. Phys. Chem. A, 103, 8935–8945, https://doi.org/10.1021/jp991651o, 1999. a
Wittrock, F., Richter, A., and Burrows, J. P.: Validation of GOME BrO and OClO observations in the northern hemisphere, in: Proceedings of the European Symposium on Atmospheric Measurements from Space (ESAMS 99), ESTEC, Noordwijk, Netherlands, 18–22 January 1999, WPP-161, 735–738, Eur. Space Agency, Noordwijk, Netherlands, http://www.iup.uni-bremen.de/doas/paper/esams_99_wittrock.ps (last access: 3 June 2022), 1999. a
Wittrock, F., Oetjen, H., Richter, A., Fietkau, S., Medeke, T., Rozanov, A., and Burrows, J. P.: MAX-DOAS measurements of atmospheric trace gases in Ny-Ålesund – Radiative transfer studies and their application, Atmos. Chem. Phys., 4, 955–966, https://doi.org/10.5194/acp-4-955-2004, 2004. a
Yela, M., Parrondo, C., Gil, M., Rodríguez, S., Araujo, J., Ochoa, H., Deferrari, G., and Díaz, S.: The September 2002 Antarctic vortex major warming as observed by visible spectroscopy and ozone soundings, Int. J. Remote Sens., 26, 3361–3376, https://doi.org/10.1080/01431160500076285, 2005. a, b
Yela, M., Gil-Ojeda, M., Navarro-Comas, M., Gonzalez-Bartolomé, D., Puentedura, O., Funke, B., Iglesias, J., Rodríguez, S., García, O., Ochoa, H., and Deferrari, G.: Hemispheric asymmetry in stratospheric NO2 trends, Atmos. Chem. Phys., 17, 13373–13389, https://doi.org/10.5194/acp-17-13373-2017, 2017. a, b, c