the Creative Commons Attribution 4.0 License.
the Creative Commons Attribution 4.0 License.
 | 05 Jul 2022
Integrated airborne investigation of the air composition over the Russian sector of the Arctic
Boris D. Belan
Gerard Ancellet
Irina S. Andreeva
Pavel N. Antokhin
Viktoria G. Arshinova
Mikhail Y. Arshinov
Yurii S. Balin
Vladimir E. Barsuk
Sergei B. Belan
Dmitry G. Chernov
Denis K. Davydov
Alexander V. Fofonov
Georgii A. Ivlev
Sergei N. Kotel'nikov
Alexander S. Kozlov
Artem V. Kozlov
Katharine Law
Andrey V. Mikhal'chishin
Igor A. Moseikin
Sergei V. Nasonov
Philippe Nédélec
Olesya V. Okhlopkova
Sergei E. Ol'kin
Mikhail V. Panchenko
Jean-Daniel Paris
Iogannes E. Penner
Igor V. Ptashnik
Tatyana M. Rasskazchikova
Irina K. Reznikova
Oleg A. Romanovskii
Alexander S. Safatov
Denis E. Savkin
Denis V. Simonenkov
Tatyana K. Sklyadneva
Gennadii N. Tolmachev
Semyon V. Yakovlev
Polina N. Zenkova
The change of the global climate is most pronounced in the Arctic, where the air temperature increases 2 to 3 times faster than the global average. This process is associated with an increase in the concentration of greenhouse gases in the atmosphere. There are publications predicting the sharp increase in methane emissions into the atmosphere due to permafrost thawing. Therefore, it is important to study how the air composition in the Arctic changes in the changing climate. In the Russian sector of the Arctic, the air composition was measured only in the surface atmospheric layer at the coastal stations or earlier at the drifting stations. Vertical distributions of gas constituents of the atmosphere and aerosol were determined only in a few small regions. That is why the integrated experiment was carried out to measure the composition of the troposphere in the entire Russian sector of the Arctic from on board the Optik Tu-134 aircraft laboratory in the period of 4 to 17 September of 2020. The aircraft laboratory was equipped with contact and remote measurement facilities. The contact facilities were capable of measuring the concentrations of CO2, CH4, O3, CO, NOx, and SO2, as well as the disperse composition of particles in the size range from 3 nm to 32 µm, black carbon, and organic and inorganic components of atmospheric aerosol. The remote facilities were operated to measure the water transparency in the upper layer of the ocean, the chlorophyll content in water, and spectral characteristics of the underlying surface. The measured data have shown that the ocean continues absorbing CO2. This process is most intense over the Barents and Kara seas. The recorded methane concentration was increased over all the Arctic seas, reaching 2090 ppb in the near-water layer over the Kara Sea. The contents of other gas components and black carbon were close to the background level.
In bioaerosol, bacteria predominated among the identified microorganisms. In most samples, they were represented by coccal forms, less often spore-forming and non-spore-bearing rod-shaped bacteria. No dependence of the representation of various bacterial genera on the height and the sampling site was revealed. The most turbid during the experiment was the upper layer of the Chukchi and Bering seas. The Barents Sea turned out to be the most transparent. The differences in extinction varied by more than a factor of 1.5. In all measurements, except for the Barents Sea, the tendency of an increase in chlorophyll fluorescence in more transparent waters was observed.
- Article
(16671 KB) - Full-text XML
- BibTeX
- EndNote


Currently, global warming and the resulting environmental change are among the most important problems classified by the world community as great challenges. At the same time, there are regions characterized by the higher rate of global warming. They include the Arctic, where the rise in air temperature is 2 to 3 times higher than in other regions of the planet (Najafi et al., 2015; Shepherd, 2016). This process has been named “Arctic amplification”. In this regard, natural questions arise: how does Arctic warming affect the air composition (Nomura et al., 2018; Sand et al., 2016; Willis et al., 2018) and how is it related to air pollutants coming to the Arctic region (Arnold et al., 2016; Law et al., 2014)? To answer these questions and to plan actions aimed to preserve the vulnerable nature of the Arctic, we need measurements and analysis of direct relations and feedbacks between climate warming and changes in the air composition (Kulmala et al., 2010). However, the relevant data for the Russian sector of the Arctic are extremely deficient. Due to the lack of data for the Russian sector of the Arctic, a disappointing conclusion that environmental and socio-economic forecasts are impossible for this region was drawn in Schmale et al. (2018).
The composition of the atmosphere in the Arctic region was most often studied in the surface air layer along the coast of the Arctic Ocean (Asmi et al., 2016; Giamarelou et al., 2016; Willis et al., 2016). The results obtained in these studies provide information on the dynamics of aerosol and gas constituents in the coastal areas and also allow estimation of the power of sources and sinks of these constituents. At the same time, the processes of gas and aerosol exchange between the water surface of the increasingly ice-free ocean and the atmosphere remain unclear. There is no information about the vertical distribution of gas constituents and aerosol, which is very important, as was shown in the analysis of the heating of different atmospheric layers (Kylling et al., 2018; Zhuravleva et al., 2018), because air heating can occur not only in the surface air layer, but also in the middle troposphere. This makes the modeling of climatic processes difficult and greatly complicates the forecast of environmental changes.
Flying laboratories are widely used to study the vertical distribution of gas and aerosol components outside the Russian sector of the Arctic (France et al., 2016; Leaitch et al., 2016; Quennehen et al., 2011). The airborne method for studying the vertical air composition is now recognized as a reference method (Wendisch and Brenguier, 2013), since it allows the use of high-precision in situ instruments and measurements in meteorological conditions corresponding to the objectives of the experiment with a good reference in space and time.
In the Russian sector of the Arctic, besides airborne measurements during the International Polar Year (Paris et al., 2009a), the air composition was studied only in the near-surface (near-water) air layer at the drifting stations (Nagurnyi, 2010; Nagurnyi and Makshtas, 2016) or from research vessels (Pipko et al., 2010; Semiletov et al., 2013; Yu et al., 2015). Finally, the well-equipped Tiksi coastal observatory was established (Reshetnikov and Makshtas, 2012). Unfortunately, it is the only one on the entire coast of the Arctic Ocean, which in Russian jurisdiction has a length of several thousand kilometers. In the last decade, we have managed to carry out two small flight campaigns in the Russian sector of the Arctic within the framework of international projects (Antokhina et al., 2018; Àntokhin et al., 2014; Petaja et al., 2020).
To fill the gap in data on the vertical distribution of gas and aerosol constituents of air over the Russian sector of the Arctic, in 2020 the experiment on sensing of the atmosphere and water surface over all seas of the Arctic Ocean (Barents, Kara, Laptev, East Siberian, and Chukchi seas) was carried out from on board the Optik Tu-134 aircraft laboratory. The Bering Sea in the Pacific Ocean was chosen as a reference in relation to the Arctic. It should be noted that such a large-scale experiment had not been conducted in either the former USSR or modern Russia. This paper describes the conducted experiment, characterizes the used equipment, and provides some tentative results.
The experiment was conducted on board the Optik Tu-134 aircraft laboratory. Its basic equipment is described in Anokhin et al. (2011). For the Arctic experiment, the basic equipment was significantly expanded. This section describes the used instruments and systems.
Figure 1 shows the arrangement of instruments and sensors both inside the aircraft and on its external elements. The measuring system consists of remote devices and devices operating on the contact principle of measurements. Their operation requires auxiliary systems, such as power supply, airlines, and recording and control systems.
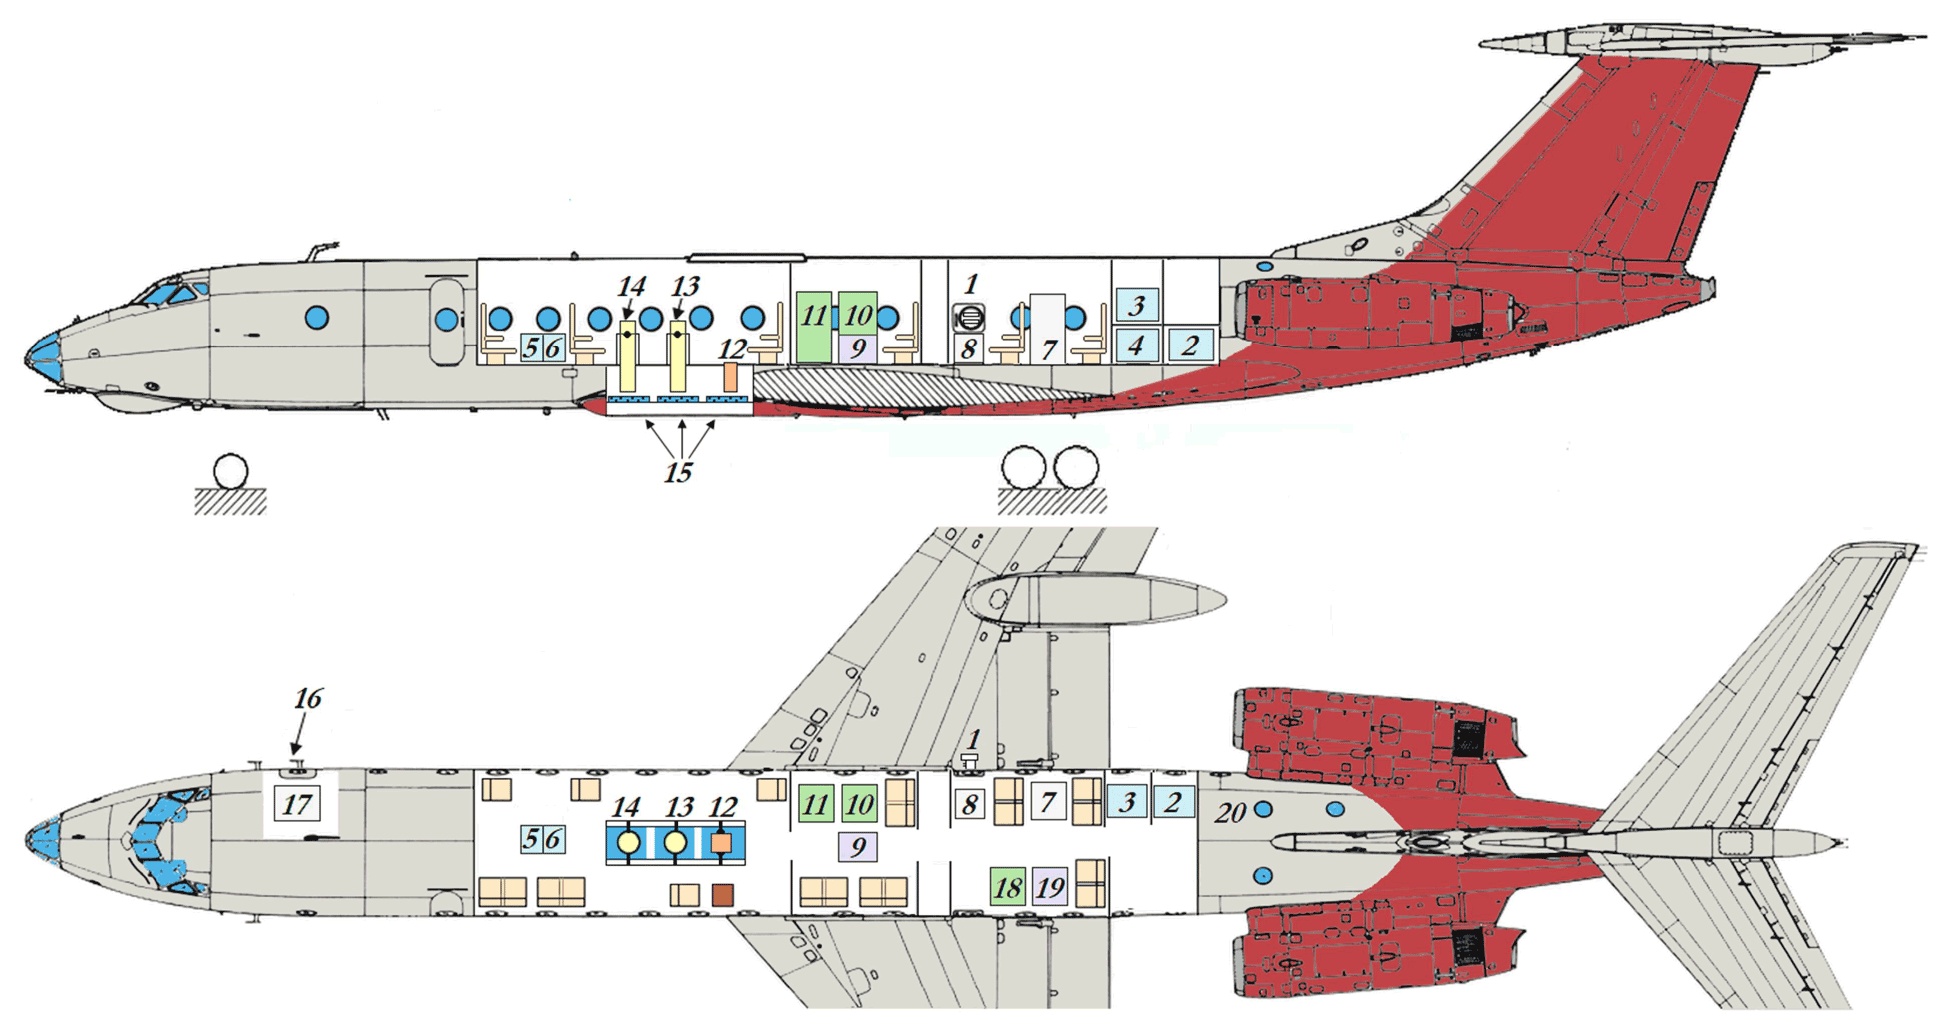
Figure 1Arrangement of the instrument suite on board the OPTIK TU-134 aircraft laboratory: 1 – ambient air inlets and RH&T probe; 2 – aircraft electrical power distribution unit (28 VDC); 3, 4, 5, 6 – inverters (28 VDC/220 VAC) and UPSs (Delta RT-2K); 7 – aerosol instrument rack: Aethalometer (MDA-02) and photoelectric aerosol nephelometer (FAN-M); 8 – aerosol instrument rack: diffusional particle sizer (DPS), optical particle counter (Grimm 1.109), filter, and bioaerosol sampling suite; 9 – navigation system (CompaNav-5.2 IAO); 10 – gas analysis rack: CO2–CH4–H2O (Picarro G2301-m): 11 – gas analysis rack: O3 (TEI model 49C), CO (TEI model 48C); 12 – spectroradiometer (Spectral Evolution PSR-1100F); 13, 14 – aerosol lidars; 15 – camera hatches; 16 – ambient air inlet; 17 – sampling unit for organic aerosol analysis; 18 – gas analysis rack: NOx (Thermo Scientific model 42i-TL); 19 – main data acquisition system (NI PXI-1042); 20 – GLONASS/GPS antennas.
2.1 Gas analysis system
To measure the concentrations of climatically significant minor gas constituents of the atmosphere, the following gas analyzers were installed on board the Optik Tu-134 aircraft laboratory:
-
CO2, CH4, and H2O – G2301-m operating based on the technology of cavity ring-down spectroscopy (CRDS, Picarro Inc., USA);
-
O3 – model 49C UV photometric gas analyzer (Thermo Environmental Instruments Inc., USA);
-
CO – model 48C non-dispersive infrared (NDIR) correlation gas-filter analyzer (Thermo Electron Corp., USA);
-
NO and NO2 (NOx) – model 42i-TL chemiluminescence gas analyzer (Thermo Fisher Scientific Inc, USA).
The integration of several of these sensors was described previously (Paris et al., 2008, 2010; Antokhin et al., 2018). The gas analysis system, airlines, and electronic communications are shown schematically in Fig. 2.
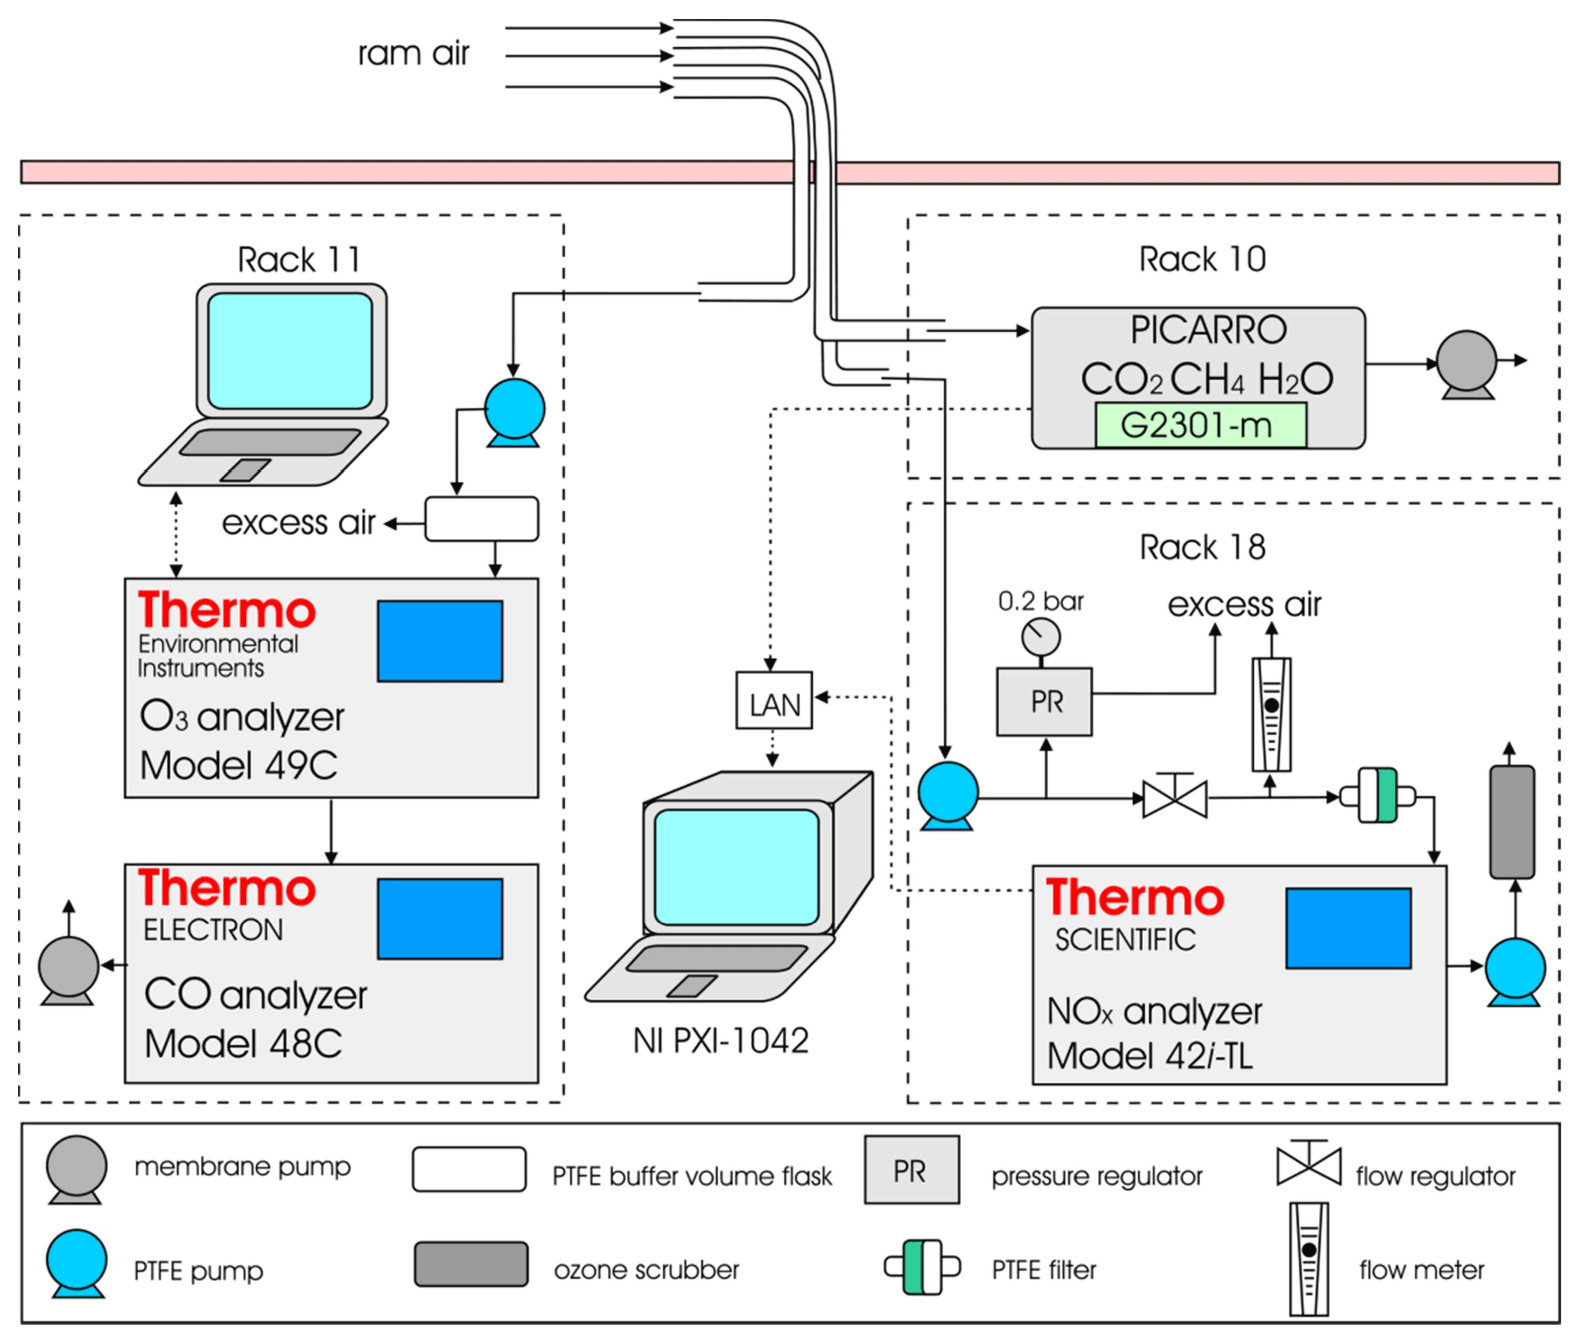
Figure 2Schematic diagram of the gas analysis instrument suite: solid lines – air ducts; dashed lines – communication cables.
An atmospheric air sample is supplied directly to the G2301-m gas analyzer by a Synflex 1300 1/4 combined metal-plastic tube (outer in., inner ∅=4 mm). The N 920 APE-W diaphragm pump (KNF Neuberger GmbH) is used as a flow stimulator, which provides the constant operating pressure at a level of 187 ± 0.1 gPa in the gas analyzer resonator up to an altitude of 10 km.
Atmospheric air samples for measurement of the concentrations of CO and chemically reactive gases NOx and O3 are delivered by Masterflex™ poly-tetra-fluoroethylene (PTFE) tubes (outer ∅=6.0 mm, inner ∅=4.48 mm). In contrast to G2301-m, the model 49C, model 48C, and model 42i-TL gas analyzers are not designed to operate at low pressures. Therefore, air samples are supplied to them with PTFE pre-pumps: VDE 0530 (KNF Neuberger GmbH) to model 49C and model 48C and LABOPORT® N820 FT.18 (KNF Neuberger GmbH) to model 42i-TL.
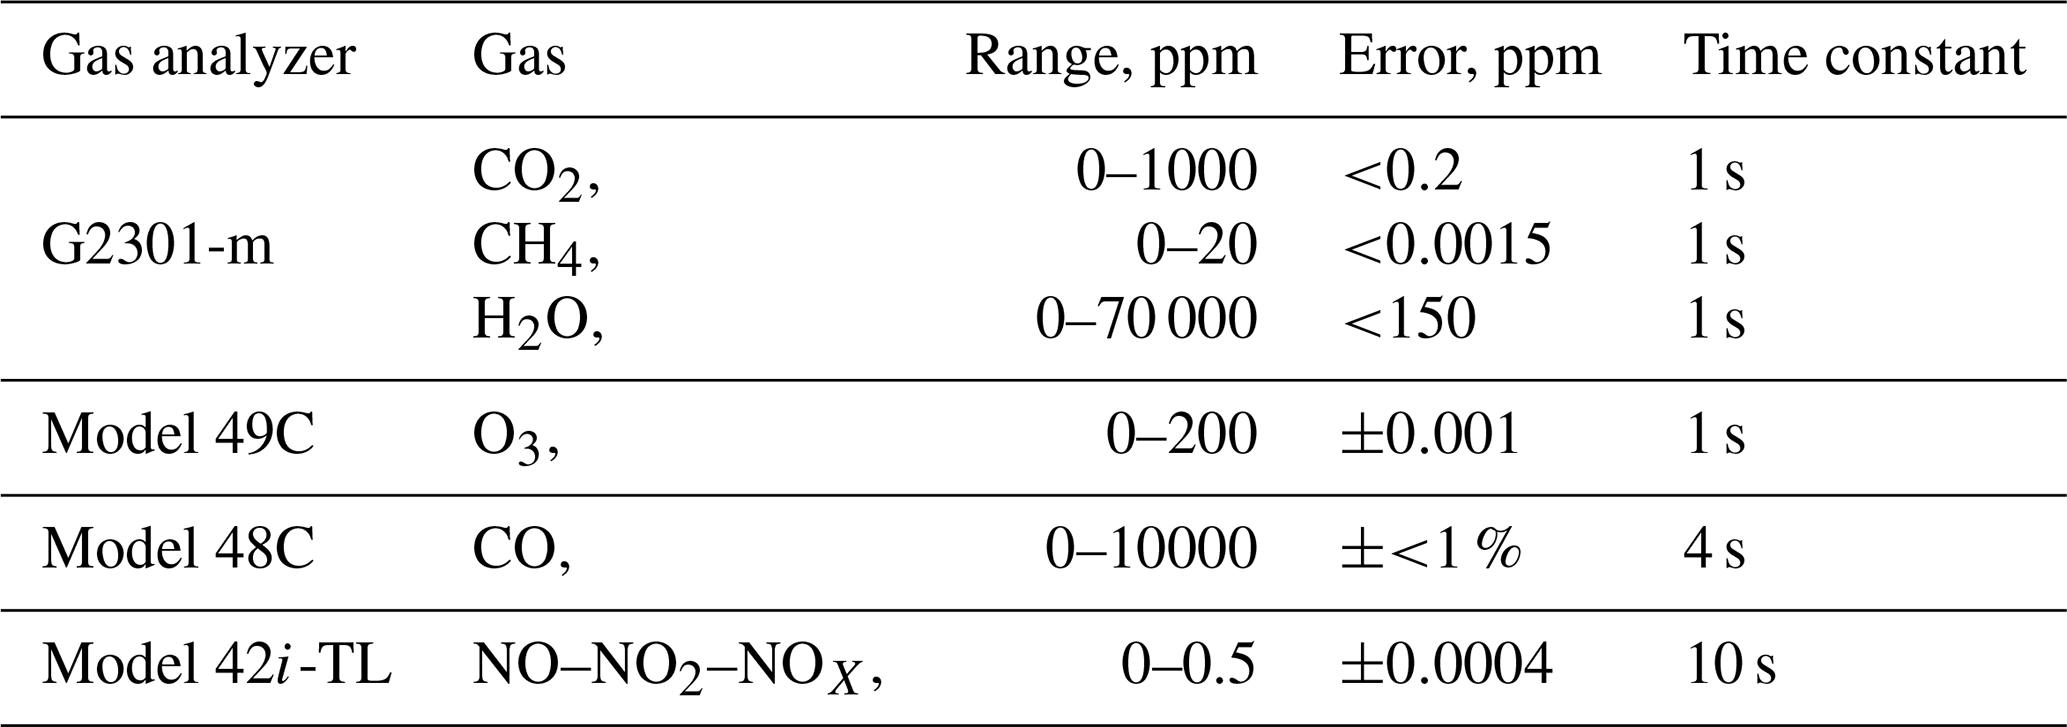
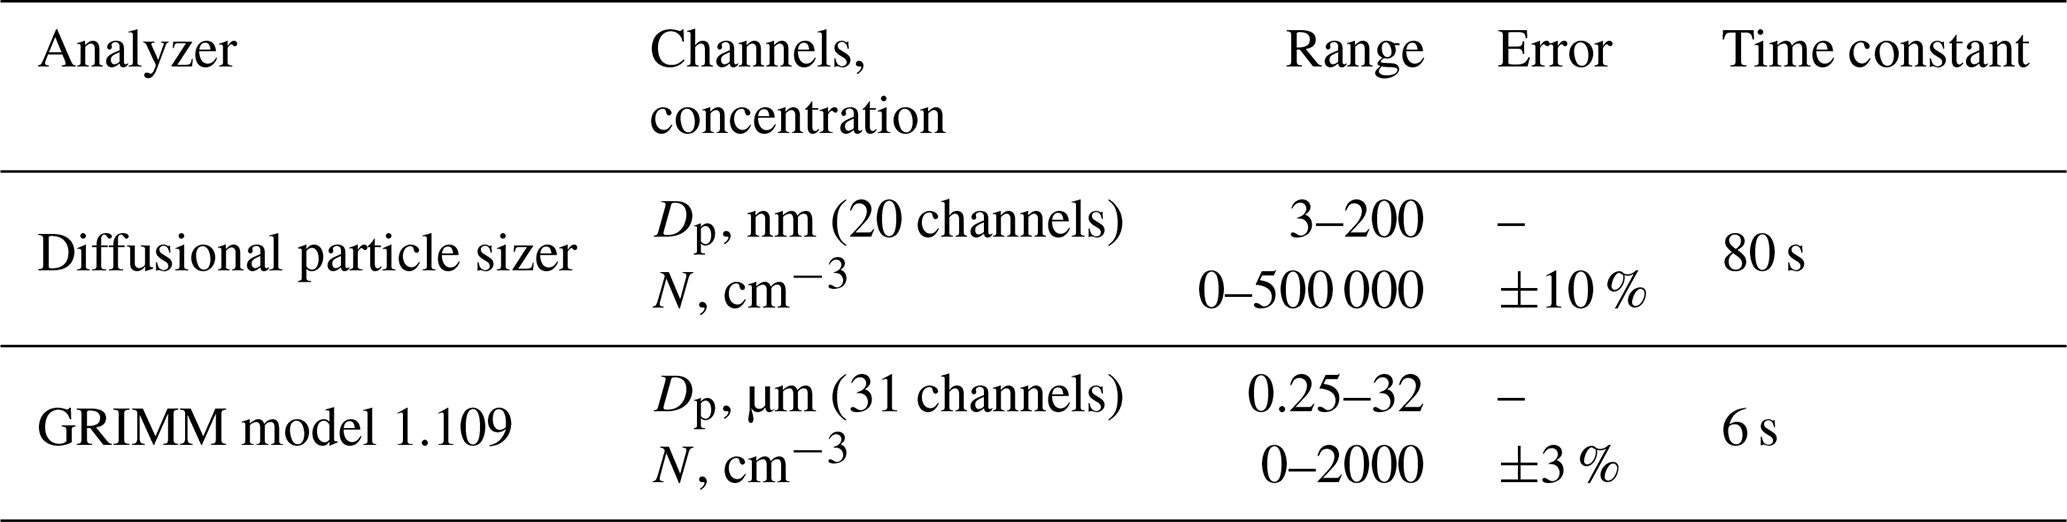
Technical characteristics of the gas analysis system are given in Table 1.
2.2 Aerosol system
The aerosol system consists of several devices for determination of the disperse and chemical composition of particles, as well as their optical characteristics.
2.2.1 Devices for measurement of the particle size distribution
To study the vertical structure of the aerosol particle size distribution, two types of devices were installed on board the Optik Tu-134 aircraft laboratory: diffusional particle sizer (DPS), which allows retrieval of the nanoaerosol particle number distribution in the size range from 3 to 200 nm in 20 size intervals, and the Grimm model 1.109 aerosol laser spectrometer (Grimm Aerosol Technik GmbH & Co., Germany) designed for measurement of the aerosol particle number density in the size range from 0.25 to 32.0 µm (Fig. 3) (Arshinov et al., 2007; Paris et al., 2009b).
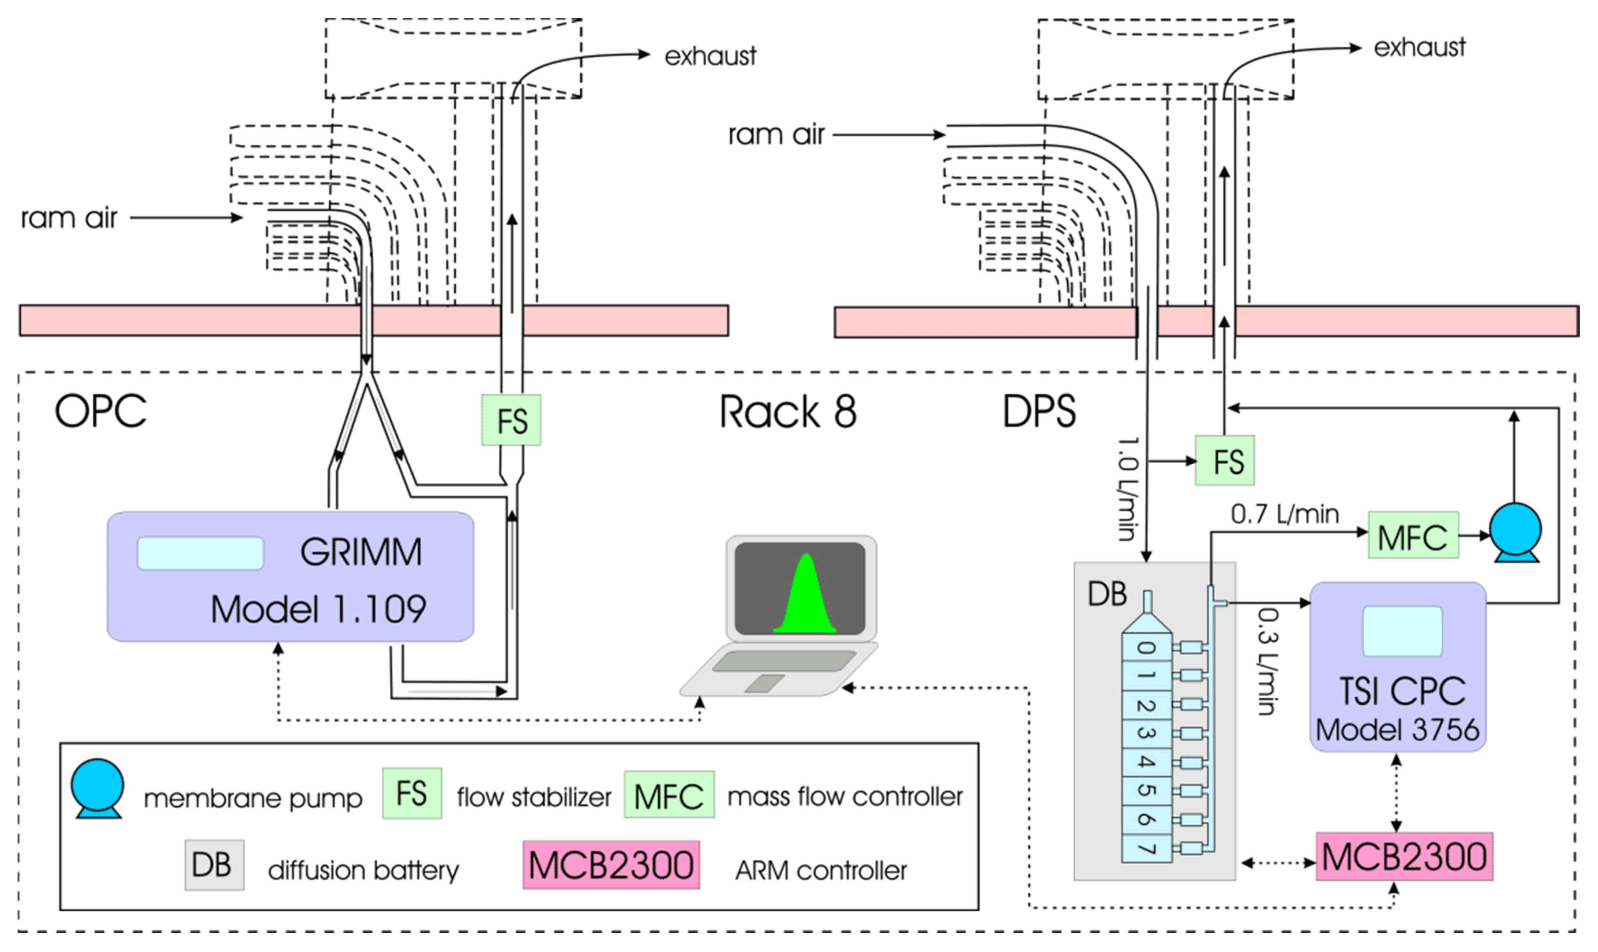
Figure 3Schematic diagram of the instrument suite for particle counting and sizing: solid lines – air ducts; dashed lines – communication cables.
DPS consists of an eight-section diffusion battery (DB) of mesh type (manufactured by the Institute of Chemical Kinetics and Combustion SB RAS) (Ankilov et al., 2002; Reischl et al., 1991) and CPC model 3756 condensation particle counter (TSI Inc., USA). The particle size separation principle is based on the size dependence of the diffusion coefficient of nanoparticles. Particles of different sizes have different deposition rates when passing through porous media (smaller particles are removed from the air flow faster). Thus, the coefficient of passage of particles through such a medium bears information about the particle size. The particle number density is measured sequentially at the exit of each DB section with the CPC model 3756 condensation particle counter. After every scan of all DB sections, the size spectrum is retrieved by the algorithm developed by Alexander Ankilov and Sergei Eremenko (Eremenko and Ankilov, 1995), which was chosen by TSI as the basic software for DPS diffusion classifier (Knutson, 1999). The use of the WCPC 3756 condensation particle counter having the response time <2 s has allowed us to obtain the entire nanoparticle size distribution for 80 s.
The Grimm model 1.109 laser aerosol spectrometer allows the aerosol particle number density to be measured in 31 size intervals: 0.25, 0.28, 0.3, 0.35, 0.4, 0.45, 0.5, 0.58, 0.65, 0.7, 0.8, 1.0, 1.3, 1.6, 2, 2.5, 3, 3.5, 4, 5, 6.5, 7.5, 8.5, 10, 12.5, 15, 17.5, 20, 25, 30, and 32 µm. Its operating principle is based on the dependence of the scattered radiation intensity on the particle size. The pulse repetition frequency at the known air flow rate makes it possible to determine the number concentration of particles in the air.
Taken together, both spectrometers form a single aerosol system capable of covering the size range from 0.003 to 32 µm with a good resolution.
The connection of the above devices to the inlet and outlet branch pipes of the air intake is shown schematically in Fig. 3. An inlet pipe ∅=7.5 mm (outlet ∅=16 mm) is used to deliver aerosol particles in the size range of 0.3–20 µm, and nanoaerosols in the size range of 3–200 nm are measured with inlet and outlet ∅=11 and ∅=28 mm, respectively. The supply lines have a bypass channel to avoid excessive pressure drop between the air inlets and outlets of the devices and to minimize the diffusion losses of nanoparticles in the supply lines. To diminish the effect of electrostatic deposition of aerosols, electrically conductive silicone tubes were chosen as supply lines. To reduce the inertial losses of large aerosol particles, the Grimm model 1.109 aerosol spectrometer is placed as close as possible to the intake device on aspiration rack 8 (Fig. 1). Technical characteristics of the diffusion and laser aerosol spectrometers are given in Table 2.
Table 2Technical characteristics of the aerosol system (disperse composition).
2.2.2 Equipment for measurement of black carbon and aerosol scattering
To measure the content of absorbing substance (black carbon), two devices were used on board the aircraft laboratory, namely the AE33 serial Aethalometer and MDA-2 developed in V.E. Zuev Institute of Atmospheric Optics. In this case, the measured characteristic is equivalent black carbon, as indicated in Petzold et al. (2013). In its operating principle, MDA-2 is analogous to the device of the Aethalometer type developed by Hansen et al. (1984). Its operation is based on continuous measurements of the diffuse attenuation of radiation by a layer of aerosol particles directly in the process of their deposition on the filter from the pumped air. In this case, the value of the recorded diffuse attenuation of light by the layer of particles is directly proportional to the black carbon (eBC) surface concentration on the filter and, consequently, to its mass concentration in the air. In the MDA-2 Aethalometer, the ambient air flow enters the optical cell of the device through a hose with an inner diameter of 8 mm and a length of about 2 m; the average intake capacity is 4 L min−1. With these parameters of the airline, coarse aerosol particles larger than 1 µm are mainly deposited in the inlet hose. Thus, the Aethalometer mostly records the content of the BC component only in the submicron aerosol fraction.
In total, the optical range of the light sources is 460, 530, 590, and 630 nm. The test air is pumped through the filter section in the measuring channel, and a layer of eBC particles accumulates on it, causing the filter to blacken. The filter section in the reference channel is not “exposed” during measurements and remains clean. The signal converter operates by the differential scheme and continuously measures the signal difference between the measuring and reference channels during the filter blackening with the deposition of particles. Knowing the intake time and the air flow through the device Vt (L min−1), the mass concentration can be determined as Ms (µg m−3) ), where Sf (cm2) is the area of the aerosol filter, dt (min) is the exposure time, and K (cm2 µg−1) is the calibration constant for the specific design of the device; this constant determines the relation of the surface BC mass concentration on the filter to the attenuation. The device measures ATN , which characterizes the optical attenuation of radiation by the layer of particles (“diffusion” optical depth). I0 is the signal recorded in the measuring channel at the start of every sampling cycle, and dI is the measured difference between the signals at the start and the end of measurements as accumulated for the particular cycle dt (min). The more detailed description can be found in Kozlov et al. (2008).
The absolute calibration of the Aethalometer was based on the comparison of the data of synchronous optical and gravimetric measurements of BC aerosol (Baklanov et al., 1998). During the calibration, BC particles with a size of 50–200 nm were used, which were formed in the pyrolysis of butanol vapors in a nitrogen atmosphere at a temperature of 1150 ∘C.
Before the start of the flights, the AE33 and MDA-2 were intercalibrated. The intercalibration showed that the concentrations measured by these two devices differ on average by no more than 5 %–7 % at different generation modes used to construct the calibration characteristics of the device.
FAN-M nephelometer
The scattering properties of the atmosphere were studied with a FAN-M automated nephelometer designed to measure the coefficient of directional scattering of radiation at the scattering angle of 45 μd (φ=45∘) (Mm−1 sr−1) at a wavelength of 0.53 µm. The volume scattering coefficient was estimated by the empirical relationship (45∘) (Mm−1) (Panchenko et al., 2019). The nephelometer is calibrated in every flight against molecular (clean) air at different altitudes. For this purpose, outboard air is passed through a set of three to four AFA filters before coming to the device. This set of filters completely deposits the aerosol component of atmospheric air on the filtering material.
Technical characteristics of the Aethalometer and nephelometer are given in Table 3.
Table 3Technical characteristics of the Aethalometer and nephelometer.

2.2.3 Sampling devices
Three kinds of sampling were used in the experiment. Correspondingly, three sampling systems were made. Two of them are designed to determine the organic and inorganic components of aerosol particles. They are based on particle sampling onto filters. This method is traditional and has been described many times in the literature (Peregud and Gorelik, 1981). These two systems differ in the number of filters and the air flow rate through the filter.
The situation with sampling of bioaerosols is more complicated. For this purpose, a separate unit was designed and manufactured. Sampling was carried out in MTS-50 impingers manufactured by the Experimental Design Bureau of Fine Biological Engineering, Kirishi, Russia.
The device is made of stainless steel with a critical nozzle that ensures a constant air flow through the device at a pressure drop of more than 4 × 10⁴ Pa. The required pressure drop was provided by the pressure difference of the flow on the air intake during the aircraft movement and the pressure overboard. Particles are deposited into the liquid swirling along the device walls by the incoming flow (with a flow rate of 50 ± 5 L min−1). A total of 50 mL of colorless Hanks solution (ICN Biomedicals) is used as the sorbing liquid. The deposition efficiency of this device for aerosols larger than 0.3 µm (the minimum size of most known bacteria) exceeded 80 %, while that for particles more than 2 µm in diameter was equal to an almost constant value of 90 ± 15 %. To eliminate the loss of aerosol particles in the connecting tubes, the impingers are located near the isokinetic sample intake.
In addition, the setup for sampling the inorganic component also served for bioaerosol sampling for the following analysis. Bioaerosol was sampled onto AFA-HA-20 filters for subsequent analysis of the total protein mass on the filter and/or analysis of genetic material of various origins in a sample.
2.3 Lidars
During the flight campaign, the aircraft laboratory operated two onboard lidars: LOZA–A2 and CE-372NP. The lidar data were used to retrieve optical characteristics of the atmospheric environment (aerosol) and sea water. For the atmosphere, the following profiles were measured: profile of the aerosol backscattering coefficient for wavelengths of 532 and 1064 nm, profile of the index of radiation depolarization at aerosol particles, and profile of the accumulated aerosol optical depth (possible only when measuring in the dark). For the sea water, the measured characteristics are the extinction coefficient in water in the range 0.07–0.6 m−1 at a wavelength of 532 nm and the relative concentration of phytoplankton by laser-induced fluorescence (LIF) of chlorophyll a at a wavelength of 680 nm (the concentration can be determined at the calibration against in situ measurements).
The technical characteristics of the both lidars are described in sufficient detail in the scientific literature (Ancellet et al., 2019; Mariage et al., 2017; Nasonov et al., 2020). Therefore, here we dwell only on the modernization of the LOZA-A2 lidar to fulfill the tasks of this large-scale experiment on sensing the sea surface. This modernization has allowed us to measure the turbidity of the upper water layer and to estimate the content of organic matter in it. The external view of the LOZA-A2 lidar transceiver on board the aircraft is shown in Fig. 4a.
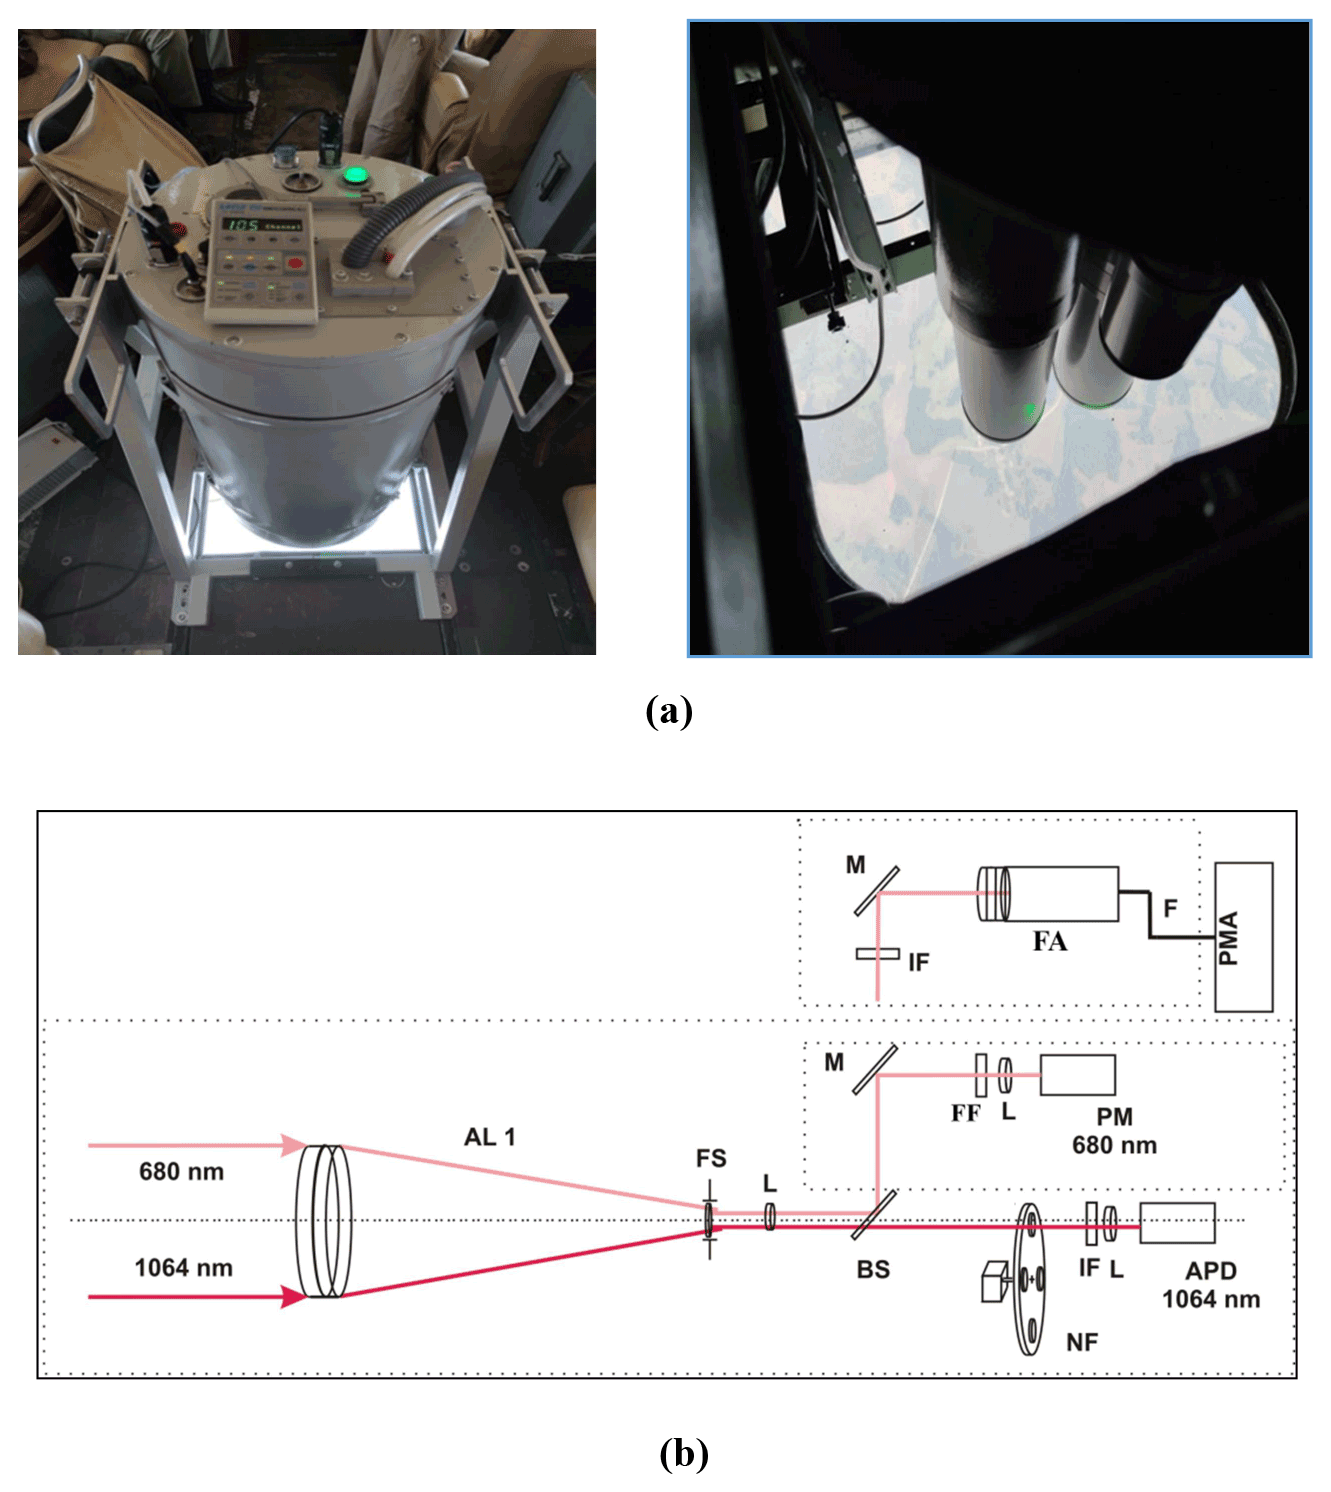
Figure 4Photo (right) of the 680 fluorescent channel unit built in the lidar (a) and the optical arrangement of the lidar with fluorescent channels (b).
The modernization included modification of the optical scheme of the transceiver, without changing the lidar bearing structure, and the addition of special photodetector units that allow us to record LIF both in a narrow spectrum of selected wavelengths (with a central line at 685 and 740 nm) of received radiation and in a wide spectrum from visible (≥550 nm) to near infrared (≤1000 nm).
For this purpose, the receiving objective (AL1 in Fig. 4b) was replaced in the channel for recording lidar signals at a wavelength of 1064 nm. The newly developed achromatic double-lens objective with a light aperture A=110 mm and a focal length f=550 mm allows elimination of chromatic aberrations and the correct recording of signals in a wide spectrum of wavelengths from the visible to the near-IR region. Optical units, which separate the received radiation at the LIF wavelengths from the axial channel recording the elastic scattering signal at a wavelength of 1064 nm, are added to the main channel. A BS dichroic mirror (DMLP900R, Thorlabs GmbH, Germany) in Fig. 4 set at an angle of 45∘ to the main optical axis splits the received spectrum, reflecting 92 % in the range 400–900 nm and transmitting 90 % in the range 930–1300 nm. Metal mirror M with silver coating (PFR10-P01, Thorlabs GmbH, Germany) diverts the reflected light flux to the FF fluorescent filter (86-988 – OD 6, central wavelength of 680 nm, bandwidth of 20 nm, Edmund Optics, USA). Then the cut-out band at these wavelengths is focused by lens L onto the photocathode of the recording PM 680 photodetector (H11526-20-NF, Hamamatsu Photonics K.K., Japan). The fluorescent filter can be quickly replaced with a wider filter (87-757 – OD 6, central wavelength of 700 nm, bandwidth of 75 nm, Edmund Optics, USA). This allows us to record LIF signals from different photosynthetic pigments of the phytoplankton community at fixed wavelengths by the high-sensitivity gated photodetector in the analog mode.
The 680 nm fluorescent channel is made as a separate unit and can be replaced without disturbing the optical alignment of the entire lidar. As a result, the optical unit for simultaneous recording of a wide range of LIF wavelengths in the received radiation can be quickly installed in the lidar. The optical scheme of this unit is shown in Fig. 4 (top panel). In this unit, an FA optical matching adapter is set instead of the FF fluorescent filter and the PM 680 photodetector. The double chromatic lens focuses the received radiation at the end face of fiber F (optical fiber diameter ≤1 mm). The optical fiber from the lidar is connected to the PMA multichannel spectrum analyzer (PMA-12, C10027-01, Hamamatsu Photonics K.K., Japan). An IF cutoff filter (FELH0550 long-wavelength filter, cutoff wavelength of 550 nm, Thorlabs, Germany) is additionally installed in this unit. The IF filter blocks the second-harmonic laser wavelength at 532 nm. The use of the PMA-12 spectrometer for LIF analysis allows us to record the spectrum of decaying fluorescence of chlorophyll a contained in all plants in the dark, as well as to analyze the spectra of radiation reflected from the underlying surface.
2.4 PSR-1100f spectroradiometer
The PSR-1100f spectroradiometer (hereinafter referred to as PSR-1100f) allows measurements of incoming/absorbed radiation in the visible and near-IR spectral regions. The receiving unit of the spectroradiometer is a cross-correlation cell of the Čzerny–Turner configuration, in which a rifled diffraction grating is used as a dispersing element. The light flux enters the spectrometer and is collimated before being reflected from the grating and refocused onto the PDA detector. The detector is an array of 512 elements covering the spectral range 320–1100 nm. It has a built-in microprocessor that controls the data acquisition by the detector array and the interface with the host computer, as well as provides data storage. The stored data consist of the calibration data (in flash memory), current dark and reference scan data (in RAM memory), and current spectrum scan data (also in RAM memory). The microprocessor also performs mathematical operations on the scanned data, such as dark signal subtraction and auto integration adjustment. The PSR-1100f has a built-in shutter for dark measurements.
Technical characteristics of PSR-1100f are
-
spectral range – 320–1100 nm;
-
nominal spectral resolution – ≤3.0 nm;
-
spectral bandwidth – 1.5 nm;
-
accuracy of wavelength determination – 0.5 nm;
-
wavelength reproducibility – 0.1 nm;
-
integration time – 8–2000 ms;
-
built-in memory – up to 2500 spectra.
The measurements are carried out in the flying aircraft with the protective shutters open. These shutters protect the hatches from adverse factors during the aircraft parking, takeoff, and landing. In flight, the PSR-1100f is controlled by the software installed on the host computer via Bluetooth interface.
2.5 CompaNav-5.2 IAO integrated inertial system
The CompaNav-5.2 IAO navigation system was developed and created specially for flights in the Arctic in addition to the existing navigation system of the Tu-134 aircraft. The CompaNav-5.2 IAO strapdown inertial navigation system (INS) is designed to determine the coordinates of location, motion parameters, and orientation angles of an aerial or ground vehicle. INS is based on Russian-made fiber-optic gyroscopes and MEMS accelerometers. CompaNav-5.2 IAO includes a GPS/GLONASS Ublox NEO-8M receiver as an additional source of navigation information. The technical characteristics are given in Table 4.
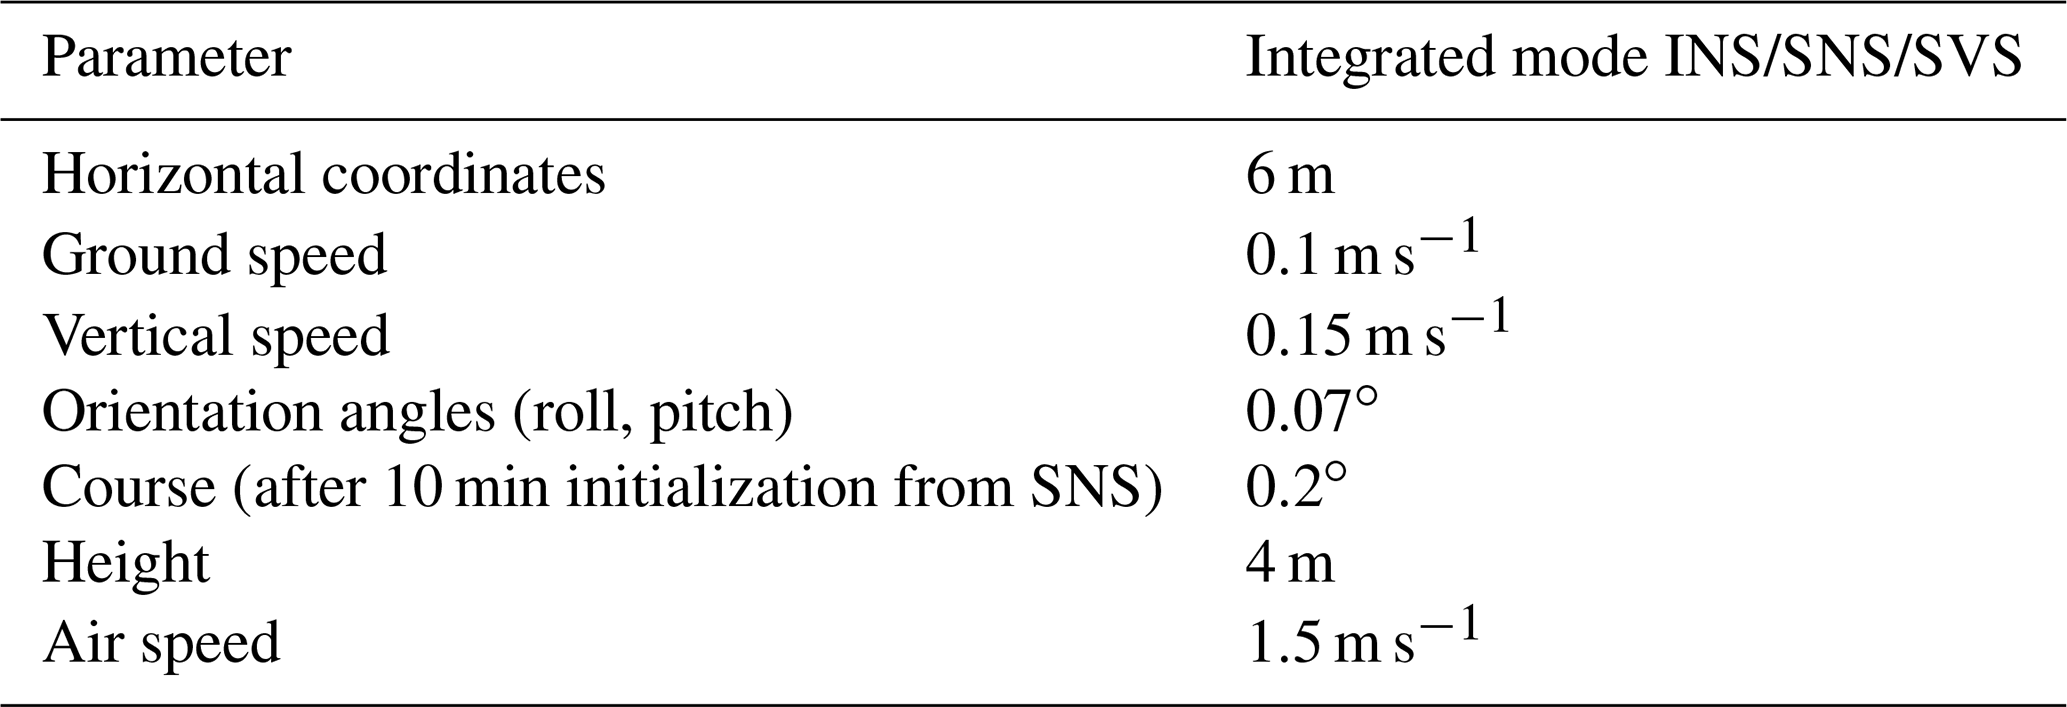
CompaNav-5.2 IAO on aerial vehicles operates in two modes: integrated inertial-satellite mode (in the presence of a high-quality signal) or autonomous mode with correction from the air signal system (in the absence or uncertain reception of a satellite signal). The built-in GLONASS/GPS receiver is used as a source of satellite signal. CompaNav-5.2 IAO INS provides the continuous navigation support in case of prolonged (1 h or more) loss of satellite signal. The advantages of the CompaNav-5.2 IAO INS over the previously used navigation system are compactness (CompaNav-5.2 IAO weight of 6 kg), positioning accuracy (three decimal places), low power consumption, and the number of motion and positioning parameters determined (35 versus 5).
The inclusion of this device in the instrumentation of our aircraft laboratory has allowed us not only to measure navigation characteristics more accurately, but also to determine the speed and direction of the actual wind, as well as its vertical component during the flight. Most operating flying laboratories do not have such devices.
2.6 Meteorological system
The meteorological system of the aircraft laboratory allows measurement of the following parameters: air temperature (∘C), temperature of complete deceleration (∘C), relative air humidity (%), and atmospheric pressure (mm Hg) (Anokhin et al., 2011; Antokhin et al., 2012).
Upon CompaNav-5.2 IAO INS being installed at the Optik aircraft laboratory, it became possible to determine the wind speed (m s−1) through calculation and wind direction (∘). The wind speed and direction are determined with the use of a navigation triangle.
3.1 Flight routes
Flights in the Russian sector of the Arctic were carried out from 4 to 17 September of 2020. The route map of the experiment is shown in Fig. 5. Vertical profiles were collected from the minimum permissible heights (typically 500 m above ground level and 200 m above seas) to the upper troposphere. The flights were carried out over all seas of the Russian sector of the Arctic and coastal territories. Horizontal sections of the flight were performed at three altitudes: 200, 5000, and 9000 m. In these sections, aerosol samples were taken and the spatial homogeneity in the distribution of gas components and meteorological parameters was investigated. Four vertical profiles were measured over each of the seas.
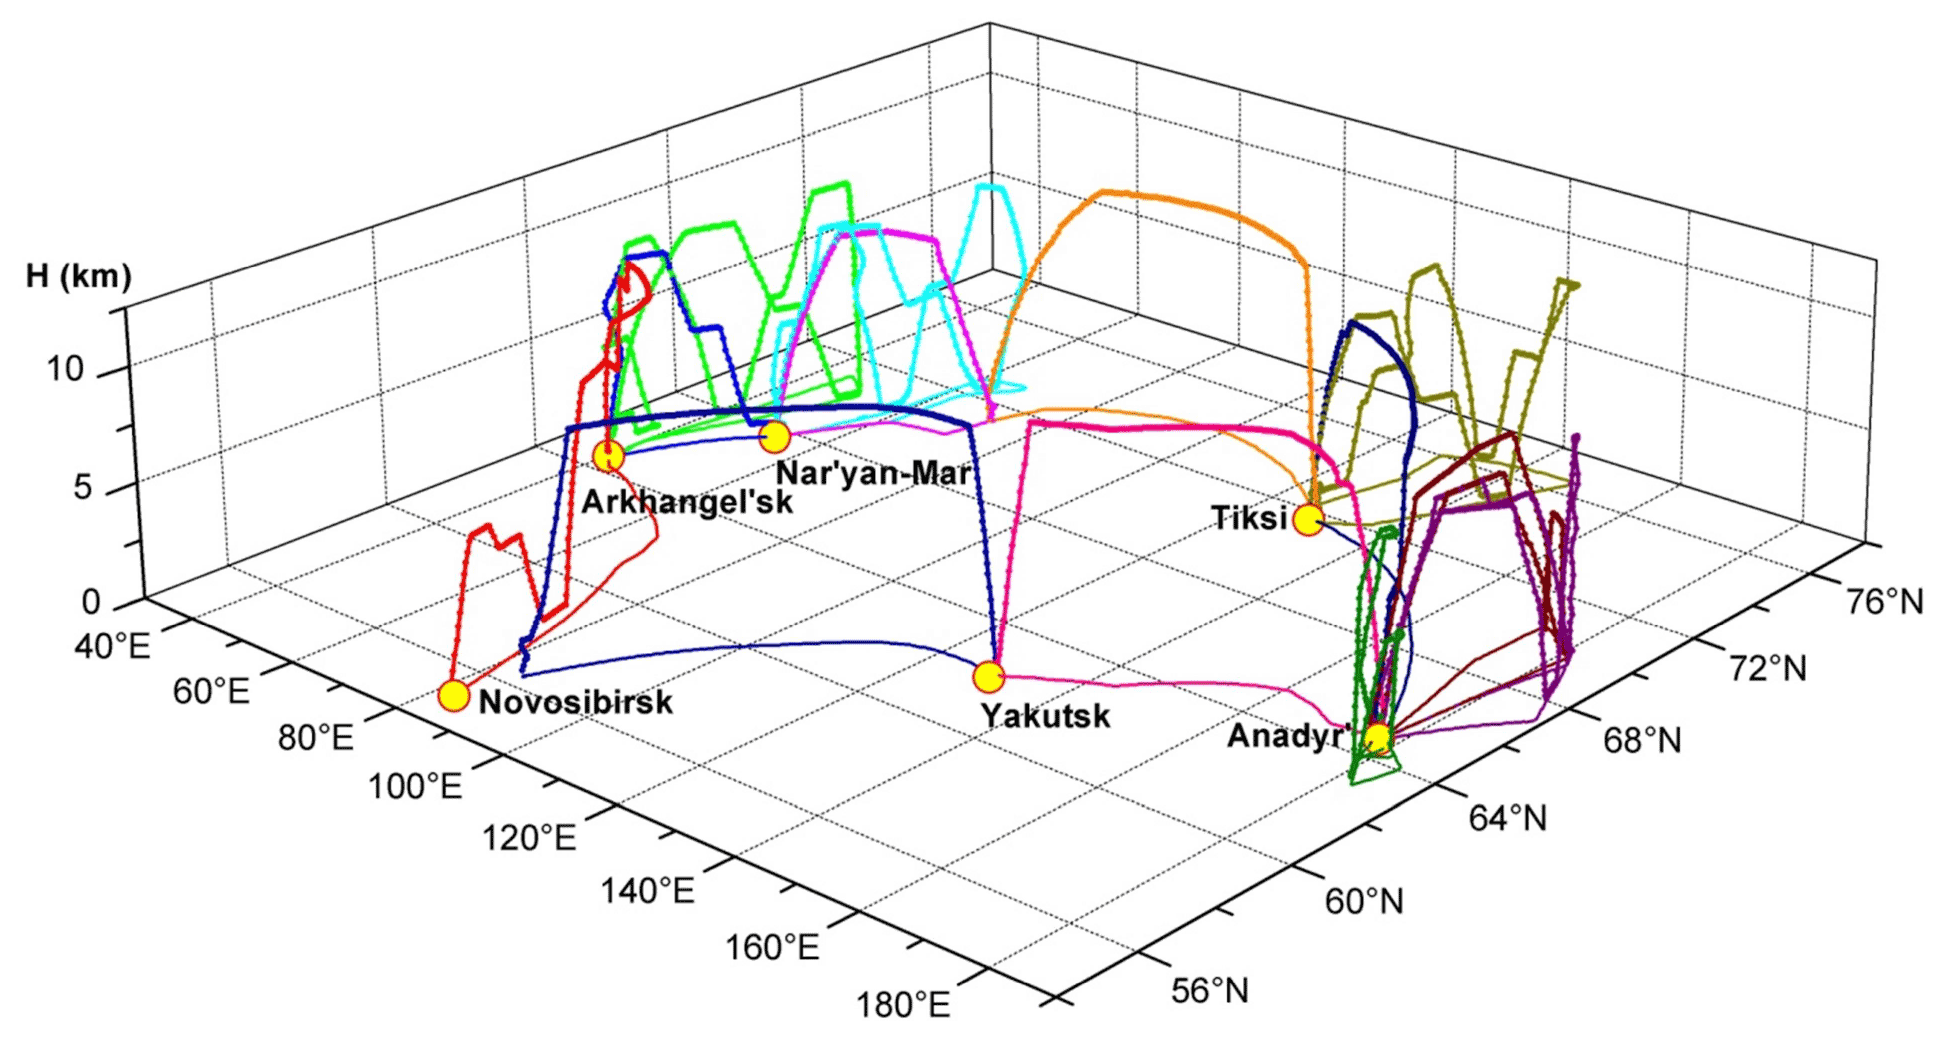
Figure 5Schematic map of the routes of the Optik Tu-134 aircraft laboratory in the regions of the Russian Arctic.
The experiment started with the Novosibirsk–Arkhangelsk flight on 4 September 2020. The sensing over the Barents Sea was carried out on the same day. The Arkhangelsk–Naryan-Mar flight took place on 6 September 2020. On the same day, a flight to the water area of the Kara Sea was made. On 7 September, a flight was carried out on the Naryan-Mar–Sabetta–Tiksi route. The flight over the waters of the Laptev Sea was performed on 9 September. The Tiksi–Anadyr flight took place on 11 September 2020. Initially, we planned to carry out flights over the East Siberian and Chukchi seas from the Pevek airport. However, this airport was closed for repairs during the experiment. Therefore, the flights started from Anadyr, which reduced the possibility of covering a significant part of the sea area due to the large flight distance. The first flight was made to the Chukchi Sea on 15 September 2020, as the clouds over the East Siberian Sea were below 150 m. Flights over the East Siberian and Bering seas were carried out on 16 September. The experiment ended with the Anadyr–Yakutsk–Tomsk flight on 17 September 2020.
3.2 Synoptic situation in the flight area
The flight from Novosibirsk to Arkhangelsk on 4 September passed along the periphery of the anticyclone. The flight over the Barents Sea on the same day was carried out in the transition zone between the cyclone and anticyclone (Fig. 6a). Weather conditions were typical for a moderate air mass.
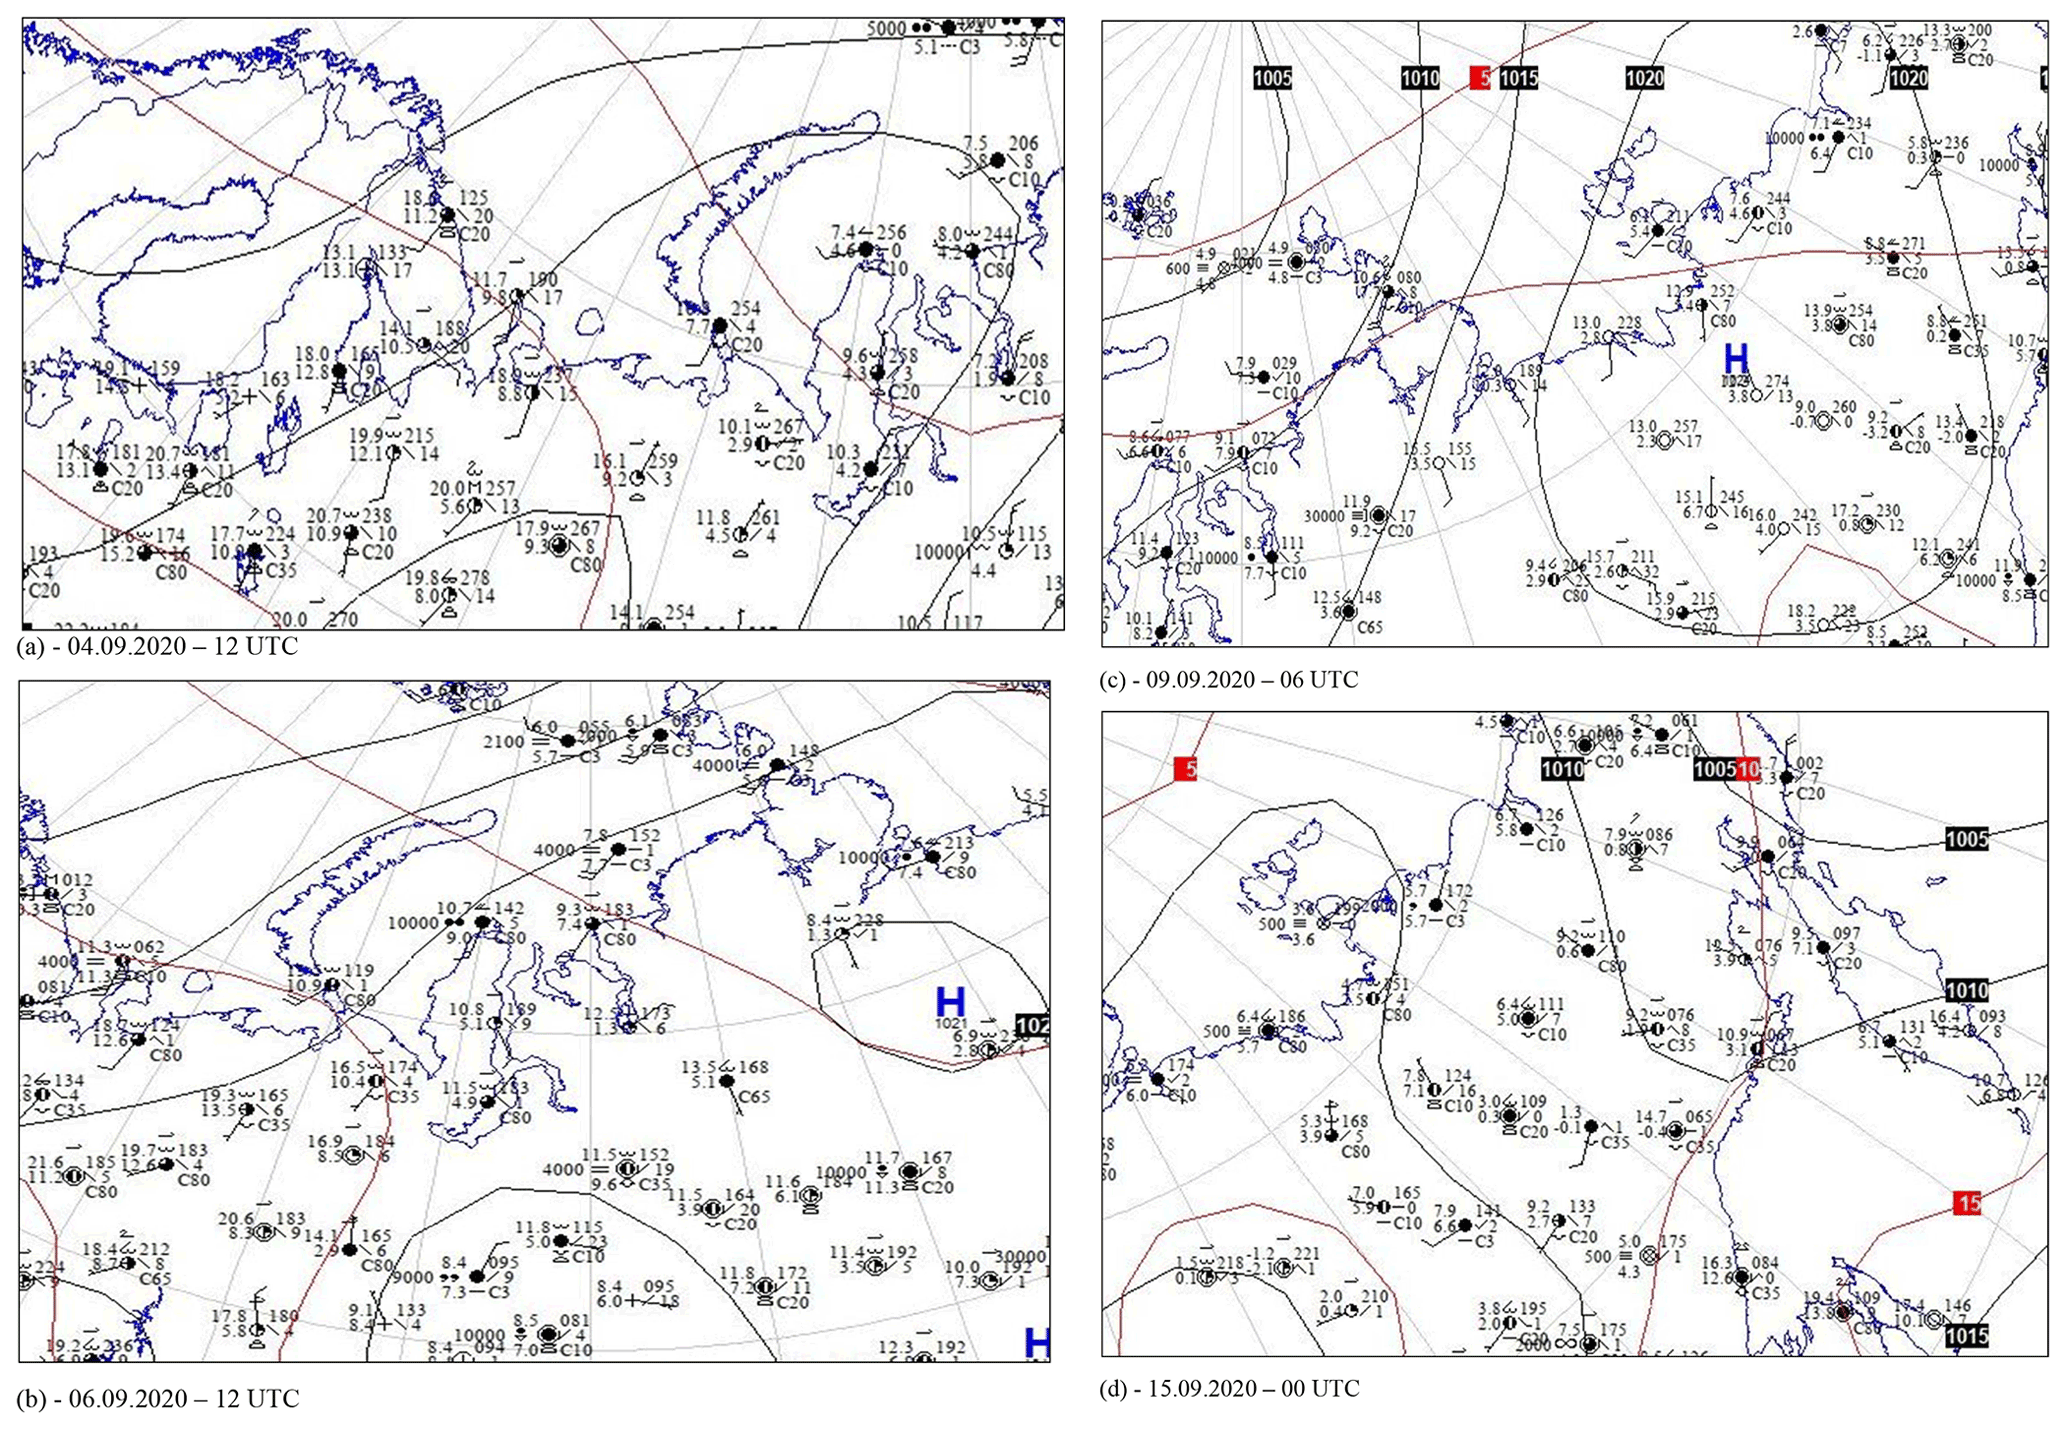
Figure 6Surface weather maps for 4–17 September 2020. UTC time and date are given in the appropriate box.
During the flight from Arkhangelsk to Naryan-Mar and to the Kara Sea on 6 September, the weather conditions were determined by a multicenter cyclone (Fig. 6b). The centers were located over the northern part of the Atlantic Ocean and the Arctic seas. The air mass was moderate as well.
The Naryan-Mar–Sabetta–Tiksi flight was carried out on 7 September and took place under cyclonic conditions, first in moderate and then in Arctic air masses.
On 9 September, the measurements were conducted over the Laptev Sea. In the Tiksi takeoff and landing area, weather conditions were determined by the northwestern periphery of the anticyclone and further north by a powerful cyclone occupying most of the Arctic (Fig. 6c).
During the flight on 11 September from Tiksi to Anadyr, a low-gradient high-pressure field was observed along the entire route. The temperature and humidity conditions were determined by the arctic air mass.
On 15 and 16 September, during the measurements over the Chukchi and East Siberian seas, the weather was determined by the northern part of the cyclone centered over the Bering Sea (Fig. 6d). On 16 September, when the measurements were conducted over the Bering Sea, the weather conditions were determined by the cyclone centered over Cape Dezhnev.
In the experiment, we have obtained a huge amount of data. This section presents tentative results of processing of the measured data.
4.1 Gas composition
Since global warming is mainly associated with a change in the gas composition of the atmosphere, we start our consideration from the analysis of the vertical distribution of greenhouse gases.
It is known (Watson et al., 2020) that the ocean absorbs up to 25 % of carbon dioxide additionally emitted by anthropogenic activities. The high absorption capacity of the ocean may be reflected in our experiment. It can be seen from Fig. 10a that the carbon dioxide concentration decreases noticeably in the lower part of the profiles related to the atmospheric boundary layer (ABL). The CO2 content in ABL over the sea areas in the measurement period was lower than that over coastal areas, as can be seen from the comparison of panels a and b in Fig. 7.
The difference in CO2 sinks over different seas is clearly visible. If we estimate it as the difference between concentrations at the ABL top and at a level of 200 m from the water surface, then it is the largest over the Barents and Kara seas. Here the vertical gradient reaches 14 ppm. For the Laptev and Chukchi seas, it is much smaller and equal to 4 ppm. Over the East Siberian Sea, the CO2 content even grows in the boundary layer. However, this is caused by the transport from the American continent. This can be clearly seen from the back trajectories constructed to a height of 200 m (Fig. 9).
The CO2 concentrations obtained experimentally over the Arctic seas are far higher than those published earlier (Cassidy et al., 2016; O'Shea et al., 2014; Strachan et al., 2015). Despite the absorption by the ocean, this is a result of increasing atmospheric concentrations of carbon dioxide around the world.
The next contributor to radiation forcing is methane. As a long-lived greenhouse gas, its effect does not depend on location. However several poorly known sources are located in the Arctic. The importance of studying the dynamics of these Arctic sources to the atmosphere has increased sharply in recent years in connection with the degradation of permafrost. The fact of the presence of high CH4 concentrations over this region was established both in near-surface measurements (Ivakhov et al., 2020; Poddubny et al., 2020) and in the entire tropospheric thickness according to satellite data (Bogoyavlensky et al., 2020; Sitnov and Mokhov, 2018). However, opinions regarding the mechanisms of formation of this phenomenon differ.
The methane inflow directly from the ocean surface into the atmosphere was analyzed by numerical simulation on the basis of direct measurements. The analysis showed that this amount of CH4 is insufficient for the formation of the observed concentrations (Berchet et al., 2016, 2020; Li et al., 2020).
Extra methane may come from the decomposition of gas hydrates on the ocean floor. This phenomenon was observed, in particular, during measurements from sea vessels (Sapart et al., 2017; Shakhova et al., 2010; Steinbach et al., 2021). The scale of the threat from the decomposition of gas hydrates has been largely debated (Thornton et al., 2020; Nisbet et al., 2020; You et al., 2019). The contribution from this source in the synthesis of Saunois et al. (2016) is thought to represent less than 1 % of annual emissions.
Methane can be transported to the Arctic Ocean from the surrounding land (Bozem et al., 2019; Makosko and Matesheva, 2020) or produced in situ in the water column. The Arctic receives carbon-rich riverine influx as well as water masses from the more southern oceans, which carry additional microbes and bacteria (Alekseev et al., 2019). They, in turn, can produce some additional methane, which is then released into the atmosphere (Babin, 2020; Lewis et al., 2020). The process of methane (and other gases) transport to the Arctic turned out to be so significant and poorly understood that the German Aerospace Agency has organized a special HALO-AC program, in which three flying laboratories will simultaneously study this process at different altitudes (Wendisch et al., 2021).
The other possible way is the emission from aquatic ecosystems including coastal ecosystems, lakes, and wetlands, where the warming climate leads to intense decomposition of permafrost being a huge reserve of organic matter, which is processed by anaerobic microorganisms into methane or carbon dioxide (Anisimov et al., 2020; Elder et al., 2020; Marushchak et al., 2016). The reserves of organic matter are so large that in Brouillette (2021) they are called a “buried carbon bomb”, which can explode with further warming in the region. In addition to the methane release from the soil as a result of permafrost thawing, thermokarst lakes are formed in such areas.
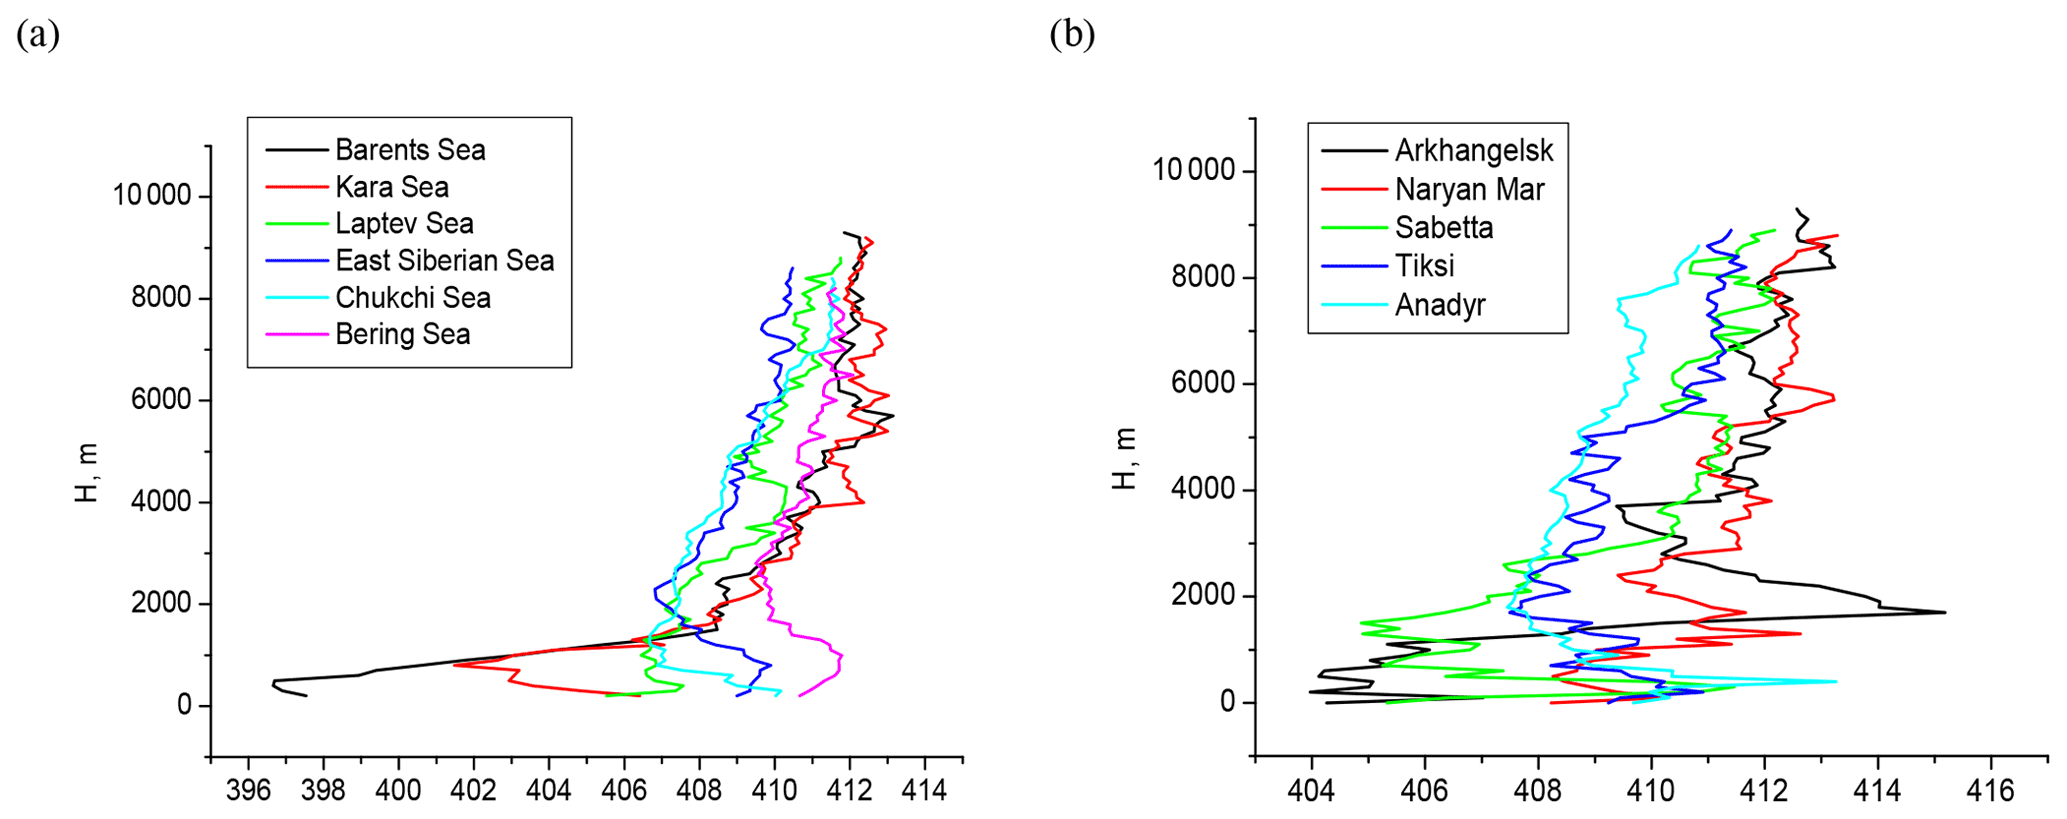
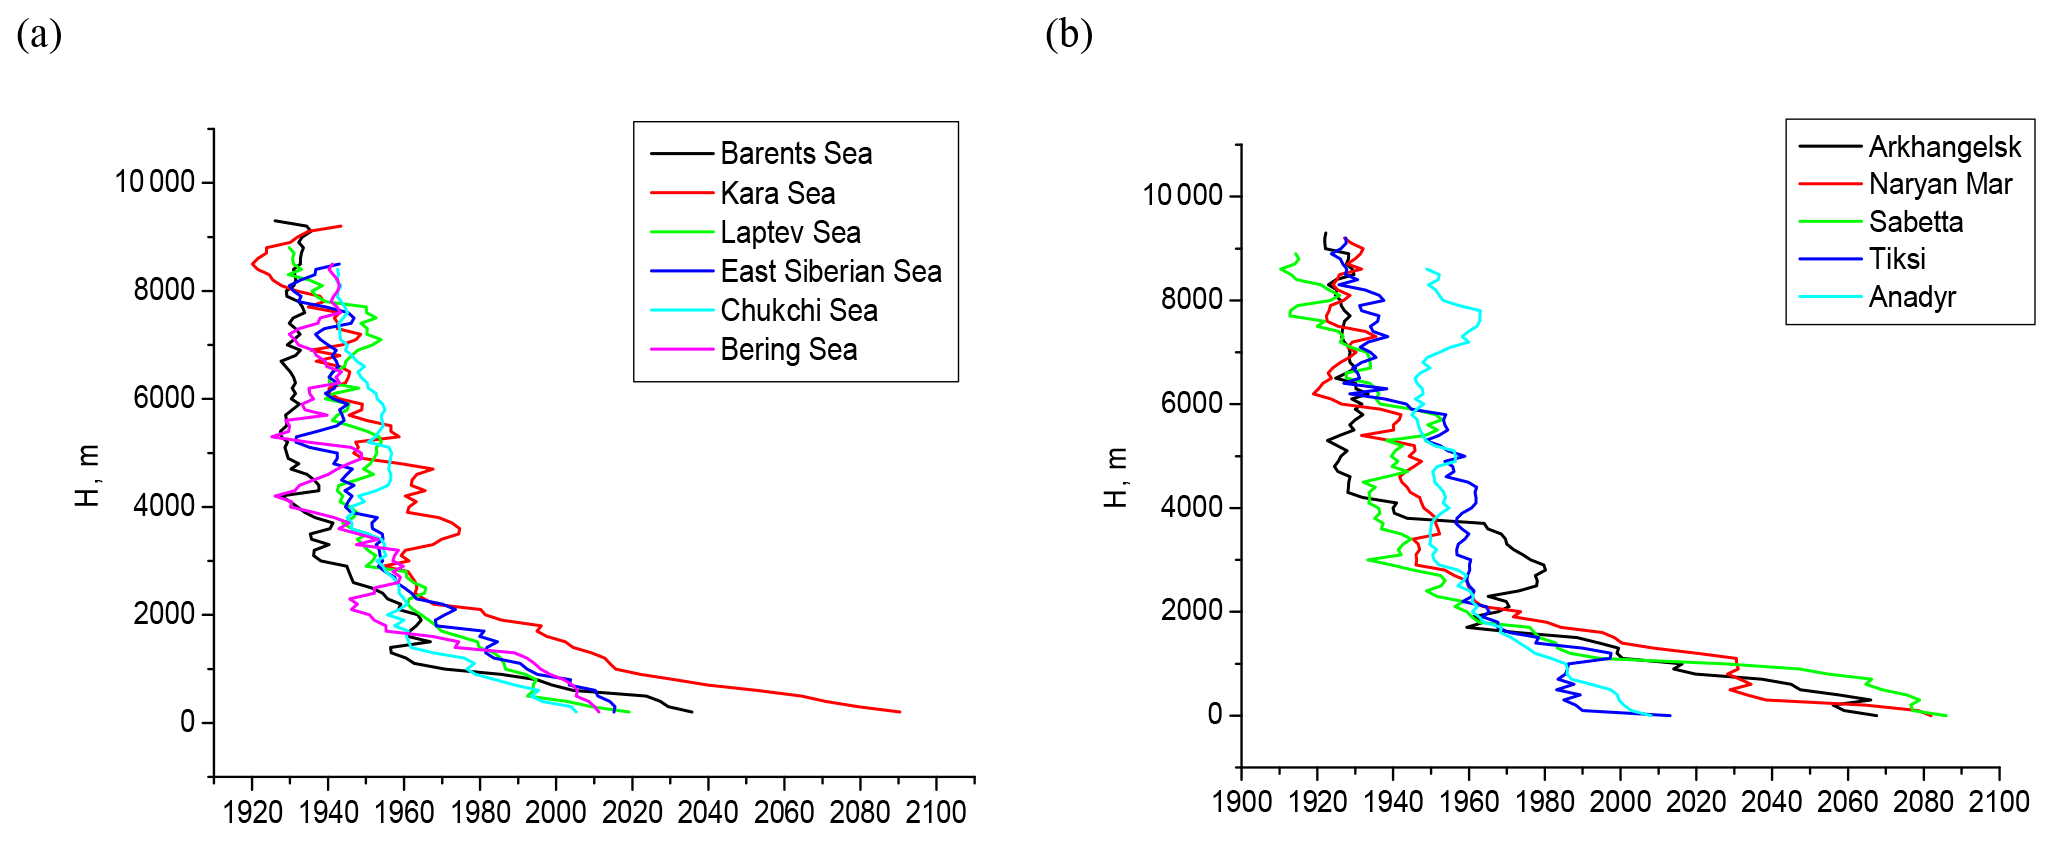
Our measurements show that, as expected, elevated methane concentrations are observed over the Arctic seas (Fig. 8).
The recently published review on the methane budget in the atmosphere (Saunois et al., 2020) although clarifies the orders of magnitude of individual sources for the planet as a whole, but it does not answer the question on the reasons for the accelerated increase in the CH4 concentration over the Arctic compared to other latitudes.
In contrast to CO2, mixing ratios of CH4 over the Arctic seas decreased with height. Thus, the lowest carbon dioxide concentrations were observed in the near-water layer over the Kara (406 ppm) and Barents seas (399 ppm). The methane concentrations there, to the contrary, were the highest and equal to 2092 and 2071 ppb, respectively (Fig. 8a). Over the other studied seas, the methane content in near-water layer was nearly identical and equal to 2018–2022 ppb. In a free atmosphere, the methane concentrations over all the seas differ slightly and fall in the range of 1920–1960 ppb. To be noted is the fact that the CH4 concentration of air in the coastal areas is comparable (Fig. 8b) with the adjacent water areas (Fig. 8a). In our opinion, this indicates the methane transport from land to sea. This conclusion is, in principle, clear from the above synoptic maps (Fig. 6) and follows from the constructed back trajectories (Fig. 9).
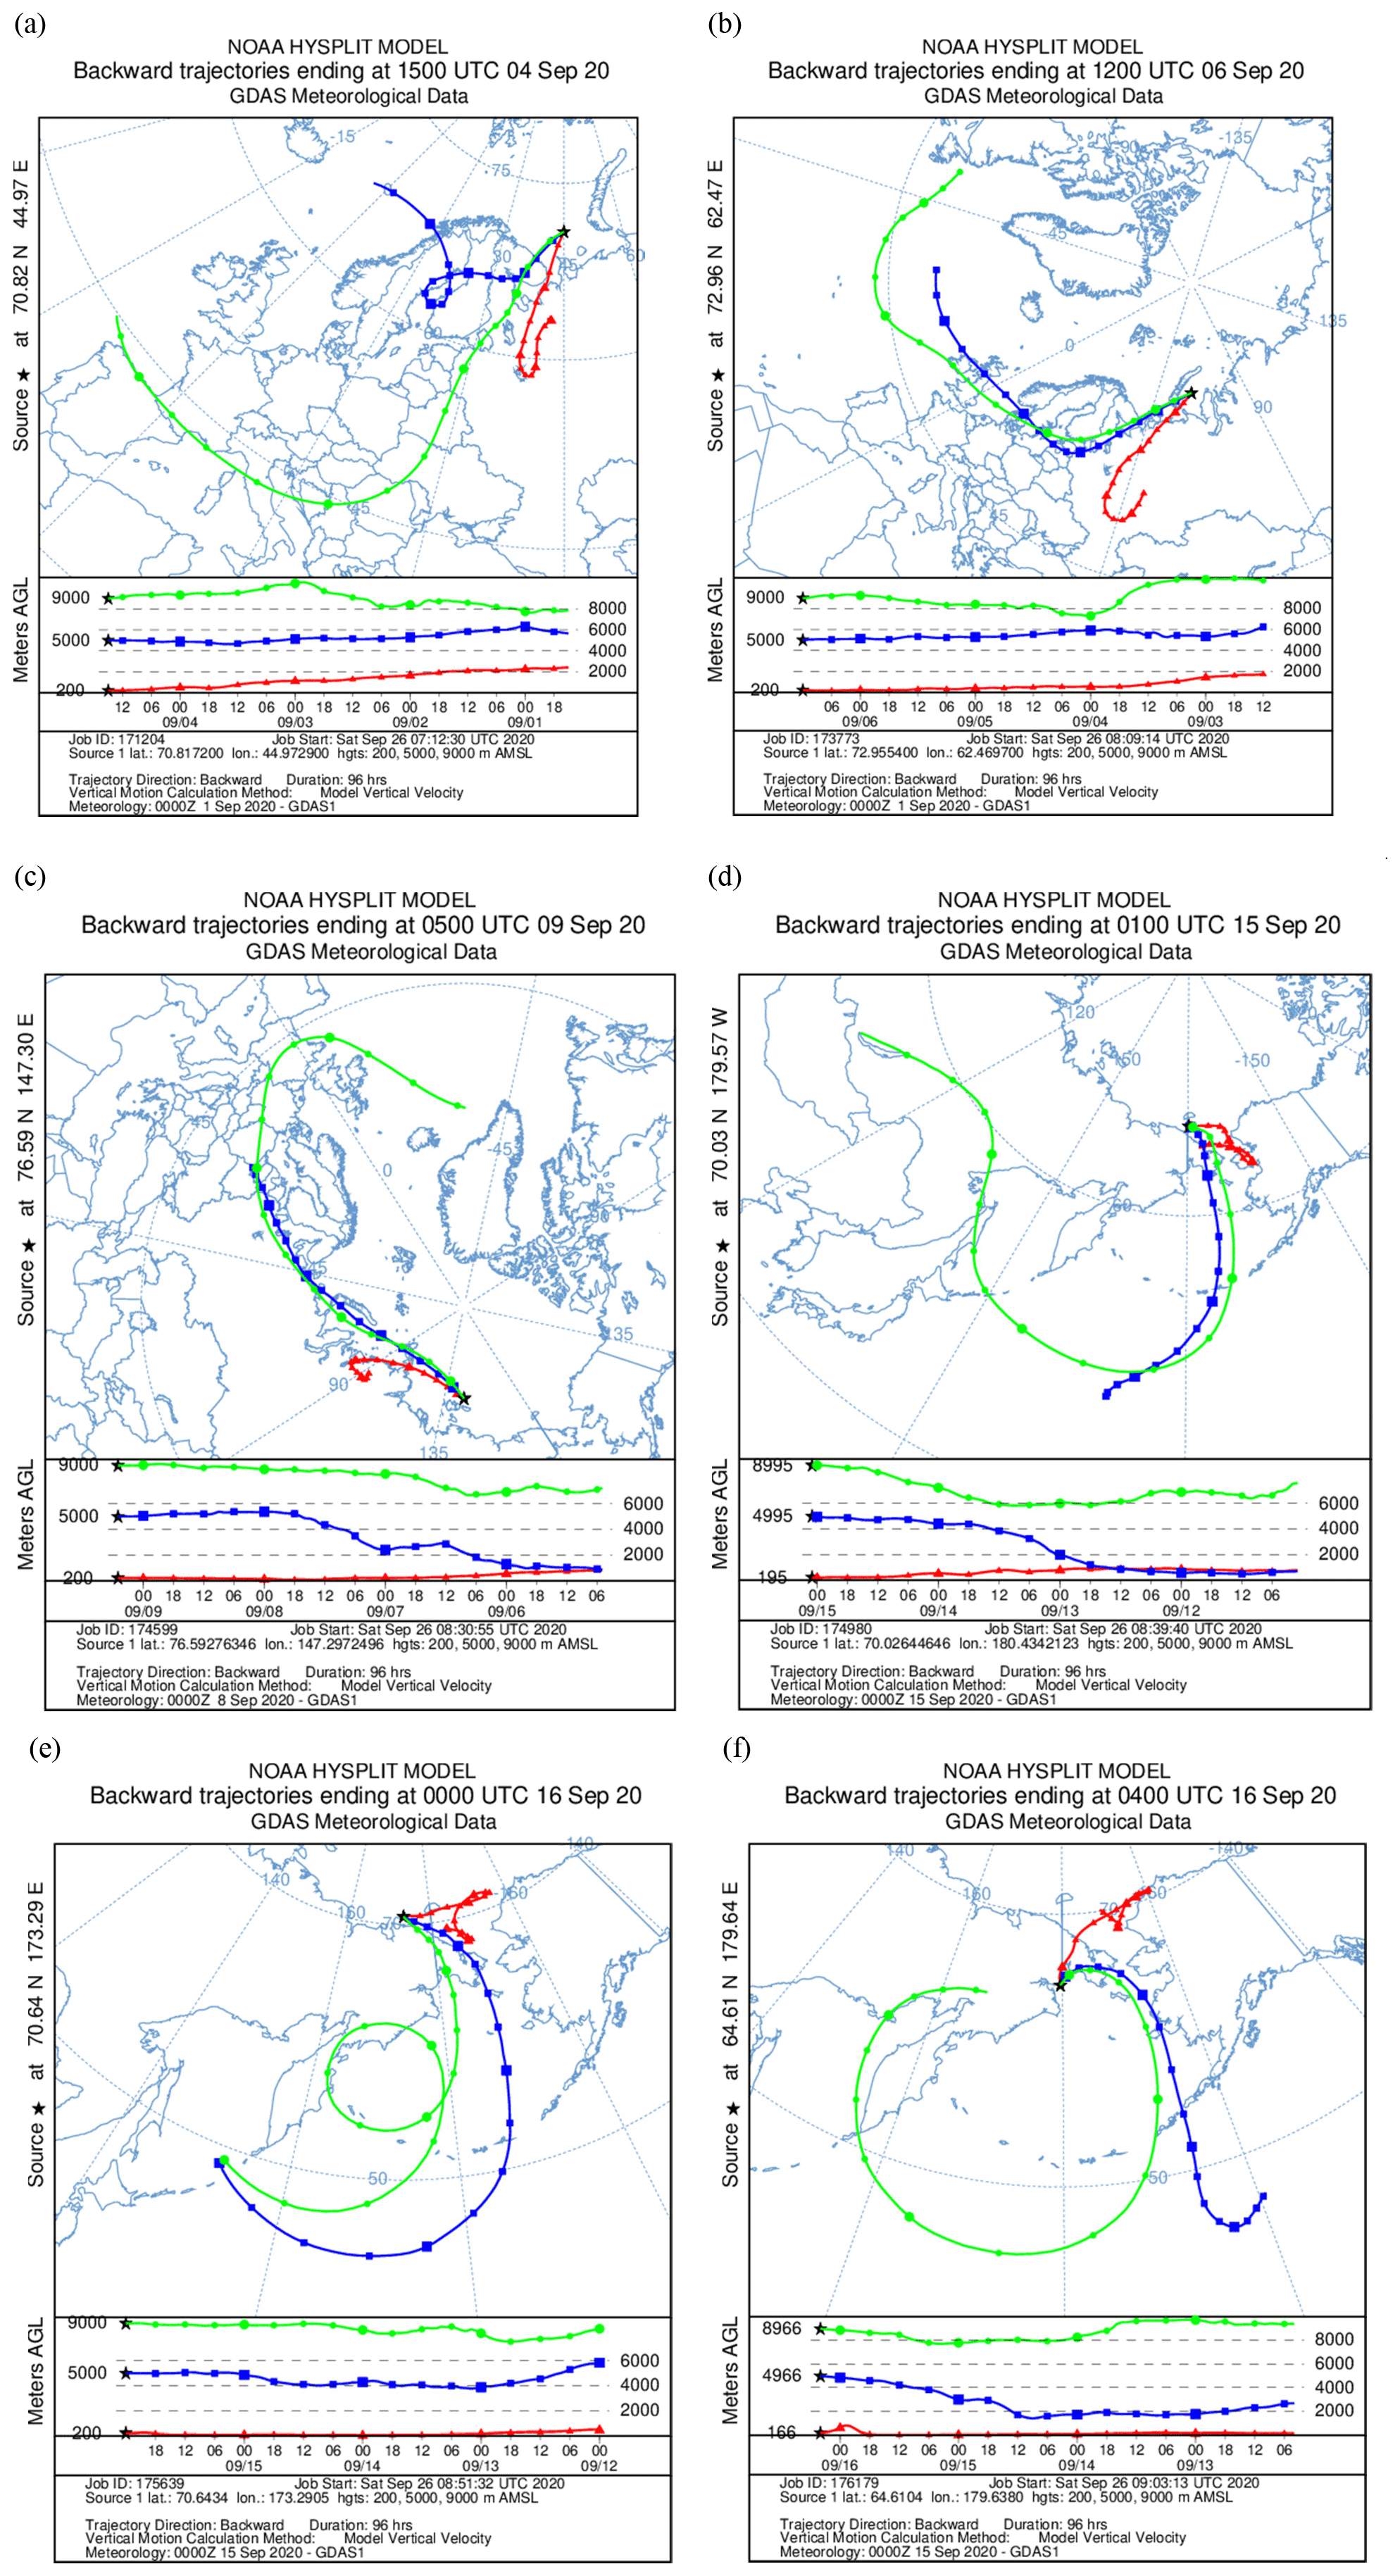
Figure 9Back trajectories for the period of the experiment.
It can be seen from Fig. 9 that for the Barents, Kara, and Laptev seas, which are characterized by the highest concentrations of CH4 in the near-water layer, the back trajectories at a level of 200 m above the sea surface start from the continent. Over the East Siberian, Chukchi, and Bering seas, to the contrary, the back trajectories begin above the sea surface, and the methane content in the lower atmosphere over these areas is much lower.
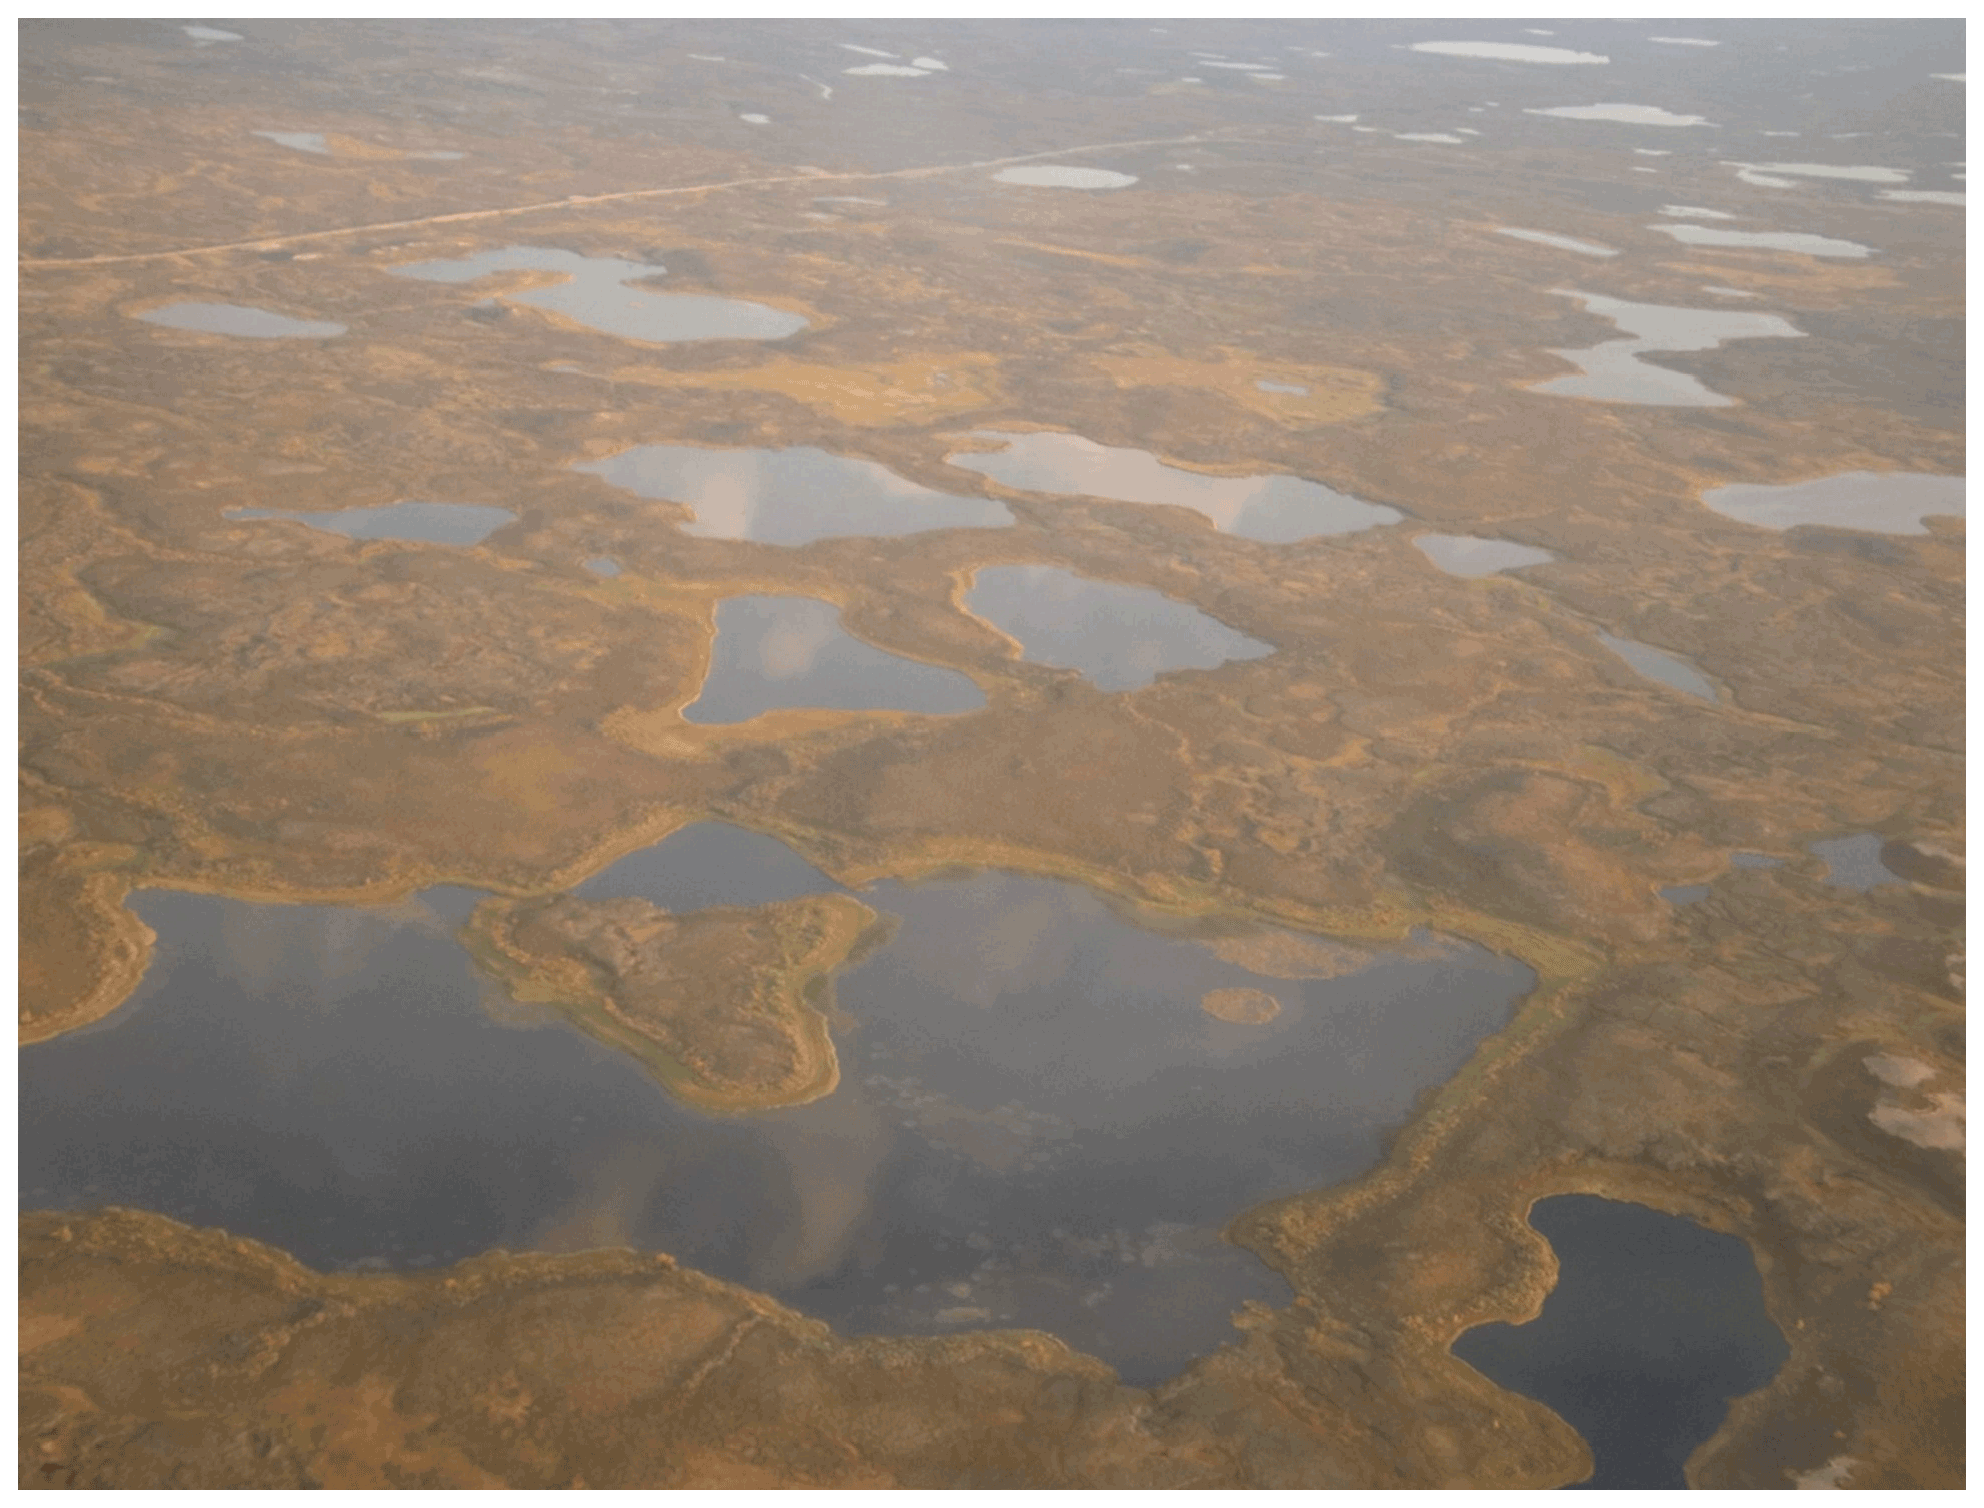
Methane is most probably released by thermokarst lakes, which are abundant in the coastal tundra as can be judged from the photograph showing the underlying surface between Arkhangelsk and Naryan-Mar (Fig. 10). The methane release from such lakes is an order of magnitude more intense than that from other sources and can reach hundreds of grams per square meter a year (Bogoyavlensky et al., 2019; Jammet et al., 2015; Tan et al., 2016). According to Walter et al. (2014), these lakes in flat regions can occupy from 10 % to 30 % of the territory. Therefore, this source is quite comparable to others in power.
Tropospheric ozone is the fourth largest contributor to total radiative forcing (WMO, 2019). Our previous studies have shown that its formation in the lower atmosphere of the Arctic regions is insignificant (Antokhina et al., 2018; Antokhin et al., 2014). This experiment confirms this conclusion (Fig. 11). Data for coastal areas are not shown here, as no differences with water areas were found.
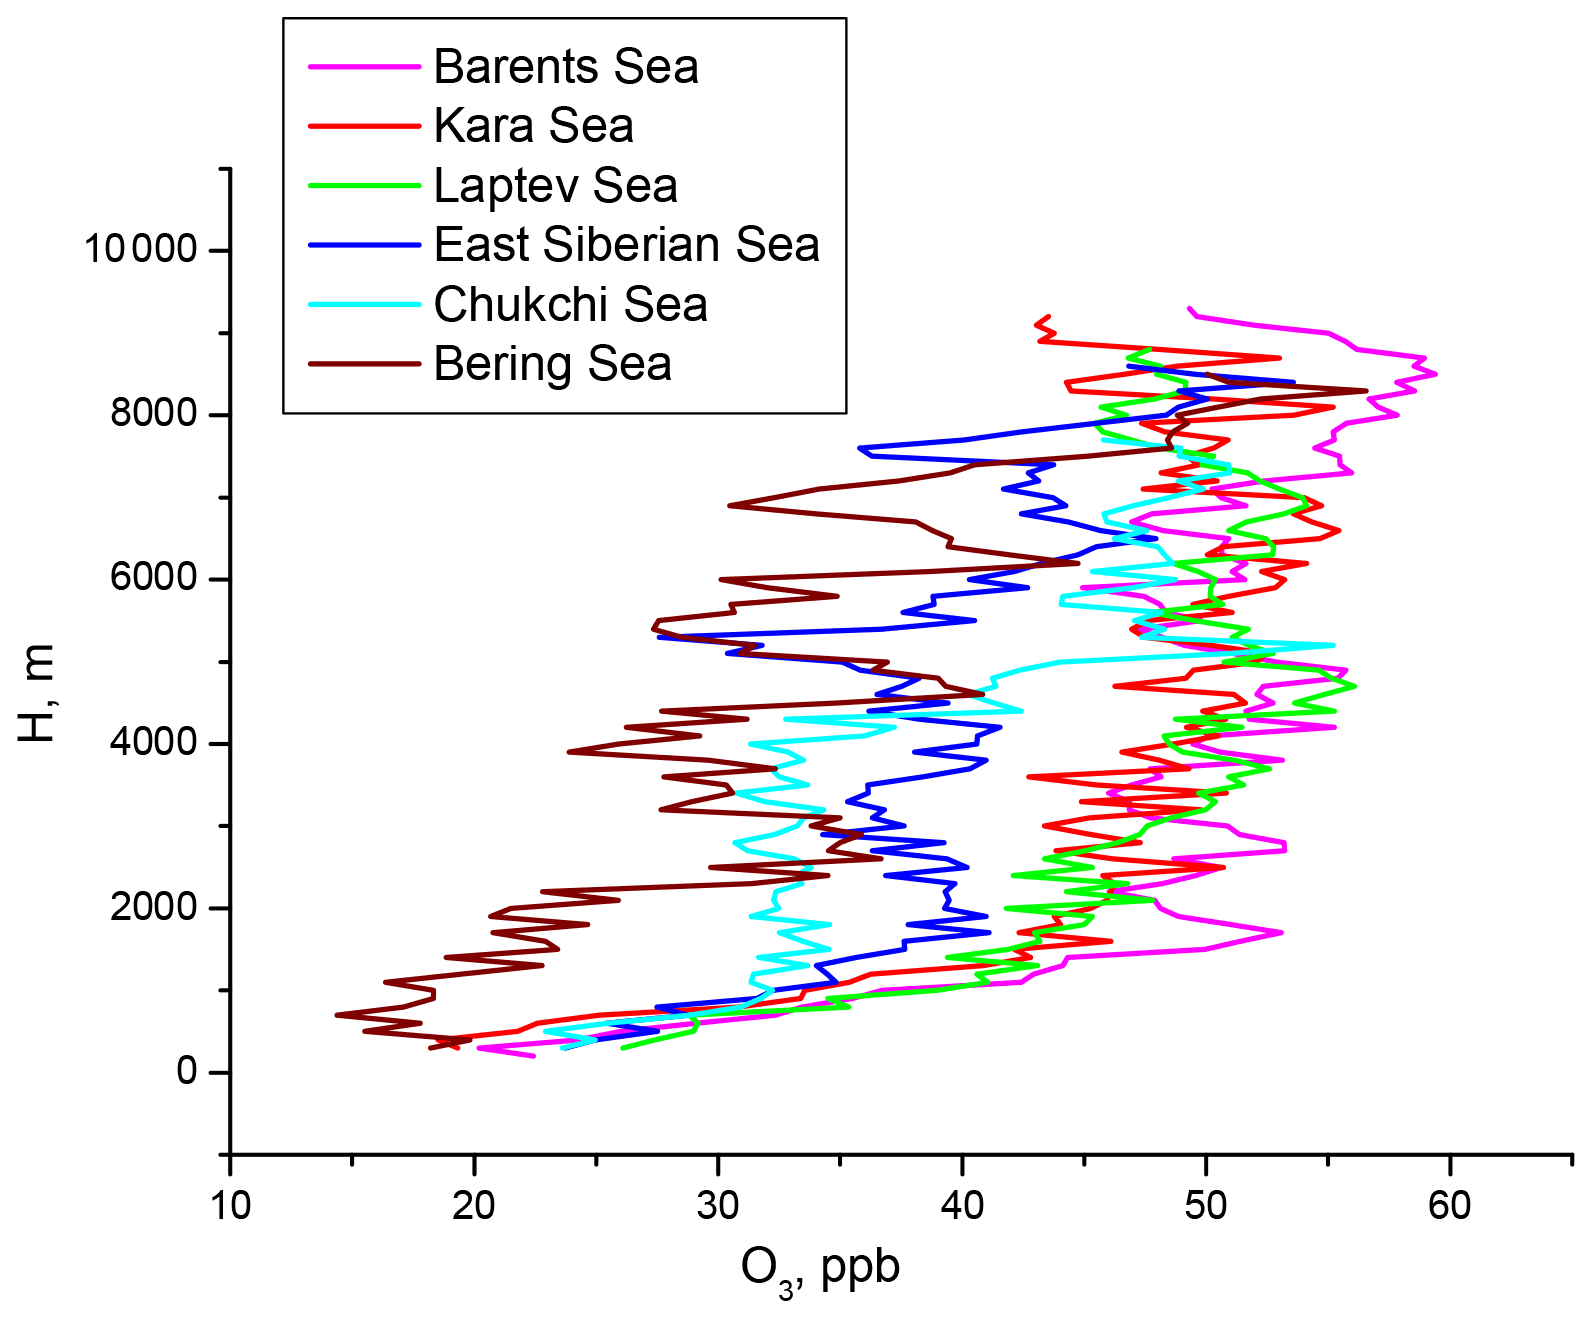
It can be seen from Fig. 11 that the ozone concentration in the near-water layer sharply decreases over all seas. Since O3 belongs to insoluble gases, in contrast to CO2 (Glinka, 1985), this is not the effect of its absorption by the ocean, but the absence of its photochemical formation. In such areas, the main source of O3 inflow into the troposphere is the stratosphere (Àntokhin and Belan, 2013; Berchet et al., 2013). It is possible that the lockdown due to the coronavirus pandemic, as was noted in Steinbrecht et al. (2021), also affected the situation. At the same time, in the middle troposphere, the eastern and western sectors of the Russian Arctic can be clearly separated. It can be seen that the ozone concentration over the western sector is much higher. This is probably due to the inflow of ozone-forming compounds from western Europe.
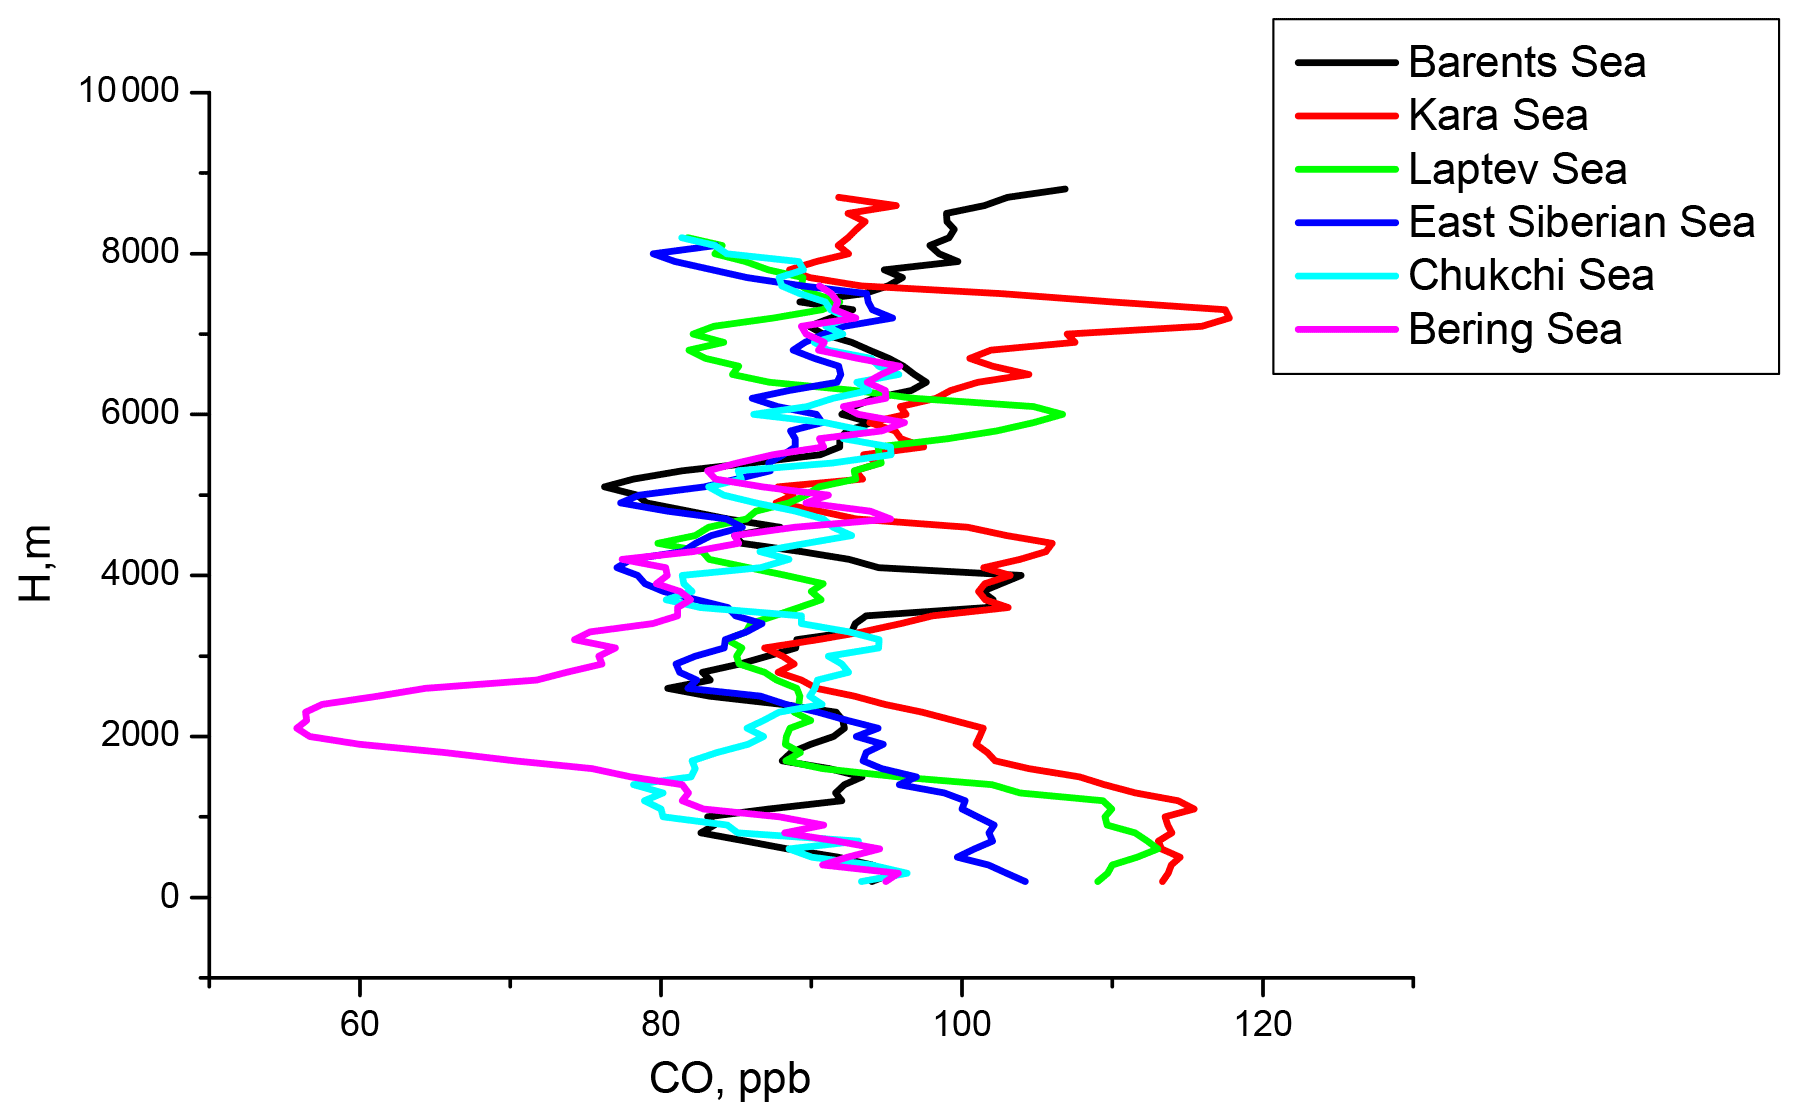
Next, consider the vertical distribution of carbon monoxide. The studies of the CO concentration in background areas in the preindustrial period and now show that it has increased. Thus, in the preindustrial period, it was 90 ppb in Greenland and 55 ppb in Antarctica (Delmas and Legrand, 1998). In Assonov et al. (2007), a lower value of 38 ± 7 ppb was obtained for Antarctica. At present, the CO concentration averages 140 ppb in the Northern Hemisphere and 50 ppb in the Southern Hemisphere (Karol, 2002).
The data of Fig. 12 demonstrate that the CO concentration during the experiment was close to the background level. CO concentration ranged within 55–118 ppb, which is far lower compared to continental regions (Davydov et al., 2019; Shtabkin et al., 2016) and close to the values typical for remote regions of Antarctica (Ustinov et al., 2019).
In addition to the above gases, NO and NO2 joined by a single abbreviation NOx were also measured in the experiment. These gases have both natural and anthropogenic sources (Seinfeld and Pandis, 2006). Recent studies show that efforts of the world community to reduce emissions of these gases have been fruitful. The concentrations of these compounds dropped sharply in urbanized regions, not to mention background ones (Galloway et al., 2014; Lefohn et al., 1999). The data of Fig. 13 confirm this information.

The NOx concentrations shown in Fig. 13 range within 0.02–0.90 ppb, which is close to the detection limits (0.01 ppb) of the devices used.
4.2 Aerosol composition
4.2.1 Disperse composition of aerosol references
The aerosol instrument suite of the Optik Tu-134 aircraft laboratory allows the aerosol distribution to be measured in a wide size range with a good resolution (20 bins in the range from 0.003 to 0.2 µm and 31 bins in the range from 0.25 to 32 µm). To reveal regional features in the vertical distribution in the troposphere, we analyzed profiles of number concentrations of the following typically used size ranges: nucleation mode (0.003 µm < Dp < 0.025 µm), Aitken mode (0.025 µm < Dp < 0.1 µm), accumulation mode (0.1 µm < Dp < 1.0 µm), and coarse mode (1.0 µm < Dp < 32 µm).
In general, during the campaign, various types of the vertical distribution typical for both coastal marine, polar, and even remote continental regions (Jaenicke, 1993) were recorded. Some concentration profiles, especially for particles of the nucleation and Aitken modes, had a Z-shaped structure described in Schröder et al. (2002).
Figure 14 shows the profiles of the number density of the main aerosol modes averaged for each water area of the Russian Arctic seas, where flights of the Optik Tu-134 aircraft laboratory were carried out at an altitude from 0.2 to ≈9.0 km.
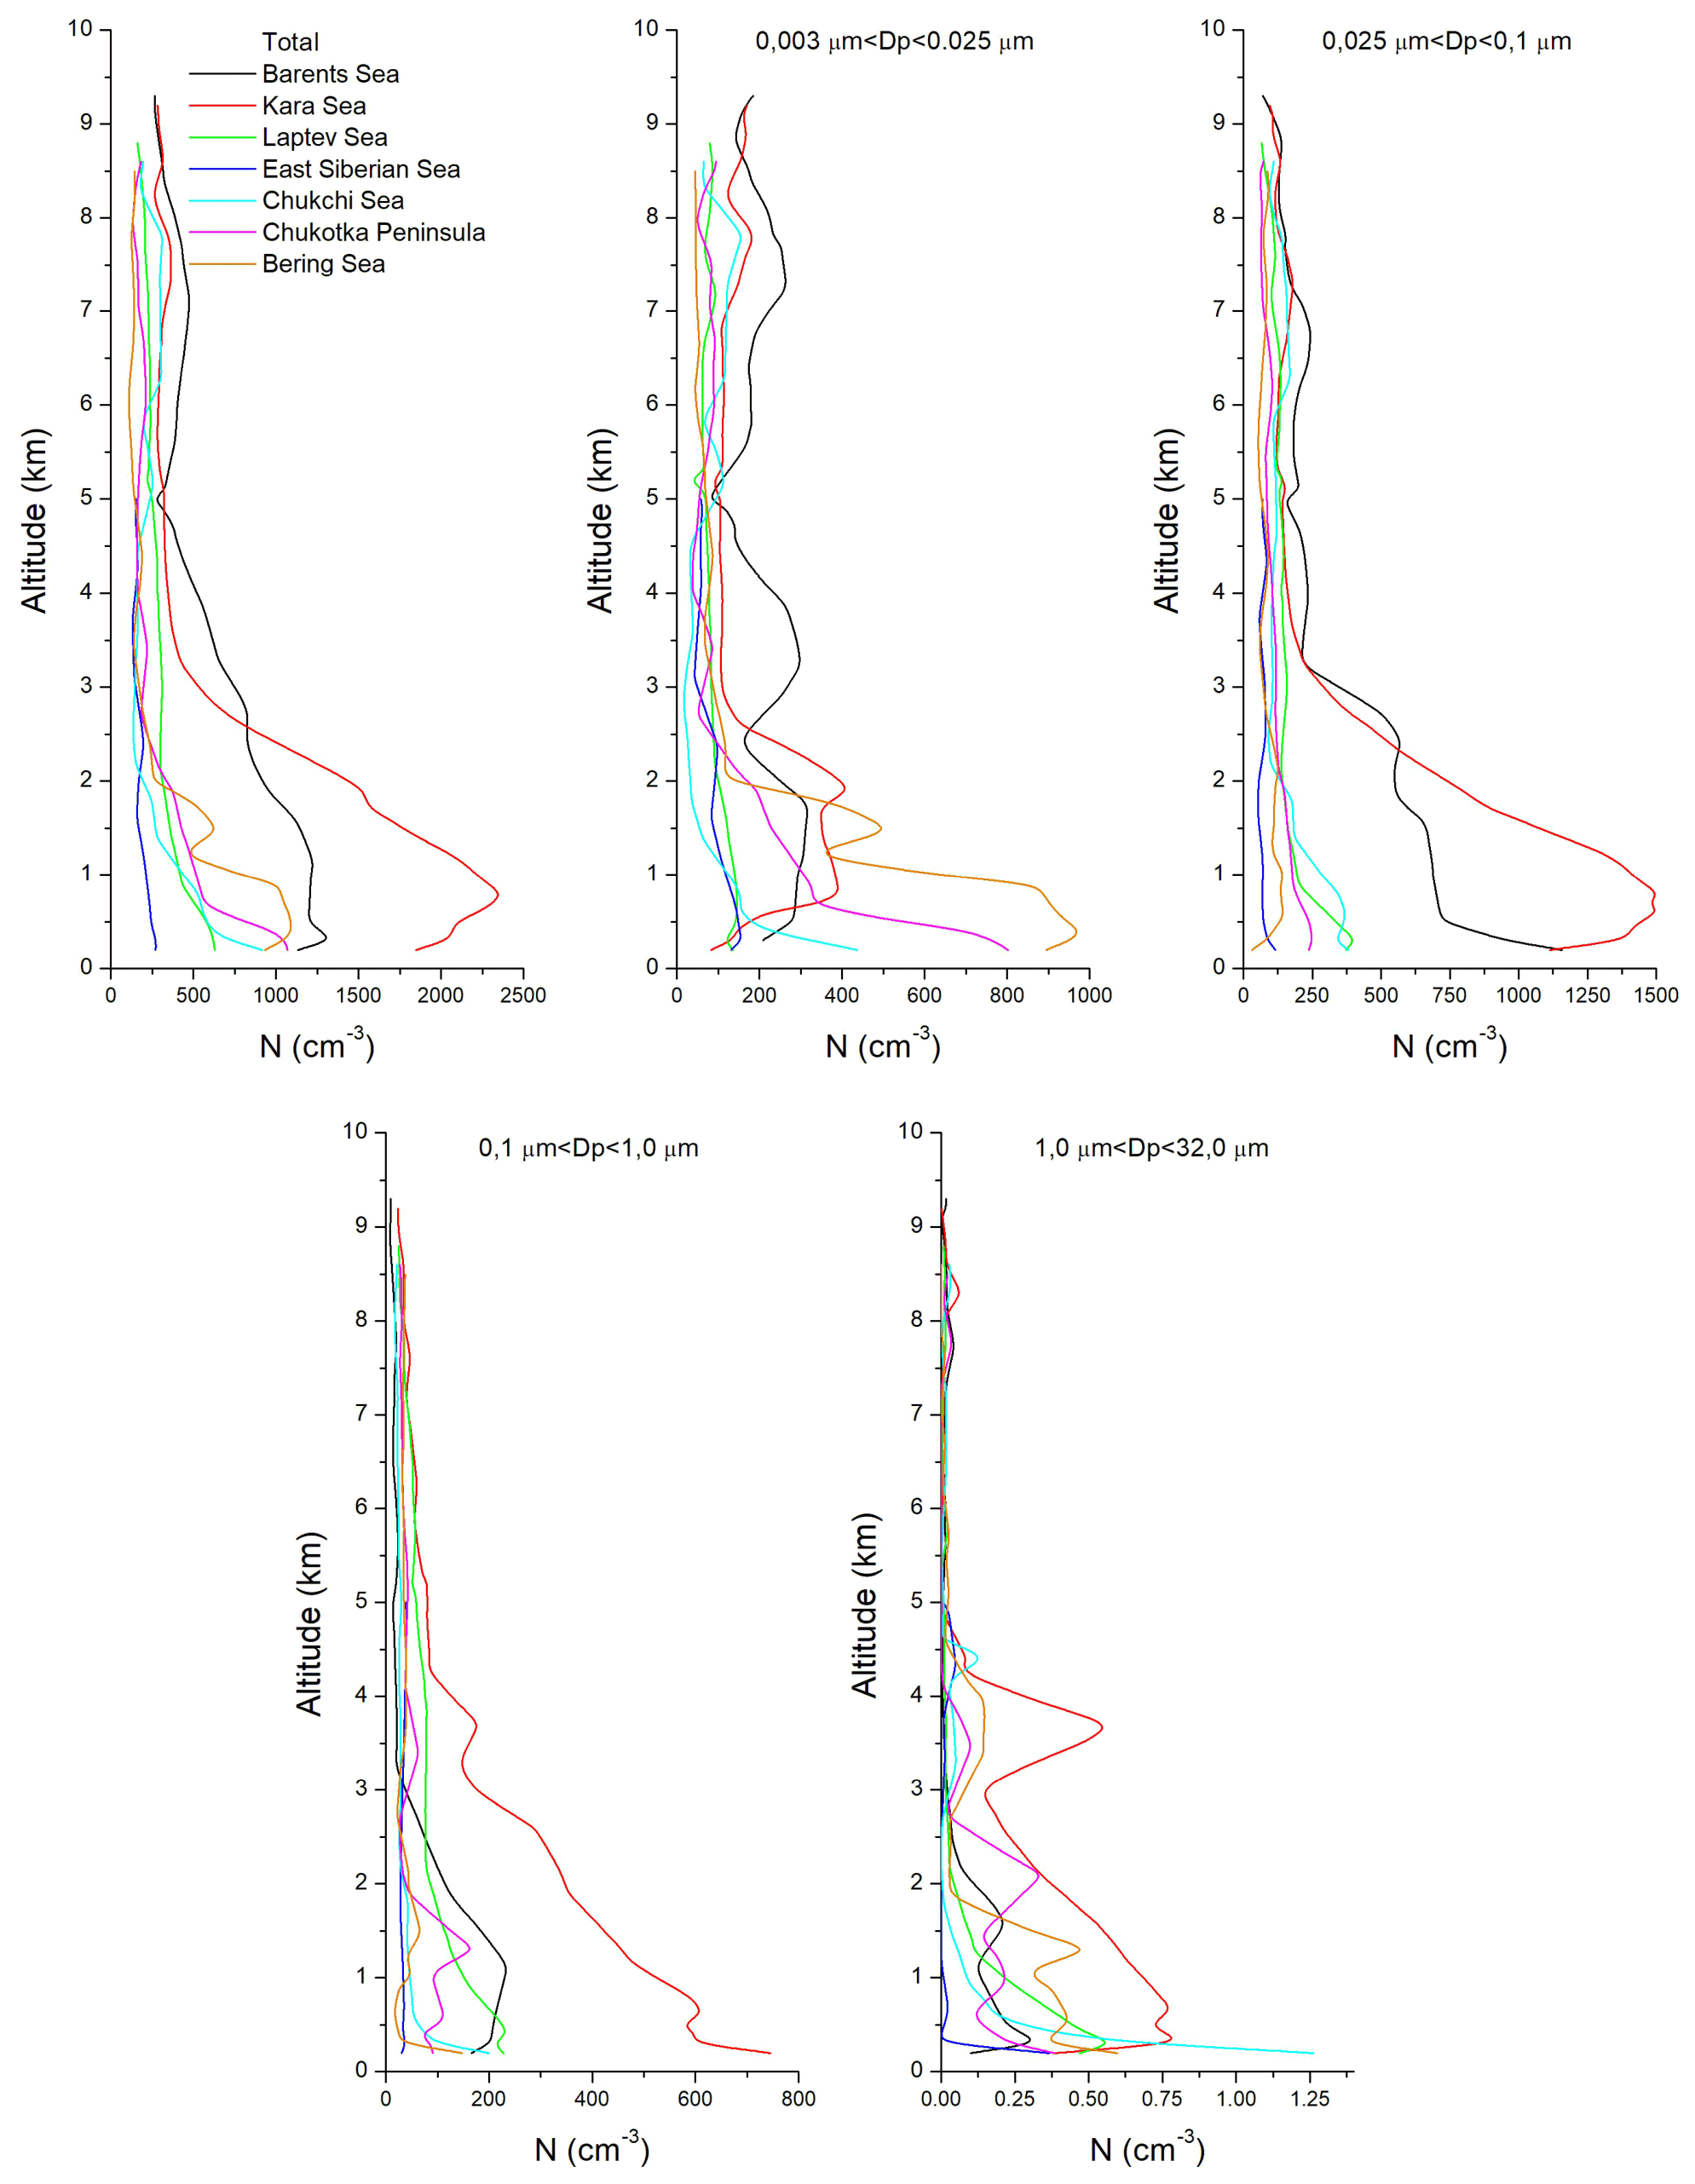
Figure 14Average vertical profiles of the total, nucleation, Aitken, accumulation, and coarse mode particle number density over different regions of the Russian Arctic in September 2020.
It can be seen that in the western part of the Russian Arctic (over the Barents and Kara seas), the vertical distribution of the continental type was observed. In this distribution, the number density is maximal near the surface, decreases with height to background aloft at altitudes of 2–3 km, and then varies slightly in the free troposphere. At the same time, in horizontal upper flights over these areas, we sometimes recorded number densities comparable to that near the surface. Analysis of the HYSPLIT back trajectories (Fig. 9) showed that the air masses came to this region from the continent during our flights. That is why the vertical distributions of the continental type were observed.
For the seas of the Asian part of the Arctic, low number densities, occasionally and slightly exceeding the level of 1000 cm−3 in the Bering Sea region, were typical. The number concentrations varied with height within a relatively narrow range. It should be noted that during the flight campaign, this territory was affected by a large cyclone with developed cloudiness and precipitation that led to the washout of a significant part of aerosol particles from the atmosphere (Fig. 6). Profiles of this type were observed during the ASCOS 2008 summer Arctic campaign conducted by European and American researchers in the Svalbard region (Kupiszewski et al., 2013).
To consider how the size distribution of aerosol particles changes with height, let us turn to Fig. 15, which shows the size spectra averaged in the tropospheric layers with a step of 1000 m, starting from an altitude of 500 m.

Figure 15Average particle size distributions observed at different heights over different regions of the Russian Arctic in September 2020.
As in the case of vertical profiles of the number density, regional differences are clearly visible here. The size distribution in the western part of the Russian Arctic changes more dynamically with height (Barents and Kara seas) both in number density and in the intensity and position of the main modes. The particle size spectra were noticeably wider here than in the eastern part of the Russian sector of the Arctic.
In the eastern part, marked changes were observed only in the nucleation size range (Dp < 0.025 µm). The weather conditions observed during the flights in this area led to significant washout of aerosols and purification of the atmosphere, which is clearly seen from the complete absence of coarse particles in the size spectra. The intensity of the Aitken mode and the accumulation fraction, which make up the main part of the total number density, did not undergo significant changes with altitude. As a result, the relatively uniform vertical distribution of the aerosol particle number density was formed over the water areas of the Chukchi and East Siberian seas.
It should be noted that despite the existing gap in detection of particles in the size ranges of 0.2 and 0.25 µm by DPS and Grimm spectrometers, the distributions obtained with them match well. The data obtained during our Arctic campaign can be considered unique, because, in most international aircraft studies, aerosol particles with Dp < 0.1 µm are measured with a significantly poorer resolution, and in the Russian sector of the Arctic this study was carried out for the first time.
4.2.2 Inorganic aerosol
Every aerosol sample taken in our Arctic experiment consisted of three exposed filters of the AFA-HA-20 type. Two of three filters were analyzed for elemental and ionic composition. In total, 77 samples were taken, of which 52 samples were over the seas and the coastal zone of the Arctic.
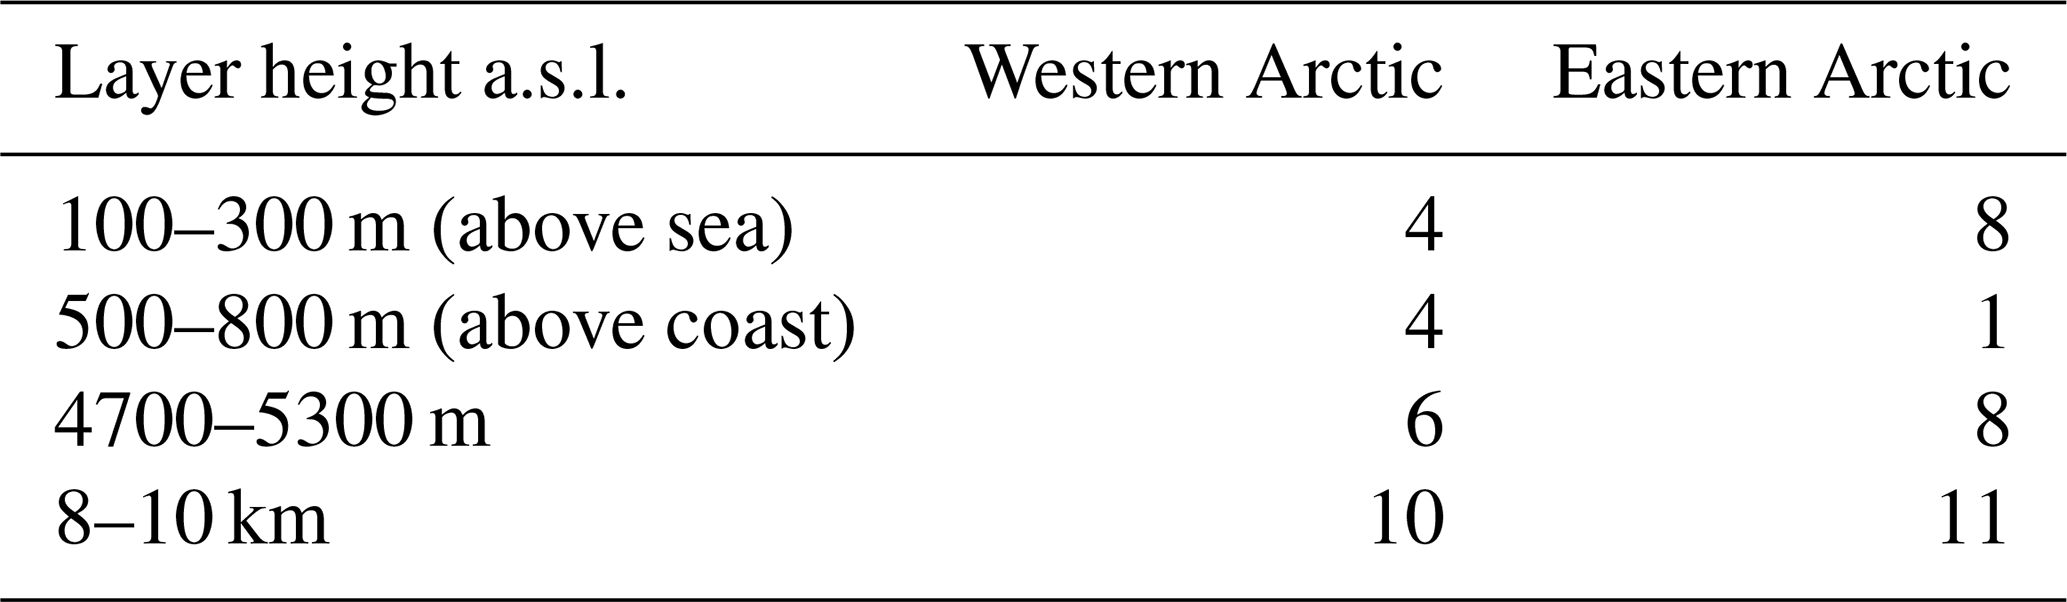
For the generalized analysis of the chemical composition of atmospheric aerosol relying on the geographical principle and the uniformity of synoptic conditions during the experiment in every area, the entire region was divided into the western (Barents and Kara seas) and the eastern (Laptev, East Siberian, Chukchi, and Bering seas) parts. The number of samples for these two parts at different heights is given in Table 5.
Table 5Statistics of samples over different regions of the Russian Arctic in September 2020.
The geometric mean concentrations of elements and ions in the composition of aerosol sampled onto the Petryanov AFA-HA-20 filters are given in Table 6. The concentrations were determined by atomic emission spectroscopy and the HPLC method. The data of Table 6 demonstrate that the synoptic conditions and the origin of air masses affected the aerosol chemical composition. The continental origin of air masses over the western part of the Russian sector of the Arctic during the experiment manifested itself in a significant increase in the mineral (elemental) component, especially in the main flow, at an altitude of 5000 m. In general, the terrigenous component determines the composition of this layer and dominates in the boundary layer. In the eastern Arctic, the fraction of the ionic component of aerosol increases significantly, although directly in the near-water layer of 100–300 m, its content decreases in comparison with the western part. In the eastern part, the concentration of mineral forms of alkaline earth metals falls below the detection limit and the concentration of their soluble forms increases significantly. The aerosol acidity in the eastern part at altitudes up to 5000 m inclusive is significantly reduced compared to the western Arctic.
Table 6Geometric mean concentrations of chemical components: elements and ions in aerosol (ng m−3).
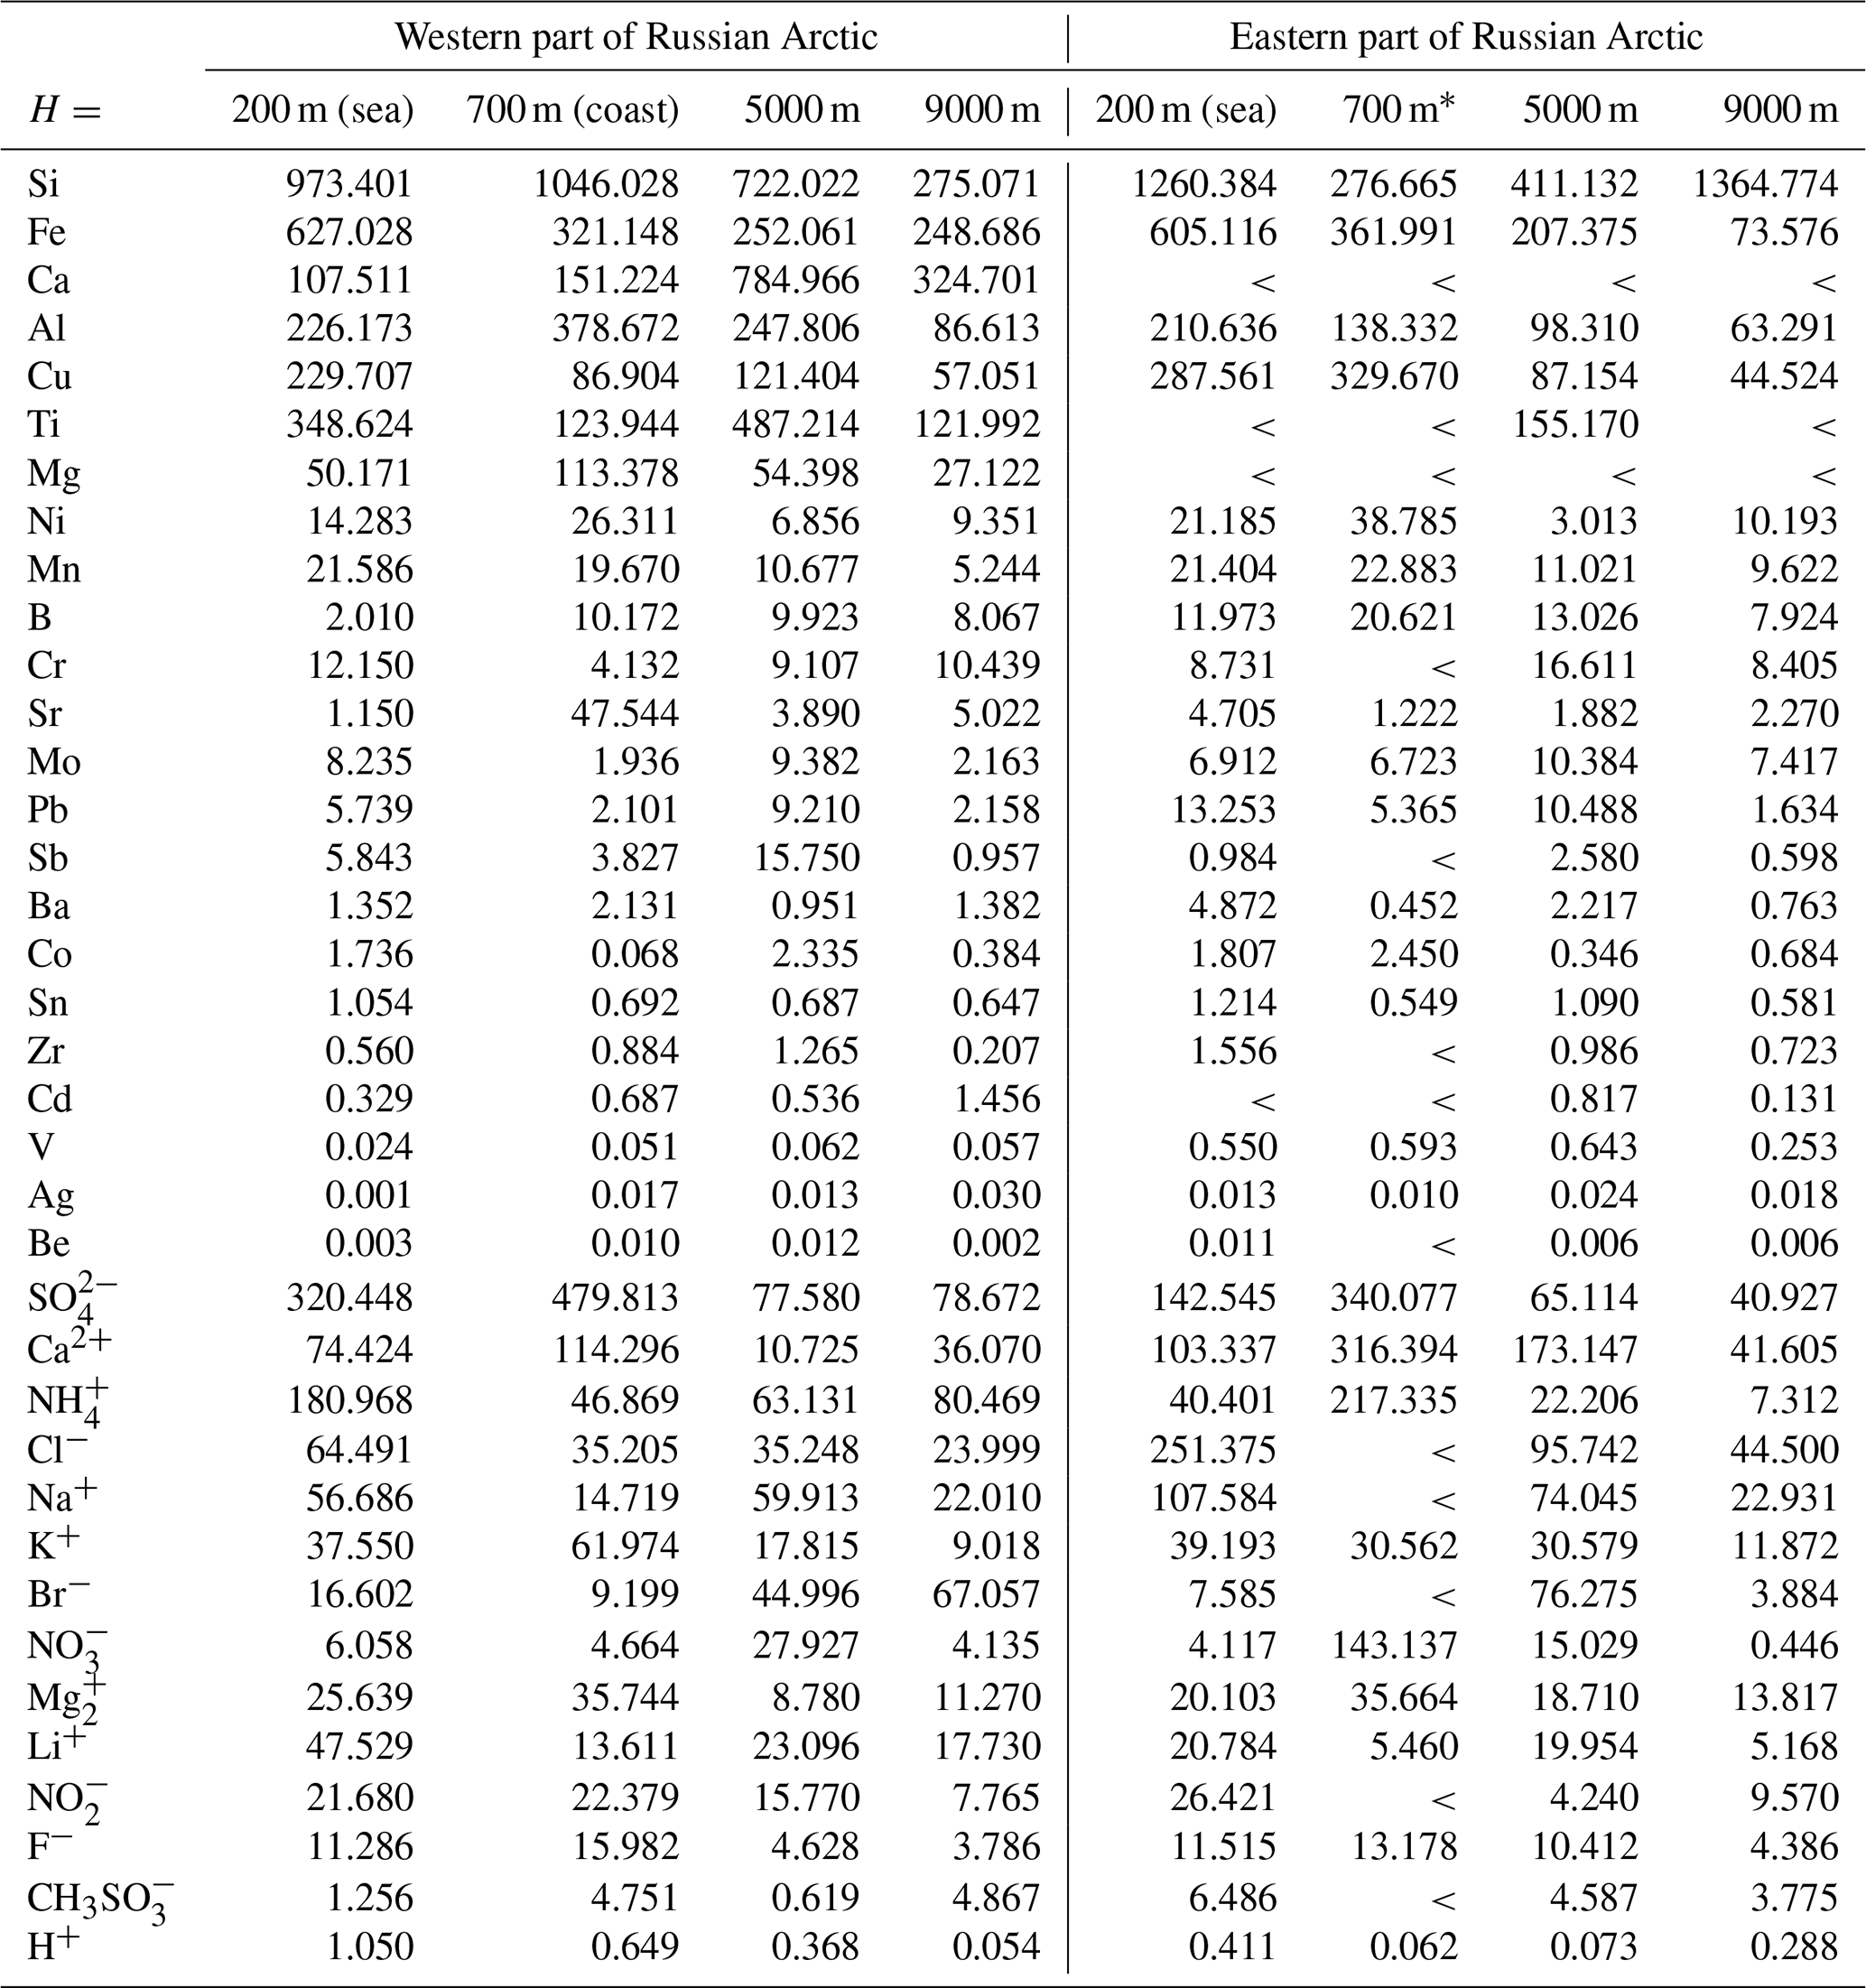
* concentrations of a single sample over the mouth and delta of the Lena River and the coast of the Tiksi Bay.
The total concentrations of ions and elements in the upper troposphere are close for the considered regions. However, for some components, the spread in the concentrations is sometimes very significant. A significant difference in the silicon content between the regions may indicate that in the upper layers there is a transport of aerosol from the East Asian deserts to the eastern Arctic.
4.2.3 Organic aerosols
A total of 19 samples (six samples in the 0–2 km layer, and the others in the 3–9 km layer) were taken during the experiment. The relatively small number of samples is caused by the low concentration of the organic aerosol component. Thus, we had to pump a large volume of air through the filter to obtain a representative sample of the analyzed material.
As a result, the vertical distribution of the organic component has the form of two layers (Fig. 16).

Figure 16 shows that the greatest amount of organic matter in aerosol was observed over the Chukchi Sea, both in the boundary layer and in the free troposphere. Over the other seas, the distribution was somewhat different. Thus, over the Barents Sea, the content of organic compounds in aerosol particles in the boundary layer is the second in mass, after the Chukchi Sea, but in the free troposphere it is the smallest of all the seas. Over the Bering Sea, the vertical distribution is even reversed. There is more organic matter in the free troposphere than in the boundary layer. This is probably due to peculiarities of the transport of organic compounds to this region from adjacent territories. However, a more detailed analysis is needed for an accurate conclusion.
4.2.4 Bioaerosols
From our point of view, total protein is the most adequate marker of the biological origin of organic material in aerosol. Various proteins are essential materials for the “construction” of biological objects. They are parts of all cells of animals, plants, and representatives of other kingdoms, including all microorganisms. Therefore, their presence in aerosol clearly indicates the biological origin of this material. The total protein concentration in 22 samples taken over the Arctic seas was determined by the method described in You et al. (1997). It should be noted that the total protein concentration in air over the Arctic seas is low, averaging 10.0 ± 16.5 ng m−3. This is significantly lower than the total protein concentrations observed at different times at different heights in southwestern Siberia (Kutsenogii, 2006; Agranovski, 2010): 460 ± 30 and 1390 ± 1480 ng m−3, respectively.
Of all the analyzed samples, the sample taken on 16 September 2020, at the Anadyr – East Siberian Sea flight segment at an altitude of 8500 m, demonstrates a significantly higher total protein concentration of 80 ng m−3 than the concentrations detected in other samples (no higher than 18 ng m−3). The back trajectory of the air mass carrying this unique sample passed over Kamchatka 4 d before sampling and then 3 d over the Bering Sea at altitudes above 7500 m. Likely, it was over Kamchatka that the air mass received a relatively large amount of total protein.
Without this point, all other measurement results are shown in Fig. 17.
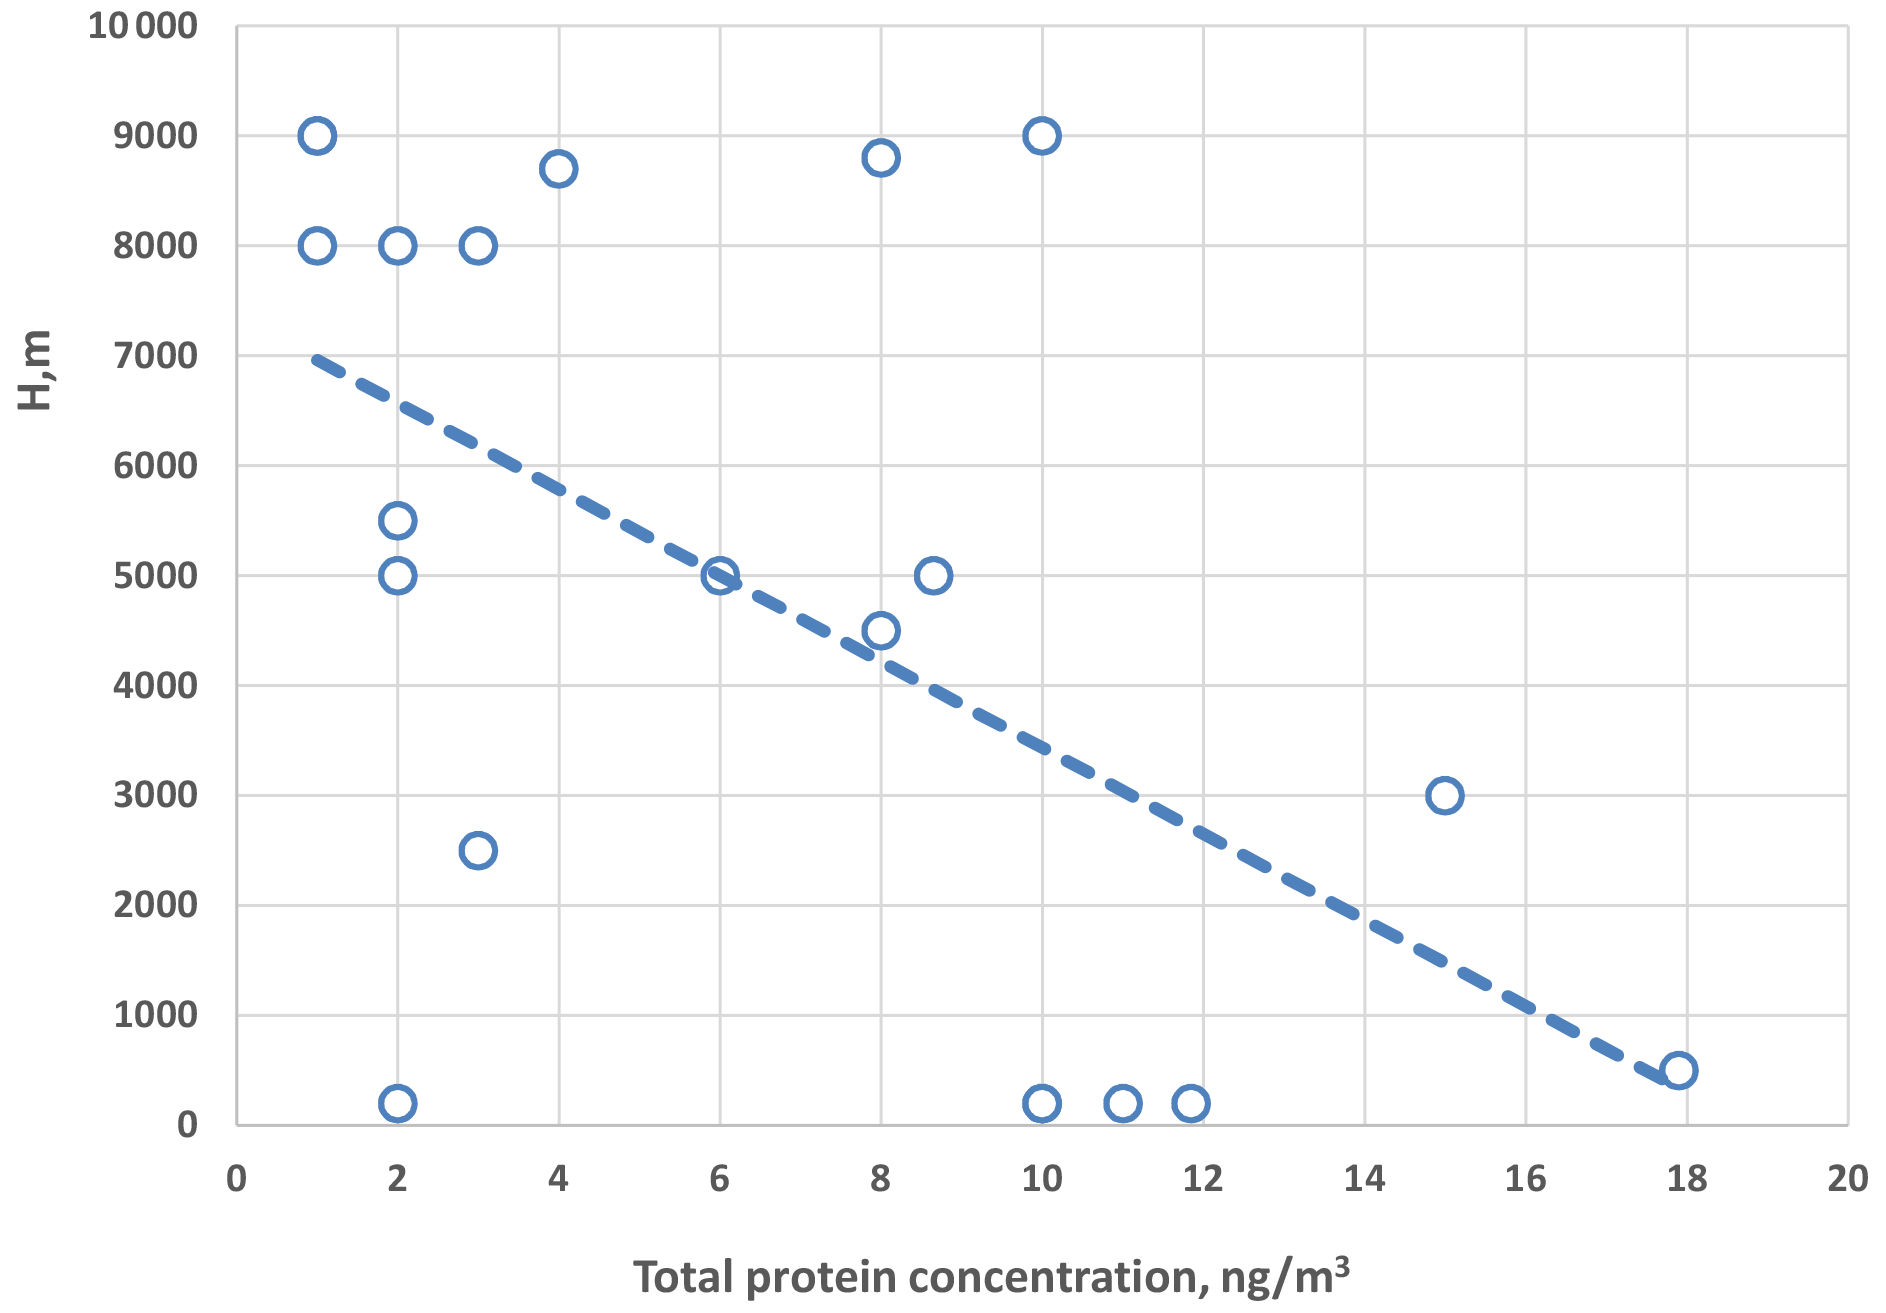
Figure 17Total protein concentration in atmospheric aerosol sampled over the Russian Arctic seas.
As can be seen from the figure, the concentration of total protein in the atmospheric aerosol sampled over the Arctic seas of Russia generally decreases with height. According to the constructed trend, it decreases by more than an order of magnitude as the altitude above sea level increases from 500 to 7000 m. It should be noted, however, that several samples have concentrations below the definition limit of the used method (on the order of 1 ng m−3). The dependence of this concentration on the sampling coordinates has not been revealed.
Let us now turn to the results of studying the microbiological component of atmospheric aerosol in samples taken over the Arctic seas. Figure 18 summarizes all the data on the concentrations of cultured microorganisms in the samples.
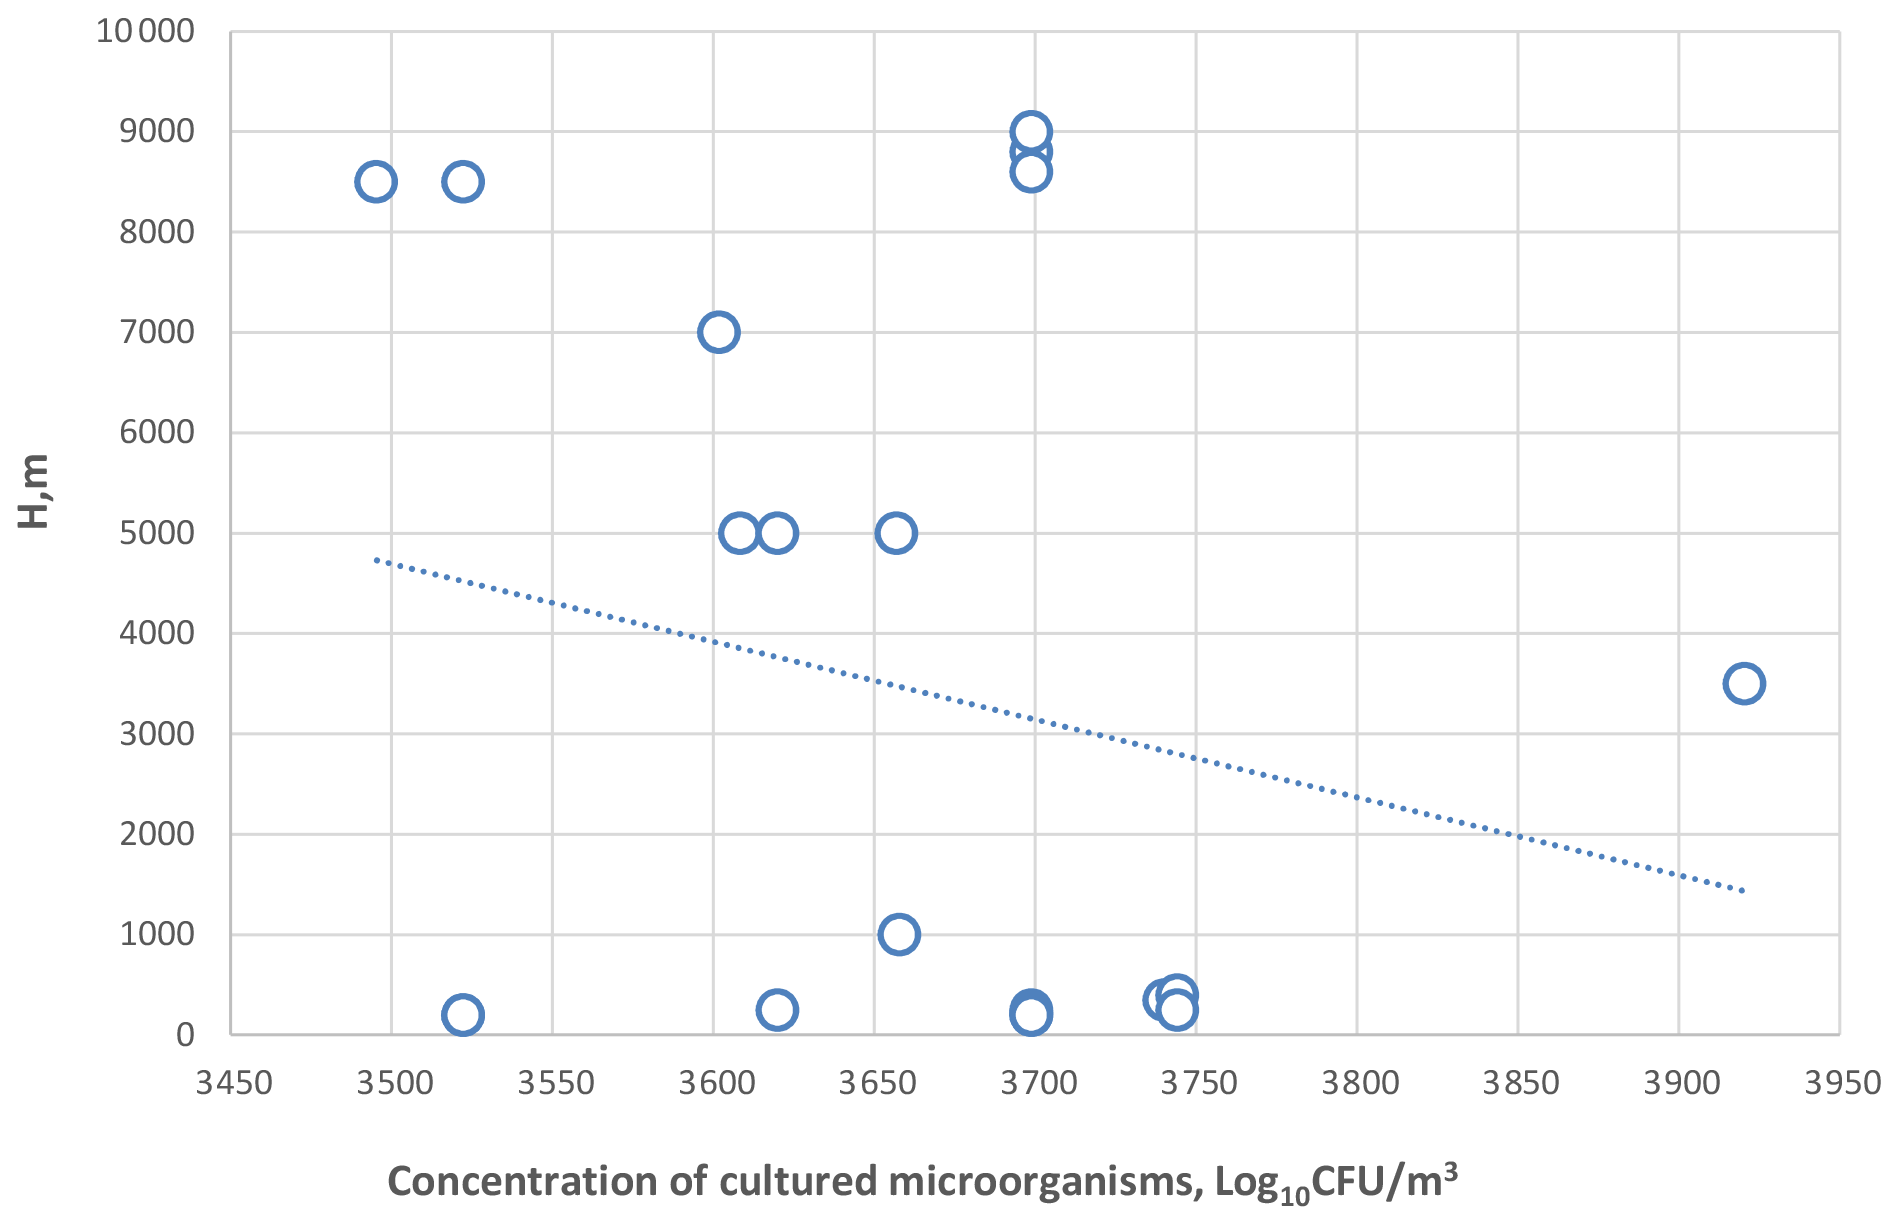
Figure 18Concentration of cultivated microorganisms (colony-forming units, CFU) in atmospheric aerosol sampled over the Russian Arctic seas.
As follows from the figure, the observed concentrations of cultured microorganisms in the atmospheric aerosol sampled over the Arctic seas change insignificantly, from 3000 to 8000 CFU per cubic meter of air. These values are comparable to those previously obtained in western Siberia (Agranovski, 2010; Andreeva et al., 2019). The vertical profile of the concentration of cultivated microorganisms in the atmospheric aerosol sampled over the Arctic seas of Russia is not significant due to the rather large scatter of the experimental data.
Various bacteria predominated among the identified microorganisms. Fungi in the samples usually accounted for less than 4 % of all microorganisms, but one sample contained 38.5 % of fungi. Coccal forms of bacteria, less often spore-forming bacteria and non-spore-bearing rod-shaped bacteria, prevailed among bacteria in most samples. It was not possible to reveal the dependence of the representation of various bacterial genera on the sampling height and site.
4.2.5 Aerosol scattering (aerosol mass concentration)
In this paper, we omit the detailed analysis of individual profiles of aerosol scattering coefficients over sea areas and in the coastal zone near the aircraft landing points (Fig. 19).
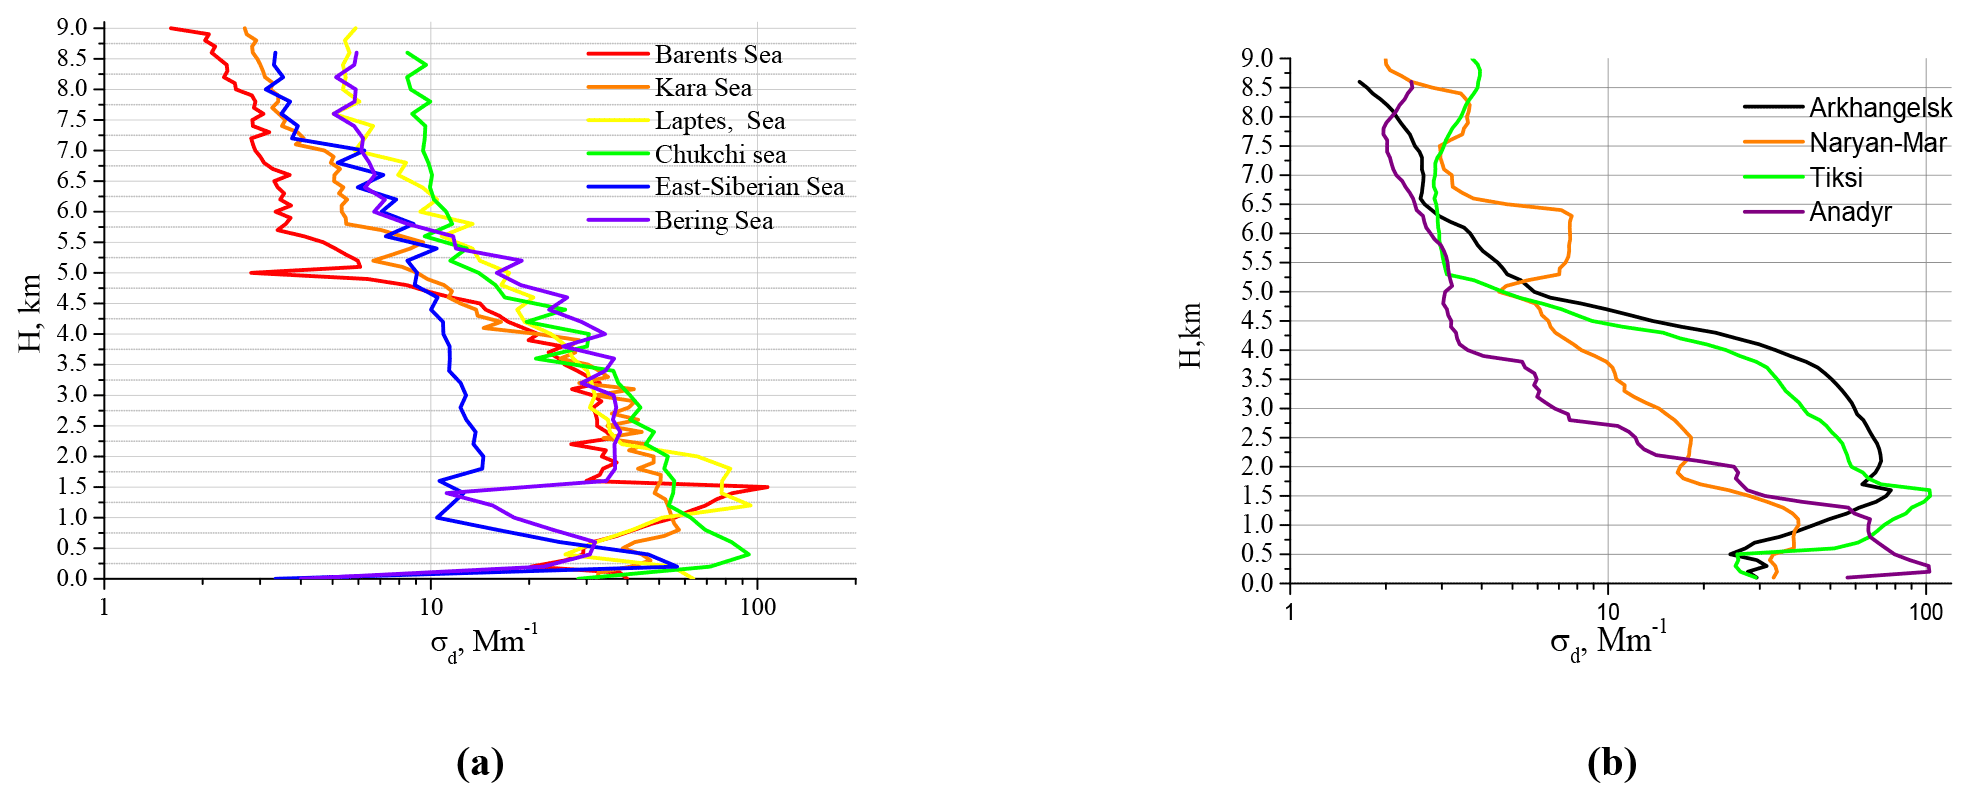
Figure 19Vertical profiles of scattering coefficients on 4–17 September 2020: over (a) sea and (b) coastal areas.
To be noted is that despite significant variability (by more than an order of magnitude), the characteristic features of the vertical distribution of the scattering coefficient allow us to assume the continental origin in almost all cases. The concentrations are maximal near the surface. At the same time, in contrast to the classical continental profile, here we observed a blurred boundary of the mixing layer and a significant decrease in σd (λ=0.53 µm) in the altitude range of 0.5–1.5 km. Both of these facts can apparently indicate that the air masses coming to the observation areas in this period and their filling with submicron aerosol were formed over a long time in a rather remote territory. The significant lifetime of submicron particles in the atmosphere is also evidenced by the drop in σd (λ=0.53 µm) in the lower atmosphere, which was caused by the purification of the lower atmosphere as a result of repeated exposure to cloudy and subcloud washout in the observed weather situation.
4.2.6 Vertical distribution of black carbon
Figure 20 shows the profiles of concentration of the absorbing substance in the composition of aerosol particles. It is obvious that the main features of the vertical distribution of the absorbing substance in every realization generally correspond to similar profiles of the scattering coefficients. The maximum values in the surface layer were recorded in the Barents and Kara seas, as well as over Arkhangelsk and Naryan-Mar. It should be noted that a mixing layer was observed in four realizations recorded over Arkhangelsk, Naryan-Mar, Sabetta, and the Barents Sea. In other situations, it was practically invisible. This is a quite clear result, since as the air mass moves over the territories having no permanent powerful sources of black carbon in the surface layer, the formation of the total composition of the submicron aerosol is governed by natural processes. However, the bulk of absorbing particles above the mixing layer enters the region from remote industrial areas (Kozlov et al., 2016). This was most pronounced in measurements in the Chukchi Sea, where the inverted nature of the vertical BC profile was observed once again. The eBC concentration steadily increased from the surface layer to heights of 6–7 km. Similar vertical profiles of absorbing aerosol were recorded in the Chukchi Sea region in our studies within the framework of the POLARCAT campaign in 2008 (Kozlov et al., 2016).
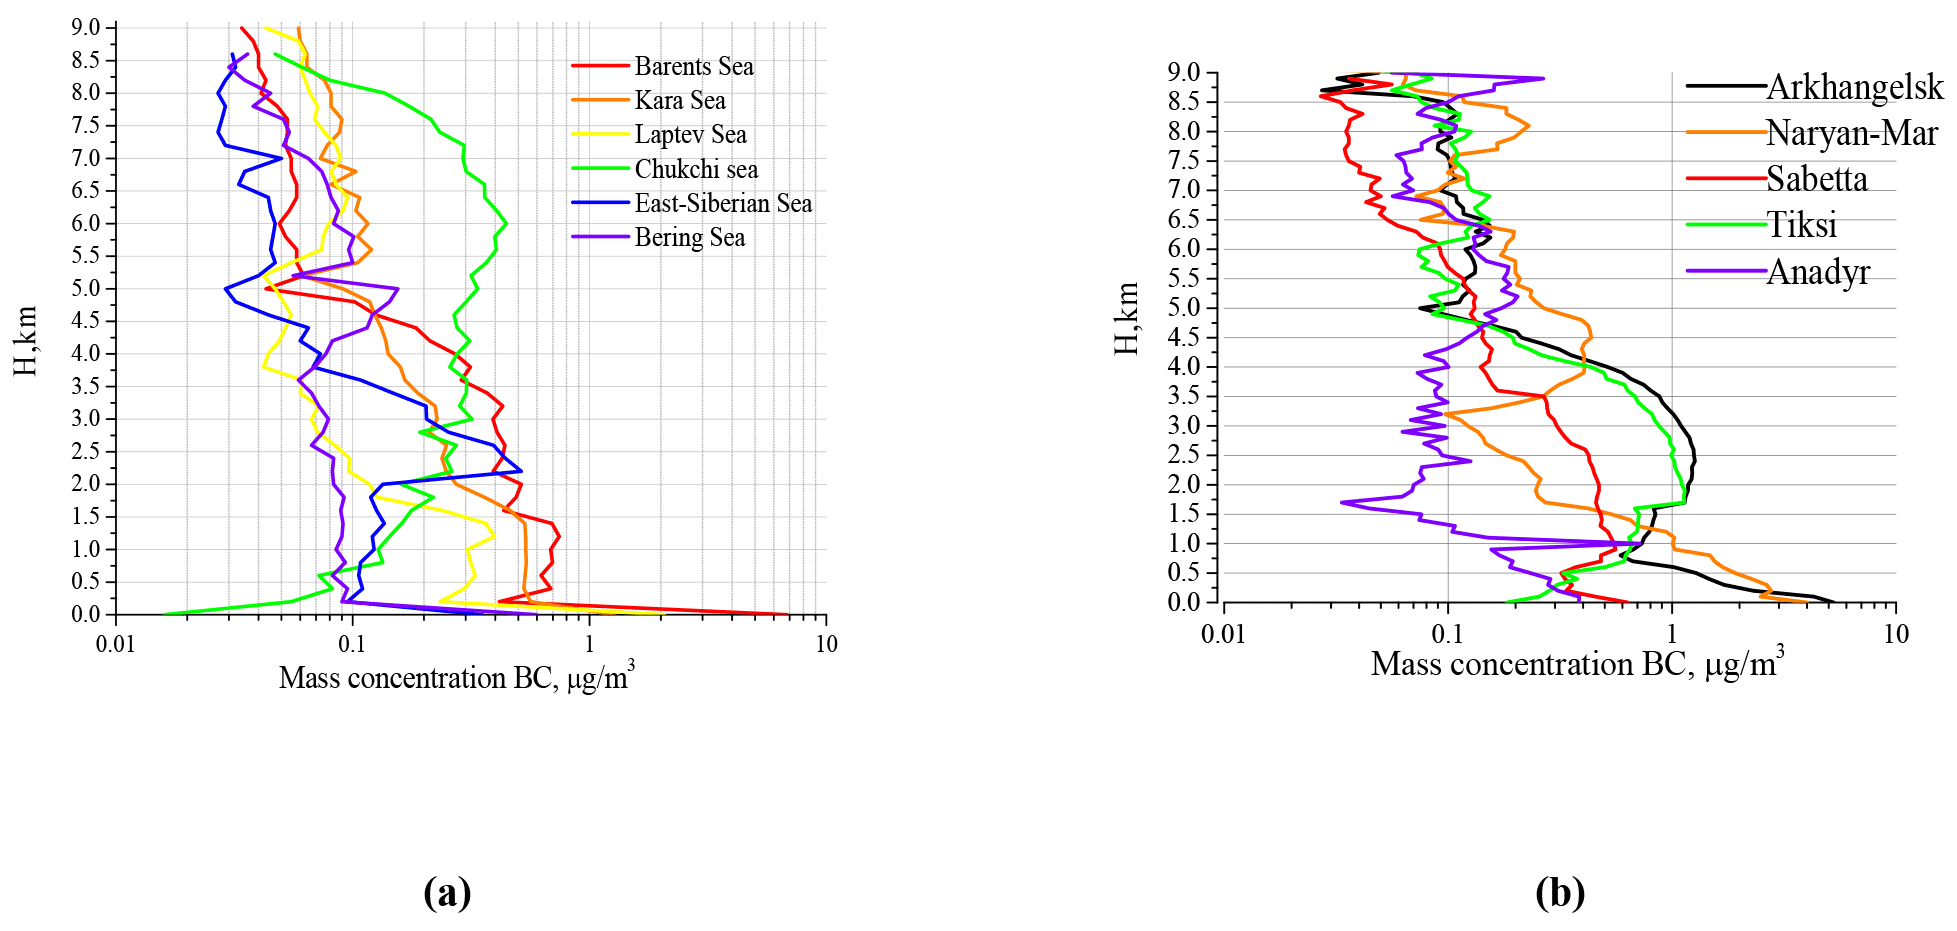
Figure 20Vertical profiles of the eBC mass concentration on 4–17 September 2020: over (a) sea and (b) coastal areas.
Comparing the data of measurements of the scattering coefficients and BC concentration, we note that in most cases, σd and BC recorded in the lower 5 km layer over coastal areas exceed the values recorded over the sea several times.
4.3 Lidar data on sensing of the water surface
In flights over the Arctic seas at altitudes of ∼ 200 m, the water column was sensed with a LOZA-A2 lidar. The extinction coefficient in water, which is one of the primary characteristics of water optical properties, was retrieved from the recorded lidar profiles of echo signals of the polarized channel at 532 nm. The values of the extinction coefficient allow estimation of the degree of water pollution or turbidity. The relative content of chlorophyll can be found from measurements of the signal of laser-induced fluorescence of the photosynthesizing pigment of phytoplankton (chlorophyll a) in the 680 nm channel. This parameter characterizes phytoplankton biomass and is a key characteristic for calculating the productivity of the ocean and seas. In connection with global warming, some scientists predict an increase in the biological productivity of the Arctic Ocean (Babin, 2020; Lewis et al., 2020; Pandolfii et al., 2020). That is why the study of this characteristic in the experiment was very important.
The results of sensing of the surface water column are generalized in Table 7.
Table 7Water extinction coefficient in the upper layer of the ocean and the presence of organic matter in the seas of the Russian sector of the Arctic.
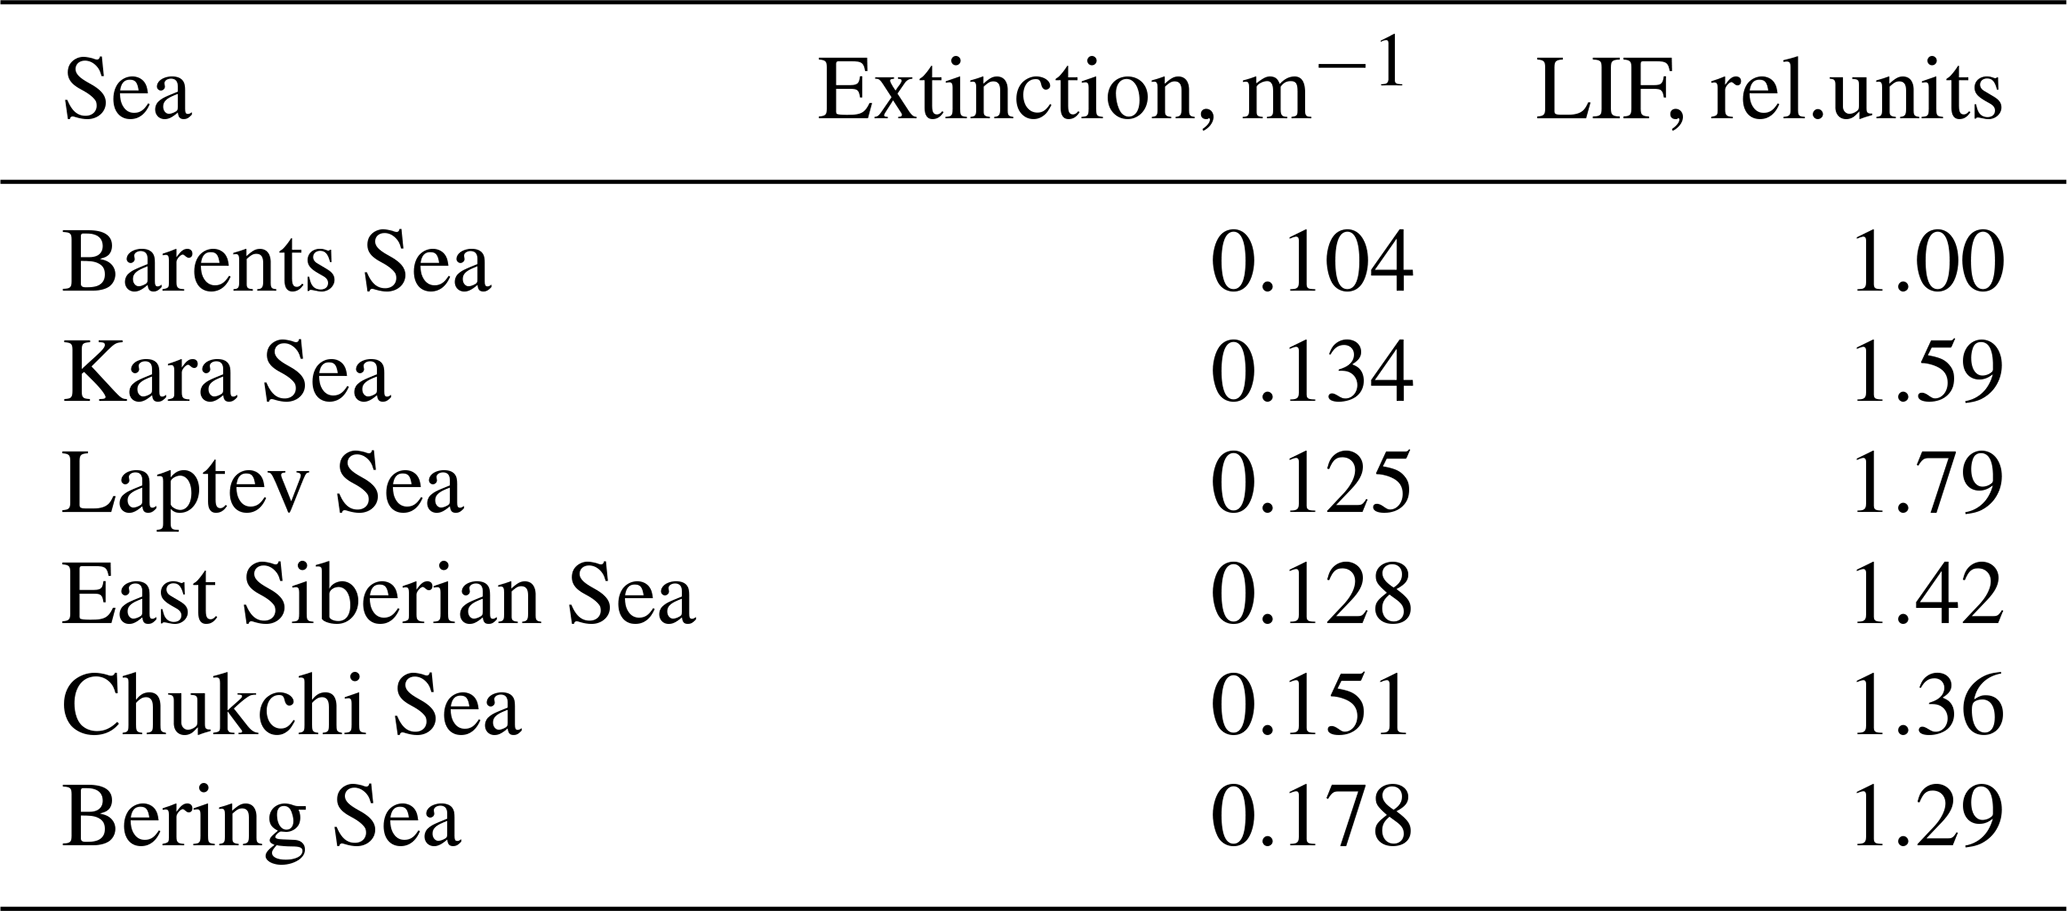
It should be noted that the data were obtained on limited sections of the flight route and cannot representatively characterize the average optical properties of water throughout the sea. Nevertheless, they are quite informative for the joint analysis of the spatial distribution of the extinction coefficient in water and chlorophyll fluorescence obtained in simultaneous measurements. The upper water layer in the Chukchi and Bering seas was the most turbid during the experiment. The Barents Sea turned out to be the most transparent. The differences in extinction varied by more than a factor of 1.5.
A tendency to an increase in chlorophyll fluorescence in more transparent waters was observed in all the measurements, except for the Barents Sea. Apparently, the turbidity of the ocean was determined by the nonorganic component. The data of sensing of the optical properties of water in the Barents Sea had minimal values. They were used to normalize the relative variation in the phytoplankton concentration. The mostly maximal LIF values were recorded near the coastline, as, for example, near Vaigach Island in the Kara Sea and Faddeevsky Island in the Laptev Sea. These values decreased with distance from the coast.
An unusual, in this relation, spatial distribution was revealed from the results of retrieving the optical properties of water from the data of airborne laser sensing in the Bering Sea. Figure 21 shows the plots of the LIF values and the extinction coefficient in the surface water layer at the flight section at an altitude of 200 m in Anadyr Bay on 16 September 2020. It can be seen from the figure that the extinction coefficient decreases and the LIF signal increases with the distance from the coast. This feature of the spatial distribution of chlorophyll concentration is characteristic of semi-enclosed water areas of bays on the shelf zone of the seas affected by dynamic hydrophysical processes. As was shown in Navrotsky et al. (2019) based on the analysis of satellite observations of chlorophyll concentration in Peter the Great Bay (Sea of Japan), this spatial distribution “is determined by the effect of currents generating shelf waves, which cause the outflow of phytoplankton concentration from the coastal zone”.
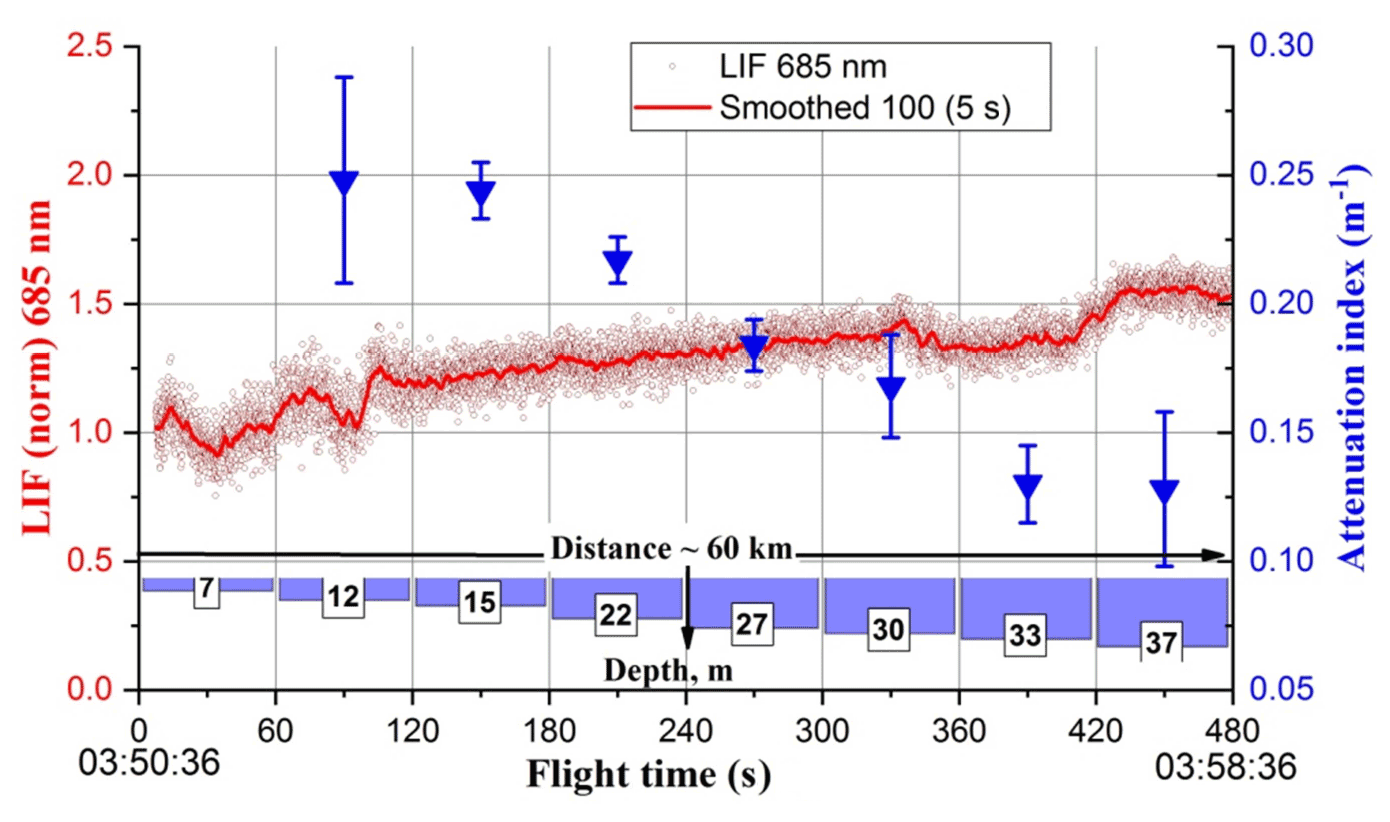
Figure 21Relative chlorophyll concentration and the water extinction coefficient in the Anadyr Bay of the Bering Sea according to laser sensing data on 16 September 2020.
The results shown in Fig. 21 demonstrate the high sensitivity and spatial resolution in determining the optical properties of the surface water column by airborne laser sensing of the seas.
This paper presents the tentative results obtained during the special experiment on airborne sensing of the troposphere in the Russian sector of the Arctic. For this experiment, the equipment of the Optik Tu-134 aircraft laboratory was significantly supplemented; namely a NOx gas analyzer, a BC meter (AE-33 Aethalometer), and a PSR-1100F spectroradiometer were installed. The navigation system was replaced with a specially developed CompaNav-5.2 navigation system, which combined navigation sensors with repeaters. To expand the lidar capabilities, a fluorescent channel was created to record the laser-induced fluorescence of photosynthetic phytoplankton pigments during the sensing of aquatic environments.
With the modernized measurement system of the Optik Tu-134 aircraft laboratory, the sensing of the air composition was carried out for a short period (4–17 September 2020) over all seas and coastal areas of the Russian sector of the Arctic and the Bering Sea. The concentrations of CO, CO2, CH4, NO, NO2, SO2, O3, aerosol, and black carbon have been measured. Air samples were taken to determine organic and inorganic aerosol components and bioaerosol. The LOZA-2 lidar was used for sensing of the turbidity of the upper water layer and determination of the phytoplankton concentration in water. Installation of the spectroradiometer on board the aircraft laboratory made it possible to determine the spectral characteristics of the water and underlying coastal surface. The data are currently being processed.
The primary results showed that the concentrations of CO, NO, NO2, SO2, O3, aerosol, and BC during the experiment had very low values typical for background regions. Low concentrations of CO2 were observed over the seas in the near-surface layer, which indicates the absorption of this gas by the ocean. The methane concentrations recorded over all seas of the Russian sector of the Arctic and the Bering Sea were increased compared to the coastal areas. Whether the methane was of oceanic origin or was transported from land is not clear yet, since the back trajectories start on the continent. To clarify this issue, numerical simulation is now being carried out, and the special land–ocean experiment is planned for 2022.
Software codes can be obtained from the authors on request.
Data measurements are available on request to bbd@iao.ru.
BDB, VEB, AVM and IAM planned the campaign; PNA, MYA, SBB, DGC, DKD, AVF, GAI, SNK, ASK, AVK, SVN, OVO, SEO, IEP, DES, DVS, TKS, GNT and PNZ performed the measurements; GA, ISA, VGA, KL, PN, MVP, IVP, TMR, and IKR analyzed the data; BDB, YSB, and ASS wrote the manuscript draft; JDP, OAR and SVY reviewed and edited the manuscript.
The contact author has declared that neither they nor their co-authors have any competing interests.
Publisher's note: Copernicus Publications remains neutral with regard to jurisdictional claims in published maps and institutional affiliations.
We would like to acknowledge our colleagues from the following organizations for their assistance in organizing and conducting this campaign: Laboratoire des sciences du climat et de l'environnement and Laboratoire atmosphères, milieux, observations spatiales (France); Finnish Meteorological Institute and Institute for Atmospheric and Earth System Research, University of Helsinki (Finland); Center for Global Environmental Research at the National Institute for Environmental Studies (Japan); the National Oceanic and Atmospheric Administration, US Department of Commerce (USA); Max-Planck-Institute for Biochemistry (Germany); and University of Reading (UK). We acknowledge the support of the YAK-AEROSIB programme and the ERA-PLANET iCUPE project.
The work was carried out using the TU-134 Optik laboratory aircraft with the financial support of the Ministry of Science and Higher Education of the Russian Federation (agreement no. 075-15-2021-934). Publisher’s note: the article processing charges for this publication were not paid by a Russian or Belarusian institution.
This paper was edited by Linlu Mei and reviewed by two anonymous referees.
Agranovski, I. (Ed.): Aerosols–Science and Technology, Wiley-VCH, Wienheim, ISBN 978-3-527-32660-0, 2010.
Alekseev G. V., Vyazilova A. E., Glok N. I., Ivanov N. E., and Kharlanenkova N. E.: The effect of water temperature anomalies at low latitudes of the ocean on Arctic climate variations and their predictability, Arctic: Ecology and Economy, 3, 73–83, http://eng.arctica-ac.ru/article/444/ (last access: 3 June 2022), 2019 (in Russian).
Ancellet, G., Penner, I. E., Pelon, J., Mariage, V., Zabukovec, A., Raut, J. C., Kokhanenko, G., and Balin, Y. S.: Aerosol monitoring in Siberia using an 808 nm automatic compact lidar, Atmos. Meas. Tech., 12, 147–168, https://doi.org/10.5194/amt-12-147-2019, 2019.
Andreeva, I. S., Safatov, A. S., Puchkova, L. I., Emelyanova, E. K., Buryak, G. A., Olkin, S. E., Reznikova, I. K., and Okhlopkova, O. V.: Cultured microorganisms in high-altitude air aerosol samples of the North of Siberia during aircraft sensing of the atmosphere, West Biological Sciences, 2, 3–11, https://vestnik.nvsu.ru/2311-1402/article/view/49615 (last access: 3 June 2022), 2019 (in Russian).
Anisimov, O. A., Zimov, S. A., Volodin, E. M., and Lavrov S. A.: Methane Emission in the Russian Permafrost Zone and Evaluation of Its Impact on Global Climate, Russ. Meteorol. Hydrol., 45, 377–385, https://doi.org/10.3103/S106837392005009X, 2020.
Ankilov, A., Baklanov, A., Colhoun, M., Enderle, K. H., Gras, J., Julanov, Y., Kaller, D., Lindner, A., Lushnikov, A. A., Mavliev, R., McGovern, F., Mirme, A., O'Connor, T. C., Podzimek, J., Preining, O., Reischl, G. P., Rudolf, R., Sem, G. J., Szymanski, W. W., Tamm, E., Vrtala, A. E., Wagner, P. E., Winklmayr, W., and Zagaynov, V.: Intercomparison of number concentration measurements by various aerosol particle counters, Atmos. Res., 62, 177–207, 2002.
Anokhin, G. G., Àntokhin, P. N., Arshinov, M. Y., Barsuk, V. E., Belan, B. D., Belan, S. B., Davydov, D. K., Ivlev, G. A., Kozlov, A. V., Kozlov, V. S., Morozov, M. V., Panchenko, M. V., Penner, I. E., Pestunov, D. A., Sikov, G. P., Simonenkov, D. V., Sinitsyn, D. S., Tolmachev, G. N., Filipov, D. V., Fofonov, A. V., Chernov, D. G., Shamanaev, V. S., and Shmargunov, V. P.: OPTIK Tu-134 aircraft laboratory, Atmos. Oceanic Opt., 24, 805–816, 2011 (in Russian).
Àntokhin, P. N. and Belan, B. D.: Control for dynamics of the tropospheric ozone through stratosphere, Atmos. Oceanic Opt., 26, 207–213, https://doi.org/10.1134/S1024856013030032, 2013.
Antokhin, P. N., Arshinov, M. Y., Belan, B. D., Davydov, D. K., Zhidovkin, E. V., Ivlev, G. A., Kozlov, A. V., Kozlov, V. S., Panchenko, M. V., Penner, I. E., Pestunov, D. A., Simonenkov, D. V., Tolmachev, G. N., Fofonov, A. V., Shamanaev, V. S., and Shmargunov, V. P.: Optik-É AN-30 Aircraft Laboratory for Studies of the Atmospheric Composition, J. Atmos. Ocean. Tech., 29, 64–75, https://doi.org/10.1175/2011JTECHA1427.1, 2012.
Àntokhin, P. N., Arshinova, V. G., Arshinov, M. Y., Belan, B. D., Belan, S. B., Davydov, D. K., Ivlev, G. A., Kozlov, A. V., Nedelek, F., Paris, J.-D., Rasskazchikova, T. M., Savkin, D. E., Simonenkov, D. V., Sklyadneva, T. K., Tolmachev, G. N., and Fofonov A. V: Large-scale studies of gaseous and aerosol composition of air over Siberia, Atmospheric and Oceanic Optics, 27, 232–239, 2014 (in Russian).
Antokhin, P. N., Arshinova, V. G., Arshinov, M. Y., Belan, B. D., Belan, S. B., Davydov, D. K., Ivlev, G. A., Fofonov, A. V., Kozlov, A. V., Paris, J.-D., Nedelec, P., Rasskazchikova, T. M., Savkin, D. E., Simonenkov, D. V., Sklyadneva, T. K., and Tolmachev, G. N.: Distribution of trace gases and aerosols in the troposphere over Siberia during wildfires of summer 2012, J. Geophys. Res.-Atmos., 123, 2285–2297, https://doi.org/10.1002/2017JD026825, 2018.
Antokhina, O. Y., Àntokhin, P. N., Arshinova, V. G., Arshinov, M. Y., Belan, B. D., Belan, S. B., Davydov, D. K., Ivlev, G. A., Kozlov, A. V., Nedelec, P., Paris, J.-D.., Rasskazchikova, T. M., Savkin, D. E., Simonenkov, D. V., Sklyadneva, T. K., Tolmachev, G. N., and Fofonov, A. V.: The vertical distributions of gaseous and aerosol admixtures in air over the Russian Arctic, Atmos. Oceanic Opt., 31, 300–310, https://doi.org/10.1134/S102485601803003X, 2018.
Arnold, S. R., Law, K. S., Brock, C. A., Thomas, J. L., Starkweather, S. M., Salzen, K., Stohl, A., Sharma, S., Lund, M. T., Flanner, M. G., Petaja, T., Tanimoto, H., Gamble, J., Dibb, J. E., Melamed, M., Johnson, N., Fider, M., Tynkkynen, V.-P., Baklanov, A., Eckhardt, S., Monks, S. A., Browse, J., and Bozem, H.: Arctic air air pollution: Challenges and opportunities for the next decade, Elementa: Sci. Atmos., 4, 000104, https://doi.org/10.12952/journal.elementa.000104, 2016.
Arshinov, M. Y., Belan, B. D., Davydov, D. K., Ivlev, G. A., Kozlov, A. V., Pestunov, D. A., Pokrovskii, E. V., Tolmachev, G. N., and Fofonov, A. V.: Sites for monitoring of greenhouse gases and gases oxidizing the atmosphere, Atmospheric and Oceanic Optics, 20, 45–53, 2007.
Asmi, E., Kondratyev, V., Brus, D., Laurila, T., Lihavainen, H., Backman, J., Vakkari, V., Aurela, M., Hatakka, J., Viisanen, Y., Uttal, T., Ivakhov, V., and Makshtas, A.: Aerosol size distribution seasonal characteristics measured in Tiksi, Russian Arctic, Atmos. Chem. Phys., 16, 1271–1287, https://doi.org/10.5194/acp-16-1271-2016, 2016.
Assonov, S. S., Brenninkmeijer, C. A. M., Jöckel, P., Mulvaney, R., Bernard, S., and Chappellaz, J.: Evidence for a CO increase in the SH during the 20th century based on firn air samples from Berkner Island, Antarctica, Atmos. Chem. Phys., 7, 295–308, https://doi.org/10.5194/acp-7-295-2007, 2007.
Babin, M.: Climate change tweaks Arctic marine ecosystems, Science, 369, 137–138, https://doi.org/10.1126/science.abd1231, 2020.
Baklanov, A. M., Kozlov, V. S., Panchenko, M. V., Ankilov, A. N., and Vlasenko, A. L.: Generation of soot particles in submicron range, J. Aerosol Sci., 29, 919–920, https://doi.org/10.1016/S0021-8502(98)90642-5, 1998.
Berchet, A., Paris, J.-D., Ancellet, G., Law, K. S., Stohl, A., Nédélec, P., Arshinov, M. Y., Belan, B. D., and Ciais, P.: Tropospheric ozone over Siberia in spring 2010: remote influences and stratospheric intrusion, Tellus B, 65, 19688, https://doi.org/10.3402/tellusb.v65i0.19688, 2013.
Berchet, A., Bousquet, P., Pison, I., Locatelli, R., Chevallier, F., Paris, J.-D., Dlugokencky, E. J., Laurila, T., Hatakka, J., Viisanen, Y., Worthy, D. E. J., Nisbet, E., Fisher, R., France, J., Lowry, D., Ivakhov, V., and Hermansen, O.: Atmospheric constraints on the methane emissions from the East Siberian Shelf, Atmos. Chem. Phys., 16, 4147–4157, https://doi.org/10.5194/acp-16-4147-2016, 2016.
Berchet, A., Pison, I., Crill, P. M., Thornton, B., Bousquet, P., Thonat, T., Hocking, T., Thanwerdas, J., Paris, J.-D., and Saunois, M.: Using ship-borne observations of methane isotopic ratio in the Arctic Ocean to understand methane sources in the Arctic, Atmos. Chem. Phys., 20, 3987–3998, https://doi.org/10.5194/acp-20-3987-2020, 2020.
Bogoyavlensky, V. I., Bogoyavlensky, I. V., Kargina, T. N., Nikonov, R. A., and Sizov, O. S.: Earth degassing in the Artic: remote and field studies of the thermokarst lakes gas eruption, Arctic: Ecology and Economy, 2, 31–47, https://doi.org/10.25283/2223-4594-2019-2-31-47, 2019 (in Russian).
Bogoyavlensky, V. I., Sizov, O. S., Nikonov, R. A., Bogoyavlensky, I. V., and Kargina, T. A.: Earth degassing in the Arctic: the genesis of natural and anthropogenic methane emissions, Arctic: Ecology and Economy, 3, 6–22, https://doi.org/10.25283/2223-4594-2020-3-6-22, 2020 (in Russian).
Bozem, H., Hoor, P., Kunkel, D., Köllner, F., Schneider, J., Herber, A., Schulz, H., Leaitch, W. R., Aliabadi, A. A., Willis, M. D., Burkart, J., and Abbatt, J. P. D.: Characterization of transport regimes and the polar dome during Arctic spring and summer using in situ aircraft measurements, Atmos. Chem. Phys., 19, 15049–15071, https://doi.org/10.5194/acp-19-15049-2019, 2019.
Brouillette, M.: The buried carbon bomb, Nature, 591, 360–362, https://doi.org/10.1038/d41586-021-00659-y, 2021
Cassidy, A. E., Christen, A., and Henry, G. H. R.: The effect of a permafrost disturbance on growing-season carbon-dioxide fluxes in a high Arctic tundra ecosystem, Biogeosciences, 13, 2291–2303, https://doi.org/10.5194/bg-13-2291-2016, 2016.
Davydov, D. K., Belan, B. D., Àntokhin, P. N., Antokhina, O. Y., Antonovich, V. V., Arshinova, V. G., Arshinov, M. Y., Akhlyostin, A. Y., Belan, S. B., Dudorova, N. V., Ivlev, G. A., Kozlov, A. V., Pestunov, D. A., Rasskazchikova, T. M., Savkin, D. E., Simonenkov, D. V., Sklyadneva, T. K., Tolmachev, G. N., Fazliev, A. Z., and Fofonov, A. V.: Monitoring of Atmospheric Parameters: 25 Years of the Tropospheric Ozone Research Station of the Institute of Atmospheric Optics, Siberian Branch, Russian Academy of Sciences, Atmos. Oceanic Opt., 32, 180–192, https://doi.org/10.1134/S1024856019020052, 2019.
Delmas, R. Y. and Legrand, M.: Trends recorded in Greenland in relation with northern hemisphere anthropogenic pollution, IGACtivities Newsletter, 14, 19–22, https://igacproject.org/sites/default/files/2016-07/Issue_14_Sep_1998.pdf (last access: 3 June 2022), 1998.
Elder, C. D., Thompson, D. R., Thorpe, A. K., Hanke, P., Walter Anthony, K. M., and Mille, C. E.: Airborne mapping reveals emergent power law of Arctic methane emissions, Geophys. Res. Lett., 47, e2019GL085707, https://doi.org/10.1029/2019GL085707, 2020.
Eremenko, S. and Ankilov A.: Conversion of the diffusion battery data to particle size distribution: Multiple Solutions Averaging algorithm (MSA), J. Aerosol Sci., 26, S749–S750, https://doi.org/10.1016/0021-8502(95)97282-J, 1995.
France, J. L., Cain, M., Fisher, R. E., Lowry, D., Allen, G., Shea, S. J. O., Illingworth, S., Pyle, J., Warwick, N., Jones, B. T., Gallagher, M. W., Bower, K., Breton, M. L., Percival, C., Muller, J., Wellpott, A., Bauguitte, S., George, C., Hayman, G. D., Manning, A. J., Myhre, C. L., Lanoiselle, M., and Nisbet, E. G.: Measurements of δ13C in CH4 and using particle dispersion modeling to characterize sources of Arctic methane within an air mass, J. Geophys. Res.-Atmos., 121, 14257–14270, https://doi.org/10.1002/2016JD026006, 2016.
Galloway, J. N., Winiwarter, W., Leip, A., Leach, A. M., Bleeker, A., and Erisman, J. W.: Nitrogen footprints: past, present and future, Environ. Res. Lett., 9, 115003, https://doi.org/10.1088/1748-9326/9/11/115003, 2014.
Giamarelou, M., Eleftheriadis, K., Nyeki, S., Torseth, K., and Biskos, G.: Indirect evidence of the composition of nucleation mode atmospheric particles in the high Arctic, J. Geophys. Res.-Atmos., 121, 965–975, https://doi.org/10.1002/2015JD023646, 2016.
Glinka, N. L.: General chemistry, Leningrad, Chemistry, 702 p., 1985 (in Russian).
Hansen, A. D. A., Rosen, H., and Novakov, T.: The Aethalometer – an instrument for the real-time measurement of optical absorption by aerosol particles, Sci. Total Environ., 36, 191–196, 1984.
Ivakhov, V. M., Paramonova, N. N., Privalov, V. I., Karol, I. L., Kiselev, A. A., Zinchenko, A. V., Semenets, E. S., and Polishchuk, V. Y.: Observations of methane atmospheric concentration and fluxes at Novy Port station (Yamal peninsula), in: Proceeding of MGO, 596, 78–95, https://elibrary.ru/contents.asp?id=44071065 (last access: 16 June 2022), 2020 (in Russian).
Jaenicke, R.: Tropospheric aerosols, in: Aerosol-Cloud-Climate Interactions, edited by: Hobs, P. V., Academic Press, San Diego, CA, 1–31, 1993.
Jammet, M., Crill, P., Dengel, S., and Friborg T.: Large methane emissions from a subarctic lake during spring thaw: Mechanisms and landscape significance, J. Geophys. Res.-Biogeo., 120, 2289–2305, https://doi.org/10.1002/2015JG003137, 2015.
Karol, I. L.: Current status of the problem of small impurities in the atmosphere and assessment of their impact on global climate change, in: the book Climate Change and Its Effects, Nauka, Saint-Petersburg, 36–44, 2002 (in Russian).
Knutson, E. O.: History of Diffusion Batteries in Aerosol Measurements, Aerosol Sci. Tech., 31, 83–128, https://doi.org/10.1080/027868299304192, 1999.
Kozlov, V. S., Shmargunov, V. P., and Pol'kin, V. V.: Spectrophotometers for Investigation of Characteristics of Radiation Absorption by Aerosol Particles, Pribory i Tekhnika Eksperimenta 2008, N5, p. 155–157, https://elibrary.ru/item.asp?id=11479999 (last access: 16 June 2022), 2008.
Kozlov, V. S., Panchenko, M. V., Shmargunov, V. P., Chernov, D. G., Yausheva, E. P., Pol'kin, V. V., and Terpugova, S. A.: Long-Term Investigations of the Spatiotemporal Variability of Black Carbon and Aerosol Concentrations in the Troposphere of West Siberia and Russian Subarctic, Chemistry for Sustainable Development, 24, 423–440, https://sibran.ru/en/journals/issue.php?ID=168378&ARTICLE_ID=168379 (last access: 16 June 2022), 2016.
Kulmala, M., Nieminen, T., Chellapermal, R., Makkonen, R., Back, J., and Kerminen, V.-M.: Climate feedbacks linking the increasing atmospheric CO2 concentration, BVOC emissions, aerosols and clouds in forest ecosystems, in: Biology, controls and model tree volatile organic compound emissions, edited by: Niinemets, U. and Monson, R. K., Springer, Dordrecht, 489–508, ISBN 978-94-007-6605-1, 2010.
Kupiszewski, P., Leck, C., Tjernström, M., Sjogren, S., Sedlar, J., Graus, M., Müller, M., Brooks, B., Swietlicki, E., Norris, S., and Hansel, A.: Vertical profiling of aerosol particles and trace gases over the central Arctic Ocean during summer, Atmos. Chem. Phys., 13, 12405–12431, https://doi.org/10.5194/acp-13-12405-2013, 2013.
Kutsenogii, K. P. (Ed.): Aerosols of Siberia, Novosibirsk: Science, 2006.
Kylling, A., Zwaaftink, G. C. D., and Stohl, A.: Mineral dust instantaneous radiative forcing in the Arctic, Geophys. Res. Lett., 45, 4290–4298, https://doi.org/10.1029/2018GL077346, 2018.
Law, K. S., Stohl, A., Quinn, P. K., Brock, C. A., Burkhart, J. F., Paris, J. D., Ancellet, G., Singh, B., Roiger, A., and Schlager, H.: Arctic air pollution, B. Am. Meteorol. Soc., 95, 1873–1895, https://doi.org/10.1175/BAMS-D-13-00017.1, 2014.
Leaitch, W. R., Korolev, A., Aliabadi, A. A., Burkart, J., Willis, M. D., Abbatt, J. P. D., Bozem, H., Hoor, P., Köllner, F., Schneider, J., Herber, A., Konrad, C., and Brauner, R.: Effects of 20–100 nm particles on liquid clouds in the clean summertime Arctic, Atmos. Chem. Phys., 16, 11107–11124, https://doi.org/10.5194/acp-16-11107-2016, 2016.
Lefohn, A. S., Husar, J. D., and Husar, R. B.: Estimating historical anthropogenic global sulfur emission patterns for the period 1850–1990, Atmos. Environ., 33, 3435–3444, https://doi.org/10.1016/S1352-2310(99)00112-0, 1999.
Lewis, K. M., van Dijken, G. L., and Arrigo, K. R.: Changes in phytoplankton concentration now drive increased Arctic Ocean primary production, Science, 369, 198–202, https://doi.org/10.1126/science.aay8380, 2020.
Li, Y., Fichot, C. G., Geng, L., Scarratt, M. G., and Xie, H.: The contribution of methane photoproduction to the oceanic methane paradox, Geophys. Res. Lett., 47, e2020GL088362, https://doi.org/10.1029/2020GL088362, 2020.
Makosko, A. A. and Matesheva, A. V.: Assessment of the long-range pollution trends of the atmosphere in the Arctic zone of Russia in 1980–2050 considering climate change scenarios, Arctic: Ecology and Economy, 1, 45–52, https://doi.org/10.25283/2223-4594-2020-1-45-52, 2020 (in Russian).
Mariage, V., Pelon, J., Blouzon, F., Victori, S., Geyskens, N., Amarouche, N., Drezen, C., Guillot, A., Calzas, M., Garracio, M., Wegmuller, N., Sennéchael, N., and Provost, C.: IAOOS microlidar-on-buoy development and first atmospheric observations obtained during 2014 and 2015 arctic drifts, Opt. Express, 25, A73–A84, https://doi.org/10.1364/OE.25.000A73, 2017.
Marushchak, M. E., Friborg, T., Biasi, C., Herbst, M., Johansson, T., Kiepe, I., Liimatainen, M., Lind, S. E., Martikainen, P. J., Virtanen, T., Soegaard, H., and Shurpali, N. J.: Methane dynamics in the subarctic tundra: combining stable isotope analyses, plot- and ecosystem-scale flux measurements, Biogeosciences, 13, 597–608, https://doi.org/10.5194/bg-13-597-2016, 2016.
Nagurnyi, A. P.: Analysis of measurement data on carbon dioxide concentration in the near-ice surface atmosphere at North Pole-35 drifting ice station (2007–2008), Russ. Meteorol. Hydrol., 35, 619–623, https://doi.org/10.3103/S1068373910090062, 2010.
Nagurnyi, A. P. and Makshtas, A. P.: Methane concentration in the atmospheric boundary layer from the measurements at north pole-36 and north pole-39 drifting ice stations, Russ. Meteorol. Hydrol., 41, 199–204, https://doi.org/10.3103/S1068373916030055, 2016.
Najafi, M. R., Zwiers, F. W., and Gillett, N. P.: Attribution of Arctic temperature change to grenhouse-gas and aerosol influences, Nat. Clim. Change, 5, 246–249, https://doi.org/10.1038/nclimate2524, 2015.
Nasonov, S., Balin, Y., Klemasheva, M., Kokhanenko, G., Novoselov, M., Penner, I., Samoilova, S., and Khodzher, T.: Mobile aerosol Raman polarizing lidar LOSA-A2 for atmospheric sounding, Atmosphere, 11, 1032, https://doi.org/10.3390/atmos11101032, 2020.
Navrotsky, V. V., Dubina, V. A., Pavlova, E. P., and Khrapchenkov, F. F.: Analysis of satellite observations of chlorophyll concentration in Peter the Great Bay (Sea of Japan), Modern Problems of Remote Sensing of the Earth from Space, 16, 158–170, https://doi.org/10.21046/2070-7401-2019-16-1-158-170, 2019.
Nisbet, E. G., Fisher, R. E., Lowry, D., France, J. L., Allen, G., Bakkaloglu, S., Broderick, T. J., Cain, M., Coleman, M., Fernandez, J., Forster, G., Griffiths, P. T., Iverach, C. P., Kelly, B. F. J., Manning, M. R., Nisbet-Jones, P. B. R., Pyle, J. A., Townsend-Small, A., al-Shalaan, A., Warwick, N., and Zazzeri, G.: Methane mitigation: methods to reduce emissions, on the path to the Paris agreement, Rev. Geophys., 58, e2019RG000675, https://doi.org/10.1029/2019RG000675, 2020.
Nomura, D., Granskog, M. A., Fransson, A., Chierici, M., Silyakova, A., Ohshima, K. I., Cohen, L., Delille, B., Hudson, S. R., and Dieckmann, G. S.: CO2 flux over young and snow-covered Arctic pack ice in winter and spring, Biogeosciences, 15, 3331–3343, https://doi.org/10.5194/bg-15-3331-2018, 2018.
O'Shea, S. J., Allen, G., Gallagher, M. W., Bower, K., Illingworth, S. M., Muller, J. B. A., Jones, B. T., Percival, C. J., Bauguitte, S. J.-B., Cain, M., Warwick, N., Quiquet, A., Skiba, U., Drewer, J., Dinsmore, K., Nisbet, E. G., Lowry, D., Fisher, R. E., France, J. L., Aurela, M., Lohila, A., Hayman, G., George, C., Clark, D. B., Manning, A. J., Friend, A. D., and Pyle, J.: Methane and carbon dioxide fluxes and their regional scalability for the European Arctic wetlands during the MAMM project in summer 2012, Atmos. Chem. Phys., 14, 13159–13174, https://doi.org/10.5194/acp-14-13159-2014, 2014.
Panchenko, M. V., Pol’kin, V. V., Pol’kin, V. V., Kozlo, V. S., Yausheva, E. P., and Shmargunov, V. P.: Size Distribution of Dry Matter of Particles in the Surface Atmospheric Layer in the Suburban Region of Tomsk within the Empirical Classification of Aerosol Weather Types, Atmos. Oceanic Opt., 32, 655–662, https://doi.org/10.1134/S1024856019060113, 2019.
Pandolfii, J. M., Staples, T. L., and Kiessling, W.: Increased extinction in the emergence of novel ecological communities, Science, 370, 220–222, https://doi.org/10.1126/science.abb3996, 2020.
Paris, J.-D., Ciais, P., Nédélec, P., Ramonet, M., Belan, B. D., Arshinov, M. Y., Golytsin, G. S., Granberg, I., Athier, G., Boumard, F., Cousin, J.-M., Cayez, G., and Stohl, A.: The YAK-AEROSIB transcontinental aircraft campaigns: new insights on the transport of CO2, CO and O3 across Siberia and in the Northern Hemisphere, Tellus B, 60, 551–568, https://doi.org/10.1111/j.1600-0889.2008.00369.x, 2008.
Paris, J.-D., Stohl, A., Nédélec, P., Arshinov, M. Y., Panchenko, M. V., Shmargunov, V. P., Law, K. S., Belan, B. D., and Ciais, P.: Wildfire smoke in the Siberian Arctic in summer: source characterization and plume evolution from airborne measurements, Atmos. Chem. Phys., 9, 9315–9327, https://doi.org/10.5194/acp-9-9315-2009, 2009a.
Paris, J.-D., Arshinov, M. Y., Ciais, P., Belan, B. D., and Nédélec, P.: Large-scale aircraft observations of ultra-fine and fine particle concentrations in the remote Siberian troposphere: New particle formation studies, Atmos. Environ., 43, 1302–1309, https://doi.org/10.1016/j.atmosenv.2008.11.032, 2009b.
Paris, J.-D., Ciais, P., Nedelec, P., Stohl, A., Belan, B. D., Arshinov, M. Y., Carouge, C., Golitsyn, G. S., and Granberg, I. G.: New insights on the chemical composition of the Siberian air shed from the YAK AEROSIB aircraft campaigns, B. Am. Meteorol. Soc., 91, 625–641, https://doi.org/10.1175/2009BAMS2663.1, 2010.
Peregud, E. A. and Gorelik, D. O.: Instrumental methods of air pollution control, Leningrad: Chemistry, 384 p., 1981.
Petäjä, T., Duplissy, E.-M., Tabakova, K., Schmale, J., Altstädter, B., Ancellet, G., Arshinov, M., Balin, Y., Baltensperger, U., Bange, J., Beamish, A., Belan, B., Berchet, A., Bossi, R., Cairns, W. R. L., Ebinghaus, R., El Haddad, I., Ferreira-Araujo, B., Franck, A., Huang, L., Hyvärinen, A., Humbert, A., Kalogridis, A.-C., Konstantinov, P., Lampert, A., MacLeod, M., Magand, O., Mahura, A., Marelle, L., Masloboev, V., Moisseev, D., Moschos, V., Neckel, N., Onishi, T., Osterwalder, S., Ovaska, A., Paasonen, P., Panchenko, M., Pankratov, F., Pernov, J. B., Platis, A., Popovicheva, O., Raut, J.-C., Riandet, A., Sachs, T., Salvatori, R., Salzano, R., Schröder, L., Schön, M., Shevchenko, V., Skov, H., Sonke, J. E., Spolaor, A., Stathopoulos, V. K., Strahlendorff, M., Thomas, J. L., Vitale, V., Vratolis, S., Barbante, C., Chabrillat, S., Dommergue, A., Eleftheriadis, K., Heilimo, J., Law, K. S., Massling, A., Noe, S. M., Paris, J.-D., Prévôt, A. S. H., Riipinen, I., Wehner, B., Xie, Z., and Lappalainen, H. K.: Overview: Integrative and Comprehensive Understanding on Polar Environments (iCUPE) – concept and initial results, Atmos. Chem. Phys., 20, 8551–8592, https://doi.org/10.5194/acp-20-8551-2020, 2020.
Petzold, A., Ogren, J. A., Fiebig, M., Laj, P., Li, S.-M., Baltensperger, U., Holzer-Popp, T., Kinne, S., Pappalardo, G., Sugimoto, N., Wehrli, C., Wiedensohler, A., and Zhang, X.-Y.: Recommendations for reporting “black carbon” measurements, Atmos. Chem. Phys., 13, 8365–8379, https://doi.org/10.5194/acp-13-8365-2013, 2013.
Pipko, I. I., Pugach, S. P., and Semiletov, I. P.: CO2 dynamics on the shelf of the East Siberian Sea, Russ. Meteorol. Hydrol., 35, 624–632, https://doi.org/10.3103/S1068373910090074, 2010.
Poddubny, V. A., Nagovitsyna, E. S., Markelov, Y. I., Buevich, A. G., Antonov, K. L., Omel'kova, E. V., and Manzhurov I. L.: Estimation of the Spatial Distribution of Methane Concentration in the Area of the Barents and Kara Seas in Summer in 2016–2017, Russ. Meteorol. Hydrol, 45, 193–200, https://doi.org/10.3103/S1068373920030073, 2020.
Quennehen, B., Schwarzenboeck, A., Schmale, J., Schneider, J., Sodemann, H., Stohl, A., Ancellet, G., Crumeyrolle, S., and Law, K. S.: Physical and chemical properties of pollution aerosol particles transported from North America to Greenland as measured during the POLARCAT summer campaign, Atmos. Chem. Phys., 11, 10947–10963, https://doi.org/10.5194/acp-11-10947-2011, 2011.
Reischl, G. P., Majerowicz, A., Ankilow, A., Eremenko, S., and Mavliev R.: Comparison of the Novosibirsk Automated Diffusion Battery with the Vienna Electro Mobility Spectrometer, J. Aerosol Sci., 22, 223–228, https://doi.org/10.1016/0021-8502(91)90030-L, 1991.
Reshetnikov, A. I. and Makshtas, A. P.: Arctic meteorology observatory “Tiksi”, in: Proceeding of MGO, 567, 267–283, https://elibrary.ru/contents.asp?id=33833669 (last access: 16 June 2022), 2012 (in Russian).
Sand, M., Berntsen, T. K., von Salzen, K., Flanner, M. G., Langner, J., and Victor, D. G.: Response of Arctic temperature to changes in emissions of short-lived climate forcers, Nat. Clim. Change, 6, 286–289, https://doi.org/10.1038/nclimate2880, 2016.
Sapart, C. J., Shakhova, N., Semiletov, I., Jansen, J., Szidat, S., Kosmach, D., Dudarev, O., van der Veen, C., Egger, M., Sergienko, V., Salyuk, A., Tumskoy, V., Tison, J.-L., and Röckmann, T.: The origin of methane in the East Siberian Arctic Shelf unraveled with triple isotope analysis, Biogeosciences, 14, 2283–2292, https://doi.org/10.5194/bg-14-2283-2017, 2017.
Saunois, M., Bousquet, P., Poulter, B., Peregon, A., Ciais, P., Canadell, J. G., Dlugokencky, E. J., Etiope, G., Bastviken, D., Houweling, S., Janssens-Maenhout, G., Tubiello, F. N., Castaldi, S., Jackson, R. B., Alexe, M., Arora, V. K., Beerling, D. J., Bergamaschi, P., Blake, D. R., Brailsford, G., Brovkin, V., Bruhwiler, L., Crevoisier, C., Crill, P., Covey, K., Curry, C., Frankenberg, C., Gedney, N., Höglund-Isaksson, L., Ishizawa, M., Ito, A., Joos, F., Kim, H.-S., Kleinen, T., Krummel, P., Lamarque, J.-F., Langenfelds, R., Locatelli, R., Machida, T., Maksyutov, S., McDonald, K. C., Marshall, J., Melton, J. R., Morino, I., Naik, V., O'Doherty, S., Parmentier, F.-J. W., Patra, P. K., Peng, C., Peng, S., Peters, G. P., Pison, I., Prigent, C., Prinn, R., Ramonet, M., Riley, W. J., Saito, M., Santini, M., Schroeder, R., Simpson, I. J., Spahni, R., Steele, P., Takizawa, A., Thornton, B. F., Tian, H., Tohjima, Y., Viovy, N., Voulgarakis, A., van Weele, M., van der Werf, G. R., Weiss, R., Wiedinmyer, C., Wilton, D. J., Wiltshire, A., Worthy, D., Wunch, D., Xu, X., Yoshida, Y., Zhang, B., Zhang, Z., and Zhu, Q.: The global methane budget 2000–2012, Earth Syst. Sci. Data, 8, 697–751, https://doi.org/10.5194/essd-8-697-2016, 2016.
Saunois, M., Stavert, A. R., Poulter, B., Bousquet, P., Canadell, J. G., Jackson, R. B., Raymond, P. A., Dlugokencky, E. J., Houweling, S., Patra, P. K., Ciais, P., Arora, V. K., Bastviken, D., Bergamaschi, P., Blake, D. R., Brailsford, G., Bruhwiler, L., Carlson, K. M., Carrol, M., Castaldi, S., Chandra, N., Crevoisier, C., Crill, P. M., Covey, K., Curry, C. L., Etiope, G., Frankenberg, C., Gedney, N., Hegglin, M. I., Höglund-Isaksson, L., Hugelius, G., Ishizawa, M., Ito, A., Janssens-Maenhout, G., Jensen, K. M., Joos, F., Kleinen, T., Krummel, P. B., Langenfelds, R. L., Laruelle, G. G., Liu, L., Machida, T., Maksyutov, S., McDonald, K. C., McNorton, J., Miller, P. A., Melton, J. R., Morino, I., Müller, J., Murguia-Flores, F., Naik, V., Niwa, Y., Noce, S., O'Doherty, S., Parker, R. J., Peng, C., Peng, S., Peters, G. P., Prigent, C., Prinn, R., Ramonet, M., Regnier, P., Riley, W. J., Rosentreter, J. A., Segers, A., Simpson, I. J., Shi, H., Smith, S. J., Steele, L. P., Thornton, B. F., Tian, H., Tohjima, Y., Tubiello, F. N., Tsuruta, A., Viovy, N., Voulgarakis, A., Weber, T. S., van Weele, M., van der Werf, G. R., Weiss, R. F., Worthy, D., Wunch, D., Yin, Y., Yoshida, Y., Zhang, W., Zhang, Z., Zhao, Y., Zheng, B., Zhu, Q., Zhu, Q., and Zhuang, Q.: The Global Methane Budget 2000–2017, Earth Syst. Sci. Data, 12, 1561–1623, https://doi.org/10.5194/essd-12-1561-2020, 2020.
Schmale, J., Arnold, S. R., Law, K. S., Thorp, T., Anenberg, S., Simpson, W. R., Mao, J., and Pratt, K. A.: Local Arctic air pollution: A neglected but serious problem, Earth's Future, 6, 1385–1412, https://doi.org/10.1029/2018EF000952, 2018.
Schröder, F., Kärcher, B., Fiebig, M., and Petzold, A.: Aerosol states in the free troposphere at northern midlatitudes, J. Geophys. Res., 107, LAC 8-1–LAC 8-8, https://doi.org/10.1029/2000JD000194, 2002.
Seinfeld, J. H. and Pandis, S. N.: Chemistry and Physics: From air Pollution to Climate Change, Wiley, New Jersey, 2006.
Semiletov, I. P., Shakhova, N. E., Pipko, I. I., Pugach, S. P., Charkin, A. N., Dudarev, O. V., Kosmach, D. A., and Nishino, S.: Space–time dynamics of carbon and environmental parameters related to carbon dioxide emissions in the Buor-Khaya Bay and adjacent part of the Laptev Sea, Biogeosciences, 10, 5977–5996, https://doi.org/10.5194/bg-10-5977-2013, 2013.
Shakhova, N., Semiletov, I., Salyuk, A., Yusupov, V., Kosmach, D., and Gustafsson, Ö.: Extensive Methane Venting to the Atmosphere from Sediments of the East Siberian Arctic Shelf, Science, 327, 1246–1250, https://doi.org/10.1126/science.1182221, 2010.
Shepherd, T. G.: Effects of a warming Arctic, Science, 353, 989–990, https://doi.org/10.1126/science.aag2349, 2016.
Shtabkin, Y. A., Moiseenko, K. B., Skorokhod, A. I., Vasileva, A. V., and Heimann M.: Sources of and variations in tropospheric CO in Central Siberia: Numerical experiments and observations at the Zotino Tall Tower Observatory, Izv. Atmos. Ocean. Phys., 52, 45–56, https://doi.org/10.1134/S0001433816010096, 2016.
Sitnov, S. A. and Mokhov, I. I.: Anomalies in the Atmospheric Methane Content over Northern Eurasia in the Summer of 2016, Dokl. Earth Sc., 480, 637–641, https://doi.org/10.1134/S1028334X18050173, 2018.
Steinbach, J., Holmstrand, H., Shcherbakova, K., Kosmach, D., Brüchert, V., Shakhova, N., Salyuk, A., Sapart, C. J., Chernykh, D., Noormets, R., Semiletov, I., and Gustafsson, O.: Source apportionment of methane escaping the subsea permafrost system in the outer Eurasian Arctic Shelf, P. Natl. Acad. Sci. USA, 118, e2019672118, https://doi.org/10.1073/pnas.2019672118, 2021.
Steinbrecht, W., Kubistin, D., Plass-Dulmer, C., Davies, J., Tarasick, D. W., Gathen, P., Deckelmann, H., Jepsen, N., Kivi, D., Lyall, N., Palm, M., Notholt, J., Kois, B., Oelsner, P., Allaart, M., Piters, A., Gill, M., Van Malderen, R., Delcloo, A. W., Sussmann, R., Mahieu, E., Servais, C., Romanens, G., Stübi, R., Ancellet, G., Godin-Beekmann, S., Yamanouchi, S., Strong, K., Johnson, B., Cullis, P., Petropavlovskikh, I., Hannigan, J. W., Hernandez, J.-L., Rodriguez, A. D., Nakano, T., Chouza, F., Leblanc, T., Torres, C., Garcia, O., Röhling, A. N., Schneider, M., Blumenstock, T., Tully, M., Paton-Walsh, C., Jones, N., Querel, R., Strahan, S., Stauffer, R. M., Thompson, A. M., Inness, A., Engelen, R., Chang, K.-L., and Cooper, O. R.: COVID-19 crisis reduces free tropospheric ozone across the Northern Hemisphere, Geophys. Res. Lett., 48, e2020GL091987, https://doi.org/10.1029/2020GL091987, 2021.
Strachan, I. B., Nugent, R. A., Crombie, S., and Bonneville, M. C.: Carbon dioxide and methan exchange at a cool-temperate freshwater marsh, Environ. Res. Lett., 10, 065006, https://doi.org/10.1088/1748-9326/10/6/065006, 2015.
Tan, Z., Zhuang, Q., Henze, D. K., Frankenberg, C., Dlugokencky, E., Sweeney, C., Turner, A. J., Sasakawa, M., and Machida, T.: Inverse modeling of pan-Arctic methane emissions at high spatial resolution: what can we learn from assimilating satellite retrievals and using different process-based wetland and lake biogeochemical models?, Atmos. Chem. Phys., 16, 12649–12666, https://doi.org/10.5194/acp-16-12649-2016, 2016.
Thornton, B. F., Prytherch, J., Andersson, K., Brooks, I. M., Salisbury, D., Tjernström, M., and Cril, P. M.: Shipborne Eddy Covariance Observations of Methane Fluxes Constrain Arctic Sea Emissions, Sci. Adv., 6, eaay7934, https://doi.org/10.1126/sciadv.aay7934, 2020.
Ustinov, V. P., Baranova, E. L., Visheratin, K. N., Grachev, M. I., and Kalsin, A. V.: Variations of carbon monoxide in the atmosphere of Antarctica according to ground-based and satellite measurements, Earth Exploration from Space, 2, 97–100, https://elibrary.ru/contents.asp?id=37620311 (last access: 16 June 2022), 2019 (in Russian).
Walter, A. K. M., Zimov, S. A., Grosse, G., Jones, M. C., Anthony, P. N., Chapin, F. S., Finlay, J. C., Mack, M. C., Davydov, S., Frenzel, P., and Frolking, S.: A shift of thermokarst lakes from carbon sources to sinks during the Holocene epoch, Nature, 511, 452–456, https://doi.org/10.1038/nature13560, 2014.
Watson, A. J., Schuster, U., Shutler, J. D., Holding, T., Ashton, I. G. C., Landschützer, P., Woolf, D. K., and Goddijn-Murphy, L.: Revised estimates of ocean-atmosphere CO2 flux are consistent with ocean carbon inventory, Nat. Commun, 11, 4422, https://doi.org/10.1038/s41467-020-18203-3, 2020.
Wendisch, M. and Brenguier, J.-L. (Eds.): Airborne Measurements foe Environmental Research, Wiley-VCH Verlag GmbH & Co, KGaA, Weinheim, ISBN 978-3-527-40996-9, 2013.
Wendisch, M. D., Handorf, D., Tegen, I., Neggers, R. A. J., and Spreen, G.: Glimpsing the ins and outs of the Arctic atmosphere cauldron, Eos, 102, https://doi.org/10.1029/2021EO155959, 2021.
Willis, M. D., Burkart, J., Thomas, J. L., Köllner, F., Schneider, J., Bozem, H., Hoor, P. M., Aliabadi, A. A., Schulz, H., Herber, A. B., Leaitch, W. R., and Abbatt, J. P. D.: Growth of nucleation mode particles in the summertime Arctic: a case study, Atmos. Chem. Phys., 16, 7663–7679, https://doi.org/10.5194/acp-16-7663-2016, 2016.
Willis, M. D., Leaitch, R. W., and Abbatt, J. P. D.: Processes Controlling the Composition and Abundance of Arctic Aerosol, Rev. Geoph., 56, 621–671, https://doi.org/10.1029/2018RG000602, 2018.
WMO: Greenhouse Gas Bulletin, No. 15., 8 p., https://public.wmo.int/en/resources/library/wmo-greenhouse-gas-bulletin-no-15 (last access: 16 June 2022), 2019.
You, K., Flemings, P. B., Malinverno, A., Collett, T. S., and Darnell, K.: Mechanisms of methane hydrate formation in geological systems, Rev. Geoph., 57, 1146–1196, https://doi.org/10.1029/2018RG000638, 2019.
You, W. W., Haugland, R. P., Ryan, D. K., and Haugland, R. P.: 3-(4-Carboxybenzoyl)quinoline-2-carboxaldehyde, a reagent with broad dynamic range for the assay of proteins and lipoproteins in solution, Annal. Biochem., 244, 277–282. https://doi.org/10.1006/abio.1996.9920, 1997.
Yu, J., Xie, Z., Sun, L., Kang, H., He, P., and Xing, G.: δ13C-CH4 reveals CH4 variations over oceans from mid-latitudes to the Arctic, Scientific Reports, 5, N13760, https://doi.org/10.1038/srep13760, 2015.
Zhuravleva, T. B., Panchenko, M. V., Kozlov, V. S., Nasrtdinov, I. M., Pol'kin, V. V., Terpugova, S. A., and Chernov, D. G.: Model Estimates of Dynamics of the Vertical Structure of Solar Absorption and Temperature Effects under Background Conditions and in Extremely Smoke-Laden Atmosphere According to Data of Aircraft Observations, Atmos. Oceanic Opt,, 31, 24–30, https://doi.org/10.1134/S1024856018010153, 2018.