the Creative Commons Attribution 4.0 License.
the Creative Commons Attribution 4.0 License.
 | 08 Jul 2022
On the influence of underlying elevation data on Sentinel-5 Precursor TROPOMI satellite methane retrievals over Greenland
Jonas Hachmeister
Oliver Schneising
Michael Buchwitz
Alba Lorente
Tobias Borsdorff
John P. Burrows
Justus Notholt
Matthias Buschmann
The Sentinel-5 Precursor (S5P) mission was launched on October 2017 and has since provided data with high spatio-temporal resolution using its remote sensing instrument, the TROPOspheric Monitoring Instrument (TROPOMI). The latter is a nadir viewing passive grating imaging spectrometer. The mathematical inversion of the TROPOMI data yields retrievals of different trace gas and aerosol data products. The column-averaged dry-air mole fraction of methane (XCH4) is the product of interest to this study. The daily global coverage of the atmospheric methane mole fraction data enables the analysis of the methane distribution and variation on large scales and also to estimate surface emissions. The spatio-temporal high-resolution satellite data are potentially particularly valuable in remote regions, such as the Arctic, where few ground stations and in situ measurements are available. In addition to the operational Copernicus S5P total-column-averaged dry-air mole fraction methane data product developed by SRON, the scientific TROPOMI/WFMD algorithm data product v1.5 (WFMD product) was generated at the Institute of Environmental Physics at the University of Bremen. In this study we focus on the assessment of both S5P XCH4 data products over Greenland and find that spatial maps of both products show distinct features along the coastlines. Anomalies up to and exceeding 100 ppb are observed and stand out in comparison to the otherwise smooth changes in the methane distribution. These features are more pronounced for the operational product compared to the WFMD product. The spatial patterns correlate with the difference between the GMTED2010 digital elevation model (DEM) used in the retrievals and a more recent topography dataset, indicating that inaccuracies in the assumed surface elevation are the origin of the observed features. These correlations are stronger for the WFMD product. In order to evaluate the impact of the topography dataset on the retrieval we reprocess the WFMD product with updated elevation data. We find that a significant reduction of the localized features when GMTED2010 is replaced by recent topography data over Greenland based on ICESat-2 data. This study shows the importance of the chosen topography data for retrieved dry-air mole fractions. The use of a DEM that is as accurate and as up to date as possible is advised for all S5P data products as well as for future missions which rely on a DEM as input data. A modification based on this study is planned to be introduced in the next version of the WFMD data product.
-
Please read the editorial note first before accessing the article.
-
Article
(17434 KB)
-
Please read the editorial note first before accessing the article.
- Article
(17434 KB) - Full-text XML
- BibTeX
- EndNote


Following the launch of the Sentinel-5 Precursor (S5P) satellite mission carrying the TROPOspheric Monitoring Instrument (TROPOMI), atmospheric measurements with unprecedented spatio-temporal resolution have become available. TROPOMI is a nadir viewing passive grating imaging spectrometer with a push-broom configuration. Its near-polar, sun-synchronous orbit provides daily coverage of the Earth. While for some gases vertical columns are retrieved, the algorithms for methane (CH4) retrieve the column-averaged dry-air mole fractions (denoted XCH4).
Methane is a globally well-distributed greenhouse gas and one of the most important drivers of climate change with a radiative forcing of 0.61 Wm−2 (Etminan et al., 2016) and an atmospheric lifetime of around 9 years (Masson-Delmotte et al., 2021). The concentration of CH4 increased by 156 % between 1750 and 2019, reaching 1866±3.3 ppb in 2019 (Masson-Delmotte et al., 2021). Large amounts of soil organic carbon (SOC) are stored in the Arctic permafrost regions (ca. 1300 Pg), roughly 800 Pg of which is perennially frozen (Hugelius et al., 2014). Further warming of the Arctic may lead to increased permafrost degradation and rapid SOC loss (Plaza et al., 2019) by the release of carbon dioxide (CO2) and/or methane. Monitoring emissions from the Arctic permafrost region is hence important but challenging as a result of the low surface reflectance of the ocean, ice and snow surface, and the spatial extent of the region. Additionally, the high solar zenith angles provide challenging measurement conditions. Furthermore, the satellite retrievals depend on knowledge of the surface elevation e.g. for the calculation of surface pressure. The exact use of elevation data depends on the retrieval algorithm; however, both datasets we investigate in this paper report a 1 % error in the retrieved XCH4 (about 20 ppb) for a 1 % error in the surface pressure. This could lead to problems due to the use of inaccurate elevation data. While ground-based and aircraft campaigns deliver vital information on a local or regional scale, the retrieved data products from satellite sensors yield potentially better spatio-temporal coverage.
At the moment three S5P/TROPOMI methane retrieval algorithms exist: the operational Copernicus S5P XCH4 algorithm developed by SRON (Hu et al., 2016), the scientific Weighting Function Modified Differential Optical Absorption Spectroscopy (WFMD) algorithm developed at the Institute of Environmental Physics at the University of Bremen (Schneising et al., 2019) and the scientific algorithm of SRON (Lorente et al., 2021). In this work, we investigate the operational product (V01, Apituley et al., 2017) and the TROPOMI/WFMD product (v1.5, Schneising, 2021b). Both yield the geolocated XCH4 and auxiliary information.
In this paper we investigate noticeable features in the maps of retrieved XCH4 over Greenland, which can be seen in both the operational S5P XCH4 product and the S5P WFMD product. For this we investigate the digital elevation model (DEM) used in both retrievals, namely the Global Multi-resolution Terrain Elevation Data (GMTED2010), and compare it to new elevation data from the ICESat-2 satellite mission.
In Sect. 2 we introduce the datasets used in this work, Sect. 3 describes the methods used in our analysis and Sect. 4 contains the results of our research. We finish with Sect. 5 wherein we present our conclusions.
2.1 Sentinel-5 Precursor mission
The Sentinel-5 Precursor satellite was launched on 13 October 2017 and has since delivered high-quality data from its only scientific instrument, TROPOMI, which is a nadir viewing passive grating imaging spectrometer. Combined with a near-polar, sun-synchronous orbit, the swath width of 2600 km provides daily coverage of the Earth. Due to the orbit geometry and swath overlap multiple observations per day are possible in the polar regions. The instrument comprises four spectrometers measuring radiances in the ultraviolet (267–332 nm), ultraviolet–visible (305–499 nm), near-infrared (661–786 nm) and shortwave infrared (2300–2389 nm) spectral range (Veefkind et al., 2012). The spatial resolution depends on the bands and is 5.5×3.5 km2 for the near-infrared (NIR) bands (7×3.5 km2 before August 2019) and 5.5×7 km2 for the shortwave infrared (SWIR) bands (7×7 km2 before August 2019) (Ludewig, 2021). Methane is retrieved from TROPOMI measurements of sunlight reflected by the Earth's surface and atmosphere in the SWIR wavelengths.
2.1.1 Sentinel-5 Precursor operational XCH4 product
The operational S5P methane product uses a retrieval algorithm, which applies the physical equations describing atmospheric radiative transfer. The algorithm simultaneously retrieves aerosol information (NIR and SWIR bands) and the methane column (SWIR band) (and other parameters e.g. surface albedo) in order to account for the influence of aerosol scattering (Hu et al., 2016; Hasekamp et al., 2019). The retrieval algorithm utilizes the GMTED2010 digital elevation model (DEM) at a resolution of approximately 2 km (Lorente et al., 2021) and European Centre for Medium-Range Weather Forecasts (ECMWF) data to calculate the surface pressure from which the pressure profile is constructed. An erroneous pressure profile affects the retrieval of XCH4 twofold: through the pressure dependence of the molecular absorption cross-sections and through the retrieved air column, which is used to convert the total CH4 column to the dry-air mole fraction XCH4. An error of ±1 % in the surface pressure (ca. 10 hPa) leads to an error of roughly 1 % in the retrieved XCH4 (ca. 20 ppb) according to Hasekamp et al. (2019). While the operational XCH4 data have proven to be of good quality by comparisons with ground-based measurements (Sha et al., 2021), there are biases related to low- and high-albedo scenes and overestimations of XCH4 over snow-covered scenes (Lorente et al., 2021). An assessment of the operational product is also presented in Barré et al. (2021), wherein it is shown that the V01 product (even after strict quality filtering) may show high bias XCH4 outliers over extended regions, for example Siberia (see their Fig. 15), related to albedo variations not fully accounted for in the retrieval (see their Fig. 16). Such features can be easily misinterpreted as a local methane emission signal (see Froitzheim et al., 2021).
The product includes a quality assurance value (QA), which is a continuous quality descriptor ranging from 0 (no data) to 1 (full quality data). As recommended in the product user guide (Apituley et al., 2017) we exclude data with QA <0.5.
For this paper we use the versions V01.02.02, V01.03.00, V01.03.01, V01.03.02 and V01.04.00 of the S5P/TROPOMI Level 2 methane product (Apituley et al., 2017), since version V02.00.00 or newer is only available for observations after June 2021.
2.1.2 Sentinel-5 Precursor WFMD XCH XCO product
The Weighting Function Modified Differential Optical Absorption Spectroscopy (WFMD) TROPOMI data product (Schneising, 2021b) is based on the WFMD algorithm (Buchwitz et al., 2006, 2007; Schneising et al., 2011, 2014), which is a linear least-squares method based on scaling (or shifting) pre-selected atmospheric vertical profiles. The vertical columns of the retrieved gases are calculated using the measured sun-normalized radiances by fitting a linearized radiative transfer model to it. The scientific WFMD algorithm retrieves both methane and carbon monoxide simultaneously from TROPOMI's SWIR bands. A detailed description of the retrieval algorithm and its differences to the operational product can be found in Schneising et al. (2019).
The WFMD algorithm relies on accurate high-resolution surface elevation information and uses GMTED2010 (Danielson and Gesch, 2011a) with a resolution of as external input. As the uncertainty of the corresponding elevation data for Greenland is larger than for other areas (see next section), potential retrieval biases may occur over Greenland. In the algorithm, the retrieved vertical methane columns are converted into column-averaged dry-air mole fractions (denoted XCH4) by division by the dry-air column obtained from the ECMWF ERA5 reanalysis (Hersbach et al., 2020). In the computation of XCH4, the digital elevation model (DEM) is used in both the determination of the vertical methane columns and the dry-air columns. In the processing of the vertical methane columns, the elevation information is required for the selection and interpolation of suitable precalculated reference spectra. In the post-processing, the ECMWF dry-air columns are corrected for the actual surface elevation of the individual TROPOMI measurements (based on the deviation from the mean altitude of the coarser model grid), inheriting the high spatial resolution of the satellite data. Therefore, errors in the elevation model lead to biases in the retrieved XCH4. These potential biases are mainly caused by the correction of the ECMWF dry-air columns, while the impact on the retrieval of the methane columns is comparatively small. An error in the elevation data translates into an error in the pressure; this influences the dry-air column, which in turn influences the XCH4. An error of 1 % in the surface pressure translates roughly to a 1 % error in XCH4. In another post-processing step the data are quality-filtered using a machine learning approach based on a random forest classifier (Schneising, 2021a). We use data with a quality flag QF =0 (good) and do not include data with QF =1 (potentially bad).
2.2 GMTED2010
The Global Multi-Resolution Terrain Elevation Data 2010 DEM is a suite of global terrain elevation data at three different resolutions (approximately 250, 500 and 1000 m) and different versions depending on the use case (e.g. minimum, maximum and median elevations) (Danielson and Gesch, 2011b). While the GMTED2010 datasets provide global coverage of almost all land areas there are some exceptions. Most importantly, the data for Greenland are only available in the lowest resolution (1000 m). GMTED2010 is based on various source datasets which are combined (Danielson and Gesch, 2011a). For Greenland the source data are given by Bamber et al. (2001), who developed a gridded DEM at a 1 km spacing from ERS-1 and Geosat satellite radar altimetry. The mean vertical error over the Greenland ice sheet was determined to be m, while over bare rock regions it ranges from 20 to 200 m (Bamber et al., 2001). In this work we use the 30 arcsec spatial mean resolution data (Danielson and Gesch, 2011b).
2.3 ATLAS/ICESat-2
The Ice, Cloud and Land Elevation Satellite-2 (ICESat-2) was launched 15 September 2018. Since then, it has provided high-resolution data from its sole instrument, the Advanced Topographic Laser Altimeter System (ATLAS). ATLAS uses a photon-counting lidar and ancillary systems to measure the travel time of a photon and its geodetic latitude and longitude (Abdalati et al., 2010). The output of the single laser (532 nm) is split into six beams, which are arranged into three pairs of beams that follow three parallel reference pair tracks (RPTs). The configuration allows for the measurement of the surface slope in the along- and across-track direction in a single pass. The laser footprint on the ground is approximately 17 m with a spatial sampling of 0.7 m. The middle pair is aligned to a reference ground track (RGT) by the onboard software. The ICESat-2 mission gathers data along 1387 different RGTs, with a 91 d return cycle, which allows for the detection of elevation changes (Smith et al., 2021a; Neumann et al., 2019). The mission target is to reach an accuracy better than or equal to 0.4 cm yr−1 on an annual basis over ice sheets. The actual elevation precision depends on the signal-to-noise ratio, the length over which laser shots are accumulated, and the precision of the photon timing. The 100-shot standard deviation is estimated to be 2–9 cm over the interior ice sheet and 6–29 cm over glaciers (Neumann et al., 2019).
Here we use the ATLAS/ICESat-2 L3B Annual Land Ice Height Version 4 (ATL11) (Smith et al., 2021b) dataset derived from the ATLAS/ICESat-2 L3A Land Ice Height product (ATL06). The ATL11 product provides height measurements, errors and quality information for a set of reference points spaced every 60 m along their corresponding ground tracks. Each of these height measurements considers ATL06 segments whose centres lie within 60 m along-track and 65 m across-track of a reference point. The data span 29 March 2019 to 23 June 2021, providing nine measurements per reference point which are 91 d apart.
In our analysis we use a grid resolution of for both the elevation data and the methane data. At 60∘ N this corresponds to a resolution of roughly 11×11 km2, which is slightly larger than the resolution of S5P at 7×7 km2. We also define two regions of interest which will be the focus of our investigation (see Fig. 1); the regions were chosen due to the strong height differences between GMTED2010 and ICESat-2 data in these areas (see Fig. 3). Region 1 lies on the north-west coast of Greenland (74∘ N, 64∘ W, 77∘ N, 54∘ W), and region 2 is located on the eastern coast (65∘ N, 40∘ W, 70∘ N, 20∘ W).
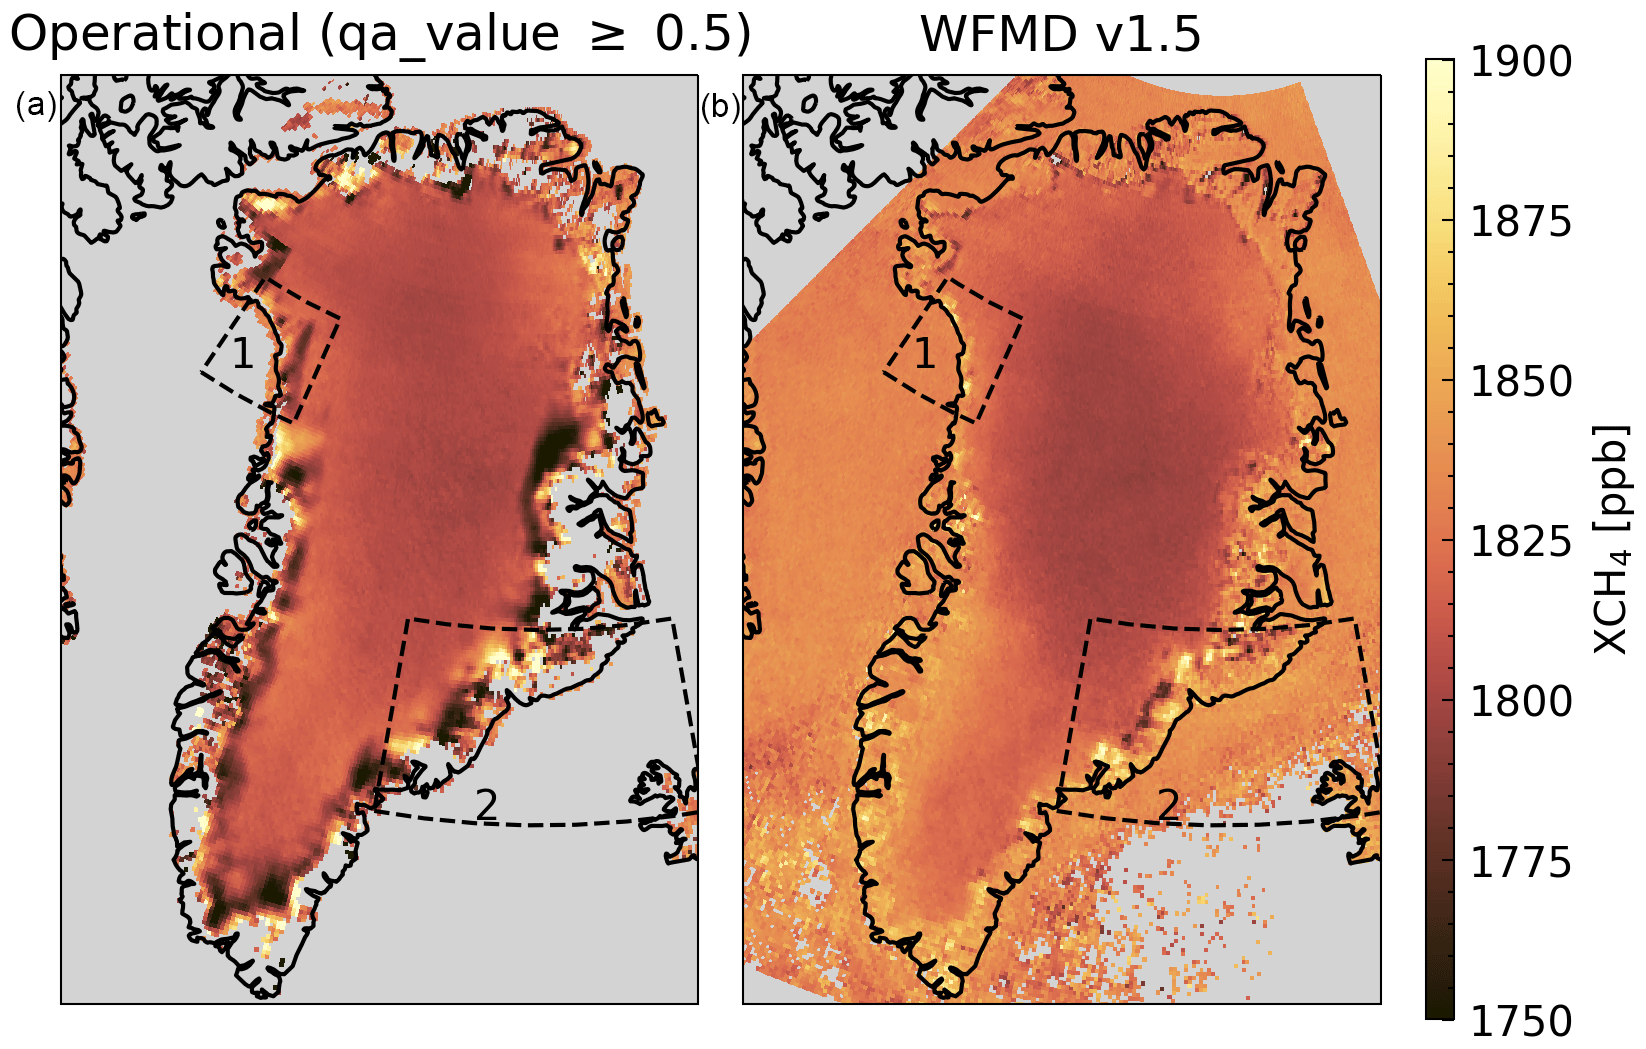
Figure 1Comparison of the mean XCH4 from 2018–2020 over Greenland for the operational methane data product (Hu et al., 2016) (a) and the WFMD product (Schneising et al., 2019) (b). The dashed boxes show areas investigated in this work.
3.1 7 d methane anomaly
To account for the seasonal variability of methane and the overall increase in methane concentrations (AMAP, 2015) we calculate the average of 7 d XCH4 anomalies (Fig. 2). We define the 7 d XCH4 anomaly as follows: first we calculate the daily mean XCH4 for every grid cell wherein the gridding is based only on the centre coordinate of each pixel. In the best case this returns a daily time series of methane measurements for every grid cell. However, this time series will have gaps (e.g. measurements not passing the quality filter). To account for this we average the XCH4 time series over 7 d (i.e. we have a methane measurement every 7 d for all cells in the ideal case). In the last step we calculate the methane anomaly by calculating the reference methane, which is defined by the average in the reference area (73∘ N, 48∘ W, 78∘ N, 38∘ W), and subtracting it from the 7 d methane averages. This yields the 7 d XCH4 anomaly. We chose the reference area due to three factors: proximity to the observed regions, absence of methane sources and data coverage. The XCH4 in the reference area is typically lower than in the coastal regions due to the higher elevation (see Sect. 4.3). Since the elevation stays virtually constant in the relevant time frame, the choice of the reference area merely defines the reference for the anomaly. The 7 d methane anomaly is denoted by ΔXCH4.
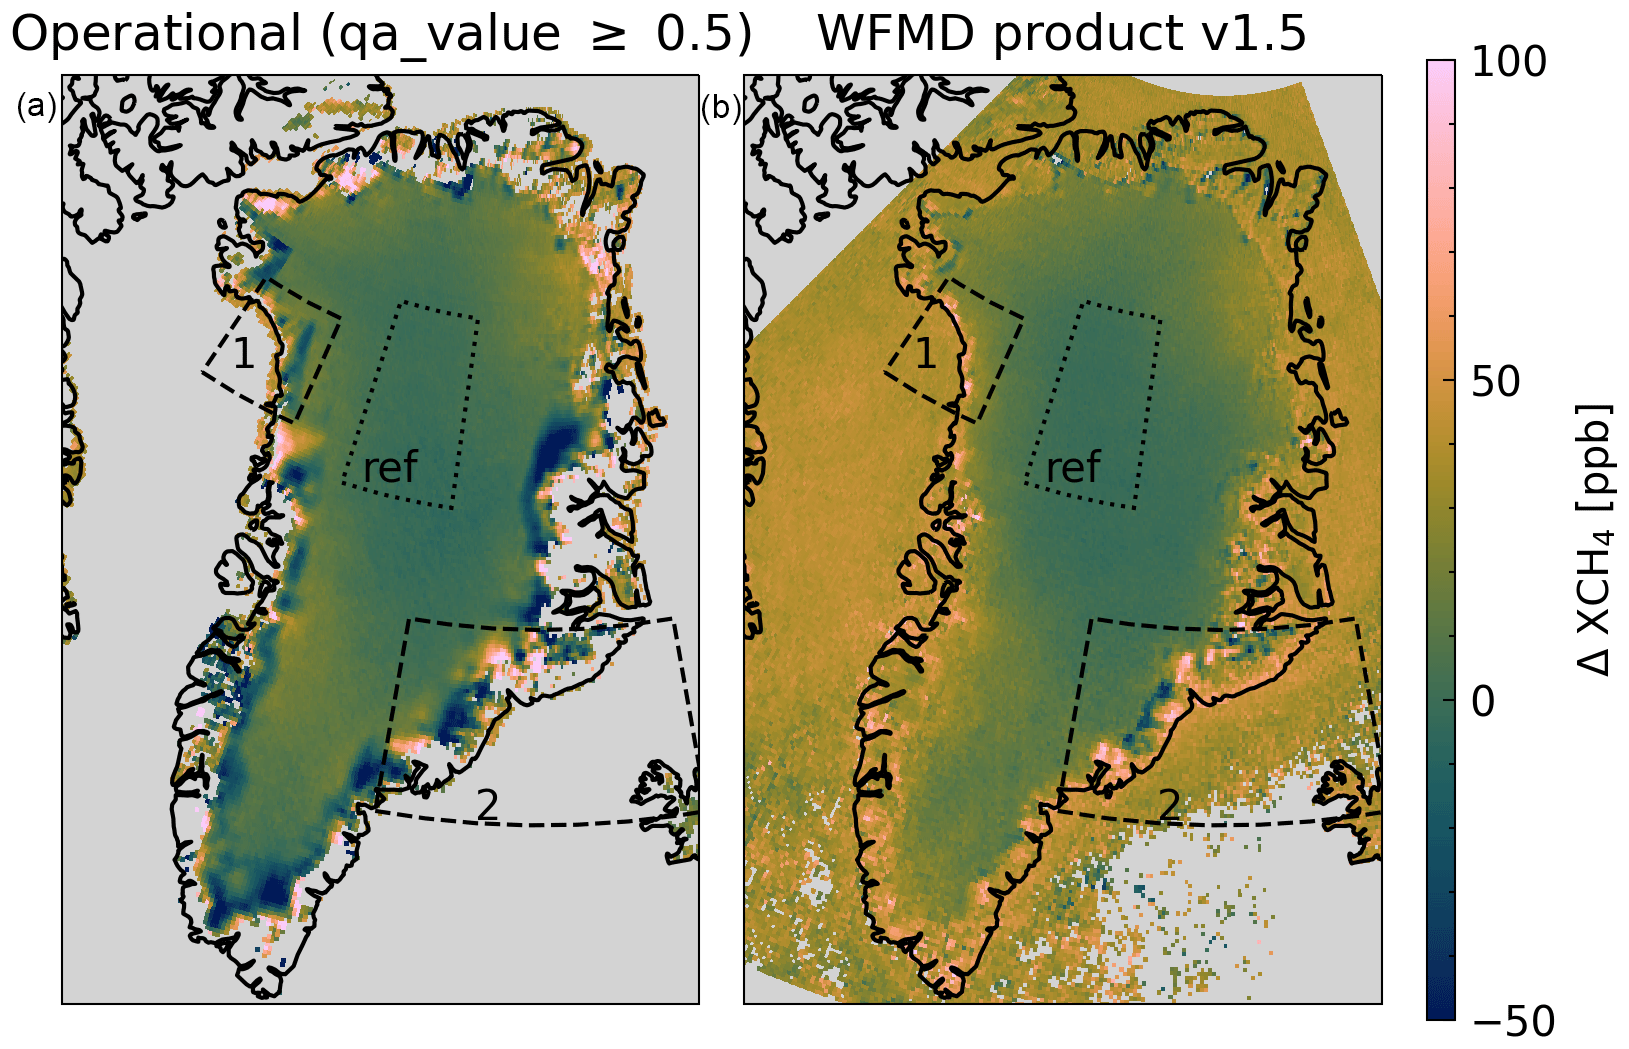
Figure 2Comparison of the mean 7 d XCH4 anomaly from 2018–2020 over Greenland in the operational methane data product (Hu et al., 2016) (a) and the WFMD product (Schneising et al., 2019) (b). The reference area is shown by the dotted contour. The dashed boxes show areas investigated in this work.
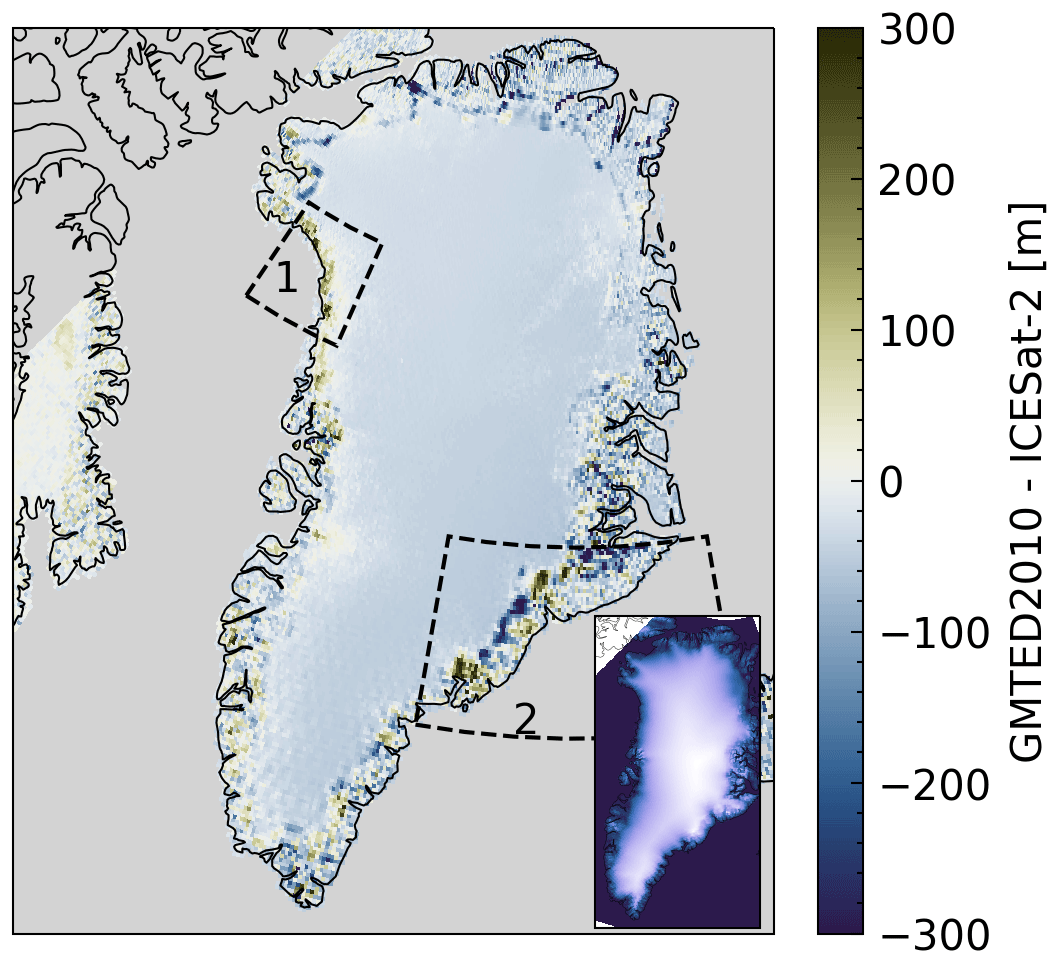
Figure 3Height difference between GMTED2010 (Danielson and Gesch, 2011b) and gridded ICESat-2 data (Smith et al., 2021b). The inset shows Greenland topography according to GMTED2010. Large height differences can be observed in regions 1 and 2. Smaller differences can be seen on the whole Greenland coastline.
3.2 Processing of ICESat-2 data
We use the ATL11 (Smith et al., 2021b) data as a basis for our elevation grid. The data are split into three groups for each RPT. The data along each RPT p(x,t) are ordered by positions x along the track for which up to nine observations for different return cycles, t, are available. We iterate over all positions x for each RPT and get the array of return cycle observations px(t). We remove NaNs and only include observations with quality flag QF =0, meaning high-quality data, and use the remaining data for the gridding process. Next we calculate the total error for each measurement in according to Smith et al. (2021a) and calculate the average of the height measurements using the inverse total errors as weights. The weighted average height then gets added to the corresponding grid cell. After all data have been processed, each grid cell containing the sum of all collocated heights is divided by the number of collocated data points.
We also mention the recent publication of Fan et al. (2022), which introduces a new DEM for Greenland generated from ICESat-2 data. Since the publication by Fan et al. (2022) was still in review when we conducted the main part of our work we used our own gridded ICESat-2 data. In Appendix A we present a comparison of our gridded data with this new DEM and show that the differences do not affect the results and conclusions of our work.
4.1 Methane anomaly
In Fig. 1 we present the mean XCH4 between 2018 and 2020 for the operational and the WFMD product. The operational product shows distinct areas of low and high methane concentration on the edges of Greenland. For the WFMD product mainly regions of high concentration are visible on the edges of Greenland, with the exception of region 2, which shows an area of low concentration. The effect of the elevation on XCH4, explained below in Sect. 4.3, can also be seen over the ice sheet for both products (i.e. decreasing XCH4 with increasing ground height). Figure 2 shows the mean 7 d methane anomaly (ΔXCH4) for both products. Here we can observe the same features as in Fig. 1.
4.2 Comparison of elevation data
To compare GMTED2010 with the gridded ICESat-2 data we resample it to the same grid using cubic resampling. In Fig. 3 we show the height difference ΔH between the elevation data. On the north-western coast (region 1) we see a region of positive elevation differences of roughly 100–200 m. This corresponds to regions of elevation change reported by The IMBIE Team (2020), which could explain part of this difference. On the south-eastern coast (region 2) we observe a distinct feature consisting of neighbouring positive and negative elevation differences. In both cases we assume that large uncertainties in the GMTED2010 data (see Sect. 2.2) in combination with local ice sheet loss and/or movement as well as differences in resolution of both datasets are responsible for the observed differences.
4.3 Height correction
Greenland is a region with very large elevation differences. We have to account for the actual influence of the terrain height on XCH4 due to the elevation-dependent weighting of tropospheric and stratospheric air. We aim to identify potential artefacts in the retrieved XCH4 due to DEM inaccuracies. This real impact of topography leads to decreasing XCH4 with increasing height. In Figs. 4 and 5 we show the corresponding correlation between the terrain height used in the retrieval and the XCH4 for the WFMD data as well as the operational data, respectively. For both cases, as expected, we see a downward trend of XCH4 with increasing height. We calculate a linear fit for both cases and use the slope as a linear correction factor in our plots (denoted as “height-corrected”). This allows a more conclusive correlation analysis between ΔH and ΔXCH4 after disentangling the described actual altitude dependency.
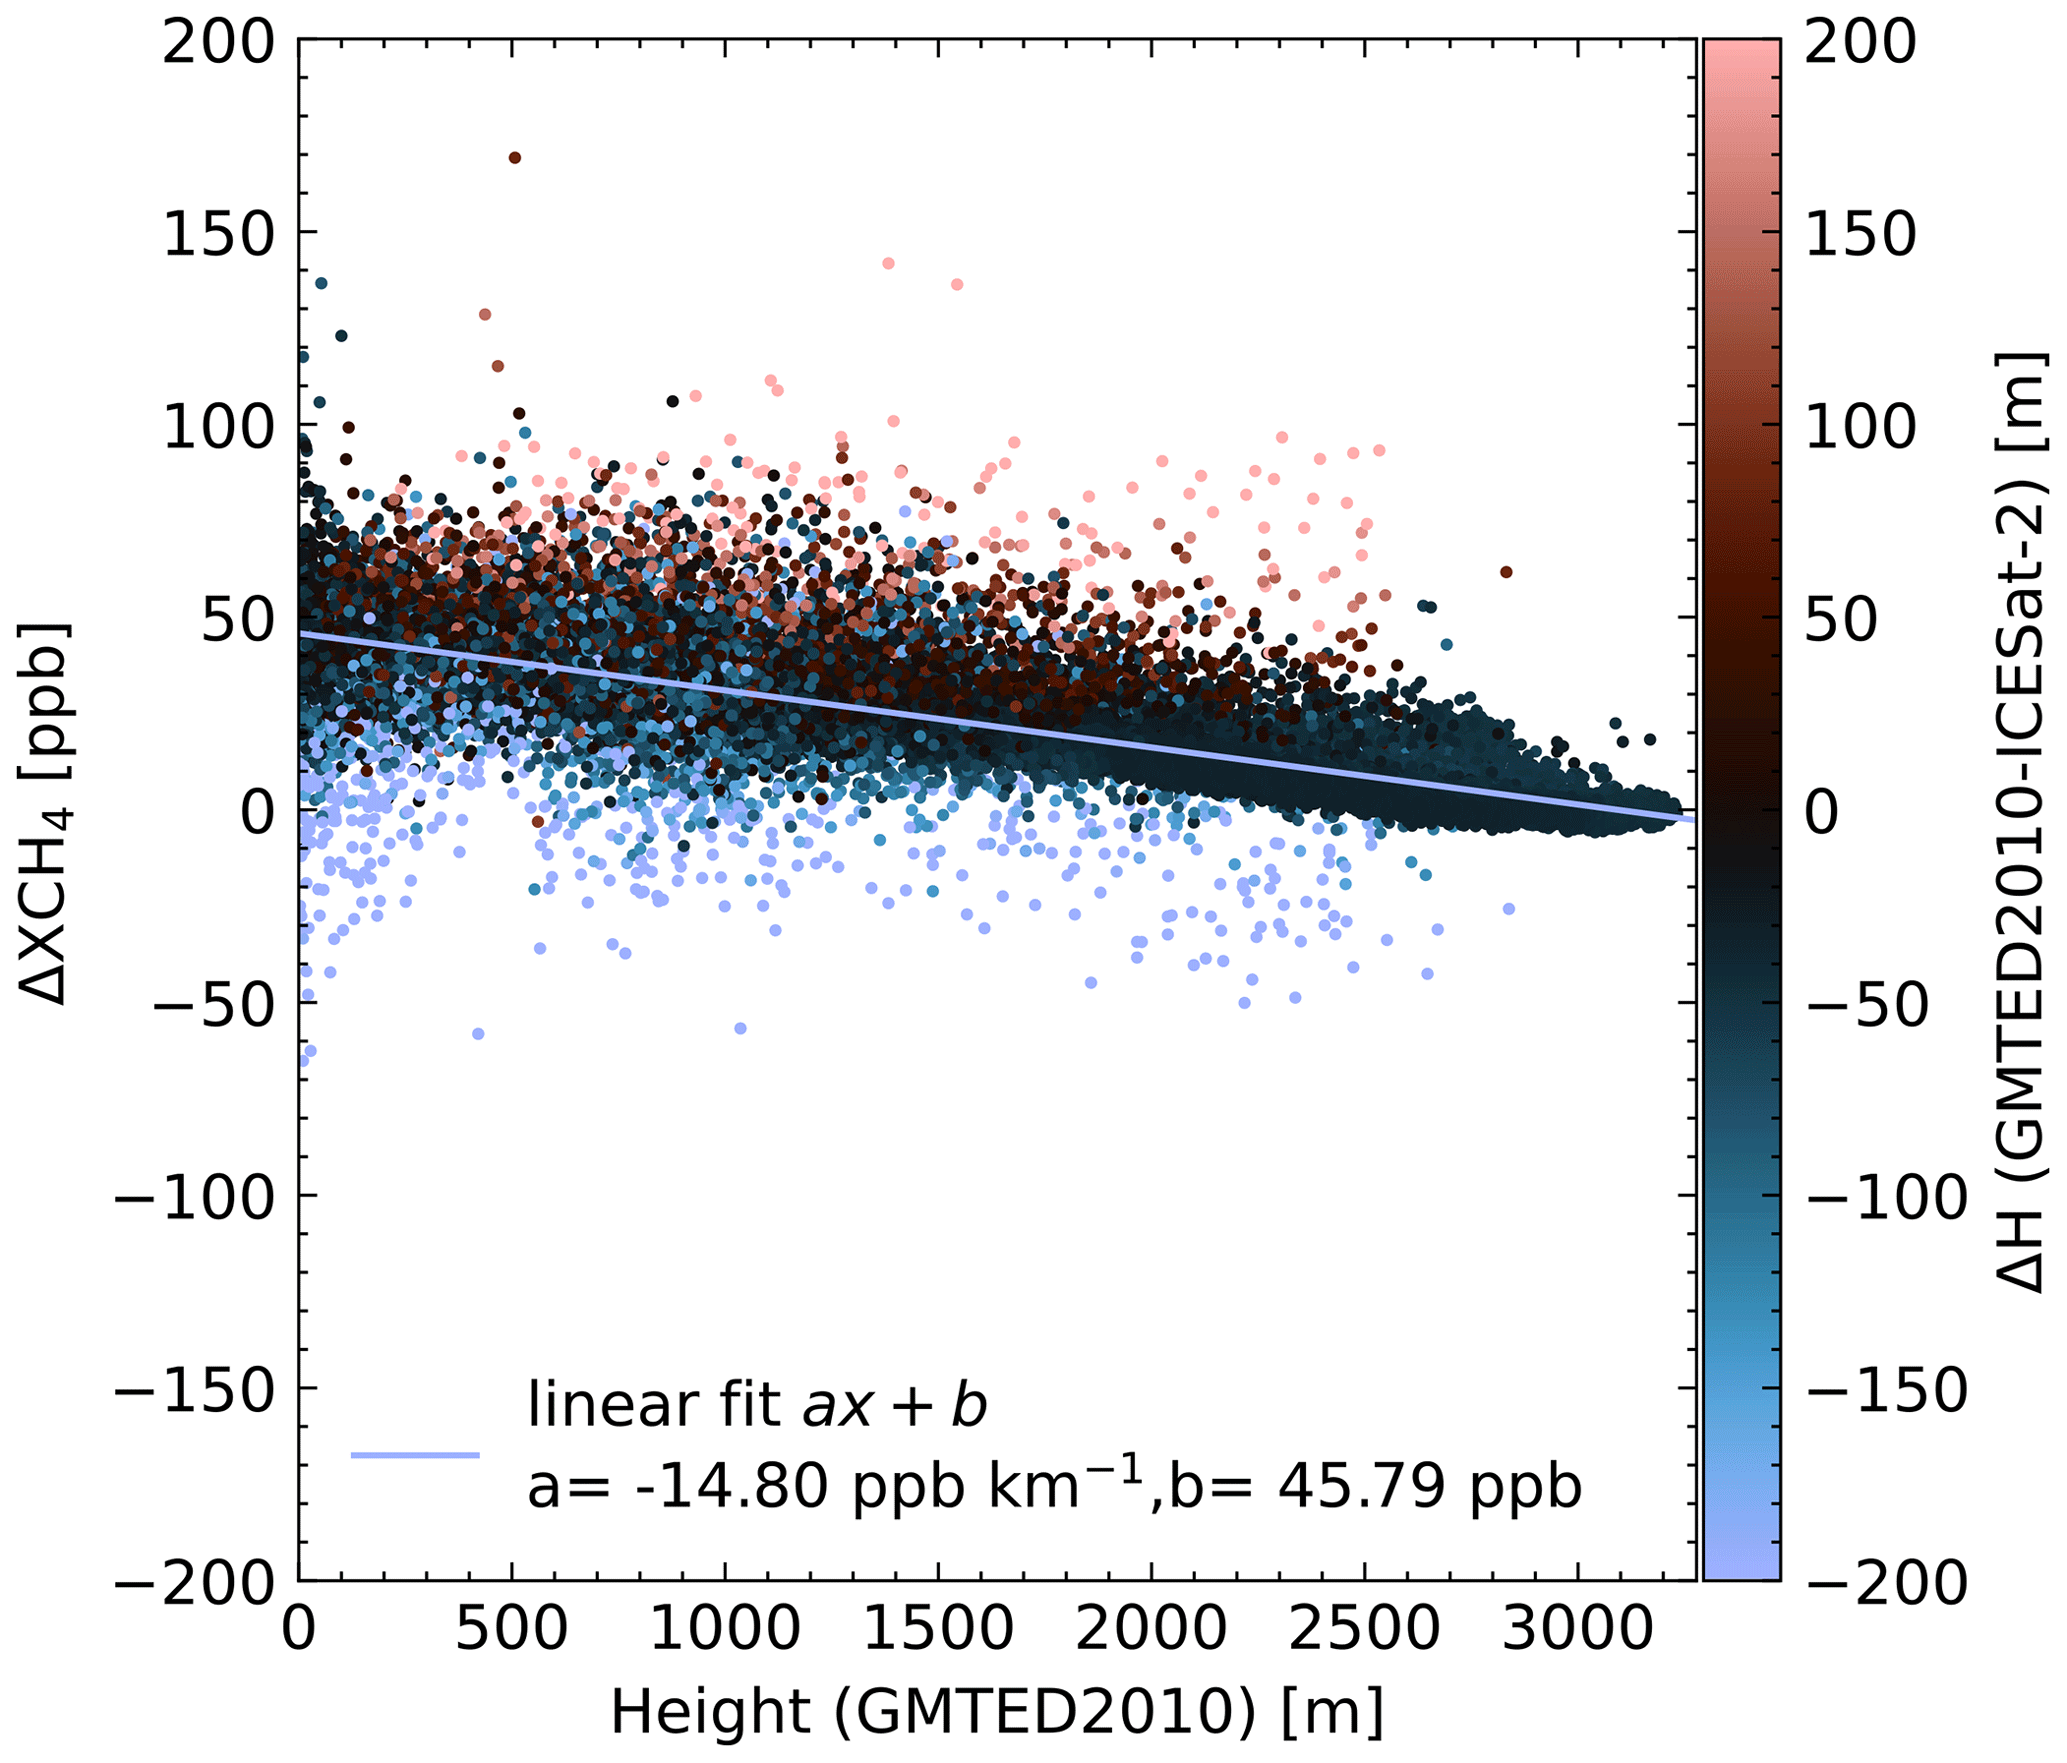
Figure 4Correlation between height from GMTED2010 and the mean 7 d methane anomaly for the WFMD product. The slope of the linear fit is used in the height correction.
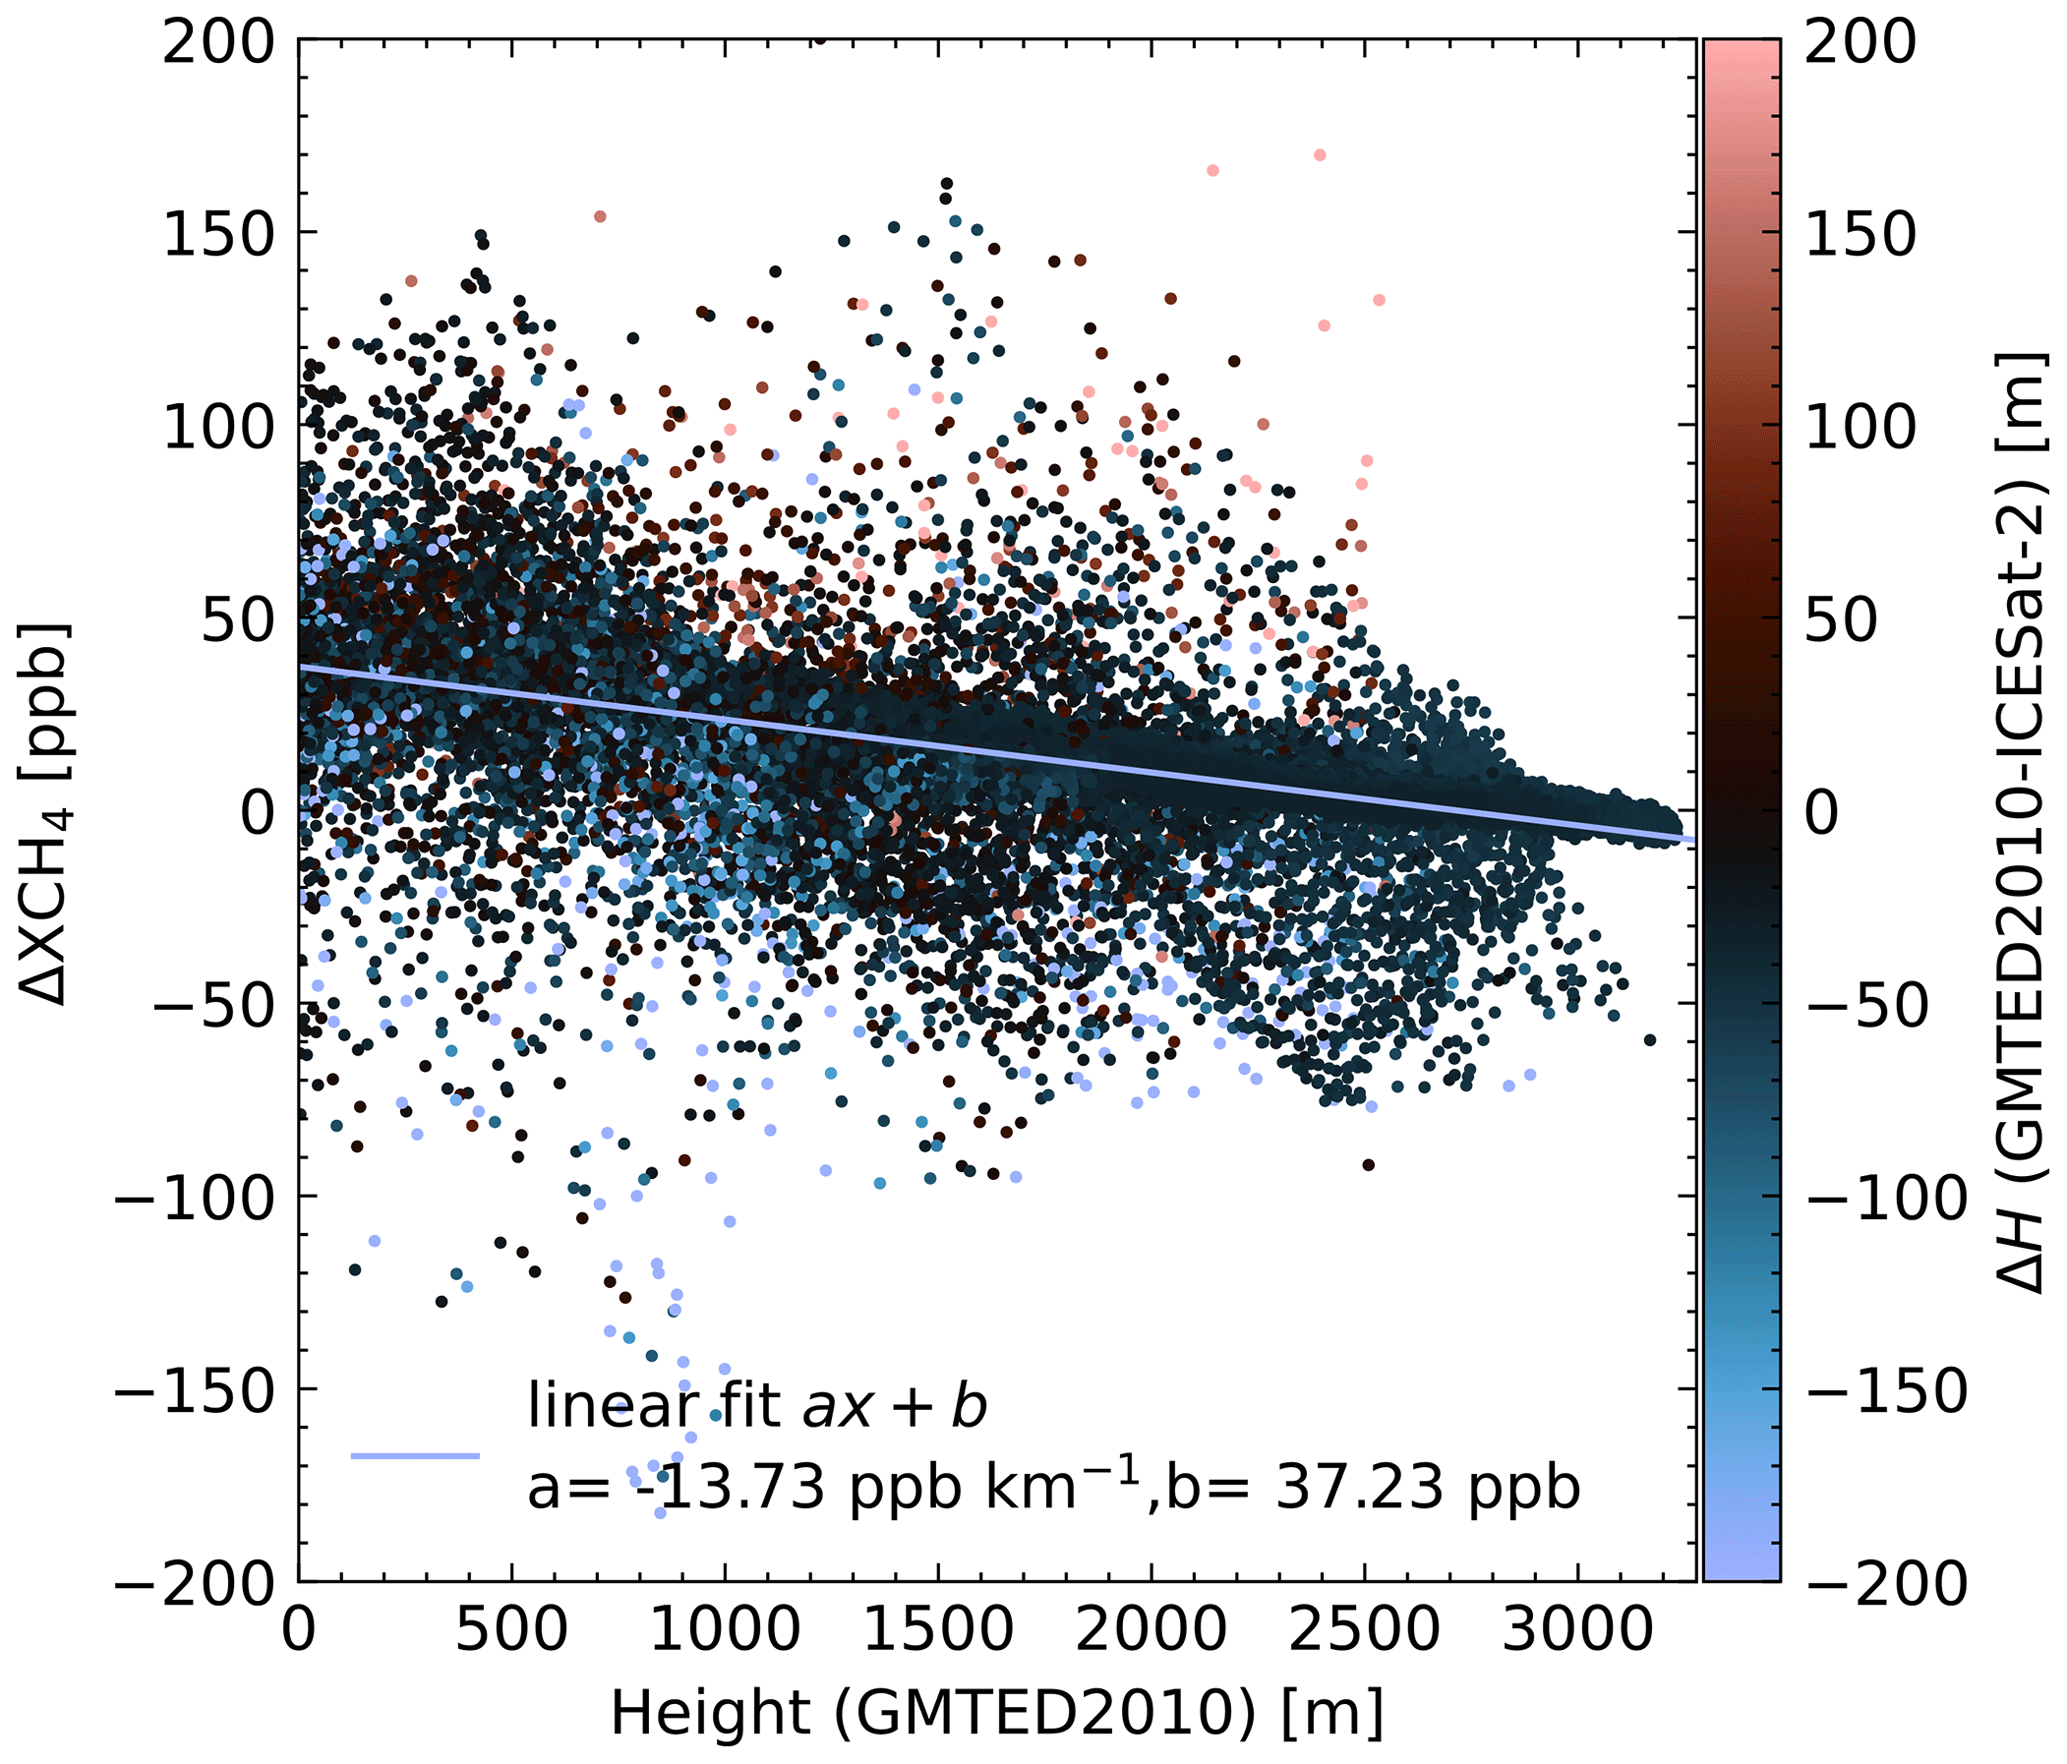
Figure 5Correlation between height from GMTED2010 and the mean 7 d methane anomaly for the operational product. The slope of the linear fit is used in the height correction.

Figure 6Correlation between mean 7 d methane anomaly ΔXCH4 and ΔH for the WFMD product. In addition to the effect of ΔH on the XCH4, the elevation has a linear effect on the retrieved XCH4 due to the elevation-dependent weighting of tropospheric and stratospheric contributions to XCH4. We thus see lower ΔXCH4 for measurements over the high ice sheet. This height relationship is corrected in the lower panels using a linear correction factor (see Fig. 4).
4.4 Correlation between ΔH and ΔXCH4
In this section we present the correlations between ΔH and ΔXCH4 to investigate and quantify how errors in the topography data lead to a change in the ΔXCH4. In Fig. 6 we show the correlation between ΔH and ΔXCH4 for the WFMD product. In the top row we show the correlation of the raw ΔXCH4 data, and in the bottom row we show the correlation for the height-corrected case (see Sect. 4.3 for an explanation). We observe a linear correlation with ρ>0.8 (Pearson correlation coefficient) for the corrected data. Figure 7 shows the same correlation plots but for the operational data product. The correlation coefficients are smaller than for the WFMD product; for region 1 the correlation coefficient becomes smaller after height correction. In contrast to the WFMD data, both regions show a large scatter of ΔXCH4 around ΔH ≈0, obfuscating the linear relationship between ΔH and ΔXCH4.
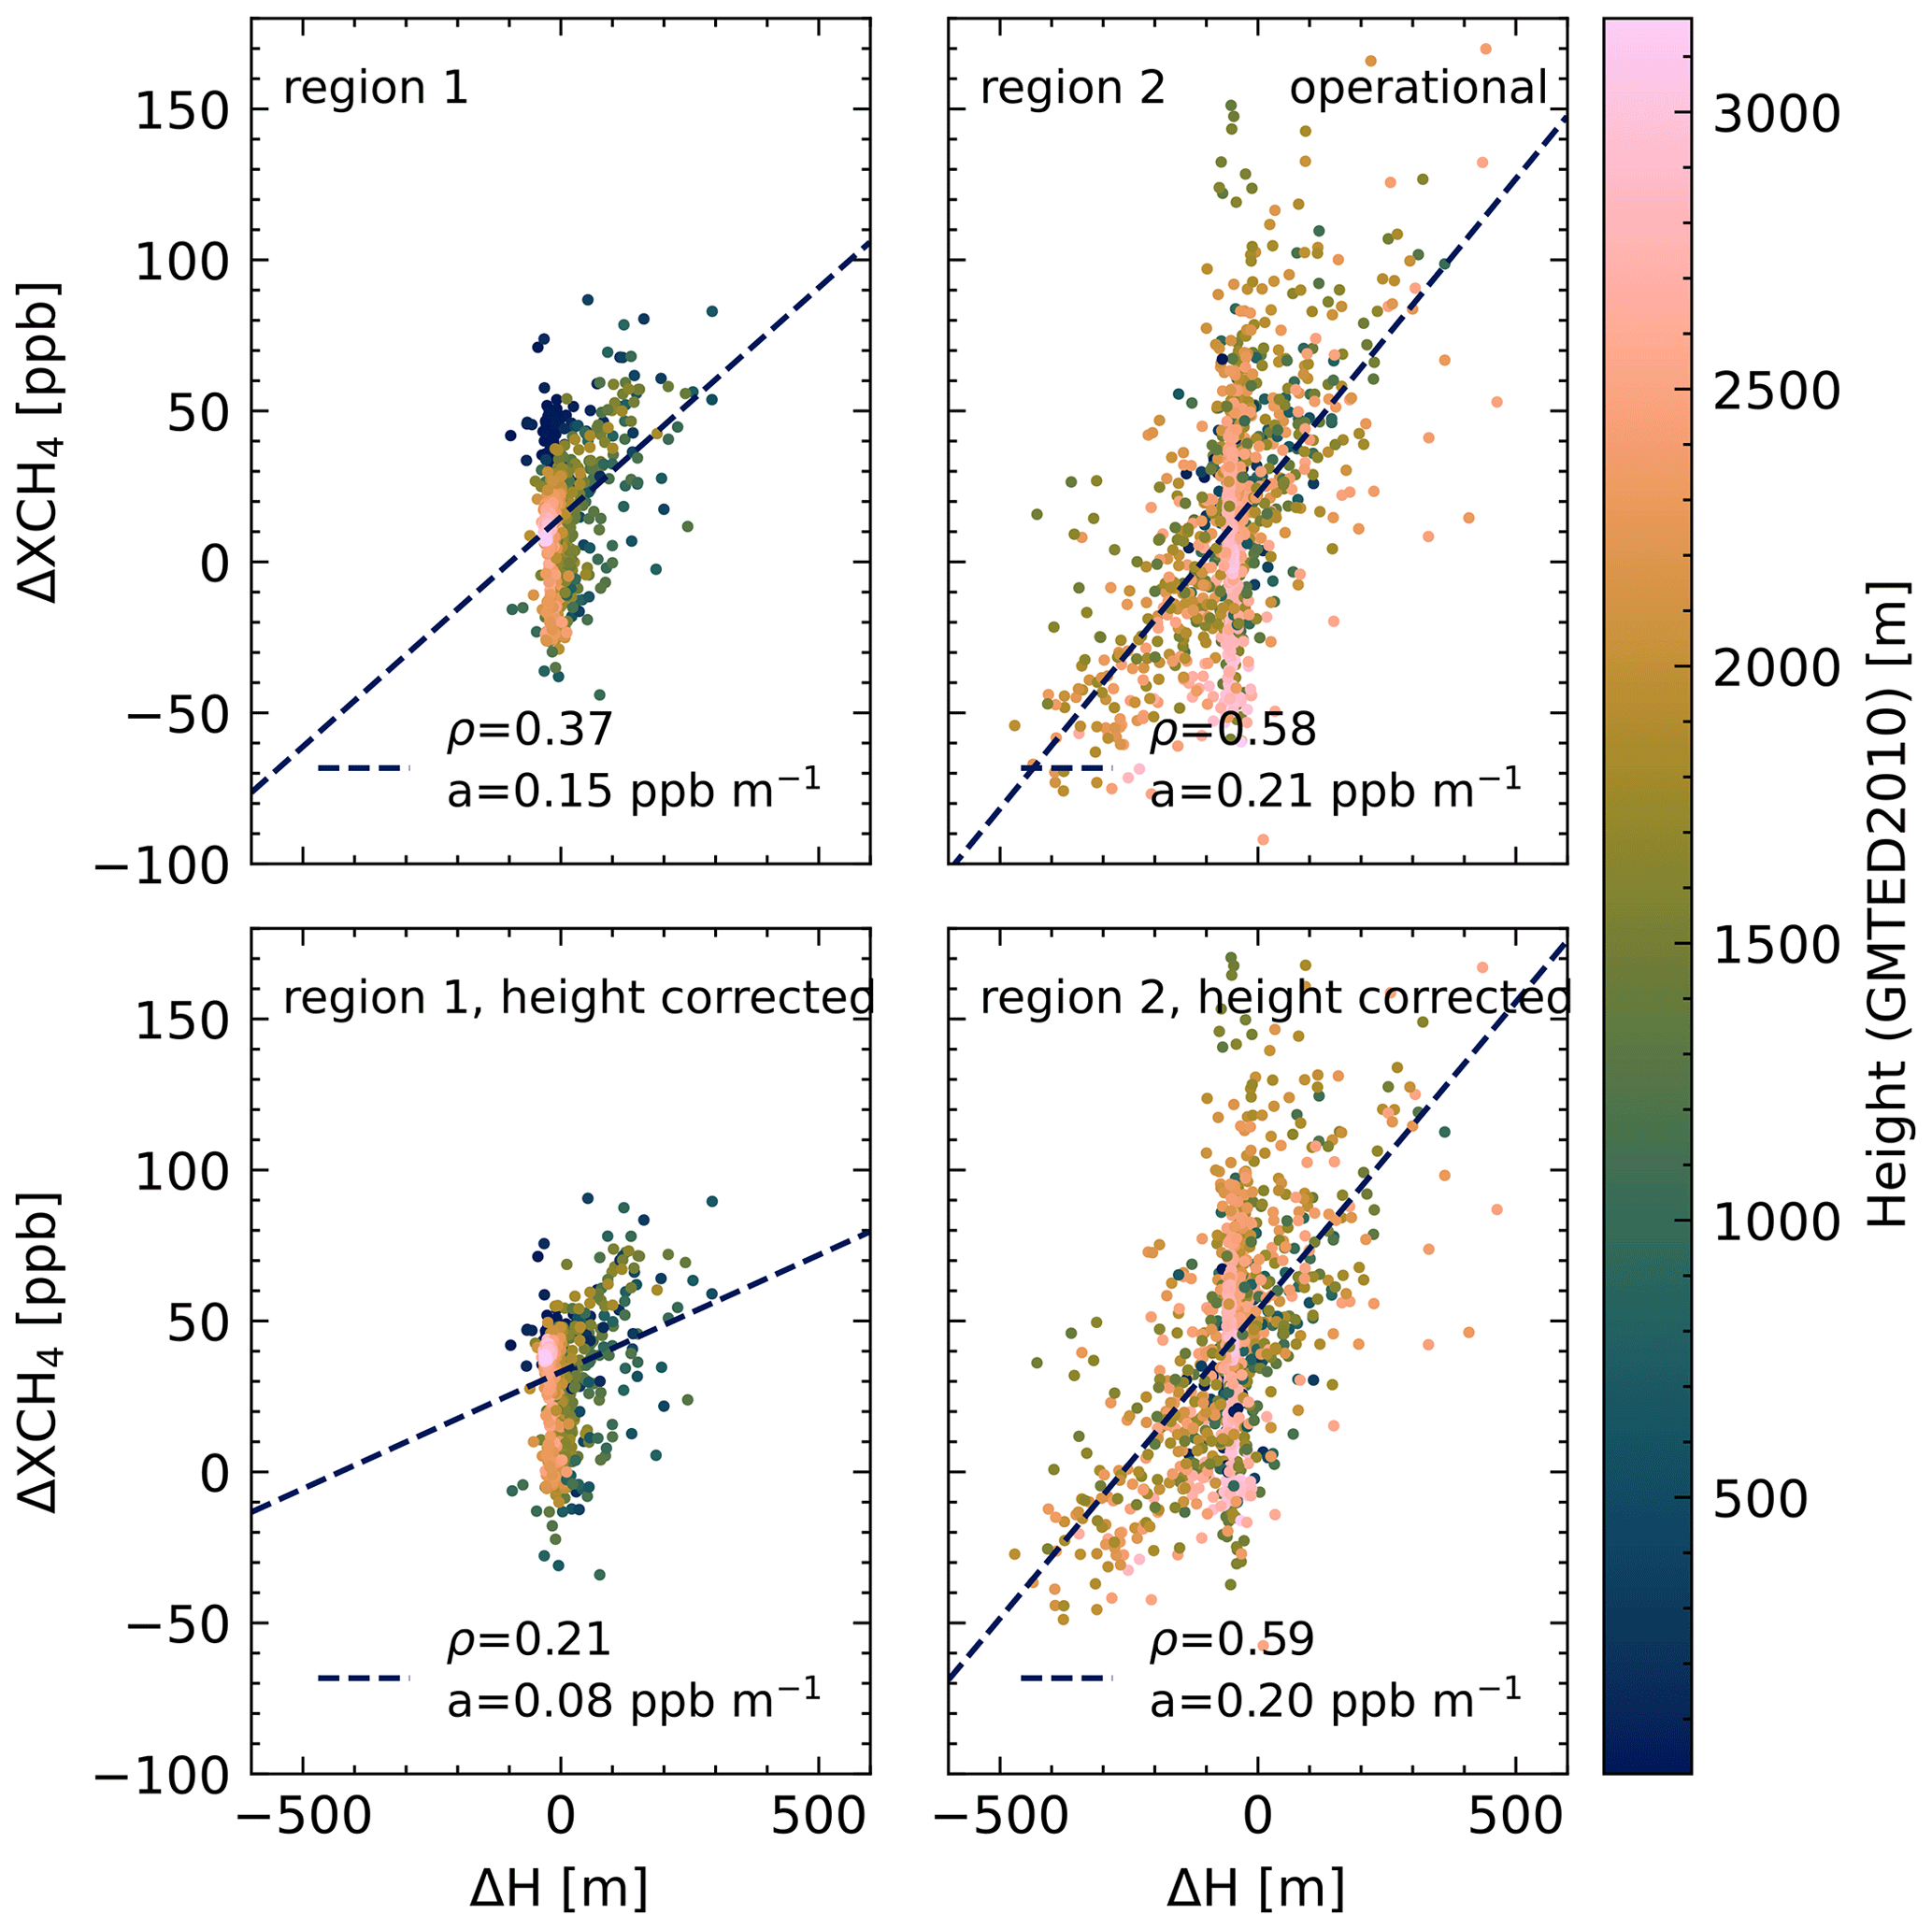
Figure 7Correlation between mean 7 d methane anomaly ΔXCH4 and ΔH for the operational product. In addition to the effect of ΔH on the XCH4, the elevation has a linear effect on the retrieved XCH4 due to the elevation-dependent weighting of tropospheric and stratospheric contributions to XCH4. We thus see lower ΔXCH4 for measurements over the high ice sheet. This height relationship is corrected in the lower panels using a linear correction factor (see Fig. 5).
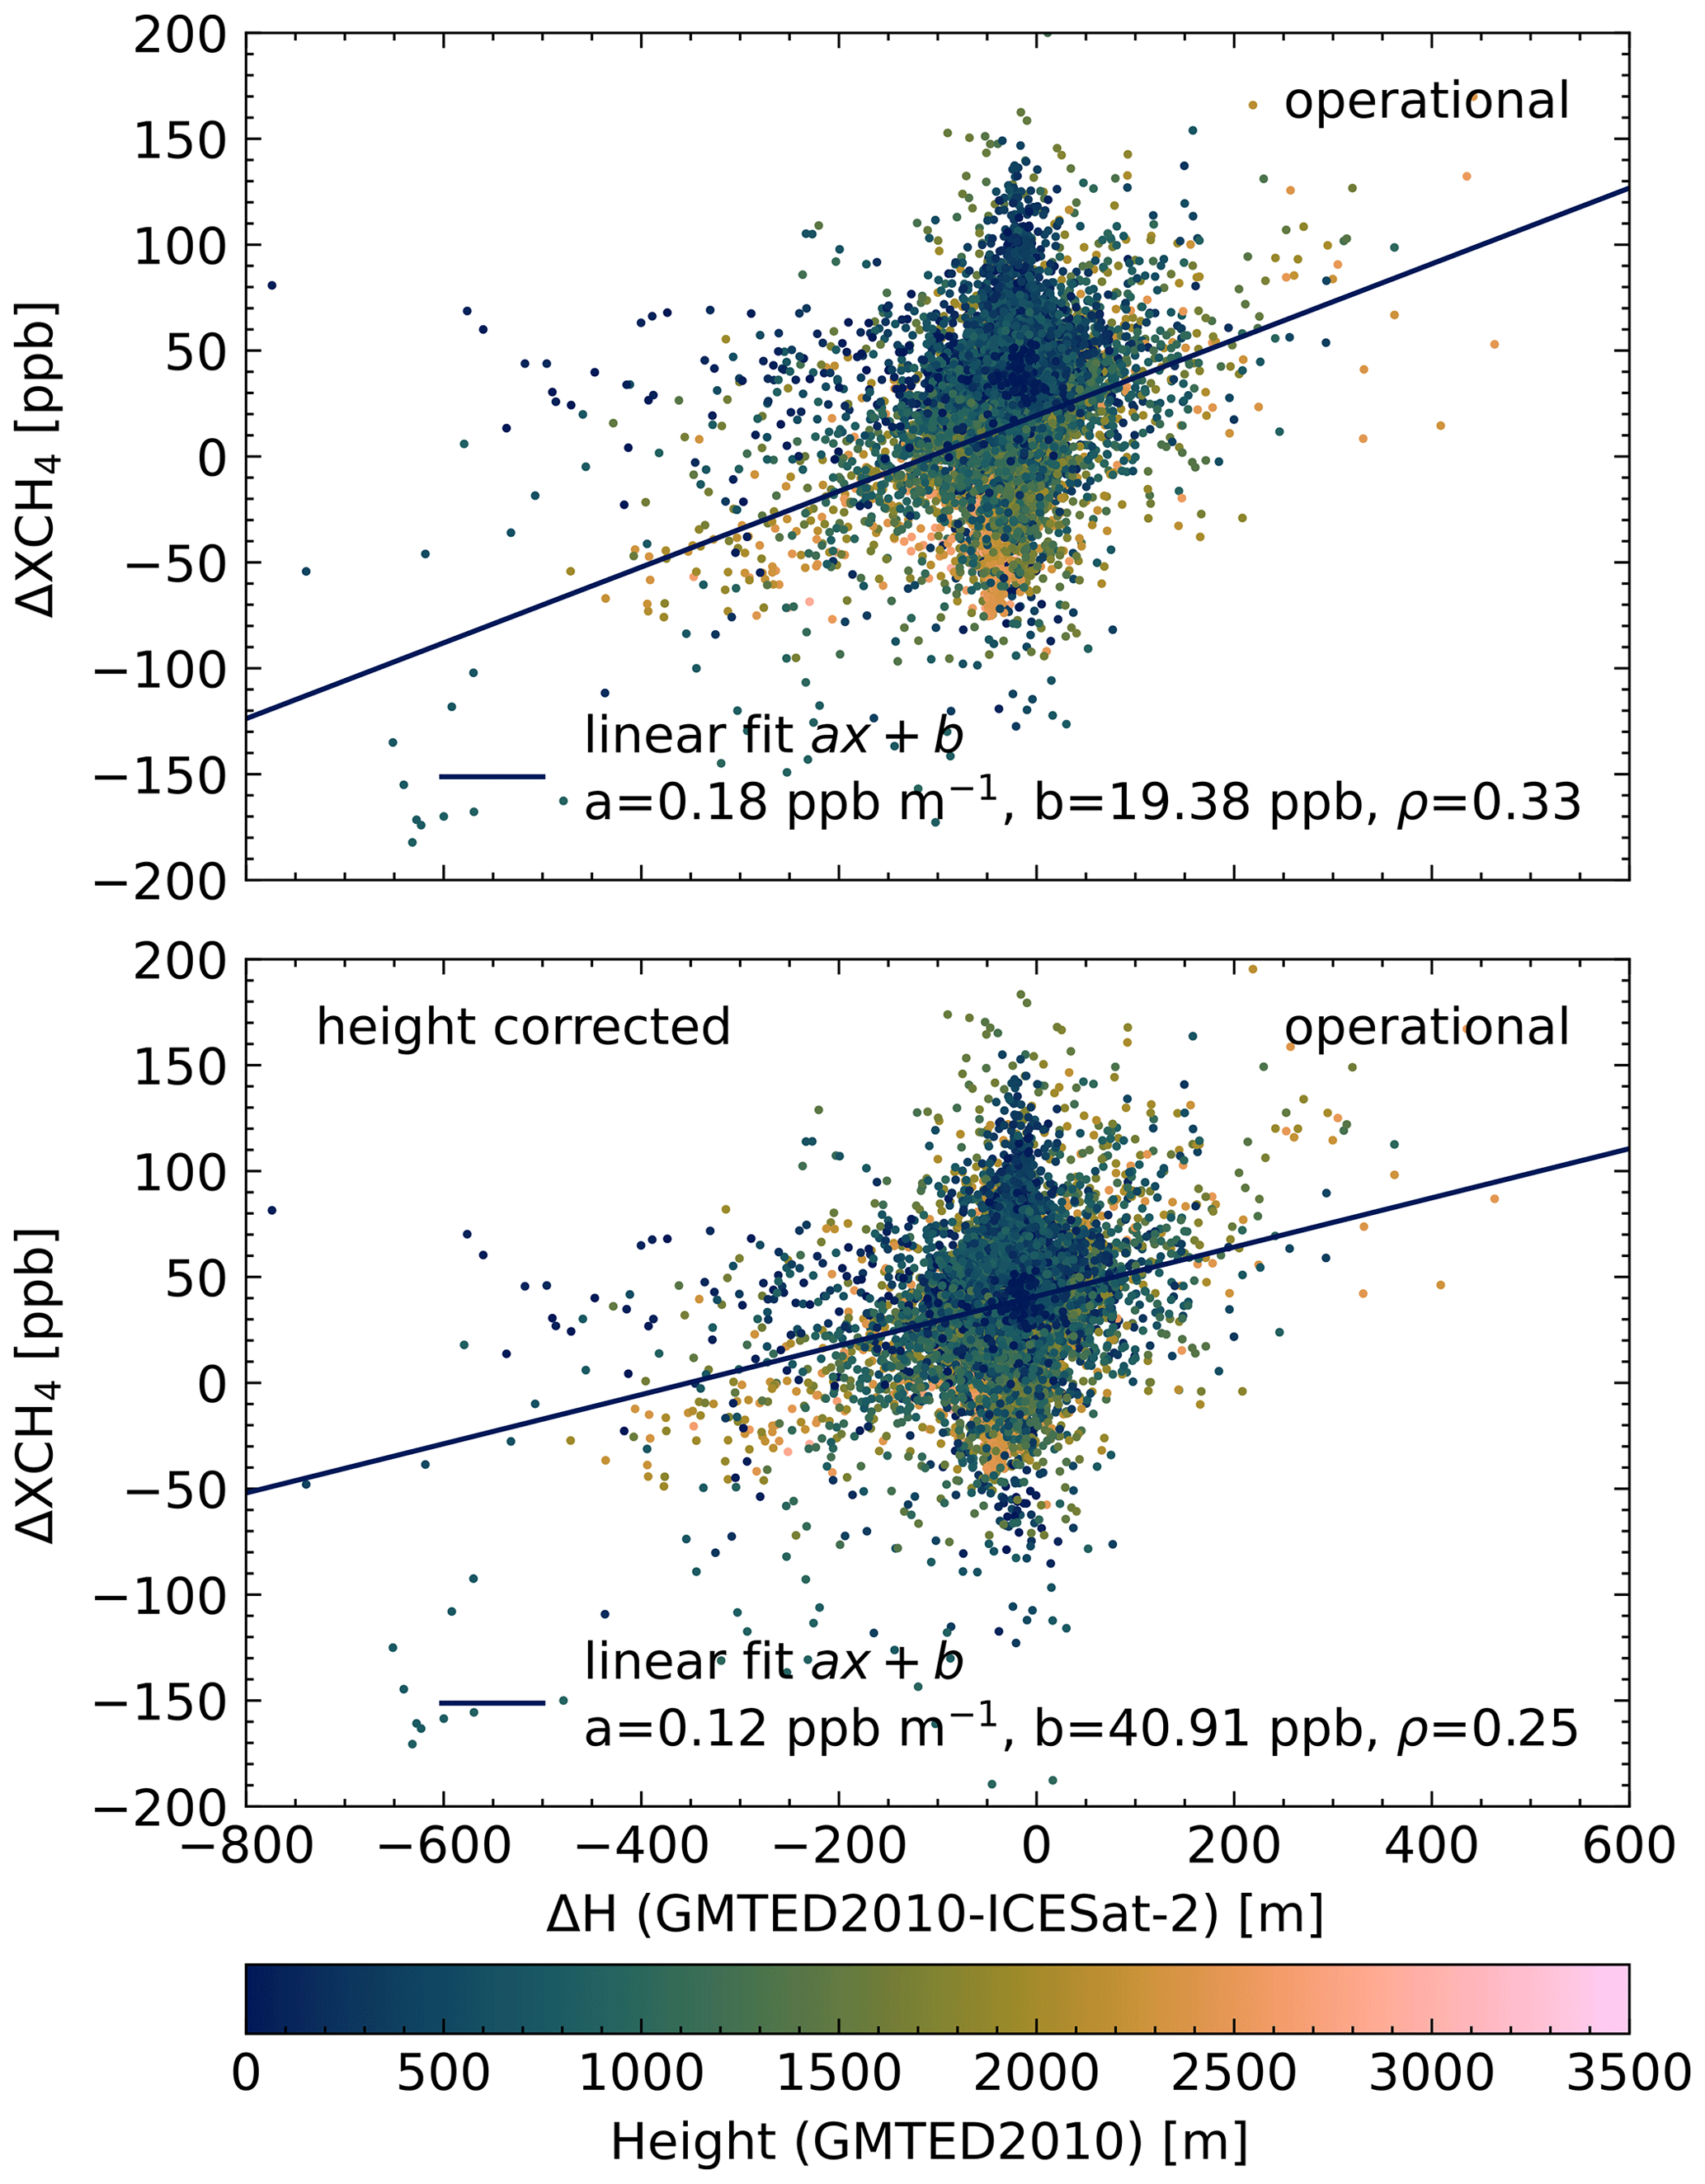
In Figs. 8 and 9 we show the correlation plots for all of Greenland for the WFMD and the operational product, respectively. For the WFMD product the correlation is again improved by the height correction (ρ=0.49). For the operational data we observe a greater spread of values and a less significant correlation with ρ=0.27 in the height-corrected case.
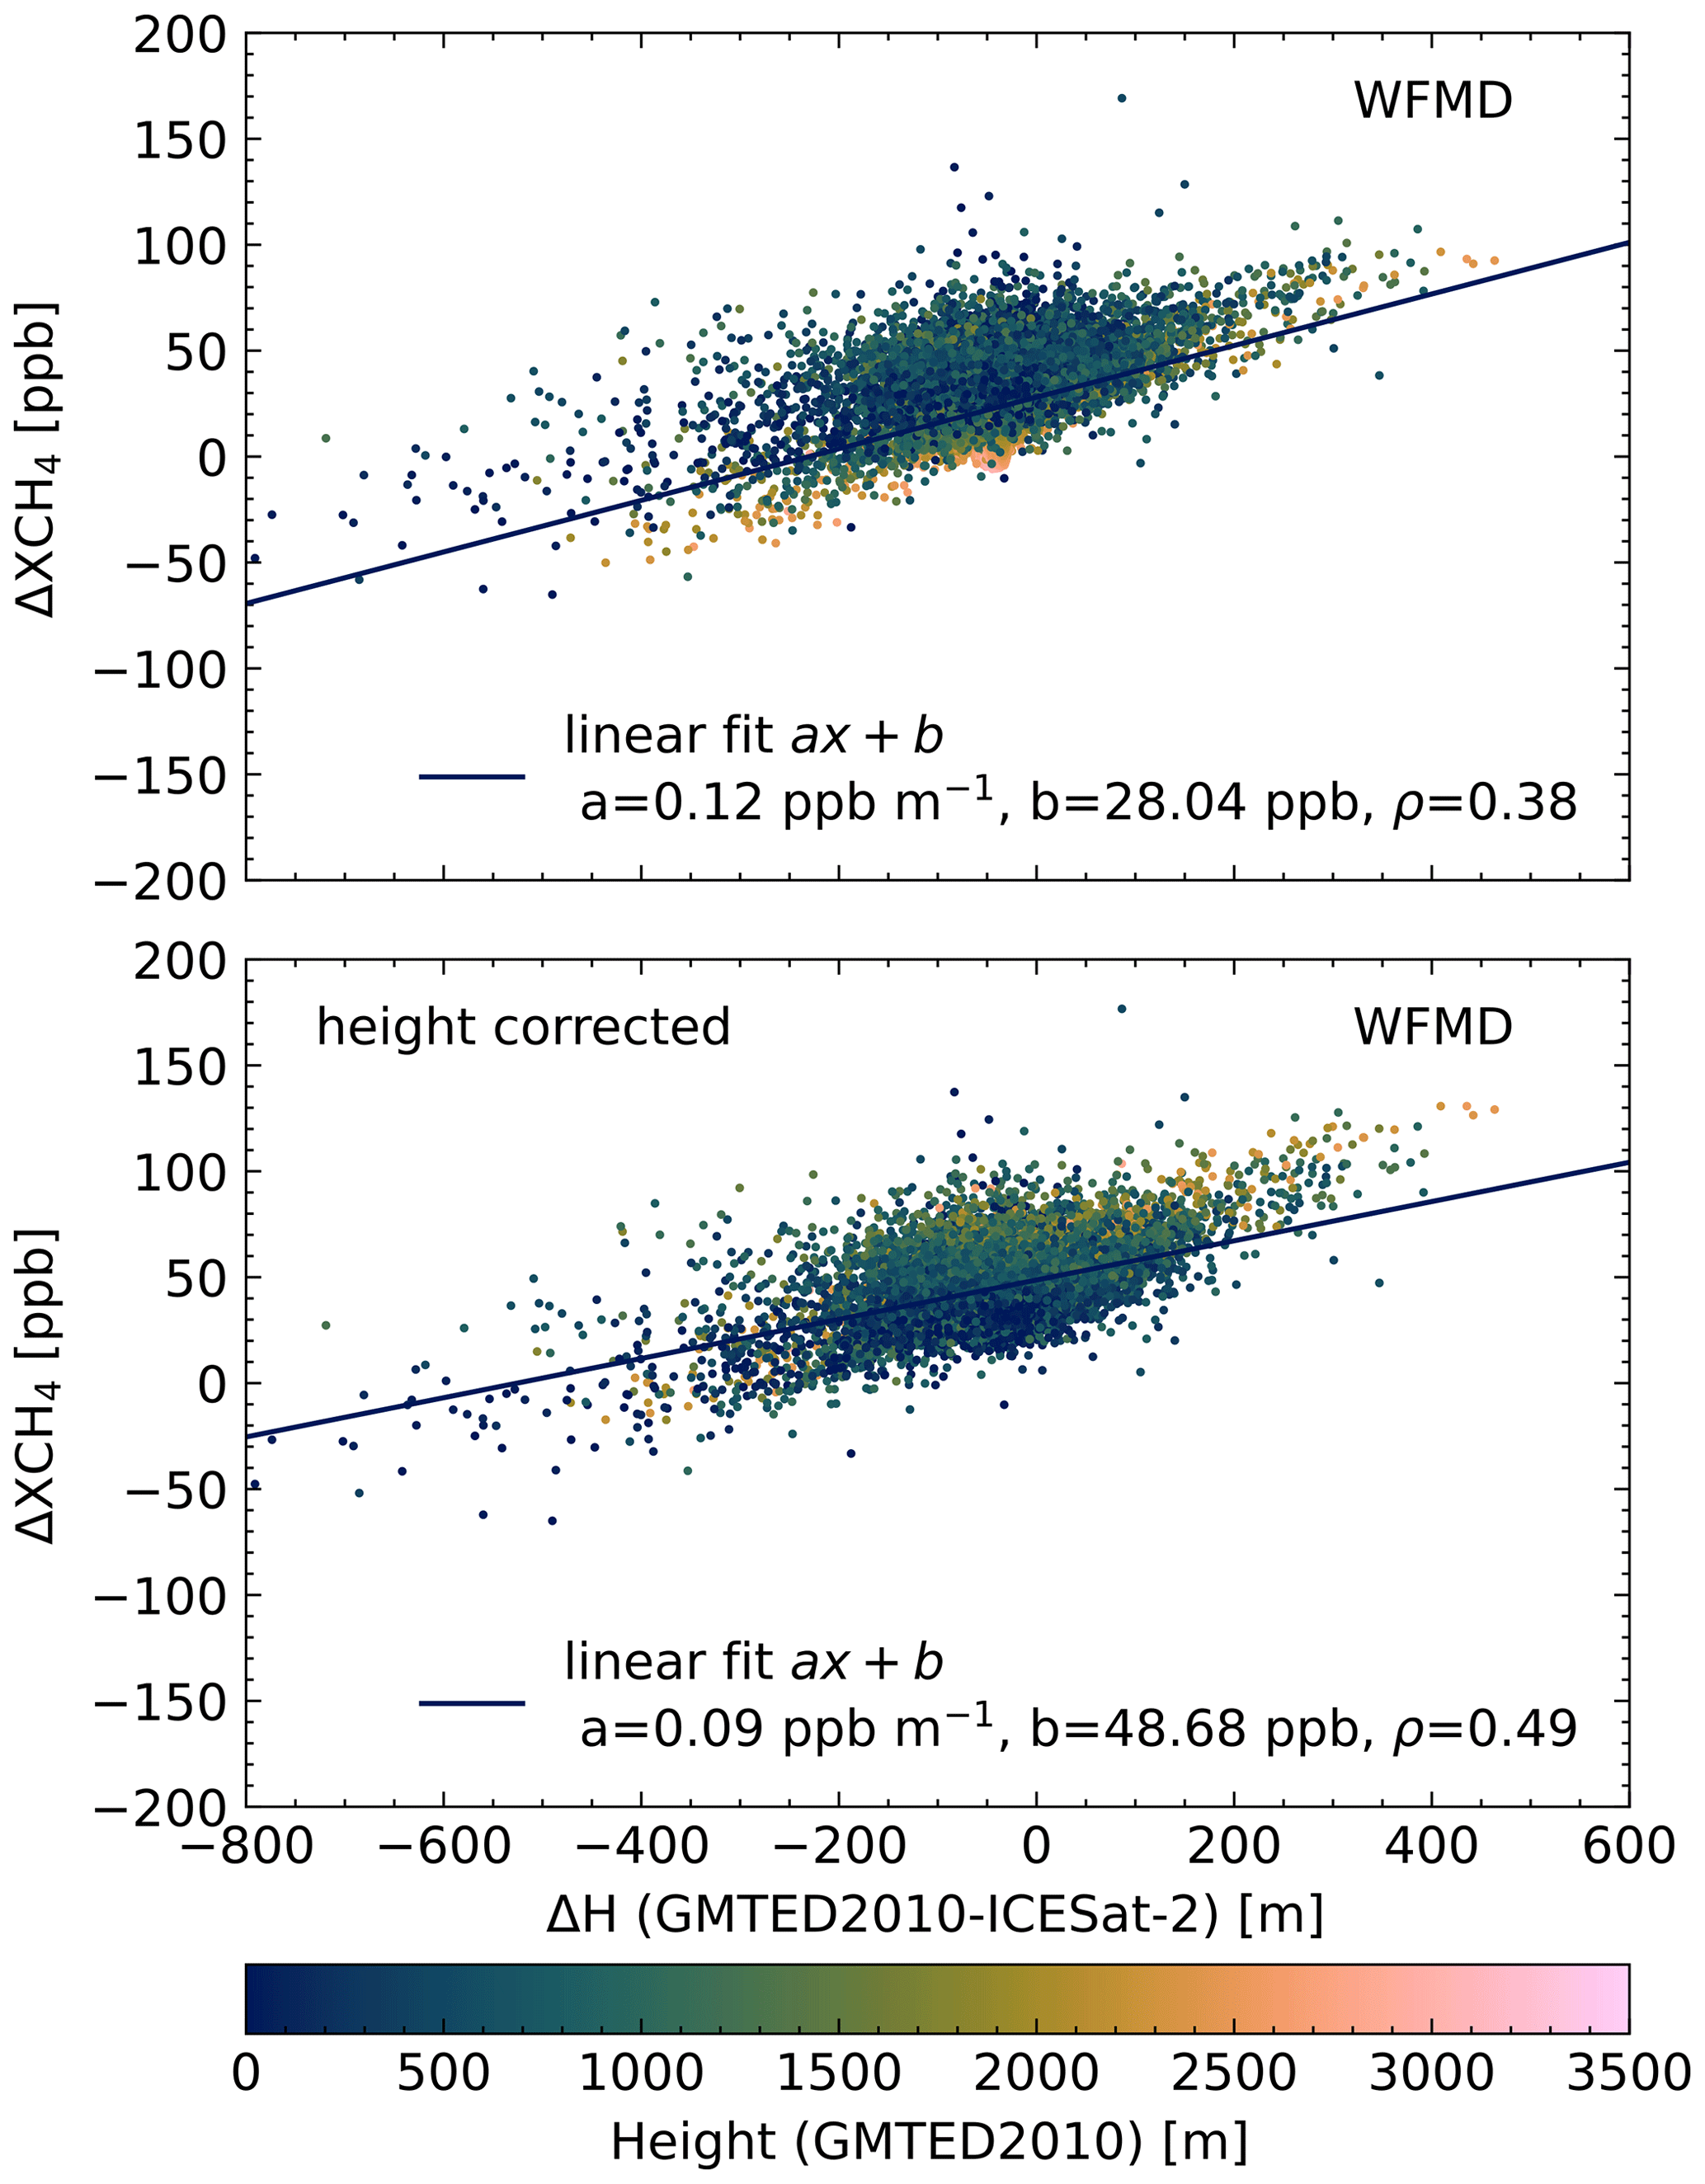
Figure 8Correlation between mean 7 d methane anomaly and ΔH for the WFMD product (whole Greenland region). See Fig. 6 for an explanation of the height correction.
4.5 Updated WFMD product
Finally, we present a preliminary version of an updated WFMD product which is reprocessed using the Greenland DEM from Fan et al. (2022) instead of GMTED2010. Furthermore, the quality filter is refined using additional ocean data in the training of the random forest classifier (see Schneising, 2021a) (18 million added scenes compared to v1.5 equally distributed over 30 d) to reduce scenes with residual cloudiness, in particular over the Arctic Ocean in summer. Figure 10 shows the WFMD v1.5 and the improved version with the more accurate DEM next to each other. The dominant features in regions 1 and 2 are no longer visible in the updated version. In addition, smaller features along the whole coastline of Greenland are no longer visible. A difference between the two versions is shown in Fig. 11. The areas of great difference (e.g. regions 1 and 2) nicely correspond to the differences observed between GMTED2010 and ICESat-2 data in Fig. 3. Even though there is no validation with third-party products, the updates to the WFMD product create an overall smoother and more realistic methane distribution and thus present significant improvements of the WFMD product over Greenland.
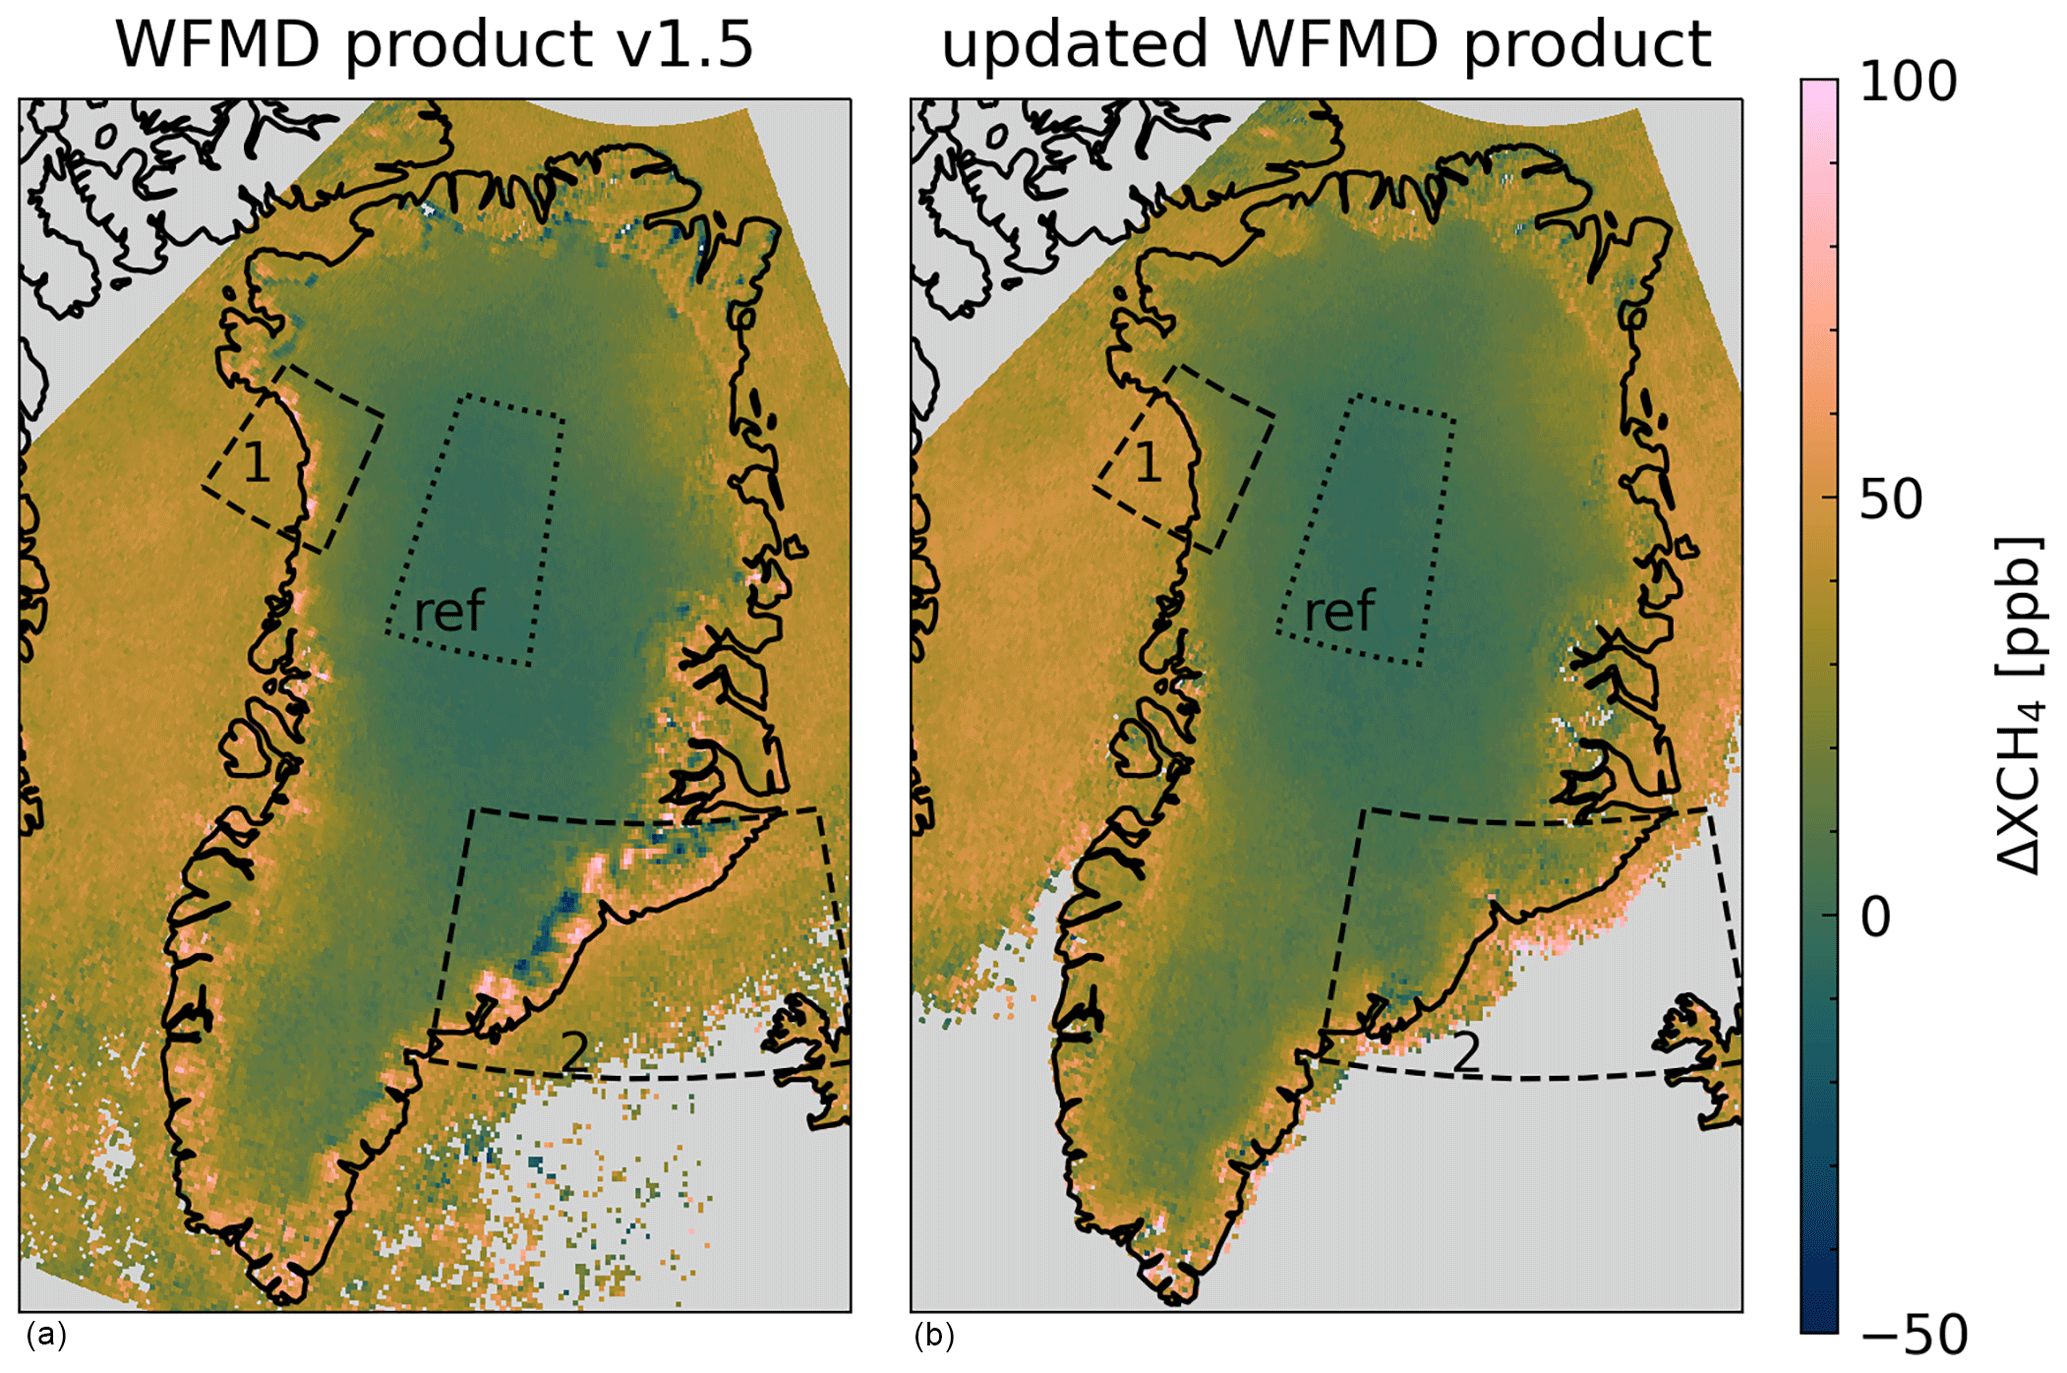
Figure 10Comparison of the mean 7 d XCH4 anomaly from 2018–2020 over Greenland in the WFMD v1.5 product (Schneising et al., 2019) (a) and an updated version of the WFMD product (b) (data provided by co-author Oliver Schneising). The distinct features in region 1 and 2 vanish for the updated WFMD product. The reference area is shown by the dotted contour. The dashed boxes show areas investigated in this work. The lower coverage over the ocean for the updated product is due to stricter quality filter criteria.

Figure 11Difference of the mean 7 d XCH4 anomaly from 2018–2020 over Greenland between WFMD v1.5 (Schneising et al., 2019) and the updated WFMD product (data provided by co-author Oliver Schneising). The reference area is shown by the dotted contour. The dashed boxes show areas investigated in this work.
Since a globally consistent recent DEM is desirable for a global product and inaccuracies of GMTED2010 may also occur in other regions of the world (e.g. Antarctica), the Copernicus GLO-90 digital elevation model (European Space Agency, 2021) will be used in the next version of the WFMD product.
In this study we investigated the presence of strong methane anomalies along Greenland's coastline for both the operational S5P methane product and the WFMD product (see Figs. 1 and 2). Our hypothesis was that some of these anomalies can be explained by the use of inadequate topography data from GMTED2010 in both algorithms. We tested this hypothesis by calculating the height difference ΔH between GMTED2010 and elevation data from ICESat-2 and correlating it with the mean 7 d methane anomaly ΔXCH4. For the WFMD product we observed good correlations for regions 1 and 2 (Fig. 6) as well as all of Greenland (Fig. 8). The correlation coefficients were improved by accounting for the underlying height relationship due to the elevation dependent weighting of stratospheric air using the linear correction factor of 14.8 ppb km−1 (see Sect. 4.4). Finally, we present an updated version of the WFMD product in Fig. 10 which uses updated elevation data from Fan et al. (2022); here we can see that features discussed in this paper disappeared, thus demonstrating that they were caused by the usage of outdated topography data.
For the operational S5P methane product the correlations were less clear (Figs. 7 and 9). While the correlations for region 1 as well as the whole Greenland region have high uncertainties, the correlations for region 2 have smaller uncertainties and are thus more clearly identifiable but have significant noise. We argue that the same effect seen in the WFMD data can be observed for the operational data. However, multiple factors obfuscate this effect. Firstly, the coverage of the operational product is lower in the investigated regions (see Fig. 2); this data gap includes bare rock regions, which show large uncertainties in the GMTED2010 data (see Sect. 2.2). Thus, some of the areas responsible for the correlations are missing in this product. Secondly, additional effects of higher magnitude are present in the operational data. This can be seen in Fig. 5, which shows large methane anomalies not related to height anomalies. While the source of these effects is not known, possible candidates are albedo-related biases or issues in snow-covered scenes previously described by Lorente et al. (2021).
Our investigations show that the use of wrong or inadequate topography information introduces significant bias to the S5P XCH4 data products at around ± 50–100 ppb. This issue can be resolved by using adequate topography data where available. Ideally, the topography would be regularly updated as the elevation of glaciated regions is prone to change. For the WFMD product a new version with updated topography data and other improvements is currently being prepared for release. Lorente et al. (2021) proposed the usage of Shuttle Radar Topography Mission (SRTM) data instead of GMTED2010 to be incorporated into the next processor update for the S5P operational methane product. While the higher-spatial-resolution data may help, the SRTM data are from the year 2000 and thus cannot capture the changes to Greenland's ice sheet which occurred during the last 20 years. In Appendix B we discuss the 7 d methane anomaly for the scientific SRON product (which uses SRTM data), which shows improvements in comparison to the operational data product. In conclusion, we recommend the use of the most accurate and appropriately timed DEM available.
We have demonstrated in this study that iterative testing and investigation prove to be vital to ensuring the quality of S5P methane data products. While the focus of this paper was on Greenland, we note that biases due to inadequate or inaccurate elevation data may also arise in other regions. This is especially true for polar regions because the topography can change over a few years (e.g. glacier ice loss, see Willis et al., 2018) and DEMs are rarely updated. While the spatial extent of problematic regions outside Greenland is probably much smaller and DEM-related biases are typically expected to be smaller, we still expect significant biases in other areas where either DEMs have high inaccuracies or notable change in the topography occurred since the creation of the DEM. We want to emphasize that both effects are important to consider for present S5P data products as well as for future missions that need a DEM as input data.
In our analysis we use gridded ATL11/ICESat-2 data as described in Sect. 3.2. The updated WFMD product we use for comparison is, however, based on a recently published Greenland DEM based on ATL11/ICESat-2 data (Fan et al., 2022). In Fig. A1 we show the difference between our data and the downsampled DEM by Fan et al. (2022). Most differences seem to occur over bare rock regions at the edges of Greenland. Here we can observe differences of up to 200–300 m. We assume this happens because we use a very simple gridding method without any additional filtering criteria (except the quality flag). Thus, we redid part of our analysis with the Fan et al. (2022) DEM, which can be seen in Fig. A2. Comparisons between Figs. 6 and A2 show that the differences are small. Use of the new DEM changes the correlation coefficients by roughly 0.02 in the height-corrected case. Since the differences are small and do not change the interpretation of our results we conclude that the use of our own gridded ICESat-2 data introduces no significant errors to our analysis. Figure A3 shows the updated version of Fig. 7.
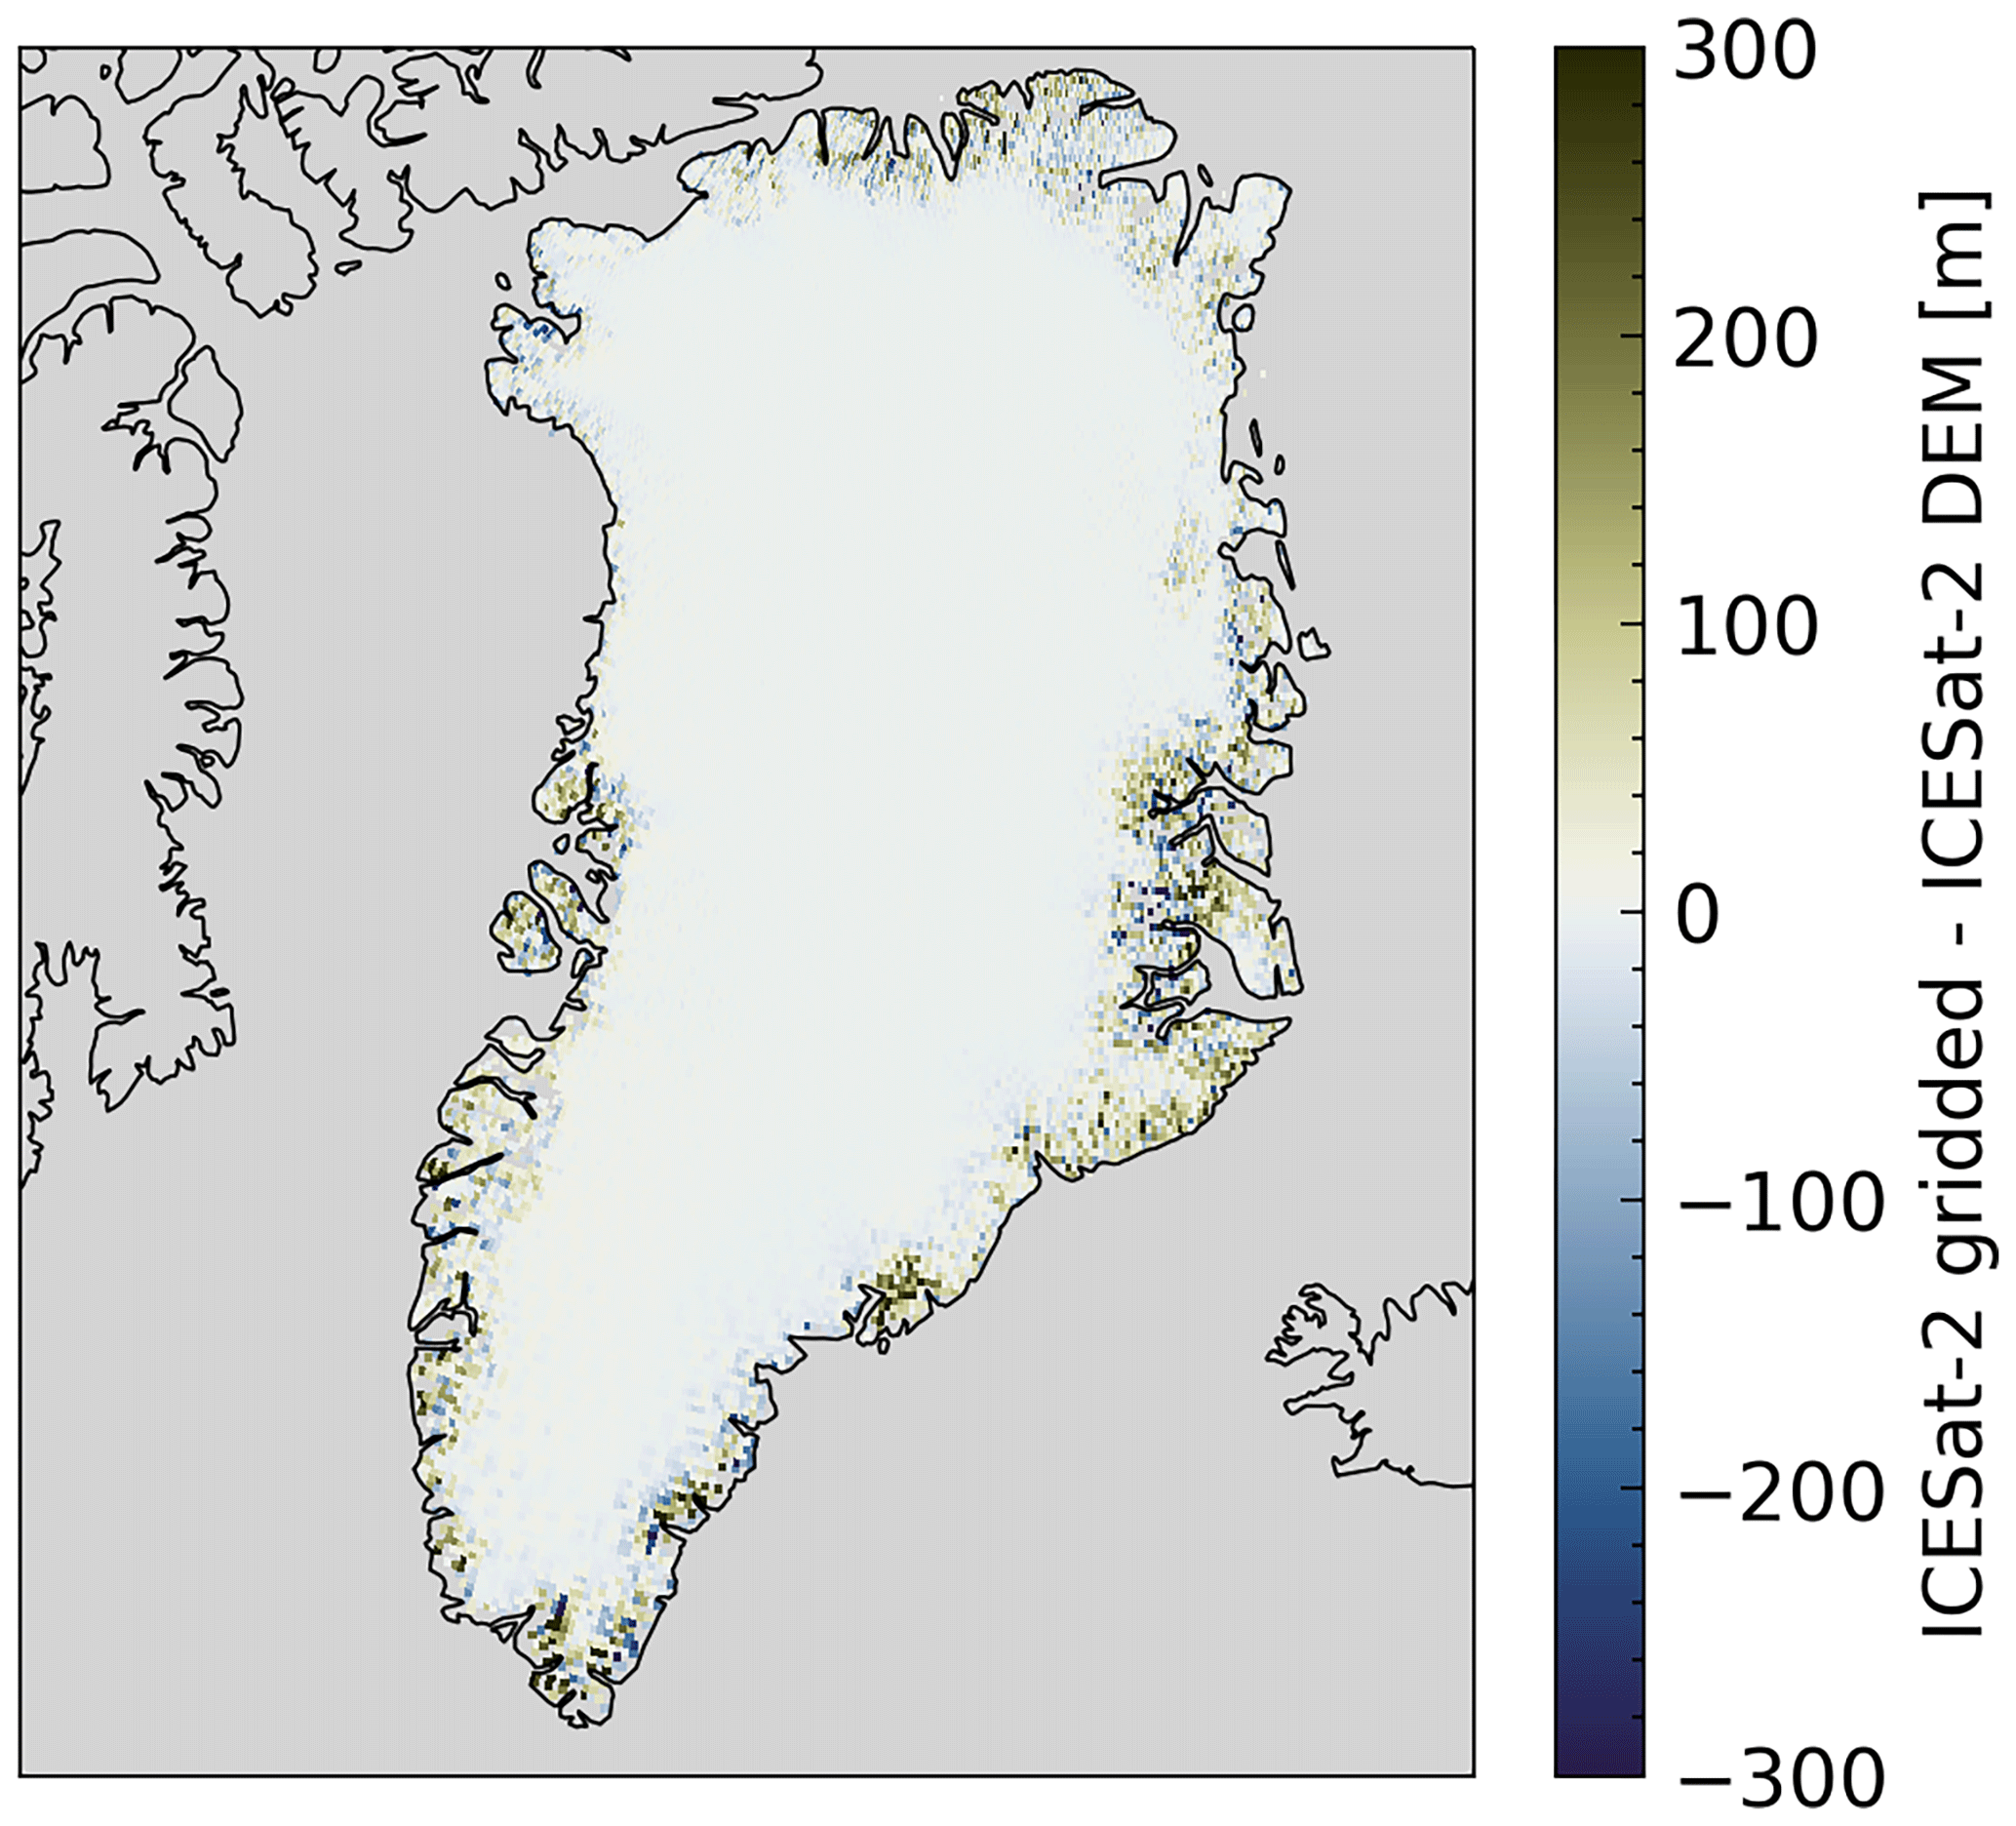
Figure A1Difference between our own gridded ICESat-2 data (Smith et al., 2021b) and DEM from ICESat-2 data by Fan et al. (2022). Differences mainly occur on the edges of Greenland where height errors can be high over rocky regions.
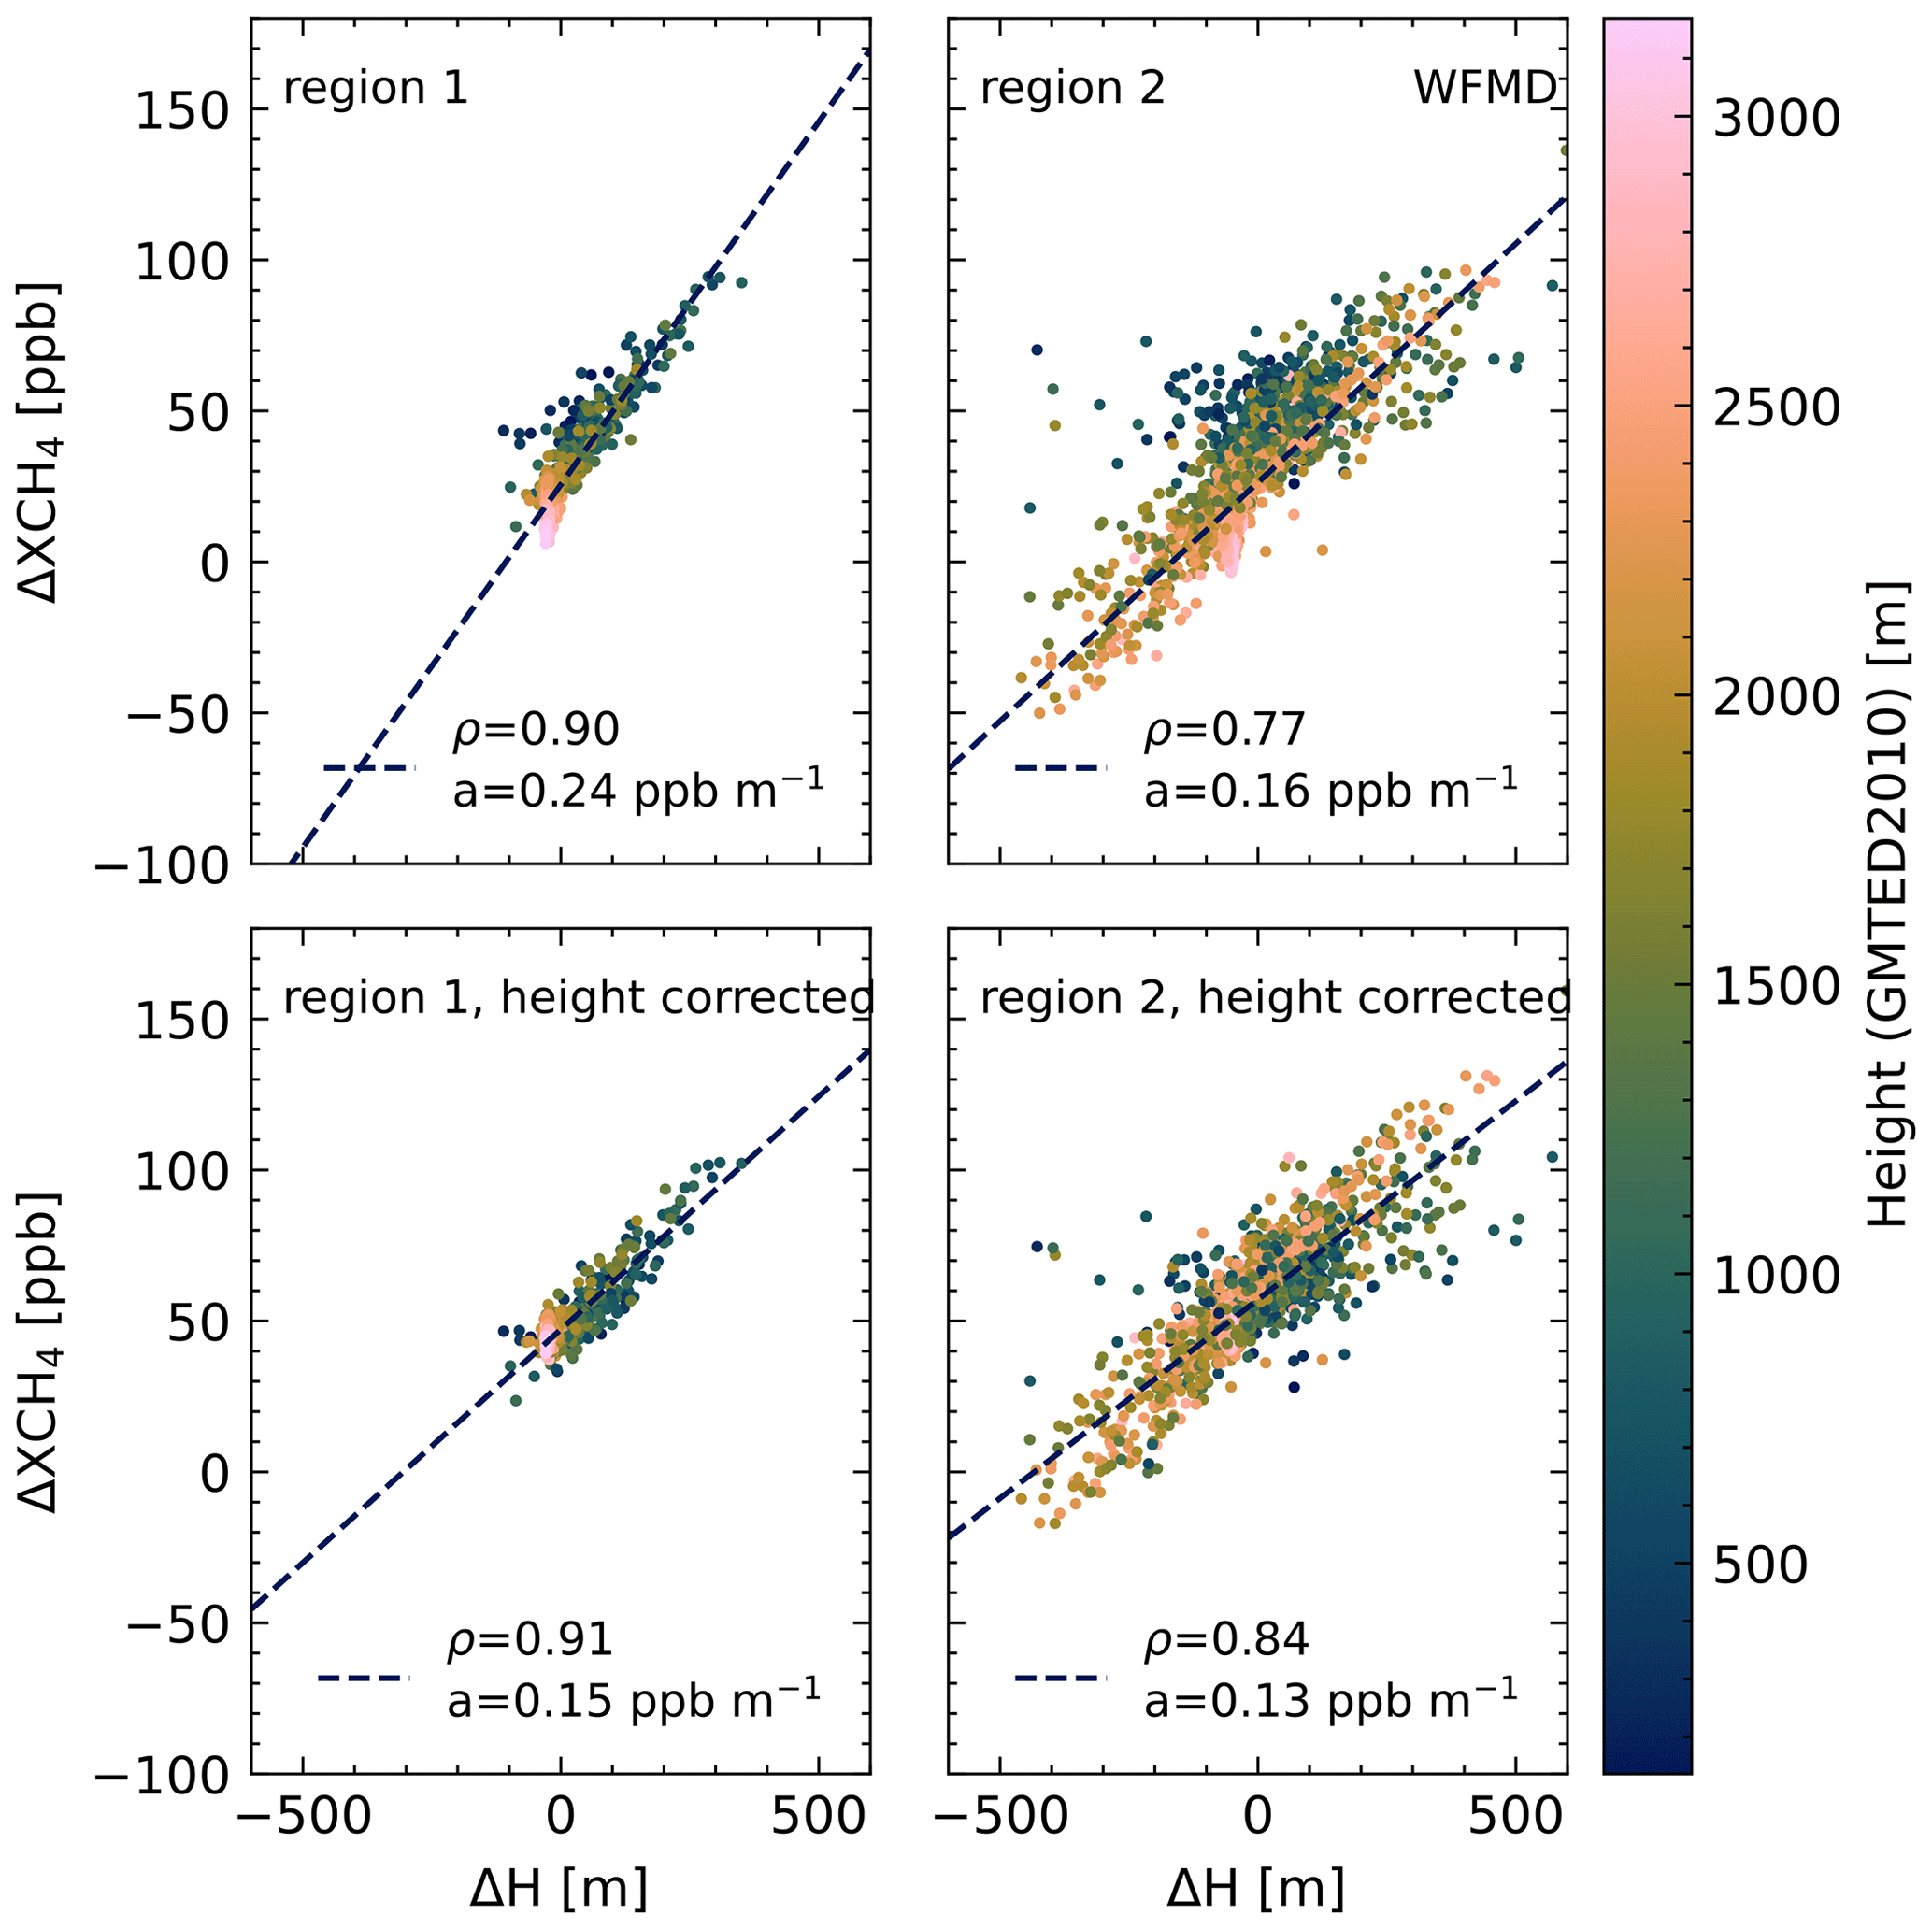
Figure A2Correlation between mean 7 d methane anomaly ΔXCH4 and ΔH for the WFMD product. Here we use the DEM from Fan et al. (2022) instead of our own gridded ICESat-2 data. See Fig. 6 for an explanation of the height correction.

Figure A3Correlation between mean 7 d methane anomaly ΔXCH4 and ΔH for the operational product. Here we use the DEM from Fan et al. (2022) instead of our own gridded ICESat-2 data. See Fig. 7 for an explanation of the height correction.

Figure A4Comparison of the mean 7 d XCH4 anomaly from 2018–2020 over Greenland in the operational product (Hu et al., 2016) (a) and the scientific SRON product (Lorente et al., 2021) (b). The reference area is shown by the dotted contour. The dashed boxes show areas investigated in this work.
While our analysis focused on the WFMD and operational data products we want to mention improvements made in the scientific SRON product compared to the operational data, showing a similar smooth and realistic methane distribution as the updated WFMD data product. Figure A4 shows the 7 d methane anomaly for the operational and scientific data products. The strong negative ΔXCH4 anomalies at the edge of Greenland vanish for the scientific product, which we identify with improvements made at low-surface-albedo scenes (Lorente et al., 2021). Strong positive anomalies are reduced for region 2 but stay present for other coastal regions of Greenland. We assume that the use of SRTM elevation data (Lorente et al., 2021) led to improvements in region 2 due to the higher resolution in comparison to GMTED2010. In other areas changes in the elevation (e.g. due to the melting of glaciers) are not captured by SRTM data, which are around 20 years old. Therefore, we recommend using an updated topography in future releases.
The TROPOMI scientific WFMD methane data product is available at https://www.iup.uni-bremen.de/carbon_ghg/products/tropomi_wfmd/ (last access: 4 July 2022; Schneising et al., 2019, https://doi.org/10.5194/amt-12-6771-2019). The TROPOMI operational methane data product is available from https://doi.org/10.5270/S5P-3p6lnwd (European Space Agency, 2022). The TROPOMI scientific SRON data product is available at https://ftp.sron.nl/open-access-data-2/TROPOMI/tropomi/ch4/18_17/ (last access: 3 June 2022; Lorente et al., 2022). GMTED2010 data are available at https://doi.org/10.5066/F7J38R2N (Danielson and Gesch, 2011b). ATL11/ICE-Sat2 data are available at https://doi.org/10.5067/ATLAS/ATL11.004 (Smith et al., 2021b). Code is available per request from the authors.
JH produced the methods and the results. OS provided a preliminary version of the WFMD product used in the analysis. JH wrote the original draft with input from OS, MiB and MaB. AL, TB, JPB and JN contributed to the discussion of the results. All authors contributed to the final version of the paper.
At least one of the (co-)authors is a member of the editorial board of Atmospheric Measurement Techniques. The peer-review process was guided by an independent editor, and the authors also have no other competing interests to declare.
Publisher's note: Copernicus Publications remains neutral with regard to jurisdictional claims in published maps and institutional affiliations.
The pre-operational TROPOMI data processing was carried out on the Dutch national e-infrastructure with the support of SURF Cooperative. Scientific colour maps (Crameri, 2021) are used in this study to prevent visual distortion of data and exclusion of readers with colour-vision deficiencies (Crameri et al., 2020).
This publication contains modified Copernicus Sentinel data (2018–2020). Sentinel-5 Precursor is an ESA mission implemented on behalf of the European Commission. The TROPOMI payload is a joint development by the ESA and the Netherlands Space Office (NSO). The Sentinel-5 Precursor ground-segment development has been funded by the ESA and with national contributions from the Netherlands, Germany and Belgium.
This research is funded by the University of Bremen as part of the junior research group “Greenhouse gases in the Arctic”. We gratefully acknowledge the funding by the Deutsche Forschungsgemeinschaft (DFG, German Research Foundation, projektnummer 268020496 – TRR 172) within the Transregional Collaborative Research Center “ArctiC Amplification: Climate Relevant Atmospheric and SurfaCe Processes, and Feedback Mechanisms (AC)3”. This research also received funding from the European Space Agency (ESA) Climate Change Initiative (CCI) via project GHG-CCI+ (ESA contract no. 4000126450/19/I-NB). The TROPOMI/WFMD retrievals presented here were performed on HPC facilities of the IUP, University of Bremen, funded under DFG/FUGG grant nos. INST 144/379-1 and INST 144/493-1.
The article processing charges for this open-access publication were covered by the University of Bremen.
This paper was edited by Helen Worden and reviewed by two anonymous referees.
Abdalati, W., Zwally, H. J., Bindschadler, R., Csatho, B., Farrell, S. L., Fricker, H. A., Harding, D., Kwok, R., Lefsky, M., Markus, T., Marshak, A., Neumann, T., Palm, S., Schutz, B., Smith, B., Spinhirne, J., and Webb, C.: The ICESat-2 Laser Altimetry Mission, P. IEEE, 98, 735–751, https://doi.org/10.1109/JPROC.2009.2034765, 2010. a
AMAP: AMAP Assessment 2015: Methane as an Arctic climate forcer, https://www.amap.no/documents/doc/amap-assessment-2015-methane-as-an-arctic-climate-forcer/1285, 2015. a
Apituley, A., Pedergnana, M., Sneep, M., Pepijn, V. J., Loyola, D., and Hasekamp, O.: Sentinel-5 precursor/TROPOMI Level 2 Product User Manual Methane, European Space Agency, https://sentinels.copernicus.eu/web/sentinel/data-products/-/asset_publisher/fp37fc19FN8F/content/tropomi-level-2-methane (last access: 4 May 2022), 2017. a, b, c
Bamber, J. L., Ekholm, S., and Krabill, W. B.: A new, high-resolution digital elevation model of Greenland fully validated with airborne laser altimeter data, J. Geophys. Res., 106, 6733–6745, https://doi.org/10.1029/2000JB900365, 2001. a, b
Barré, J., Aben, I., Agustí-Panareda, A., Balsamo, G., Bousserez, N., Dueben, P., Engelen, R., Inness, A., Lorente, A., McNorton, J., Peuch, V.-H., Radnoti, G., and Ribas, R.: Systematic detection of local CH4 anomalies by combining satellite measurements with high-resolution forecasts, Atmos. Chem. Phys., 21, 5117–5136, https://doi.org/10.5194/acp-21-5117-2021, 2021. a
Buchwitz, M., de Beek, R., Noël, S., Burrows, J. P., Bovensmann, H., Schneising, O., Khlystova, I., Bruns, M., Bremer, H., Bergamaschi, P., Körner, S., and Heimann, M.: Atmospheric carbon gases retrieved from SCIAMACHY by WFM-DOAS: version 0.5 CO and CH4 and impact of calibration improvements on CO2 retrieval, Atmos. Chem. Phys., 6, 2727–2751, https://doi.org/10.5194/acp-6-2727-2006, 2006. a
Buchwitz, M., Khlystova, I., Bovensmann, H., and Burrows, J. P.: Three years of global carbon monoxide from SCIAMACHY: comparison with MOPITT and first results related to the detection of enhanced CO over cities, Atmos. Chem. Phys., 7, 2399–2411, https://doi.org/10.5194/acp-7-2399-2007, 2007. a
Crameri, F.: Scientific colour maps, Zenodo [code], https://doi.org/10.5281/zenodo.5501399, 2021. a
Crameri, F., Shephard, G. E., and Heron, P. J.: The misuse of colour in science communication, Nat. Commun., 11, 5444, https://doi.org/10.1038/s41467-020-19160-7, 2020. a
Danielson, J. J. and Gesch, D. B.: Global multi-resolution terrain elevation data 2010 (GMTED2010), U.S. Geological Survey, https://doi.org/10.3133/ofr20111073, Open-File Report 2011–1073, 26 pp., 2011a. a, b
Danielson, J. J. and Gesch, D. B.: Global multi-resolution terrain elevation data 2010 (GMTED2010) [30-arc-second mean; 50∘ N, 90∘ W, 90∘ N, 0∘ W], U.S. Geological Survey [data set], https://doi.org/10.5066/F7J38R2N, 2011b. a, b, c, d
Etminan, M., Myhre, G., Highwood, E. J., and Shine, K. P.: Radiative forcing of carbon dioxide, methane, and nitrous oxide: A significant revision of the methane radiative forcing, Geophys. Res. Lett., 43, 12614–12623, https://doi.org/10.1002/2016GL071930, 2016. a
European Space Agency (ESA): Copernicus Global Digital Elevation Models, OpenTopography, https://doi.org/10.5069/G9028PQB, 2021. a
European Space Agency (ESA): Copernicus Sentinel-5P, TROPOMI Level 2 Methane Total Column products, Version 01, processed by: ESA [data set], https://doi.org/10.5270/S5P-3p6lnwd, 2022. a
Fan, Y., Ke, C.-Q., and Shen, X.: A new Greenland digital elevation model derived from ICESat-2 during 2018–2019, Earth Syst. Sci. Data, 14, 781–794, https://doi.org/10.5194/essd-14-781-2022, 2022. a, b, c, d, e, f, g, h, i, j
Froitzheim, N., Majka, J., and Zastrozhnov, D.: Methane release from carbonate rock formations in the Siberian permafrost area during and after the 2020 heat wave, P. Natl. Acad. Sci. USA, 118, e2107632118, https://doi.org/10.1073/pnas.2107632118, 2021. a
Hasekamp, O., Lorente, A., Haili, H., Butz, A., aan de Brugh, J., and Landgraf, J.: Algorithm Theoretical Baseline Document for Sentinel-5 Precursor Methane Retrieval, SRON Netherlands Institute for Space Research, http://www.tropomi.eu/sites/default/files/files/publicSentinel-5P-TROPOMI-ATBD-Methane-retrieval.pdf (last access: 24 January 2022), 2019. a, b
Hersbach, H., Bell, B., Berrisford, P., Hirahara, S., Horányi, A., Muñoz-Sabater, J., Nicolas, J., Peubey, C., Radu, R., Schepers, D., Simmons, A., Soci, C., Abdalla, S., Abellan, X., Balsamo, G., Bechtold, P., Biavati, G., Bidlot, J., Bonavita, M., De Chiara, G., Dahlgren, P., Dee, D., Diamantakis, M., Dragani, R., Flemming, J., Forbes, R., Fuentes, M., Geer, A., Haimberger, L., Healy, S., Hogan, R. J., Hólm, E., Janisková, M., Keeley, S., Laloyaux, P., Lopez, P., Lupu, C., Radnoti, G., de Rosnay, P., Rozum, I., Vamborg, F., Villaume, S., and Thépaut, J.-N.: The ERA5 global reanalysis, Q. J. Roy. Meteor. Soc., 146, 1999–2049, https://doi.org/10.1002/qj.3803, 2020. a
Hu, H., Hasekamp, O., Butz, A., Galli, A., Landgraf, J., Aan de Brugh, J., Borsdorff, T., Scheepmaker, R., and Aben, I.: The operational methane retrieval algorithm for TROPOMI, Atmos. Meas. Tech., 9, 5423–5440, https://doi.org/10.5194/amt-9-5423-2016, 2016. a, b, c, d, e
Hugelius, G., Strauss, J., Zubrzycki, S., Harden, J. W., Schuur, E. A. G., Ping, C.-L., Schirrmeister, L., Grosse, G., Michaelson, G. J., Koven, C. D., O'Donnell, J. A., Elberling, B., Mishra, U., Camill, P., Yu, Z., Palmtag, J., and Kuhry, P.: Estimated stocks of circumpolar permafrost carbon with quantified uncertainty ranges and identified data gaps, Biogeosciences, 11, 6573–6593, https://doi.org/10.5194/bg-11-6573-2014, 2014. a
Lorente, A., Borsdorff, T., Butz, A., Hasekamp, O., aan de Brugh, J., Schneider, A., Wu, L., Hase, F., Kivi, R., Wunch, D., Pollard, D. F., Shiomi, K., Deutscher, N. M., Velazco, V. A., Roehl, C. M., Wennberg, P. O., Warneke, T., and Landgraf, J.: Methane retrieved from TROPOMI: improvement of the data product and validation of the first 2 years of measurements, Atmos. Meas. Tech., 14, 665–684, https://doi.org/10.5194/amt-14-665-2021, 2021. a, b, c, d, e, f, g, h
Lorente, A., Borsdorff, T., Landgraf, J., and the SRON L2 team: SRON RemoTeC-S5P XCH4 scientific product, SRON Netherlands Institute for Space Research [data set], https://ftp.sron.nl/open-access-data-2/TROPOMI/tropomi/ch4/18_17/, last access: 3 June 2022. a
Ludewig, A.: S5P Mission Performance Centre Level 1b Readme, SRON Netherlands Institute for Space Research, https://sentinels.copernicus.eu/documents/247904/3541451/Sentinel-5P-Level-1b-Product-Readme-File.pdf/a89d82ce-7414-43e6-ac77-0c371ed1b096 (last access: 3 March 2022), 2021. a
Masson-Delmotte, V., Zhai, P., Pirani, A., Connors, S., Péan, C., Berger, S., Caud, N., Chen, Y., Goldfarb, L., Gomis, M., Huang, M., Leitzell, K., Lonnoy, E., Matthews, J., Maycock, T., Waterfield, T., Yelekçi, O., Yu, R., and Zhou, B.: Climate Change 2021: The Physical Science Basis. Contribution of Working Group I to the Sixth Assessment Report of the Intergovernmental Panel on Climate Change, Cambridge University Press, https://www.ipcc.ch/report/sixth-assessment-report-working-group-i/ (last access: 26 January 2022), 2021. a, b
Neumann, T. A., Martino, A. J., Markus, T., Bae, S., Bock, M. R., Brenner, A. C., Brunt, K. M., Cavanaugh, J., Fernandes, S. T., Hancock, D. W., Harbeck, K., Lee, J., Kurtz, N. T., Luers, P. J., Luthcke, S. B., Magruder, L., Pennington, T. A., Ramos-Izquierdo, L., Rebold, T., Skoog, J., and Thomas, T. C.: The Ice, Cloud, and Land Elevation Satellite – 2 mission: A global geolocated photon product derived from the Advanced Topographic Laser Altimeter System, Remote Sens. Environ., 233, 111325, https://doi.org/10.1016/j.rse.2019.111325, 2019. a, b
Plaza, C., Pegoraro, E., Bracho, R., Celis, G., Crummer, K. G., Hutchings, J. A., Hicks Pries, C. E., Mauritz, M., Natali, S. M., Salmon, V. G., Schädel, C., Webb, E. E., and Schuur, E. A. G.: Direct observation of permafrost degradation and rapid soil carbon loss in tundra, Nat. Geosci., 12, 627–631, https://doi.org/10.1038/s41561-019-0387-6, 2019. a
Schneising, O.: Algorithm Theoretical Basis Document (ATBD), TROPOMI WFM-DOAS (TROPOMI/WFMD) XCH4, Institute of Environmental Physics, Unversity of Bremen, https://www.iup.uni-bremen.de/carbon_ghg/products/tropomi_wfmd/atbd_wfmd.pdf, last access: 2 August 2021a. a, b
Schneising, O.: Product User Guide (PUG) TROPOMI WFM-DOAS (TROPOMI/WFMD) XCH4, Institute of Environmental Physics, Unversity of Bremen, https://www.iup.uni-bremen.de/carbon_ghg/products/tropomi_wfmd/data/v15/pug_wfmd.pdf, last access: 30 June 2021b. a, b
Schneising, O., Buchwitz, M., Reuter, M., Heymann, J., Bovensmann, H., and Burrows, J. P.: Long-term analysis of carbon dioxide and methane column-averaged mole fractions retrieved from SCIAMACHY, Atmos. Chem. Phys., 11, 2863–2880, https://doi.org/10.5194/acp-11-2863-2011, 2011. a
Schneising, O., Burrows, J. P., Dickerson, R. R., Buchwitz, M., Reuter, M., and Bovensmann, H.: Remote sensing of fugitive methane emissions from oil and gas production in North American tight geologic formations, Earth's Future, 2, 548–558, https://doi.org/10.1002/2014EF000265, 2014. a
Schneising, O., Buchwitz, M., Reuter, M., Bovensmann, H., Burrows, J. P., Borsdorff, T., Deutscher, N. M., Feist, D. G., Griffith, D. W. T., Hase, F., Hermans, C., Iraci, L. T., Kivi, R., Landgraf, J., Morino, I., Notholt, J., Petri, C., Pollard, D. F., Roche, S., Shiomi, K., Strong, K., Sussmann, R., Velazco, V. A., Warneke, T., and Wunch, D.: A scientific algorithm to simultaneously retrieve carbon monoxide and methane from TROPOMI onboard Sentinel-5 Precursor, Atmos. Meas. Tech., 12, 6771–6802, https://doi.org/10.5194/amt-12-6771-2019, 2019 (data vailable at: https://www.iup.uni-bremen.de/carbon_ghg/products/tropomi_wfmd/, last access: 4 July 2022). a, b, c, d, e, f, g
Sha, M. K., Langerock, B., Blavier, J.-F. L., Blumenstock, T., Borsdorff, T., Buschmann, M., Dehn, A., De Mazière, M., Deutscher, N. M., Feist, D. G., García, O. E., Griffith, D. W. T., Grutter, M., Hannigan, J. W., Hase, F., Heikkinen, P., Hermans, C., Iraci, L. T., Jeseck, P., Jones, N., Kivi, R., Kumps, N., Landgraf, J., Lorente, A., Mahieu, E., Makarova, M. V., Mellqvist, J., Metzger, J.-M., Morino, I., Nagahama, T., Notholt, J., Ohyama, H., Ortega, I., Palm, M., Petri, C., Pollard, D. F., Rettinger, M., Robinson, J., Roche, S., Roehl, C. M., Röhling, A. N., Rousogenous, C., Schneider, M., Shiomi, K., Smale, D., Stremme, W., Strong, K., Sussmann, R., Té, Y., Uchino, O., Velazco, V. A., Vigouroux, C., Vrekoussis, M., Wang, P., Warneke, T., Wizenberg, T., Wunch, D., Yamanouchi, S., Yang, Y., and Zhou, M.: Validation of methane and carbon monoxide from Sentinel-5 Precursor using TCCON and NDACC-IRWG stations, Atmos. Meas. Tech., 14, 6249–6304, https://doi.org/10.5194/amt-14-6249-2021, 2021. a
Smith, B., Dickinson, S., Harbeck, K., Neumann, T., Hancock, D., Lee, J., and Jelly, B.: Algorithm Theoretical Baseline Document for Land-Ice Along-Track Products Part 2: Land-ice H(t)/ATL11, National Aeronautics and Space Administration (NASA), https://nsidc.org/sites/nsidc.org/files/technical-references/ICESat2_ATL11_ATBD_r004.pdf (last access: 14 February 2022), 2021a. a, b
Smith, B., Dickinson, S., Jelley, B. P., Neumann, T. A., Hancock, D., Lee, J., and Harbeck, K.: ATLAS/ICESat-2 L3B Annual Land Ice Height, Version 4 [59∘ N,75∘ W,84∘ N,10∘ W], NASA National Snow and Ice Data Center Distributed Active Archive Center [data set], Boulder, Colorado, USA, https://doi.org/10.5067/ATLAS/ATL11.004, 2021b. a, b, c, d, e
The IMBIE Team: Mass balance of the Greenland Ice Sheet from 1992 to 2018, Nature, 579, 233–239, https://doi.org/10.1038/s41586-019-1855-2, 2020. a
Veefkind, J., Aben, I., McMullan, K., Förster, H., de Vries, J., Otter, G., Claas, J., Eskes, H., de Haan, J., Kleipool, Q., van Weele, M., Hasekamp, O., Hoogeveen, R., Landgraf, J., Snel, R., Tol, P., Ingmann, P., Voors, R., Kruizinga, B., Vink, R., Visser, H., and Levelt, P.: TROPOMI on the ESA Sentinel-5 Precursor: A GMES mission for global observations of the atmospheric composition for climate, air quality and ozone layer applications, Remote Sens. Environ., 120, 70–83, https://doi.org/10.1016/j.rse.2011.09.027, 2012. a
Willis, M. J., Zheng, W., Durkin, W. J., Pritchard, M. E., Ramage, J. M., Dowdeswell, J. A., Benham, T. J., Bassford, R. P., Stearns, L. A., Glazovsky, A. F., Macheret, Y. Y., and Porter, C. C.: Massive destabilization of an Arctic ice cap, Earth Planet. Sc. Lett., 502, 146–155, https://doi.org/10.1016/j.epsl.2018.08.049, 2018. a
- Abstract
- Introduction
- Datasets
- Methods
- Results
- Conclusions
- Appendix A: Difference between gridded ICESat-2 data and new Greenland DEM
- Appendix B: 7 d methane anomaly of the scientific SRON XCH4 product
- Code and data availability
- Author contributions
- Competing interests
- Disclaimer
- Acknowledgements
- Financial support
- Review statement
- References
Please read the editorial note first before accessing the article.
- Article
(17434 KB) - Full-text XML
- Abstract
- Introduction
- Datasets
- Methods
- Results
- Conclusions
- Appendix A: Difference between gridded ICESat-2 data and new Greenland DEM
- Appendix B: 7 d methane anomaly of the scientific SRON XCH4 product
- Code and data availability
- Author contributions
- Competing interests
- Disclaimer
- Acknowledgements
- Financial support
- Review statement
- References