the Creative Commons Attribution 4.0 License.
the Creative Commons Attribution 4.0 License.
 | 27 Jan 2022
Retrieval of aerosol properties using relative radiance measurements from an all-sky camera
Juan C. Antuña-Sánchez
Victoria E. Cachorro
Carlos Toledano
Benjamín Torres
David Mateos
David Fuertes
César López
Ramiro González
Tatyana Lapionok
Marcos Herreras-Giralda
Oleg Dubovik
Ángel M. de Frutos
This paper explores the potential of all-sky cameras to retrieve aerosol properties with the GRASP code (Generalized Retrieval of Atmosphere and Surface Properties). To this end, normalized sky radiances (NSRs) extracted from an all-sky camera at three effective wavelengths (467, 536 and 605 nm) are used in this study. NSR observations are a set of relative (uncalibrated) sky radiances in arbitrary units. NSR observations have been simulated for different aerosol loads and types with the forward radiative transfer module of GRASP, indicating that NSR observations contain information about the aerosol type, as well as about the aerosol optical depth (AOD), at least for low and moderate aerosol loads. An additional sensitivity study with synthetic data has been carried out to quantify the theoretical accuracy and precision of the aerosol properties (AOD, size distribution parameters, etc.) retrieved by GRASP using NSR observations as input. As a result, the theoretical accuracy of AOD is within ±0.02 for AOD values lower than or equal to 0.4, while the theoretical precision goes from 0.01 to 0.05 when AOD at 467 nm varies from 0.1 to 0.5. NSR measurements recorded at Valladolid (Spain) with an all-sky camera for more than 2 years have been inverted with GRASP. The retrieved aerosol properties are compared with independent values provided by co-located AERONET (AErosol RObotic NETwork) measurements. AODs from both data sets correlate with determination coefficient (r2) values of about 0.87. Finally, the novel multi-pixel approach of GRASP is applied to daily camera radiances together by constraining the temporal variation in certain aerosol properties. This temporal linkage (multi-pixel approach) provides promising results, reducing the highly temporal variation in some aerosol properties retrieved with the standard (one by one or single-pixel) approach. This work implies an advance in the use of all-sky cameras for the retrieval of aerosol properties.
- Article
(11578 KB) - Full-text XML
- Companion paper
-
Supplement
(25138 KB) - BibTeX
- EndNote


Atmospheric aerosol particles (hereinafter, “aerosols”), which are the solid and liquid particles floating in the atmosphere (Willeke et al., 1993), impact on the Earth's radiative balance mainly through aerosol–radiation and aerosol–cloud interactions (Boucher et al., 2013). These interactions are related to the direct absorption and scattering of incoming solar radiation, as well as the modification of cloud properties, like cloud lifetime and albedo, since aerosols act as water droplet or ice crystal nuclei. These interactions depend significantly on the aerosol load and properties like the aerosol size distribution, chemical composition or refractive index. These properties vary with the aerosol type. The high spatial and temporal variability in aerosols on a global scale means that the effects of aerosols on the energy budget are still largely uncertain (Boucher et al., 2013; IPCC, 2014). Thus, aerosol property monitoring on a global scale is a crucial task.
Aerosol measurements from satellite instruments like MODIS (MODerate resolution Imaging Spectroradiometer; Remer et al., 2005; Levy et al., 2013) are frequently used for global monitoring of aerosol properties like the aerosol optical depth (AOD). Unfortunately, the temporal resolution of these satellite measurements is not high, and, in addition, these measurements need to be subjected to calibration and/or validation procedures using ground-based measurements. Some global networks focused on aerosol measurements, like AERONET (AErosol RObotic NETwork1; Holben et al., 1998), are used to this end. AERONET is a federation of ground-based remote sensing aerosol networks with measurement stations distributed worldwide, all using the same standard instrument model. This standard instrument is a sun–sky (recently also moon) photometer which is capable of measuring direct sun irradiance and sky radiances at several wavelengths. Sun measurements are used to derive spectral AOD (Giles et al., 2019), while sky radiances, which contain important aerosol information (Nakajima et al., 1996), are used together with AOD in an inversion algorithm to retrieve other aerosol properties like volume size distribution or refractive index (Dubovik and King, 2000; Dubovik et al., 2000, 2006; Sinyuk et al., 2020).
A new inversion algorithm that allows for a similar retrieval of aerosol properties is the GRASP code (Generalized Retrieval of Atmosphere and Surface Properties2; Dubovik et al., 2014). This algorithm is capable of retrieving aerosol properties by inverting sun–sky photometer measurements, but its versatility also allows for inversion of other kinds of measurements like lidar/ceilometer signal plus AOD and sky radiances (Lopatin et al., 2013; Benavent-Oltra et al., 2017; Román et al., 2018; Titos et al., 2019; Herreras et al., 2019; Molero et al., 2020; Tsekeri et al., 2017), satellite measurements (Chen et al., 2020; Wei et al., 2021), nephelometer data (Espinosa et al., 2017), and even only AOD measurements (Torres et al., 2017).
As mentioned, sky radiance measurements are useful to retrieve aerosol properties, these measurements being usually taken with high accuracy and precision by sky photometers. However, sky radiance measurements from photometers over different sky positions (almucantar geometry, for example) are not collected simultaneously since the instrument needs to scan the various sky positions in a sequence that results in time lag among the measurements. An instrument which is sensitive to sky radiance at every point of sky in a short time interval is the all-sky camera. All-sky cameras are mainly used to detect clouds (see Tapakis and Charalambides, 2013, and references therein), but some works have demonstrated that they are capable of other purposes like obtaining sky radiance and luminance measurements (Rossini and Krenzinger, 2007; Román et al., 2012; Tohsing et al., 2014), characterizing aerosol properties (Cazorla et al., 2008), or performing advanced aerosol characterization by combining in GRASP the sky radiance from an all-sky camera and other instrument data like lunar photometer and lidar (Román et al., 2017; Benavent-Oltra et al., 2019). In this sense, Antuña-Sánchez et al. (2021) recently published a new method to extract normalized sky radiances (NSRs), which are relative (normalized) sky radiances in arbitrary units. The norm in this case is calculated as the sum of all observed multi-angular radiances for each wavelength. NSRs are calculated at three effective wavelengths from an all-sky camera equipped with narrower than usual spectral filters. These NSR measurements potentially contain enough information to retrieve some aerosol properties with an inversion algorithm such as GRASP.
In this framework, the main objective of this work is to propose a new methodology to retrieve aerosol properties using normalized sky radiance measurements from an all-sky camera as input for GRASP code. Another goal is to quantify the accuracy and precision of these retrieved properties, as well as to compare them with independent retrievals of AERONET. The ultimate goal is to achieve an affordable alternative to obtain aerosol information in places where sky radiance measurements from a photometer are not available. The use of accessible and widely spread instruments like an all-sky camera can contribute to fill this lack of aerosol data.
This paper is structured as follows: Sect. 2 introduces the main instrumentation used in this work and the characteristics of the place where is located, as well as the description of the inversion methodology used in this study; the sensitivity of NSR measurements to aerosol variations and the theoretical accuracy and precision of the retrieved aerosol properties with NSR measurements are discussed in Sect. 3. Section 4 presents a comparison of the aerosol properties retrieved using real NSR measurements as input against the aerosol properties obtained independently by AERONET. Finally, the main conclusions are summarized in Sect. 5.
2.1 Site and instrumentation
2.1.1 Valladolid station
The data used in this study were collected at a platform installed on the rooftop of the science faculty of the University of Valladolid (41.6636∘ N, 4.7058∘ W; 705 m above sea level), located at Valladolid (Spain). Valladolid is a medium-sized city with a population of around 400 000 inhabitants including the metropolitan area. The climate at this place is Mediterranean, with cold winters and hot summers (Csb Köppen–Geiger climate classification). The predominant aerosol type is “clean continental”, but the presence of Saharan desert dust particles is also frequent, especially in summer when the highest AOD monthly mean values are reached (Bennouna et al., 2013; Román et al., 2014; Cachorro et al., 2016).
2.1.2 CE318 photometers and AERONET products
The “Grupo de Óptica Atmosférica” (Group of Atmospheric Optics) of the University of Valladolid (GOA-UVa) manages the mentioned instrumentation platform. This group has been in charge of the calibration of part of the European AERONET photometers since 2006. The facility is now also part of the European infrastructure ACTRIS (Aerosol, Clouds and Trace Gases Research Infrastructure3), with active contributions to sun and moon photometry at the European level (Barreto et al., 2019; González et al., 2020). A couple of calibrated AERONET reference photometers are always installed and routinely operating at Valladolid for side-by-side calibration of field instruments. All these photometers are CE318 photometers (Cimel Electronique SAS), the standard instrument of AERONET, the most recent model being the CE318-T sun–sky–moon photometer (Barreto et al., 2016), also available at Valladolid station since 2016. CE318 photometers measure direct sun irradiance (CE318-T allows also direct moon irradiance) at several narrow spectral bands selected with interference filters mounted in a rotating wheel. These measurements are used by AERONET to calculate AOD at different wavelengths (Giles et al., 2019) with an uncertainty of ±0.01 for wavelengths longer than 440 nm (Holben et al., 1998). Moreover, sky radiance scans are also measured by these photometers at various wavelengths and for two scan: almucantar (azimuth varying while zenith angle is set equal to solar zenith angle) and principal plane (zenith angle varying while azimuth is set equal to solar azimuth angle). CE318-T allows the sky radiance to be measured in an additional geometry: hybrid scan (Sinyuk et al., 2020), in which sky positions are set to fix scattering angles. AERONET uses the AOD and sky radiances (at almucantar or at hybrid scans), at 440, 675, 870 and 1020 nm, to retrieve advanced aerosol properties like aerosol volume size distribution at 22 log-spaced radius bins and the complex refractive index at various wavelengths (Dubovik and King, 2000; Dubovik et al., 2006).
In this work, we use AERONET version 3 level 1.5 cloud-screened products (almucantar and hybrid) directly downloaded from the AERONET web page. These products are AOD at 440, 500 and 675 nm (Giles et al., 2019); the three log-normal parameters of the volume size distribution (volume median radius, R; standard deviation, σ; and aerosol volume concentration, VC) for both coarse and fine modes; the real part of the refractive index at 440 and 675 nm; and the fraction of spherical particles (sphericity factor) (Sinyuk et al., 2020). The AERONET-retrieved products with a sky error above 10 % are rejected.
2.1.3 All-sky camera and relative radiances
The main instrument of this work is a SONA202-NF (Sieltec Canarias S.L.) all-sky camera installed at the Valladolid GOA-UVa platform since July 2018. This camera consists of a CMOS sensor with a fisheye lens (field of view of 185∘) inside a weatherproof case and a dome on the top. The sensor has an RGB Bayer filter plus another tri-band filter reducing the bandwidth of the three RGB channels; these responses are shown in Fig. 1 of Antuña-Sánchez et al. (2021). The effective wavelengths of these channels are 467, 536 and 605 nm (see Sect. 3.1 of Antuña-Sánchez et al., 2021 for the explanation of how these wavelengths were calculated). This camera performs every 5 min a fast sequence of sky images captured at different nominal exposure times: 0.3, 0.4, 0.6, 1.2, 2.4, 4.8 and 9.6 ms. This multi-exposure sequence allows a linear high dynamic range (HDR) image to be calculated and, hence, the relative sky radiance (and its propagated uncertainty) to be calculated at the three effective wavelengths for any sky direction. The process to derive the relative sky radiances and their propagated uncertainty (mainly associated with the method and the readout and shot noises) from the multi-exposure camera images is explained in detail by Antuña-Sánchez et al. (2021). This paper refers to relative radiances as uncalibrated radiances in arbitrary units but linearly proportional to the real sky radiances in absolute physical units (e.g. ).
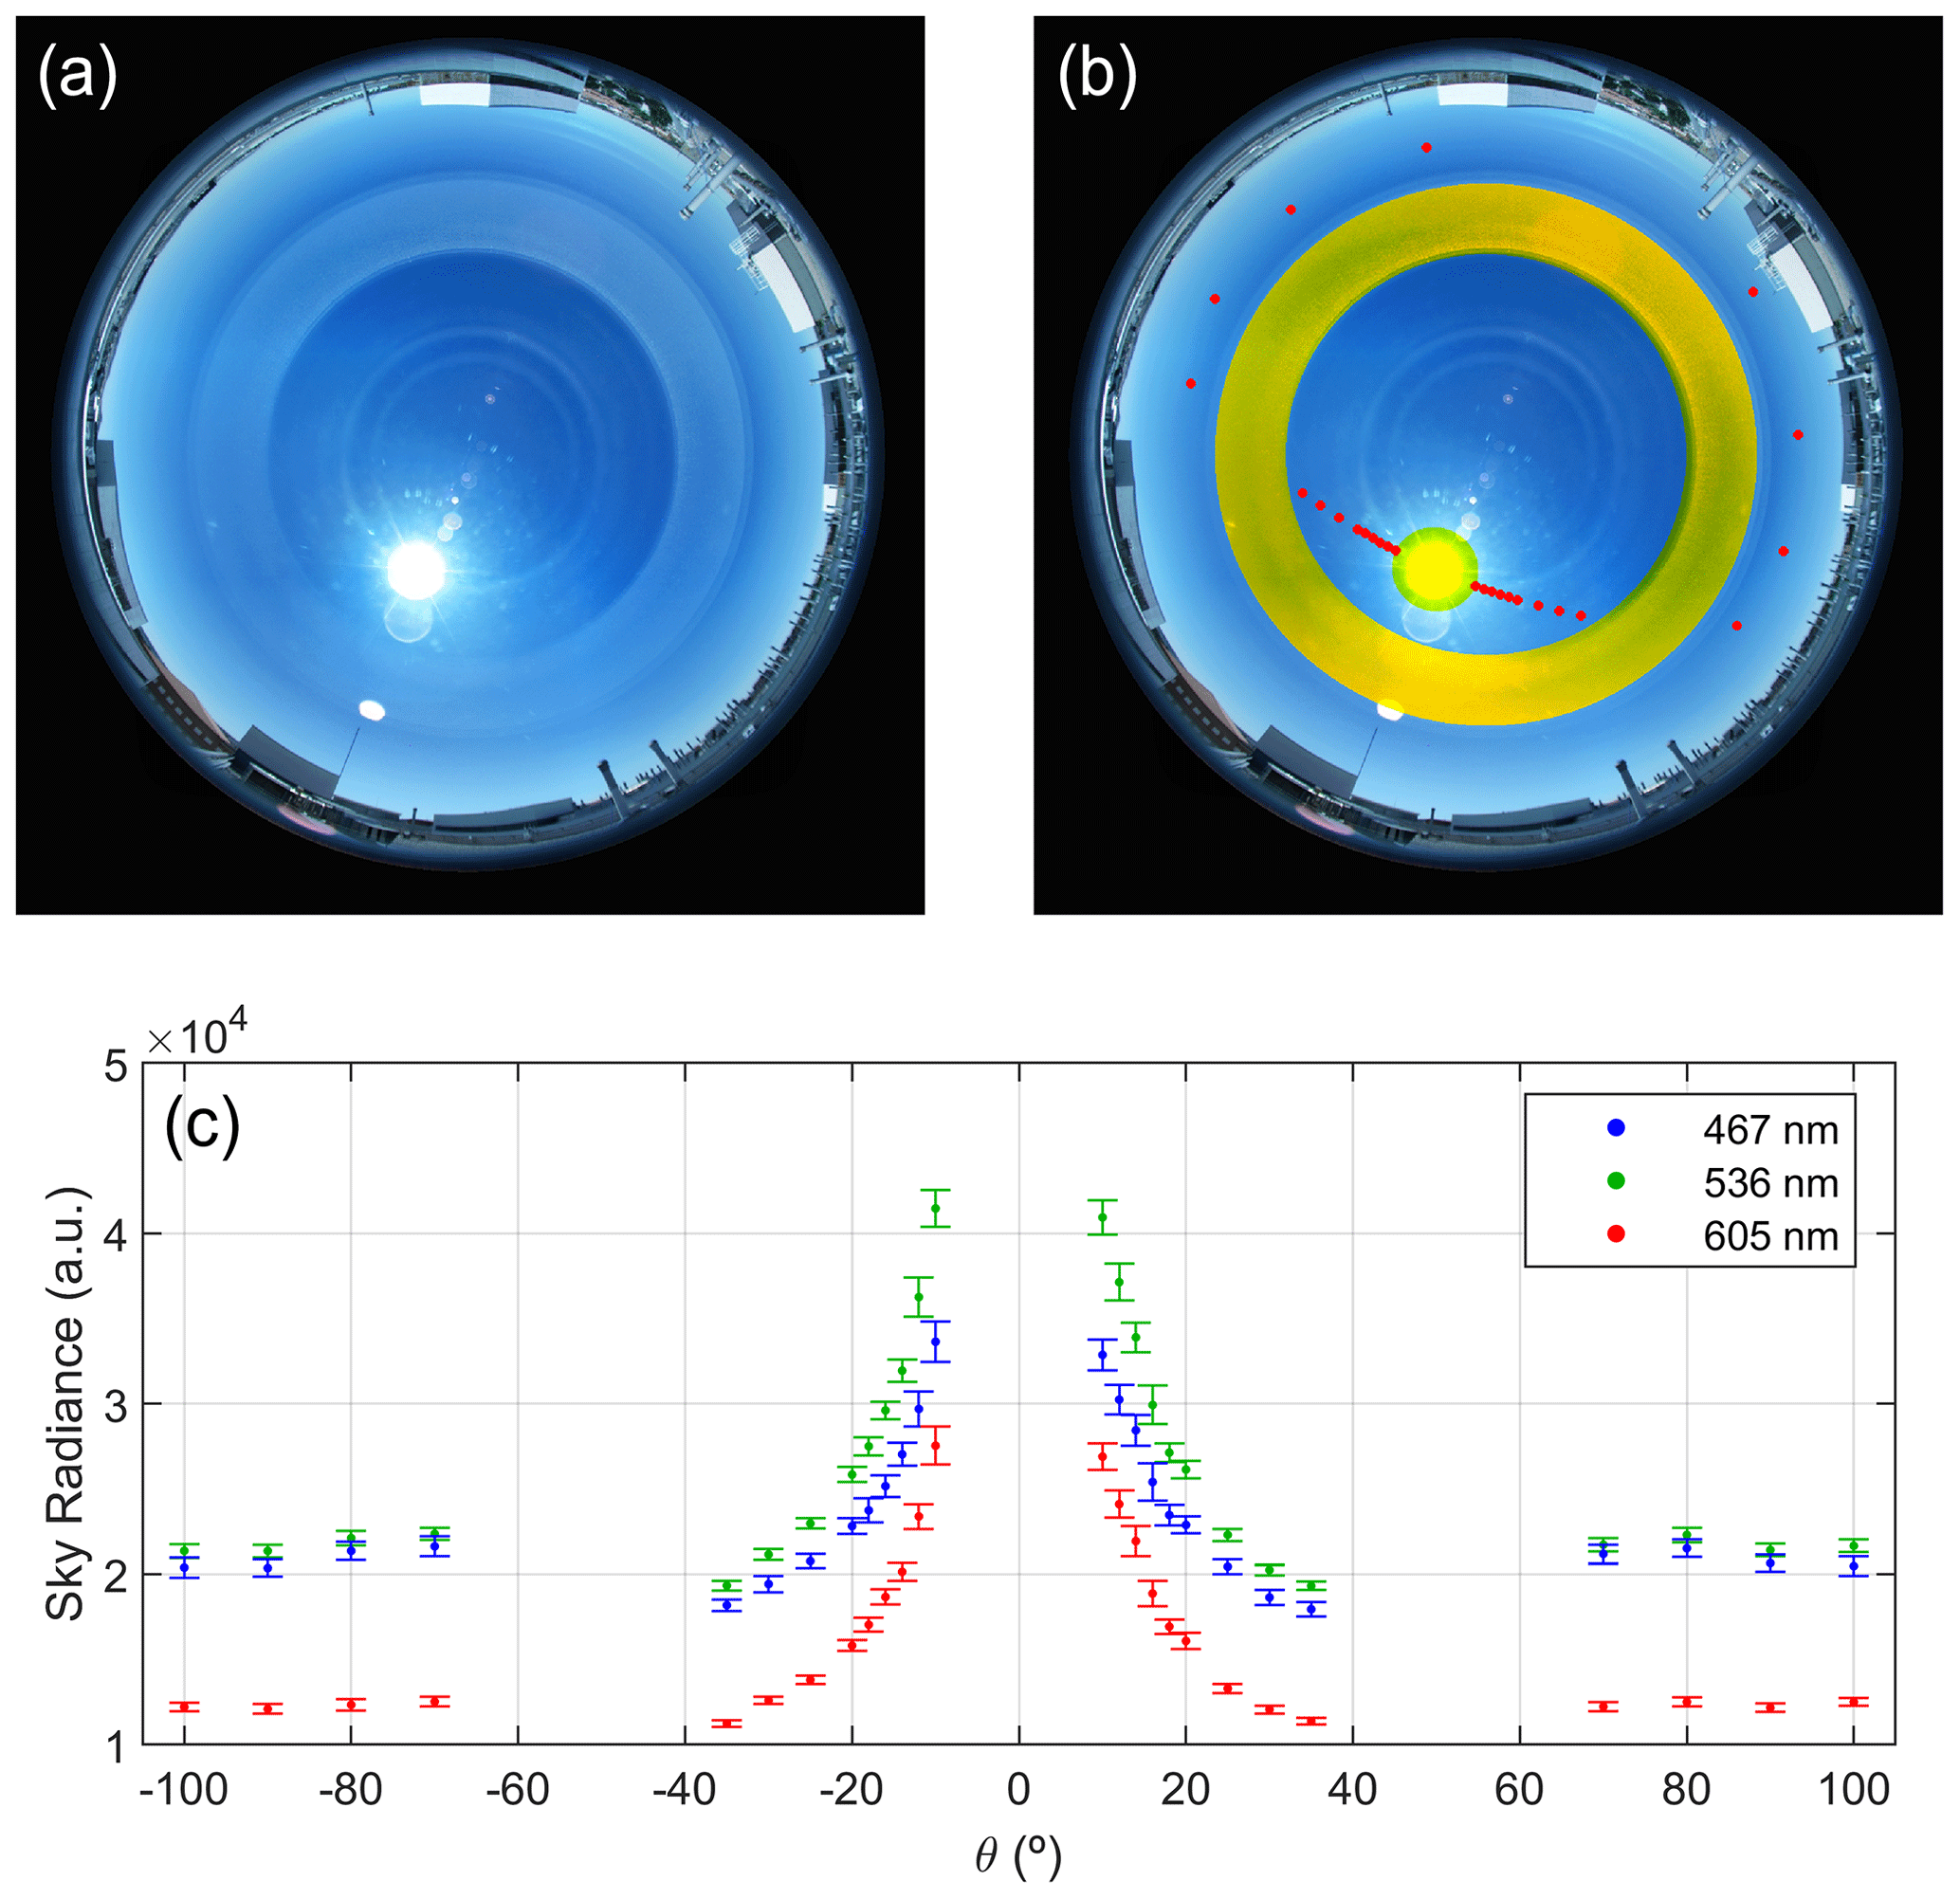
Figure 1Tone map of the high dynamic range (HDR) sky image on 17 August 2019, 11:35 UTC, at Valladolid (a, b). Panel (b) also shows in yellow the sky areas banned to extract sky radiance and in red the points of the hybrid scan in this case. Panel (c) presents the relative sky radiance, in arbitrary units, extracted from the camera channels at three wavelengths as a function of the scattering angle (Θ), corresponding to the sky points of the hybrid scan shown in panel (b).
As an example for one camera sequence, Fig. 1 shows in the top-left panel a tone map of an HDR image captured on 17 August 2019, 11:35 UTC, at Valladolid. The solar zenith angle (SZA) was equal to 30∘. The sky conditions were cloudless, however, due to some reflections on the lens and the dome; the sky relative radiance cannot be extracted in the scattering angles below 10∘ (solar aureole) or zenith angles between 48 and 65∘ (Antuña-Sánchez et al., 2021); these banned areas are marked in yellow in Fig. 1b. The chosen geometry to extract relative radiances is the AERONET hybrid geometry (see Sect. 4 of Sinyuk et al., 2020), rejecting the angles over the banned areas since this geometry allows for long scattering angles even for low SZA values and presents a symmetry with respect to the sun position which is useful for cloud screening. The red points in Fig. 1b represent the chosen sky points of the hybrid geometry in this case; the lowest scattering angle is 10∘, and there are no points in the yellow banned areas. Following the method of Antuña-Sánchez et al. (2021), the relative sky radiance is calculated at the chosen hybrid points as observed in Fig. 1c. Once the relative radiances are extracted, both left and right symmetrical sky points are averaged for each wavelength. The points with right–left differences above 5 % are rejected (cloud contaminated); moreover, the points with a propagated uncertainty (derived from method uncertainties and camera readout and shot noises; see Antuña-Sánchez et al., 2021) above 5 % are also rejected. Both rejections are to assure cloud-free conditions and high-quality data. Afterwards, the remaining relative radiances for each wavelength are normalized, dividing each value by the total sum of all of observations, obtaining a normalized sky radiance (NSR). To clarify, NSR values are calculated by Eq. (1):
where SRi(λ) is the i measurement of the total of N (this value depends on wavelength) camera sky radiances (in arbitrary units) at the effective λ wavelength. All this process is described in detail by Antuña-Sánchez et al. (2021), who characterized the uncertainty of this normalized radiances, once the explained quality and cloud-screening criteria are applied, as () %, () % and () % for 467, 536 and 605 nm, respectively.
This process has been applied to all multi-exposure sequences taken by the sky camera from July 2018 to September 2020 at Valladolid. NSR measurements in the AERONET hybrid geometry at 467, 536 and 605 nm every 5 min throughout this period are available for analysis.
2.2 Inversion strategy
The normalized sky radiances obtained at the three effective wavelengths from the sky camera have been used as input in the GRASP inversion code to retrieve aerosol properties. Additional information about the surface reflectance is introduced in GRASP through bidirectional reflectance distribution function (BRDF) data. These BRDF values are obtained from a 8 d climatology table created for Valladolid station using satellite data (MCD43C1 product from MODIS V005 collection; Schaaf et al., 2011) from the 2000–2014 period; more details about these climatology values are provided in Román et al. (2018).
The inversion of camera radiances with GRASP has been carried out considering some assumptions: (1) the aerosol size distribution is bimodal, with one fine and one coarse mode, and each mode equal to a log-normal distribution; (2) there is no dependence of the real and imaginary parts of refractive index on the wavelength since we assume the differences between the three camera wavelengths are short to produce high variation in the complex refractive index; and (3) the imaginary part of refractive index (IRI) cannot be retrieved (NSR measurements are not sensitive to aerosol light absorption), and it is assumed equal to 0.005 for all retrievals. The IRI value of 0.005 is chosen in this work because it is the most frequent for the aerosol at Valladolid (from AERONET-derived climatology); however, if the inversions are carried out at other location, the use of the most representative IRI value of that location is recommended. The vertical aerosol distribution is a required input in GRASP, and it is assumed in this work as a Gaussian layer centred at 2 km above ground level with a standard deviation of 250 m. The impact of gaseous absorption on normalized sky radiance is assumed negligible at the camera effective wavelengths.
Eight aerosol parameters are retrieved with this strategy: one for the real part of refractive index (RRI), one for the fraction of spherical particles (SPH) and six quantities (variables) linked to size distribution: modal radius (RF and RC), width (σF and σC), and concentration (VCF and VCC; the last letter of each corresponds to the fine, F, or coarse, C, mode). Other aerosol properties like AOD are derived from the retrieved aerosol products. This configuration of GRASP and the products derived by it are labelled in this paper as “GRASP-CAM” in order to make reference to the use of camera measurements in GRASP.
The GRASP-CAM retrieval is run for each camera measurement (5 min sampling interval) only if at least six cloud-free NSR measurement points are available for each wavelength in order to ensure enough information about the aerosol properties in the measurements (at least double the number of input measurements, 18, than the number of retrieved parameters, 8). In addition, every GRASP retrieval provides, for each wavelength, the residual differences between the NSR measured (input) and generated by the retrieval (modelled). This residual is calculated for each wavelength in a relative way (%) as the root mean square of all relative differences (%) between measured NSR values and modelled (forward module) ones, as Eq. (2) shows.
The superscripts “fwd” and “meas” refer to modelled (calculated by the forward module) and measured NSR, respectively; N is the total number of NSR measurements used in the retrieval for each wavelength. This residual information is useful to reject non-convergent retrievals; in this configuration we classify a retrieval as non-convergent if the residual in NSR is higher than the uncertainty of the measured NSR for any of the three wavelengths. It means that a retrieval is only considered as convergent if the residual is below 3.7 % for 467 nnm but also below 4.8 % for 536 nm and below 5.7 % for 605 nm .
The GRASP-CAM inversion is run in single-pixel approach. It means that each retrieval is stand-alone; the inversion of one set of NSR measurements from a specific camera sequence in a given time is independent of the measurements in other times. However, considering that the temporal variation in aerosol properties should not be abrupt, all the NSR measurements in a day can be inverted together, with additional constraints about the smoothness of the temporal variation in the different aerosol properties. This concept is called multi-pixel approach, and GRASP allows this kind of temporal (and spatial) constraints (Dubovik et al., 2011, 2014; Lopatin et al., 2021). Hence, in order to explore the performance of the temporal multi-pixel approach, the NSR camera measurements that satisfy at least six measurements per wavelength during a full day have been inverted together constraining the smoothness of the time variation in the size distribution parameters, in the real part of refractive index and in the fraction of spherical particles. This configuration has been called “GRASPmp-CAM”, denoting the GRASP-CAM configuration in the multi-pixel (mp) approach.
A detailed sensitivity analysis is developed in this section using synthetic data in order to study the capability to retrieve aerosol properties using normalized sky radiance measurements like the ones obtained from the SONA202-NF all-sky camera. We also intend to quantify the uncertainty of the retrieved properties. To this end, and following the methodology of Torres et al. (2017), seven different aerosol models (types), obtained from the climatology reported by Dubovik et al. (2002), are chosen. These models correspond to the next sites: Goddard Space Flight Center (GSFC; Maryland, USA), Mexico city (MEXI; Mexico), African Savanna (ZAMB; Zambia), Solar Village (SOLV; Saudi Arabia), Bahrain (BAHR; Persian Gulf), Lanai (LANA; Hawaii, USA), INDOEX (MALD; Maldives). GSFC and MEXI are classified as urban/industrial aerosol, BAHR and SOLV as desert dust, ZAMB as Biomass burning, LANA as oceanic aerosol, and MALD as mixed aerosol. These seven models cover a range of aerosol types with different absorption and size distribution properties (GSFC, MEXI and ZAMB with predominance of fine mode, while BAHR, SOLV and LANA with predominance of coarse mode). For each aerosol model, nine aerosol loads with different AOD values (AOD at 467 nm ranging from 0.1 to 0.9 in 0.1 steps) have been defined; this produces a total of 63 scenarios (seven aerosol models × nine aerosol loads). GRASP requires geographical coordinates as input, especially the site elevation and latitude for Rayleigh scattering default calculation (Bodhaine et al., 1999); in this work, for the GRASP simulations, the 63 mentioned scenarios are assumed that take place over Valladolid site coordinates. These coordinates are chosen to be the same coordinates as the ones used in the inversion of real measurements recorded at Valladolid and shown in Sect. 4.
3.1 Radiance simulations
Once the aerosol scenarios are defined, the radiative transfer forward module of GRASP is run for each one to simulate the normalize radiance observations that the camera would register (hybrid scan removing banned area affected by dome reflection). These simulations have been performed for three different sun positions (SZA equal to 30, 50 and 70∘), but this study is focused on the SZA = 70∘ case (the results for the other SZA angles are provided in the Supplement) since any sky point of the hybrid scan with a scattering angle higher than or equal to 10∘ falls out of the banned area for this sun position.
Figure 2 presents the simulated NSR values as a function of the scattering angle for different AOD467 values (AOD at 467 nm) at the three camera wavelengths and for the GSFC, ZAMB and SOLV aerosol models (Fig. S1 in the Supplement shows the rest of the models). The changes in NSR values with AOD are appreciable when the AOD467 values are below 0.4–0.5 for all models and wavelengths; however, the NSR values tend to show no significant dependence on AOD as it increases above 0.5. This result is similar for all the models and for other SZA values (see Figs. S1, S2 and S3) and even including lower scattering angles (Fig. S4). The explanation behind this result is that sky radiance is mainly controlled by Rayleigh scattering when the aerosol load is low, but the aerosol scattering starts to dominate the sky radiance as the AOD increases. Therefore, the sky radiance behaviour is a mixture between Rayleigh and aerosol scatterings depending on AOD, at least from very low AOD values until AOD values about 0.5, at which point the sky radiance is dominated by aerosol scattering and the NSR does not present further significant changes. As an example of this, the NSR differences between the cases of AOD467 of 0.1 and 0.2 are higher for 467 nm than 605 nm since Rayleigh scattering at 605 nm is lower for longer wavelengths, and hence, NSR at 605 nm is more dominated by aerosol scattering than at 467 nm. To confirm the proposed explanation, the same simulations as in Fig. 2 (and Fig. S1) have been calculated but considering an atmosphere without Rayleigh scattering in GRASP. These NSR simulations are shown in Fig. S5 and point out that NSR does not significantly depend on AOD when Rayleigh scattering is negligible, even for low AOD values, showing always similar values to the ones observed in Fig. 2 (and Fig. S1) for high AOD values; this result supports our hypothesis. Finally, multiple scattering and surface albedo also affect NSR, but their impact on NSR is small, at least for the analysed aerosol loads.
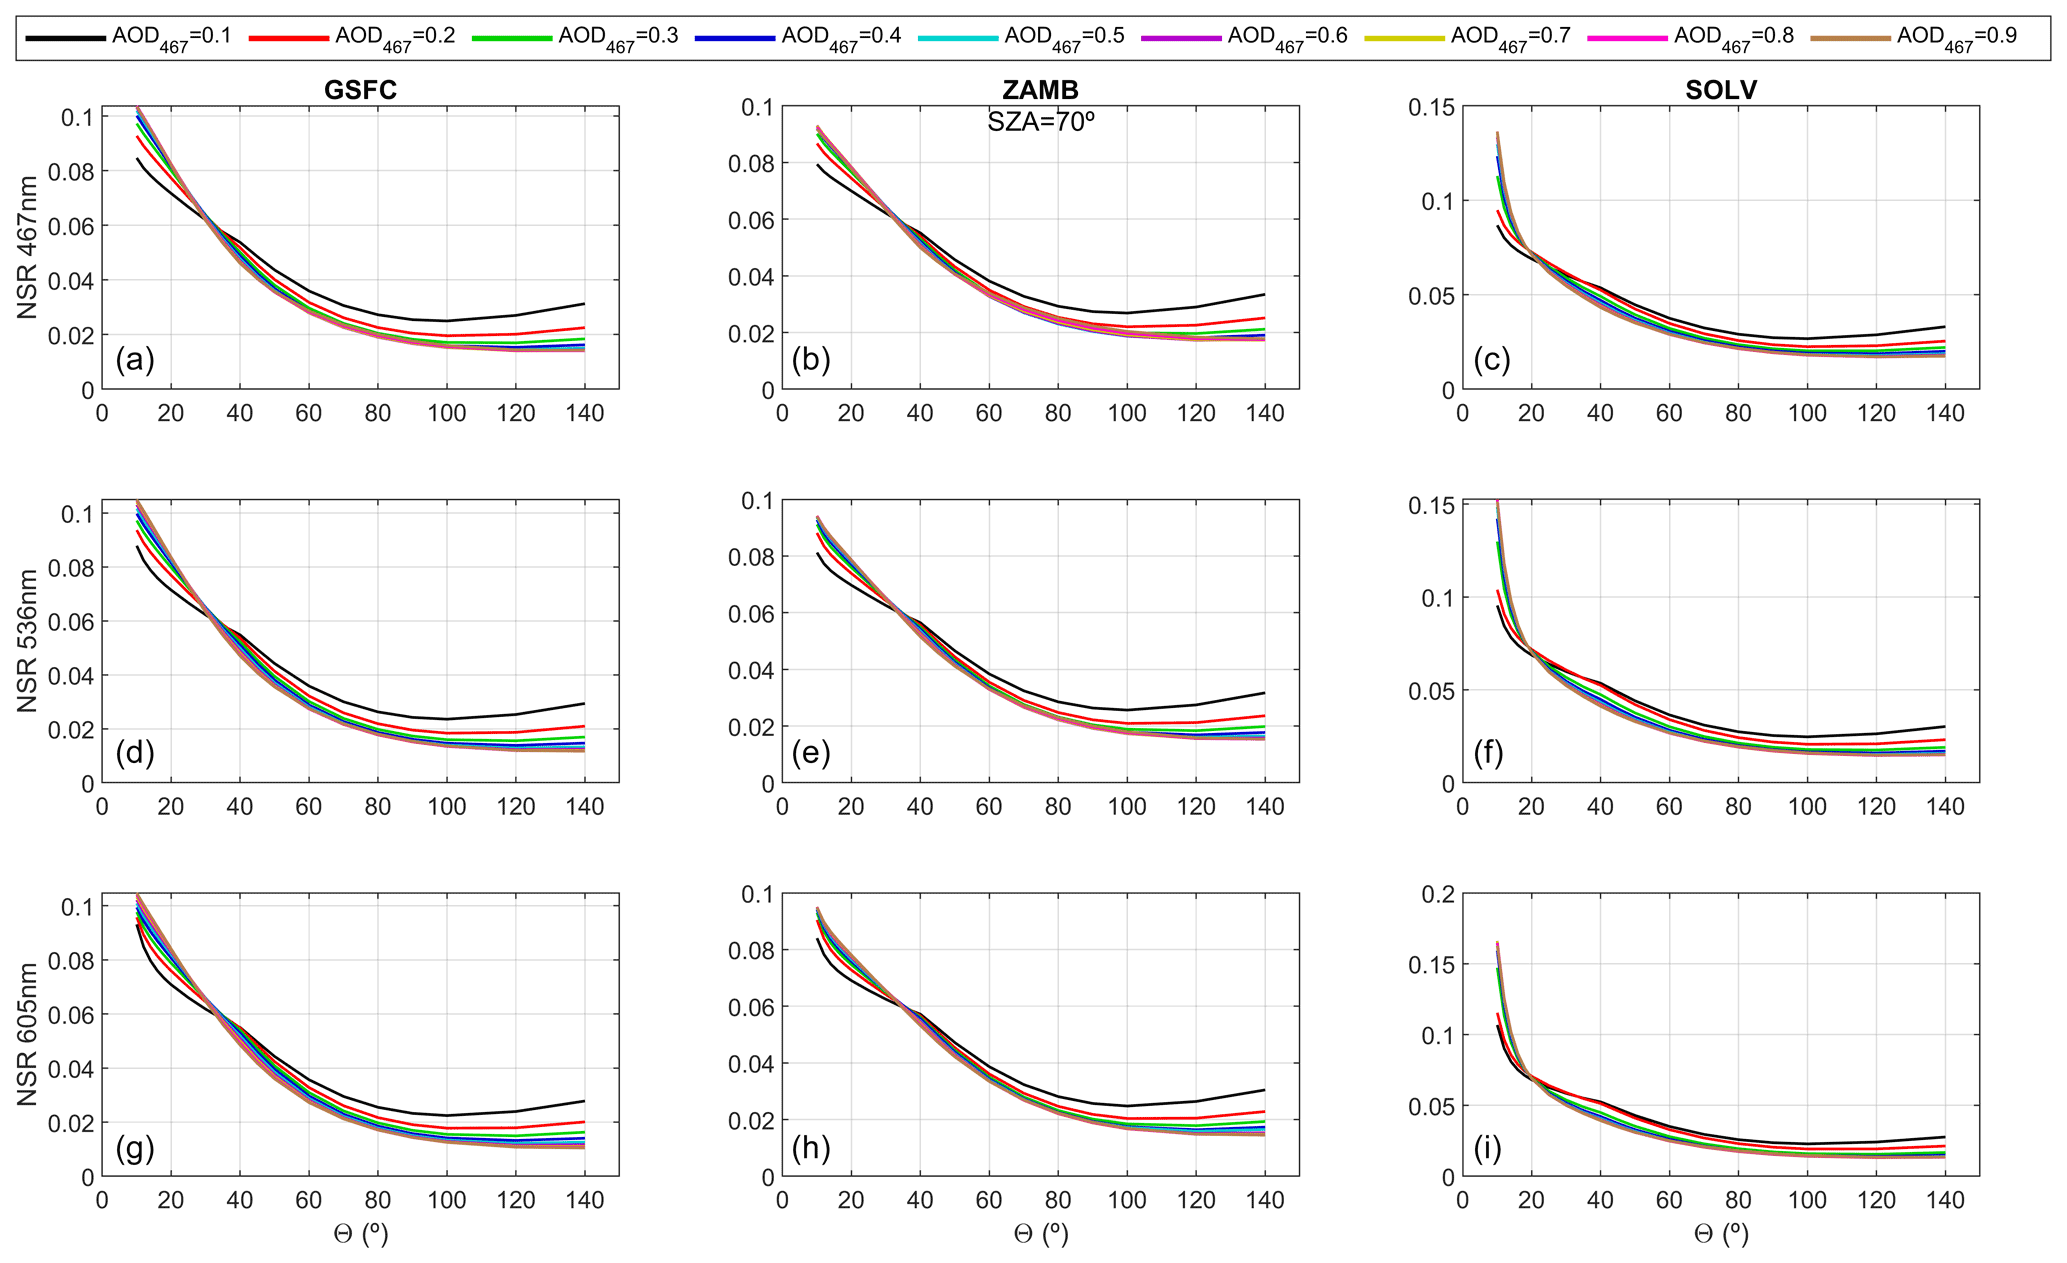
Figure 2Normalized sky radiance (NSR) for solar zenith angle (SZA) of 70∘ at 467 nm (a, b, c), 536 nm (d, e, f) and 605 nm (g, h, i) as a function of scattering angle (Θ) for different AOD (at 467 nm) values. Columns correspond to (a, d, g) GSFC, (b, e, h) ZAMB and (c, f, i) SOLV aerosol models.
NSR measurements are sensitive to AOD, but this sensitivity decreases as the AOD increases; hence, NSR measurements could be useful to derive AOD values but until a threshold value (when Rayleigh scattering is much lower than aerosol scattering). The sky radiances are more sensitive to AOD variations when absolute values are measured instead of normalized ones (see Fig. S6).
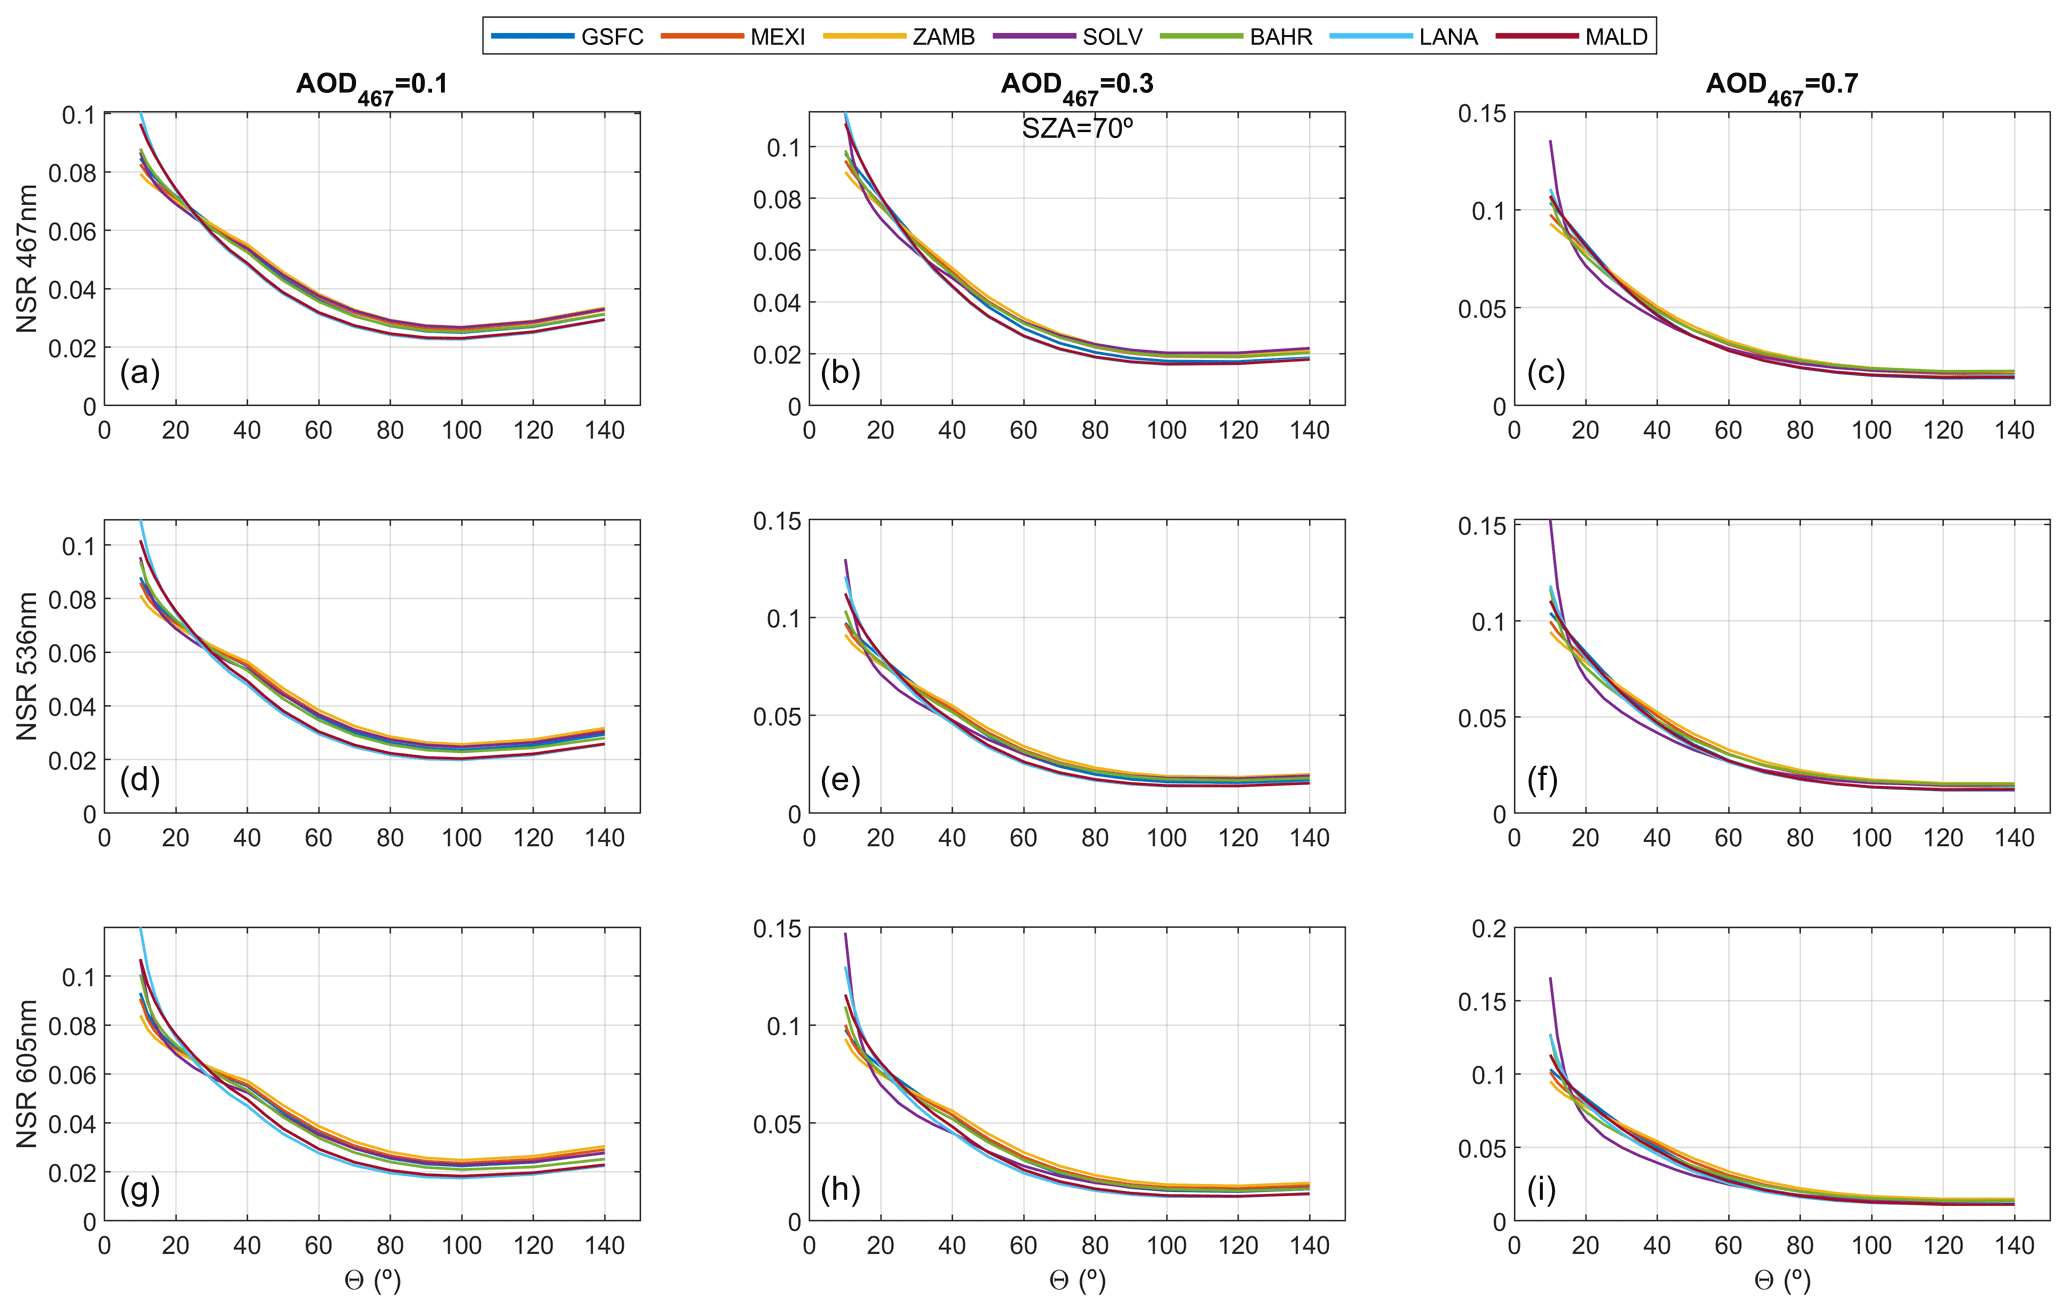
Figure 3Normalized sky radiance (NSR) with a solar zenith angle (SZA) of 70∘ at 467 nm (a, b, c), 536 nm (d, e, f) and 605 nm (g, h, i) as a function of scattering angle (Θ) for different aerosol models. Columns correspond to AOD at 467 nm (AOD467) values of (a, d, g) 0.1, (b, e, h) 0.3 and (c, f, i) 0.7.
To observe the sensitivity of NSR observations to the aerosol type, Fig. 3 shows the simulated NSR observations as a function of scattering angle for the different aerosol models in each panel and for three different aerosol loads (the rest of the aerosol loads are shown in Fig. S7). In this case, the NSR values differ from one aerosol type to another, especially at low scattering angles, and this difference is appreciable for the different AOD values. An analogous result is found for other SZA values (Figs. S8 and S9) and if lower scattering angles are included (Fig. S10). These results point out that NSR observations contain information about the aerosol type, independently of AOD and not only for low and moderate AOD values, as is found in the case of the NSR sensitivity to AOD. In the case of absolute sky radiances, the dependence on aerosol type is even more evident for all AOD loads (see Fig. S11).
3.2 Aerosol properties
The results of Sect. 3.1 reveal that normalized sky radiances contain information about the aerosol properties; this new section aims to know what aerosol information can be extracted from this kind of measurements and what is the uncertainty of this information. To this end, the synthetic NSR values simulated for the different aerosol scenarios (see Sect. 3.1) have been inverted following the GRASP-CAM method. These retrievals are not purely realistic since the normalized sky radiances used are ideal (not perturbed). To obtain more realistic results, random noise (Gaussian distributed) has been added to each simulated sky radiance in accordance with the NSR uncertainty of the camera product (see Sect. 2.1.3). Up to 1000 different sets of normalized radiances with random noise have been created from the original radiances and then inverted for each aerosol scenario. The median (Md) and standard deviation (SD) of each retrieved aerosol property have been calculated, rejecting the retrievals with no convergence.
3.2.1 Aerosol optical depth
Figure 4 presents the AOD of the original (black line) chosen aerosol scenario (the one used to simulate the NSR observations), the AOD retrieved from the simulated NSR observations without noise (blue line) and the median of the retrievals with noise (red line), with its ± standard deviation (red shadowed area). These AOD values are plotted for the seven aerosol models and for AOD467 values of 0.1, 0.2, 0.3 and 0.4 (same plots for higher AOD values are shown in Fig. S12). The retrieved AOD values, both with and without noise, fit well with the original values at the three camera wavelengths for all aerosol scenarios and AOD (467 nm) values below 0.5–0.6 (see Fig. S12). However, the AOD accuracy of the retrievals is worse for the higher aerosol loads, with low precision in the noise-perturbed retrievals. This worse fit for high AOD values must be caused by the observed low sensitivity of NSR to AOD for high AOD values (see Sect. 3.1). The accuracy of AOD is not significantly higher if scattering angles from 3∘ instead of from 10∘ are added to the retrievals (see Figs. S13 and S14). The results are similar for a SZA of 30∘ (see Fig. S15), but the uncertainty of the retrieved AOD is much higher for a SZA equal to 50∘ (see Fig. S16), which is likely due to the lack of low scattering angles in this scenario (the sun image appears inside the banned area of the camera).
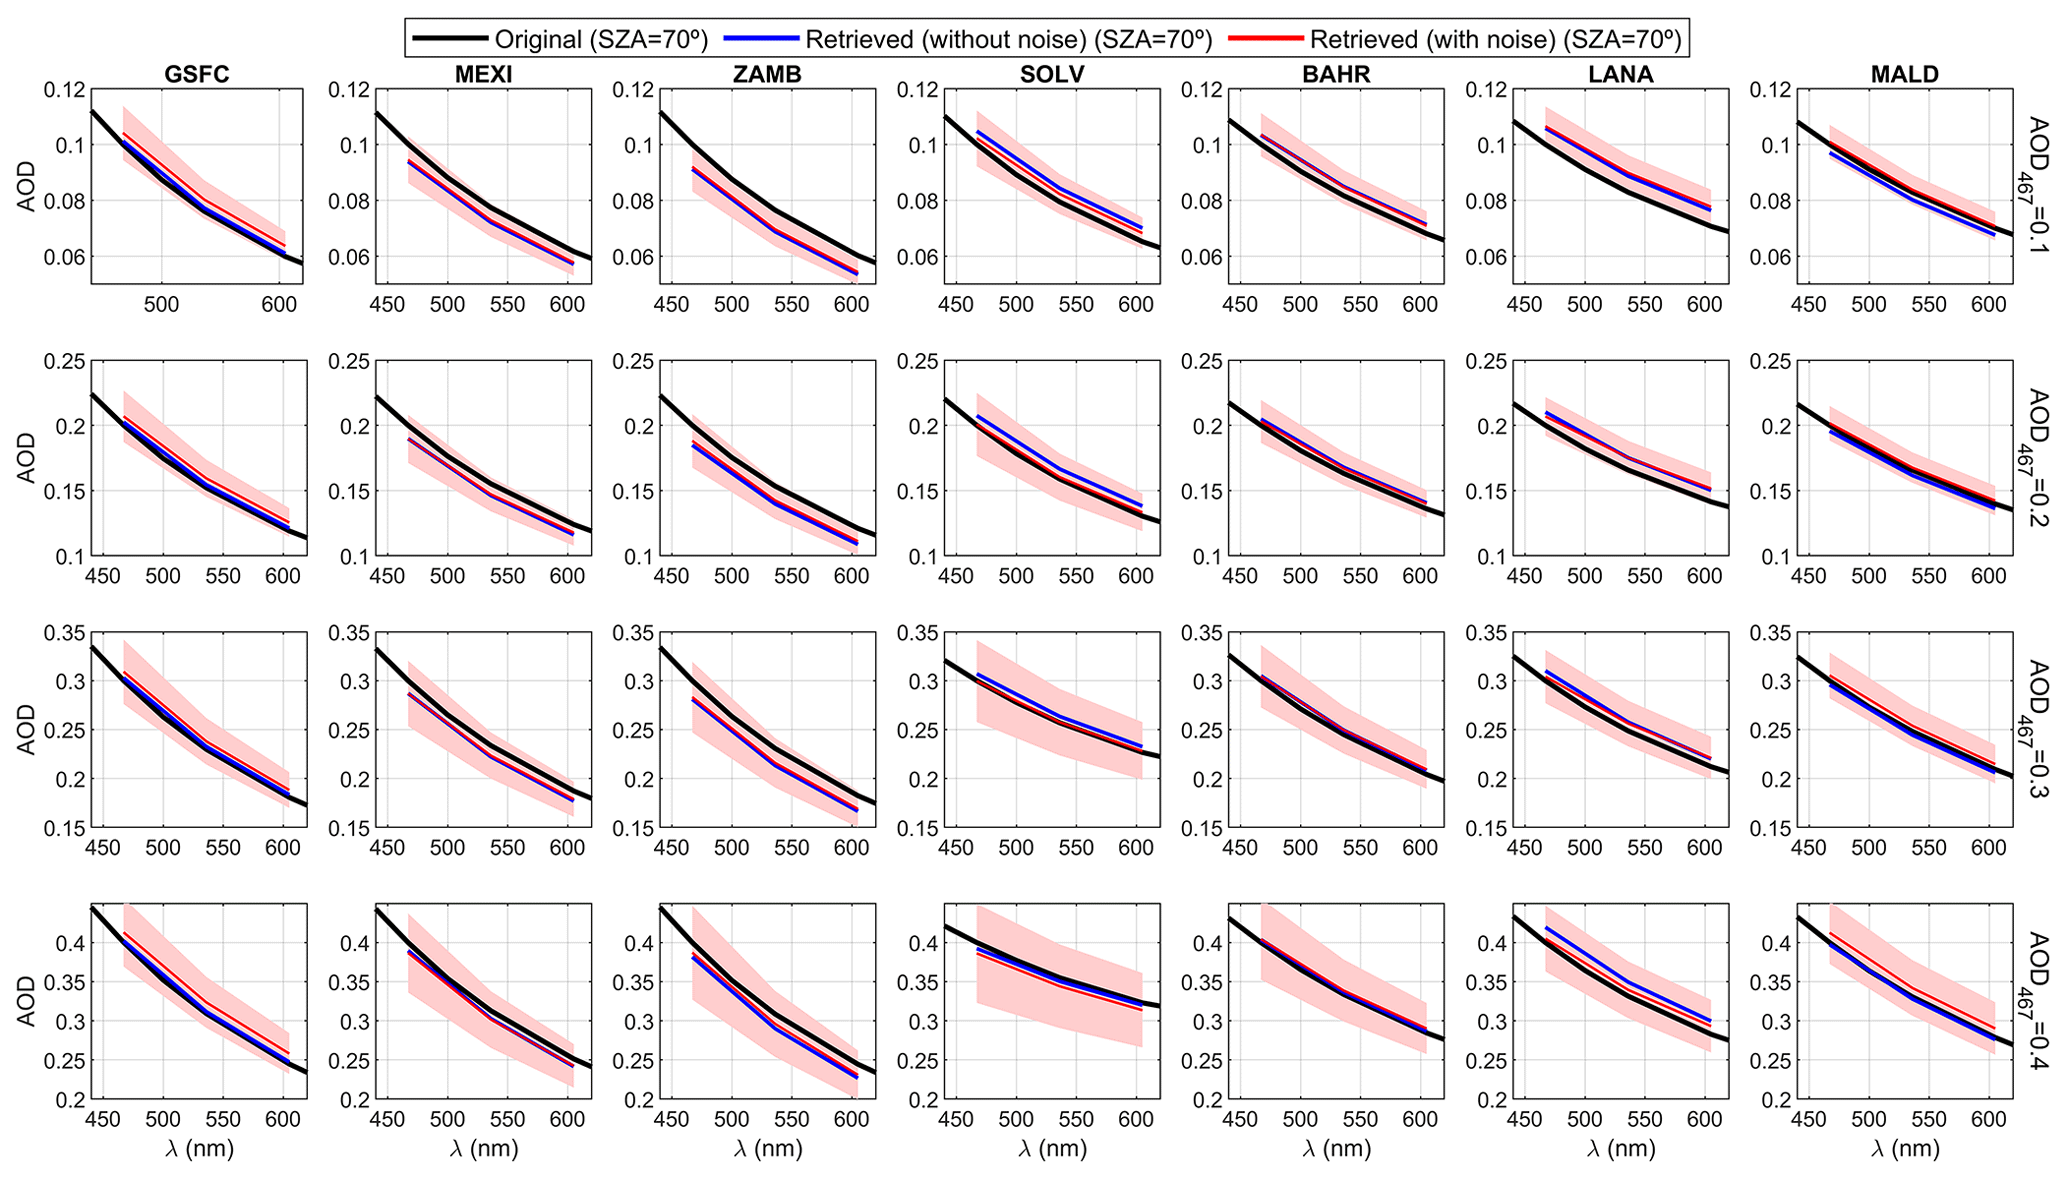
Figure 4Aerosol optical depths (AODs) used as reference (black line), AODs retrieved without noise (blue line), and the median of all AODs retrieved with noise (red line) for solar zenith angle (SZA) equal to 70∘. These AOD values are represented for different aerosol types (one type per column) and for AOD values at 467 nm (AOD467) of 0.1 (first row), 0.2 (second row), 0.3 (third row) and 0.4 (last row). Red shadowed area corresponds to ± the standard deviation of all averaged size distributions retrieved with noise-perturbed radiances.
A more quantitative analysis about the GRASP-CAM performance has been done for each retrieved aerosol parameter. To this end, and for each aerosol property, type and load, the median and standard deviation of the difference between the retrieved aerosol property (only convergent retrievals) and the original value have been calculated. Figure 5 shows, for SZA = 70∘ and for each aerosol type and load, the number of retrievals showing convergence, as well as the median and standard deviation of the differences between retrieved and original values for AOD values at 467, 536 and 605 nm. Figure S17 shows the same plots but with x axis (AOD467) limited to 0.5 for a better observation of the low–medium AOD values. The number of convergent retrievals decreases with increasing AOD. The accuracy of the retrieved AOD, represented by the median difference Md, is within ±0.02 for all wavelengths and aerosol types if AOD467 is lower than or equal to 0.4. This bias presents high values, generally negative except for GSFC and MALD, for AOD467 above 0.6. Regarding the precision of AOD, given by SD, it decreases (SD increases) with AOD467, the highest SD values being for SOLV. The AOD absolute precision is slightly higher for longer wavelengths, but in general it ranges from 0.01 to 0.05 when AOD467 varies from 0.1 to 0.5. The accuracy and precision of retrieved AOD are worse when there is a lack of information like in the mentioned cases of SZA = 30∘ (Fig. S18) and SZA = 50∘ (Fig. S19). On the other hand, if scattering angles lower than 10∘ (until 3∘) are added to the inversion of SZA = 70∘ (Fig. S20), the precision of AOD is improved (SD is reduced) but not the accuracy.
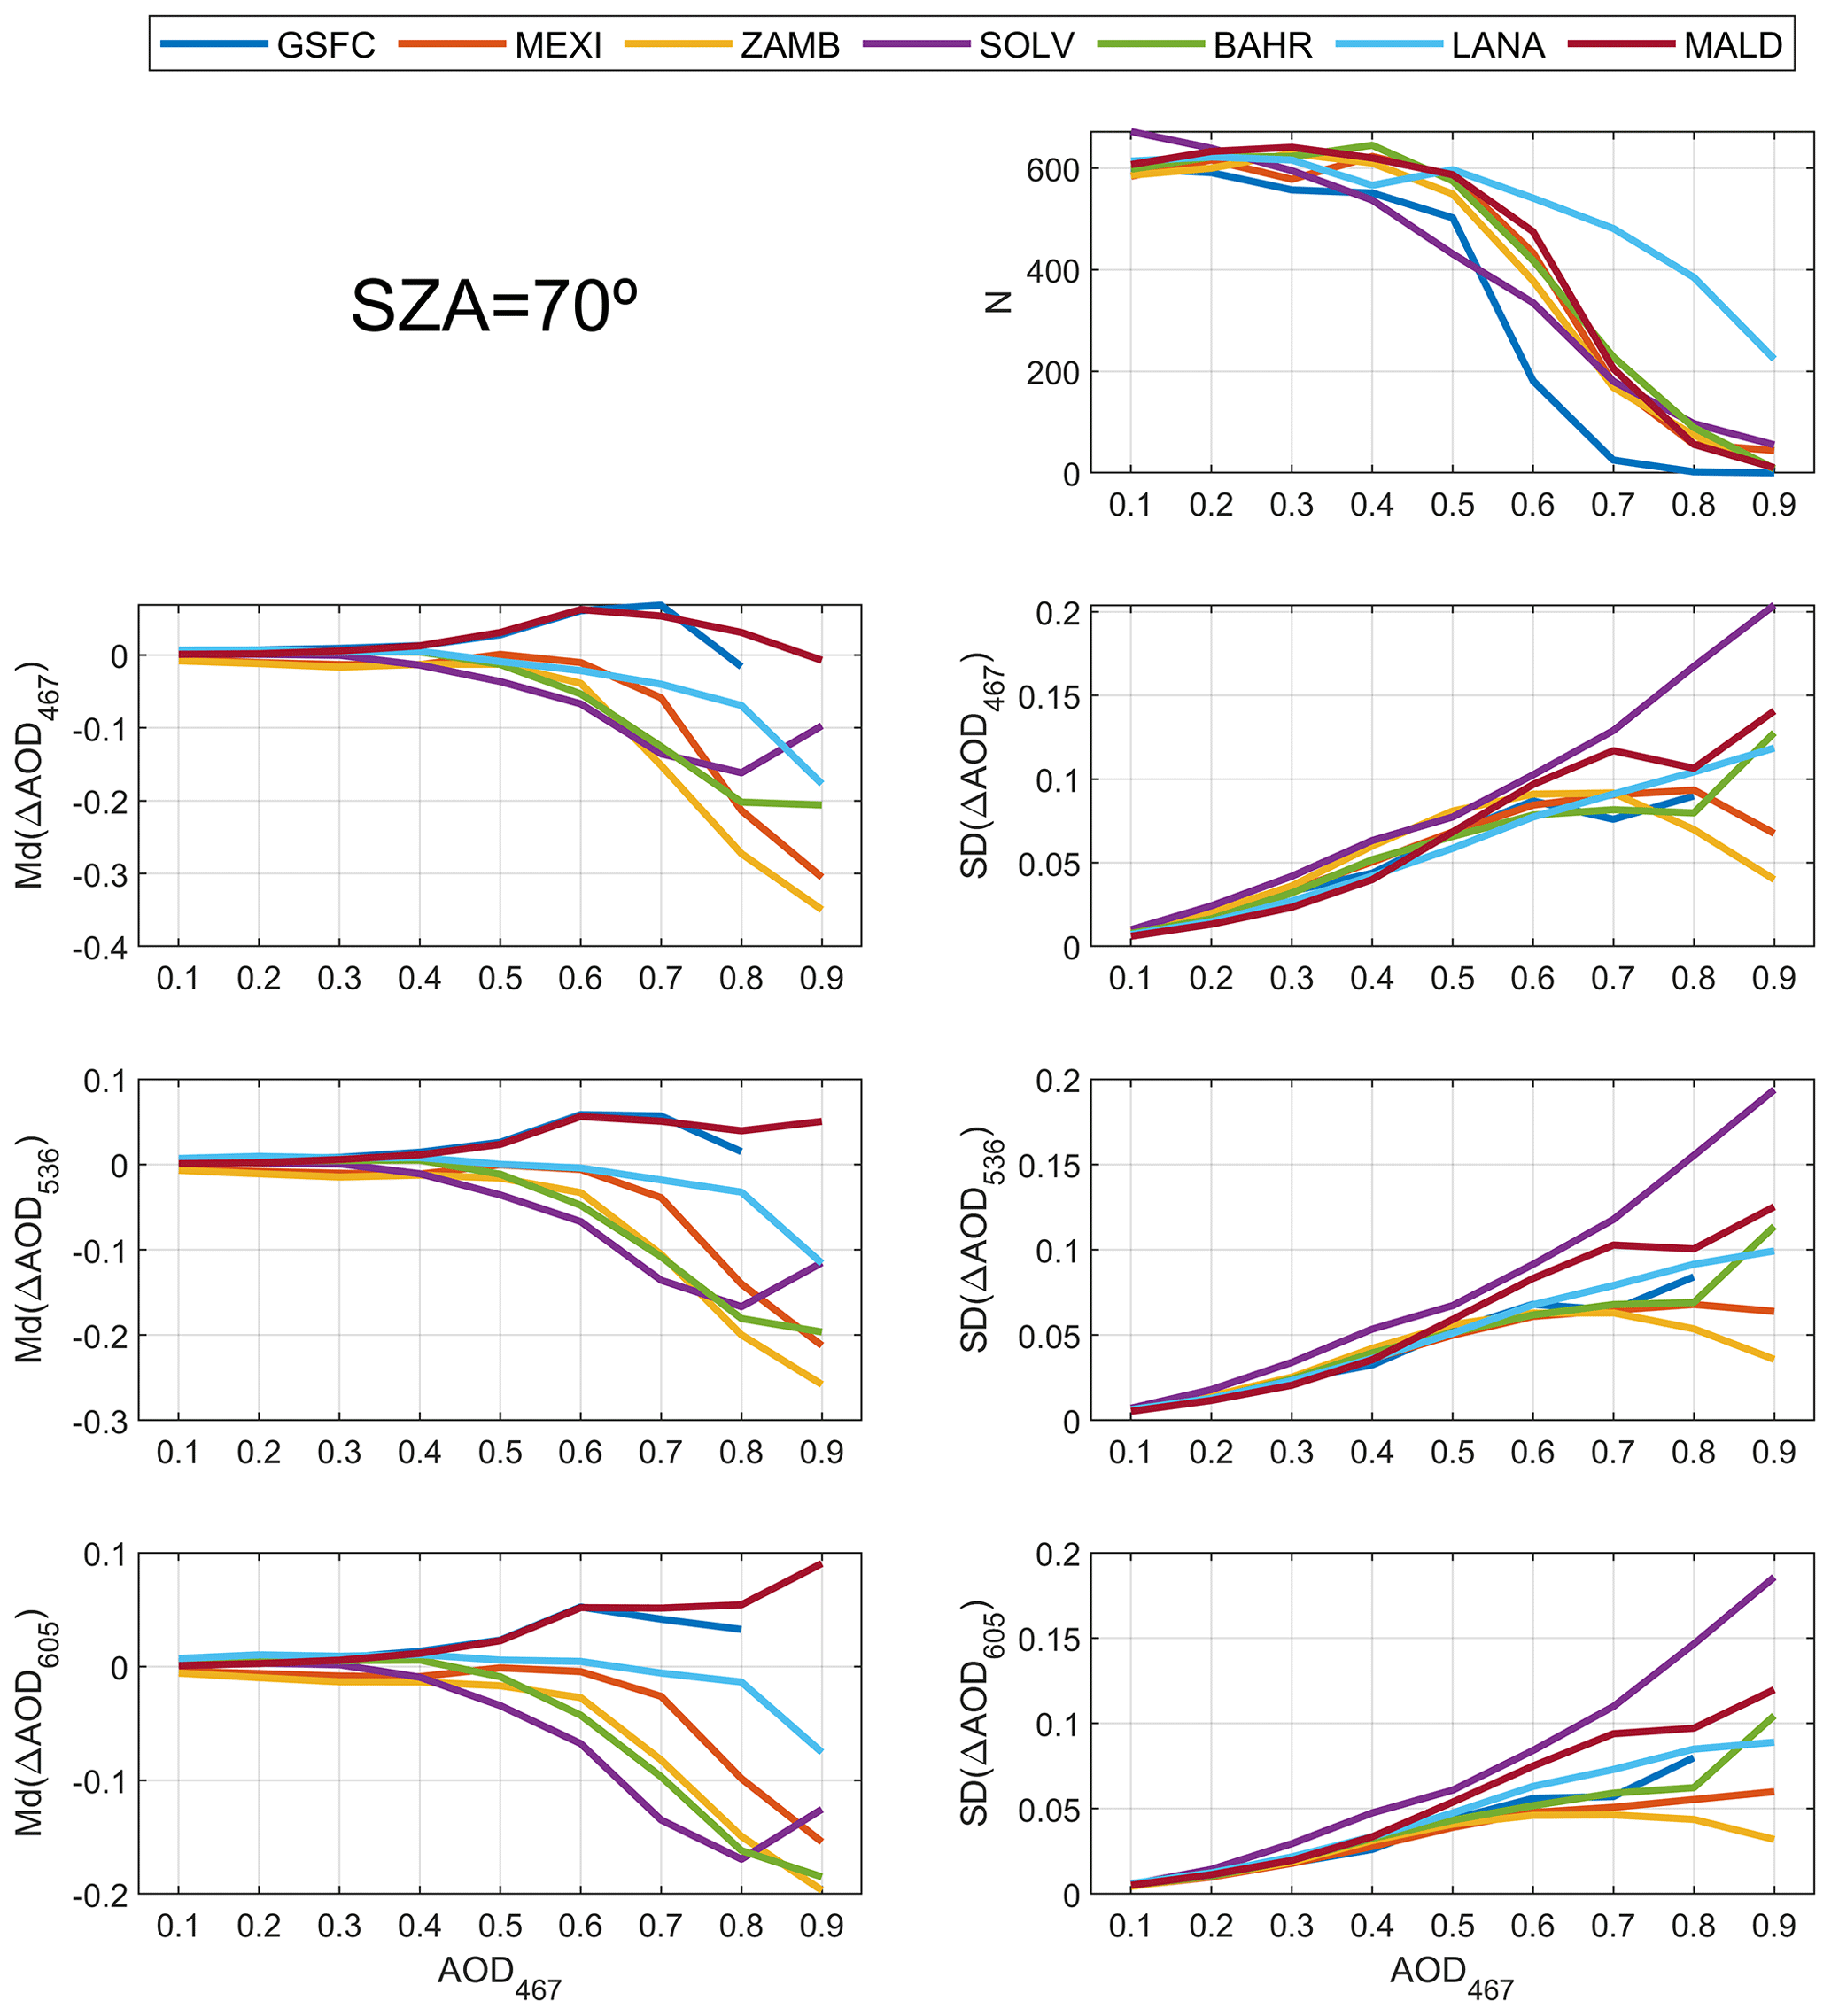
Figure 5Median (Md) and standard deviation (SD) of the Δ differences between the available retrieved aerosol properties with noise-perturbed radiances and the original (reference) properties. The amount of available retrievals (N) is also shown. Only the retrievals with solar zenith angle (SZA) equal to 70∘ are used. The aerosol properties provided are aerosol optical depth (AOD) at 467 nm (AOD467), 536 nm (AOD536) and 605 nm (AOD605). The Md and SD are represented as a function of AOD467 for different aerosol types.
3.2.2 Other aerosol properties
The retrieved aerosol volume size distributions with and without noise are shown for SZA = 70∘ in Fig. 6, in a similar way to that in Fig. 4. Both retrievals, with and without noise, fit similarly with the original size distribution. In general, the accuracy of the retrieved size distributions decreases for high AOD values (see Fig. S21), which is likely related to the mentioned lack of sensitivity of NSR observations to AOD for high aerosol loads. The retrieved size distributions show higher accuracy for fine mode than for coarse mode (especially for LANA, SOLV and BAHR); higher standard deviation is found for coarse mode, i.e. less precision. The lower accuracy for the coarse mode could be caused by the lack of low scattering angles, which contain information about the coarse mode (Tonna et al., 1995; Román et al., 2017; Torres and Fuertes, 2021); this is corroborated by Figs. S22 and S23, where the accuracy of the coarse mode is better for the same retrievals if we include scattering angles from 3∘ instead of 10∘. All these results are similar for SZA = 30∘ (see Fig. S24), but the uncertainty in the coarse mode is much higher for the case of SZA = 50∘ (see Fig. S25); it could be caused by the lack of low scattering angles with SZA = 50∘ due to the banned area of the camera.

Figure 6Original size distribution used as reference (black line), size distribution retrieved without noise (blue line), and the median of all retrieved size distributions with noise (red line) for a solar zenith angle (SZA) equal to 70∘. These size distributions are represented for different aerosol types (one type per column) and for values of AOD (aerosol optical depth) at 467 nm (AOD467) of 0.1 (first row), 0.2 (second row), 0.3 (third row) and 0.4 (last row). Red shadowed area corresponds to ± the standard deviation of all averaged size distributions retrieved with noise-perturbed synthetic radiances.
Figure 7 presents a similar analysis to that of Fig. 5 but for the other aerosol properties retrieved by GRASP-CAM. Regarding size distribution parameters, Fig. 7 shows that the accuracy and precision of fine mode radius are within ±0.01 µm and below 0.02 µm, respectively, even for high aerosol loads. For the coarse mode the accuracy and precision of the radius are within ±0.6 µm and below 0.2 µm, respectively, for most of the cases. The accuracy of σ is worse for the coarse mode (within ±0.1) than for the fine one (within ±0.02), but the precision is similar to and below 0.08 in most cases. Regarding the volume concentration, the accuracy of the fine and coarse modes is, for AOD467 below 0.6, within ±0.01 and ±0.04 µm3 µm−2, respectively, while the precision is below 0.04 and 0.1 µm3 µm−2 for both fine and coarse modes, respectively. The precision and accuracy get worse as AOD increases. The results for SZA = 30∘ (Fig. S26) are similar to those for SZA = 70∘ regarding size distribution parameters, but the accuracy of these parameters is generally worse for the SZA = 50∘ case (Fig. S27). In general, the retrieved coarse mode parameters show higher dependence on the aerosol type than fine mode ones. This dependence is lower when low scattering angles (from 3∘ instead of 10∘) are used in the inversion (Fig. S28); the addition of low scattering angles also improves the accuracy of the retrieved coarse parameters. However, RC and σC still present a significant dependence on aerosol type, which could indicate that the retrieved values of these parameters do not vary significantly from the initial guess value, and hence, the proposed GRASP-CAM methodology has not enough sensitivity to retrieve both parameters.
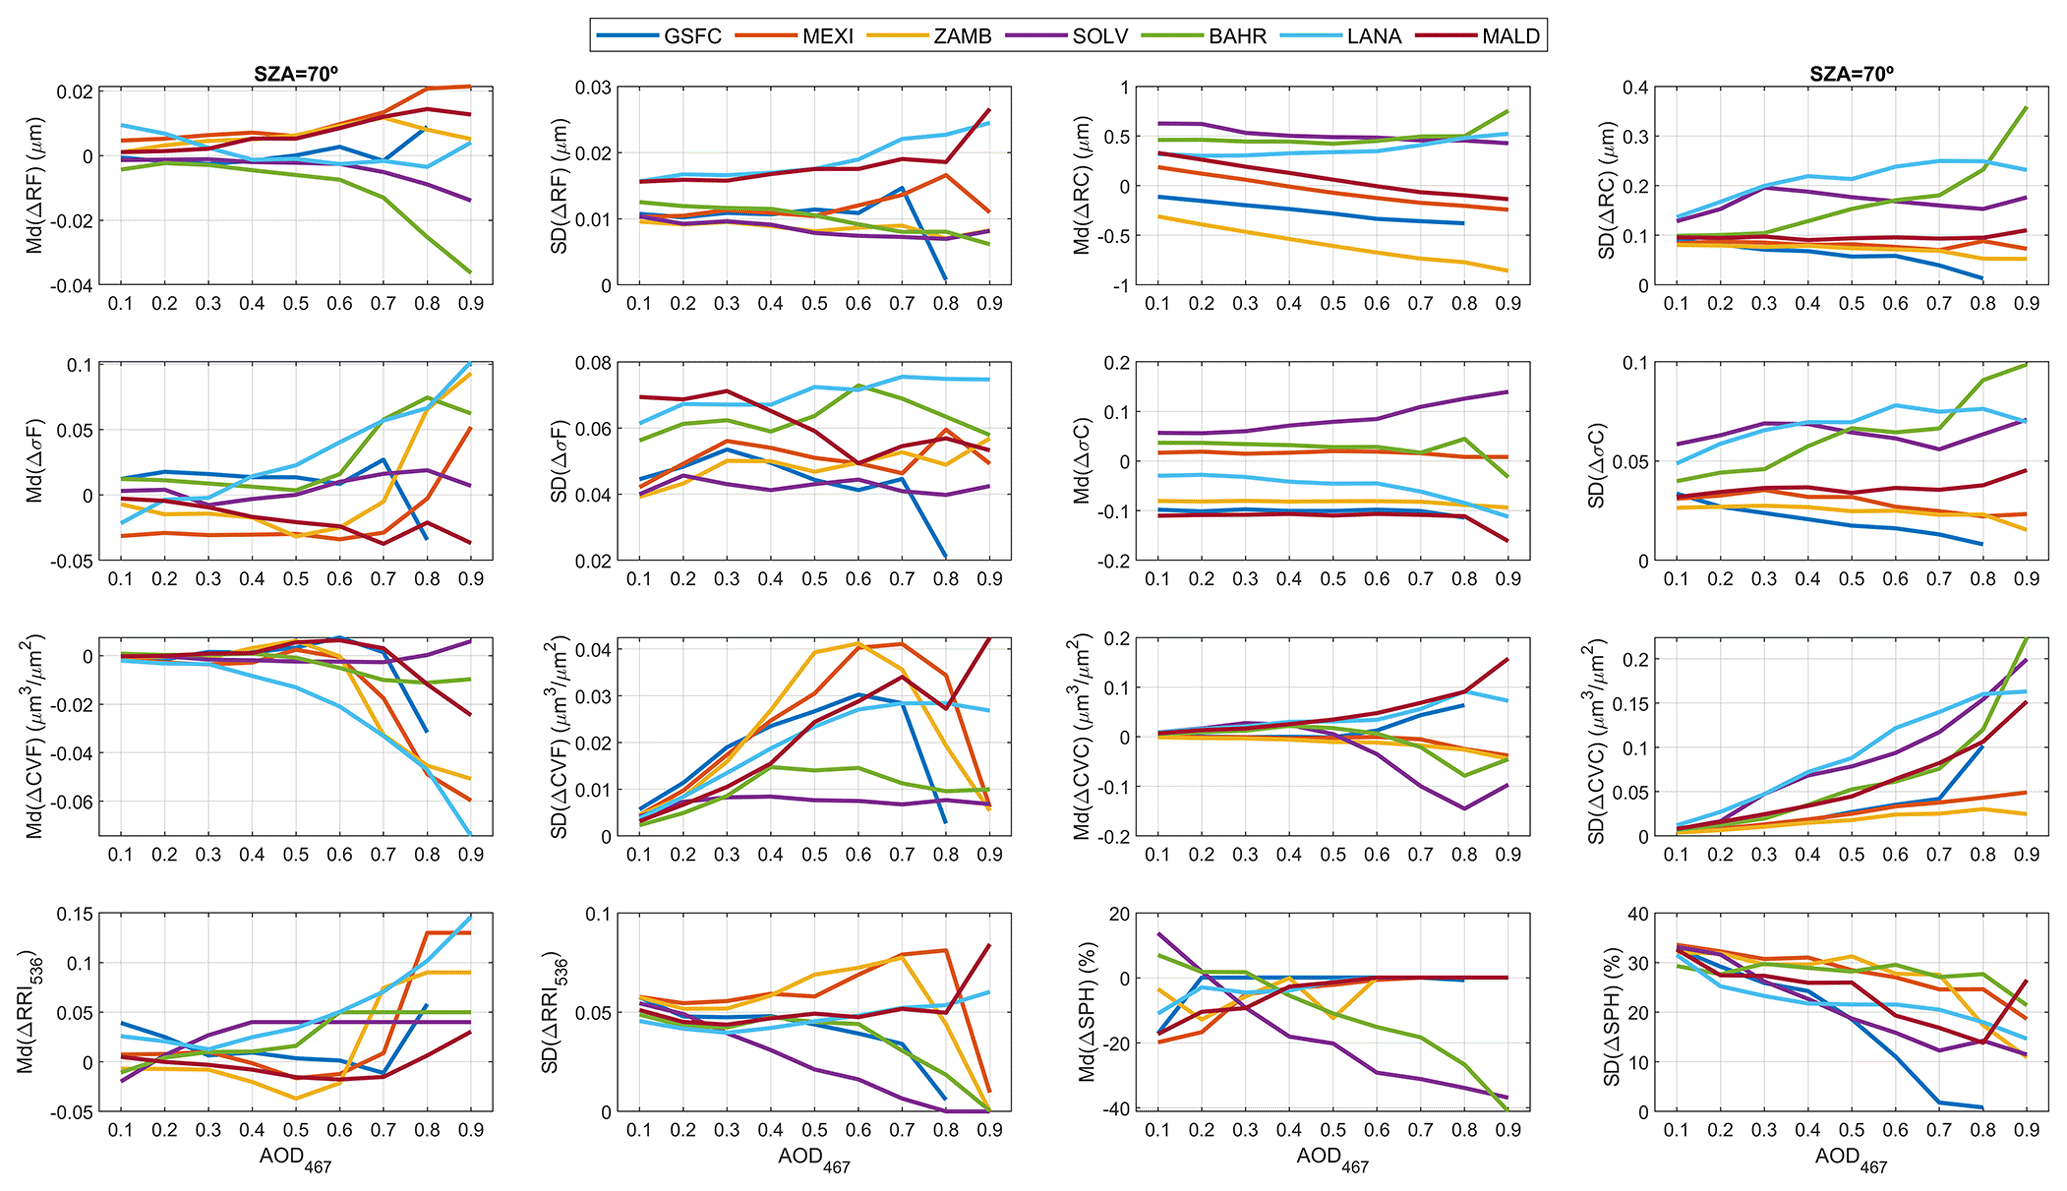
Figure 7Median (Md) and standard deviation (SD) of the Δ differences between the available retrieved aerosol properties with noise and the original ones for solar zenith angle (SZA) of 70∘. The aerosol properties are volume median radius of fine (RF) and coarse (RC) modes, standard deviation of log-normal distribution for fine (σF) and coarse (σC) modes, aerosol volume concentration for fine (VCF) and coarse (VCC) modes, real part of refractive index at 536 nm (RRI536), and the fraction of spherical particles (SPH). These Md and SD values are represented as a function of AOD467 for different aerosol types.
Figure 7 also presents the Md and SD values for the differences in RRI, showing an accuracy of RRI between −0.02 and 0.04 for AOD values below 0.5, with a precision of about 0.05; the SD values are in general higher for MEXI and ZAMB than for the other aerosol types. In addition, in the Supplement, Fig. S29 presents the same results as in Figs. 6 and 4 but for RRI. The retrieved values correlate with the original ones, especially for the retrievals without noise. These results indicate that NSR measurements contain information about the real part of refractive index.
The Md values of ΔSPH are also shown in Fig. 7, being close to zero for the entire AOD range except for desert dust aerosols. The SD of ΔSPH is similar for all aerosol types, varying from 30 % to about 20 % when AOD rises from 0.1 to 0.9. In general, the accuracy and precision of all parameters observed in Fig. 7 are worse when the scattering angles are reduced, like in the cases of SZA = 30∘ (Fig. S26) and especially SZA = 50∘ (Fig. S27). If scattering angles from 3∘ instead of 10∘ are used, the precision of the parameters of Fig. 7 is slightly better in most cases (Fig. S28).
A similar analysis to the one presented in this section was done but assuming that IRI can be also retrieved from the NSR measurements; we assumed an initial guess IRI value of 0.01. The retrieved IRI values are shown in Fig. S30. There is not a correlation between the original and retrieved values (even without noise perturbation). These results point out that, as expected, there is no sensitivity of NSR measurements to the imaginary part of refractive index, which motivated the exclusion of IRI from the set of parameters to be retrieved by the GRASP-CAM strategy (see Sect. 2.2). This lack of sensitivity to aerosol absorption is due to the lack of absolute calibration in the GRASP-CAM measurements because it is well known that absolute radiances contain the necessary information to retrieve aerosol absorptive properties, like in the AERONET retrievals (Dubovik and King, 2000; Sinyuk et al., 2020).
4.1 Single-pixel approach
In order to study the performance of the GRASP-CAM products using real measurements, the GRASP-CAM method has been applied to NSR measurements obtained with the all-sky camera at Valladolid (see Sect. 2.1). The data span from 11 July 2018 to 15 September 2020. This has provided a total of 42 105 retrievals (satisfying at least six cloud-free NSR data points per wavelength), but only 34 536 pass the convergence criteria.
An additional quality-control criterion has been added: the need of at least one NSR measurement, in any wavelength, with a low scattering angle (≤14∘) and with a high one (). This new criterion is based on the results of Sect. 3, which revealed the need of low scattering angles for an accurate retrieval, but also based on the AERONET criteria (Holben et al., 2006), which demand a minimum number of sky radiance measurements in various scattering angle ranges, including high angles, for quality-assured retrievals. This new criterion reduces the available retrievals to 23 368, removing all retrievals with SZA values between 47.2 and 64.2∘ and with SZA values higher than 82.5∘. The rejection of retrievals with the highest SZA values is also motivated by the GRASP assumption of plane-parallel geometry for forward modelling; this assumption could still affect the remaining retrievals with high SZA angles.
These criteria are required for quality assurance of the retrieval. However, some data contaminated by clouds could pass them. Hence, additional cloud-screening criteria, based on the AERONET cloud-screening version 3 (Giles et al., 2019), have been applied. For this purpose, the time series of the GRASP-CAM-retrieved AOD has been used. A GRASP-CAM retrieval has been assumed as cloud contaminated, and hence removed, if (1) the time variation of the remaining cloud-free AOD at 536 nm is higher than 0.01 min−1 (temporal smoothness criterion), (2) there is no remaining cloud-free AOD within ±1 h (stand-alone criterion), (3) the remaining cloud-free AOD at 536 nm is without the range defined by the daily mean of this variable ±3sigma, sigma being the daily standard deviation of this AOD (AOD 3sigma criterion), (4) the remaining cloud-free Ångström exponent (AE) is without the range defined by the daily mean of this variable ±3sigma, sigma being the daily standard deviation of this AE (AE 3sigma criterion), and (5) the amount of remaining cloud-free data in 1 d is lower than 3 % or than the 10 % of the potential retrievals on this day (potential measurements criterion). These criteria are described in detail in Giles et al. (2019) and González et al. (2020). Finally, a total of 22 501 GRASP-CAM retrievals have been classified as cloud-free and quality-assured after applying these cloud-screening criteria. These remaining data are the measurements used in this section.
4.1.1 Aerosol optical depth
To study the goodness of the AOD retrieved by GRASP-CAM, it needs to be compared with alternative and independent measurements and in our case with the AOD measured by a collocated AERONET sun–sky photometer. To this end, the AOD from AERONET has been interpolated to the effective camera wavelengths following the Ångström law (Angström, 1930, 1961). Figure 8 shows both GRASP-CAM and AERONET AOD time series for a 12 d period in summer 2020 at Valladolid. AOD from GRASP-CAM looks a bit noisier than AERONET; however, both data series are well correlated for the three wavelengths, showing similar AOD values. For example, a decrease from moderate to low AOD load can be observed in both series on 1 August. Sometimes AOD from GRASP-CAM is available when the AERONET one is not, which points out that GRASP-CAM could be useful to complement AOD data series. The full time series of retrieved AOD can be observed in Fig. S31.
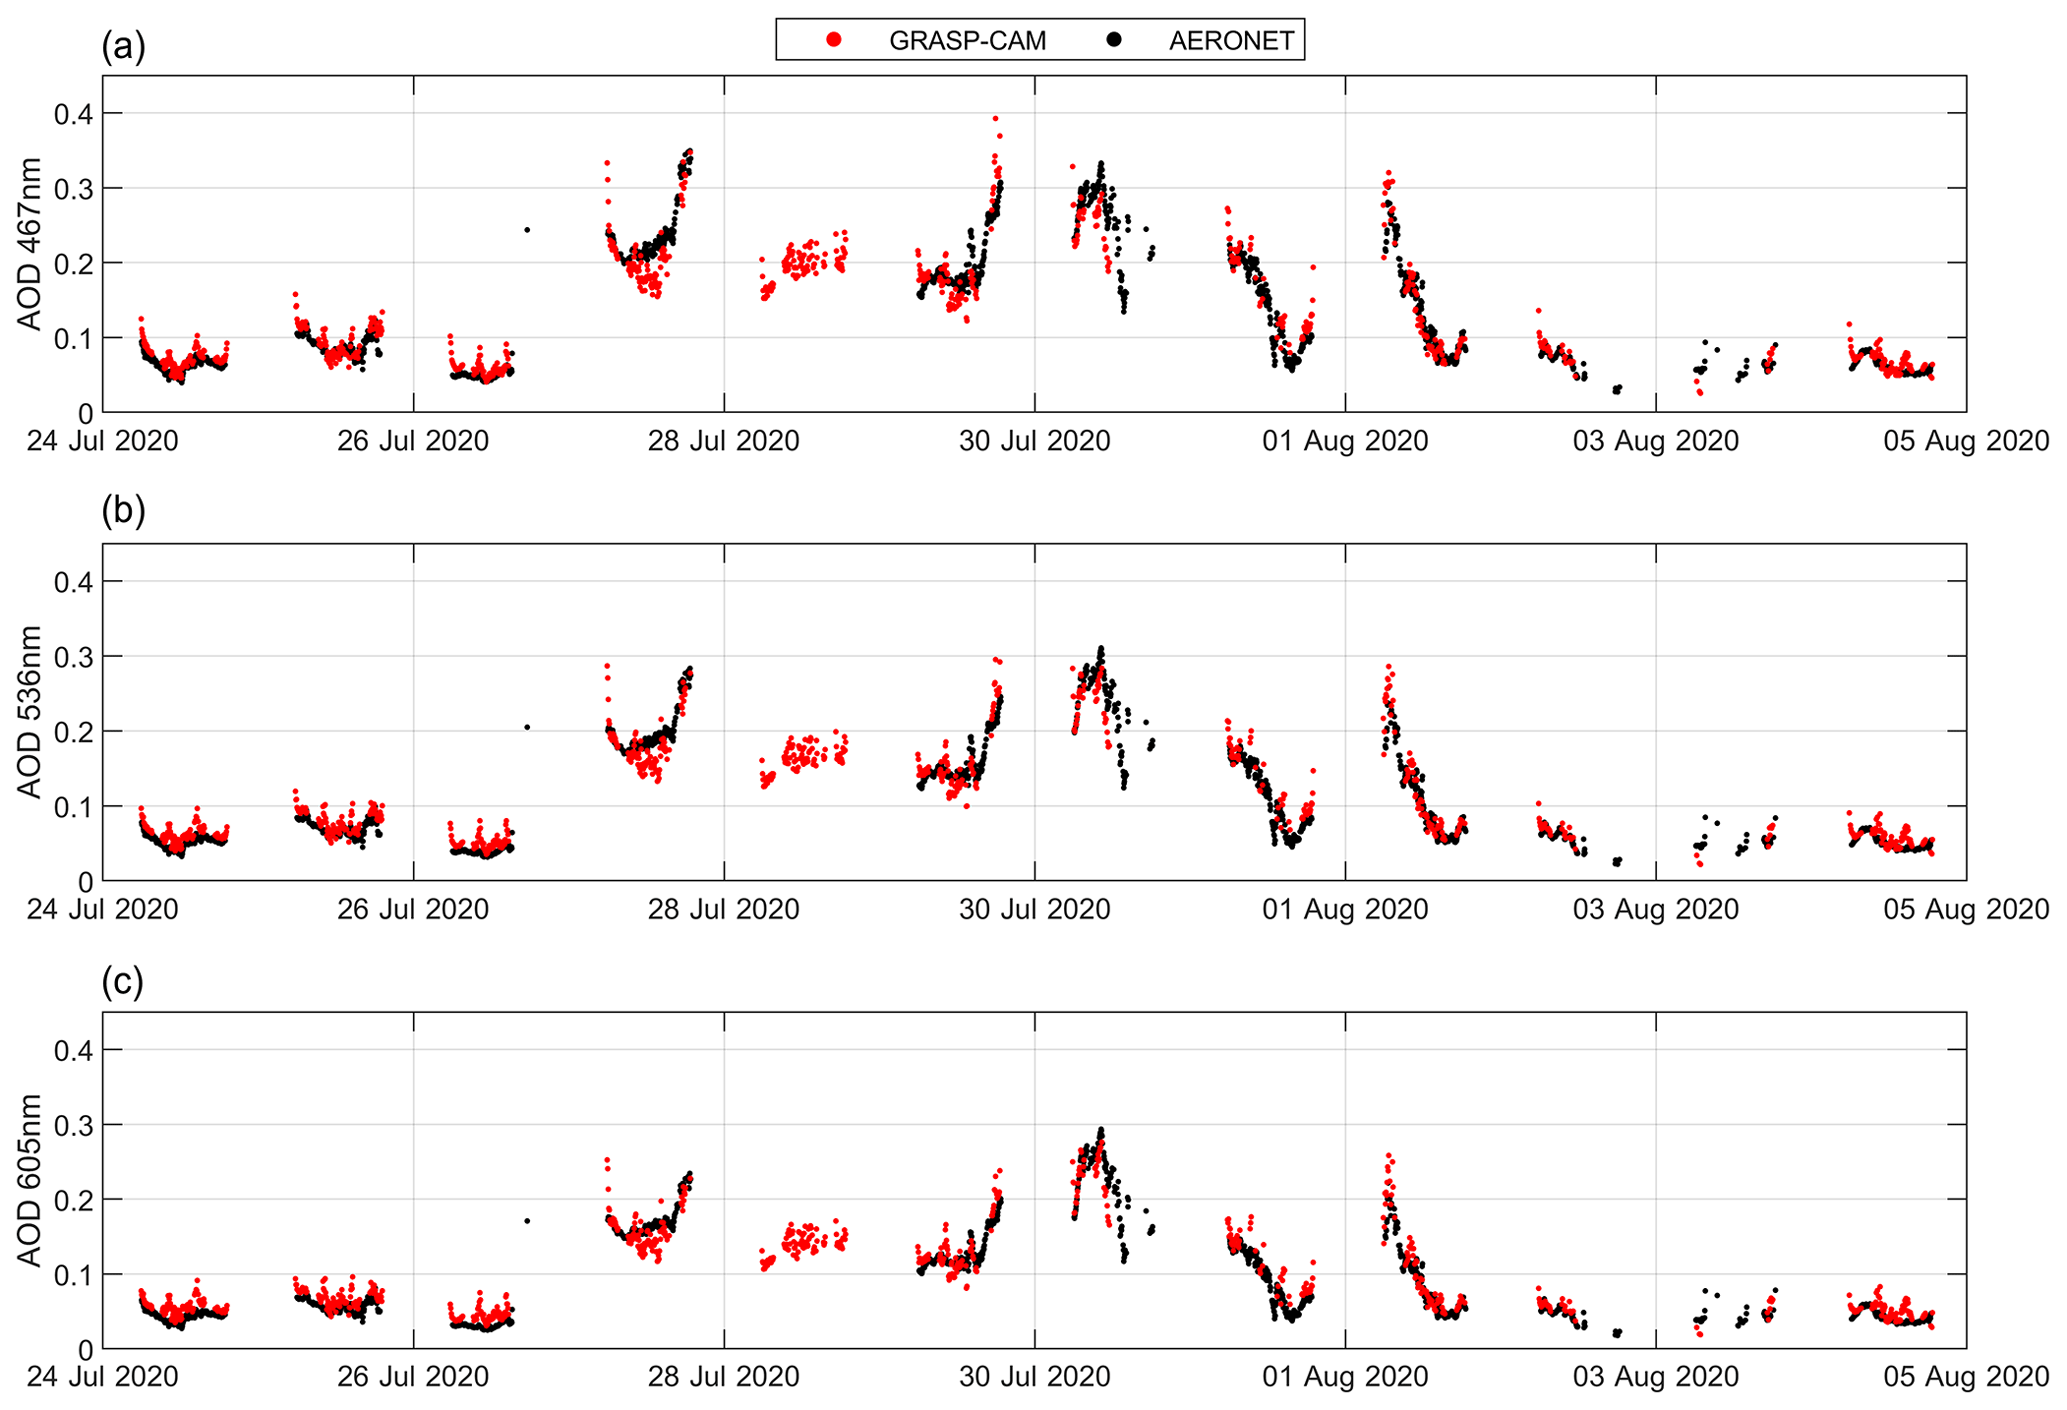
Figure 8Aerosol optical depth (AOD) at 467 nm (a), 536 nm (b) and 605 nm (c) retrieved by GRASP with the single-pixel approach (GRASP-CAM) and by AERONET at Valladolid from 24 July to 4 August 2020. AERONET data have been interpolated to the all-sky camera wavelengths.
A more quantitative analysis has been done by a match-up of GRASP-CAM and AERONET AOD data. Each available GRASP-CAM AOD data point has been paired up with the closest AOD AERONET data point within ±2.5 min. The ±2.5 min interval has been used because GRASP-CAM data are available each 5 min, and this interval avoids overlapping one AERONET value for two or more GRASP-CAM retrievals. After this match-up, a total of 16 935 AOD data pairs (GRASP-CAM versus AERONET) are available for each wavelength. The upper panels of Fig. 9 show these data pairs through density scatter plots of AOD from GRASP-CAM as a function of AERONET AOD for each wavelength. The least squares linear fit, its equation and the determination coefficient (r2) of these data pairs are also included. AOD from GRASP-CAM correlates well with AERONET measurements, with r2 of about 0.87 at the three wavelengths. The differences between both AOD sources increase for high AOD values, but the availability of data pairs under these conditions is scarce. The scatter plots and the linear fit equations show a slight overestimation of GRASP-CAM to AERONET for low AOD values, while GRASP-CAM tends to underestimate the highest AOD values.
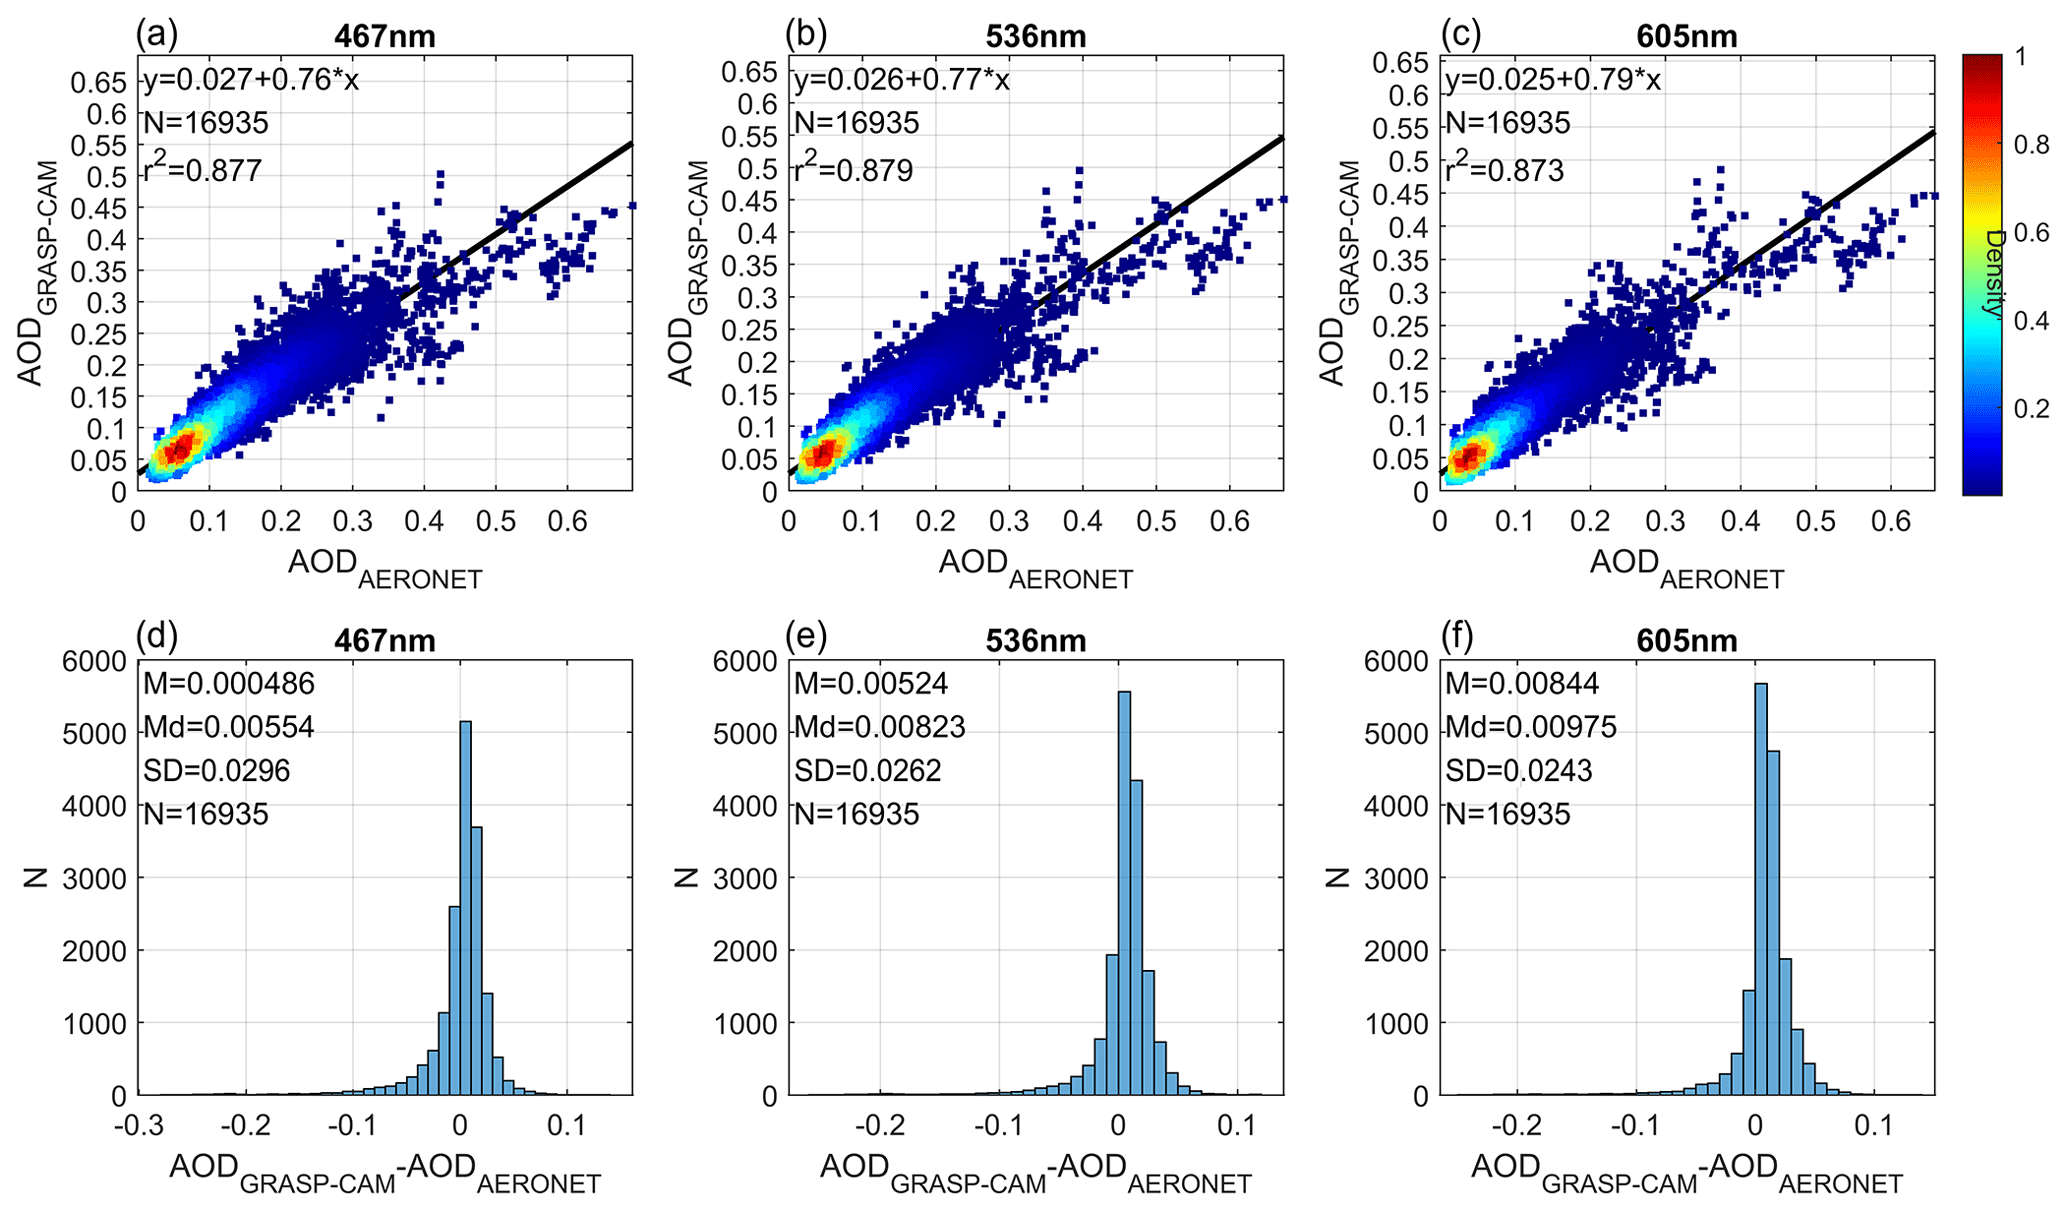
Figure 9(a–c) Density scatter plots of the aerosol optical depth (AOD) retrieved by GRASP with the single-pixel approach (GRASP-CAM) versus the AOD from AERONET at 467 nm (a), 536 nm (b) and 605 nm (c); linear fit (black line), its equation and the determination coefficient (r2) are also shown. (d–f) Frequency histograms of the differences in AOD between GRASP-CAM and AERONET at 467 nm (d), 536 nm (e) and 605 nm (f). The mean (M), median (Md) and standard deviation (SD) of these differences are also shown.
The bottom panels of Fig. 9 present the frequency distribution of the differences between the AOD from GRASP-CAM and AERONET, as well as the mean (M), median and standard deviation of these differences. The peak of the three distributions are slightly biased to positive values, which could be caused by the mentioned overestimation of GRASP-CAM to AERONET for low AOD values (the most frequent in Valladolid). On the other hand, a longer tail appears on the distributions for negative values, likely indicating the mentioned underestimation of GRASP-CAM to AERONET for the highest AOD values, which are less frequent. Considering all data, the median of the differences, which can be assumed as the accuracy considering AERONET as reference, ranges between 0.006 at 467 nm and 0.010 at 605 nm. The mean values are slightly lower. The uncertainty of AERONET AOD is ±0.01 for their nominal wavelengths. Hence, the bias of AOD between GRASP-CAM and AERONET is within the AERONET uncertainty. Using AERONET as reference, the precision of AOD, associated with the standard deviation of the distributions of Fig. 9, goes from 0.030 at 467 nm to 0.024 at 605 nm, these values being larger than the AERONET AOD uncertainty.
The last values of the experimental accuracy and precision of GRASP-CAM AOD have been globally obtained using all available data, but the results could vary as a function of AOD, as suggested in Sect. 3.2. In order to obtain a more detailed description of the accuracy and precision, the differences between AOD from GRASP-CAM and AERONET (ΔAOD) have been calculated for different AOD bins (±0.025 AOD bins). The amount of available data, the median and the standard deviation of all these distributions are represented in Fig. 10 as a function of AOD. The amount of data available per AOD bin is much higher for AOD values below 0.25 (N>1000), as can also be observed in Fig. 9; hence, the results will be more representative for the bins of lower AOD. The median of the ΔAOD differences decreases with AOD, and it is within ±0.015 and with similar values for all wavelengths for AOD values below 0.25. The SD values are below 0.02 for AOD lower than 0.15 and below 0.04 for AOD lower than 0.25. These Md and SD results are similar to the ones observed with synthetic data in Sect. 3.2 (see Figs. 5, S18 and S19).
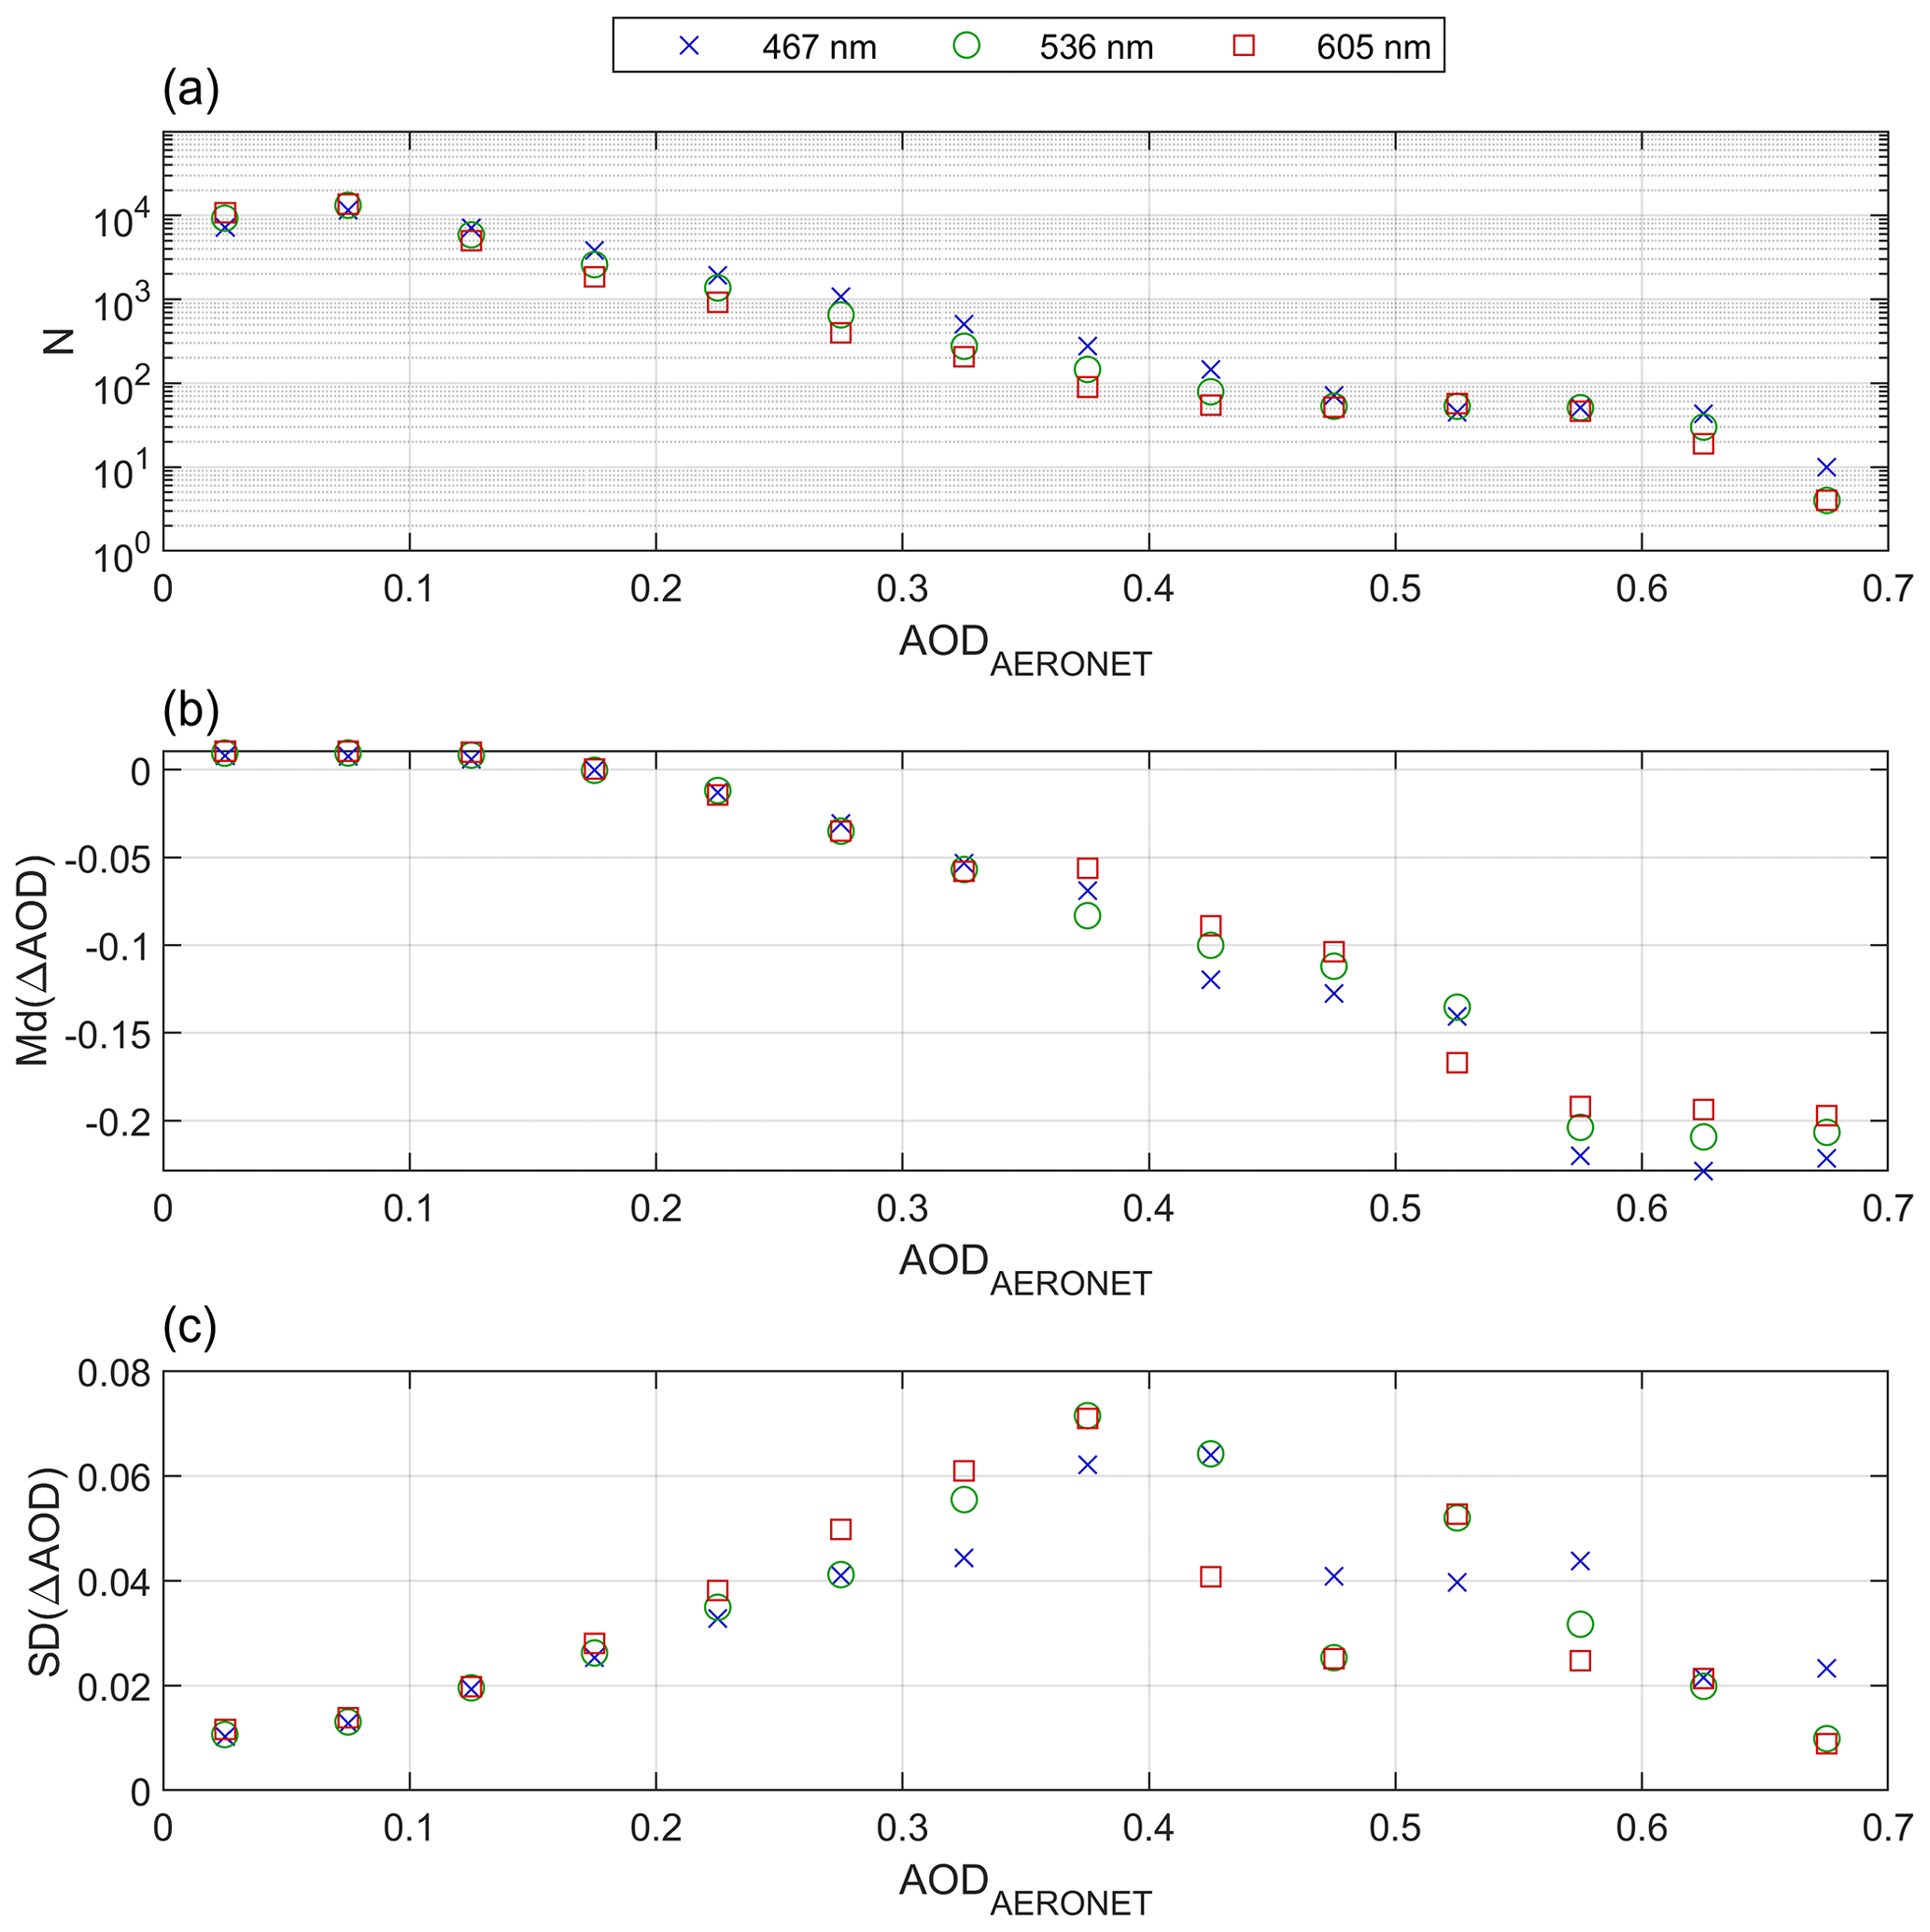
Figure 10Median (Md; b) and standard deviation (SD; c) of the Δ differences in the aerosol optical depth (AOD) retrieved by GRASP with the single-pixel approach (GRASP-CAM) and those obtained by AERONET at 467, 536 and 605 nm for different AOD bins. The available amount of ΔAOD data (N) per AOD bin is also shown in (a) for the three wavelengths.
AOD from GRASP-CAM underestimates the AERONET product for AOD values above 0.25, decreasing the Md values from −0.05 (AOD ≈ 0.3) to −0.2 (AOD ≈ 0.6). This underestimation and lack of accuracy of the GRASP-CAM AOD for high AOD values have been also observed in the synthetic data analysis (Sect. 3.2), especially for the case of SZA = 30∘ and for desert dust coarse particles, which are usually the predominant particles at Valladolid during high AOD episodes. The SD for AOD values above 0.25 still increases up to 0.06–0.07 when AOD is about 0.375, but then it decreases to 0.01–0.02 as the AOD goes up to 0.7. These results are approximately between the ones obtained theoretically with SZA = 70∘ and SZA = 30∘. However, the obtained accuracy and precision of AOD from GRASP-CAM using AERONET as reference must be carefully considered for high AOD values since the amount of available data under these conditions may not be representative.
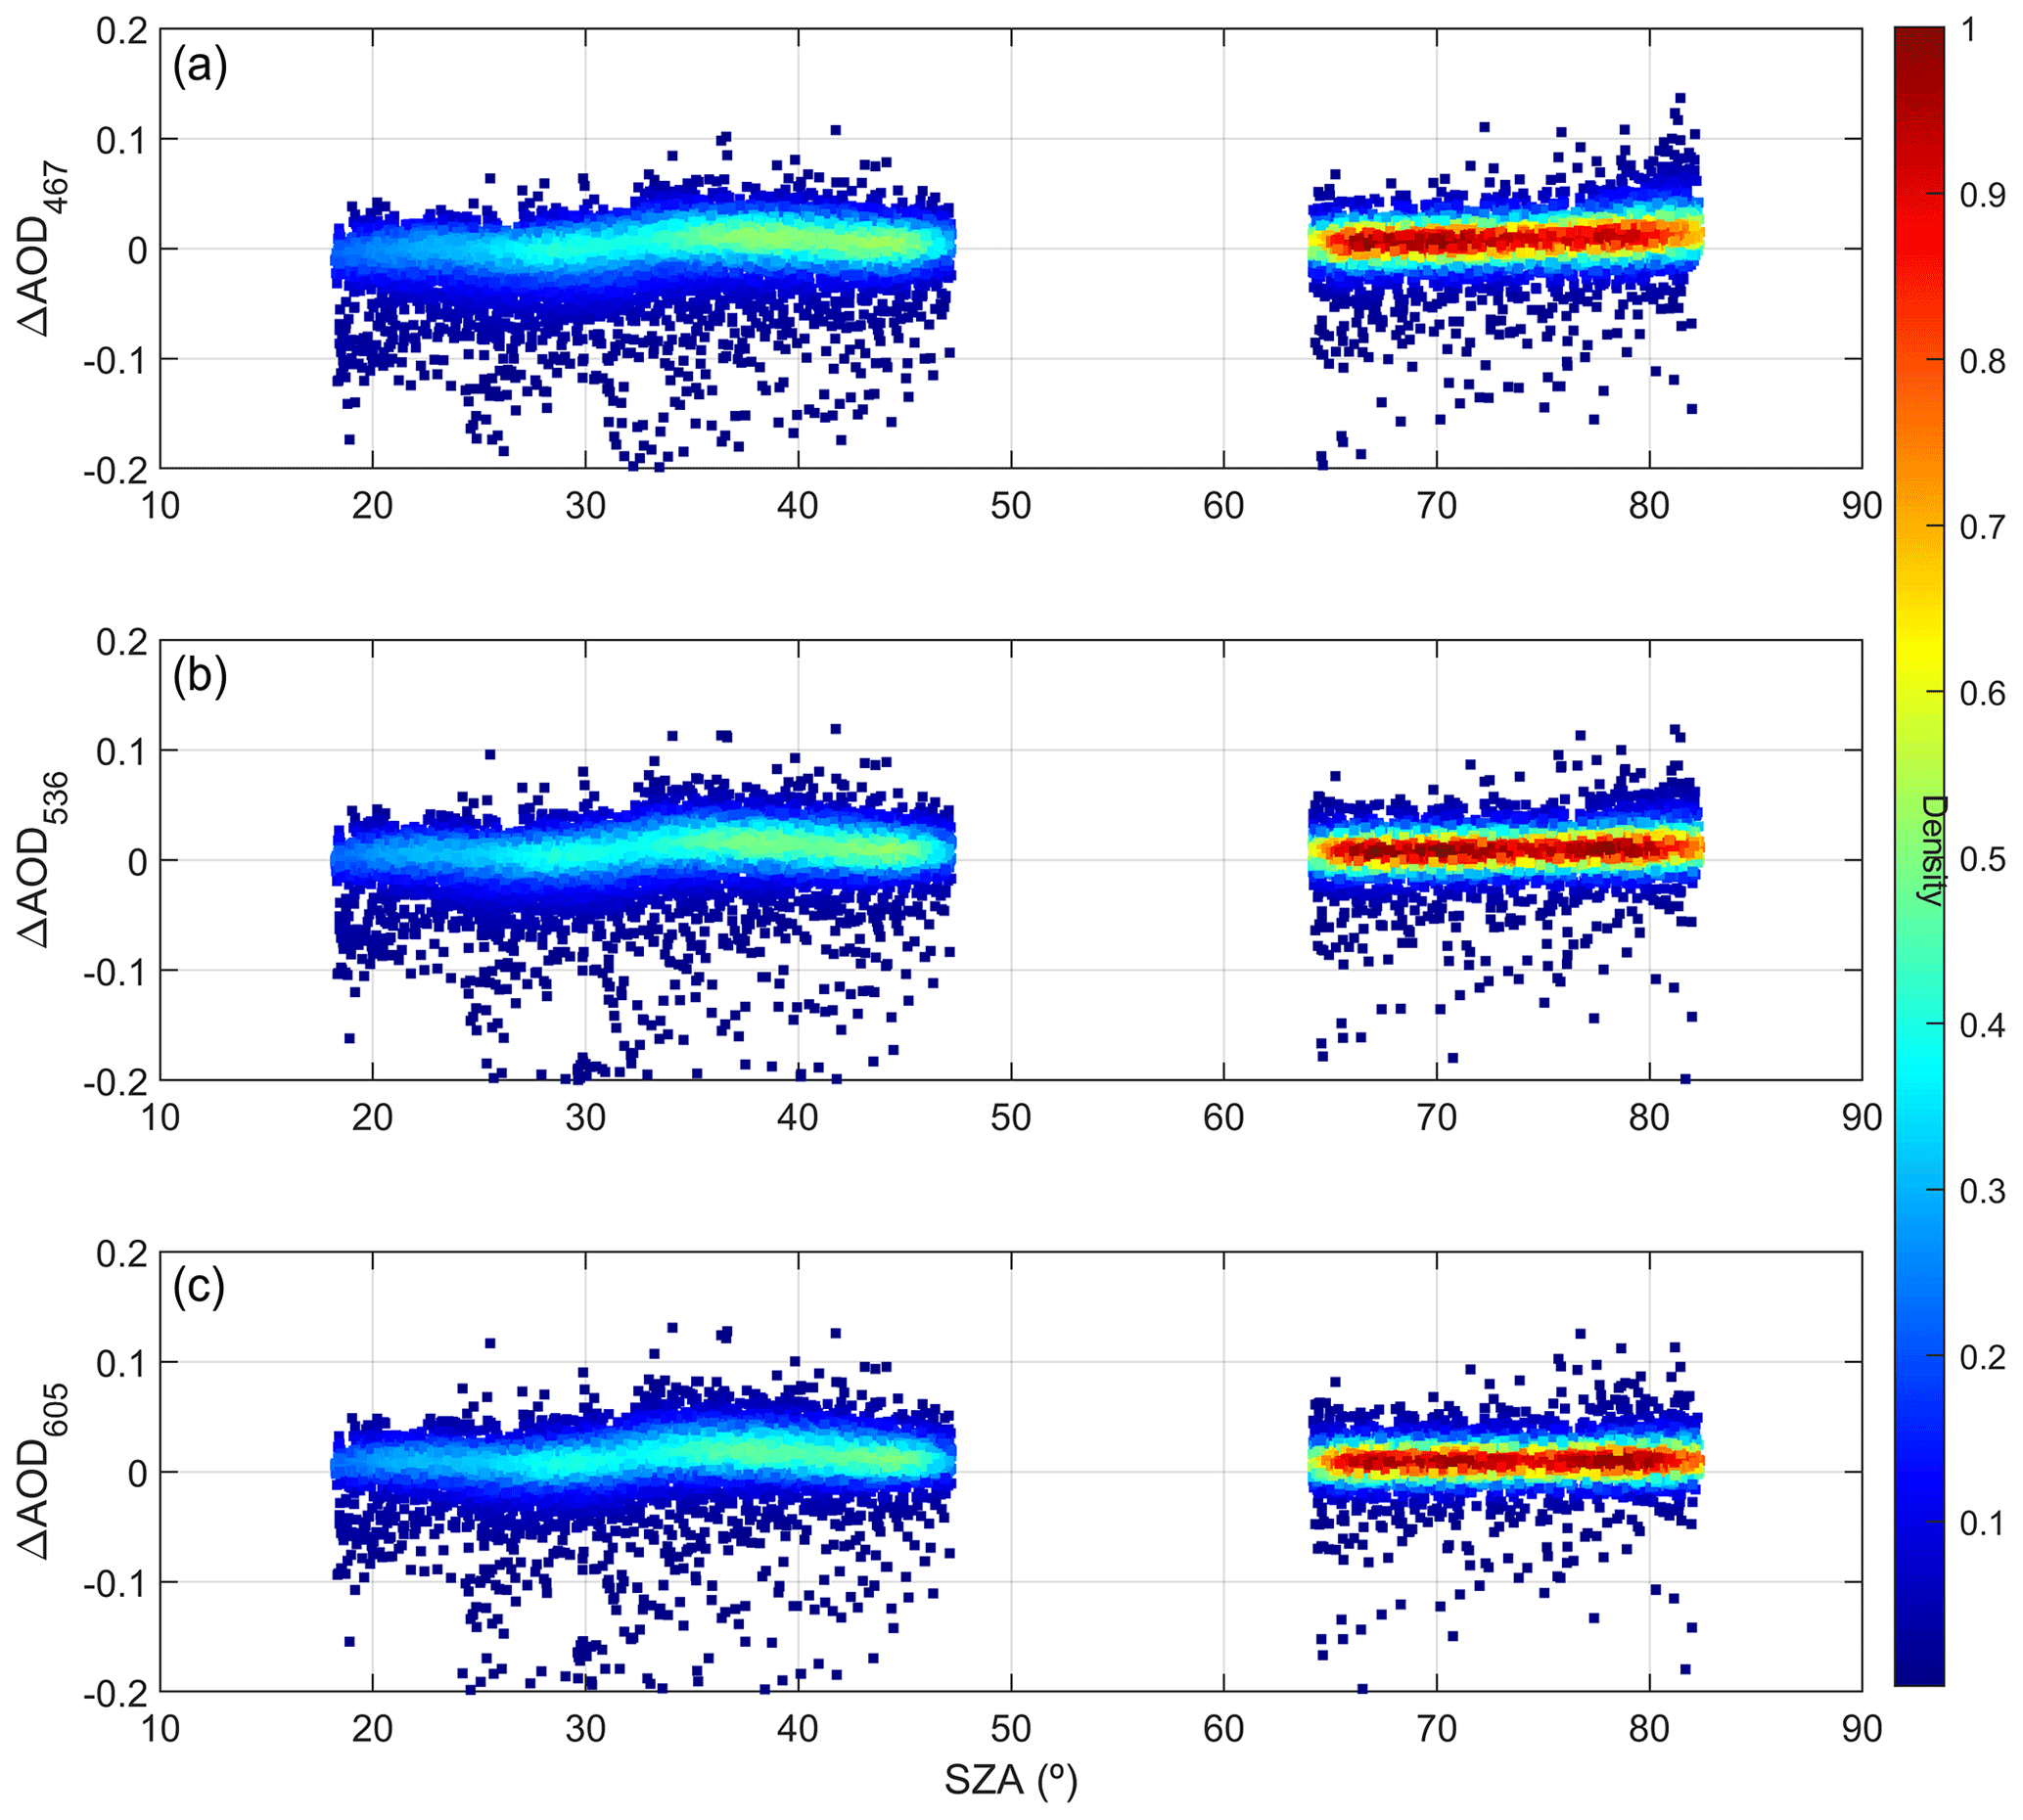
Figure 11The Δ differences in the aerosol optical depth (AOD) retrieved by GRASP with the single-pixel approach (GRASP-CAM) and those obtained by AERONET at 467 nm (a), 536 nm (b) and 605 nm (c) as a function of the solar zenith angle (SZA). The colour legend represents the density of data points.
The accuracy and precision of GRASP-CAM AOD depends on the aerosol load, but they could also depend on the SZA and the availability of input data as pointed out in Sect. 3. Figure 11 shows the AOD differences between GRASP-CAM and AERONET for the three wavelengths as a function of SZA. The results are similar for the three wavelengths. The mode of these differences is around zero for SZA values below 47.2∘; however, for higher SZA values this mode increases from about 0 to about 0.01 (overestimation). A similar overestimation is observed in the middle of the 30–40∘ SZA range. Regarding data outliers, they are most frequent for low SZA values, reaching negative values (underestimation). The lack of data between 47.2 and 64.2∘ is caused by the requirement of at least one NSR measurement with a scattering angle lower than or equal to 14∘ in the input. Figure S32 shows the same differences as Fig. 11 but including retrievals without scattering angles ≤14∘. It must be taken into account that the addition of these retrievals modified the number of retrievals passing the cloud-screening criteria, and hence, some data appearing in Fig. 11 do not appear in Fig. S32 and vice-versa. The most important result is that the AOD from GRASP-CAM clearly overestimates AERONET in the 47.2–64.2∘ SZA range (where there is a lack of scattering angles ≤14∘); it confirms the need of rejecting the retrievals without, at least, one NSR measurements with a scattering angle ≤14∘.
4.1.2 Other aerosol properties
The previous subsection is focused on the AOD performance from the GRASP-CAM retrievals, but there are more aerosol properties of interest in these retrievals. Figure 12 shows the time series of GRASP-CAM- and AERONET-retrieved size distribution parameters of the fine and coarse modes for the same period shown in Fig. 8. It is important to remark that these other aerosol properties retrieved by AERONET are obtained by inverting AOD plus sky radiance measurements, and these sky measurements are less frequent (and need more time to be measured) than the AOD ones. Thus, the amount of data retrieved by GRASP-CAM is higher than AERONET, GRASP-CAM values being available usually each 5 min. In general, the size distribution parameters retrieved by GRASP-CAM present a noisier behaviour than AERONET values, especially for the coarse mode. GRASP-CAM and AERONET values look well correlated and with similar values for VCF, VCC, and RF parameters but not for the rest.
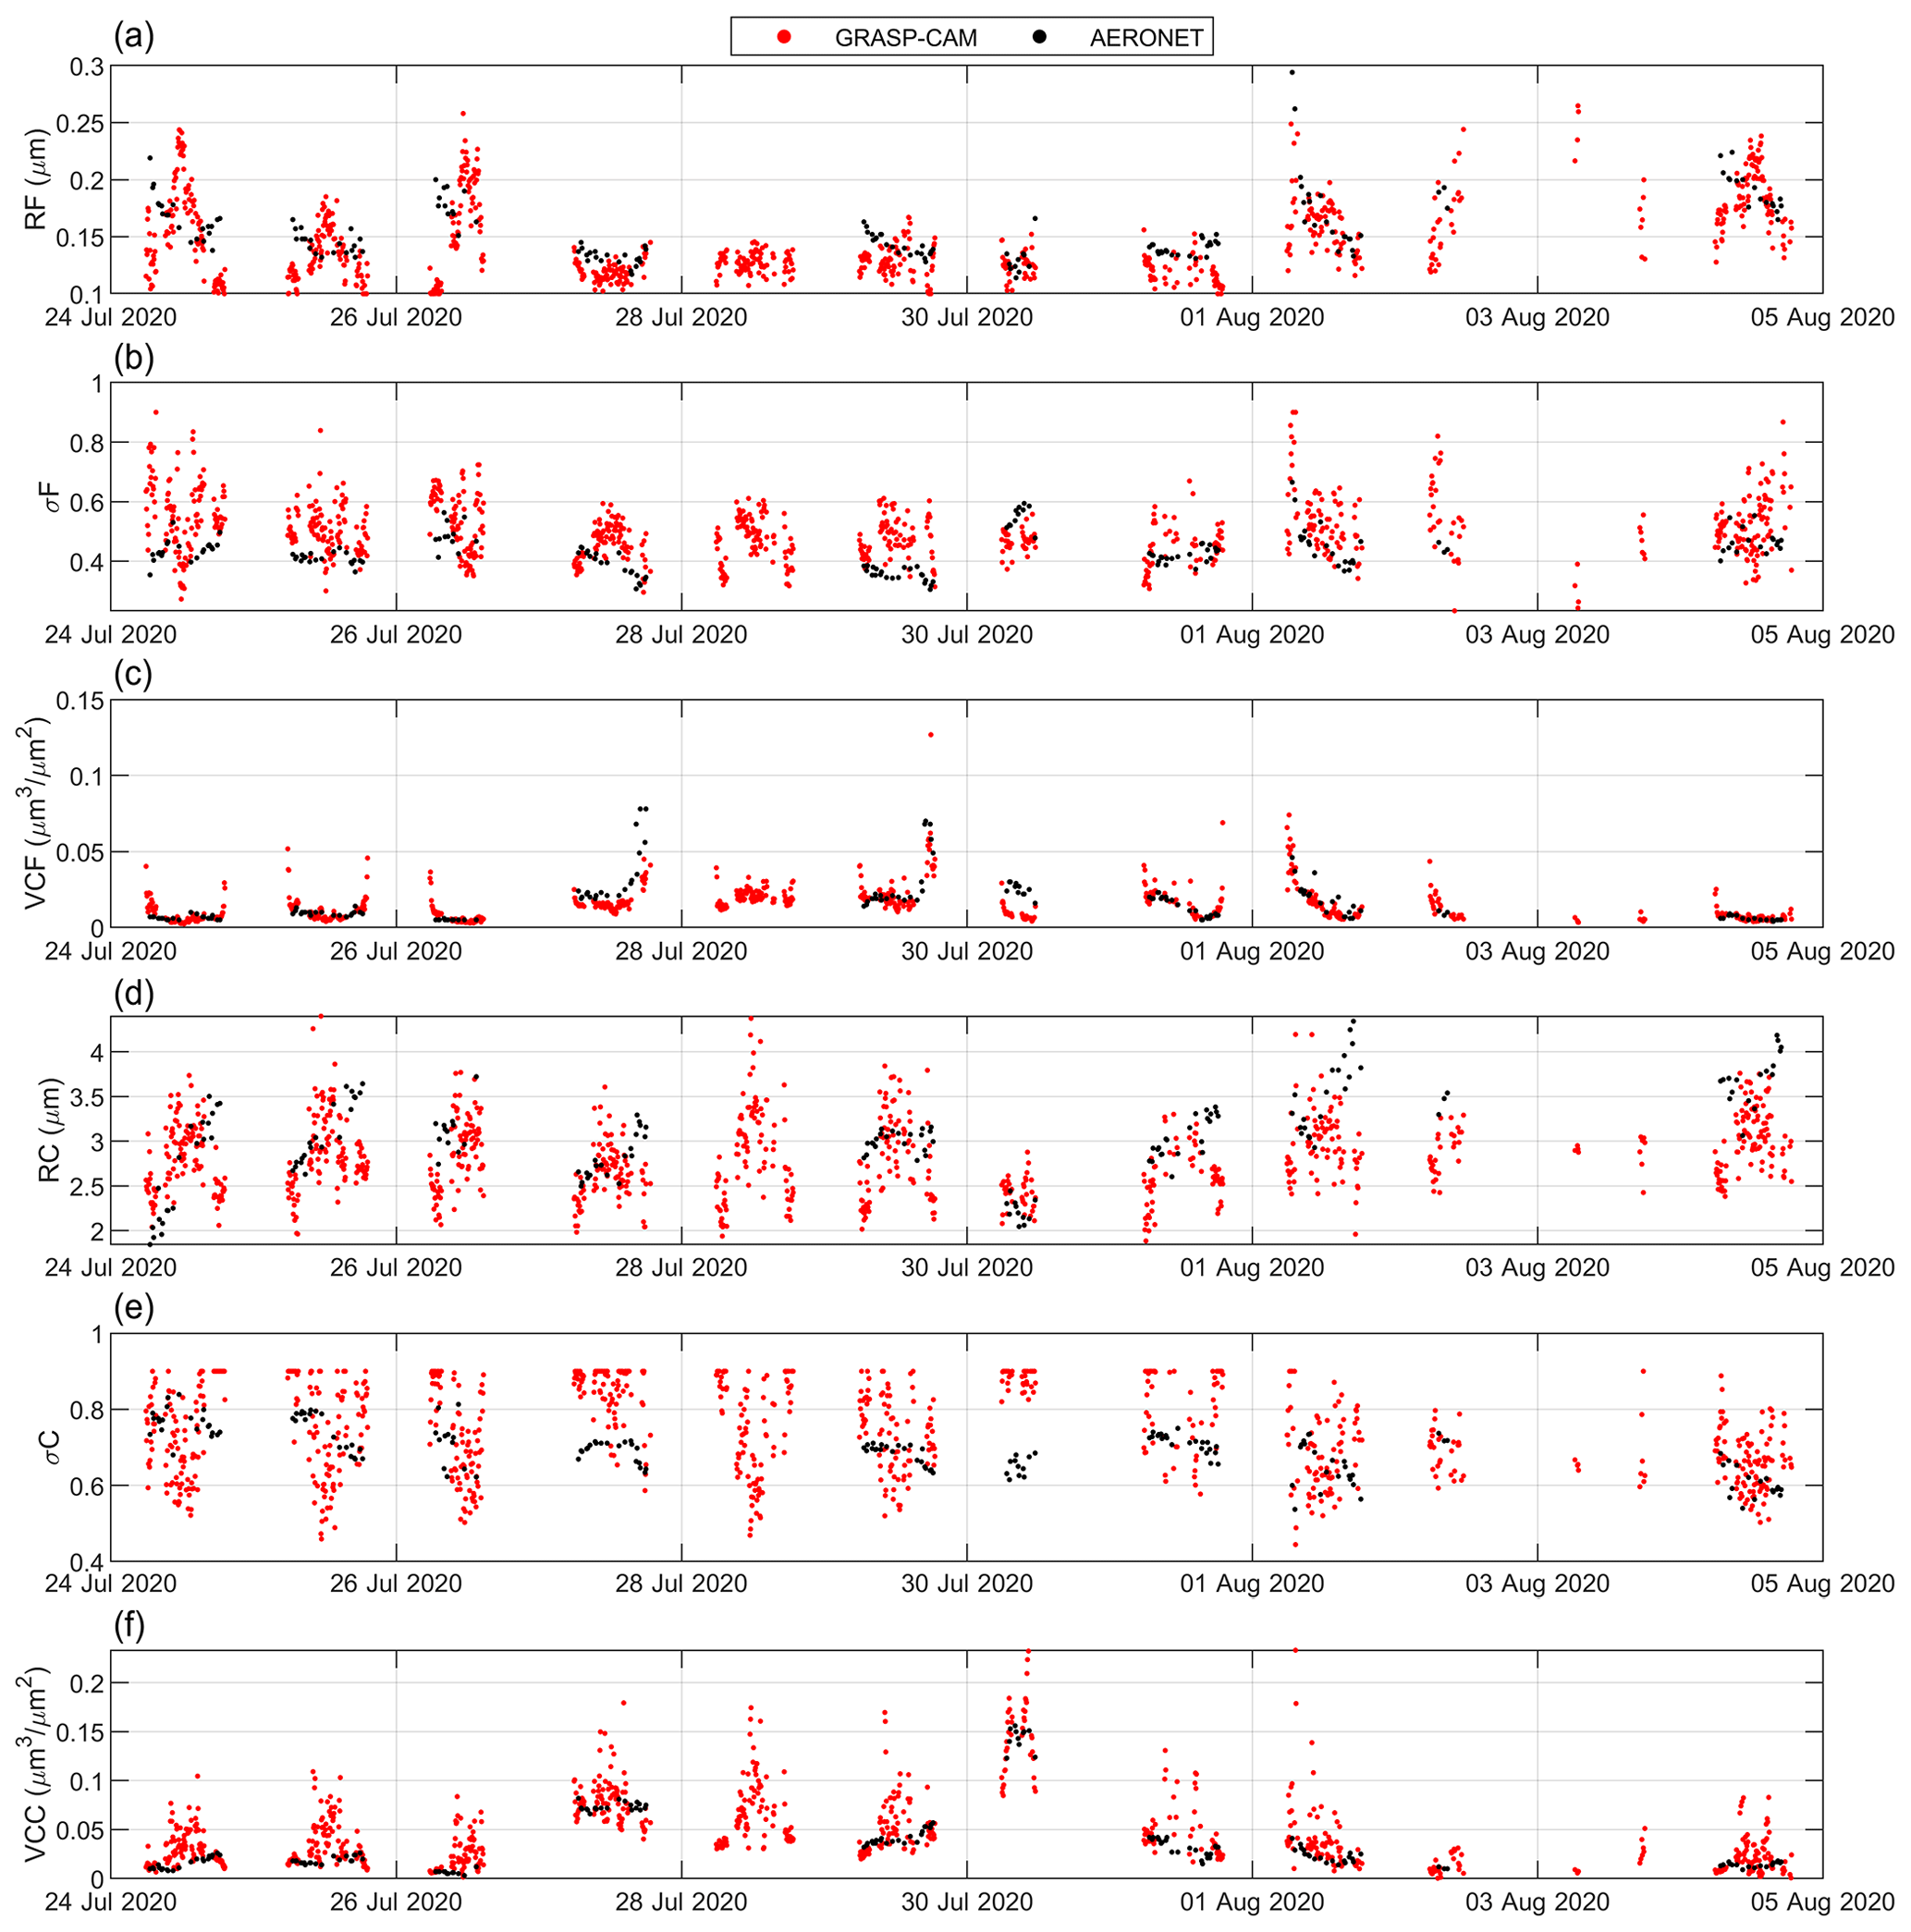
Figure 12Volume median radius, R, standard deviation of log-normal distribution, σ, and aerosol volume concentration, VC, for fine (F; a–c) and coarse (C; d–f) modes of the aerosol size distribution retrieved by GRASP with the single-pixel approach (GRASP-CAM) and by AERONET at Valladolid from 24 July to 4 August 2020.
The mentioned correlation between GRASP-CAM and AERONET size distribution parameters can be better observed in Fig. 13, which also presents the total aerosol volume concentration (VCT). This figure shows the density scatter plots of the GRASP-CAM values as a function of the AERONET ones. The GRASP-CAM–AERONET data pairs have been matched up by pairing the AERONET retrievals with the closest GRASP-CAM data within ±2.5 min. In addition, AERONET retrievals with AOD at 440 nm below 0.05 have been discarded in order to have a minimum of aerosol load for the retrieval. A total of 1853 data pairs have been obtained. The highest correlations between GRASP-CAM and AERONET appear for VCT and VCC, both with r2 above 0.5, and for VCF and RF, with r2 of 0.38 and 0.35, respectively. The largest lack of correlation is on the σC parameter, where GRASP-CAM frequently provides the value of 0.9, while AERONET provides more variation in values, with 0.7 being the most frequent. Likely, this worse performance of the coarse mode retrieval could be partially related to the lack of scattering angles below 10∘ in the GRASP-CAM input since it has been observed that these lowest angles contain more information about the coarse mode microphysics. A low sensitivity of GRASP-CAM to retrieve RC and σC, the parameters with the lowest correlation in Fig. 13, was also observed in Sect. 3.2.2.
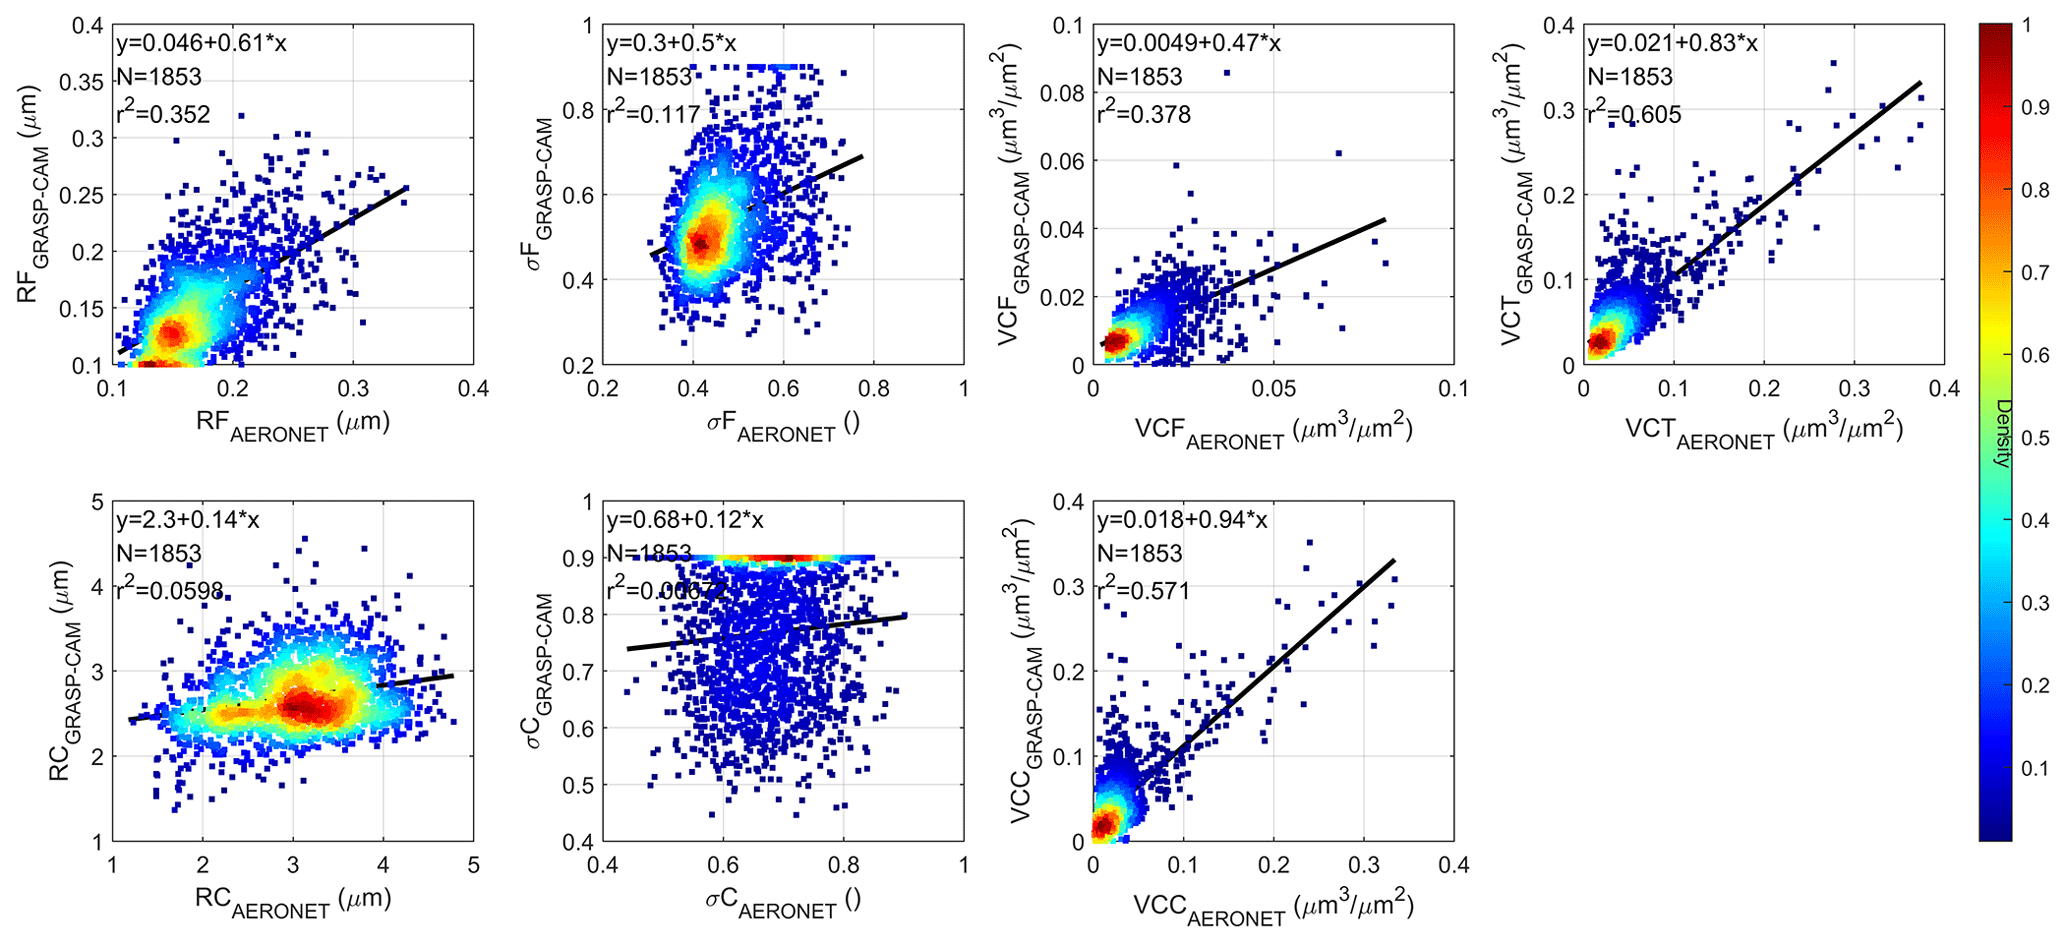
Figure 13Density scatter plots of the aerosol size distribution properties retrieved by GRASP in single-pixel approach (GRASP-CAM) versus the ones retrieved by AERONET; linear fit (black line), its equation and the determination coefficient (r2) are also shown. These size distribution properties are volume median radius of fine (RF) and coarse (RC) modes, standard deviation of log-normal distribution for fine (σF) and coarse (σC) modes, and aerosol volume concentration for fine (VCF) and coarse (VCC) modes and the total value (VCT).
The lack of correlation does not mean that GRASP-CAM products are not accurate. To estimate the accuracy and precision of these GRASP-CAM parameters, the frequency distributions of the differences between GRASP-CAM and AERONET on the aerosol parameters of Fig. 13 have been calculated and shown in Fig. 14, in addition to their statistical estimators. Regarding volume median radius, an intensive aerosol property, both fine and coarse modes present a symmetric distribution with a Gaussian behaviour, the median ± SD being equal to and µm for the fine and coarse modes, respectively. GRASP-CAM slightly underestimates the aerosol radius for both fine and coarse modes, the precision being better for the fine mode. Regarding σF and σC, both GRASP-CAM intensive properties present similar results, with an overestimation of about 0.07–0.10 and a precision given by the SD of 0.12–0.13. The distributions of VCF and VCC from GRASP-CAM are similar, both centred around zero, but with a long negative and positive tail for fine and coarse modes, respectively. It means that GRASP-CAM overestimates/underestimates the coarse/fine volume concentration for high aerosol concentrations, in agreement with Fig. 13. The precision of these parameters is about 0.007 and 0.03 µm3 µm−2 for fine and coarse modes, respectively; the results for the total concentration are similar to those obtained for VCC. In general, the accuracy and precision obtained in the size distribution parameters from GRASP-CAM compared with AERONET products are worse than the ones obtained by comparison with synthetic data (Sect. 3.2, see also Fig. S18 and S19) except for the aerosol volume concentration. This can be caused, at least in part, by the uncertainty of the AERONET retrievals used as reference.
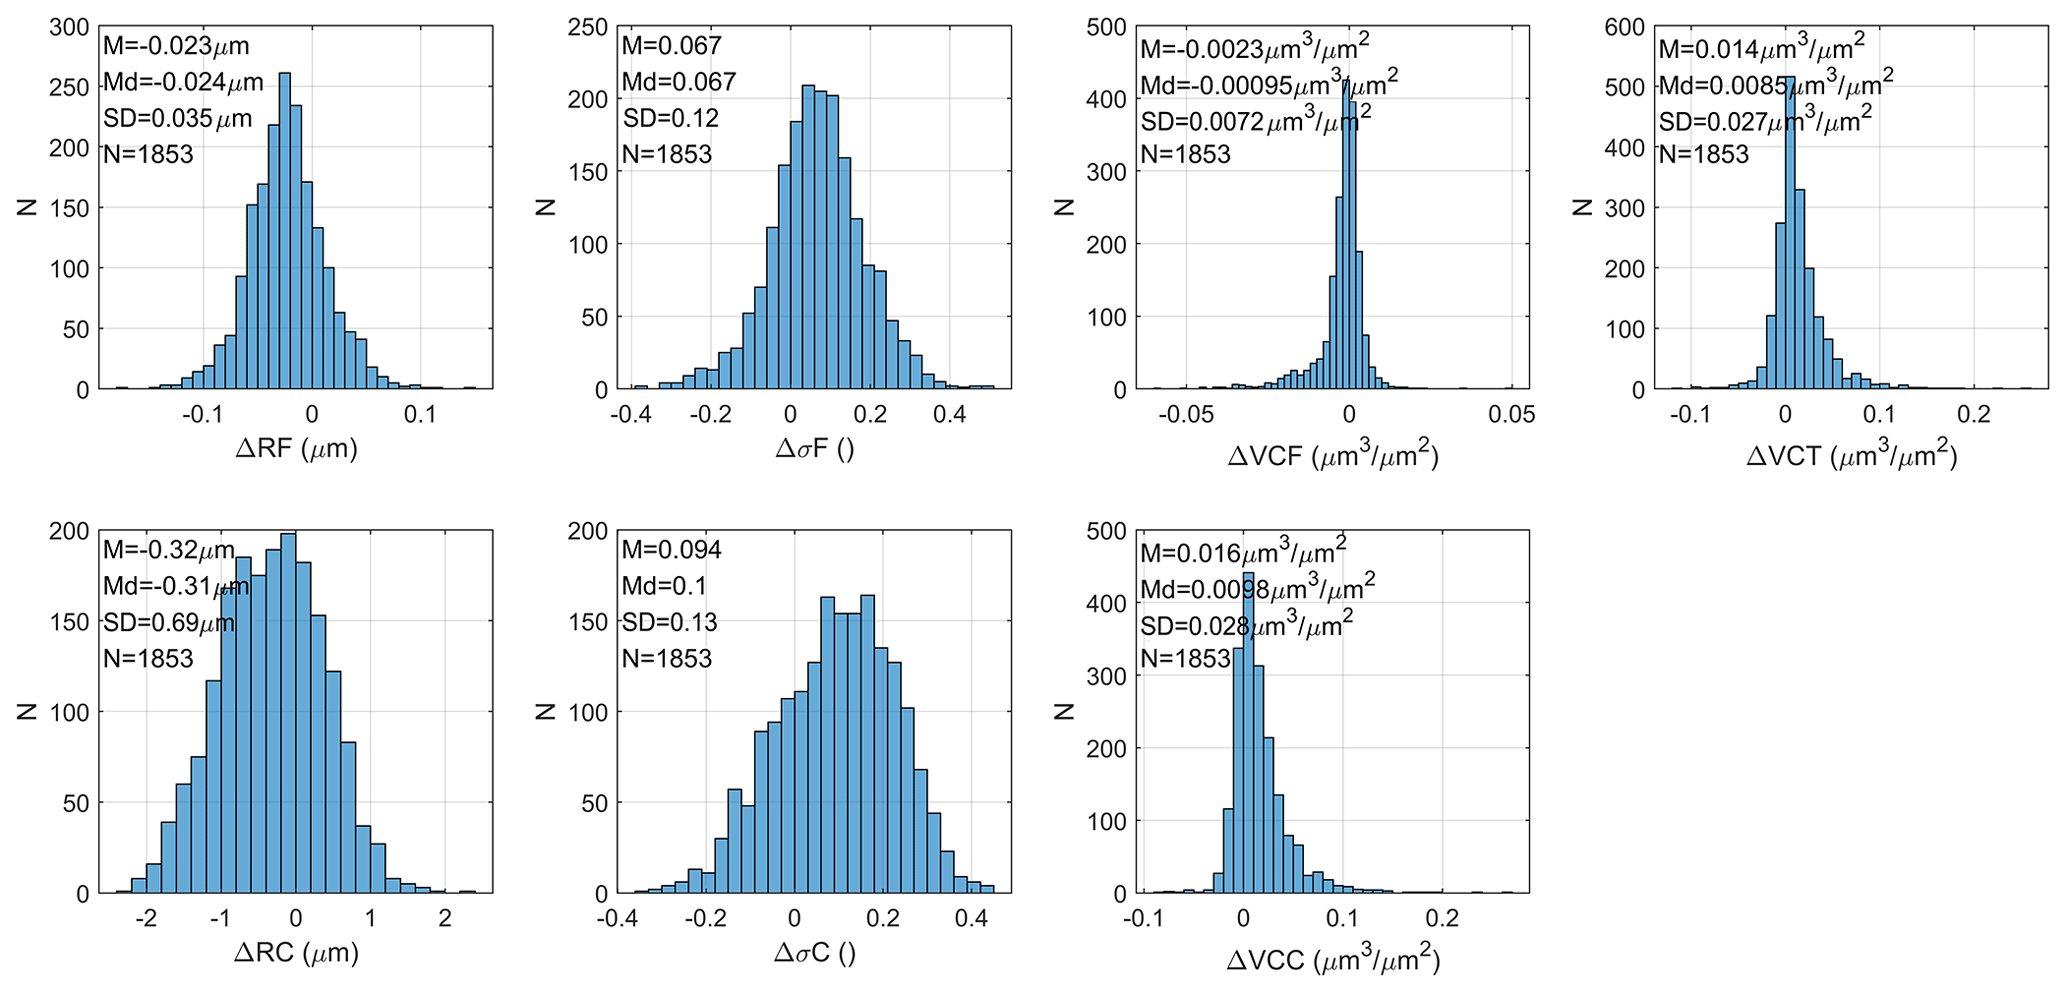
Figure 14Frequency histograms of the Δ differences in the aerosol size distribution properties retrieved by GRASP with the single-pixel approach (GRASP-CAM) and the ones retrieved by AERONET. The mean (M), median (Md) and standard deviation (SD) of these differences are also shown. These size distribution properties are volume median radius of fine (RF) and coarse (RC) modes, standard deviation of log-normal distribution for fine (σF) and coarse (σC) modes, and aerosol volume concentration for fine (VCF) and coarse (VCC) modes and the total value (VCT).
The rest of the retrieved parameters, RRI and SPH from GRASP-CAM and AERONET for the analysed period of Fig. 8, are provided in Fig. S33. These parameters retrieved by GRASP-CAM look noisy compared to AERONET ones. It points out that GRASP-CAM could be not too sensitive to these parameters, and likely they should not be used for studies requiring more accuracy. Anyway, these last results must be taken with care since the quality of some of these AERONET products is only assured for high AOD values.
4.2 Multi-pixel approach
The GRASP-CAM method is based on stand-alone retrievals, and occasionally the input data do not contain enough information on the aerosol, especially in a range of sun positions due to technical problems of the all-sky camera (dome reflections). One way to add more information at each single retrieval is to use information from the temporal adjacent measurements or retrievals, which is the idea behind the temporal multi-pixel approach (GRASPmp-CAM; see Sect. 2.2). Information from the measurements taken at one time is transferred to other times with this approach; in addition, it provides more stability to all the retrievals of 1 d since they are linked so that the retrieved aerosol properties cannot vary abruptly between consecutive retrievals. This section is focused, same as Sect. 4.1, on the analysis of the performance of the aerosol properties derived by NSR camera measurements but retrieved by GRASPmp-CAM instead of GRASP-CAM.
The quality-assurance criteria for input measurements for GRASPmp-CAM are slightly different than those for GRASP-CAM. A GRASPmp-CAM retrieval is done with all NSR sequences of 1 d, each one with at least six cloud-free NSR measurements per wavelength. Therefore, for GRASPmp-CAM, it is only demanded that one of the available NSR sequences of a full day must contain one NSR measurement with a scattering angle ≤14∘ and another one above 80∘. These criteria are demanded for all single NSR sequences with GRASP-CAM since every NSR sequence is inverted alone; but in GRASPmp-CAM the information of the measurements with a scattering angle ≤14∘ or >80∘ in one NSR sequence is transferred to the other sequences within the same day. Moreover, it allows for retrievals with SZA values between 47.2 and 64.2∘. The NSR sequences taken with SZA > 82.5∘ have not been added in the daily GRASPmp-CAM retrieval since the sun is close to horizon and these angles are not contemplated in the GRASP-CAM.
Once the input measurements are ready for each day, GRASP has been run with the GRASPmp-CAM configuration, which provides as a result the aerosol properties (AOD, size distribution, etc.) for each NSR sequence used in the input, i.e. for each measurement time. A total of 35 615 time inversions are available from 11 July 2018 to 15 September 2020 at Valladolid. Each retrieval also provides the individual residual at each time (or used NSR sequence) between the input measurements and the observations reproduced by the retrieved aerosol properties. These residual values are also used to remove individual non-convergent retrievals, applying the same criteria as in the GRASP-CAM method (see Sect. 4.1). Up to 32 621 inversions pass these convergence criteria. Finally, the same cloud-screening criteria of Sect. 4.1, based on AOD, have been applied to remove cloud-contaminated data. The final amount of individual cloud-free aerosol retrievals obtained by GRASPmp-CAM is 32 062. Cloud-screening criteria remove less data for GRASPmp-CAM than for GRASP-CAM because adjacent retrievals, and hence aerosol properties, of GRASPmp-CAM are constrained to a smooth temporal variation; therefore some cloud-screening criteria, like the one based on time variation in AOD, are not as frequently triggered.
4.2.1 Aerosol optical depth
Figure 15 shows the time series of AOD, retrieved by GRASPmp-CAM, at Valladolid for the same time period as that in Fig. 8 (Fig. S34 shows the same AOD data but for the full measurements period). These AOD values from GRASPmp-CAM are similar to the ones obtained by GRASP-CAM (Fig. 8), but their time evolution is less noisy; therefore, the AOD values retrieved by GRASPmp-CAM are closer to the AERONET values.
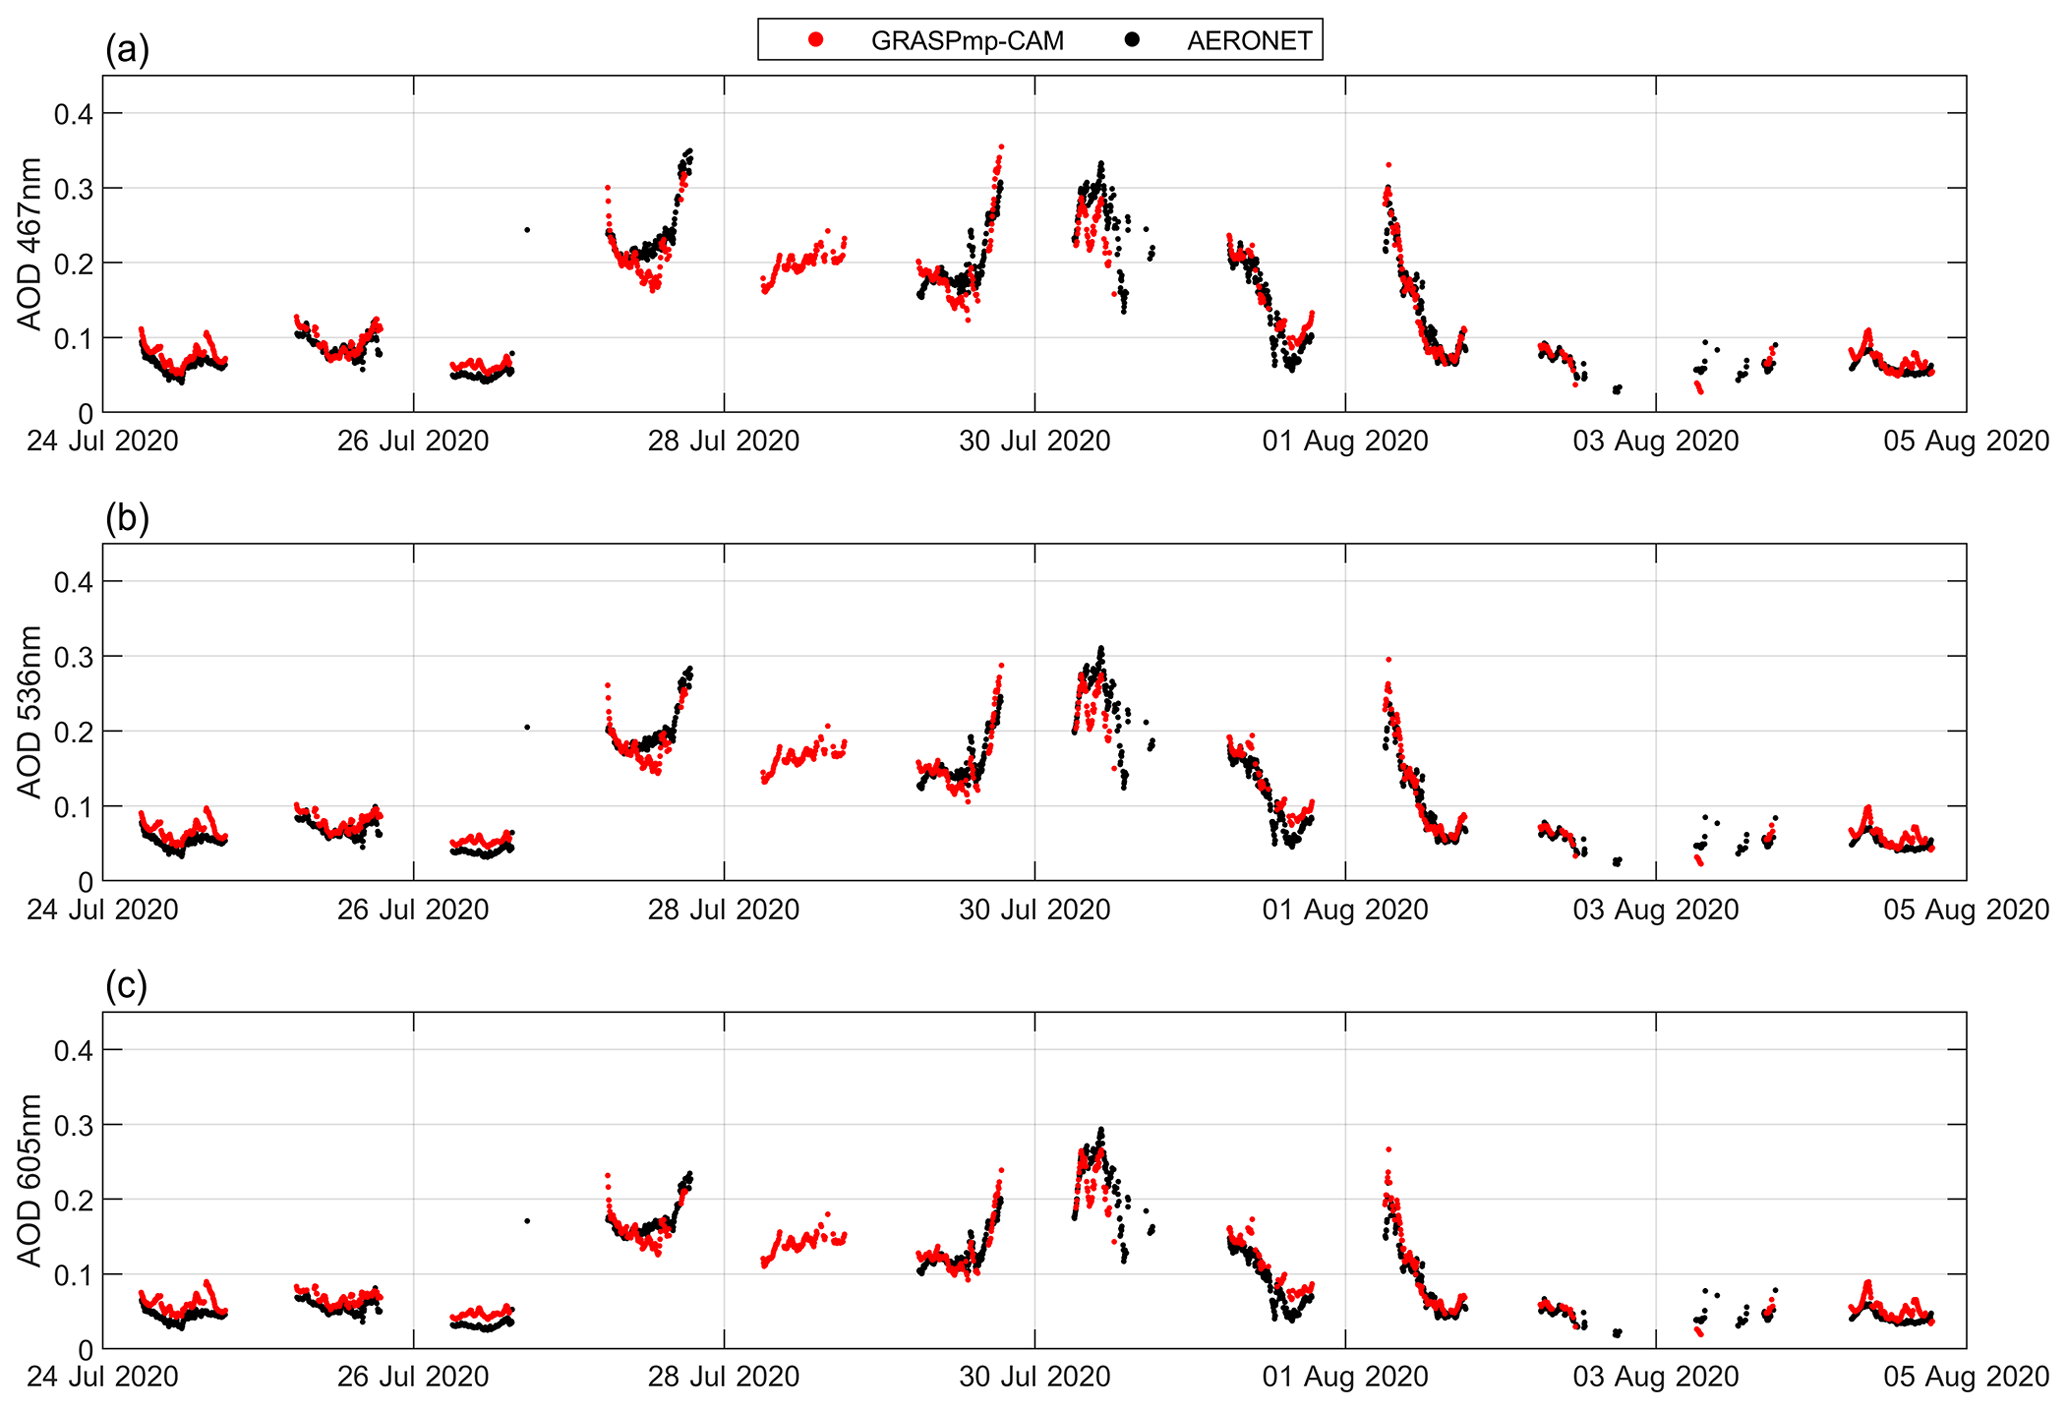
Figure 15Aerosol optical depth (AOD) at 467 nm (a), 536 nm (b) and 605 nm (c) retrieved by GRASP with the multi-pixel approach (GRASPmp-CAM) and by AERONET at Valladolid from 24 July to 4 August 2020.
The AOD values, and the rest of aerosol properties, obtained from GRASPmp-CAM with SZA between 47.2 and 64.2∘ are not a priori discarded like in GRASP-CAM. In this sense, Fig. 16 shows the AOD differences between GRASPmp-CAM and AERONET as a function of SZA, same as in Fig. 11 but including the mentioned SZA interval. The results are similar to those for GRASP-CAM for the SZA values out of the 47.2–64.2∘ range but with some additional outliers for low SZA values that overestimate the AOD from AERONET. AOD from GRASP-CAM overestimates AERONET values in the 47.2–64.2∘ SZA range (see Fig. S32) due to the lack of information from low scattering angles, and hence, these data were rejected; however, most of the AOD differences between GRASPmp-CAM and AERONET are close to zero, as observed in Fig. 16, even when several data outliers overestimate the AERONET values. It is in agreement with the multi-pixel idea of transferring aerosol information from pixels (observations) with more information (with low scattering angle measurement) to other pixels with less information (without low scattering angles, as is the case in the 47.2–64.2∘ SZA range).
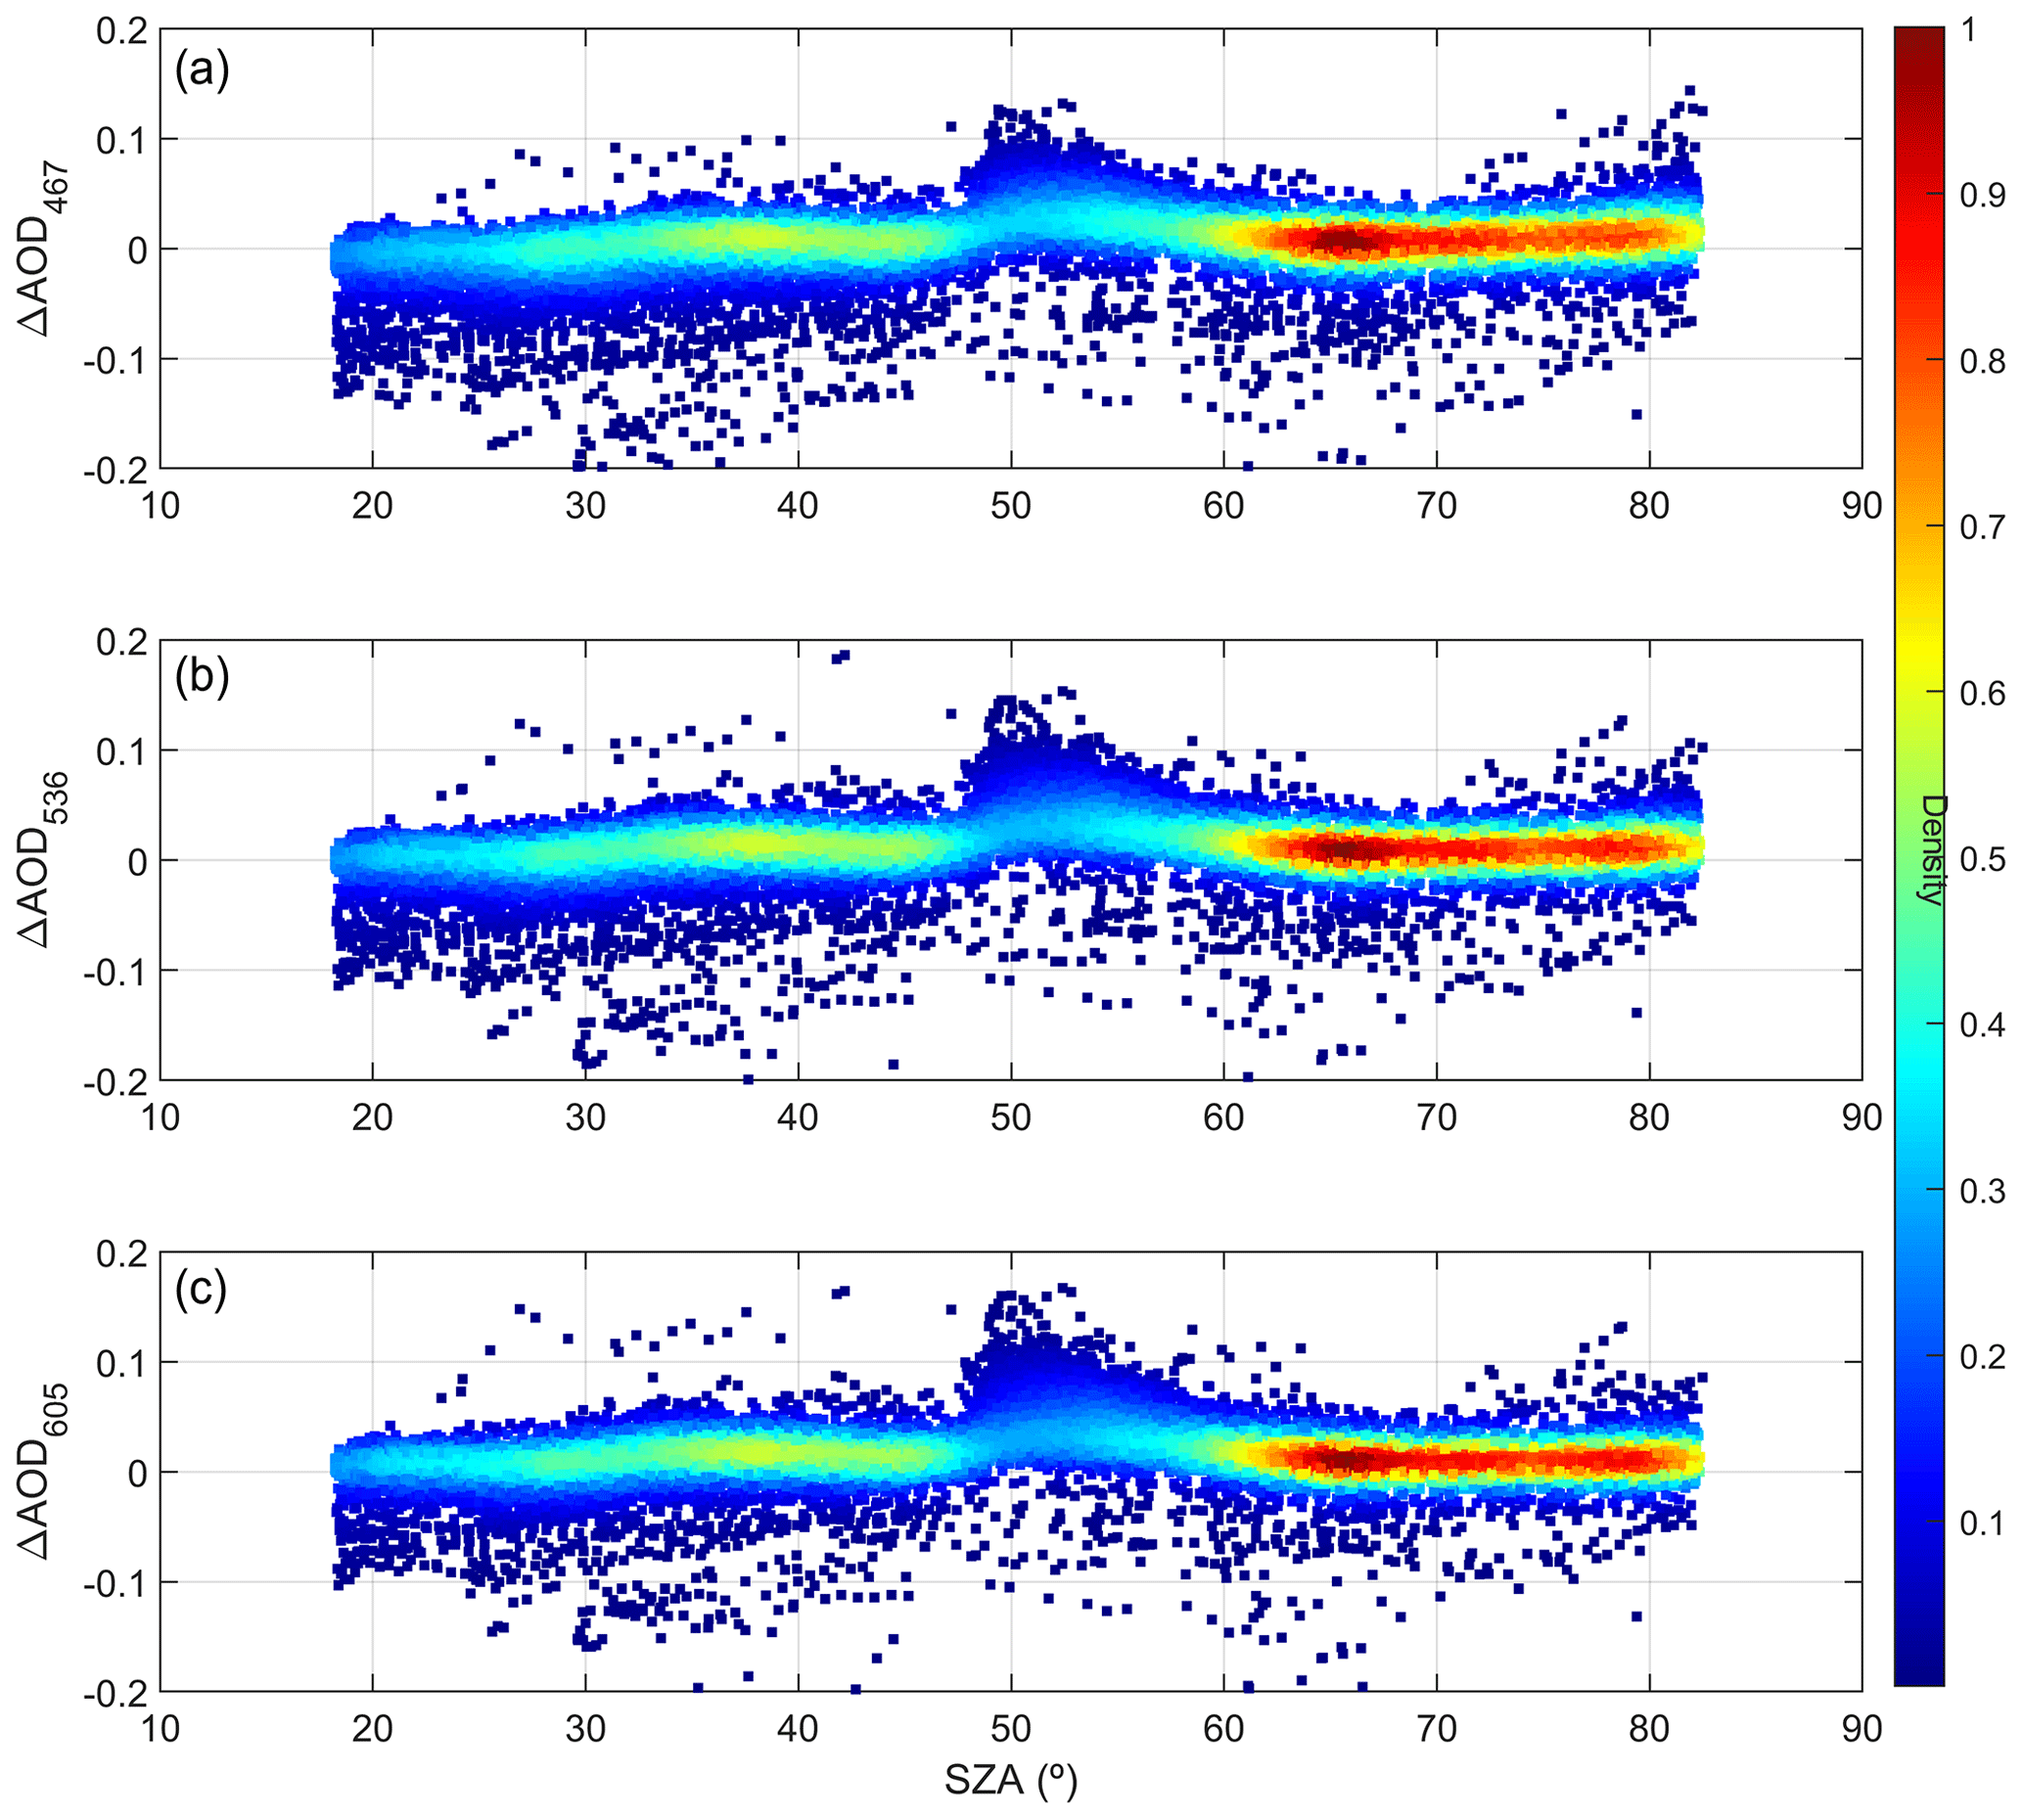
Figure 16The Δ differences in the aerosol optical depth (AOD) retrieved by GRASP with the multi-pixel approach (GRASPmp-CAM) and those obtained by AERONET at 467 nm (a), 536 nm (b) and 605 nm (c) as a function of the solar zenith angle (SZA). The colour legend represents the density of the plotted data points.
Figure 17 presents, for the three camera wavelengths, the density scatter plots for GRASPmp-CAM versus AERONET and the frequency distribution of their differences. The amount of available data (25 008) is much higher than for GRASP-CAM (see Fig. 9), which is partially caused by the addition of data on the 47.2–64.2∘ SZA range. The AOD underestimation of GRASPmp-CAM to the highest AERONET AOD values is clearly shown. The determination coefficient is a bit lower than for GRASP-CAM, especially for longer wavelengths. Regarding the Md and SD of the AOD differences from AERONET, the values for GRASPmp-CAM are similar to the ones obtained with the single-pixel approach. The mentioned results of GRASP-CAM with the single-pixel approach were obtained without data in the 47.2–64.2∘ SZA range; therefore, for a more proper comparison, the same values of Fig. 17 have been represented in Fig. S35, i.e. excluding the mentioned SZA range. As a result, the amount of available data is still higher than for GRASP-CAM; the correlation, with r2 values about 0.88, is a bit higher than for GRASP-CAM, and the accuracy and precision are similar, with Md values between 0.005 and 0.010 and SD between 0.024 and 0.030.

Figure 17(a–c) Density scatter plots of the aerosol optical depth (AOD) retrieved by GRASP with the multi-pixel approach (GRASPmp-CAM) versus the AOD from AERONET at 467 nm (a), 536 nm (b) and 605 nm (c); linear fit (black line) and its equation and the determination coefficient (r2) are also shown. (d–f) Frequency histograms of the differences in AOD from GRASPmp-CAM and AERONET at 467 nm (d), 536 nm (e) and 605 nm (f). The mean (M), median (Md) and standard deviation (SD) of these differences are also shown.
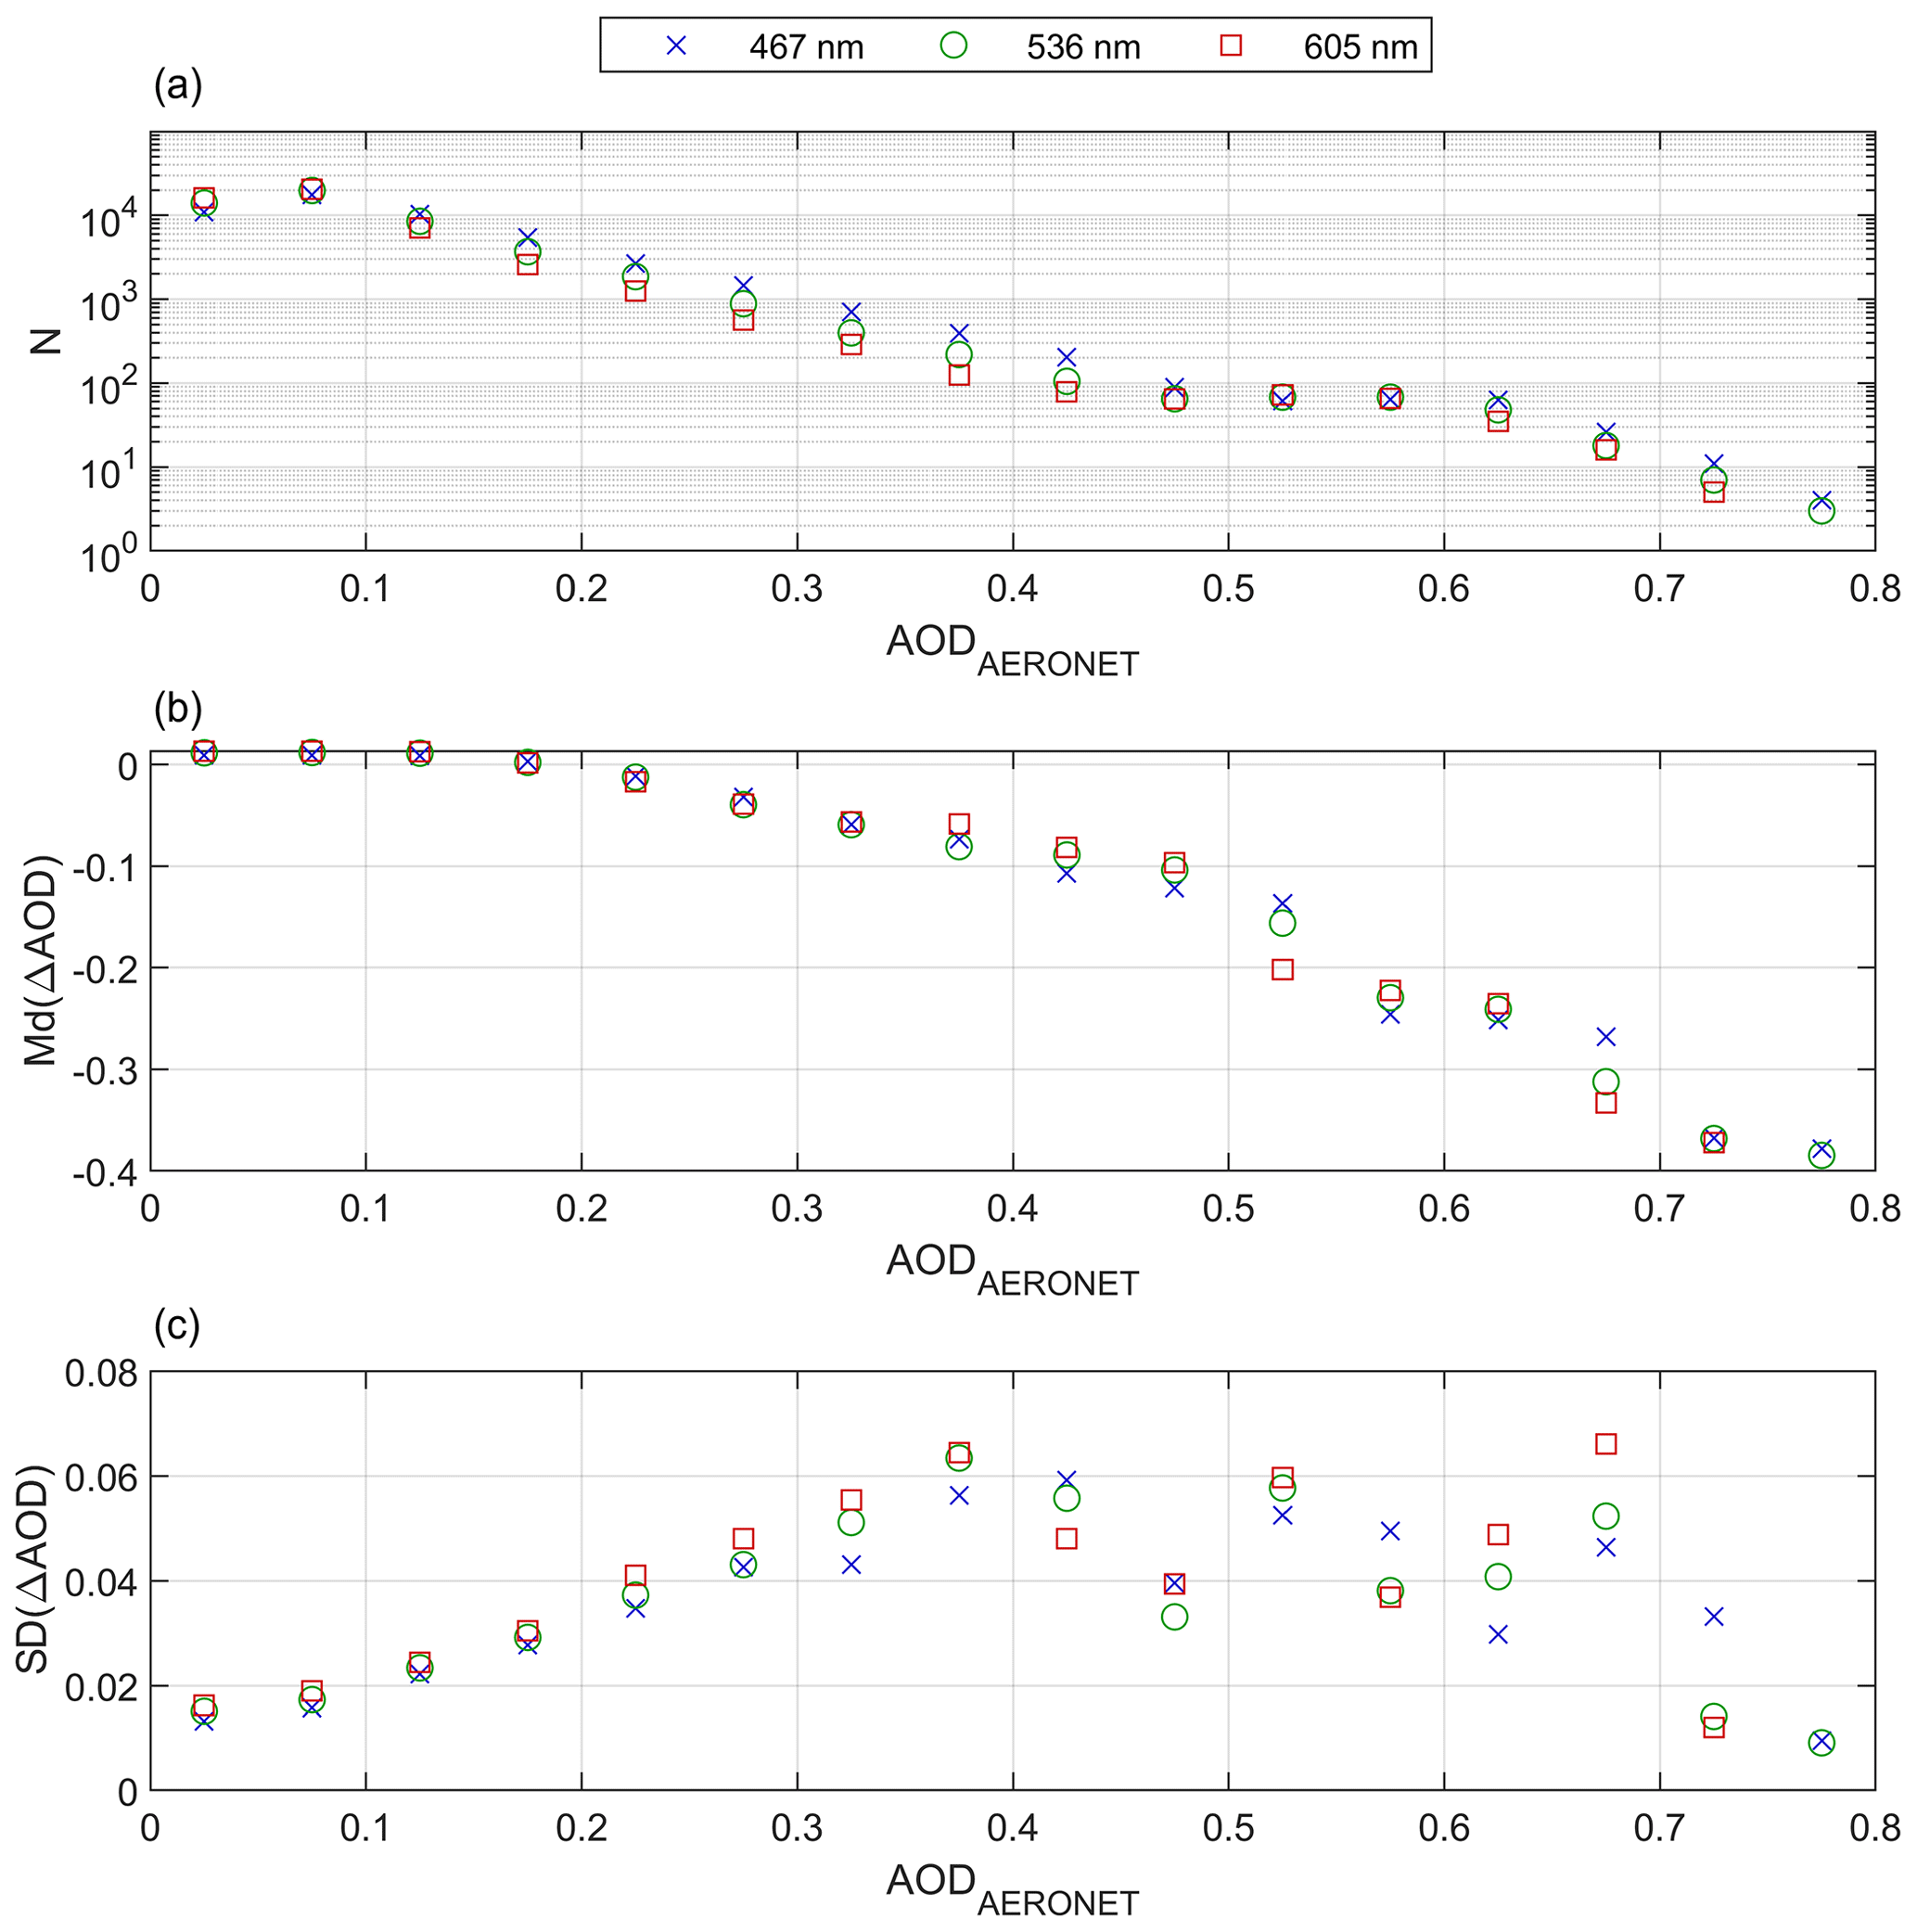
Figure 18Median (Md; b) and standard deviation (SD; c) of the Δ differences in the aerosol optical depth (AOD) retrieved by GRASP with the multi-pixel approach (GRASPmp-CAM) and those obtained by AERONET at 467, 536 and 605 nm for different AOD bins. The available number of ΔAOD data (N) per AOD bin is also shown in (a) for the three wavelengths.
In a similar way to that in Sect. 4.1.1, the GRASPmp-CAM and AERONET AOD differences have been calculated for various AOD bins in order to study the dependence of accuracy and precision on AOD. Figure 18 shows the amount of data per AOD bin and the Md and SD of the AOD differences for each wavelength. The amount of data is, as expected, higher for GRASPmp-CAM than for GRASP-CAM (see Fig. 10). The dependence on AOD of the Md and SD from GRASPmp-CAM and GRASP-CAM is similar, but GRASPmp-CAM shows slightly lower absolute values than GRASP-CAM in both statistical estimators. Md is between −0.02 and 0.01 and SD below 0.04 for AOD below 0.25; the Md goes from −0.04 to as AOD increases from 0.25 to 0.5; the SD in this interval is about 0.04 and 0.06. The accuracy and precision of GRASPmp-CAM AOD is approximately equal if data in the 47.2–64.2∘ SZA range are not considered in the analysis (Fig. S36), but it presents better accuracy and precision for high AOD values.
4.2.2 Other aerosol properties
The time series of size distribution parameters retrieved by GRASPmp-CAM are shown in Fig. 19 from 24 July to 4 August 2020 at Valladolid. The same as in AOD, the time series of size distribution parameters is smoother and looks less noisy than the values retrieved by the single-pixel approach of GRASP-CAM (see Fig. 12).
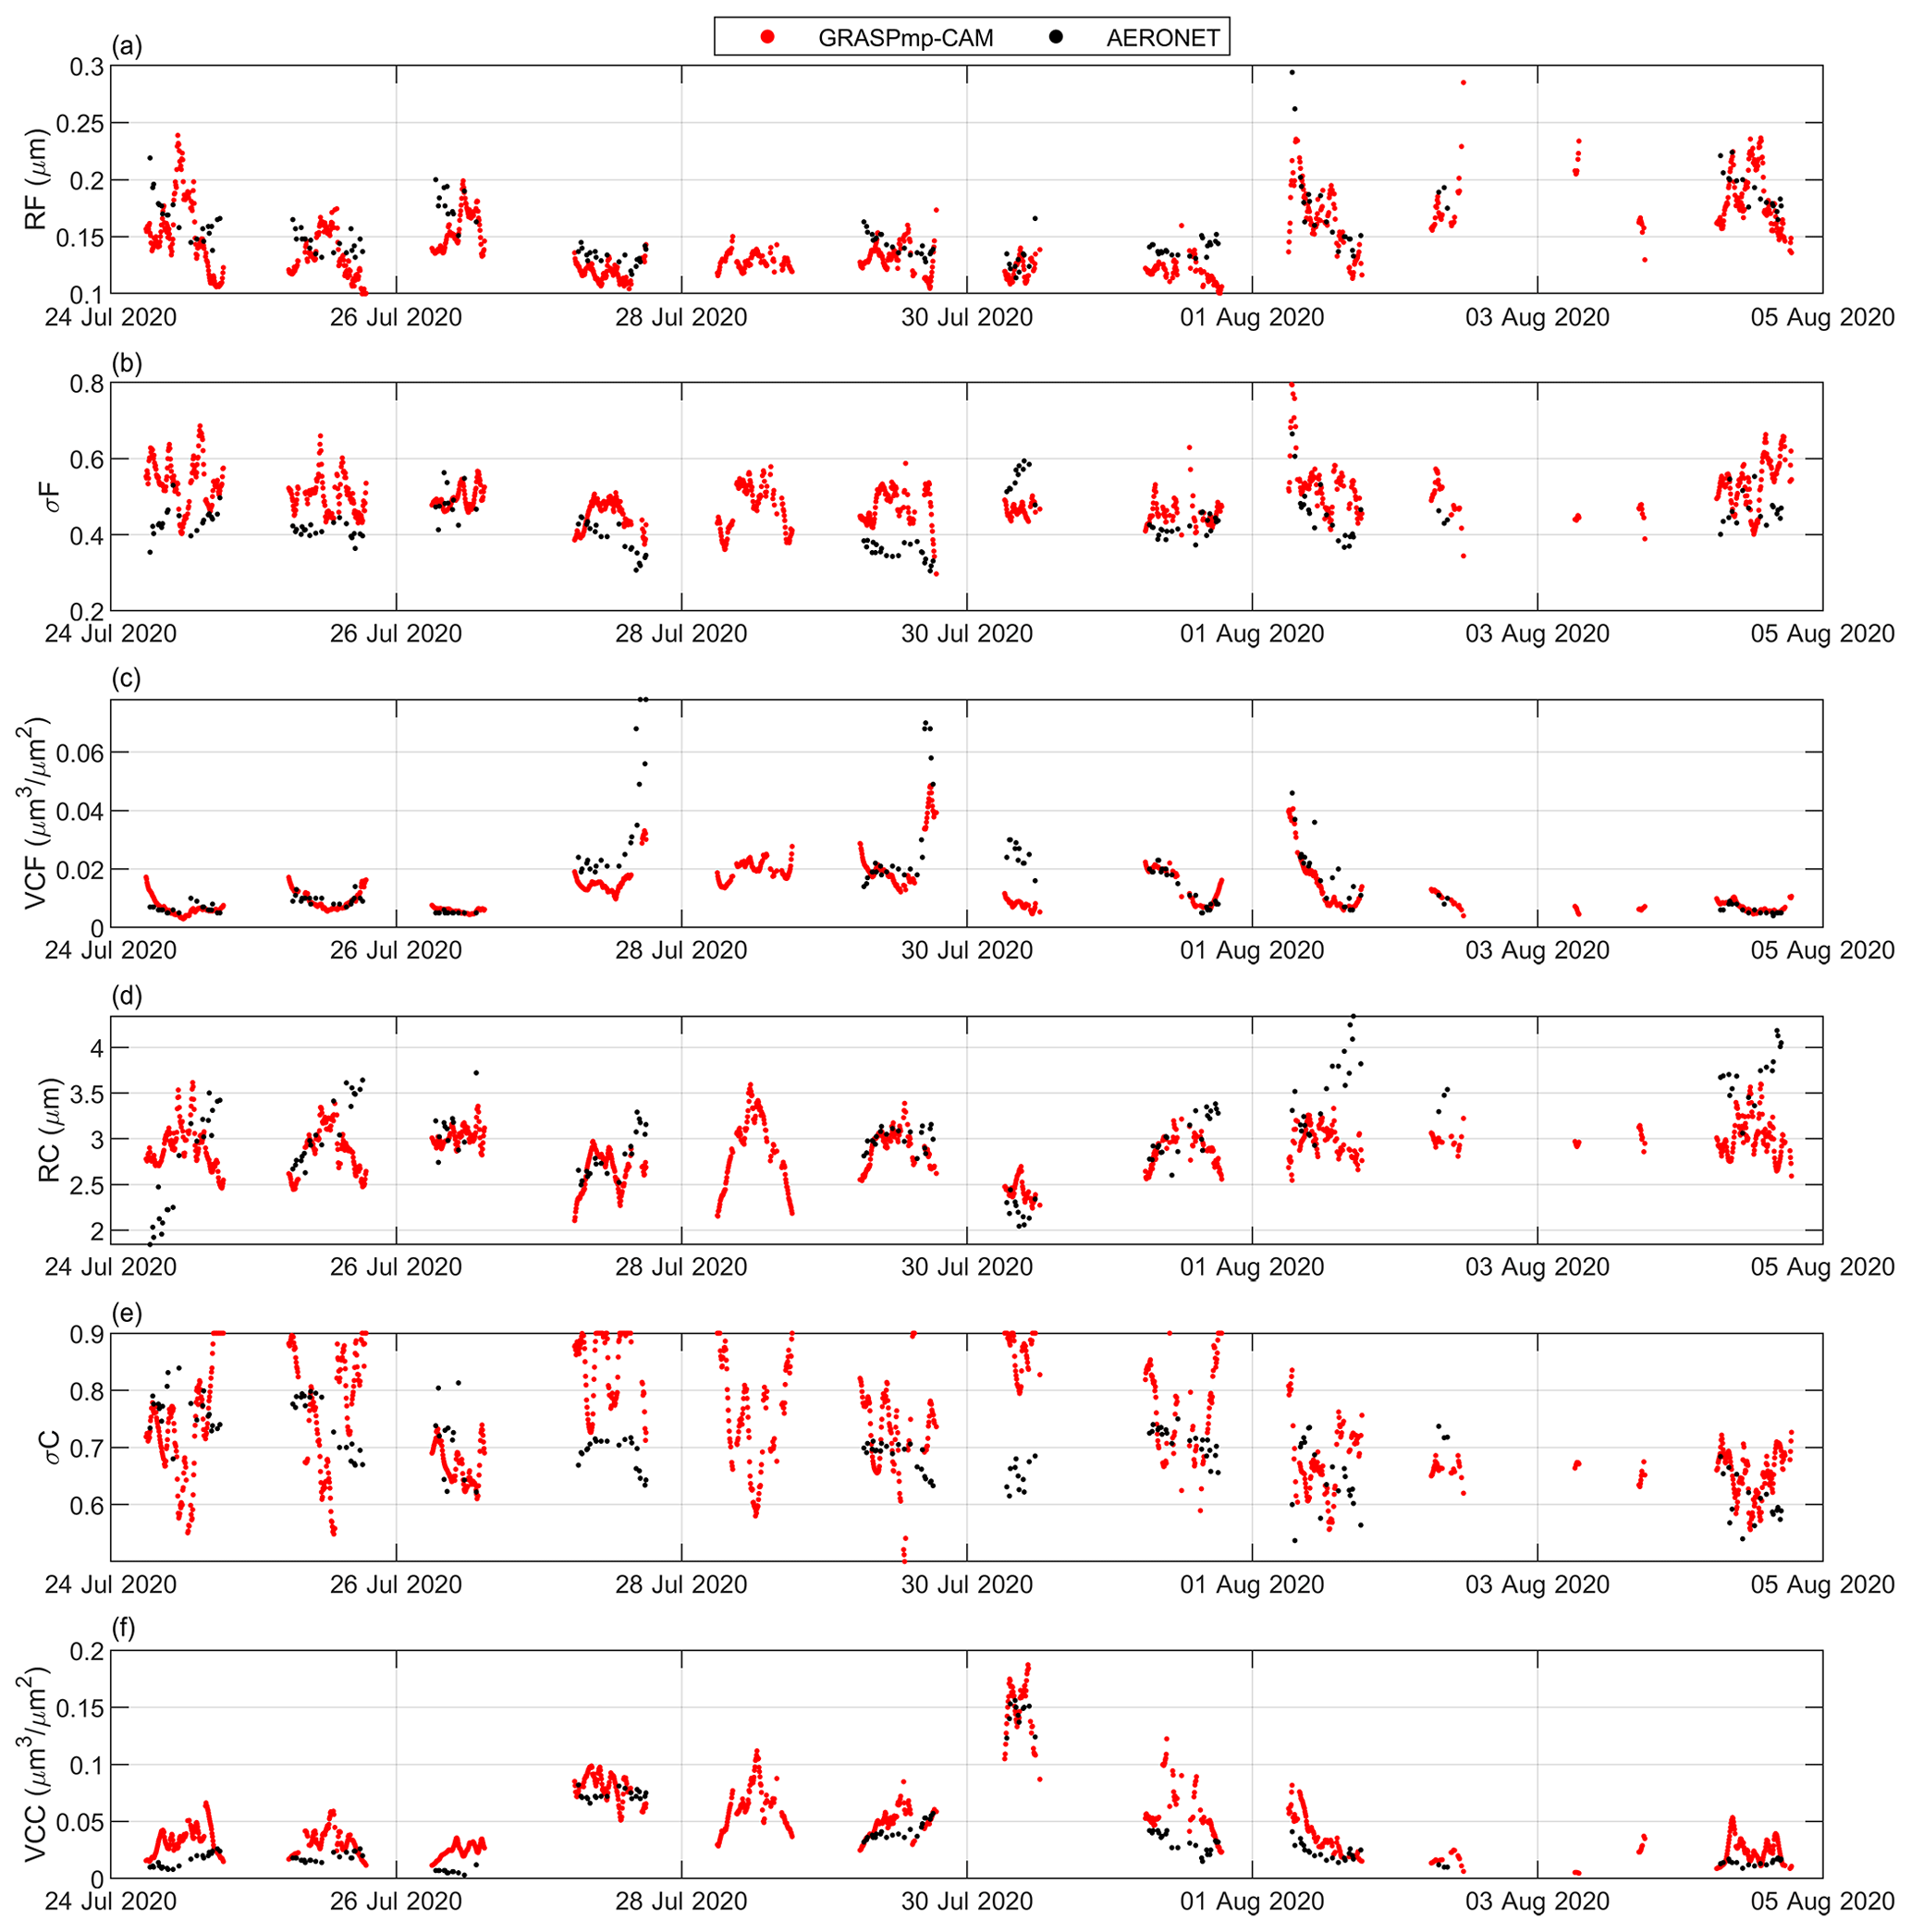
Figure 19Volume median radius, R, standard deviation of log-normal distribution, σ, and aerosol volume concentration, VC, for fine (F; a–c) and coarse (C; d–f) modes retrieved by GRASP with the multi-pixel approach (GRASPmp-CAM) and by AERONET at Valladolid from 24 July to 4 August 2020.
The GRASPmp-CAM size distribution parameters are represented as a function of the AERONET ones in Fig. 20. The amount of available data (3418) is higher than in the GRASP-CAM case (see Fig. 13). GRASPmp-CAM data are more correlated with AERONET than GRASP-CAM for the RF (r2=0.39) and VCF (r2=0.46), but they are less correlated for VCC (r2=0.50) and VCT (r2=0.54). This correlation between GRASPmp-CAM and AERONET increases when data in the 47.2–64.2∘ SZA range are not considered (see Fig. S37). In this case, some GRASPmp-CAM data overestimating the low VCC, and hence VCT, disappear. As a result, the correlation of GRASPmp-CAM values of VCC (r2=0.69) and VCT (r2=0.72) with AERONET is higher than for GRASP-CAM.

Figure 20Density scatter plots of the aerosol size distribution properties retrieved by GRASP with the multi-pixel approach (GRASPmp-CAM) versus the ones retrieved by AERONET; linear fit (black line), its equation and the determination coefficient (r2) are also shown. The size distribution properties are volume median radius of fine (RF) and coarse (RC) modes, standard deviation of log-normal distribution for fine (σF) and coarse (σC) modes, and aerosol volume concentration for fine (VCF) and coarse (VCC) modes and the total value (VCT).
The differences between GRASPmp-CAM and AERONET on size distribution parameters are shown Fig. 21. In general, the SD of the differences is slightly lower for GRASPmp-CAM than for GRASP-CAM except for VCC and VCT. On the other hand, GRASPmp-CAM presents Md values slightly farther from zero than GRASP-CAM for all size parameters except RF, σF and σC. These results vary if the data in the 47.2–64.2∘ SZA range are excluded in the frequency distributions (see Fig. S38). In this case, the SD is reduced for VCC and VCT, while it is similar for the other parameters. The Md is also closer to zero for VCF, VCC and VCT, but not for the other parameters, if the mentioned SZA values are discarded.

Figure 21Frequency histograms of the Δ differences in the aerosol size distribution properties retrieved by GRASP with the multi-pixel approach (GRASPmp-CAM) and the ones retrieved by AERONET. The mean (M), median (Md) and standard deviation (SD) of the differences are also shown. The size distribution properties are volume median radius of fine (RF) and coarse (RC) modes, standard deviation of log-normal distribution for fine (σF) and coarse (σC) modes, and aerosol volume concentration for fine (VCF) and coarse (VCC) modes and the total value (VCT).
Finally, the time series for RRI and SPH retrieved by GRASPmp-CAM from 24 July to 4 August 2020 are shown in Fig. S39. In a similar way to that for AOD, the aerosol properties retrieved by GRASPmp-CAM present a less noisy behaviour in the time series compared with GRASP-CAM (see Fig. S33). These retrieved parameters qualitatively fit better with AERONET than in the GRASP-CAM case, but significant differences between GRASPmp-CAM and AERONET can still be observed.
This paper has analysed in detail the feasibility of using normalized sky radiance (NSR) measurements at three effective wavelengths from an all-sky camera to retrieve aerosol properties using the GRASP code. This inversion method (camera NSR measurements on GRASP) has been called “GRASP-CAM”. For this study, NSR measurements in the AERONET hybrid scan geometry are used but with some limitations caused by technical problems of the camera: NSR measurements with lower scattering angles than 10∘ and any NSR measurement with solar zenith angle between 48 and 65∘ cannot be used.
Thanks to an analysis with synthetic data, we can conclude that NSR measurements are sensitive to changes in AOD, at least until AOD467 (AOD at 467 nm) values of 0.4–0.5. In this AOD range, the sky radiance is largely dominated by both Rayleigh and aerosol scattering, and the weight of each process is controlled by the AOD; hence, sky radiance shape varies with AOD. For higher AOD values, the aerosol scattering dominates, and hence, the sensitivity to increasing AOD is reduced. NSR measurements are also sensitive to the aerosol type, even for high aerosol loads. This sensitivity is mainly located at low scattering angles, indicating that NSR at these low angles contains valuable information about the aerosol type, especially for coarse mode. There is not sensitivity of the NSR measurements to the aerosol absorption.
The accuracy and precision of the aerosol properties retrieved by GRASP have been tested also with synthetic data. The theoretical accuracy of the retrieved AOD is generally within ±0.02 for AOD at AOD467 values below or equal to 0.4, while the theoretical precision goes from 0.01 to 0.05 as AOD467 varies from 0.1 to 0.5. The AOD retrieved by GRASP using real NSR measurements correlates (r2≈0.87–0.88) with independent measurements taken by an AERONET sun–sky photometer. The differences between both AOD sources are, as expected, higher for high AOD values, GRASP-CAM underestimating AERONET AOD as AOD increases. In general, the median and standard deviations of all these AOD differences have been between 0.006 and 0.010 and between 0.024 and 0.030, respectively; it points out an overall combined uncertainty of AOD retrieved with GRASP-CAM of about 0.026–0.030.
Regarding the aerosol volume size distribution, the theoretical precision and accuracy of the retrieved aerosol coarse mode improves if scattering angles lower than 10∘ are added to the inversion. Aerosol size distribution parameters retrieved by GRASP-CAM and by AERONET have been compared, and they have shown better correlation for the total (r2≈0.61), coarse (r2≈0.57) and fine (r2≈0.38) volume concentration and fine radius (r2≈0.35). GRASP-CAM has not shown enough sensitivity to the size distribution parameters of the coarse mode (radius and standard deviation); hence, these products should be carefully used.
The GRASP retrievals have been done with the single-pixel approach (each retrieval is stand-alone). However, this method discards a significant number of potential retrievals since NSR measurements do not reach low scattering angles, where valuable aerosol information is contained. Trying to solve that, the multi-pixel approach has been explored, which is a technique linking all the measurements of a full day and constraining the temporal evolution of aerosol properties throughout that day (smoothness criterion). As a result, more retrievals are achieved, showing more accurate AOD values when low scattering angles are not available than in the single-pixel approach. However, the accuracy of AOD in the retrievals for which low scatterings angles can not be reached is still low in the multi-pixel approach. A slight improvement in the retrieved AOD has been observed when the multi-pixel approach is used instead of the single-pixel if the most problematic sun positions (due to dome reflections) are not considered. The temporal evolution of other aerosol properties is less noisy and makes more physical sense using the multi-pixel rather than the single-pixel approach.
This work takes all-sky cameras one step beyond in their capability to obtain atmospheric aerosol properties. Normalized sky radiance measurements contain information about the aerosol properties, and therefore, they are useful to obtain the AOD, at least for low and moderate aerosol loads. The retrieved AOD under high aerosol loads should be carefully taken. The sensitivity of NSR measurements to aerosol type even for high AOD values suggests that these camera measurements could be combined in GRASP with other kinds of measurements more sensitive to AOD, or even AOD directly from other instruments, in order to obtain more accurate aerosol properties, including high aerosol load scenes. The availability of sky radiances with low scattering angles is important to obtain an accurate retrieval of aerosol properties; hence, we recommend manufacturers of all-sky cameras to work on the elimination of reflections in these instruments in order to cover a greater range of useful scattering angles. The multi-pixel approach seems to be an interesting technique to retrieve aerosol properties, and its potential should be explored in more detail in future works. The possibility that all-sky cameras offer to select alternative cloudless sky points when the standard sky points (from hybrid or almucantar scans) are contaminated by clouds should also be explored in the future.
AERONET data are publicly available on the AERONET web page (https://aeronet.gsfc.nasa.gov/, last access: 16 June 2021; Holben et al., 1998, https://doi.org/10.1016/S0034-4257(98)00031-5). Normalized sky radiances from the all-sky camera and the retrieved aerosol products are available upon request to the authors.
The supplement related to this article is available online at: https://doi.org/10.5194/amt-15-407-2022-supplement.
RR and JCAS designed and developed the main concepts and ideas behind this work and wrote the paper with input from all authors. They also processed the camera measurements and the GRASP retrievals. RR, BT, VEC and CT discussed and defined the used inversion strategy. CL developed and provided the all-sky camera used. RG was responsible for the camera's operation at the Valladolid station. VEC and CT were responsible for the Valladolid AERONET station. DF and TL contributed with the changes in GRASP code for the normalized sky radiances used as input. DM, MHG, OD and AMdF contributed in the interpretation of the results. All authors were involved in helpful discussions and contributed to the manuscript.
At least one of the (co-)authors is a member of the editorial board of Atmospheric Measurement Techniques. The peer-review process was guided by an independent editor, and the authors also have no other competing interests to declare.
Publisher's note: Copernicus Publications remains neutral with regard to jurisdictional claims in published maps and institutional affiliations.
Sieltec Canarias S.L. is acknowledged for lending the all-sky camera. The authors acknowledge the use of GRASP inversion algorithm software (https://www.grasp-open.com, last access: 16 June 2021). The authors gratefully thank AERONET for the aerosol products used. Finally, the authors thank the GOA-UVa staff members (Rogelio Carracedo, Daniel González-Fernández, Sara Herrero-Anta and Patricia Martín-Sánchez), who helped with the maintenance of the instruments and support for the station infrastructure. Roberto Román wants to acknowledge the interesting personal talks about GRASP code with Jose Antonio Benavent and Milagros Herrera.
This research has been supported by the Ministerio de Ciencia, Innovación y Universidades (grant no. RTI2018-097864-B-I00), the Junta de Castilla y León (grant no. VA227P20), and the Marie Skłodowska-Curie Research Innovation and Staff Exchange (RISE) (GRASP-ACE project (grant no. 778349)).
This paper was edited by Edward Nowottnick and reviewed by Reed Espinosa and one anonymous referee.
Angström, A.: On the atmospheric transmission of sun radiation II, Geogr. Ann., H 11, 1301–1308, 1930. a
Angström, A.: Techniques of determining the turbidity of the atmosphere, Tellus, 13, 214–223, 1961. a
Antuña-Sánchez, J. C., Román, R., Cachorro, V. E., Toledano, C., López, C., González, R., Mateos, D., Calle, A., and de Frutos, Á. M.: Relative sky radiance from multi-exposure all-sky camera images, Atmos. Meas. Tech., 14, 2201–2217, https://doi.org/10.5194/amt-14-2201-2021, 2021. a, b, c, d, e, f, g, h
Barreto, Á., Cuevas, E., Granados-Muñoz, M.-J., Alados-Arboledas, L., Romero, P. M., Gröbner, J., Kouremeti, N., Almansa, A. F., Stone, T., Toledano, C., Román, R., Sorokin, M., Holben, B., Canini, M., and Yela, M.: The new sun-sky-lunar Cimel CE318-T multiband photometer – a comprehensive performance evaluation, Atmos. Meas. Tech., 9, 631–654, https://doi.org/10.5194/amt-9-631-2016, 2016. a
Barreto, A., Román, R., Cuevas, E., Pérez-Ramírez, D., Berjón, A., Kouremeti, N., Kazadzis, S., Gröbner, J., Mazzola, M., Toledano, C., Benavent-Oltra, J. A., Doppler, L., Jurysek, J., Almansa, F., Victori, S., Maupin, F., Guirado-Fuentes, C., González, R., Vitale, V., Goloub, P., Blarel, L., Alados-Arboledas, L., Woolliams, E., Greenwell, C., Taylor, S., Antuña, J. C., and Yela, M.: Evaluation of night-time aerosol optical depth measurements and lunar irradiance models in the frame of the first multi-instrument nocturnal intercomparison campaign, Atmos. Environ., 202, 190–211, 2019. a
Benavent-Oltra, J. A., Román, R., Granados-Muñoz, M. J., Pérez-Ramírez, D., Ortiz-Amezcua, P., Denjean, C., Lopatin, A., Lyamani, H., Torres, B., Guerrero-Rascado, J. L., Fuertes, D., Dubovik, O., Chaikovsky, A., Olmo, F. J., Mallet, M., and Alados-Arboledas, L.: Comparative assessment of GRASP algorithm for a dust event over Granada (Spain) during ChArMEx-ADRIMED 2013 campaign, Atmos. Meas. Tech., 10, 4439–4457, https://doi.org/10.5194/amt-10-4439-2017, 2017. a
Benavent-Oltra, J. A., Román, R., Casquero-Vera, J. A., Pérez-Ramírez, D., Lyamani, H., Ortiz-Amezcua, P., Bedoya-Velásquez, A. E., de Arruda Moreira, G., Barreto, Á., Lopatin, A., Fuertes, D., Herrera, M., Torres, B., Dubovik, O., Guerrero-Rascado, J. L., Goloub, P., Olmo-Reyes, F. J., and Alados-Arboledas, L.: Different strategies to retrieve aerosol properties at night-time with the GRASP algorithm, Atmos. Chem. Phys., 19, 14149–14171, https://doi.org/10.5194/acp-19-14149-2019, 2019. a
Bennouna, Y., Cachorro, V., Torres, B., Toledano, C., Berjón, A., de Frutos, A., and Alonso Fernández Coppel, I.: Atmospheric turbidity determined by the annual cycle of the aerosol optical depth over north-center Spain from ground (AERONET) and satellite (MODIS), Atmos. Environ., 67, 352–364, https://doi.org/10.1016/j.atmosenv.2012.10.065, 2013. a
Bodhaine, B. A., Wood, N. B., Dutton, E. G., and Slusser, J. R.: On Rayleigh Optical Depth Calculations, J. Atmos. Ocean. Tech., 16, 1854–1861, https://doi.org/10.1175/1520-0426(1999)016<1854:ORODC>2.0.CO;2, 1999. a
Boucher, O., Randall, D., Artaxo, P., Bretherton, C., Feingold, G., Forster, P., Kerminen, V.-M., Kondo, Y., Liao, H., Lohmann, U., Rasch, P., Satheesh, S. K., Sherwood, S., Stevens, B., and Zhang, X.-Y.: Clouds and aerosols, in: Climate change 2013: the physical science basis. Contribution of Working Group I to the Fifth Assessment Report of the Intergovernmental Panel on Climate Change, Cambridge University Press, 571–657, 2013. a, b
Cachorro, V. E., Burgos, M. A., Mateos, D., Toledano, C., Bennouna, Y., Torres, B., de Frutos, Á. M., and Herguedas, Á.: Inventory of African desert dust events in the north-central Iberian Peninsula in 2003–2014 based on sun-photometer–AERONET and particulate-mass–EMEP data, Atmos. Chem. Phys., 16, 8227–8248, https://doi.org/10.5194/acp-16-8227-2016, 2016. a
Cazorla, A., Olmo, F., and Alados-Arboledas, L.: Using a Sky Imager for aerosol characterization, Atmos. Environ., 42, 2739–2745, https://doi.org/10.1016/j.atmosenv.2007.06.016, 2008. a
Chen, C., Dubovik, O., Fuertes, D., Litvinov, P., Lapyonok, T., Lopatin, A., Ducos, F., Derimian, Y., Herman, M., Tanré, D., Remer, L. A., Lyapustin, A., Sayer, A. M., Levy, R. C., Hsu, N. C., Descloitres, J., Li, L., Torres, B., Karol, Y., Herrera, M., Herreras, M., Aspetsberger, M., Wanzenboeck, M., Bindreiter, L., Marth, D., Hangler, A., and Federspiel, C.: Validation of GRASP algorithm product from POLDER/PARASOL data and assessment of multi-angular polarimetry potential for aerosol monitoring, Earth Syst. Sci. Data, 12, 3573–3620, https://doi.org/10.5194/essd-12-3573-2020, 2020. a
Dubovik, O. and King, M.: A Flexible Inversion Algorithm for Retrieval of Aerosol Optical Properties from Sun and Sky Radiance Measurements., J. Geophys. Res., 105, 20673–20696, 2000. a, b, c
Dubovik, O., Smirnov, A., Holben, B. N., King, M. D., Kaufman, Y. J., Eck, T. F., and Slutsker, I.: Accuracy assessments of aerosol optical properties retrieved from Aerosol Robotic Network (AERONET) Sun and sky radiance measurements, J. Geophys. Res., 105, 9791–9806, 2000. a
Dubovik, O., Holben, B., Eck, T., Smirnov, A., Kaufman, Y., King, M. D., Tanre, D., and Slutsker, I.: Variability of Absorption and Optical Properties of Key Aerosol Types Observed in Worldwide Locations, J. Atmos. Sci., 59, 590–608, 2002. a
Dubovik, O., Sinyuk, A., Lapyonok, T., Holben, B. N., Mishchenko, M., Yang, P., Eck, T. F., Volten, H., Muñoz, O., Veihelmann, B., van der Zande, W. J., Léon, J.-F., Sorokin, M., and Slutsker, I.: Application of spheroid models to account for aerosol particle nonsphericity in remote sensing of desert dust, J. Geophys. Res., 111, D11208, https://doi.org/10.1029/2005JD006619, 2006. a, b
Dubovik, O., Herman, M., Holdak, A., Lapyonok, T., Tanré, D., Deuzé, J. L., Ducos, F., Sinyuk, A., and Lopatin, A.: Statistically optimized inversion algorithm for enhanced retrieval of aerosol properties from spectral multi-angle polarimetric satellite observations, Atmos. Meas. Tech., 4, 975–1018, https://doi.org/10.5194/amt-4-975-2011, 2011. a
Dubovik, O., Lapyonok, T., Litvinov, P., Herman, M., Fuertes, D., Ducos, F., Lopatin, A., Chaikovsky, A., Torres, B., Derimian, Y., Huang, X., Aspetsberger, M., and Federspiel, C.: GRASP: a versatile algorithm for characterizing the atmosphere, SPIE: Newsroom, https://doi.org/10.1117/2.1201408.005558, 2014. a, b
Espinosa, W. R., Remer, L. A., Dubovik, O., Ziemba, L., Beyersdorf, A., Orozco, D., Schuster, G., Lapyonok, T., Fuertes, D., and Martins, J. V.: Retrievals of aerosol optical and microphysical properties from Imaging Polar Nephelometer scattering measurements, Atmos. Meas. Tech., 10, 811–824, https://doi.org/10.5194/amt-10-811-2017, 2017. a
Giles, D. M., Sinyuk, A., Sorokin, M. G., Schafer, J. S., Smirnov, A., Slutsker, I., Eck, T. F., Holben, B. N., Lewis, J. R., Campbell, J. R., Welton, E. J., Korkin, S. V., and Lyapustin, A. I.: Advancements in the Aerosol Robotic Network (AERONET) Version 3 database – automated near-real-time quality control algorithm with improved cloud screening for Sun photometer aerosol optical depth (AOD) measurements, Atmos. Meas. Tech., 12, 169–209, https://doi.org/10.5194/amt-12-169-2019, 2019. a, b, c, d, e
González, R., Toledano, C., Román, R., Fuertes, D., Berjón, A., Mateos, D., Guirado-Fuentes, C., Velasco-Merino, C., Antuña-Sánchez, J. C., Calle, A., Cachorro, V. E., and de Frutos, Á. M.: Daytime and nighttime aerosol optical depth implementation in CÆLIS, Geosci. Instrum. Method. Data Syst., 9, 417–433, https://doi.org/10.5194/gi-9-417-2020, 2020. a, b
Herreras, M., Román, R., Cazorla, A., Toledano, C., Lyamani, H., Torres, B., Cachorro, V., Olmo, F., Alados-Arboledas, L., and de Frutos, A.: Evaluation of retrieved aerosol extinction profiles using as reference the aerosol optical depth differences between various heights, Atmos. Res., 230, 104625, https://doi.org/10.1016/j.atmosres.2019.104625, 2019. a
Holben, B. N., Eck, T. F., Slutsker, I., Tanré, D., Buis, J. P., Setzer, A., Vermote, E., Reagan, J. A., Kaufman, Y. J., Nakajima, T., Lavenu, F., Jankowiak, I., and Smirnov, A.: AERONET – a federated instrument network and data archive for aerosol characterization, Remote Sens. Environ., 66, 1–16, https://doi.org/10.1016/S0034-4257(98)00031-5, 1998 (data available at: https://aeronet.gsfc.nasa.gov/, last access: 16 June 2021). a, b, c
Holben, B. N., Eck, T. F., Slutsker, I., Smirnov, A., Sinyuk, A., Schafer, J., Giles, D., and Dubovik, O.: Aeronet's Version 2.0 quality assurance criteria, Proc. SPIE, 6408, 64080Q, https://doi.org/10.1117/12.706524, 2006. a
IPCC: Climate Change 2014: Synthesis Report. Contribution of Working Groups I, II and III to the Fifth Assessment Report of the Intergovernmental Panel on Climate Change, IPCC, Tech. rep., Intergovernmental Panel on Climate Change, Geneva, Switzerland, 151 pp., 2014. a
Levy, R. C., Mattoo, S., Munchak, L. A., Remer, L. A., Sayer, A. M., Patadia, F., and Hsu, N. C.: The Collection 6 MODIS aerosol products over land and ocean, Atmos. Meas. Tech., 6, 2989–3034, https://doi.org/10.5194/amt-6-2989-2013, 2013. a
Lopatin, A., Dubovik, O., Chaikovsky, A., Goloub, P., Lapyonok, T., Tanré, D., and Litvinov, P.: Enhancement of aerosol characterization using synergy of lidar and sun-photometer coincident observations: the GARRLiC algorithm, Atmos. Meas. Tech., 6, 2065–2088, https://doi.org/10.5194/amt-6-2065-2013, 2013. a
Lopatin, A., Dubovik, O., Fuertes, D., Stenchikov, G., Lapyonok, T., Veselovskii, I., Wienhold, F. G., Shevchenko, I., Hu, Q., and Parajuli, S.: Synergy processing of diverse ground-based remote sensing and in situ data using the GRASP algorithm: applications to radiometer, lidar and radiosonde observations, Atmos. Meas. Tech., 14, 2575–2614, https://doi.org/10.5194/amt-14-2575-2021, 2021. a
Molero, F., Pujadas, M., and Artíñano, B.: Study of the Effect of Aerosol Vertical Profile on Microphysical Properties Using GRASP Code with Sun/Sky Photometer and Multiwavelength Lidar Measurements, Remote Sens.-Basel, 12, 4072, https://doi.org/10.3390/rs12244072, 2020. a
Nakajima, T., Tonna, G., Rao, R., Boi, P., Kaufman, Y., and Holben, B.: Use of sky brightness measurements from ground for remote sensing of particulate polydispersions, Appl. Optics, 35, 15, 2672–2686, 1996. a
Remer, L. A., Kaufman, Y. J., Tanré, D., Mattoo, S., Chu, D. A., Martins, J. V., Li, R.-R., Ichoku, C., Levy, R. C., Kleidman, R. G., Eck, T. F., Vermote, E., and Holben, B. N.: The MODIS aerosol algorithm, products, and validation, J. Atmos. Sci., 62, 947–973, 2005. a
Román, R., Antón, M., Cazorla, A., de Miguel, A., Olmo, F. J., Bilbao, J., and Alados-Arboledas, L.: Calibration of an all-sky camera for obtaining sky radiance at three wavelengths, Atmos. Meas. Tech., 5, 2013–2024, https://doi.org/10.5194/amt-5-2013-2012, 2012. a
Román, R., Bilbao, J., and de Miguel, A.: Uncertainty and variability in satellite-based water vapor column, aerosol optical depth and Angström exponent, and its effect on radiative transfer simulations in the Iberian Peninsula, Atmos. Environ., 89, 556–569, https://doi.org/10.1016/j.atmosenv.2014.02.027, 2014. a
Román, R., Torres, B., Fuertes, D., Cachorro, V., Dubovik, O., Toledano, C., Cazorla, A., Barreto, A., Bosch, J., Lapyonok, T., González, R., Goloub, P., Perrone, M., Olmo, F., de Frutos, A., and Alados-Arboledas, L.: Remote sensing of lunar aureole with a sky camera: Adding information in the nocturnal retrieval of aerosol properties with GRASP code, Remote Sens. Environ., 196, 238–252, https://doi.org/10.1016/j.rse.2017.05.013, 2017. a, b
Román, R., Benavent-Oltra, J. A., Casquero-Vera, J. A., Lopatin, A., Cazorla, A., Lyamani, H., Denjean, C., Fuertes, D., Pérez-Ramírez, D., Torres, B., Toledano, C., Dubovik, O., Cachorro, V. E., de Frutos, A., Olmo, F. J., and Alados-Arboledas, L.: Retrieval of aerosol profiles combining sunphotometer and ceilometer measurements in GRASP code, Atmos. Res., 204, 161–177, 2018. a, b
Rossini, E. G. and Krenzinger, A.: Maps of sky relative radiance and luminance distributions acquired with a monochromatic CCD camera, Sol. Energy, 81, 1323–1332, https://doi.org/10.1016/j.solener.2007.06.013, 2007. a
Schaaf, C., Liu, J., Gao, F., and Strahler, A. H.: MODIS albedo and reflectance anisotropy products from Aqua and Terra, Land Remote Sensing and Global Environmental Change: NASA's Earth Observing System and the Science of ASTER and MODIS, 11, 549–561, 2011. a
Sinyuk, A., Holben, B. N., Eck, T. F., Giles, D. M., Slutsker, I., Korkin, S., Schafer, J. S., Smirnov, A., Sorokin, M., and Lyapustin, A.: The AERONET Version 3 aerosol retrieval algorithm, associated uncertainties and comparisons to Version 2, Atmos. Meas. Tech., 13, 3375–3411, https://doi.org/10.5194/amt-13-3375-2020, 2020. a, b, c, d, e
Tapakis, R. and Charalambides, A.: Equipment and methodologies for cloud detection and classification: A review, Sol. Energy, 95, 392–430, https://doi.org/10.1016/j.solener.2012.11.015, 2013. a
Titos, G., Ealo, M., Román, R., Cazorla, A., Sola, Y., Dubovik, O., Alastuey, A., and Pandolfi, M.: Retrieval of aerosol properties from ceilometer and photometer measurements: long-term evaluation with in situ data and statistical analysis at Montsec (southern Pyrenees), Atmos. Meas. Tech., 12, 3255–3267, https://doi.org/10.5194/amt-12-3255-2019, 2019. a
Tohsing, K., Schrempf, M., Riechelmann, S., and Seckmeyer, G.: Validation of spectral sky radiance derived from all-sky camera images – a case study, Atmos. Meas. Tech., 7, 2137–2146, https://doi.org/10.5194/amt-7-2137-2014, 2014. a
Tonna, G., Nakajima, T., and Rao, R.: Aerosol features retrieved from solar aureole data: a simulation study concerning a turbid atmosphere, Appl. Optics, 34, 4486–4499, https://doi.org/10.1364/AO.34.004486, 1995. a
Torres, B. and Fuertes, D.: Characterization of aerosol size properties from measurements of spectral optical depth: a global validation of the GRASP-AOD code using long-term AERONET data, Atmos. Meas. Tech., 14, 4471–4506, https://doi.org/10.5194/amt-14-4471-2021, 2021. a
Torres, B., Dubovik, O., Fuertes, D., Schuster, G., Cachorro, V. E., Lapyonok, T., Goloub, P., Blarel, L., Barreto, A., Mallet, M., Toledano, C., and Tanré, D.: Advanced characterisation of aerosol size properties from measurements of spectral optical depth using the GRASP algorithm, Atmos. Meas. Tech., 10, 3743–3781, https://doi.org/10.5194/amt-10-3743-2017, 2017. a, b
Tsekeri, A., Lopatin, A., Amiridis, V., Marinou, E., Igloffstein, J., Siomos, N., Solomos, S., Kokkalis, P., Engelmann, R., Baars, H., Gratsea, M., Raptis, P. I., Binietoglou, I., Mihalopoulos, N., Kalivitis, N., Kouvarakis, G., Bartsotas, N., Kallos, G., Basart, S., Schuettemeyer, D., Wandinger, U., Ansmann, A., Chaikovsky, A. P., and Dubovik, O.: GARRLiC and LIRIC: strengths and limitations for the characterization of dust and marine particles along with their mixtures, Atmos. Meas. Tech., 10, 4995–5016, https://doi.org/10.5194/amt-10-4995-2017, 2017. a
Wei, Y., Li, Z., Zhang, Y., Chen, C., Xie, Y., Lv, Y., and Dubovik, O.: Derivation of PM10 mass concentration from advanced satellite retrieval products based on a semi-empirical physical approach, Remote Sens. Environ., 256, 112319, https://doi.org/10.1016/j.rse.2021.112319, 2021. a
Willeke, K., Baron, P. A., and Martonen, T.: Aerosol measurement: principles, techniques, and applications, vol. 876, Van Nostrand Reinhold, New York, 1993. a
https://aeronet.gsfc.nasa.gov (last access: 16 June 2021)
http://www.grasp-open.com (last access: 16 June 2021)
http://www.actris.eu (last access: 16 June 2021)