the Creative Commons Attribution 4.0 License.
the Creative Commons Attribution 4.0 License.
 | 27 Jan 2022
Ash particle refractive index model for simulating the brightness temperature spectrum of volcanic ash clouds from satellite infrared sounder measurements
Hiroshi Ishimoto
Masahiro Hayashi
Yuzo Mano
Using data from the Infrared Atmospheric Sounding Interferometer (IASI) measurements of volcanic ash clouds (VACs) and radiative transfer calculations, we attempt to simulate the measured brightness temperature spectra (BTS) of volcanic ash aerosols in the infrared region. In particular, the dependence on the ash refractive index (RI) model is investigated. We apply 21 RI models for the optical properties of ash particles, including recently published models. The results of BTS simulations are evaluated using the root mean square (rms) of the brightness temperature difference between measurements and simulations for channels in the wavenumber range of 750–1400 cm−1. The results of numerical simulations for 156 pixels of IASI measurements for ash plumes from seven volcanoes indicated that some newly established RI models have smaller rms than those obtained with the conventional ash RI model. For some eruption events, the RI models deduced from the chemical composition of ash samples for the same volcanic eruption events simulate the measured BTS well. The results suggest that infrared sounder measurements and precise BTS simulations of the VACs contribute to estimating the appropriate RI model in satellite VAC analysis.
- Article
(6615 KB) - Full-text XML
-
Supplement
(5951 KB) - BibTeX
- EndNote


For continuous near-real-time monitoring of volcanic ash clouds (VACs) during both day and night, satellite observations obtained using infrared sensors are particularly useful (Mackie and Watson, 2014; Mackie et al., 2016; Clarisse and Prata, 2016). Silicate has a characteristic absorption band around 10 µm due to the stretching vibration of the Si–O bond; thus, VACs containing fine ash particles can be easily detected and distinguished from water or ice clouds by measuring the brightness temperature difference between two channels in this absorption band, such as 10.8 and 12 µm (Wen and Rose, 1994; Prata and Grant, 2001). Applying further constraints related to the atmospheric profile and microphysical properties of the ash particles, such as the particle size distribution, the physical properties of VACs (plume height, particle effective radius, optical depth, and the associated ash mass loading) have been determined using measurements from multiple infrared channels from high-resolution satellite imagers and from satellite infrared sounders (e.g., Francis et al., 2012; Pavolonis et al., 2013; Clarisse et al., 2013; Ventress et al., 2016). These retrieval methods are based on the results of radiative transfer calculations for the measured infrared brightness temperature of VACs under assumed atmospheric profiles and surface conditions; as such, the optical properties of the ash particles are essential. In particular, the complex refractive index (RI) is an important upstream parameter for estimating ash optical properties and their wavelength dependence.
A typical RI model over a wide range of infrared wavelengths, the “andesite” model proposed by Pollack et al. (1973) (hereinafter, PL1973), has been adopted for radiative transfer calculations for volcanic ash analysis. Although the PL1973 andesite model provides suitable approximations for the analysis of some VACs (Pavolonis et al., 2013), simulations of the infrared brightness temperature spectrum (BTS) of VACs based on radiative transfer calculations from the PL1973 andesite model often cause large discrepancies relative to calculations based on satellite infrared sounder measurements (Gangale et al., 2010; Newman et al., 2012; Ishimoto et al., 2016; Clarisse and Prata, 2016). For simulating a measured BTS to retrieve the physical properties of a VAC from satellite data, RI models that account for variations in the chemical composition of volcanic ash are essential. Optical properties of ash particles calculated using an appropriate RI model for an observed VAC support accurate and robust determination of the physical properties of the VAC in satellite image analysis. Furthermore, a good RI model leads to improvements in existing retrieval algorithms for volcanic SO2 gas levels using the ν1 SO2 absorption band around 8.7 µm (∼1152 cm−1) through accurate estimation of the ash contribution to the measured brightness temperature (Corradini et al., 2009; Clarisse et al., 2012).
In recent years, two RI datasets for volcanic ash over a broad infrared wavelength range have been proposed. One dataset is built from the results of laboratory experiments using ash sampled from several volcanoes (Reed et al., 2017, 2018). Based on the results of Reed et al. (2018), Prata et al. (2019) constructed another RI dataset parameterized using the SiO2 content or ratio of non-bridging oxygens to tetrahedrally coordinated cations (NBO/T). If an appropriate RI model for analyzing a measured VAC from satellite data is provided by the RI dataset of Reed et al. (2018), the RI model can be estimated based on the similarity with the rock type of the target volcano. Furthermore, if the SiO2 content or NBO/T parameterizations of Prata et al. (2019) are effective, we can identify the RI model, for example, from the chemical composition of ash or pumice samples from ongoing or past eruption events. However, whether the selected RI model accurately reproduces satellite measurements via radiative transfer calculations remains unclear.
The most appropriate satellite measurement type to discuss such reproducibility is a BTS obtained using an infrared sounder. In this work, we attempt to simulate the observed BTS through radiative transfer calculations using the RI models from recently proposed RI datasets without compositional constraints for the ash aerosols. If the RI model obtained from infrared sounder measurements corresponds to that derived from SiO2 content or NBO/T for a sample from the same volcano, the results are considered to support the validity of the RI model based on ash chemical composition. Volcanic ash particles in the atmosphere may have different optical properties compared to sampled ash particles due to modifications in the atmosphere, such as the condensation of ice, water, or sulfate on ash particles. Even pure ash particles identified from satellite infrared observations may have compositions different from those of ash or pumice samples (Carn and Krotkov, 2016). The particle sizes are generally small for ash plumes, which cause the large negative brightness temperature difference between two infrared split-window channels. The estimated effective radii of the ash plumes are generally less than 5 µm depending on the plume height and optical depth (Clarisse and Prata, 2016). For such fine ash particles, silicic micropumice and small glass shards may remain in the atmosphere longer than bulk composition particles due to their density (Cashman and Rust, 2016). Thus, volcanic ash particles detected in infrared satellite measurements after long-distance transportation may have a more felsic composition than ash particles sampled near a volcano do. Conversely, the differences in the RI models used may not be statistically distinguishable from the reproduced BTS because there are many unknowns and assumptions in the radiative transfer calculations. One of the objectives of this study was to investigate whether RI models that reproduce the observed BTS in the infrared region can be identified, and whether the compositional type (mafic or felsic) corresponding to that RI model is consistent with that of the volcanic ash sample or the type of volcano.
In this work, we use the time and places of VAC observation data from the Infrared Atmospheric Sounding Interferometer (IASI) on board the Meteorological Operation (MetOp) satellite to simulate measured BTS based on radiative transfer calculations. IASI has 8461 channels that range between 645 and 2760 cm−1, with a spectral sampling interval of 0.25 cm−1, and the ground resolution is 12 km at nadir (Hilton et al., 2012). In Sect. 2, our numerical method for the radiative transfer calculations is explained. VAC parameters and RI models for the ash particles used in numerical simulations are discussed in Sect. 3, and the selection of IASI pixels, which are used for analysis, is described in Sect. 4. Results of case studies for some VACs are discussed in Sect. 5.
To estimate VAC parameters and SO2 gas contents from satellite infrared sounder measurements, a fast radiative transfer model is needed that can calculate upward channel radiance at the top of the atmosphere (TOA), including multiple light-scattering events among ash particles. Furthermore, we examine a number of RI models for volcanic ash to simulate the measured BTS. To meet these requirements, we developed a radiative transfer code, MBCRM, to simulate infrared sounder measurements. For the basic algorithm of MBCRM, we adopt the Atmospheric Radiative Transfer Simulator (Buehler et al., 2010). Upward radiance Ri of a sounder channel i at TOA is calculated as the weighted sum of N number of monochromatic radiances .
where Cj is the weighting coefficient . Using a diverse atmospheric profile dataset to compare the calculated Ri with values derived from exact integration of channel response functions using line-by-line calculations, the monochromatic wavenumber νj and weight Cj were determined, as was the number N, using a simulated annealing technique. To simulate the radiance of the 8461 IASI channels, a total of 14 132 monochromatic wavenumber values were determined. Figure 1 shows the root-mean-square difference of the channel brightness temperature BTi calculated from Ri for clear-sky conditions between rigorous line-by-line calculations and MBCRM using the ECMWF 83 diverse atmospheric profiles dataset (Matricardi, 2008). We assume that the mixing ratios of the six atmospheric components (CO2, N2O, CO, CH4, O2, and N2) are fixed (the CO2 mixing ratio was set to 403.3 ppmv). For line-by-line calculations, the HITRAN 2012 database (Rothman et al., 2013) and same definitions of line parameters and correction formulas as those of LBLRTM version 12.4 (Clough et al., 2005) are applied, and MT-CKD2.5 (Mlawer et al., 2012) is used for the water vapor continuum. The radiances of IASI channels in Fig. 1 are calculated by applying the IASI channel response function for the monochromatic line-by-line output with the wavenumber interval cm−1. The accuracy of MBCRM for calculating gas absorption was less than 0.4 K in wavenumber range cm−1.
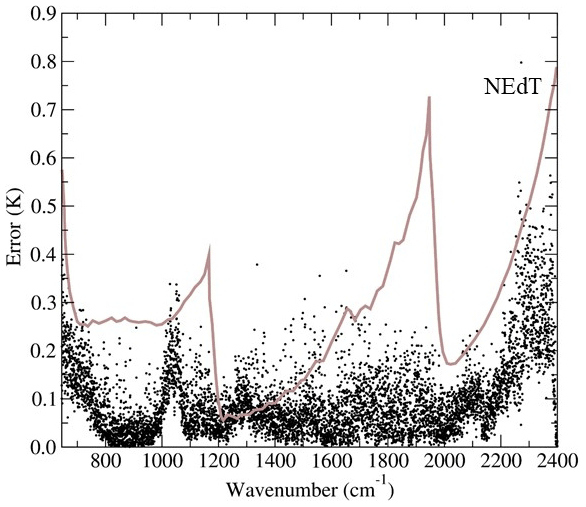
Figure 1The root mean square of the TOA brightness temperature for the IASI 7021 channels (645–2400 cm−1) between line-by-line and MBCRM calculations. The satellite zenith angle 0∘ and surface emissivity 1.0 were applied, and the temperature of the atmosphere at surface pressure height was used as surface temperature. The brown line is the NEdT (noise-equivalent brightness temperature) of IASI at 280 K (Hilton et al., 2012). The atmospheric profile dataset is available from https://nwp-saf.eumetsat.int/oldsite/deliverables/rtm/profile_datasets.html (last access: 18 January 2022).
A plane-parallel single homogeneous layer VAC was assumed for calculations of multiple scattering by ash particles. The values of νj and Cj in Eq. (1) determined under clear-sky conditions can be applied to calculations in a cloudy atmosphere with high accuracy (Holl et al., 2012). We used the same formulation of Eq. (1) for radiance calculations in cloudy conditions caused by volcanic ash. For monochromatic radiative transfer calculations at infrared wavelengths, we formulated an analytical expression of TOA radiance in which the terms for cloud multiple scattering were described by coefficients depending only on cloud geometry and cloud optical properties. A lookup table (LUT) of coefficients for various ash cloud conditions was prepared for calculation of monochromatic radiance in advance using the discrete ordinate method with 64 streams.
As a benchmark test for the calculations of TOA radiance for the atmosphere including the VAC layer, the simulations of IASI channel radiances between MBCRM and Radiative Transfer for the TIROS Operational Vertical Sounder (RTTOV) were compared using the optical properties of “new volcanic ash (VAPO)” in RTTOV (Fig. 2).
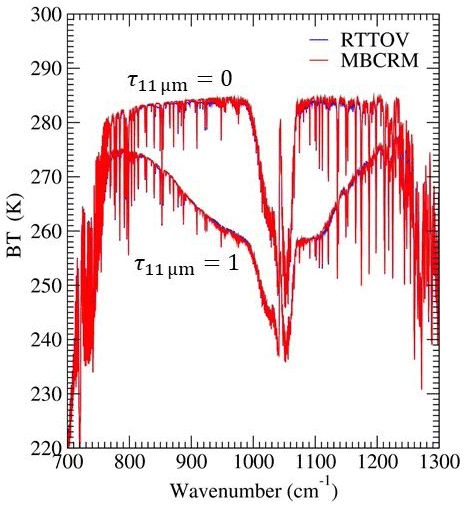
Figure 2Comparisons of the IASI BTS simulated using MBCRM and RTTOV (version 12.2) for clear-sky (τ11 µm=0) and cloudy (τ11 µm=1) atmosphere. Optical depth was defined as that at wavelength 11 µm (ν=907.488 cm−1). The average atmospheric profile in the ECMWF 52 diverse profile dataset (no. 52) and the satellite zenith angle 0∘ were used, and a sea surface emissivity model and surface temperature 286.52 K were applied. For cloudy atmosphere, a homogeneous aerosol layer between 358.966 and 459.712 hPa, and the aerosol properties of the “new volcanic ash (VAPO)” model in RTTOV (Vidot and Hocking, 2017) were considered. For RTTOV, result of the eight-stream discrete-ordinate method (DOM) was plotted. For MBCRM calculations, we read the complex refractive index (RI) data of VAPO from the figure in the RTTOV-11 Science and Validation Report (Saunders et al., 2013).
Using LUTs for ash optical properties, numerical simulations of IASI measurements of VACs were conducted using MBCRM. A prolate spheroid shape with a 1:2 axis ratio and a log-normal size distribution (Hansen and Travis, 1974) with a geometric standard deviation of 0.74 (Pavolonis et al., 2013) were assumed for ash particles. The optical properties of the particles were calculated using the T-matrix method (Mishchenko et al., 2002) for particle effective radii reff between 0.1 and 20 µm (particle size is defined as the radius of a sphere with equivalent volume). In satellite infrared sounder measurements, volcanic ash mainly affects TOA brightness temperature in the wavenumber range of ν≤1400 cm−1, and LUTs of volcanic ash optical properties were prepared for 640 cm cm−1 at an interval of Δν=10 cm−1. The optical properties of each IASI channel were estimated through linear interpolation of the LUT. TOA radiance and brightness temperature were calculated under the assumption that the ash plumes are in thermal equilibrium with the ambient air.
For RI models of volcanic ash particles, we used the datasets of Reed et al. (2018) and Prata et al. (2019) (hereinafter, RE2018 and PG2019). Additionally, we prepared datasets using two RI models, PLAND and PLRHY. These models were described as “andesite” and “rhyolite (obsidian)” models by PL1973. The RI models applied in this work are listed in Table 1, and the characteristics of the models are described below.
Table 1Abbreviations for the refractive index (RI) datasets and RI models. The RI models of Reed et al. (2018) (RE2018; RE010–RE080) are listed in alphabetical order and labeled with the name of the corresponding volcanic ash sample. Numbers used for the RI models based on the Prata et al. (2019) (PG2019) dataset (PG000–PG100) represent the ratio of non-bridging oxygens to tetrahedrally coordinated cations (NBO/T). The values of NBO/T and SiO2 (wt %) for the RI models of RE2018 were calculated from bulk components of the ash samples and derived by PG2019. PLAND and PLRHY are “andesite” and “obsidian from Little Glass Mountain, California” by Pollack et al. (1973). The wavenumber dependence of each RI model is plotted in Figs. 3–5.

3.1 Refractive index dataset of Reed et al. (2018): RE2018
Using the assumptions of the Rayleigh continuous distribution of ellipsoids (CDE) scattering model for sampled ash particles and the Lorentz formulation for RI to ensure consistency with the Kramers–Kronig relationship, RE2018 constructed a spectral RI dataset of typical volcanic ash samples for wavelengths of 0.33–19 µm (526–3030 cm−1). RI data for eight ash samples from seven volcanoes (Askja, Aso, Eyjafjallajökull-a and -b, Grímsvötn, Nisyros, Spurr, and Tongariro) are available from the Aerosol Refractive Index Archive (http://eodg.atm.ox.ac.uk/ARIA/index.html, last access: 18 January 2022), as well as in the Supplement of PG2019 (https://doi.org/10.1029/2018JD028679). The spectral RIs of RE2018 over the wavenumber range of 650 cm cm−1 are plotted in Fig. 3. In the wavenumber range of 700 cm cm−1, the RI models of RE2018 showed weak absorption features that were not clearly expressed in the andesite and rhyolite models of PL1973. In previous attempts to simulate sounder-observed BTS, the calculated BTS tended to exhibit a positive bias in this wavenumber range (Gangale et al., 2010; Clarisse et al., 2013; Ishimoto et al., 2016; Clarisse and Prata, 2016). With the RE2018 RI models, improvements in BTS fitting are expected, although the relationships of chemical composition and volcano type (mafic or felsic) with the absorption index (imaginary part of the complex RI: k) at 700 cm cm−1 remain unclear. All RI models based on the RE2018 dataset have relatively weak absorption peaks (k≤1.0) and similar wavenumber dependence of k between 1110 and 1250 cm−1. The individual RI models of RE2018, RE020 (Aso), and RE080 (Tongariro) show a similar wavenumber dependence of k, although their NBO/T and SiO2 wt % values differ significantly. In addition, k from RE050 (Grímsvötn) exhibits a broad feature that differs from those of the other RI models of RE2018.
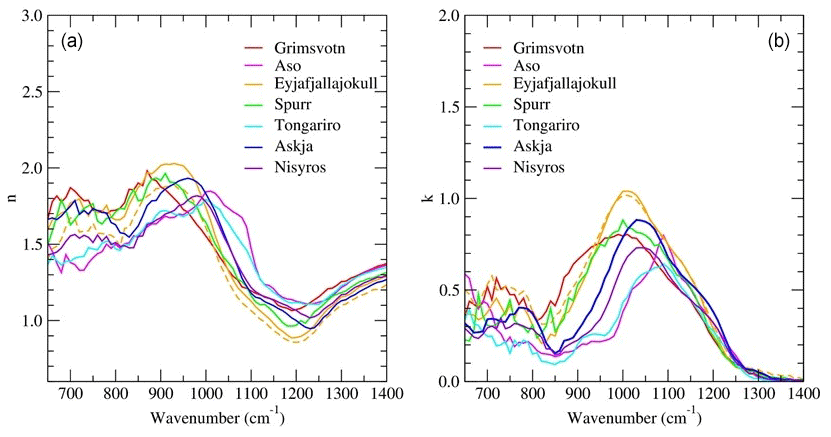
Figure 3Real n (a) and imaginary k (b) parts of the RE2018 complex RI models (). For Eyjafjallajökull ash samples, the solid and dashed yellow lines indicate Eyjafjallajökull-a and -b, respectively. See Table 1 for the abbreviations, NBO/T values, and SiO2 wt % of each RI model.
3.2 RI models parameterized by Prata et al. (2019): PG2019
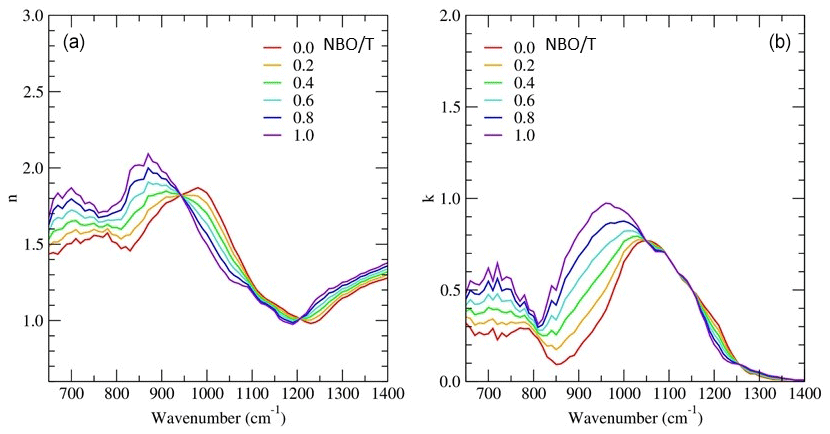
Using the RE2018 RI dataset and the results of laboratory analysis of the chemical composition of ash samples, Prata et al. (2019) provided a new parameterization for the ash RI, based on SiO2 content and NBO/T. According to Prata et al. (2019), NBO/T and SiO2 wt % in the bulk composition of the ash samples exhibited stronger correlations with the derived RI over a broad spectral range compared to glass composition. Furthermore, parameterization using NBO/T provides better results compared to using SiO2 wt % at both visible and infrared wavelengths. In this study, we used 11 RI models parameterized using NBO/T values between 0 and 1, with a step size of 0.1. The (n,k) data for the corresponding NBO/T values were calculated using a supporting spreadsheet from Prata et al. (2019), which is available from the publisher's website. Compared to the RE2018 dataset, RI models using NBO/T parameterization show simplified wavelength dependences in both the real and imaginary parts of the RI due to the use of linear regression. However, this simple parameterization is useful for VAC retrieval based on satellite remote sensing, given that an appropriate RI model can be specified in advance based on the assumed chemical composition of the ash aerosols. In that context, it is important to verify how well PG2019 RI models reproduce the BTS of infrared sounder measurements.
3.3 Andesite and rhyolite RI models of Pollack et al. (1973): PLAND and PLRHY
The two RI models PLAND and PLRHY are the andesite and rhyolite (obsidian from Little Glass Mountain, California) models of PL1973, respectively. These RI models were used for comparisons to the results of BTS simulations using RI models based on the RE2018 and PG2019 datasets.
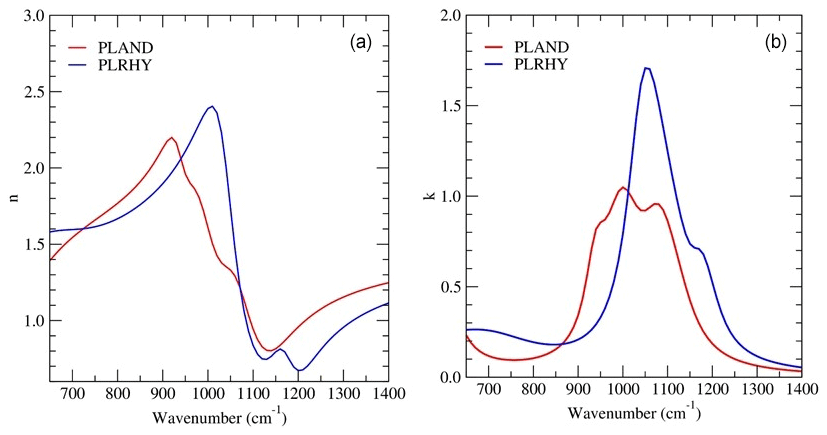
Figure 5The same as Fig. 3 but for the PLAND (red) and PLRHY (blue) models. These RI models are the andesite and rhyolite models of PL1973. The refractive index (n,k) values were calculated using dispersion parameters and the equations in PL1973.
To evaluate the RI models by comparing measured and simulated BTS, continuous data from an infrared sounder that covers the wavenumber range of 650–1400 cm−1 are desirable, and VAC data collected by IASI were used in this work. The IASI Level-1C granule data were acquired from the National Oceanic and Atmospheric Administration Comprehensive Large Array-Data Stewardship System (https://www.avl.class.noaa.gov/saa/products/welcome, last access: 18 January 2022). As a primary condition for BTS analysis, the brightness temperature difference between 10.7 µm (934.5 cm−1) and 12.2 µm (819.5 cm−1) was used, and pixels with K for VACs over the ocean were selected. For discriminating the results of BTS simulations from different RI models using radiative transfer calculations, VAC pixels with more negative values of ΔBTsplit are better, as the BTS of such pixels shows distinct wavenumber dependence due to absorption in the infrared window region. The value −2 K was chosen as the minimum requirement for discriminating the difference in BTS between the results of different RI models. We excluded VAC data over land due to large uncertainties in spectral surface emissivity and surface temperature.
Our radiative transfer model MBCRM conducts forward calculations for a single layer of VAC with no contamination from meteorological clouds (MCs) consisting of water or ice particles. Because MC contamination in VAC pixels can cause large estimation errors for VAC parameters and RI models (Kylling et al., 2015), contaminated pixels must be excluded to ensure the validity of the estimated RI model based on the results of our BTS analysis. In the case of VAC covered with dense MC layers, most measured pixels are rejected due to the condition K. On the other hand, if a portion of the pixel area is covered by MC or if the VAC is located above the MC layers, the MC can cause a negative bias in the measured BTS and still meet K. As a result, large errors may occur for the estimation of VAC parameters under the assumption of a single VAC layer. Furthermore, the detailed wavelength dependence of the BTS for such contaminated pixels may differ from that of the pure VAC. For these reasons, we used VAC data from daytime IASI measurements, and pixels that were presumed to be affected by MC were excluded through reference to visible true-color imagery for the same area from the Moderate Resolution Imaging Spectroradiometer (MODIS) on board the Terra and Aqua satellites. MODIS images were provided by the Level-1 and Atmosphere Archive & Distribution System Distributed Active Archive Centre and are available online (https://atmosphere-imager.gsfc.nasa.gov/images/l1b-granules, last access: 18 January 2022). The visible true-color image product of the Japanese geostationary meteorological satellite Himawari-8 Advanced Himawari Imager (AHI) (Bessho et al., 2016) was also used for volcanic eruptions since 2015 in the coverage area of Himawari-8 (images were downloaded from the Japan Aerospace Exploration Agency Himawari Monitor homepage: https://www.eorc.jaxa.jp/ptree/index.html, last access: 18 January 2022). Because we used daytime IASI measurements that could be referenced to MODIS images, the number of VAC pixels available for our analysis was reduced significantly. Furthermore, the evaluation of IASI pixels using MODIS-visible images does not always exclude MC contamination due to the time difference between IASI and MODIS measurements and the difference in sensor spatial resolution. Therefore, we added another condition for IASI pixels in our analysis. From a simple approximation of the thermal emissions from sea surface and clouds, the observed BT at a satellite is usually lower than that without MC when the MC is located between the ash plume and sea surface and when the ash plume is not optically thick. Using the brightness temperature at wavenumber νa, where the measured brightness temperature is maximized in the region of 750 cm cm−1 due to a local minimum of the absorption index k, the difference ΔBTclr between the brightness temperatures of clear sky BTclr(νa) and ash plumes BTobs(νa) was defined as []. The value of νa was derived from VAC measurements, and BTclr(νa) was calculated using our forward model. Following this, a threshold of ΔBTclr was set according to the value of ΔBTsplit. Figure 6 shows a plot of BTclr(νa) with respect to ΔBTsplit in 1026 IASI pixels of VAC measurements for the volcanic eruptions listed in Table 2. The pixels are selected based on the primary condition K over ocean areas, including nighttime data to increase the number of data points. The clear-sky brightness temperature BTclr(νa) was calculated using atmospheric profiles, sea surface temperature, and atmospheric pressure at the surface from the results of the global assimilation analysis (GANAL) using a four-dimensional variational method and the atmospheric state from the Global Spectral Model (GSM) in the operational numerical weather prediction system of the Japan Meteorological Agency (https://www.jma.go.jp/jma/jma-eng/jma-center/nwp/outline2019-nwp/index.htm, last access: 18 January 2022). In Fig. 6, pixels are discriminated between Eyjafjallajökull (blue) and other volcanic eruptions (red), and the two datasets in the plot show similar distribution patterns. If a pixel of pure VAC observation is contaminated with MC, the negative value of ΔBTsplit is likely to become smaller, while the value of ΔBTclr is likely to increase. Therefore, the data in the upper right of Fig. 6 may have higher probabilities of MC contamination than the data on lower left of the plot. In our retrieval analysis, a threshold value of ΔBTclr (K) was defined to reduce the fraction of MC-contaminated pixels:
and was applied as an additional retrieval condition. The coefficients of Eq. (2) were determined empirically, and approximately 30 % of all pixels with K were rejected due to this condition for the Eyjafjallajökull VAC shown in Fig. 6. The aim of this condition is to reduce the fraction of MC-contaminated pixels in our analysis; this threshold cannot be used to determine whether an individual pixel is contaminated with MC. Even for a pure VAC of a single homogeneous layer, ΔBTclr may be greater than ΔBTclr.th depending on the VAC parameters. In addition to MC contamination, the negative value of ΔBTsplit decreases, and ΔBTclr increases for VACs with larger particle sizes and optical depths, as shown in the scatter plot of Fig. 6, essentially the same as when the split-window plotting method is used (Prata, 1989; Wen and Rose, 1994; Prata and Grant, 2001) with the vertical and horizontal axes switched. As a result, the retrieval condition of Eq. (2) selects pixels of optically thin VACs composed of relatively small particles.
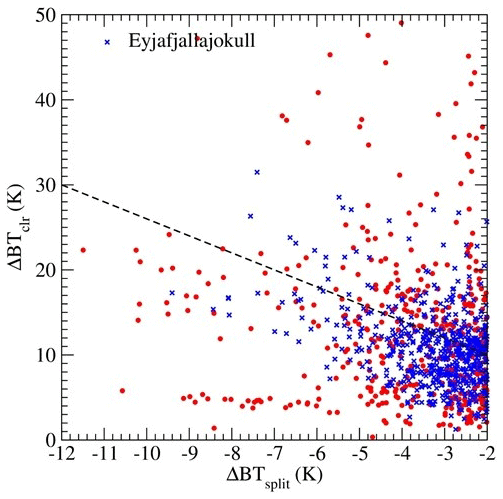
Figure 6Estimated brightness temperature difference ΔBTclr for VAC pixels of ΔBTsplit measured with IASI. In total, 1026 pixels of K from the volcanic eruptions listed in Table 2 were used. Data for Eyjafjallajökull eruptions (6–16 May 2010) are colored blue. The dashed line indicates the threshold of ΔTBclr from Eq. (2) used for retrieval analysis in this work.
For retrieval analysis, we selected up to 10 VAC pixels with large negative values of ΔBTsplit from a granular dataset of IASI measurements. Radiative transfer calculations and BTS simulations for the selected VAC pixels were conducted using assumptions for three VAC parameters: the pressure height of the plume top Ptop, optical depth τc at wavelength 11 µm (ν=907.488 cm−1), and effective radius of the ash particles reff, which were retrieval variables, and using the temperature and water vapor profiles and sea surface temperature and pressure from GANAL as fixed values. We set the pressure height of the plume base Pbase to hPa for simplicity. For the ozone profile, the total column of ozone was treated as a retrieval variable, and the relative values for the initial ozone profile from GANAL were fixed. A homogeneous volcanic SO2 gas layer with a pressure difference of 100 hPa between the top and base was assumed, with the pressure height of the layer top and total column used as variables. The estimated values of the retrieval variables were those for which the root mean square (rms) between measured and calculated brightness temperatures (BTobs and BTcal) in the assumed channels of number N is minimized. The RI models are primarily evaluated by comparing the rms values of various RI models.
Retrieval calculations were conducted using the scattering properties for ash particles derived from the selected RI model and data for IASI channels of 650 cm cm−1 with the following procedure.
- a.
VAC parameters are estimated using BTobs and BTcal for channels excluding the ozone band of 980 cm cm−1 and SO2 bands of 1100 cm cm−1 and 1320 cm cm−1. By changing the value of the VAC parameters Ptop from 100 hPa to PS−100 hPa (PS is the surface pressure) in 12 steps, reff from 0.1 to 5.0 µm in 10 steps, and τc from 0.1 to 5.0 in 15 steps, we calculate the radiance of all parameter combinations and search for a set of that makes the minimum rms. Following this, the minimum rms is searched again at a smaller step size for each VAC parameter within the range of the previous ±1 steps. The set of for the minimum rms is the final result for the VAC parameters for the specific RI model.
- b.
The total columns of ozone and SO2 column and top pressure are estimated using the channels 980 cm cm−1 for ozone and 1320 cm cm−1 for SO2, assuming the VAC parameters as fixed values. The wavenumbers 1100 cm cm−1 are excluded from estimation of the SO2 because the brightness temperature of these channels is strongly influenced by the applied ash RI model. For ozone, the column amount was set to a retrieval parameter, and the value was estimated using the Gauss–Newton method. For volcanic SO2, the layer top pressure is changed from 100 hPa to PS−100 hPa in the same way as for ash top pressure, and the column amount of SO2 gas is estimated by the Gauss–Newton method for each SO2 layer. The final results of the SO2 parameters are the top height and column amount that give the minimum rms in wavenumbers 1320 cm cm−1.
- c.
The rms for the channels 750 cm cm−1 is then calculated, considering the estimated VAC, ozone, and SO2 parameters as fixed. Although the range of 650 cm cm−1 is important for estimating the VAC parameters, especially the top height of the ash plumes, we exclude this range to avoid rms values related to error in the applied atmospheric profiles and to clarify the difference between the RI models in the atmospheric window region.
- d.
Processes (a) to (c) are conducted for all RI models.
The date and number of pixels in the selected IASI data for eruptions from seven volcanoes are listed in Table 2. The average value of the wavenumber at the local maximum of brightness temperature is also listed. A TAS (total alkali–silica) diagram based on the data of tephra samples of volcanos from the literature is shown in Fig. 7. In particular, νa is related to the minimum of the absorption index k and has been reported as an important parameter for identifying ash aerosols from infrared sounder measurements (Gangale et al., 2010; Clarisse et al., 2013; Clarisse and Prata, 2016). Using a total of 21 RI models, which are listed in Table 1, the mean rms of brightness temperature in the wavenumber range 750 cm cm−1 was determined for each RI model. In the following sections, we discuss the results for the RI models determined from rms values for the volcanic events in Table 2. The detailed results for rms and VAC parameters , ash top height htop estimated from Ptop and the GANAL profile, and total column and top height of SO2 for each IASI pixel are provided in the Supplement. The mineral composition of ash varies across different eruptions and within the same eruption at different times (Prata and Lynch, 2019). In this study, however, we assumed that the ash aerosols ejected from a given volcano remain the same throughout the period of each eruption event in Table 2 and that the RI model is evaluated using the average of the rms over all pixels for a given volcano. Even if its mean rms was the smallest, we rejected an RI model as unrealistic if the converged values of reff reached the minimum size 0.1 µm for many pixels in the retrieval analyses. In addition to the differences among RI models, the size of ash particles effectively changes the wavelength dependence of the simulated BTS (Clarisse and Prata, 2016; Ishimoto et al., 2016), and small values of reff tend to be estimated when a relatively mafic RI model is used with low SiO2 wt % or large NBO/T values. The relationship between the estimated reff value and the RI model in the retrieval analysis is discussed in Sect. 5.1.
In our radiative transfer calculations for the BTS simulations, we assumed that the VAC is distributed homogeneously within the area of the IASI pixel footprint (∼12 km in the nadir direction). Note that the estimated VAC parameters might have large errors if the VAC is only partially distributed within the pixel area (VAC fraction <1). Of the three VAC parameters, ash top height was relatively sensitive to the assumed ash fraction, and the homogeneous layer assumption tended to derive a lower height of Ptop. Furthermore, the BTS simulations in this work include many potential error sources in addition to MC contamination, such as the error due to the monochromatic approximation of Eq. (1) in radiative transfer calculations for ash plumes, interpolation error of ash optical properties from the data table in MBCRM, applied atmospheric profiles and sea surface temperature and emissivity, and the assumption of a homogeneous plane-parallel ash layer. Therefore, the results of the following analysis and discussion may change if different assumptions and numerical methods were applied for the ash plume analysis.
Table 2Volcanic eruption events used for BTS analysis of IASI measurements and examples of the RI models. The RI models were selected through a comparison between measured and simulated BTS for IASI pixels on dates listed in the column “date”. Plural RI models in the column “RI model” indicate that the results of BTS fitting were almost the same. The average wavenumber is that at which the measured brightness temperature is maximized in the range of 750 cm cm−1. For the Calbuco eruptions, RI models for different ash plume locations, Calbuco_A and Calbuco_B, are listed separately.
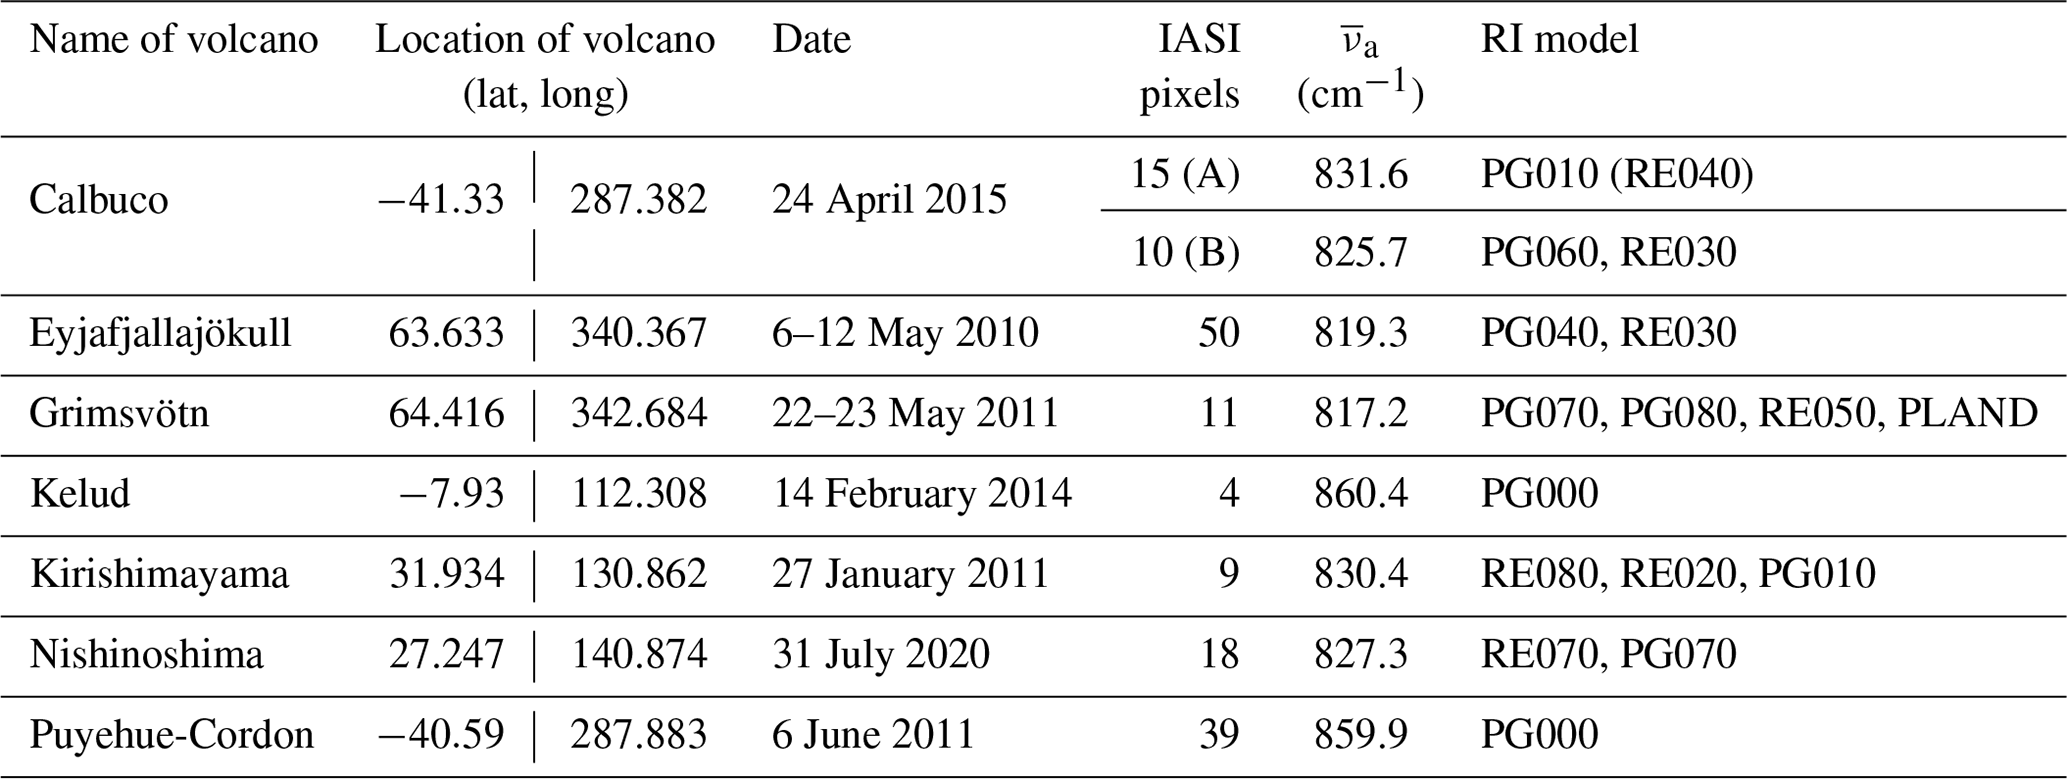
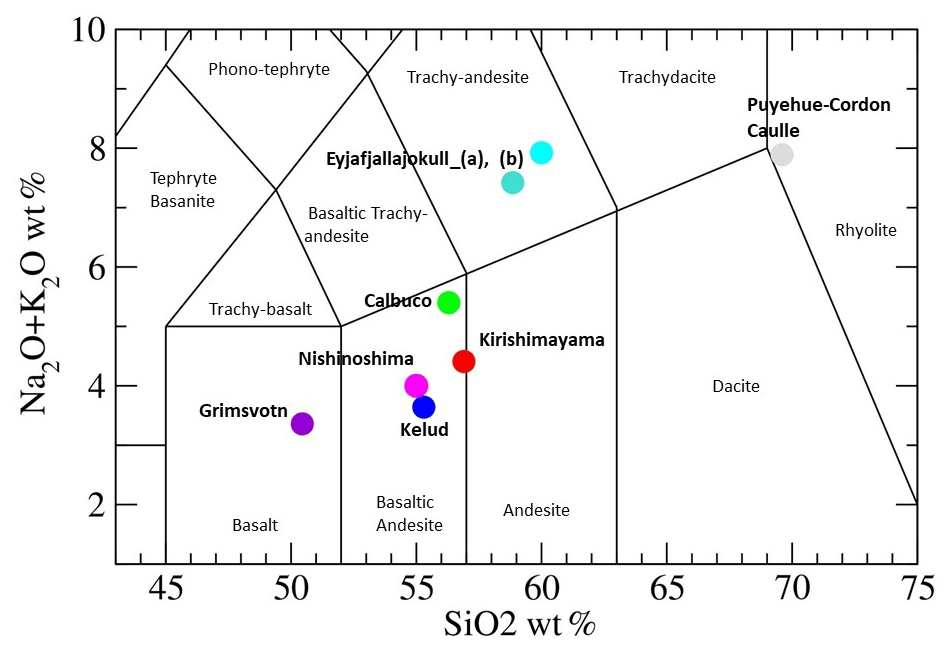
Figure 7Total alkali–silica (TAS) diagram based on ash and pumice samples of the volcanos featured in Table 2. SiO2 and Na2O + K2O wt % values for each volcano were obtained from the literature as follows: Calbuco values are from Deguine et al. (2020); Eyjafjallajökull and Grímsvötn values are from Reed et al. (2018) and Prata et al. (2019), respectively; Kelud values are from Maeno et al. (2019); Kirishimayama values are from https://www.gsj.jp/hazards/volcano/kirishima/2011/works-index.html (last access: 18 January 2022); Nishinoshima values are from https://www.data.jma.go.jp/svd/vois/data/tokyo/STOCK/kaisetsu/CCPVE/shiryo/147/147_2-2.pdf (last access: 18 January 2022; p. 19); and Puyehue-Cordón Caulle values are from Castro et al. (2013).
Selected IASI measurements for the eruption events of seven volcanoes and examples of the RI models are listed in Table 2. Figure 8 shows ranking plots for the results of rms analysis for each measurement pixel, and Fig. 9 shows the mean and standard deviation for each volcano. Ranking based on the smallest rms was conducted for the 21 RI models. Detailed results for each RI model in each pixel, including the minimum rms, estimated VAC parameters , and SO2 top height and column amount, are provided in the Supplement. From the scattered distribution of the ranking in Fig. 8 and from the mean and standard deviation of the rms in Fig. 9, the basic features of BTS for the ash plumes measured by IASI can be reproduced by several RI models, although we chose typical RI models 1–4 in Table 2. Moreover, statistical discussions are difficult for some eruptions, such as Kelud and Kirishimayama, because of the small number of pixels available for the analysis. Therefore, the selection of the RI models used here may change depending on the measurement dataset and the numerical conditions in the BTS simulations.
The RI models from the PG2019 dataset were selected for all volcanic events. Furthermore, high-ranking RI models tended to converge at a specific value of NBO/T in the PG2019 dataset. This result suggests that NBO/T, which can be determined from the chemical composition of the ash, is an effective indicator of the appropriate RI model for satellite VAC analysis. On the other hand, the andesite model of PL1973 (PLAND) was not selected for the high-ranking RI models, except for the Grímsvötn eruptions. This result shows that the novel RI models of RE2018 and PG2019 are useful for simulating the measured BTS for various types of volcanic plume.
The results of VAC analysis for individual volcanoes are discussed in the following subsections. Typical results of the BTS simulations are shown in the figures, and the estimated VAC parameters, SO2 column and top height, and RI model used for each simulation are summarized in Table 3.
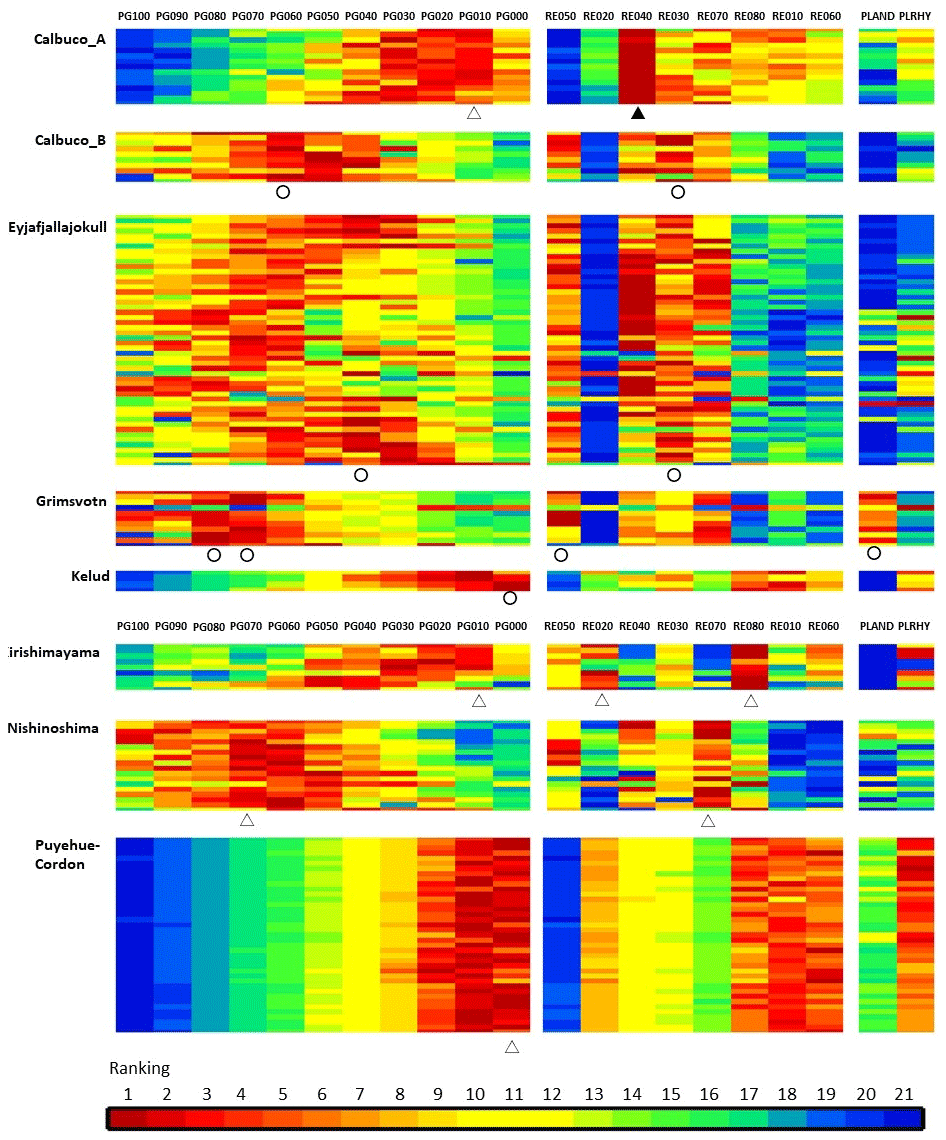
Figure 8Ranking plots showing the results of BTS simulations for the pixels used for the IASI ash plume measurements in Table 2. The ranking of the 21 RI models is in ascending order of the rms values between the measured and simulated BTS. Results for different pixels are shown on different lines, which are ordered by the date and time of IASI granule measurements from top to bottom. The 11 RI models using the PG2019 dataset are arranged based on NBO/T values (0.0 to 1.0 in steps of 0.1 from right to left), while the eight RI models using the RE2018 dataset and two RI models from PL1973 (PLAND/PLRHY) are arranged based on SiO2 wt % (Table 1). The RI model for the volcano (Table 2) was determined from the average of rms values for the corresponding measurement pixels. A circle indicates that the BTS simulated using the RI model provides a good fit to the measured BTS, and other RI models are indicated by open triangles (▵). The RI model with a solid triangle (▴) resulted in the smallest average of rms values but was rejected because many estimated reff values reach the assumed minimum size 0.1 µm.
Table 3Locations of IASI pixels, applied RI models, retrieved VAC parameters , and SO2 column (in Dobson units) and top height (km) for BTS simulations of typical VAC. BTS data for simulations and measurements are provided in the Supplement.
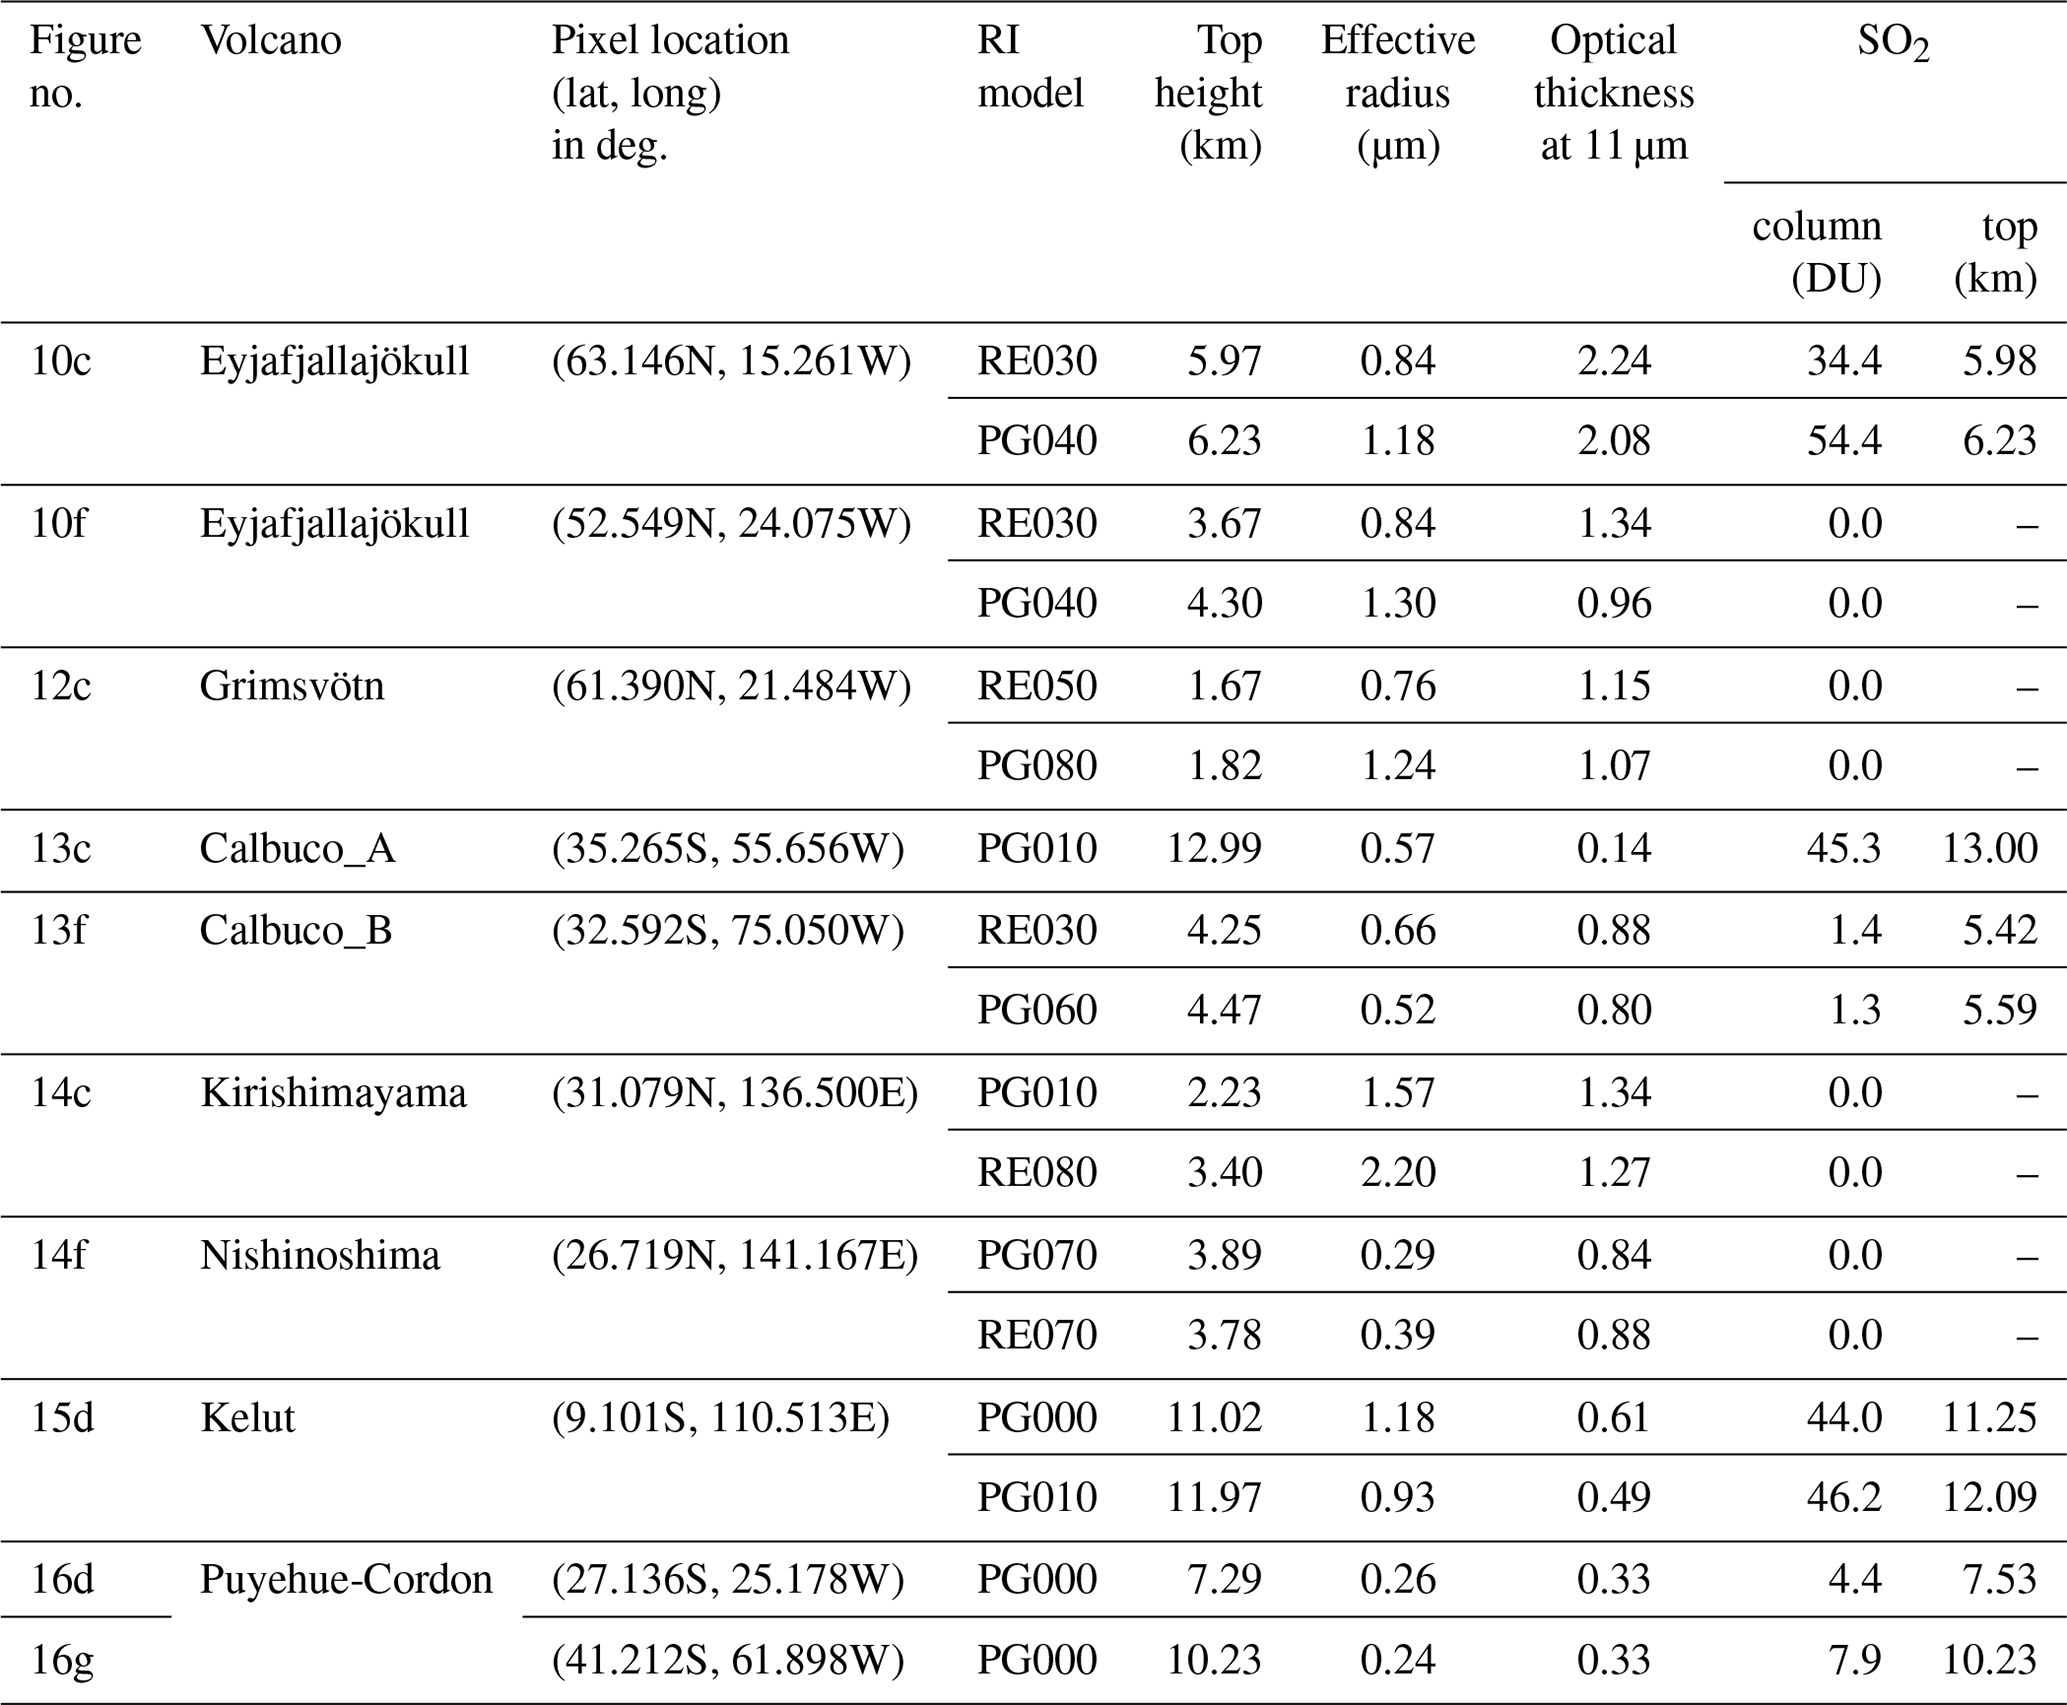
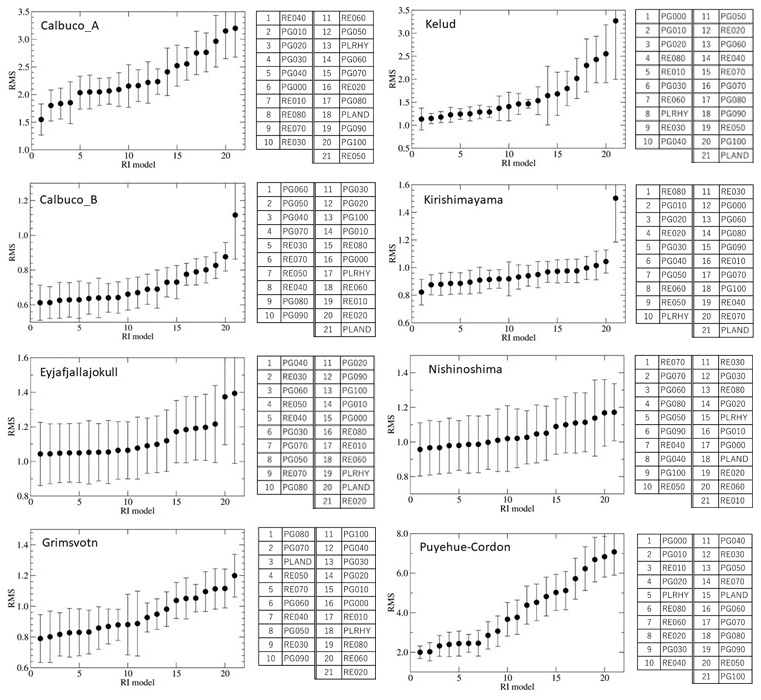
Figure 9Results of the rms (filled circle) for each RI model averaged over the pixels of the eruptions in Table 2. The error bar indicates the standard deviation. The RI models are arranged in order from smallest to largest rms from left to right, and the corresponding RI models are listed on the right.
5.1 Eyjafjallajökull
In the case of the Eyjafjallajökull eruptions in 2010, RI models developed from the results of laboratory analysis of ash samples were provided by RE2018, and data of IASI measurements were obtained. Simulations of the measured BTS were conducted using 50 BTS datasets for IASI pixels that satisfied our retrieval conditions over the period of 6–12 May 2010. Overall, the RI models of NBO/T = 0.3–0.6 (PG030–PG060) for the PG2019 dataset and the RI model Eyjafjallajökull-a (RE030) using the RE2018 dataset showed good BTS fitting results (Fig. 9). Specifically, RE030 and PG040 gave similar values for the smallest of average rms values over the 50 total pixels. Typical results of BTS analysis for the Eyjafjallajökull VAC are shown in Fig. 10. For these IASI measurements, true-color images from the MODIS product (Fig. 10a and d) taken near the IASI measurement time were obtained. Through comparison with the color image shown in Fig. 10a, the influence of MCs appears small in the vicinity of IASI pixels with highly negative ΔTBsplit values in Fig. 10b. The results of BTS simulation with RE030 and PG040 were similar and in good agreement with the measured BTS, although some differences occurred for the estimated VAC parameters (Table 3). Because PG040 is parameterized by NBO/T = 0.4 and this NBO/T value is close to that of the Eyjafjallajökull-a ash sample (0.38), the wavenumbers of the local minimum and local maximum of the absorption index k obtained using PG040 were similar to those of RE030 (Figs. 3 and 4). Thus, the results of the BTS simulations shown in Fig. 10c arose from the similarity of the spectral pattern of k between PG040 and RE030. Another Eyjafjallajökull VAC was located more than 1000 km from the volcano on 9 May 2010 (Fig. 10d–f). In IASI measurements, pixels with highly negative values of ΔTBsplit are present in the area of 51∘ N ≤ lat ≤ 54∘ N and 20∘ W ≤ long ≤ 28∘ W (circle in Fig. 10e); a faint VAC with sparse broken clouds was inferred in this area from the MODIS color image, and an ash optical thickness of 0.15–0.20 at visible wavelengths was estimated by Ventress et al. (2016). Figure 10f shows the results of BTS simulation for one of the nine selected pixels in this area. As shown in Fig. 10c, the BTS simulated using PG040 and RE030 agree well with the measured values, and the effect of MC contamination on the measured BTS appears minor. The average VAC parameter values over the nine pixels were for PG040 and for RE030. The values of htop and reff are consistent with the mode values of the estimated htop and reff histograms based on IASI data from the same day (Ventress et al., 2016). In our analysis of 50 total pixels showing the Eyjafjallajökull VAC from 6–12 May, the average value of the effective radius was 1.08 µm (0.95 µm) with the PG040 (RE030) RI model, which agrees with the results from aircraft observations stating that reff was in the range of 0.87–1.19 µm (Turnbull et al., 2012; Ventress et al., 2016).
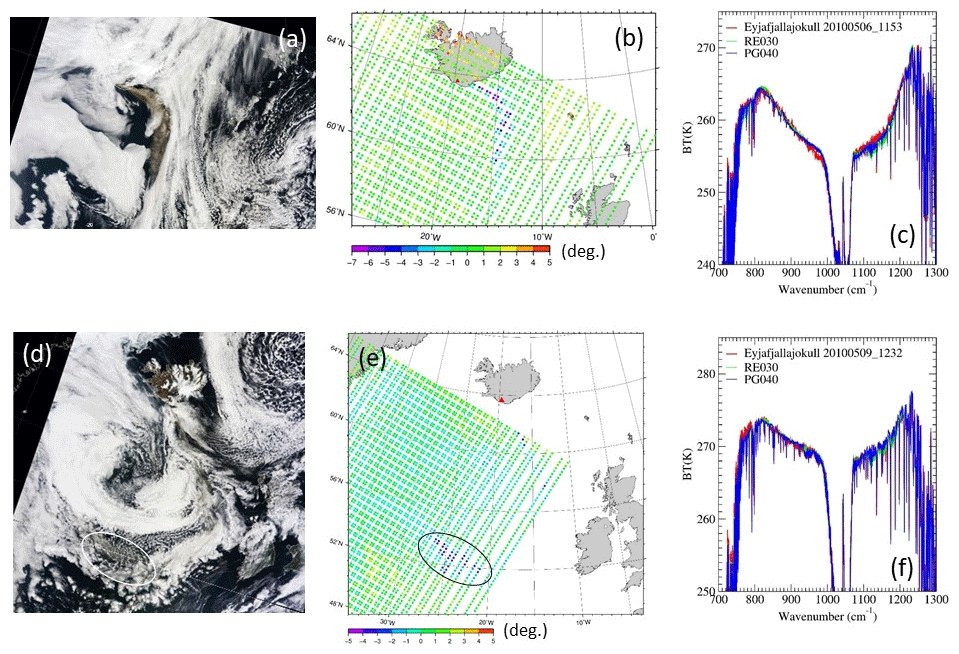
Figure 10Examples of BTS analyses of the Eyjafjallajökull VAC on 6 May 2010 (a–c). (a) MODIS true-color image at 11:55 UTC and (b) brightness temperature difference ΔBTsplit measured with IASI at 11:53 UTC. (c) BTS of IASI measurement at (lat, long) = (63.146∘ N, 15.261∘ W) (red), and results of BTS simulations using the RI models RE030 (green) and PG040 (blue). (d–f) The same as (a–c), but for the VAC on 9 May 2010. The MODIS color image is a composite from 12:25–12:30 UTC (d), and IASI ΔBTsplit is calculated at 12:32 UTC (e). The area of highly negative ΔBTsplit is indicated with circles in (d, e). (f) Measured and simulated BTS for the IASI pixel at (lat, long) = (52.549∘ N, 24.075∘ W). The retrieved VAC parameters and SO2 for each BTS simulation are listed in Table 3.
Using the retrieval results for 50 pixels of Eyjafjallajökull VAC measurements under various RI models (PG070, PG040, and PG010), the dependence of the RI model on the estimated VAC parameters was investigated (Fig. 11a–c). In particular, the results for reff showed a strong dependence on RI model selection (Fig. 11b). Within the PG2019 dataset, small values of reff tend to be estimated for mafic RI models with large NBO/T. By contrast, relatively large reff values were derived for felsic RI models. Similar dependence of RI models on estimated reff was also confirmed for our VAC retrievals related to other volcanic events listed in Table 2. Using a pixel with small differences in retrieved htop and τc among the three RI models (pixel no. 12), the results of BTS simulations with different reff values and with different RI models are plotted in Fig. 11d and e, respectively. If we assume that the RI model of PG040 is adequate for Eyjafjallajökull ash aerosols and that the retrieval result reff∼1.0 µm using PG040 is close to the true value, a positive bias of the simulated BTS in the region of 900 cm cm−1 occurs, except within the ozone band, when we use a more mafic RI model (PG060 and PG080) than PG040 with the same reff value (Fig. 11e). The positive bias of the BTS is mitigated by applying a smaller value of reff and keeping the other VAC parameters constant in the BTS simulation, as shown in Fig. 11d. By contrast, a negative bias of the BTS occurs in the same wavenumber range when we use a more felsic RI model (PG000 and PG020 in Fig. 11e), and fitting of the calculated BTS improves when a larger reff value is used for the ash particles as in Fig. 11d. Thus, the retrieval results of reff are sensitive to the wavenumber dependence of the particle absorption property around 900 cm cm−1. As such, the selection of the proper RI model is important for estimating reff. In our BTS analysis of the Eyjafjallajökull VAC, PG040 and RE030 were selected as their fitting results were better than those of other RI models in wavenumber regions other than 900 cm cm−1 (in particular, 750 cm cm−1).
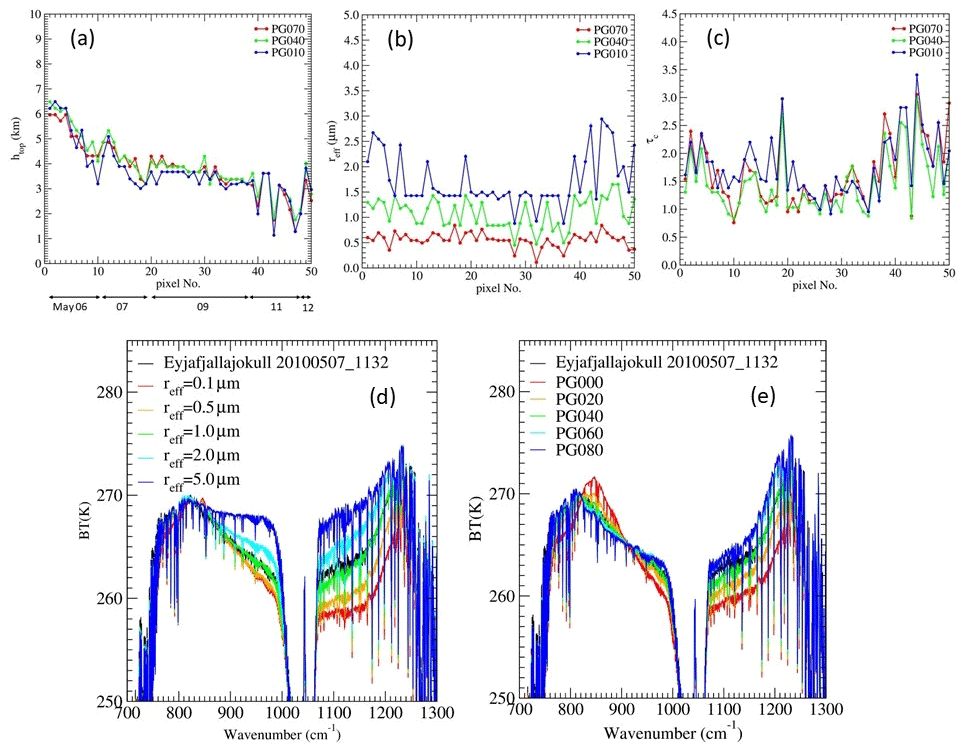
Figure 11VAC parameters plume top height htop (a), particle effective radius reff (b), and optical thickness τc (c) estimated from our BTS analysis of 50 IASI pixels for Eyjafjallajökull VAC measurement. Observation dates corresponding to the serial number of the pixel are shown in the lower part of (a). Panels (d) and (e) show examples of measured and calculated BTS using IASI data for pixel no. 12 (7 May 11:32 UTC, (lat, long) = (61.669∘ N, 15.370∘ W)). The green line in (d, e) indicates the BTS calculated using the PG040 RI model and the VAC parameters , while the BTS calculated after changing the reff value is plotted in (d). Panel (e) is the same as (d) but using PG000–PG080 RI models and the VAC parameters .
5.2 Grimsvötn
For the Grímsvötn eruptions in May 2011, both the RI model from the laboratory experiments of RE2018 and IASI measurements of ash plumes were obtained. From IASI data for the Grímsvötn VAC, 1 pixel at 12:08 UTC on 22 May and 10 pixels at 11:47 UTC on 23 May were selected for our BTS analysis. The measured IASI pixels of K on 23 May (Fig. 12b) were estimated to have low MC contamination based on the MODIS color image taken at 12:05 UTC (Fig. 12a). Moreover, from this MODIS color image, MCs in the area of the VAC were determined to be located at higher altitudes than the VAC (F. Prata et al., 2017), suggesting that the MC-contaminated pixels were effectively excluded from the target pixels in our BTS analysis. For VACs from Grímsvötn eruptions, the BTS based on IASI measurements was reported to produce good simulation results using the basalt RI model of PL1973 (Newman et al., 2012). The results of our BTS simulations showed that a small rms was obtained for the PG070 and PG080 RI models using the PG2019 dataset, and RI models derived from data on Grímsvötn (RE050) and Spurr (RE070) ash samples listed in the RE2018 dataset and the andesite model (PLAND) of PL1973 returned relatively small rms values. Absorption features related to SO2 gas were not present in the BTS of 11 analyzed pixels, in accordance with the report of SO2 gas separation from ash plumes (F. Prata et al., 2017); thus, PG070-PG080, RE050, and PLAND were selected as the typical RI models based on their mean rms scores. The estimate of NBO/T for the Grímsvötn ash sample was 0.74–0.75, which is the highest value within the RE2018 dataset (Prata et al., 2019). Because the PG2019 dataset was derived from NBO/T parameterization using the RE2018 dataset, the wavelength dependence of PG070–PG080 is similar to that of RE050. As a result, similar VAC parameters were estimated for PG070–PG080 and RE050, and the average values over 11 pixels, i.e., (1.59 km, 1.47 µm, 2.04) for PG070 (PG080) and for RE050. This result for reff generally agrees with published results for a Grímsvötn ash sample (1.1 µm) (Reed et al., 2018). For plume top height, Moxnes et al. (2014) estimated htop≤4 km through the analysis of IASI data, and similar results for plume height were obtained using the Inversion Technique for Emission Modeling (Harvey et al., 2020). According to the measurements using Cloud-Aerosol Lidar with Orthogonal Polarization (CALIOP) on board the Cloud-Aerosol Lidar and Infrared Pathfinder Satellite Observation (CALIPSO), the top heights of the Grímsvötn VAC at 60–62∘ N and ∼20∘ W on the same day were around 3 km, and the backscatter peak heights were less than 2 km (Taylor et al., 2019). Although our estimated values of htop are smaller, they are generally consistent with previous research.
An example of the results from BTS simulations is shown in Fig. 12c. Due to the small SO2 contribution, the BTS in the range of 1100 cm cm−1 is mainly driven by the optical properties of ash particles, and the difference in the BTS of PG080 and RE050 was small in this wavenumber range.
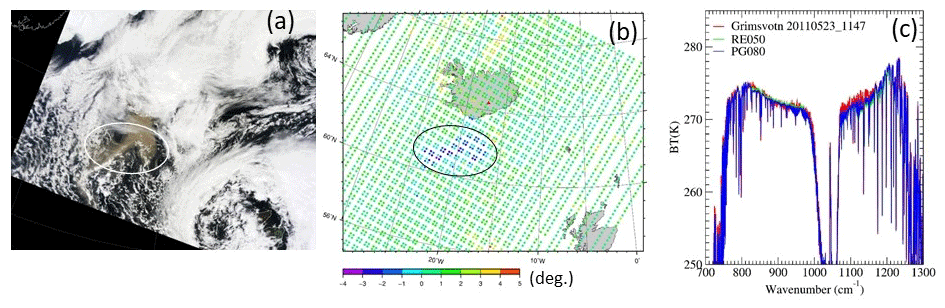
Figure 12Grímsvötn VAC on 23 May 2011, shown in a MODIS true-color image taken at 12:05 UTC (a), ΔTBsplit from IASI measurements at 11:47 UTC (b), and the BTS of the IASI pixel at (lat, long) = (61.390∘ N, 21.484∘ W) (red) (c). The results of BTS simulations using RE050 (green) and PG080 (blue) are also shown in (c).
The selected RI models for simulating the observed BTS of the Eyjafjallajökull and Grímsvötn VACs had similar NBO/T values to those of ash samples from the same volcanic eruptions. This result indicates that the BTS of VACs obtained from satellite infrared sounder measurements is related to the spectrum of the ash RI and VAC parameters. Furthermore, it supports the proposals of Reed et al. (2018) and Prata et al. (2019) that an appropriate RI model for VAC retrieval from satellites can be determined using the NBO/T (or SiO2 content) of ash samples. In addition, our results suggest that infrared sounder measurements for VAC may help to choose ash RI models under certain atmospheric and numerical conditions to perform exact radiative transfer calculations, provided that enough RI models have been prepared in advance.
5.3 Calbuco
In the series of Calbuco volcanic activity from 22 April 2015, IASI data for brightness temperature at 13:29–13:32 UTC on 24 April were used for our retrieval analysis. At this time, ash plumes with negative ΔTBsplit were observed over the Atlantic Ocean near the estuary of the La Plata River at latitudes of 35–38∘ S and longitudes of 55–56∘ W (Calbuco_A: Fig. 13b), as well as over the Pacific Ocean near the west coast of Chile at 32–33∘ S and 73–76∘ W (Calbuco_B: Fig. 13e). From the MODIS color image taken at 13:35 UTC (Fig. 13a), it appeared that the effect of MCs on the BTS was small for pixels with large negative values of ΔBTsplit in Calbuco_A. Although another VAC was confirmed around latitude 40∘ S in the MODIS image shown in Fig. 13a, the IASI pixels had slightly negative or positive ΔTBsplit values, suggesting ice particles within or above the VAC layer. BTS analyses were conducted for 15 pixels with large negative ΔBTsplit values in Calbuco_A. Small total rms values were obtained from the PG010–PG030 RI models with the PG2019 dataset and RE040 with the RE2018 dataset, and the smallest rms was obtained from RE040 (Figs. 8 and 9). The estimated reff values were small overall and were less than 0.2 µm for most pixels when relatively mafic RI models (PG030–PG100 of PG2019 dataset) were applied. For the RE040 RI model, low reff values of less than 0.2 µm were obtained for most of the analyzed pixels, and the smallest effective radius reff=0.1 µm in our LUT was estimated for 8 of the 15 total pixels within Calbuco_A. These small reff values are mainly related to the fitting of the BTS in the range of 1070 cm cm−1, as discussed in Sect. 5.1 (Fig. 11). The area of pixels with large negative ΔBTsplit in Fig. 13b is ∼1500 km from Calbuco volcano, and the particle size of the VAC is expected to be reduced due to depositional segregation during transportation in the atmosphere. Although a reff<0.2 µm may not be too small for the ash particles present in this area, we considered the PG010 RI model, which had the second smallest mean rms after RE040 and averaged reff≥0.2 µm, to be the better RI model in this study. As shown in Fig. 13c, the absorption feature of SO2 gas is clearly apparent in the measured BTS, and the results of BTS simulations approximately agree with the measurements. However, the rms values between measurements and simulations were relatively large for all pixels, and systematic deviation from the measurements occurred even with PG010. For the retrieval calculations for the IASI pixels near Calbuco_A, similar rms values were obtained at different VAC top heights, htop= 5–7 km and htop>10 km. According to the CALIOP measurements at 17:31–17:45 UTC of the same day, the height of the VAC near the Calbuco_A region was 15–18 km. Therefore, we considered the retrieved VAC parameters when the estimated top height htop>10 km (Table 3) to be closer to the true values.
MODIS observed the Calbuco_B region at 15:00 UTC (Fig. 13d). We inferred the presence of an optically thin VAC in an area with little MCs, although the MODIS observation was made 1.5 h after that of IASI. As SO2 absorption features were weak in the BTS from IASI measurements, we deduced that the measured BTS patterns arise mainly from the optical properties of the VAC. In BTS simulations for 10 pixels in Calbuco_B, high-ranking RI models tended to have greater NBO/T in the PG2019 dataset compared with the results of Calbuco_A (Fig. 8); results from the RI models PG040–PG070 and RE030 had small rms values. The reason for this difference between the results of Calbuco_A and Calbuco_B has not been determined. According to the compositional analyses of Romero et al. (2016) and Deguine et al. (2020), Calbuco ash samples are of the basaltic andesite type with a SiO2 wt % of 55–56.3, which is a similar or more mafic composition than Eyjafjallajökull ash samples. Our results for Calbuco_B pixels are relatively consistent with the compositional analysis results; however, the PG040–PG070 RI had large rms errors for Calbuco_A pixels in our retrieval analysis.
We concluded that the measured BTS of the Calbuco_A VAC were due to small, relatively felsic ash particles. Although we examined the contamination of ice clouds and internal mixing of sulfate and mafic ash particles using simple optical models in the preliminary calculations and the results were not successful, we cannot exclude the possibility that other factors explain the BTS of Calbuco_A.
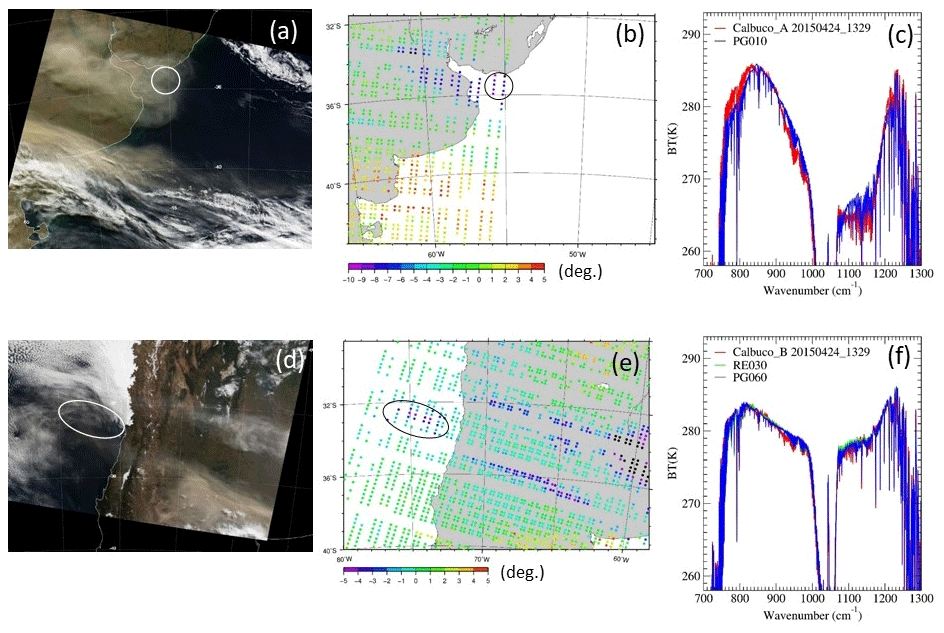
Figure 13Brightness temperature difference ΔBTsplit of Calbuco ash plumes measured by IASI at 13:29 UTC on 24 April 2015 over the Atlantic Ocean (Calbuco_A, b), and the measured (red) and calculated (PG010, blue) BTS for the pixel at (lat, long) = (35.265∘ S, 55.656∘ W) (c). MODIS visible-color image of the same region at 13:25 UTC (a). (d–f) The same as (a–c) but for ash plumes over the Pacific Ocean (Calbuco_B, marked with a circle in e) and the measured BTS at (lat, long) = (32.592∘ S, 75.050∘ W). Calculated BTS without SO2 gas from the RE030 (green line) and PG060 (blue line) RI models are also shown. The measurement time of the MODIS color image (d) was 15:00 UTC.
5.4 Kirishimayama and Nishinoshima
During the Kirishimayama eruption on 26 January 2011, ash plumes were transported in the southeast direction over the Pacific Ocean, and IASI measured the VAC to the south of the Japanese archipelago at 00:08 UTC on 27 January (Fig. 14b). The MODIS image taken at 01:05 UTC (Fig. 14a) suggests that the VAC in the region of highly negative ΔBTsplit is distributed above the streaks of MCs, and VACs with lower MC contamination are expected in locations between the MC streaks. Due to the 1 h time difference between IASI and MODIS measurements, the pixels for analysis were determined using only IASI data. Among 30 pixels of K, 21 pixels were rejected under the condition of Eq. (2), suggesting that many IASI pixels were contaminated with MCs. For the BTS of the remaining nine pixels, the RI models RE080, RE020, and PG010-PG020 provided small rms values. The results of BTS simulations for RE080 and PG010 generally agree with measured values (Fig. 14c). However, some small differences between the measured and calculated BTS were confirmed, such as a negative bias in the RE080 simulation around 920 cm−1. From the plot ranking shown in Fig. 8 for the PG2019 dataset, the Kirishimayama VAC at this time tended to fit the results of RI models with smaller NBO/T values than the Eyjafjallajökull and Grímsvötn ash plumes. This result is reasonable considering the reported SiO2 contents of the ash samples and the average local maximum of cm−1, which is a greater wavenumber than the local maxima for Eyjafjallajökull and Grímsvötn (Table 2). However, the possibility of MC contamination of the BTS for all VAC pixels in this area cannot be excluded. Further precise analysis of the Kirishimayama VAC, including nighttime measurements with no MC contamination, is necessary. An algorithm for detecting MC contamination in the VAC using infrared channels will be essential to solving this problem.
Compared to Kirishimayama, the VACs of Nishinoshima, which were observed by IASI at 00:08 (Fig. 14e) and 23:47 UTC on 31 July 2020, were easily identified by the AHI data on board the geostationary satellite Himawari-8 as having less MC contamination (Fig. 14d). In BTS simulations for 18 pixels with large negative values of ΔBTsplit, the RI models RE070 with the RE2018 dataset and PG050–PG080 with the PG2019 dataset returned small rms values and small effective radius estimates (reff≤0.6 µm) for all pixels. As shown in Fig. 14f, the calculated BTS fit well to the measured BTS, especially at wavenumbers ν≥1050 cm−1; however, systematic errors in the range of 750 cm cm−1 were also observed. From the results of chemical analysis of volcanic ash samples from eruptions on 14 and 20 July 2020, it has been estimated that the bulk composition of the Nishinoshima volcanic product apparently changed from andesite (59–60 SiO2 wt %) to basaltic andesite (54–55 SiO2 wt %) during the 2019–2020 eruptions. Our result of relatively mafic RI models for the Nishinoshima VAC indicates that the BTS analysis might detect the compositional variation in the VAC from satellite measurements.
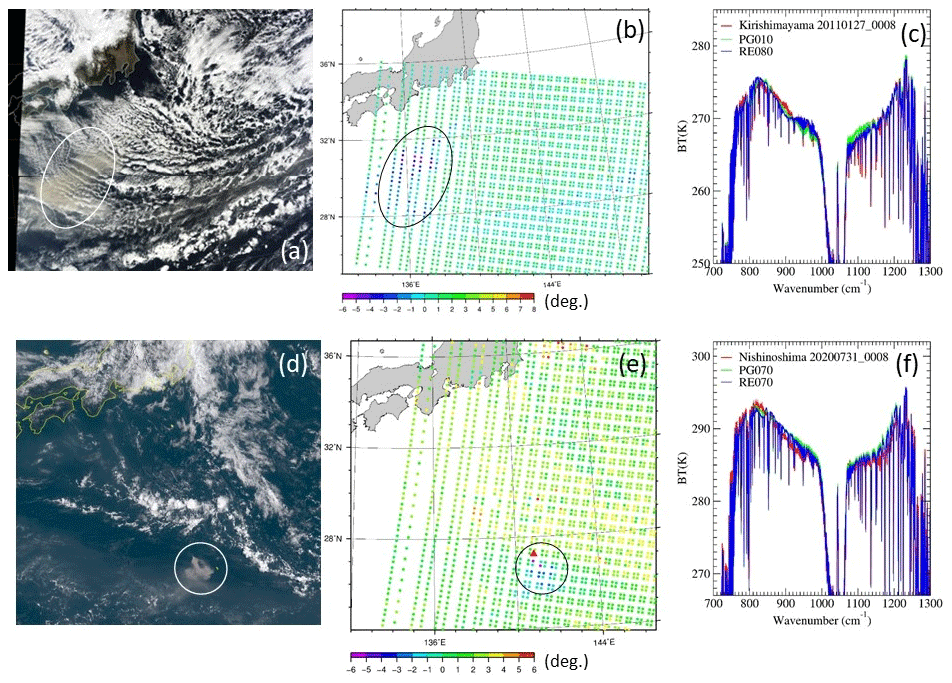
Figure 14(a–c) Composite MODIS image of the Kirishimayama VAC at 01:05 UTC on 27 January 2011 (a), and ΔBTsplit from IASI data at 00:08 UTC on the same day (b). Results of BTS simulations for the pixel at (lat, long) = (31.079∘ N, 136.500∘ E) and the measured values are shown in (c). The RI models PG010 (green) and RE080 (blue) were used for the BTS simulations. For the Nishinoshima VAC on 31 July 2020, the visible true-color image (d) is from the Himawari-8/AHI observation at 00:00–00:09 UTC, and ΔTBsplit is from IASI at 00:05–00:08 UTC (e). (f) Measured and calculated BTS for the pixel at (lat, long) = (26.719∘ N, 141.167∘ E). The RI models PG070 (green) and RE070 (blue) were used for simulations.
5.5 Kelud
For the VAC from the Kelud eruption event on 13 February 2014, Ishimoto et al. (2016) analyzed data obtained by the Atmospheric Infrared Sounder (AIRS) on board the Earth Observing System Aqua polar-orbiting satellite and estimated that the spectral RI of the Kelud VAC was at an intermediate value between the andesite model and the rhyolite (obsidian) model of PL1973. In their analysis, a mixture of these two RI models was assumed as the a priori RI, and the spectral RI in the wavenumber range of ν≥1100 cm−1 was omitted due to missing spectral data between 1137 and 1216 cm−1 from the AIRS measurements. Furthermore, MC contamination was not considered for pixels with highly negative ΔBTsplit values, although MC contamination may cause large errors in RI estimation. For the Kelud VAC at this time, Kylling (2016) reported that a mixture of ice clouds and ash plumes in an IASI pixel can explain the observed BTS from the PL1973 andesite model. In this work, retrieval analyses of the Kelud VAC were repeated using IASI pixels with less MC contamination, as estimated from visible images and from the condition of Eq. (2).
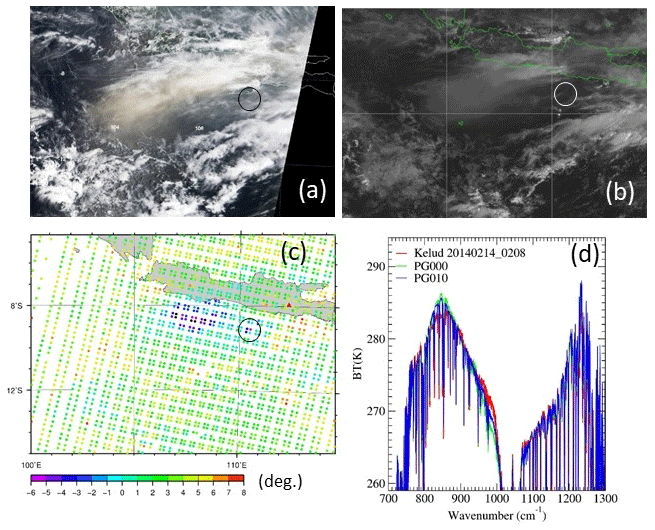
Figure 15Kelud ash plumes on 14 February 2014. MODIS true-color image taken at 03:35 UTC (a) and monochromatic Himawari-7 visible image taken at 02:00 UTC (b). ΔBTsplit from the IASI measurement at 02:08 UTC (c) and measured and calculated BTS for the pixel at (lat, long) = (9.101∘ S, 110.513∘ E) (d) (indicated by circles in a–c).
In the IASI data of the Kelud VAC observed at 02:08 UTC on 14 February (Fig. 15c), all pixels with K in the region of 8.0∘ S ≤ lat ≤ 9.5∘ S and 106.5∘ E ≤ long ≤ 109.5∘ E were rejected under the condition of Eq. (2), and four pixels (indicated by the circle in Fig. 15c) were retained for our retrieval analysis. This result suggests that most VAC measurements are affected by MC contamination, which is consistent with the conclusion of Kylling (2016) that IASI measures both ash and ice clouds in the same pixel. The area of the four retained pixels is presumed to be covered with thin ash plumes and to have fewer MCs based on the MODIS true-color image taken at 03:35 UTC (Fig. 15a) and the Himawari-7 visible monochromatic image taken at 02:00 UTC (Fig. 15b). The results of BTS simulations showed that the BTS of the Kelud VAC could be simulated well using relatively felsic RI models with small NBO/T values and the PG2019 dataset (Figs. 8 and 9), with PG000 and PG010 leading to the smallest rms values (Fig. 15d). Although the measured BTS for pixels in the area of 8.0∘ S ≤ lat ≤ 9.5∘ S and 106.5∘ E ≤ long ≤ 109.5∘ E are negatively biased due to MC contamination, their spectral features, such as the wavenumber of the local maximum (νa), were similar to those shown in Fig. 15d (plots of BTS for the Kelud VAC are also shown in Clarisse and Prata, 2016). Whether these measured BTS can be simulated well by internal or external mixing between the andesite model of VAC and ice cloud remains unclear. In addition to internal mixing between ash and ice based on effective medium theory, a simple external mixing process between individual ash and ice layers was examined through preliminary calculations, and the BTS simulations were unsuccessful. We could not conclude that Kelud ash plumes were composed of felsic ash aerosols based on the chemical composition (∼55 SiO2 wt %) of the Kelud ash samples from the same eruption (Maeno et al., 2019) . However, the measured BTS of the Kelud VACs in this eruption event can be explained well by assuming that ash particles in the Kelud VACs had a similar infrared RI feature to PG000 and PG010.

Figure 16(a–c) MODIS true-color images at (a) 12:45 UTC and (b) 11:05 UTC, and (c) IASI ΔBTsplit at 10:41–10:47 UTC for Puyehue-Cordón Caulle ash plumes on 6 June 2011. (d) Results of BTS simulation with the PG000 RI model for the pixel at (lat, long) = (27136∘ S, 25178∘ W). (e–g) MODIS image at (e) 14:25 UTC, and (f) IASI ΔBTsplit at 12:29 UTC. (g) Results of BTS simulation for the pixel at (lat, long) = (41.212∘ S, 61.898∘ W).
5.6 Puyehue-Cordón Caulle (PCC)
From the beginning of the eruption on 4 June 2011, large amounts of volcanic ash and SO2 gas were ejected from PCC, and the plumes reached an altitude of 12–13 km. Subsequently, ash plumes remained at high latitudes in the Southern Hemisphere for a long time (Theys et al., 2013; Klüser et al., 2013; Clarisse et al., 2013). BTS analysis was conducted for ash plumes observed over the Atlantic Ocean at 10:41–10:47 and 12:29 UTC on 6 June. In the area of IASI measurements at 10:41–10:47 UTC (Fig. 16c), MODIS observations were made at 11:05 UTC (Fig. 16b) and 12:45 UTC (Fig. 16a). From these MODIS images, ash plumes in the area with highly negative values of ΔTBsplit based on IASI measurements were distributed above broken MCs, and BTS simulations were performed for 29 IASI pixels that met the condition of Eq. (2). In addition, 10 additional IASI pixels were selected in the area of latitude 40–42∘ S and longitude 60–63∘ W from the data obtained at 12:29 UTC to avoid low-level dense MCs (circles in Fig. 16e, f). As shown in the ranking plot in Fig. 8, almost all pixels have similar spectral features, and smaller mean rms values were obtained for RI models with smaller NBO/T values in the PG2019 dataset. The smallest rms was obtained for PG000 among all RI models. In accordance with the results of BTS analysis conducted by Newman et al. (2012), felsic RI models agreed well with the results of compositional analysis of ash sampled by Castro et al. (2013). Comparing BTS from simulations and measurements, the simulation results obtained using PG000 differ significantly from the observations (Fig. 16d, g). Although the simulation results exhibit a good fit to measurements in the wavenumber region of 820–1000 cm−1 and at wavenumbers greater than 1130 cm−1, a large difference in brightness temperature at wavenumbers less than 820 cm−1 suggests an excess of relative absorption in the PG000 RI model. Moreover, the simulated BTS values were significantly larger than the measurements between 1070 and 1130 cm−1, particularly for pixels in the area shown in Fig. 16c. According to the results of VAC parameter retrieval using PG000, the effective radius reff was less than 0.5 µm for most pixels, reff tended to decrease as distance from PCC increased, and most of the retrieval results showed reff≤0.3 µm for pixels around (lat, long) = (27∘ S, 25∘ W) (circle in Fig. 16c), which is 4500–4600 km from PCC. Considering a decrease in large particles due to deposition over a long transport period in the atmosphere, reff≤0.3 µm may be realistic in the case of PCC. Ash plumes from PCC eventually circled the Southern Hemisphere three times. Very small ash particles may increase the longevity of PCC ash plumes (Carn and Krotkov, 2016). According to the results of measurements by CALIOP on board CALIPSO, PCC ash plumes are mainly composed of fine-mode non-spherical ash particles with a low sulfate contribution (Vernier et al., 2013; A. T. Prata et al., 2017). For BTS in the range of 1070–1200 cm−1, the RI model PLRHY provides a better fit than PG000 (data not shown). This result suggests that an RI model with a stronger absorbing feature in the index k around 1050 cm−1 than that of PG000 is better for explaining the measured BTS of PCC ash plumes.
Using infrared brightness temperature data from IASI measurements of volcanic ash clouds (VACs) and radiative transfer calculations, we investigate whether refractive index (RI) models for ash particles could reproduce the measured brightness temperature spectra (BTS) in the infrared window region. We applied a total of 21 RI models to BTS simulations, including 8 RI models using the Reed et al. (2018) dataset (RE2018), 11 RI models using the Prata et al. (2019) dataset (PG2019), and 2 additional RI models based on the andesite and rhyolite models of Pollack et al. (1973) (PL1973). For the eruption events of seven volcanoes, 156 daytime IASI pixels containing apparent volcanic ash features ( K) with low meteorological cloud (MC) contamination were selected with reference to MODIS and Himawari-8/AHI visible-color images and an additional brightness temperature condition. The BTS simulation for each pixel included the retrieval of VAC parameters and SO2 column content and top height, and the root mean square (rms) between the measured and simulated BTS for each RI model was calculated. The results of the RI models were ranked based on the smallest rms values for each pixel. Typical BTS simulation results were discussed for the ash plumes of some volcanoes.
As shown in Fig. 9, the rms and its standard deviation between the simulation and observed BTS for each RI model are relatively large. Furthermore, the differences in the derived mean rms between the RI models are relatively small because we individually estimated the VAC parameters and SO2 for each RI model in the BTS fittings procedure. Therefore, it is difficult to determine a specific RI model from statistically insufficient BTS measurements; the RI models proposed here are not always statistically significant, and they can vary depending on the measurement dataset and the assumed atmospheric state. With that in mind, the findings obtained from the analyses are summarized below.
Using RI models based on new RI datasets (RE2018, PG2019), the fitting of brightness temperature simulation for VACs in the atmospheric window region was improved. In particular, RI models using the PG2019 dataset performed as well as those using the RE2018 dataset. This suggests that the NBO/T parameterization of Prata et al. (2019) is effective for RI modeling at infrared window wavelengths.
In our BTS simulations, RI models for Eyjafjallajökull (RE030, RE040) with the RE2018 dataset and RI models parameterized using similar NBO/T values to those of Eyjafjallajökull ash samples (PG030, PG040) represented the measured BTS of Eyjafjallajökull ash plumes with good accuracy. Such consistency for mafic RI models was also observed for Grímsvötn ash plumes. The correlation between ash samples and ash plume measurements based on RI for the same volcanic event indicates that hyperspectral sounder measurements may help the selection of the RI model for ash aerosols in addition to the information on NBO/T and SiO2 wt % data obtained from compositional analysis of ash samples.
The RI models estimated from BTS simulations of IASI measurements were not always consistent with models deduced from the reported chemical compositions of ash samples. For ash plumes released from Calbuco (Calbuco_A) and Kelud, the RI models estimated from IASI measurements were more felsic (or had lower NBO/T) than the rock type or SiO2 wt % of tephra samples of the corresponding volcano. Furthermore, some RI models were excluded from acceptable RI models despite good BTS fitting results because the retrieved effective radii were too small. Negative values of brightness temperature difference ΔTBsplit are greater for ash particles of smaller sizes, and therefore our analysis is biased toward ash plumes with small reff. In addition, the retrieved reff values tended to be smaller when mafic RI models were used compared to the results of felsic RI models. This difference is due to fitting of the measured BTS in the wavenumber range of 950 cm cm−1, excluding the ozone absorption band. An effective radius of less than 0.2 µm is too small for fresh ash plumes shortly after eruption but may be realistic for ash plumes that have undergone long-distance transport in the atmosphere. Moreover, the condensation of volcanic sulfate on pure ash particles during transport might alter the inherent optical properties of the ash plumes.
We used the conventional andesite model (PLAND) by Pollack et al. (1973) for comparisons in our BTS analysis. Except for the Grímsvötn ash plumes, PLAND did not always perform well among the RI models for IASI pixels in this study. This result indicates that substantial improvement in satellite retrieval results for VACs can be expected from replacing the conventional andesite model with a proper RI model based on the RE2018 and PG2019 datasets. We explored the reproducibility of measured BTS over the entire wavenumber range of 650–1400 cm−1, including bands for CO2, water vapor, ozone, and SO2, and noted that the estimated RI models may not produce good results for VAC parameters in retrievals from multi-channel satellite imagers using certain infrared wavelength channels.
In this study, we used MODIS and Himawari-8 daytime visible images for a rough estimation of MC contamination in IASI measurement areas. For that reason, the number of IASI pixels available for analysis was significantly reduced, and statistical evaluation of the retrieval results for some volcanic events was difficult. To achieve a sufficient number of analyses, thorough evaluation of MC contamination of nighttime VAC data from infrared sounder measurements is necessary, and methods for such evaluation should be explored in future research. In recent years, plans for mounting infrared sounders on geostationary satellites have been undertaken. High-frequency observations of distinct volcanic plumes increase the number of BTS data available, and precise retrieval is expected with further improvements in VAC analysis to combine infrared sounder and high-resolution imager measurements.
We tested 21 RI models in this article, and conspicuous discrepancies in measured and calculated BTS at specific wavenumber ranges were confirmed in all RI models for some volcanic events. These discrepancies may be resolved by applying precise atmospheric profiles, such as temperature and humidity profiles, and surface temperature in the radiative transfer calculations. Nevertheless, the number of RI models may still be insufficient for simulating all BTS patterns of VACs for various types of volcanoes. Recently, another RI dataset based on laboratory analysis of ash samples from six volcanoes was published by Deguine et al. (2020). A set of RI models, in which the silica content and porosity and grass-to-crystal ratio were considered, was also published by Piontek et al. (2021). These data are available from the journal's website. We would like to examine these novel RI models in the future.
Data of the calculation results are available upon request by contacting the corresponding author (hiroishi@mri-jma.go.jp).
The supplement related to this article is available online at: https://doi.org/10.5194/amt-15-435-2022-supplement.
HI designed the study. The basic algorithm of MBCRM was developed by YM and was improved by HI for volcanic ash analysis. MH contributed to the development of the retrieval algorithm using GANAL data.
The contact author has declared that neither they nor their co-authors have any competing interests.
Publisher's note: Copernicus Publications remains neutral with regard to jurisdictional claims in published maps and institutional affiliations.
We acknowledge the use of visible color imagery of MODIS from the Level-1 and Atmosphere Archive & Distribution System (LAADS) Distributed Active Archive Center (DAAC) provided by NASA.
The color image produced from Himawari-8 that was used in this paper was supplied by the P-Tree System, Japan Aerospace Exploration Agency (JAXA). We used the products of CALIPSO Standard Browse Images (version 4.1) provided by NASA as the supporting information for discussions.
This research is supported by the 2nd Research Announcement on the Earth Observations of the Japan Aerospace Exploration Agency (JAXA) (PI no. ER2GCN206).
This paper was edited by Andrew Sayer and reviewed by two anonymous referees.
Bessho, K., Date, K., Hayashi, M., Ikeda, A., Imai, T., Inoue, H., Kumagai, Y., Miyakawa, T., Murata, H., Ohno, T., Okuyama, A., Oyama, R., Sasaki, Y., Shimazu, Y., Shimoji, K., Sumida, Y., Suzuki, M., Taniguchi, H., Tsuchiyama, H., Uesawa, D., Yokota, H., and Yoshida, R.: An Introduction to Himawari-8/9 – Japan's New-Generation Geostationary Meteorological Satellites, J. Meteorol. Soc. Jpn., Ser. II, 94, 151–183, https://doi.org/10.2151/jmsj.2016-009, 2016.
Buehler, S. A., John, V. O., Kottayil, A., Milz, M., and Eriksson, P.: Efficient radiative transfer simulations for a broadband infrared radiometer—Combining a weighted mean of representative frequencies approach with frequency selection by simulated annealing, J. Quant. Spectrosc. Ra., 111, 602–615, https://doi.org/10.1016/j.jqsrt.2009.10.018, 2010.
Carn, S. A. and Krotkov, N. A.: Chapter 12 – Ultraviolet Satellite Measurements of Volcanic Ash, in: Volcanic Ash: Hazard Observation, edited by: Mackie, S., Cashman, K., Ricketts, H., Rust, A., and Watson, M., Elsevier, 217–231, https://doi.org/10.1016/B978-0-08-100405-0.00018-5, 2016.
Cashman, K. and Rust, A.: Volcanic Ash: Generation and Spatial Variations, in: Volcanic Ash: Hazard Observation, edited by: Mackie, S., Cashman, K., Ricketts, H., Rust, A., and Watson, M., Elsevier, 5–22, https://doi.org/10.1016/B978-0-08-100405-0.00003-3, 2016.
Castro, J. M., Schipper, C. I., Mueller, S. P., Militzer, A. S., Amigo, A., Parejas, C. S., and Jacob, D.: Storage and eruption of near-liquidus rhyolite magma at Cordón Caulle, Chile, B. Volcanol., 75, 702, https://doi.org/10.1007/s00445-013-0702-9, 2013.
Clarisse, L. and Prata, F.: Chapter 11 – Infrared Sounding of Volcanic Ash, in: Volcanic Ash: Hazard Observation, edited by: Mackie, S., Cashman, K., Ricketts, H., Rust, A., and Watson, M., Elsevier, 189–215, https://doi.org/10.1016/B978-0-08-100405-0.00017-3, 2016.
Clarisse, L., Hurtmans, D., Clerbaux, C., Hadji-Lazaro, J., Ngadi, Y., and Coheur, P.-F.: Retrieval of sulphur dioxide from the infrared atmospheric sounding interferometer (IASI), Atmos. Meas. Tech., 5, 581–594, https://doi.org/10.5194/amt-5-581-2012, 2012.
Clarisse, L., Coheur, P.-F., Prata, F., Hadji-Lazaro, J., Hurtmans, D., and Clerbaux, C.: A unified approach to infrared aerosol remote sensing and type specification, Atmos. Chem. Phys., 13, 2195–2221, https://doi.org/10.5194/acp-13-2195-2013, 2013.
Clough, S. A., Shephard, M. W., Mlawer, E. J., Delamere, J. S., Iacono, M. J., Cady-Pereira, K., Boukabara, S., and Brown, P. D.: Atmospheric radiative transfer modeling: a summary of the AER codes, J. Quant. Spectrosc. Ra., 91, 233–244, https://doi.org/10.1016/j.jqsrt.2004.05.058, 2005.
Corradini, S., Merucci, L., and Prata, A. J.: Retrieval of SO2 from thermal infrared satellite measurements: correction procedures for the effects of volcanic ash, Atmos. Meas. Tech., 2, 177–191, https://doi.org/10.5194/amt-2-177-2009, 2009.
Deguine, A., Petitprez, D., Clarisse, L., Guđmundsson, S., Outes, V., Villarosa, G., and Herbin, H.: Complex refractive index of volcanic ash aerosol in the infrared, visible, and ultraviolet, Appl. Optics, 59, 884–895, https://doi.org/10.1364/AO.59.000884, 2020.
Francis, P. N., Cooke, M. C., and Saunders, R. W.: Retrieval of physical properties of volcanic ash using Meteosat: A case study from the 2010 Eyjafjallajökull eruption, J. Geophys. Res., 117, D00U09, https://doi.org/10.1029/2011JD016788, 2012.
Gangale, G., Prata, A. J., and Clarisse, L.: The infrared spectral signature of volcanic ash determined from high-spectral resolution satellite measurements, Remote Sens. Environ., 114, 414–425, https://doi.org/10.1016/j.rse.2009.09.007, 2010.
Hansen, J. E. and Travis, L. D.: Light scattering in planetary atmospheres, Space Sci. Rev., 16, 527–610, https://doi.org/10.1007/BF00168069, 1974.
Harvey, N. J., Dacre, H. F., Webster, H. N., Taylor, I. A., Khanal, S., Grainger, R. G., and Cooke, M. C.: The Impact of Ensemble Meteorology on Inverse Modeling Estimates of Volcano Emissions and Ash Dispersion Forecasts: Grímsvötn 2011, Atmosphere (Basel), 11, 1022, https://doi.org/10.3390/atmos11101022, 2020.
Hilton, F., Armante, R., August, T., Barnet, C., Bouchard, A., Camy-Peyret, C., Capelle, V., Clarisse, L., Clerbaux, C., Coheur, P.-F., Collard, A., Crevoisier, C., Dufour, G., Edwards, D., Faijan, F., Fourrié, N., Gambacorta, A., Goldberg, M., Guidard, V., Hurtmans, D., Illingworth, S., Jacquinet-Husson, N., Kerzenmacher, T., Klaes, D., Lavanant, L., Masiello, G., Matricardi, M., McNally, A., Newman, S., Pavelin, E., Payan, S., Péquignot, E., Peyridieu, S., Phulpin, T., Remedios, J., Schlüssel, P., Serio, C., Strow, L., Stubenrauch, C., Taylor, J., Tobin, D., Wolf, W., and Zhou, D.: Hyperspectral Earth Observation from IASI: Five Years of Accomplishments, B. Am. Meteorol. Soc., 93, 347–370, https://doi.org/10.1175/BAMS-D-11-00027.1, 2012.
Holl, G., Buehler, S. A., Mendrok, J., and Kottayil, A.: Optimised frequency grids for infrared radiative transfer simulations in cloudy conditions, J. Quant. Spectrosc. Ra., 113, 2124–2134, https://doi.org/10.1016/j.jqsrt.2012.05.022, 2012.
Ishimoto, H., Masuda, K., Fukui, K., Shimbori, T., Inazawa, T., Tuchiyama, H., Ishii, K., and Sakurai, T.: Estimation of the refractive index of volcanic ash from satellite infrared sounder data, Remote Sens. Environ., 174, 165–180, https://doi.org/10.1016/j.rse.2015.12.009, 2016.
Klüser, L., Erbertseder, T., and Meyer-Arnek, J.: Observation of volcanic ash from Puyehue–Cordón Caulle with IASI, Atmos. Meas. Tech., 6, 35–46, https://doi.org/10.5194/amt-6-35-2013, 2013.
Kylling, A.: Ash and ice clouds during the Mt Kelud February 2014 eruption as interpreted from IASI and AVHRR/3 observations, Atmos. Meas. Tech., 9, 2103–2117, https://doi.org/10.5194/amt-9-2103-2016, 2016.
Kylling, A., Kristiansen, N., Stohl, A., Buras-Schnell, R., Emde, C., and Gasteiger, J.: A model sensitivity study of the impact of clouds on satellite detection and retrieval of volcanic ash, Atmos. Meas. Tech., 8, 1935–1949, https://doi.org/10.5194/amt-8-1935-2015, 2015.
Mackie, S. and Watson, M.: Probabilistic detection of volcanic ash using a Bayesian approach, J. Geophys. Res.-Atmos., 119, 2409–2428, https://doi.org/10.1002/2013JD021077, 2014.
Mackie, S., Cashman, K., Ricketts, H., Rust, A., and Watson, M. (Eds.): Introduction, in: Volcanic Ash: Hazard Observation, Elsevier, 1–3, https://doi.org/10.1016/B978-0-08-100405-0.00001-X, 2016.
Maeno, F., Nakada, S., Yoshimoto, M., Shimano, T., Hokanishi, N., Zaennudin, A., and Iguchi, M.: A sequence of a plinian eruption preceded by dome destruction at Kelud volcano, Indonesia, on February 13, 2014, revealed from tephra fallout and pyroclastic density current deposits, J. Volcanol. Geoth. Res., 382, 24–41, https://doi.org/10.1016/j.jvolgeores.2017.03.002, 2019.
Matricardi, M.: The generation of RTTOV regression coefficients for IASI and AIRS using a new profile training set and a new line-by-line database, ECMWF Technical Memoranda No. 564, 2008.
Mishchenko, M. I., Travis, L. D., and Lacis, A. A: Scattering, Absorption, and Emission of Light by Small Particles, Cambridge, 445 pp., ISBN 052178252X, 2002.
Mlawer, E. J., Payne, V. H., Moncet, J.-L., Delamere, J. S., Alvarado, M. J., and Tobin, D. C.: Development and recent evaluation of the MT_CKD model of continuum absorption, Philos. T. Roy. Soc. A, 370, 2520–2556, https://doi.org/10.1098/rsta.2011.0295, 2012.
Moxnes, E. D., Kristiansen, N. I., Stohl, A., Clarisse, L., Durant, A., Weber, K., and Vogel, A.: Separation of ash and sulfur dioxide during the 2011 Grímsvötn eruption, J. Geophys. Res.-Atmos., 119, 7477–7501, https://doi.org/10.1002/2013JD021129, 2014.
Newman, S. M., Clarisse, L., Hurtmans, D., Marenco, F., Johnson, B., Turnbull, K., Havemann, S., Baran, A. J., O'Sullivan, D., and Haywood, J.: A case study of observations of volcanic ash from the Eyjafjallajökull eruption: 2. Airborne and satellite radiative measurements, J. Geophys. Res., 117, D00U13, https://doi.org/10.1029/2011JD016780, 2012.
Pavolonis, M. J., Heidinger, A. K., and Sieglaff, J.: Automated retrievals of volcanic ash and dust cloud properties from upwelling infrared measurements, J. Geophys. Res.-Atmos., 118, 1436–1458, https://doi.org/10.1002/jgrd.50173, 2013.
Piontek, D., Hornby, A. J., Voigt, C., Bugliaro, L., and Gasteiger, J.: Determination of complex refractive indices and optical properties of volcanic ashes in the thermal infrared based on generic petrological compositions, J. Volcanol. Geoth. Res., 411, 107174, https://doi.org/10.1016/j.jvolgeores.2021.107174, 2021.
Pollack, J. B., Toon, O. B., and Khare, B. N.: Optical properties of some terrestrial rocks and glasses, Icarus, 19, 372–389, https://doi.org/10.1016/0019-1035(73)90115-2, 1973.
Prata, A. J.: Infrared radiative transfer calculations for volcanic ash clouds, Geophys. Res. Lett., 16, 1293–1296, https://doi.org/10.1029/GL016i011p01293, 1989.
Prata, A. J. and Grant, I. F.: Retrieval of microphysical and morphological properties of volcanic ash plumes from satellite data: Application to Mt Ruapehu, New Zealand, Q. J. Roy. Meteor. Soc., 127, 2153–2179, https://doi.org/10.1002/qj.49712757615, 2001.
Prata, A. T., Young, S. A., Siems, S. T., and Manton, M. J.: Lidar ratios of stratospheric volcanic ash and sulfate aerosols retrieved from CALIOP measurements, Atmos. Chem. Phys., 17, 8599–8618, https://doi.org/10.5194/acp-17-8599-2017, 2017.
Prata, F. and Lynch, M.: Passive Earth Observations of Volcanic Clouds in the Atmosphere, Atmosphere (Basel), 10, 199, https://doi.org/10.3390/atmos10040199, 2019.
Prata, F., Woodhouse, M., Huppert, H. E., Prata, A., Thordarson, T., and Carn, S.: Atmospheric processes affecting the separation of volcanic ash and SO2 in volcanic eruptions: inferences from the May 2011 Grímsvötn eruption, Atmos. Chem. Phys., 17, 10709–10732, https://doi.org/10.5194/acp-17-10709-2017, 2017.
Prata, G. S., Ventress, L. J., Carboni, E., Mather, T. A., Grainger, R. G., and Pyle, D. M.: A New Parameterization of Volcanic Ash Complex Refractive Index Based on NBO/T and SiO2 Content, J. Geophys. Res.-Atmos., 124, 1779–1797, https://doi.org/10.1029/2018JD028679, 2019.
Reed, B. E., Peters, D. M., McPheat, R., Smith, A. J. A., and Grainger, R. G.: Mass extinction spectra and size distribution measurements of quartz and amorphous silica aerosol at 0.33–19 µm compared to modelled extinction using Mie, CDE, and T-matrix theories, J. Quant. Spectrosc. Ra., 199, 52–65, https://doi.org/10.1016/j.jqsrt.2017.05.011, 2017.
Reed, B. E., Peters, D. M., McPheat, R., and Grainger, R. G.: The Complex Refractive Index of Volcanic Ash Aerosol Retrieved From Spectral Mass Extinction, J. Geophys. Res.-Atmos., 123, 1339–1350, https://doi.org/10.1002/2017JD027362, 2018.
Romero, J. E., Morgavi, D., Arzilli, F., Daga, R., Caselli, A., Reckziegel, F., Viramonte, J., Díaz-Alvarado, J., Polacci, M., Burton, M., and Perugini, D.: Eruption dynamics of the 22–23 April 2015 Calbuco Volcano (Southern Chile): Analyses of tephra fall deposits, J. Volcanol. Geoth. Res., 317, 15–29, https://doi.org/10.1016/j.jvolgeores.2016.02.027, 2016.
Rothman, L. S., Gordon, I. E., Babikov, Y., Barbe, A., Chris Benner, D., Bernath, P. F., Birk, M., Bizzocchi, L., Boudon, V., Brown, L. R., Campargue, A., Chance, K., Cohen, E. A., Coudert, L. H., Devi, V. M., Drouin, B. J., Fayt, A., Flaud, J.-M., Gamache, R. R., Harrison, J. J., Hartmann, J.-M., Hill, C., Hodges, J. T., Jacquemart, D., Jolly, A., Lamouroux, J., Le Roy, R. J., Li, G., Long, D. A., Lyulin, O. M., Mackie, C. J., Massie, S. T., Mikhailenko, S., Müller, H. S. P., Naumenko, O. V., Nikitin, A. V., Orphal, J., Perevalov, V., Perrin, A., Polovtseva, E. R., Richard, C., Smith, M. A. H., Starikova, E., Sung, K., Tashkun, S., Tennyson, J., Toon, G. C., Tyuterev, V. G., and Wagner, G.: The HITRAN2012 molecular spectroscopic database, J. Quant. Spectrosc. Ra., 130, 4–50, https://doi.org/10.1016/j.jqsrt.2013.07.002, 2013.
Saunders, R., Hocking, J., Rundle, D., Rayer, P., Matricardi, M., Geer, A., Lupu, C., Brunel, P., and Vidot, J.: RTTOV-11 Science and Validation Report, Doc ID: NWPSAF-MO-TV-032, EUMETSAT NWP SAF, available at: https://www.nwpsaf.eu/site/download/documentation/rtm/docs_rttov11/rttov11_svr.pdf (last access: 18 January 2022), 2013.
Taylor, I. A., Carboni, E., Ventress, L. J., Mather, T. A., and Grainger, R. G.: An adaptation of the CO2 slicing technique for the Infrared Atmospheric Sounding Interferometer to obtain the height of tropospheric volcanic ash clouds, Atmos. Meas. Tech., 12, 3853–3883, https://doi.org/10.5194/amt-12-3853-2019, 2019.
Theys, N., Campion, R., Clarisse, L., Brenot, H., van Gent, J., Dils, B., Corradini, S., Merucci, L., Coheur, P.-F., Van Roozendael, M., Hurtmans, D., Clerbaux, C., Tait, S., and Ferrucci, F.: Volcanic SO2 fluxes derived from satellite data: a survey using OMI, GOME-2, IASI and MODIS, Atmos. Chem. Phys., 13, 5945–5968, https://doi.org/10.5194/acp-13-5945-2013, 2013.
Turnbull, K., Johnson, B., Marenco, F., Haywood, J., Minikin, A., Weinzierl, B., Schlager, H., Schumann, U., Leadbetter, S., and Woolley, A.: A case study of observations of volcanic ash from the Eyjafjallajökull eruption: 1. In situ airborne observations, J. Geophys. Res., 117, D00U12, https://doi.org/10.1029/2011JD016688, 2012.
Ventress, L. J., McGarragh, G., Carboni, E., Smith, A. J., and Grainger, R. G.: Retrieval of ash properties from IASI measurements, Atmos. Meas. Tech., 9, 5407–5422, https://doi.org/10.5194/amt-9-5407-2016, 2016.
Vernier, J.-P., Fairlie, T. D., Murray, J. J., Tupper, A., Trepte, C., Winker, D., Pelon, J., Garnier, A., Jumelet, J., Pavolonis, M., Omar, A. H., and Powell, K. A.: An Advanced System to Monitor the 3D Structure of Diffuse Volcanic Ash Clouds, J. Appl. Meteorol. Clim., 52, 2125–2138, https://doi.org/10.1175/JAMC-D-12-0279.1, 2013.
Vidot, J. and Hocking, J.: Note on RTTOV v12 unit conversions for gases, clouds and aerosols, available at: https://www.nwpsaf.eu/site/download/documentation/rtm/docs_rttov12/rttov_gas_cloud_aerosol_units.pdf (last access: 18 January 2022), 2017.
Wen, S. and Rose, W. I.: Retrieval of sizes and total masses of particles in volcanic clouds using AVHRR bands 4 and 5, J. Geophys. Res., 99, 5421–5431, https://doi.org/10.1029/93JD03340, 1994.
- Abstract
- Introduction
- Infrared spectral simulator Monochromatic-Based Cloud Radiation Model (MBCRM) for VAC analysis
- VAC parameters for radiative transfer calculations and RI models
- IASI ash plume data
- Refractive index models estimated through IASI measurement simulation
- Summary and discussion
- Data availability
- Author contributions
- Competing interests
- Disclaimer
- Acknowledgements
- Financial support
- Review statement
- References
- Supplement