the Creative Commons Attribution 4.0 License.
the Creative Commons Attribution 4.0 License.
 | 11 Aug 2022
Impact of instrumental line shape characterization on ozone monitoring by FTIR spectrometry
Esther Sanromá
Frank Hase
Matthias Schneider
Sergio Fabián León-Luis
Thomas Blumenstock
Eliezer Sepúlveda
Carlos Torres
Natalia Prats
Alberto Redondas
Virgilio Carreño
Retrieving high-precision concentrations of atmospheric trace gases from FTIR (Fourier transform infrared) spectrometry requires a precise knowledge of the instrumental performance. In this context, this paper examines the impact on the ozone (O3) retrievals of several approaches used to characterize the instrumental line shape (ILS) function of ground-based FTIR spectrometers within NDACC (Network for the Detection of Atmospheric Composition Change). The analysis has been carried out at the subtropical Izaña Observatory (IZO, Spain) by using the 20-year time series of the high-resolution FTIR solar absorption spectra acquired between 1999 and 2018. The theoretical quality assessment and the comparison to independent O3 observations available at IZO (Brewer O3 total columns and electrochemical concentration cell, ECC, sondes) reveal consistent findings. The inclusion of a simultaneous retrieval of the ILS parameters in the O3 retrieval strategy allows, on the one hand, a rough instrumental characterization to be obtained and, on the other hand, the precision of the FTIR O3 products to be slightly improved. The improvement is of special relevance above the lower stratosphere, where the cross-interference between the O3 vertical distribution and the instrumental performance is more significant. However, it has been found that the simultaneous ILS retrieval leads to a misinterpretation of the O3 variations on daily and seasonal scales. Therefore, in order to ensure the independence of the O3 retrievals and the instrumental response, the optimal approach to deal with the FTIR instrumental characterization is found to be the continuous monitoring of the ILS function by means of independent observations, such as gas cell measurements.
- Article
(6208 KB) - Full-text XML
- BibTeX
- EndNote


Long-term ground-based observations of atmospheric composition are essential for monitoring the evolution of the Earth–atmosphere system. Among current atmospheric measurement techniques, FTIR (Fourier transform infrared) spectrometry has an outstanding importance for climate research, since most atmospheric molecules interact with solar electromagnetic radiation in the infrared spectral region. By analysing the measured solar absorption spectra, this technique can provide atmospheric concentrations of many different gases simultaneously and with high precision (e.g. Rinsland et al., 1982; Hase et al., 2004; Schneider et al., 2008a; García et al., 2012; Sepúlveda et al., 2014; Barthlott et al., 2015; Vigouroux et al., 2015; Barthlott et al., 2017; De Mazière et al., 2018; García et al., 2022, 2021).
Within NDACC (Network for the Detection of Atmospheric Composition Change, https://www.ndaccdemo.org, last access: 31 January 2022), high-resolution FTIR spectrometers have been operating since the 1990s, with the main goal of establishing long-term databases to detect changes and trends in atmospheric composition and to understand their impacts on the Earth–atmosphere system (De Mazière et al., 2018). In the last few years, the NDACC Infrared Working Group (IRWG, https://www2.acom.ucar.edu/irwg, last access: 31 January 2022) has developed data acquisition protocols and retrieval methods to minimize the site-to-site differences and to achieve consistent responses to actual variations in atmospheric composition (e.g. Hase et al., 2004; IRWG, 2014; Barthlott et al., 2015, 2017; Vigouroux et al., 2018).
One of the factors that is most dependent on each NDACC FTIR site is the treatment of the spectrometer response through the instrumental line shape (ILS) function (e.g. Vigouroux et al., 2008, 2015). A precise knowledge of the ILS is essential to properly characterize the instrument performance, since the ILS affects the absorption line shape on which the retrieved information is based on. This is critical for estimating the vertical distribution of an absorber because such retrievals largely rely on the shape of the absorption lines (pressure broadening effect). Therefore, uncertainties in the ILS can also affect the quality of the total column (TC) amounts. Furthermore, the temporal stability of the ILS is an important requisite for precise gas retrievals (Schneider and Hase, 2008; Schneider et al., 2008b).
Nowadays, different approaches are used to deal with the ILS characterization.
-
In the first approach, ILS is assumed to be ideal. However, in cases where there are misalignments in the FTIR spectrometer, a considerable systematic error may be introduced on the gas retrievals (Hase et al., 1999; Schneider and Hase, 2008; Hase, 2012; Sun et al., 2018).
-
In the second approach, ILS is retrieved simultaneously with the gas vertical distribution from the measured solar absorption spectra. This is a superior strategy when compared to the first approach (e.g. Barret et al., 2002; Vigouroux et al., 2015); however, part of the actual gas variability may be wrongly mapped into changes of the ILS, since the ILS and the absorber profiles have similar effect on the absorption line shapes (i.e. changing the shape and width of the line). In addition, overlapping lines (i.e. due to interfering species) may introduce asymmetry in the absorption lines that may be indistinguishable from an ILS phase deviation (Sun et al., 2018).
-
In the third approach, ILS is monitored through independent, regular, and calibrated low-pressure gas cell measurements (Hase et al., 1999; Hase, 2012; Fig. 5 of García et al., 2021), whereby both the independence of FTIR gas retrievals and the instrumental characterization are ensured.
The stratospheric gases are more sensitive to the ILS treatment and its temporal behaviour than the tropospheric ones, since the full width at half maximum of their sharp absorption lines (absorptions taking place at low pressure) and of ILS have similar magnitudes (Takele Kenea et al., 2013; Sun et al., 2018). Given its key role in atmospheric chemistry, the ILS effects are of special relevance for the analysis of ozone (O3) (e.g. Vigouroux et al., 2008; Cuevas et al., 2013; De Mazière et al., 2018). Recently, Sun et al. (2018) have documented that a typical ILS degradation of 10 % may produce changes in the O3 TCs by 2 %, but the resulting disturbances of the vertical profile are considerably larger (between ± 20 %) and dependent on altitude. These values become especially important when compared to the rather small signals of O3 recovery obtained from long-term observations or projected from chemistry climate models. As summarized in the latest WMO/UNEP (World Meteorological Organization/United Nations Environment Programme) report (WMO, 2018), no significant trend has been detected in global (60∘ S–60∘ N) O3 TCs over the 1997–2016 period, and outside the polar regions only upper stratospheric O3 has been found to increase significantly by 0.1 % yr−1–0.3 % yr−1 since 2000. Consistent estimates are predicted by climate models (e.g. Hegglin and Shepherd, 2009; Li et al., 2009; Steinbrecht et al., 2017), pointing to a vertical stratification of the O3 recovery in response to the combined effects of an acceleration of Brewer–Dobson circulation, the stratospheric cooling induced by increasing greenhouse gases concentrations, and the levelling off of anthropogenic O3 depleting substances.
Within the FTIR community considerable efforts have been made toward the development, optimization, and validation of retrieval strategies for atmospheric O3 monitoring (e.g. Barret et al., 2002; Schneider et al., 2005, 2008a, b; Schneider and Hase, 2008; Vigouroux et al., 2008; Lindenmaier et al., 2010; García et al., 2012, 2014; Vigouroux et al., 2015; Zhou et al., 2020; García et al., 2022). These works were mainly focused on investigating the optimal selection of the O3 spectral absorption lines or the inversion settings used, such as the a priori information, the different constraints, or the inclusion of an additional atmospheric temperature profile retrieval. Nonetheless, the influence of instrumental characterization has not been addressed in detail yet. This is the focus of this paper, where the impact of the different approaches for characterizing the ILS (listed above as approaches 1–3) are examined using FTIR O3 products as an example. The study has been performed at the subtropical Izaña Observatory (IZO), where since 1999 ground-based FTIR observations have been carried out coincidentally with other independent O3 measurement techniques. In addition, the ILS function of the IZO FTIR spectrometers has been routinely monitored by means of independent gas cell measurements since 1999. These two facts make IZO a unique place for developing and documenting the reliability of new O3 retrieval strategies from ground-based FTIR spectrometry. In this context, this paper is structured as follows: Sect. 2 describes the Izaña Observatory and its O3 programme, while Sect. 3 presents the IZO FTIR observations, describing the monitoring of the ILS function, the O3 and ILS retrieval strategies used in this work, and their theoretical characterization in terms of vertical sensitivity and expected uncertainties. Section 4 addresses the comparison of the ILS time series determined from gas cell measurements and those simultaneously retrieved with the O3 concentrations from the measured solar absorption spectra and also describes how the differences between the ILS approaches are transferred to the FTIR O3 products. Section 5 assesses the impact of the different ILS treatments on the FTIR O3 products by comparing them to independent datasets (Brewer TC observations and electrochemical concentration cell, ECC, sondes). Finally, Sect. 6 summarizes the main results and conclusions drawn from this work.
The Izaña Observatory (IZO) is a subtropical high-mountain station managed by the Izaña Atmospheric Research Center (IARC, https://izana.aemet.es, last access: 31 January 2022) and belonging to the State Meteorological Agency of Spain (AEMet, https://www.aemet.es, last access: 31 January 2022). It is on the island of Tenerife in the northern Atlantic Ocean (28.3∘ N, 16.5∘ W) and located on the top plateau of Izaña mountain at 2373 m a.s.l. From a climatic point of view, IZO is located below the descending branch of the northern subtropical Hadley cell, under a quasi-permanent subsidence regime, and typically above a well-established thermal inversion layer. Moreover, the cities and the moderate industrial activity of the island are concentrated on the coast, thereby the observatory is not affected by significant local and regional pollution contributions (especially during night-time, when the subsidence regime prevails). The combination of these factors ensures clean air and clear-sky situations during most of the year and offers excellent conditions for atmospheric composition monitoring. As a result, since many years IZO has been engaged in several international atmospheric and environmental activities and research networks. Refer to Cuevas et al. (2019) for more details about IZO and its atmospheric monitoring programmes.
2.1 FTIR programme
Within the IZO's research activities, the FTIR programme was established in 1999 in the framework of a collaboration between the AEMet-IARC and the KIT (Karlsruhe Institute of Technology), with the main goals of the long-term monitoring of atmospheric gas composition and the validation of space-based observations and climate models. Since then two Bruker high-resolution FTIR systems have been operated at IZO contributing to NDACC: an IFS 120M from 1999 to 2005 and an IFS 120/5HR from 2005 onward.
The FTIR O3 measurements within NDACC are retrieved from the measured solar absorption spectra in the 990–1015 cm−1 spectral region by using a potassium bromide (KBr) beam splitter and a cooled mercury cadmium telluride (MCT) detector. To resolve the narrow O3 absorption lines, the solar spectra have been acquired at the high spectral resolution of 0.0036 cm−1 (250 cm of maximum optical path difference, OPD, OPDmax) until April 2000 and 0.005 cm−1 (OPD cm) from that point on. The IFS 120M's field-of-view (FOV) angle has varied between 0.17 and 0.29∘ depending on the measurement period, while for the IFS 120/5HR it has been always limited to 0.2∘, both of which are considerably lower than the solar diameter of 0.5∘. For this study, the 20-year O3 measurements taken from 1999 to 2018 have been used. Refer to García et al. (2021) for a detailed description of the FTIR spectrometry activities at IZO.
2.2 Brewer and ECC sonde programmes
At IZO O3 TC observations have been also continuously taken by Brewer spectrometers since 1991. In 2001 the IZO Brewer activities were accepted by NDACC, and 2 years later the RBCC-E (Regional Brewer Calibration Center Europe, http://rbcce.aemet.es/, last access: 31 January 2022) of the WMO/GAW (Global Atmospheric Watch) programme was established at the observatory.
Although the full uncertainty budget is still in development, provisional results indicate that the IZO RBCC-E reference instruments can provide O3 TCs with a total uncertainty (standard uncertainty, k=1) between 1.2 % and 1.5 % (Gröbner et al., 2017). For the current study, the O3 TCs of the permanent instrument Brewer#157 have been used, which were computed following the data processing of the EUBREWNET network (León-Luis et al., 2018; Redondas et al., 2018).
The latest extension of the IZO O3 programme is the uptake of regular O3 sonde observations, which were initiated in November 1992 and included within NDACC in 2001. O3 soundings were performed once a week from the Santa Cruz Station (30 km north-east of IZO, 36 m a.s.l.) from 1992 until 2011, when they were moved to a launch site at the Botanic Observatory (13 km north of IZO, 114 m a.s.l.). The O3 sounding is based on ECC that senses O3 as it reacts with a dilute solution of potassium iodide (KI) to produce an electrical current proportional to the atmospheric O3 concentration (Komhyr, 1986). The O3 sonde model SPC-5A was used until September 1997, after which it was updated to the SPC-6A model (SPC, 1996) with a cathode sensing solution type SST1.0 (1.0 % KI and full pH buffer). The sounding provides O3 (mPa) profiles, from the ground to the burst level (generally between 30 and 35 km), with a resolution of 0.01 mPa and accuracy of ± 5 %–15 % in the troposphere and ± 5 % in the stratosphere (WMO, 2014).
Note that for the purposes of this paper both Brewer and ECC sonde databases fully cover the entire FTIR 1999–2018 period.
Although they are not used in this work, the IZO O3 programme also includes DOAS (differential optical absorption spectroscopy) observations, performed within NDACC since 1999, and ground-level O3 records, taken in the framework of the WMO/GAW programme since 1987. More details about these measurement techniques are given in Gil-Ojeda et al. (2012) and Cuevas et al. (2013, 2019).
3.1 Monitoring of the ILS function
The ILS function is the Fourier transform of the weighting applied to the interferogram (Davis et al., 2001). In the case of ideal instruments, the ILS is affected only by modulation loss that is due to the self-apodization of the interferometer (accepting a finite FOV) and is symmetric (Hase et al., 1999). From the physical viewpoint, interferometric misalignments, deviations from the desired circular interferometric FOV, OPD-dependent vignetting effects, and mismatch between the wave fronts of the reference laser wave front and the infrared beam are the main drivers of ILS imperfections. For real instruments, the ILS is equivalent to a complex modulation efficiency (ME) in the interferogram. The phase-corrected interferogram generated by a spectral line is of the following form (Hase et al., 1999):
where IFG(δ) is the interferogram (with δ as the mirror displacement), σ is the wavenumber, MEA is the modulation efficiency amplitude, and PE is the modulation efficiency phase error. Note that the MEA and PE correspond to the real and imaginary part of the complex ME, respectively.
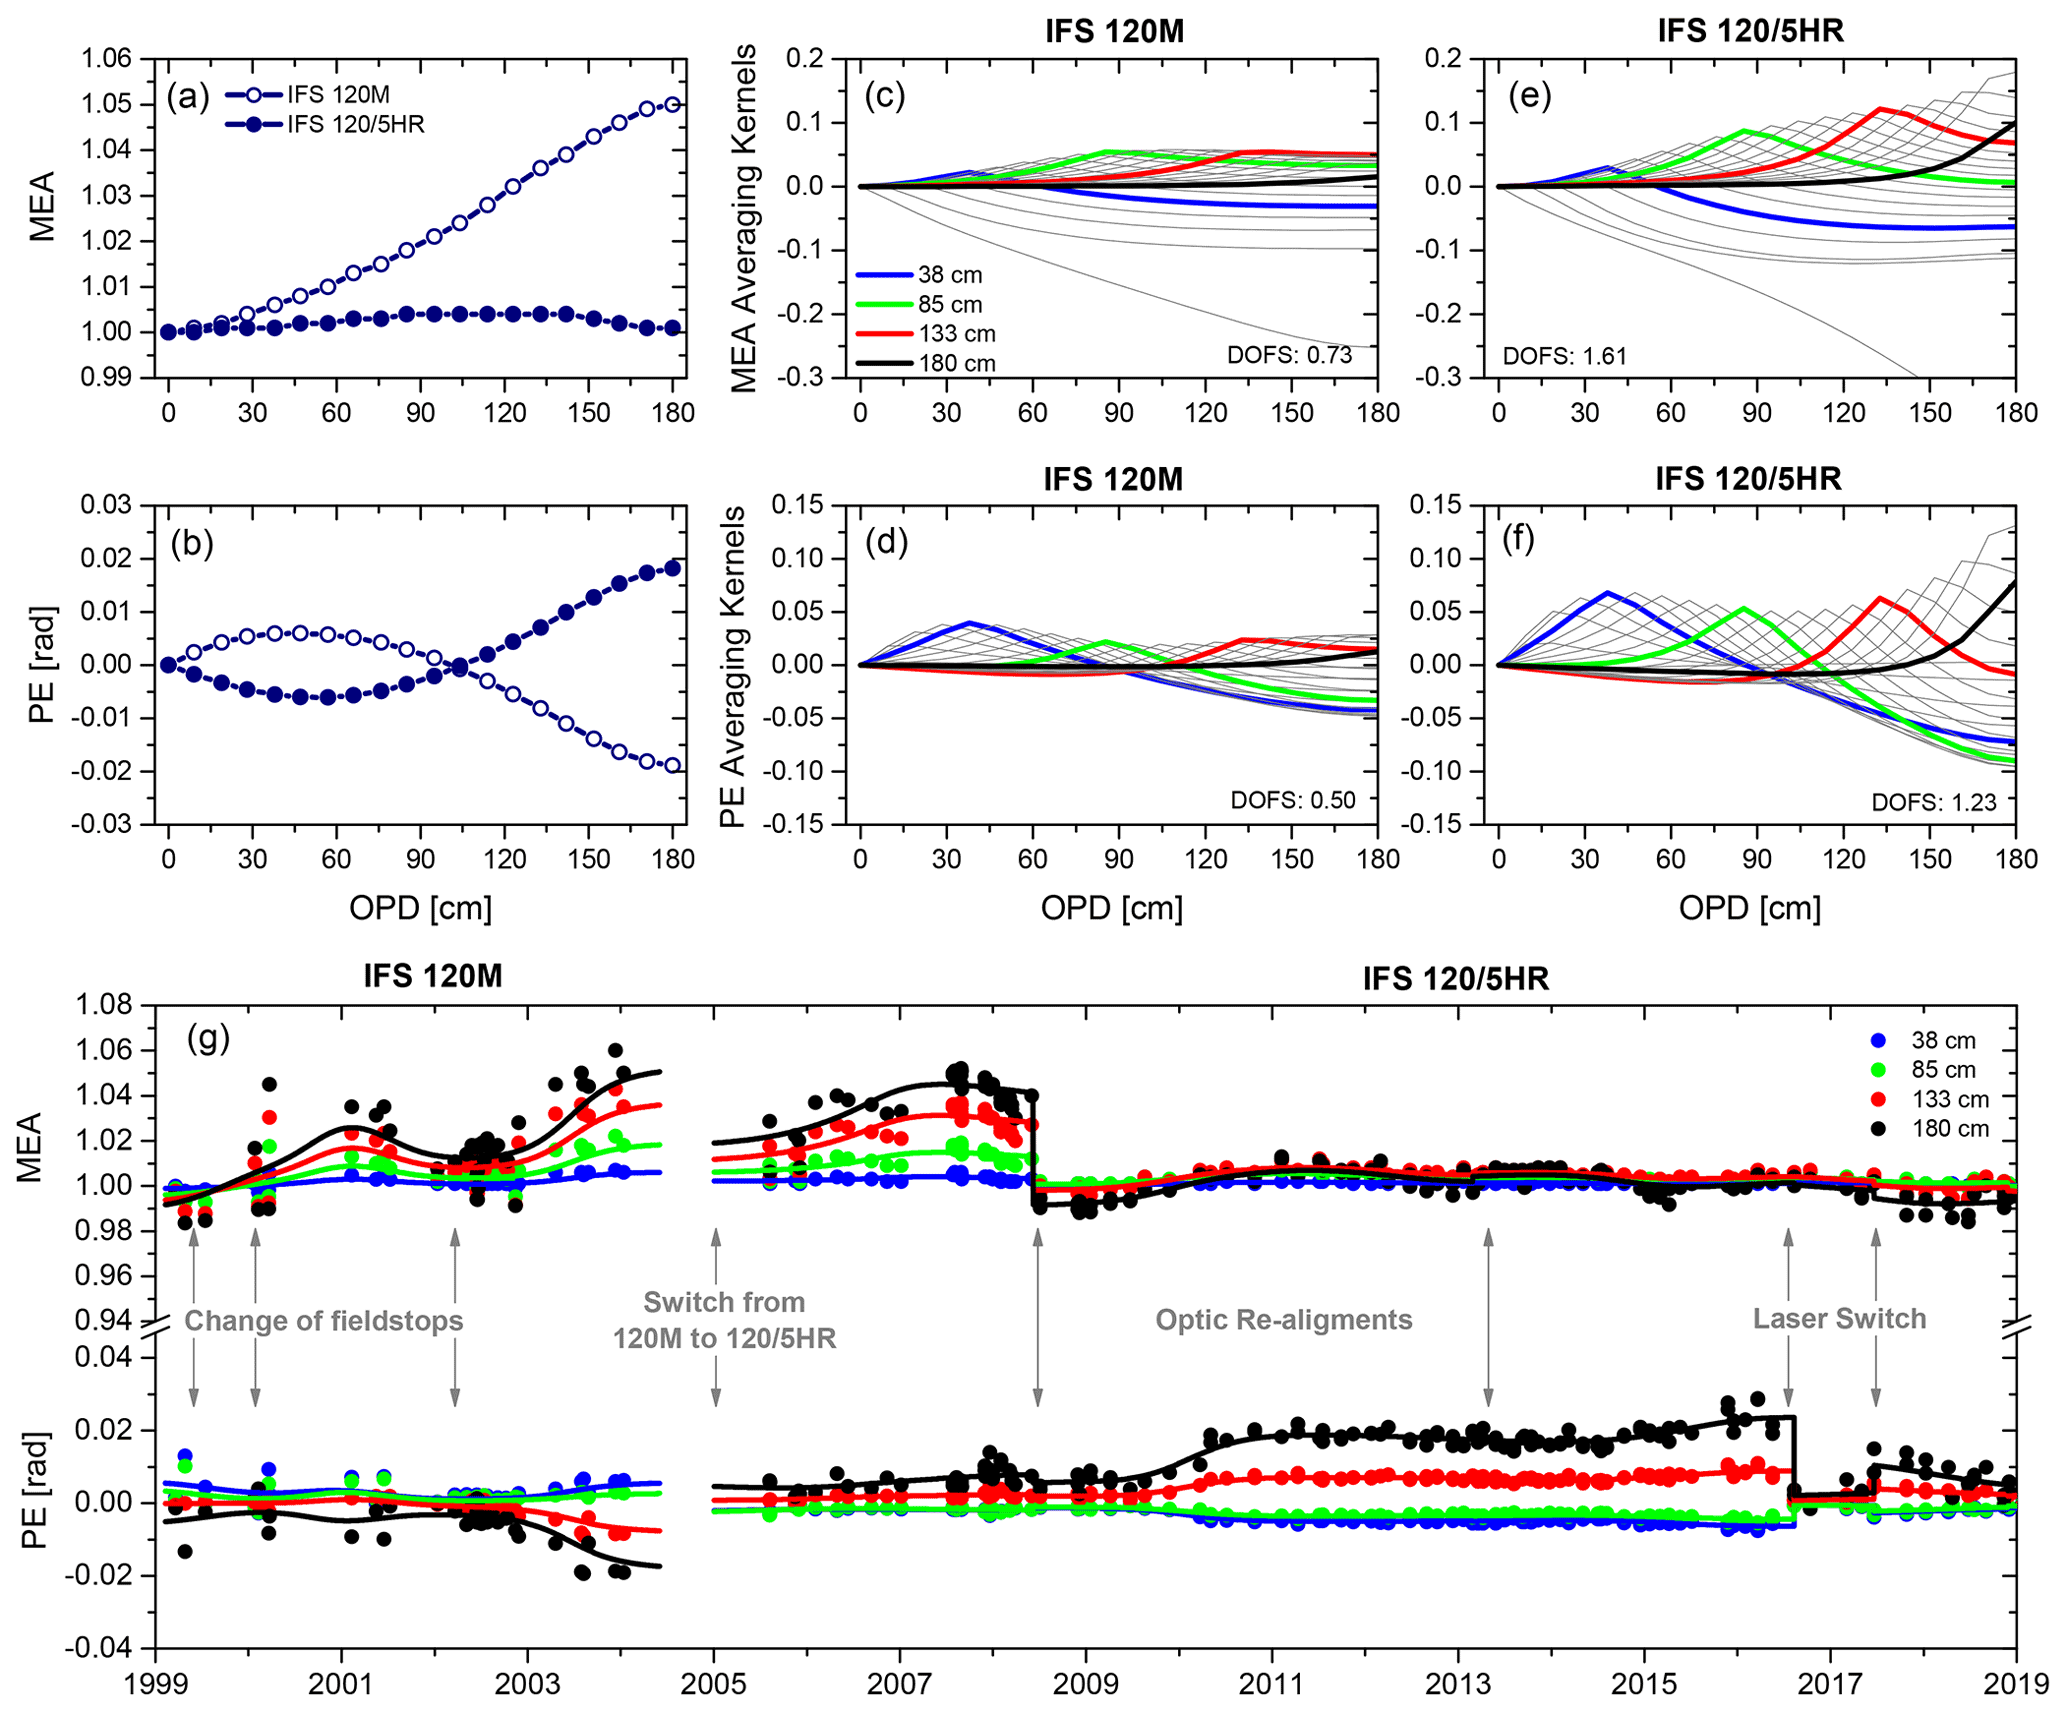
Figure 1Example of the (a) normalized MEA and (b) PE (rad) retrievals as a function of the OPD for the IFS 120M (N2O cell measurement taken on 3 July 2003) and for the IFS 120/5HR (N2O cell measurement performed on 20 March 2013). (c, d) Averaging kernel rows of the MEA and PE retrievals for the cell example of the IFS 120M. Panels (e, f) are the same as (c) and (d) but for the IFS 120/5HR. The degrees of freedom for signal (DOFS) are also shown. (g) Time series of the normalized MEA and PE values at four OPD (38, 85, 133 and 180 cm) between 1999 and 2018. Data points represent individual N2O cell measurements, and solid lines depict the smoothed MEA and PE curves. The solid grey arrows indicate punctual interventions made regarding the IZO FTIR instruments: the changes in the field stop instruments between 1999 and 2004, there is a switch from the IFS 120M to the IFS 120/5HR in January 2005, optical re-alignments are performed in June 2008 and February 2013, and internal laser replacements are performed in August 2016 and June 2017. (g) Adapted from García et al. (2022).
At IZO much effort has been made toward the instrumental characterization of the two FTIR spectrometers. Since 1999 the ILS function has been routinely monitored about every 2 months using low-pressure N2O cell measurements and the software LINEFIT (v14.5). The LINEFIT package allows the deviation of the measured ILS from the ideal one to be determined through estimating the MEA and PE parameters (Hase et al., 1999). Because the measurement process of an FTIR spectrometer is performed in the interferogram domain, this parameterization refers to the interferogram, LINEFIT uses 20 equidistant grid points up to OPDmax and assumes a smooth variation of MEA and PE along OPD. MEA (normalized to unity at zero path difference, ZPD) is a measure of ILS width, and a decline of MEA indicates a broader ILS, while a rise indicates a narrower ILS with stronger sidelobes. A curving PE indicates ILS asymmetry (while a linear rise is equivalent to a spectral shift of the ILS but does not indicate a distortion of its shape).
The ILS parameters used in the FTIR O3 retrievals at IZO are estimated from the N2O cell measurements using two broad micro-windows, combining saturated and unsaturated N2O absorbing lines between 1235.0–1279.5 and 1291.8–1301.9 cm−1, and following the approach suggested by Hase (2012). In Hase's approach, the MEA at zero OPD (ZPD) is kept fixed to unity, while the PE is not constrained at ZPD. Here Hase's method has been modified by considering a clamped PE retrieval at ZPD (i.e. the PE is kept fixed to zero at ZPD). This modification has proved to allow for a superior interpretation of the measured O3 absorption lines, and thus it offers a better reconstruction of ILS than the retrievals with free PE at ZPD. The ILS time series evaluated assuming a non-clamped PE retrieval (i.e. free PE) at ZPD and the comparison of the theoretical performance of the O3 retrievals between the clamped and non-clamped PE retrievals are both included and discussed in Appendix A.
Figure 1a–f displays two exemplary contrasting ILS retrievals, showing, on the one hand, the noticeable ILS degradation of the IFS 120M spectrometer in 2003 and, on the other hand, the proper alignment of the IFS 120/5HR after 2008. For both instruments the overall response of the ILS estimates on the actual instrumental performance is rather consistent. As observed in the rows of the averaging kernel matrix A obtained in the ILS inversion procedure, the sensitivity of the MEA retrieval slightly increases towards maximum OPDs, which ensures enough sensitivity to resolve the narrower O3 absorption lines, while the PE sensitivity is larger towards ZPD to properly characterize the instrumental asymmetry issues. Nonetheless, the comparison between the two instruments also confirms the improved sensitivity of the IFS 120/5HR as compared to the IFS 120M due to a poorer signal-to-noise ratio in the cell spectra of the latter. As a result, the number of independent pieces of ILS information that can be estimated (given by the trace of A matrix, the so-called “degrees of freedom for signal”, DOFS) for the IFS 120/5HR are greater than those obtained for the IFS 120M instrument by almost a factor of 2. For the cell examples of Fig. 1, the MEA DOFS is 0.73 and 1.61 for the IFS 120M and the IFS 120/HR, respectively, while the PE DOFS is 0.50 and 1.23 for the IFS 120M and the IFS 120/HR respectively.
The continuous monitoring of the ILS function is critical to control the instrumental alignment and temporal stability and to detect instrumental issues. The ILS time series at IZO (Fig. 1g) shows a few jumps due to punctual interventions made regarding the FTIR instruments between 1999 and 2018: (1) different changes to the field stop instruments between 1999 and 2004, (2) the switch from the IFS 120M to the IFS 120/5HR instrument in January 2005, (3) two optical re-alignments of the IFS 120/5HR system in June 2008 and February 2013, and (4) two replacements of the spectrometer's internal laser in July 2016 and July 2017. Figure 1 also illustrates that, besides suffering from a greater level of spectral noise in the cell and atmospheric measurements, the ILS of the IFS 120M spectrometer is less stable over time than the ILS of the IFS 120/5HR. After the first re-alignment in 2008, the IFS 120/5HR's MEA shows a deviation of an ideal instrument of only ∼1 % throughout the whole OPD range that remains until time of writing, while deviations of up to 5 % are observed for the IFS 120M. Regarding the PE time series, subtle asymmetries (±0.02 rad) are observed from 2003 onward in the IFS 120M and between 2010 and 2016 in the IFS 120/5HR. The former was due to the IFS 120M instrumental degradation, while the latter was likely introduced in the replacement of the interferometer's scanner motor at the end of 2009 and was properly corrected with the internal laser switch in July 2016. As discussed by Hase (2012), finite divergence and misalignment of the internal reference laser might slightly distort the sampling positions and thus impact PE.
From the analysis of the ILS evolution, three periods with different features affecting the IZO FTIR measurements clearly emerge: (1) 1999–2004, when despite the N2O cell measurements being routinely carried out, the ILS estimation is imprecise due to the instability of the IFS 120M spectrometer; (2) 2005–May 2008, when the ILS function is well assessed despite the IFS 120/5HR instrument exhibiting a gradual temporal drift; and (3) June 2008–2018, when the IFS 120/5HR instrument is well characterized and optically well aligned (ILS is nearly nominal). Thereby, these three periods will be independently analysed in the present work in order to examine the impact of the instrument's status on the FTIR O3 products.
3.2 Ozone and ILS retrieval strategies
In order to determine how the ILS characterization affects the FTIR O3 products, the retrieval strategy that theoretically and experimentally showed the best performance in García et al. (2022) has been modified to assess different ILS treatments (the so-called 5MWs set-up). In this strategy, the O3 volume mixing ratio (VMR) profiles are estimated from the measured O3 absorption lines in five single micro-windows between 991 and 1014 cm−1 by means of the inversion code PROFFIT (PROFile FIT, Hase et al., 2004). The O3 retrieval is performed using an ad hoc Tikhonov–Philips slope constraint (TP1) on a logarithmic scale. The a priori VMR profiles for O3 and all interfering species considered (H2O, CO2, C2H4, 686O3, 668O3, 676O3, and 667O3) correspond to the climatological simulations from WACCM-version 6 (Whole Atmosphere Community Climate Model, Marsh et al., 2013), while the spectroscopic parameters are taken from the HITRAN 2008 database with a 2009 update for H2O (https://www.cfa.harvard.edu, last access: 31 January 2022). Refer to García et al. (2022) for more details about the O3 retrieval strategy.
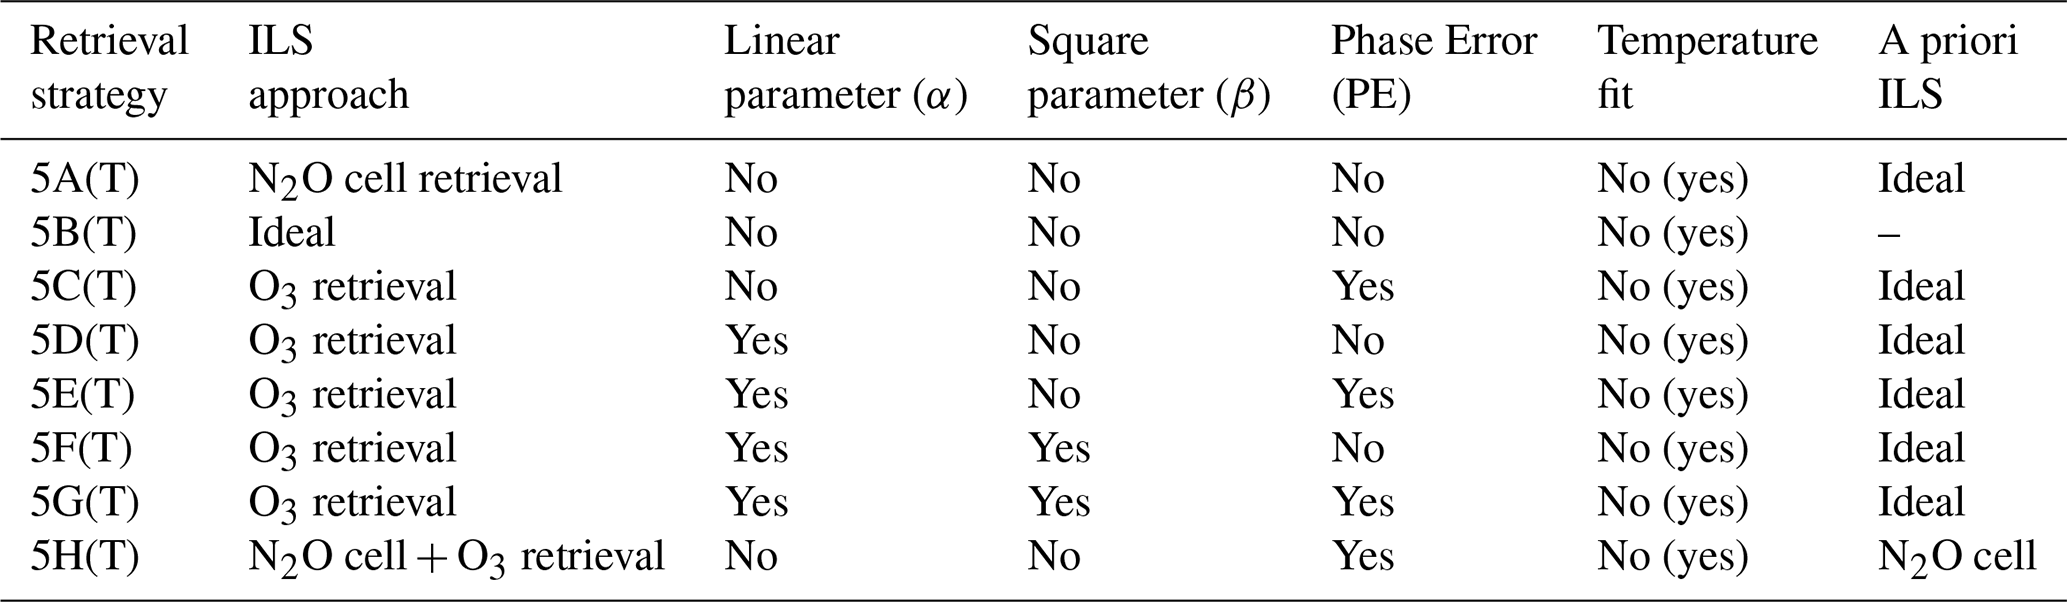
The strategies considered to deal with the ILS function are listed in Table 1 and are based on different approaches traditionally used by the FTIR community (e.g. Schneider and Hase, 2008; Vigouroux et al., 2008, 2015; Sun et al., 2018). Set-up 5A considers the ILS time series obtained from independent N2O cell measurements and evaluated with LINEFIT-v14.5 (Fig. 1). Set-up 5B assumes an ideal ILS function, i.e. both the MEA and the PE are set to 1 and 0, respectively, for the whole OPD range. The configuration 5C only retrieves the PE parameter, which is fitted to a constant value throughout the whole OPD range, while the MEA is considered to be ideal (i.e. equal to 1). Set-ups 5D and 5F only estimate the MEA parameter (also so-called effective apodization parameter, EAP, fit), which is calculated by using a second-order polynomial fit of OPD as follows:
where α and β are the linear and square parameters, respectively, OPDmax is equal to 180 cm, and the MEA is sampled at 20 equidistant positions in the interval x=0, …, OPDmax. Set-up 5D assumes that the MEA linearly varies with the OPD, whereby only the linear parameter α is retrieved simultaneously with the O3 concentrations, while set-up 5F considers a second-order polynomial dependency, meaning that both the linear and square parameters are estimated. Set-ups 5E and 5G optimize set-ups 5D and 5F, respectively, by including the PE fit, which is retrieved similarly to set-up 5C (i.e. a constant value throughout the whole OPD range). Set-ups 5C, 5D, 5E, 5F, and 5G assume an ideal ILS as a priori information. Finally, in order to account for uncertainties in the assessment of the independent N2O cell measurements, set-up 5H uses the cell-derived MEA values, but a simultaneous fit of a PE offset is superimposed on the retrieved path-dependent cell-derived PE.
Table 1Description of the FTIR O3 retrieval strategies with different ILS characterizations and with and without a simultaneous atmospheric temperature profile retrieval ( the set-ups fitting the temperature profile are given in brackets). The 5A, 5AT, 5B, and 5BT configurations consider the cell-derived and the ideal ILS, respectively. The remaining set-ups fit some of the ILS parameters in the O3 retrieval procedure. Note that the level of refinement of the ILS retrieval increases from set-up 5C to set-up 5H.
As reported in previous work (Schneider and Hase, 2008; Schneider et al., 2008a; García et al., 2012, 2022), the quality of the FTIR O3 products can be significantly improved by including a simultaneous atmospheric temperature profile retrieval. However, this enhancement can only be achieved provided the FTIR spectrometer is well characterized and stable over time. For unstable instruments, the temperature fit has been found to exhibit a strong negative impact on the O3 retrievals by increasing the cross-interference between the instrumental performance and the temperature retrieval (Schneider and Hase, 2008; García et al., 2022). In order to examine the combined effect of a simultaneous ILS and temperature retrieval for different instrument's status, an optimal estimation of the atmospheric temperature profile has also been considered in this study. For this purpose, four isolated CO2 absorption lines between 962.80 and 969.60 cm−1 have been added to the O3 micro-windows, and the temperature a priori information and inversion settings have been defined according to García et al. (2022, and references therein). The retrieval strategies with nomenclature that end with the character “T” include a simultaneous atmospheric temperature profile retrieval (see Table 1).
The FTIR spectra are only recorded when the line of sight (LOS) between the instrument and the Sun is cloud-free. However, to avoid possible contamination of thin clouds or unstable measured spectra, once the O3 retrievals have been computed they are filtered according to the number of iterations at which the convergence is reached and the fitting residuals between the simulated and measured spectra. Following this, all O3 datasets are temporally paired to ensure a fair comparison. The coincident and quality-filtered FTIR O3 retrievals amount to 4924 in the 1999–2018 period (∼90 % of the measured dataset).
3.3 Theoretical quality assessment
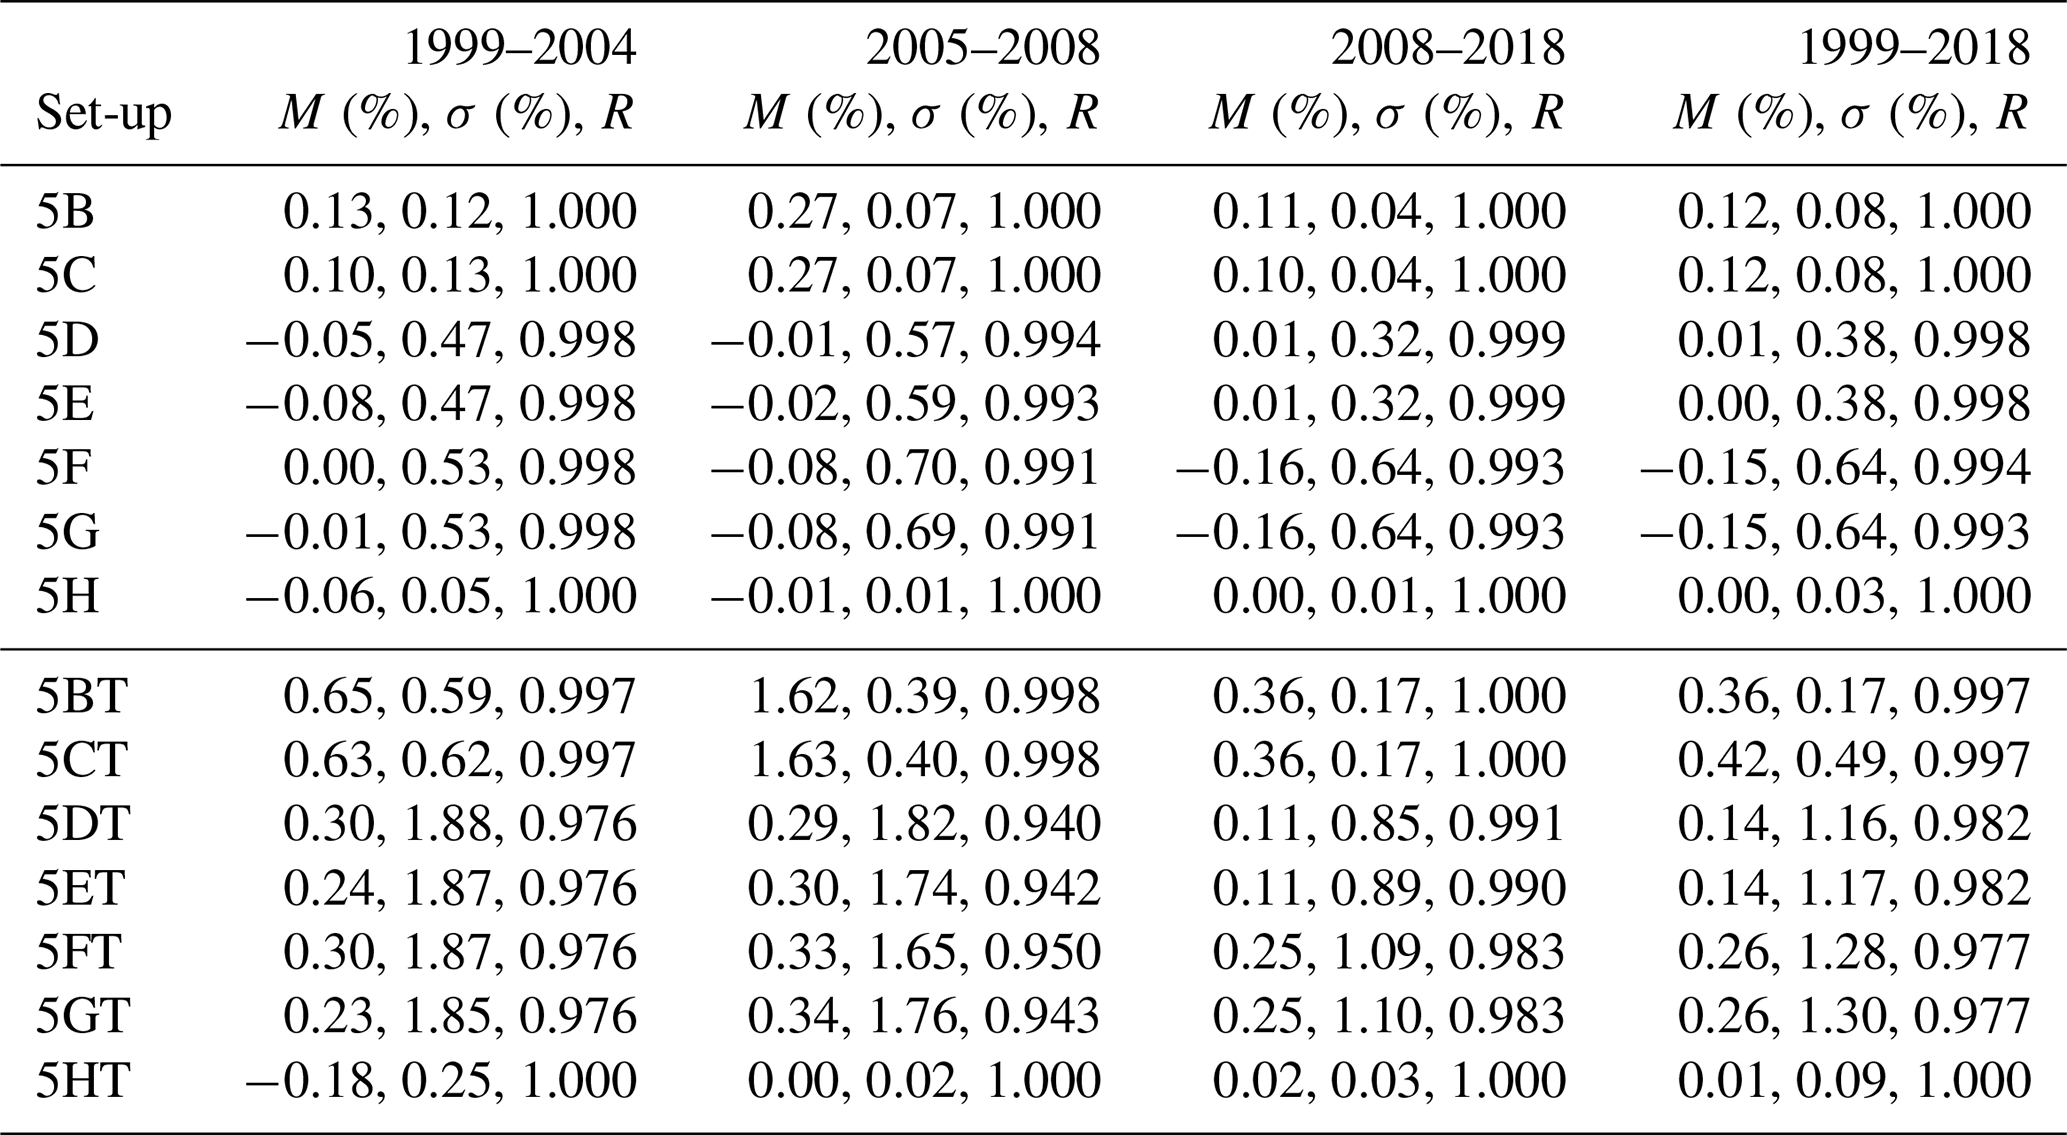
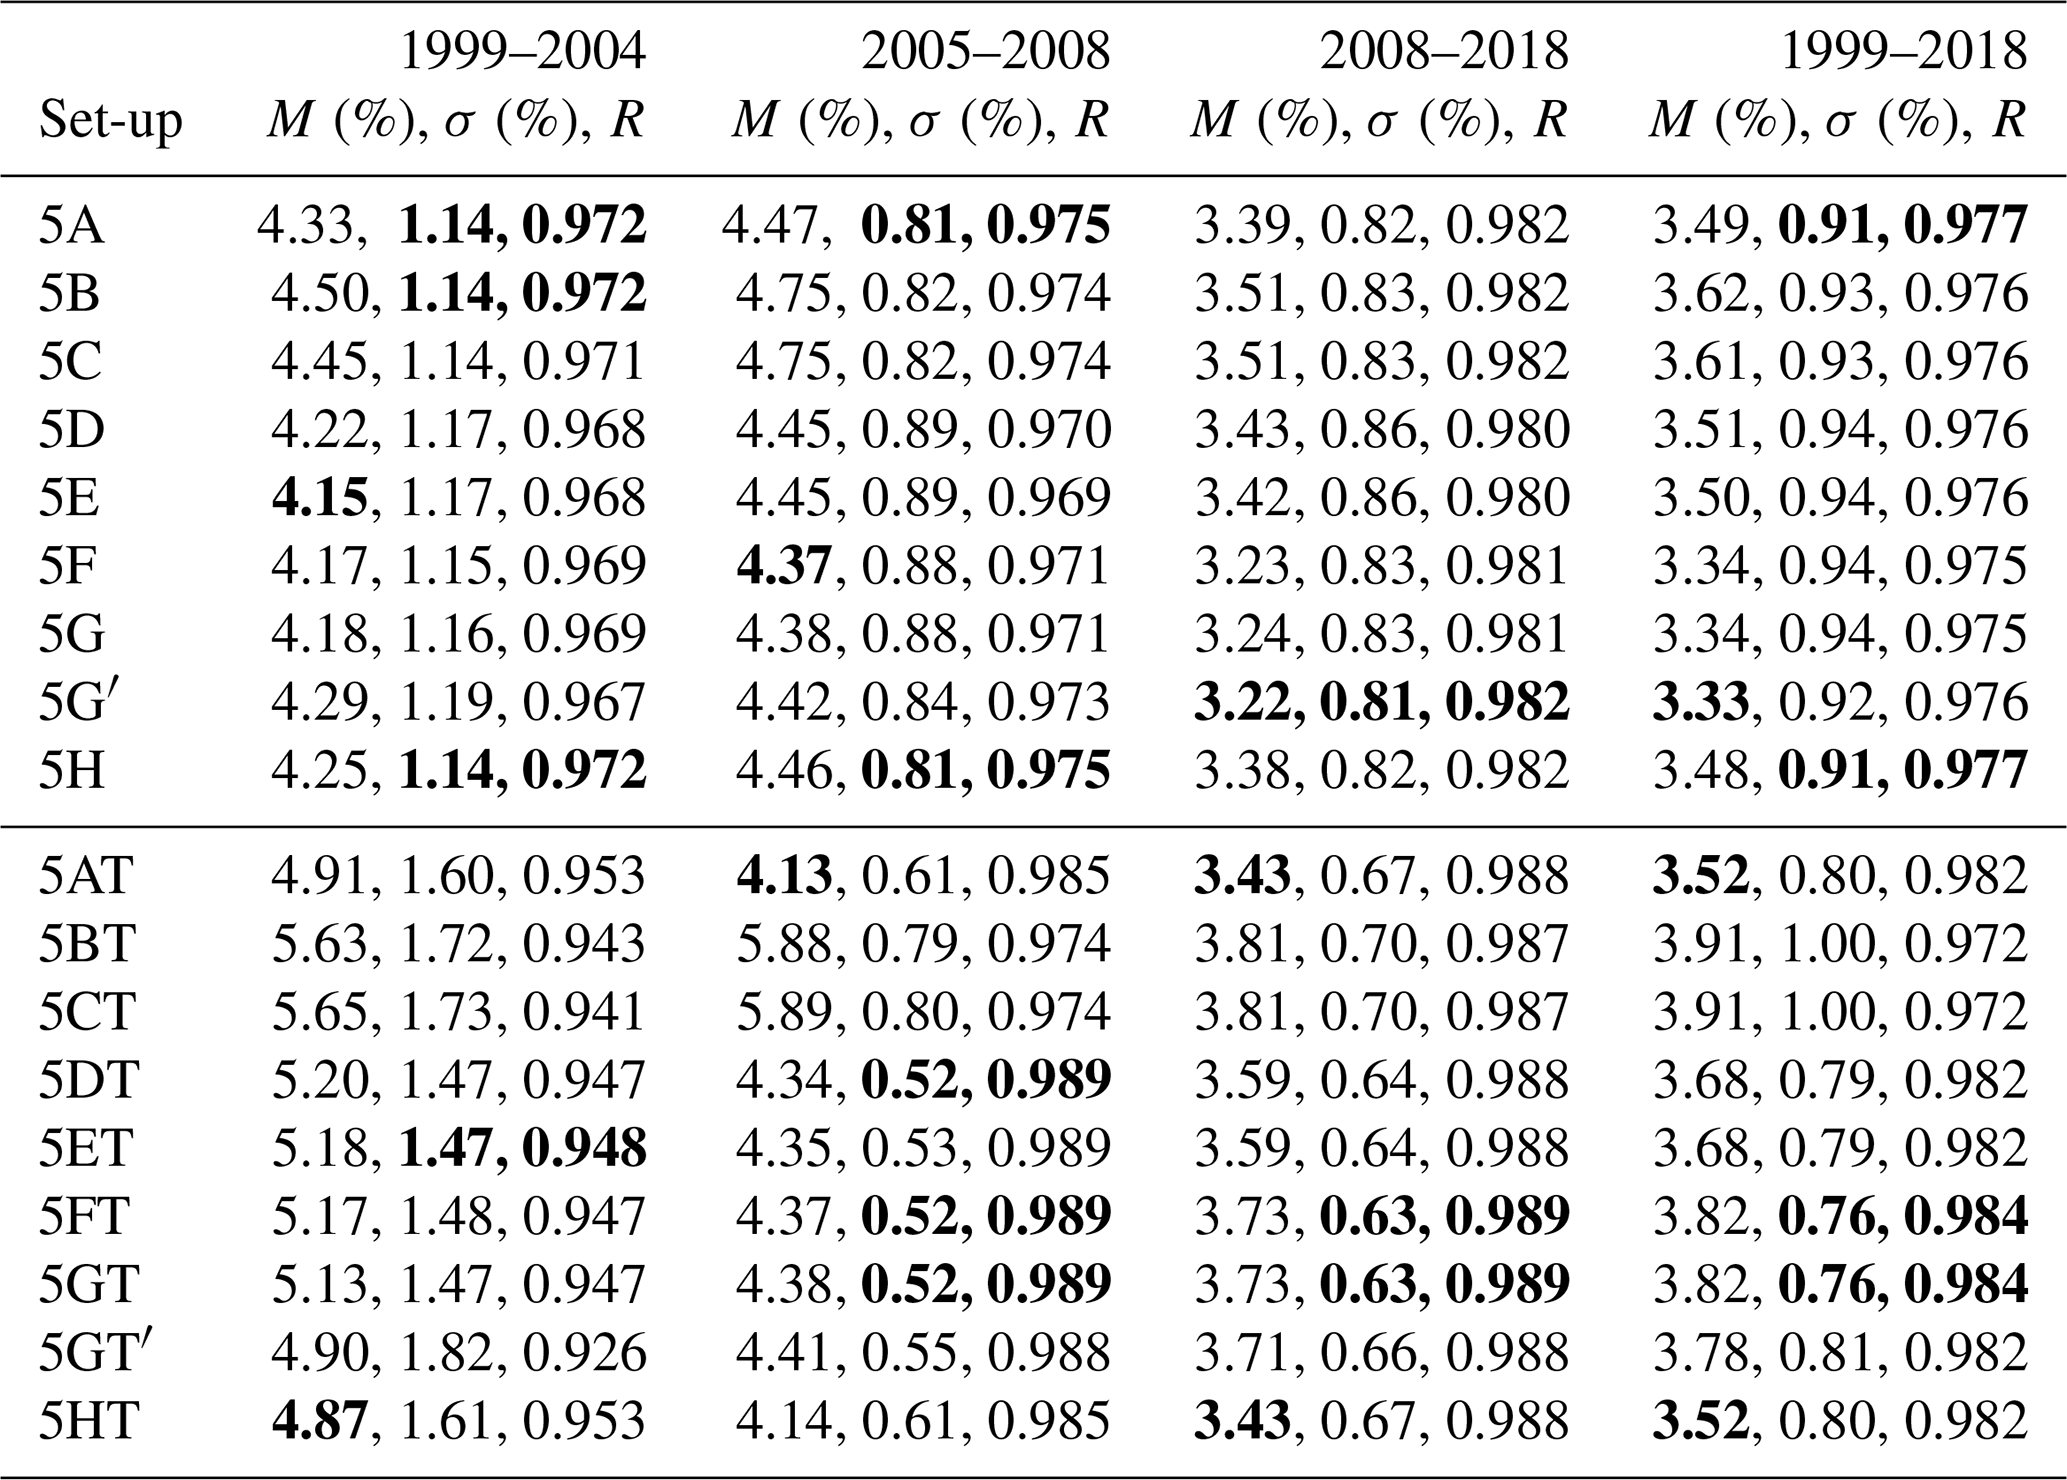
This section presents the theoretical characterization of the different ILS retrieval strategies based on the evaluation of their performance and expected uncertainties. Table 2 provides an overview of the vertical sensitivity of the different retrievals on real O3 variations (i.e. total O3 DOFS) and of the interpretation of the measured spectra (i.e. fitting residuals).
Table 2Summary of statistics of the DOFS and fitting residuals for the set-ups 5A and 5AT, 5B and 5BT, 5C and 5CT, 5D and 5DT, 5E and 5ET, 5F and 5FT, 5G and 5GT, and 5H and 5HT for the periods 1999–2004, 2005–May 2008, and June 2008–2018 and for the entire time series (1999–2018). The fitting residuals are computed as the signal-to-noise ratio for a common spectral region contained in all set-ups (1001.47–1003.04 cm−1). Shown are the median (M) and standard deviation (σ) for each period. The number of quality-filtered measurements is 466, 683, and 3775 for the three periods, respectively, and 4924 for the whole dataset. The strategies showing the best performance (largest DOFS and smallest residuals) are highlighted in bold for each period.
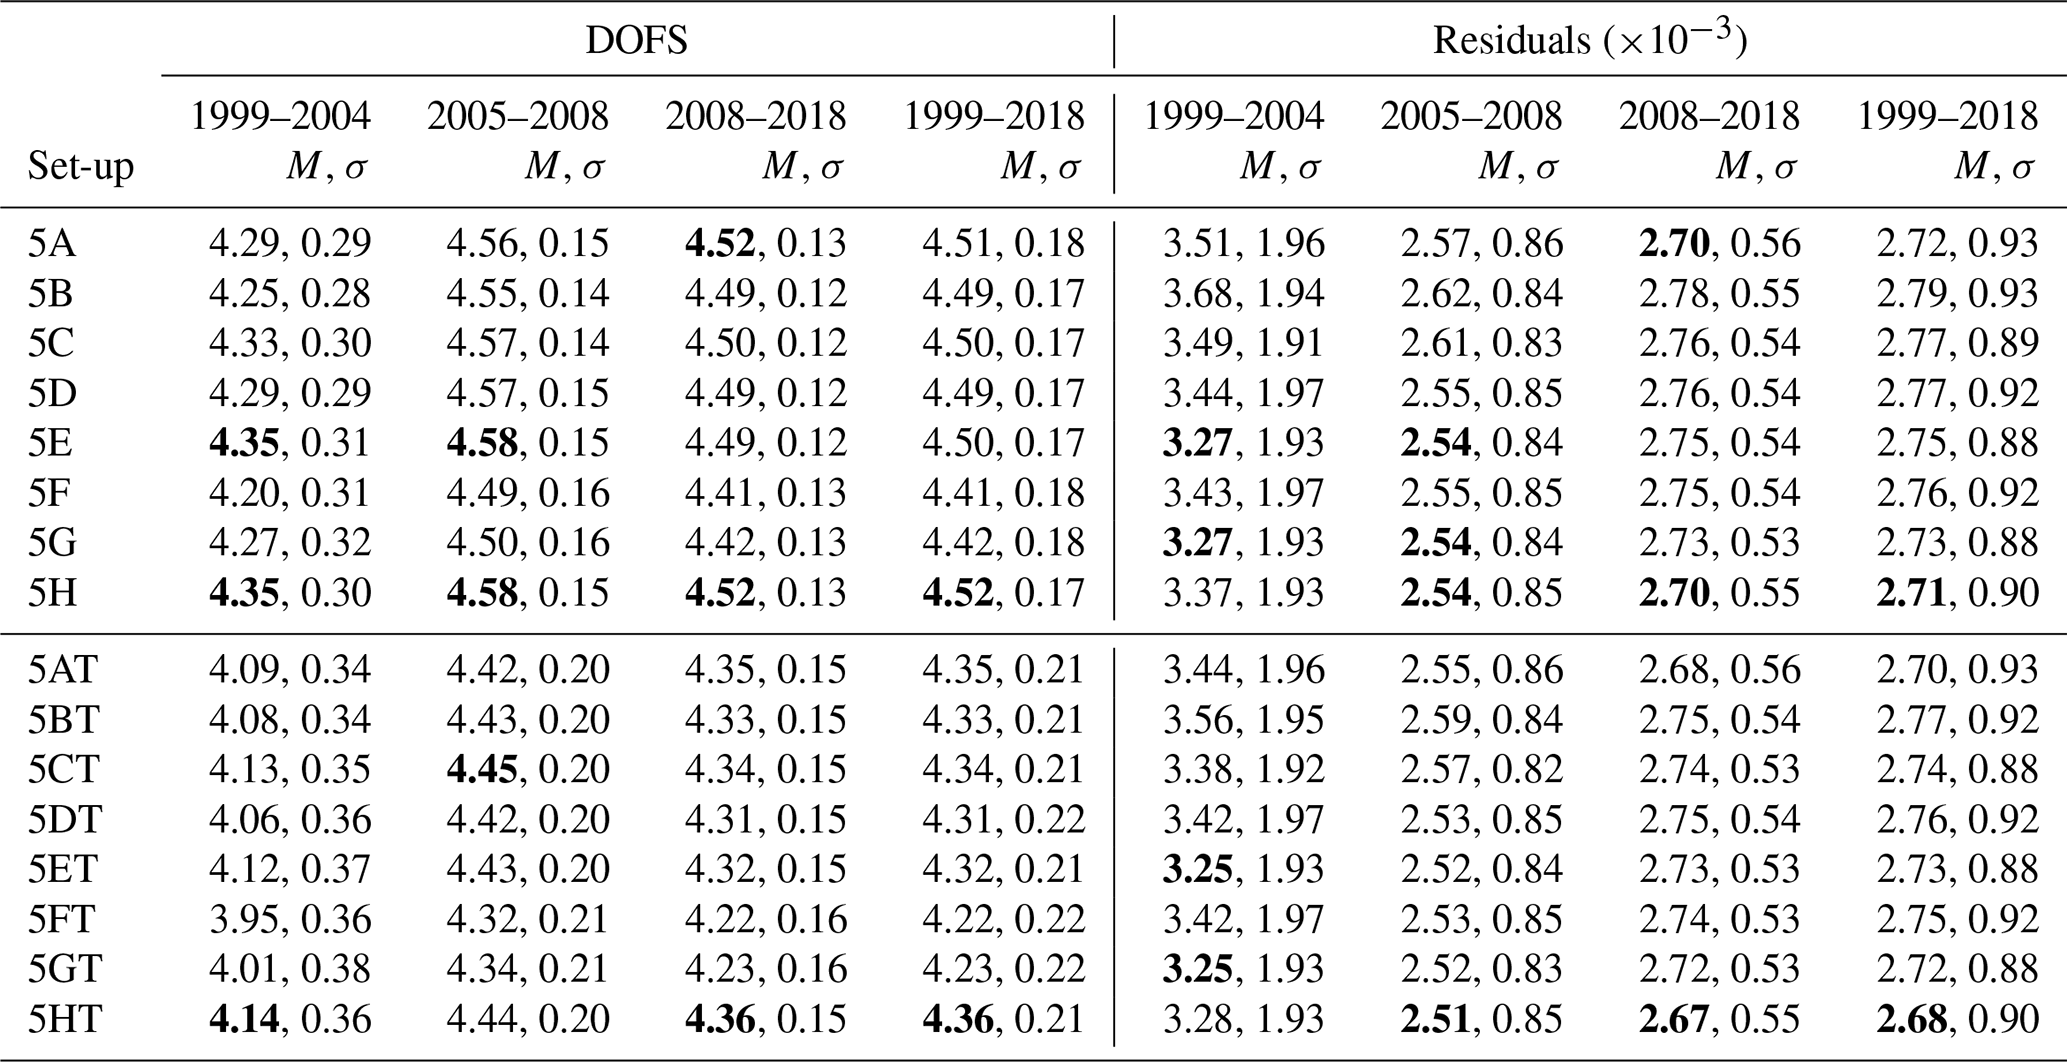
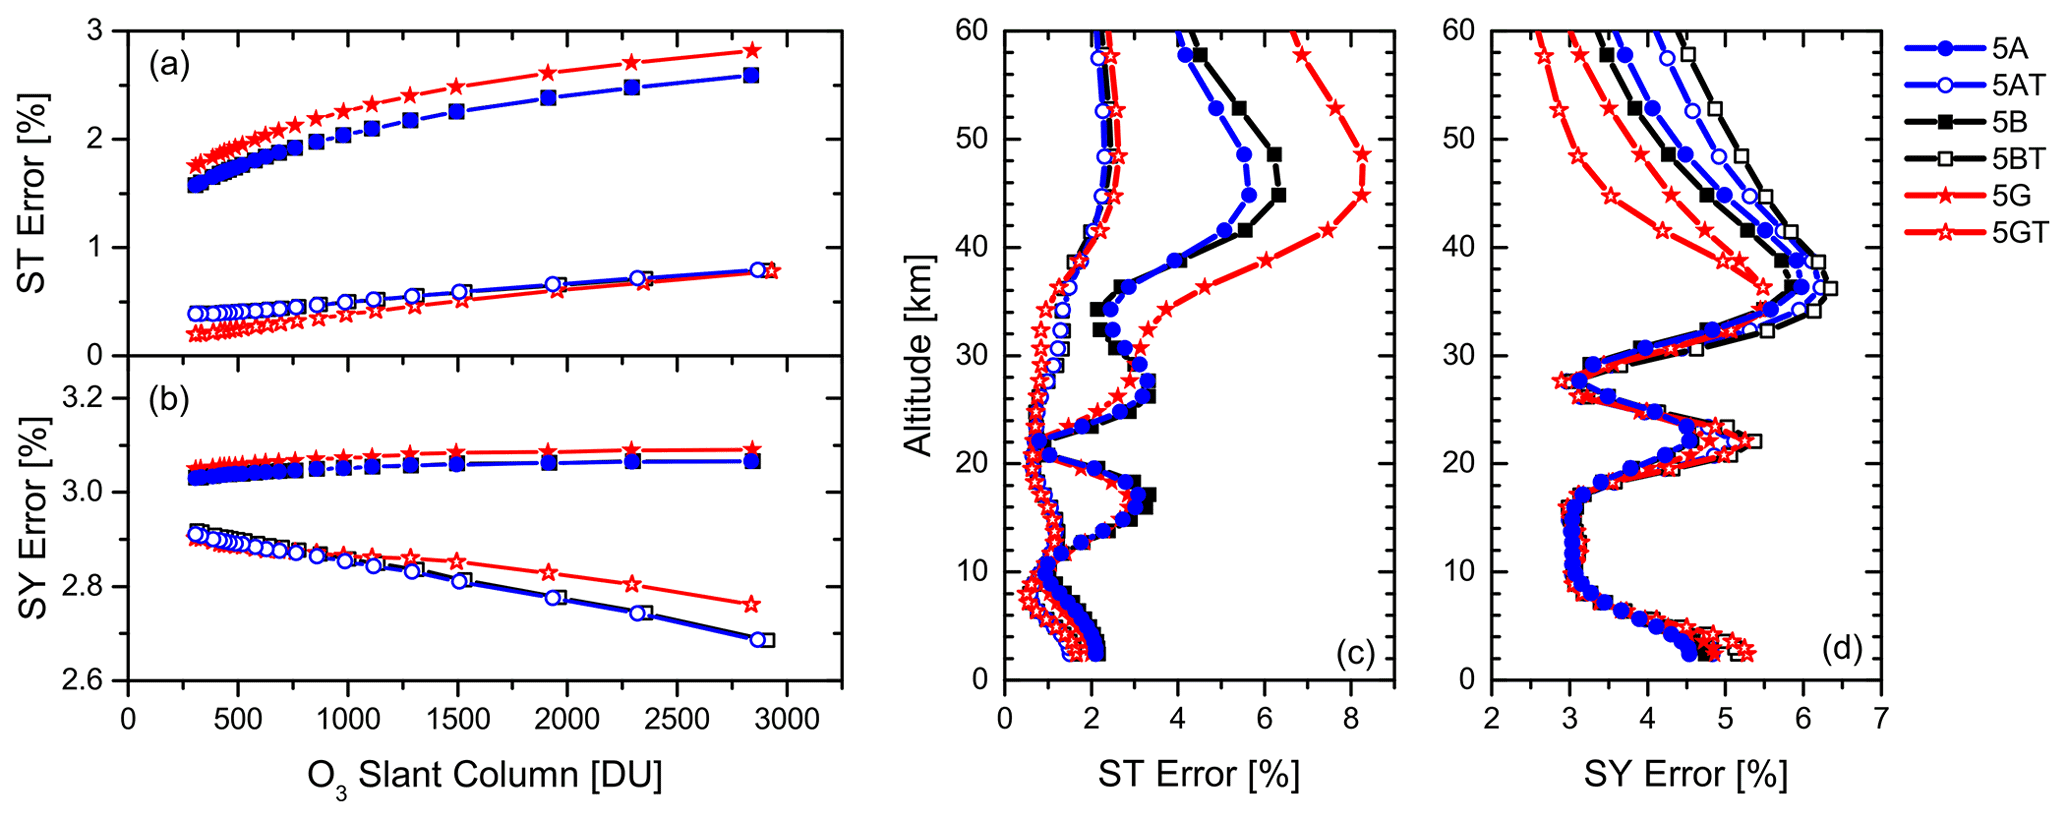
Figure 2(a) Estimated total statistical (ST) and (b) systematic (SY) errors (%) for O3 TCs retrieved from the 5A and 5AT, 5B and 5BT, and 5G and 5GT set-ups as a function of O3 slant column (SC) (DU) for measurements taken on 31 August 2007 from solar zenith angles (SZAs) between 84∘ (∼ 07:00 UT) and 21∘ (∼ 13:30 UT). (c) Example of estimated total statistical (ST) and (d) systematic (SY) error profiles (%) for the same set-ups for the spectrum taken on 31 August 2007 at a SZA of ∼ 50∘ and an O3 SC of 390 DU. The total errors are computed as the square root of the quadratic sum of all ST and SY error sources considered.
For all ILS set-ups an averaged total DOFS of ∼ 4 has been consistently obtained, whereby four atmospheric O3 altitude regions can be distinguished by both FTIR instruments (i.e. troposphere, upper troposphere–lower stratosphere (UTLS), middle stratosphere, and upper stratosphere). Although the differences between the periods and retrieval strategies lie within the overall variance, the set-ups considering the cell-derived ILS (5A and 5AT) seem to present the best performance when the FTIR system is very stable over time (i.e. 2008–2018 period). However, the opposite behaviour is observed for the more unstable periods, which is likely due to uncertainties in the cell-derived PE estimates, as documented by the enhancement of sensitivity and the reduction of fitting residuals when the PE is simultaneously fitted in the O3 retrieval procedure (5H and 5HT). For the remaining set-ups, the total vertical sensitivity slightly decreases as the ILS set-ups become more sophisticated (from 5C and 5CT to 5G and 5GT) because the information contained in the measured spectra is then split into the ILS and O3 retrievals (the retrieved state vector space is not perfectly orthogonal). However, in return the measured spectra are better reproduced. Similar patterns are observed when the temperature profile fit is also included in the retrieval strategy (lower total DOFS and lower fitting residuals are obtained as compared to those set-ups that do not retrieve the temperature).
The different ILS strategies have been also evaluated by performing an uncertainty analysis, which follows the formalism given in Rodgers (2000) and the NDACC IRWG recommendations (IRWG, 2014) and has been analytically performed by the PROFFIT package. The error budget includes the impact of the spectral measurement noise and errors due to uncertainties in the input parameters, accounting for instrumental and model features, which are split into statistical (ST) and systematic (ST) contributions. More specifically, the ILS function estimates are assumed to have an uncertainty of 1 % and 0.01 rad for the MEA and PE, respectively. The baseline parameters, accounting for channelling effects and the intensity offsets, are expected to show an error of 0.1 %, while the solar pointing issues are limited to 0.001 rad. Regarding atmospheric temperatures, an uncertainty of 2 K up to 50 km a.s.l. and 1 K for higher altitudes has been considered. Possible uncertainties in the determination of solar lines have been also included (an error of 1 % and 10−6 for intensity and spectral position, respectively). Finally, the O3 spectroscopy data (intensity and pressure broadening parameters) are assumed to be uncertain by 3 %. All of these error sources and values can be considered typical for FTIR measurements (e.g. García et al., 2016; Gordon et al., 2022). Refer to García et al. (2022, and references therein) for further details on the error estimation.
The propagation of these uncertainty sources for a typical measurement day of the IFS 120/5HR instrument, considering the cell-derived (5A and 5AT), ideal (5B and 5BT), and the most refined ILS characterization (5G and 5GT), is displayed in Fig. 2. The error estimates reveal consistent results for all ILS set-ups. On the one hand, both the statistical and systematic uncertainties do depend on the O3 spectroscopic signatures due to the increase in the pointing errors and measurement noise at larger O3 slant column (SC) amounts. On the other hand, the inclusion of a simultaneous temperature retrieval significantly improves the theoretical performance for all FTIR O3 products, as mentioned above. The total statistical errors of O3 TCs are reduced to one-third when applying the temperature fit (from ∼ 1.5 %–3.0 % to ∼ 0.5 %–1.0 % for O3 SCs between 250 and 3000 DU), while the total systematic contributions drop by 0.1 %–0.4 % at low- and high-O3 SCs, respectively. However, the uncertainty analysis also illustrates the cross-interference between the simultaneous ILS and temperature retrievals, which becomes more evident in the altitude-resolved error patterns (Fig. 2c and d). For set-ups without the temperature fit, the ILS retrieval (5G) increases the statistical errors of the O3 TCs by significantly worsening the error profiles beyond the middle stratosphere. However, when the temperature and ILS are jointly retrieved with the O3 concentrations (5GT), more precise O3 TCs are expected due to an error reduction in the middle stratosphere layer around 30 km (visible for O3 SCs smaller than 1500 DU in Fig. 2a). Although only the error estimation for the set-ups 5G and 5GT is depicted in Fig. 2 for simplicity, the remaining strategies fitting the ILS parameters are found to be consistent with these results overall.
It is worth highlighting that the uncertainty analysis carried out in this work assumes the same uncertainty values for the MEA and PE parameters for all strategies. However, the ILS errors for set-ups 5B and 5BT (ideal MEA and PE) or 5C and 5CT (ideal MEA) are expected to be significantly larger than for the 5A and 5AT retrievals (cell-derived ILS), especially for the MEA parameter as displayed in Fig. 1. As shown by García et al. (2022), an uncertainty of ∼ 5 % for the MEA parameter may double the expected total statistical errors if the temperature fit is taken into account in the O3 retrieval procedure.
Figure 3 synthesizes the comparison between the cell-derived ILS time series for the two IZO FTIR instruments, evaluated from N2O cell measurements (Fig. 1), and those retrieved simultaneously with the O3 concentrations from the most refined ILS set-ups (5G and 5GT). The MEA time series as a function of the OPD and the MEA and the PE time series at an OPD of 133 cm are shown as examples of the ILS behaviour at large OPDs. Note that the ILS evaluation becomes determinant towards maximum OPDs due to the high spectral resolution required to resolve the narrow O3 absorption lines.
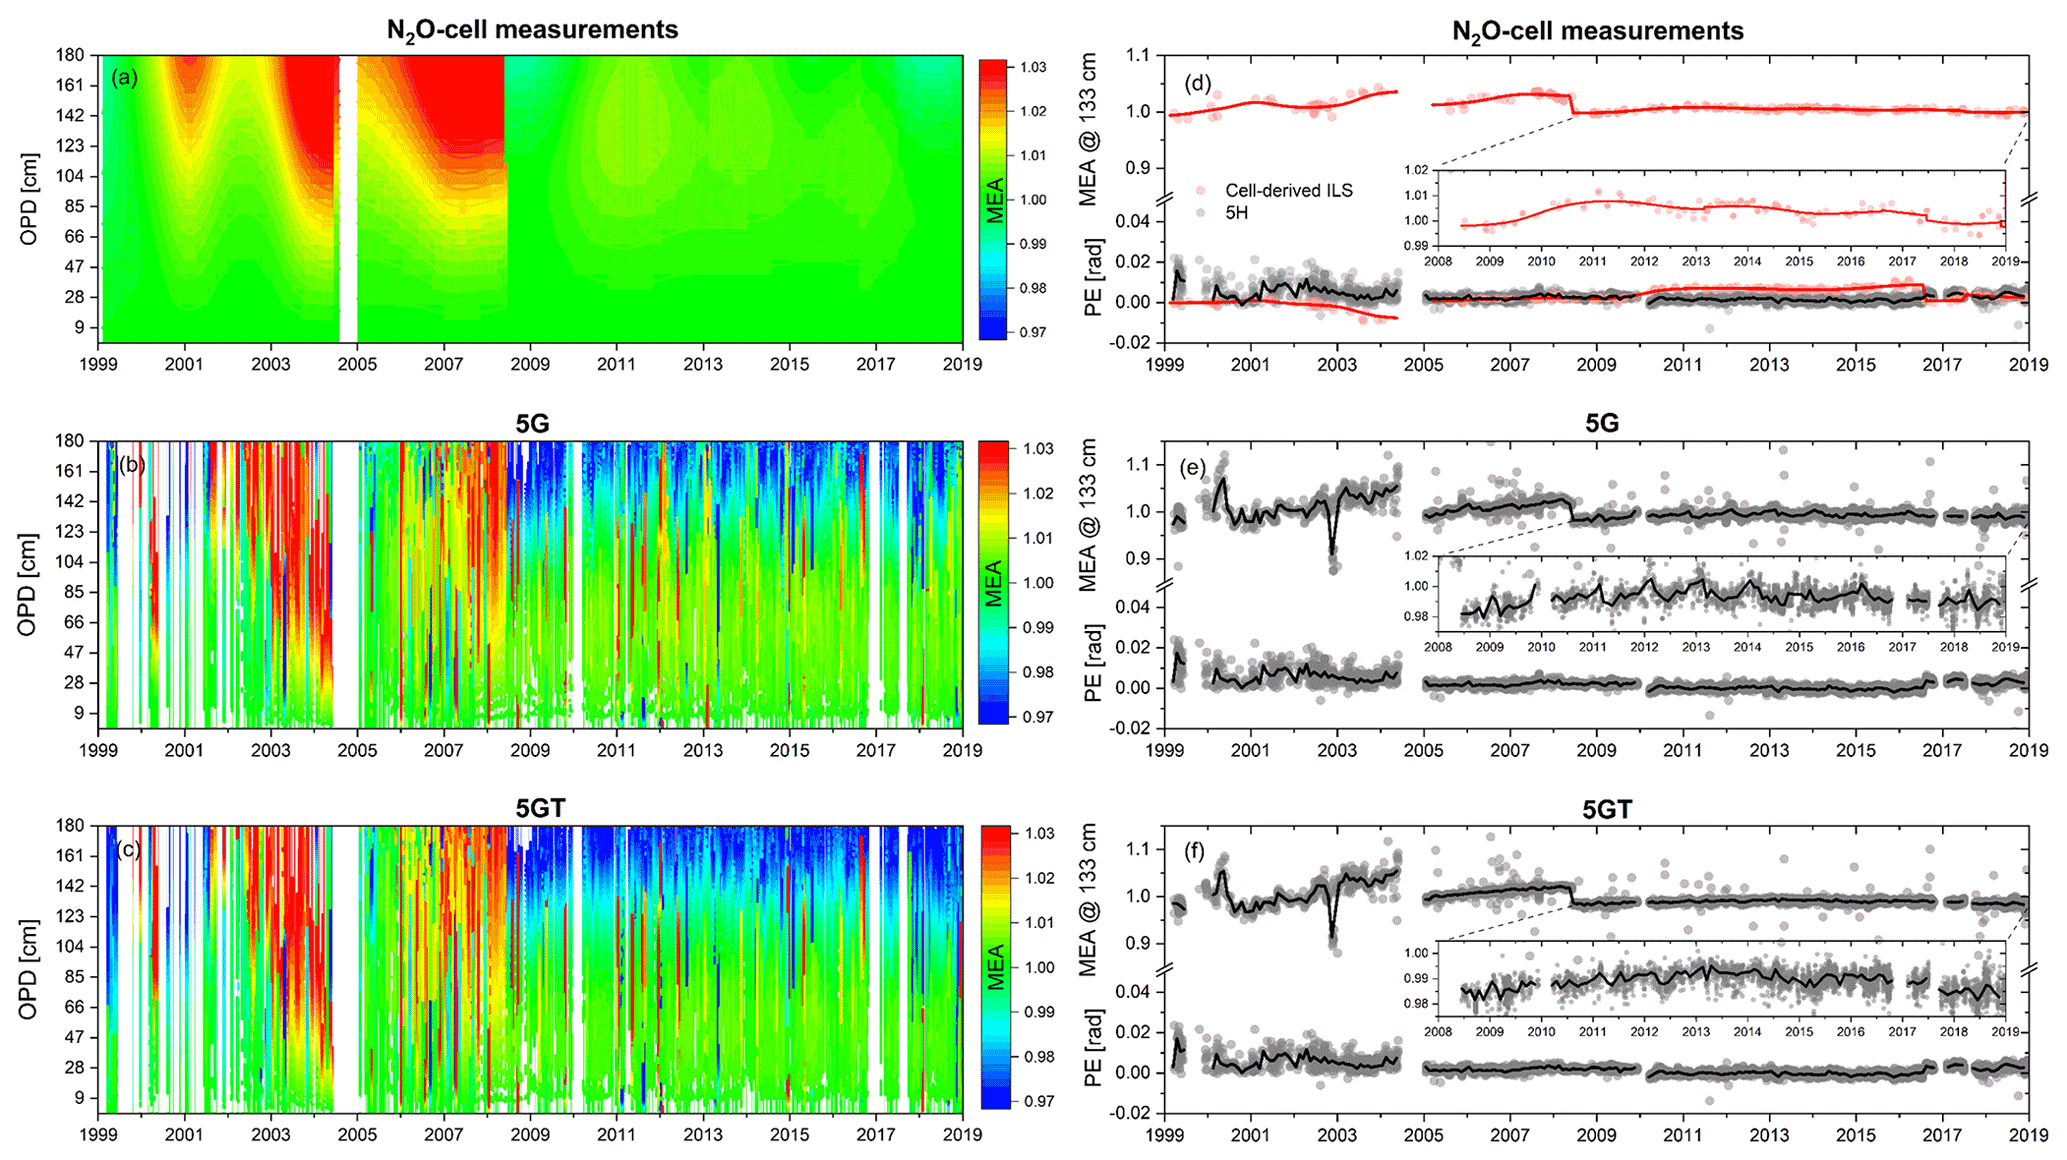
Figure 3Time series of the MEA as a function of the OPD from 1999 to 2018 evaluated from (a) N2O cell measurements, (b, c) O3 retrievals (5G and 5GT). Panels (d), (e), and (f) are the same as (a), (b), and (c) but for the MEA and PE at an OPD of 133 cm. The PE values retrieved from the 5H set-up are also included in (d). Note that for set-ups 5G, 5GT, 5H, and 5HT the retrieved PE is constant throughout the whole OPD range.
The ILS comparison proves that the general shape of the cell-derived MEA is reproduced well by the ILS retrieval strategies: the estimated MEA values capture the increasing drift for the IFS 120M instrument and for the IFS 120/5HR spectrometer between 2005 and May 2008 and its stable evolution since then. However, the fitted MEA shows an artificial annual cycle, which is more noticeable when the temperature is not simultaneously retrieved and the instrument is properly aligned and stable (after the first re-alignment in 2008; a zoom in of this period is shown in Fig. 3e). In addition, fitting the ILS parameters produces, together with a noticeable daily variability, unrealistic MEA retrievals (see, for example, the values at the beginning of 2000 and at the end of 2002 in Fig. 3e and f). Thereby, the ILS fit seems to misinterpret extreme or anomalous O3 events as instrumental deficiencies. These results point out the existence of a significant cross-interference between the ILS and the O3 concentrations when both are simultaneously retrieved, meaning that part of the O3 variability on a daily and annual basis are damped when fitting the ILS parameters.
Similarly to the MEA retrievals, the estimated PE values are also able to capture the overall evolution of the IFS 120/5HR instrument and the punctual interventions made regarding the spectrometer (e.g. the scanner's motor change at the end of 2009 and the internal laser switches in 2016 and 2017). As expected, the IFS 120M instrument exhibits more variable retrieved PE values from the atmospheric spectra than those evaluated from the N2O cell measurements. Figure 3d also includes the retrieved PE values from the set-up 5H, which superimposes an PE offset on the cell-derived PE values. The excellent agreement between the PE retrievals from atmospheric spectra using an ideal and the cell-derived ILS as a priori information becomes evident (Fig. 3e and f). However, as shown in Appendix A, larger PE corrections are retrieved from the atmospheric spectra when the cell-derived ILS is evaluated assuming a non-clamped PE retrieval (especially for the IFS 120M instrument). This fact further corroborates that a clamped PE retrieval at ZPD when evaluating the N2O cell measurements is a superior choice to characterize the instrumental performance of the NDACC FTIR spectrometers, as outlined in Sect. 3.1.
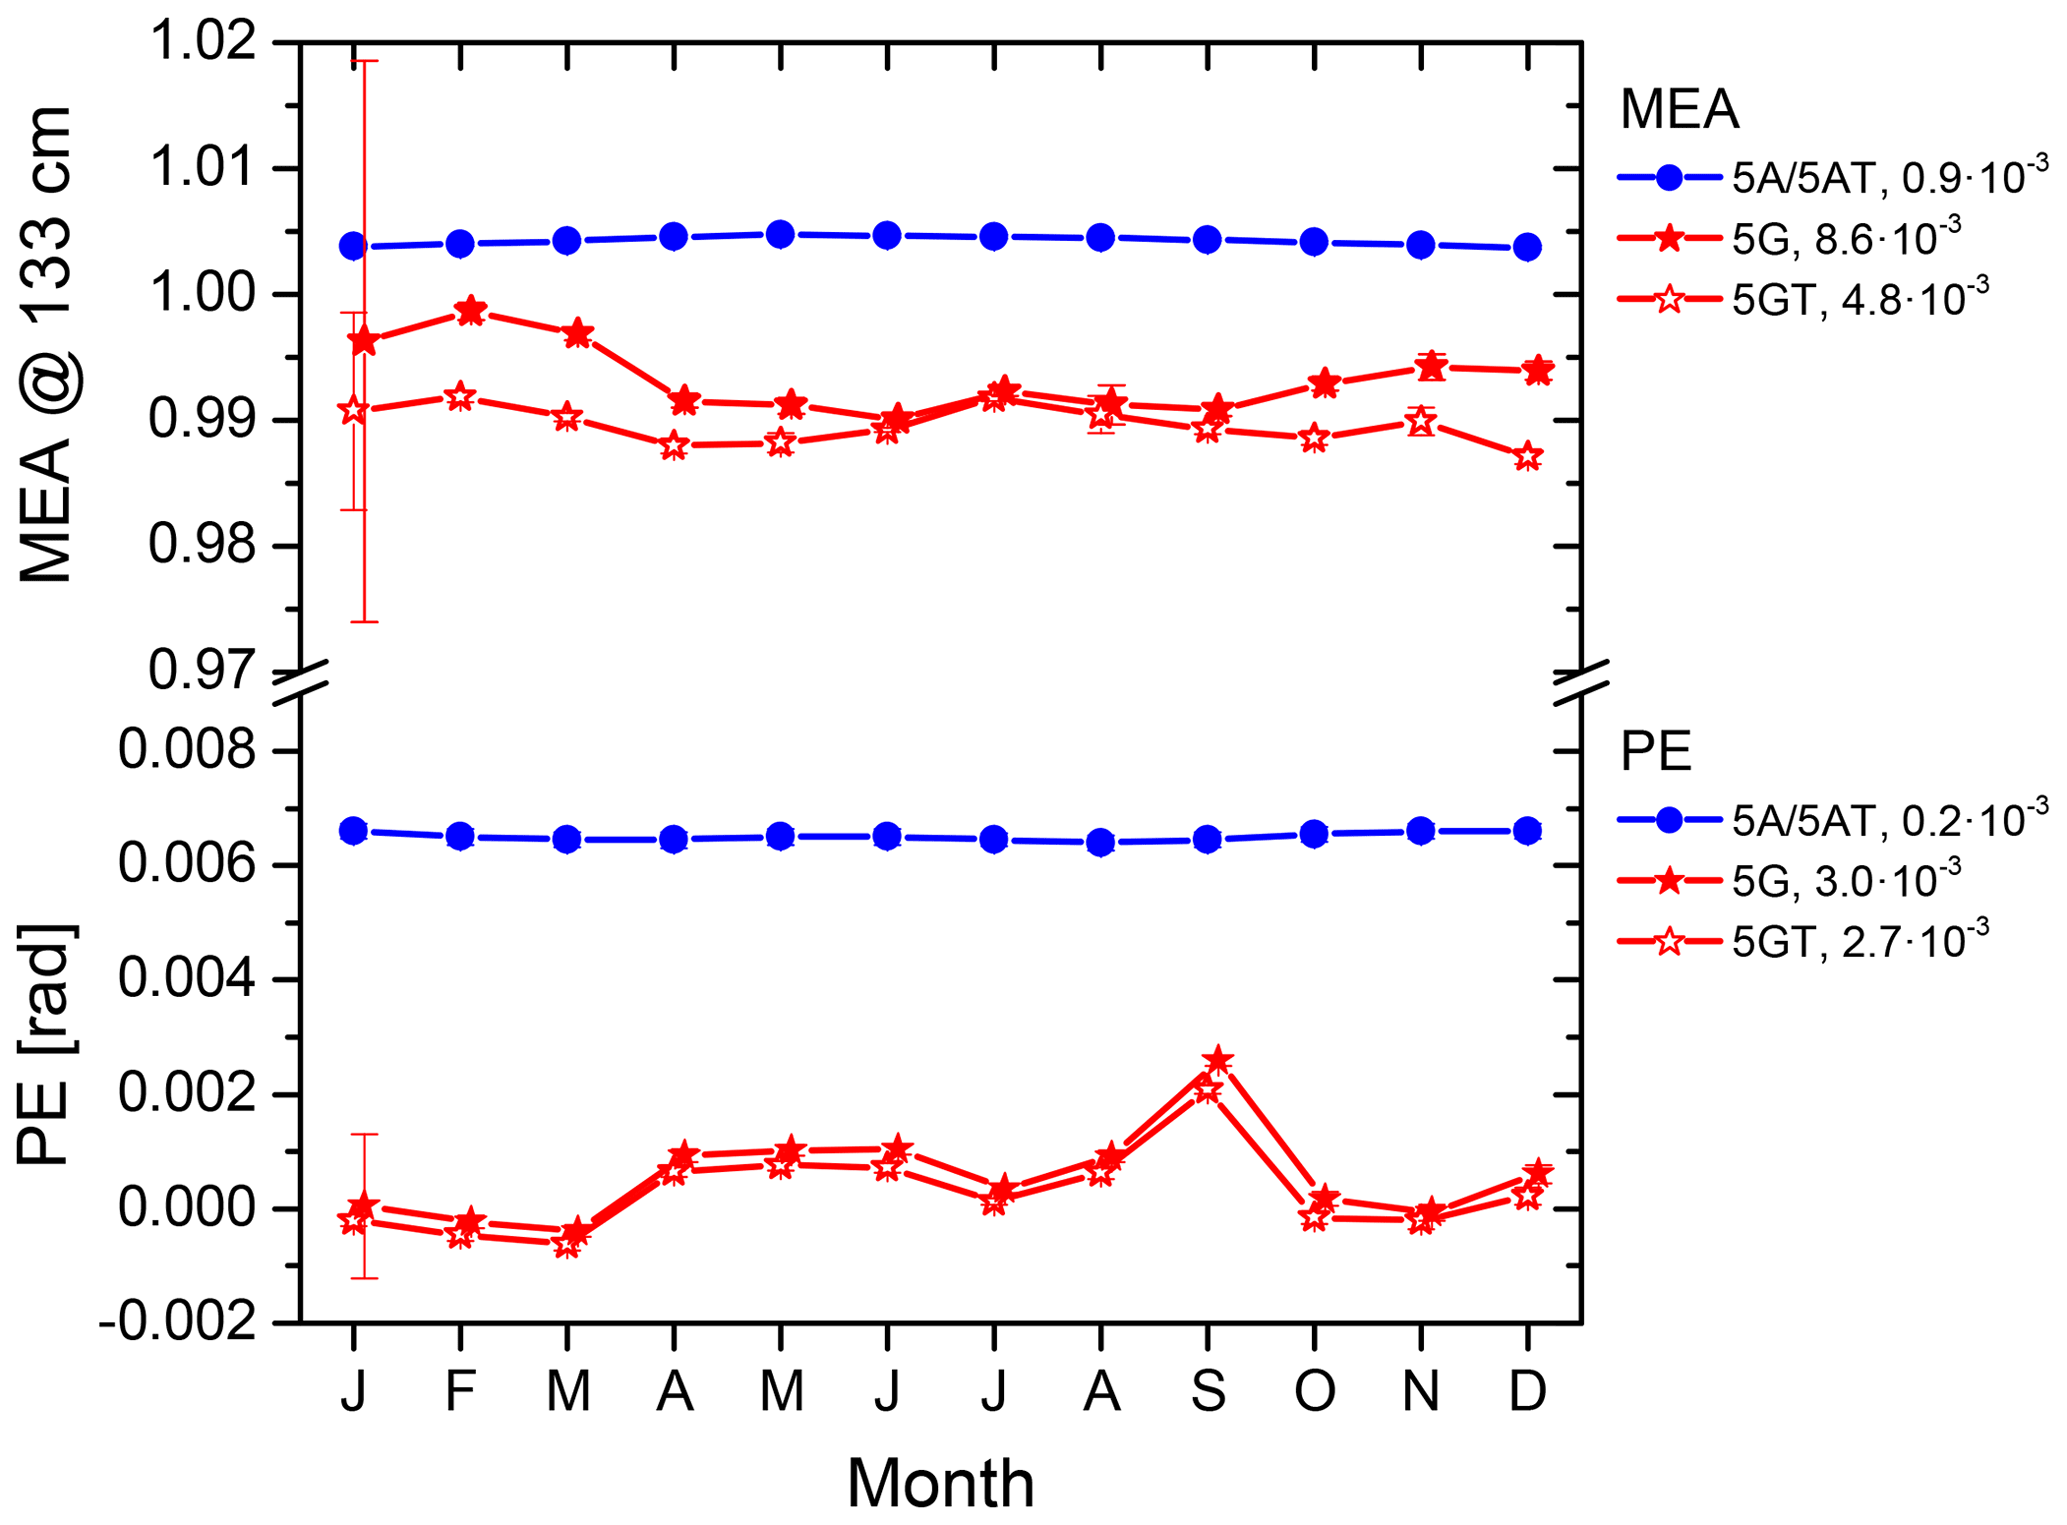
Figure 4Averaged annual cycle of the MEA (at 133 cm) and PE (rad) from 2009 to 2018 for the set-ups 5A, 5AT, 5G, and 5GT. For 5A and 5AT the PE is given at 133 cm, while for the other strategies it corresponds to a unique value throughout the whole OPD range. The annual range (annual maximum minus annual minimum) is shown in the legend for each set-up. The error bars in the seasonal cycles are the standard errors of the mean, , where σ is the standard deviation and N is the number of monthly measurements.
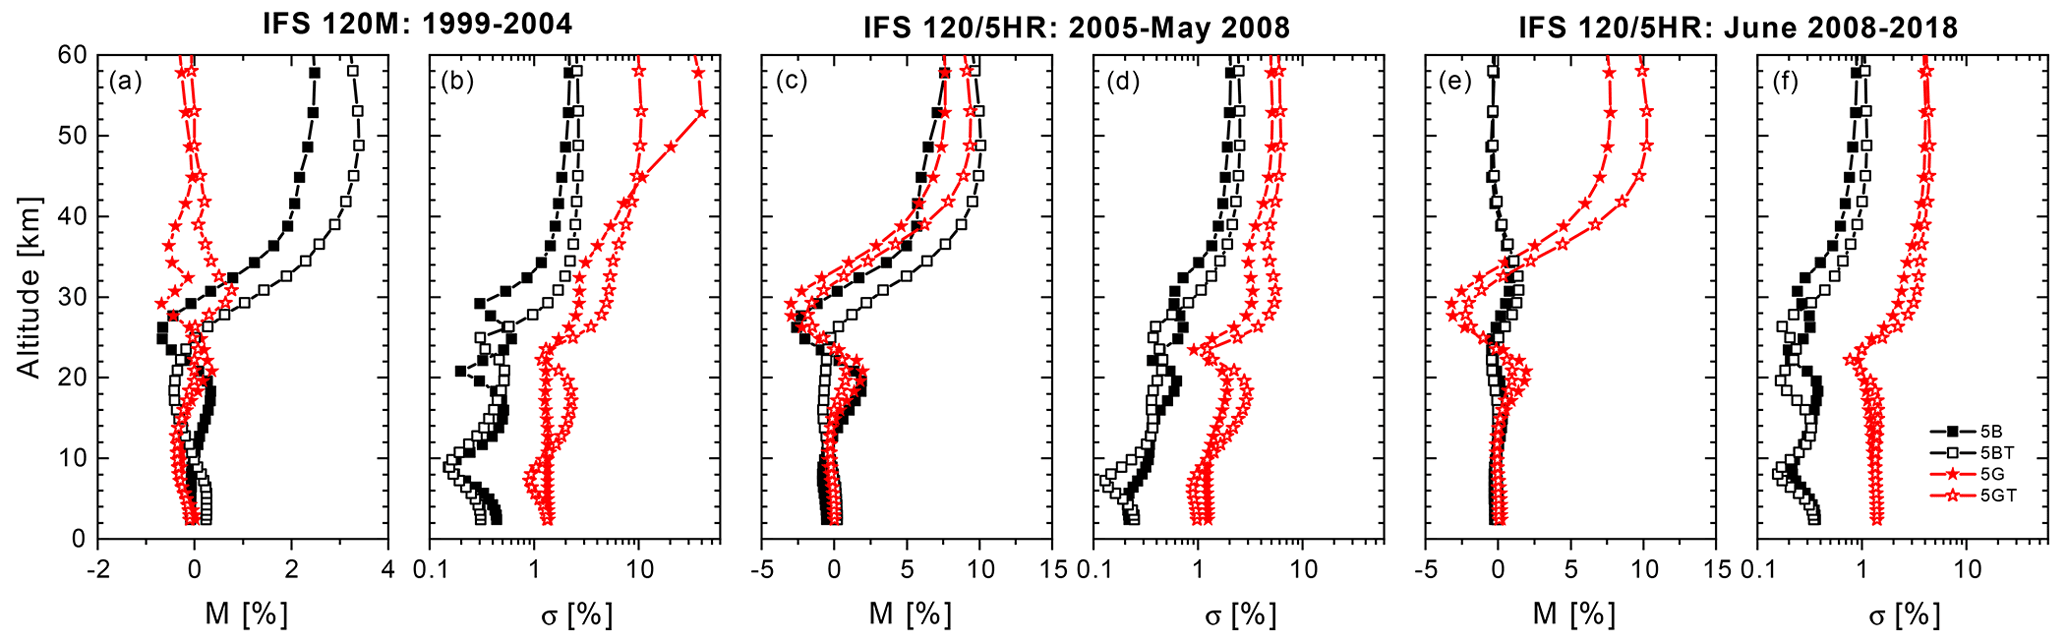
Figure 5Summary of the O3 profile comparison for the set-ups 5B, 5BT, 5G, and 5GT with respect to 5A and 5AT for the periods 1999–2004, 2005–May 2008 and June 2008–2018, and for the entire time series (1999–2018). Panels (a), (c), and (e) display the vertical profiles of the median (M) RD (5X and 5XT to 5A and 5AT, in %) for the three periods, respectively. Panels (b), (d), and (f) are the same as (a), (c), and (e) but for the standard deviation of RD distributions (σ, in %).
Table 3Summary of statistics for the O3 TC comparison for the set-ups 5B, 5BT, 5C, 5CT, 5D, 5DT, 5E, 5ET, 5F, 5FT, 5G, 5GT, 5H, and 5HT with respect to 5A and 5AT: median (M, in %) and standard deviation (σ, in %) of the relative differences (RD, 5X and 5XT to 5A and 5AT), and Pearson correlation coefficient (R) for the periods 1999–2004, 2005–May 2008, and June 2008–2018 and for the entire time series (1999–2018). The number of quality-filtered measurements is 466, 683, and 3775 for the three periods, respectively, and 4924 for the whole dataset.
In order to examine the presence of seasonality in the retrieved ILS time series in more detail, Fig. 4 displays the averaged annual cycle of the MEA and PE parameters for the more stable IFS 120/5HR period (2009–2018). Similarly to Fig. 3, the annual cycles at an OPD of 133 cm for the set-ups 5A, 5AT, 5G, and 5GT are shown. As expected, the cell-derived MEA and PE values derived from the N2O cells exhibit no seasonality. By contrast, a noticeable annual cycle for the retrieved MEA is observed for the 5G and 5GT set-ups, although it is partially corrected by the temperature fit. The MEA seasonal range is (0.9 % with respect to the mean retrieved MEA) and (0.5 % with respect to the mean retrieved MEA) for 5G and 5GT, respectively, which are about 10 and 5 times that of the reference, (0.1 % with respect to the mean cell-derived MEA). Regarding the PE parameter, although a subtle seasonal dependence is detected in the retrieved PE values, no significant differences are observed between the ILS strategies, and no influence of temperature retrieval is found.
Consistent results were obtained for the less sophisticated ILS set-ups: the cell-derived ME and PE values are well reproduced overall for both FTIR instruments, especially for the IFS 120/5HR periods (data not shown). However, the artificial ILS seasonality for these configurations is less noticeable than for the most refined ILS set-ups (5G and 5GT), particularly when the temperature retrieval is not considered. The MEA seasonal range is limited to 0.4 % (5D and 5E) and 0.5 % (5DT and 5ET) with respect to the mean retrieved MEA for the 5E and 5ET set-ups, respectively.
In cases where gas cell measurements are not available and the independence of ILS and target gas retrievals is pursued, an alternative approach might be to retrieve the ILS information from atmospheric trace gas retrievals with well-known vertical distribution (Vigouroux et al., 2015). To assess the viability of this strategy, the ILS parameters have been also evaluated from the measured absorbing lines of very stable tropospheric and stratospheric gases, such as carbon dioxide (CO2) and hydrogen fluoride (HF), respectively. Nonetheless, as discussed in Appendix B, both strategies produce unrealistic ILS estimates and a strong artificial annual cycle in the retrieved MEA and PE values; therefore, they have been discarded in the subsequent O3 assessment. Consequently, in the absence of independent ILS measurements, the most promising approach to characterize the instrumental performance might be to apply a retrieval of the ILS parameters simultaneously to the atmospheric temperature and O3 profiles (provided the FTIR instrument is stable over time).
The differences between the ILS treatments are transferred to the O3 TCs and profiles as summarized in Table 3 and Fig. 5, respectively. The set-ups not retrieving MEA information provide the largest bias with respect to the cell-derived ILS O3 TCs (i.e. up to 0.3 % for 5B and 5C in the 2005–May 2008 period), whereas the most significant variability is observed for the most refined ILS set-ups (i.e. up to 0.7 % for 5F and 5G in the 2005–May 2008 period). As expected, the simultaneous temperature retrieval strongly affects the differences between the ILS treatments due to the cross-interference between the ILS and the O3 and temperature profiles (especially beyond the lower stratosphere, as illustrated in Fig. 5).
5.1 FTIR and Brewer ozone total columns
The quality assessment of the different ILS set-ups has been addressed by a straightforward comparison to coincident Brewer observations, acquired within a temporal window of ±5 min around the FTIR measurements. This matching criterion leads to 1958 coincidences in the 1999–2018 period. As observed in the 20-year time series of the relative differences (RD, FTIR–Brewer) for the set-ups 5A, 5AT, 5B, 5BT, 5G, and 5GT (Fig. 6), the differences between the ILS set-ups become more significant when the temperature is simultaneously estimated, corroborating the cross-interference between both retrievals. The most remarkable discrepancies occur for the IFS 120M period and between 2005 and mid-2008 for the IFS 120/5HR instrument, when the behaviour of both systems was far from ideal. In fact, when assuming the ILS to be ideal (5BT set-up) the FTIR O3 TCs seem to absorb the actual ILS temporal degradation, as documented by the consistent increasing drift observed in the RD and cell-derived MEA time series (2003–2008 period in Figs. 1 and 6b). By contrast, when the IFS 120/5HR behaves almost as an ideal instrument (2008–2018 period), no significant discrepancies were found between using the cell-derived or ideal ILS (with and without temperature retrieval). This fact further confirms the reliability of the ILS estimates from independent gas cell measurements.

Figure 6Summary of Brewer–FTIR comparison from 1999 to 2018. (a) RD time series (O3 TCFTIR–O3 TCBrewer, in %) for the set-ups 5A, 5B, and 5G. Panel (b) is the same as (a) but for the set-ups 5AT, 5BT, and 5GT. (c) Averaged annual cycles of the RD for the 2009–2018 period for the set-ups 5A, 5B, and 5E. Panel (d) is the same as (c) but for the set-ups 5AT, 5BT, and 5GT. The averaged annual cycles for the ILS strategies 5G′ and 5GT′ have also been included in (c) and (d), respectively. The solid lines in (a) and (b) correspond to the monthly median values. The legend in (c) and (d) shows the seasonal amplitude of each cycle.
Figure 6 also illustrates that although the scatter of RD is significantly improved by the temperature retrieval, these strategies present more extreme RD values, which are larger for those set-ups without fitting of the ILS. Note, for example, the correlation between the unrealistic retrieved MEA values at the beginning of 2000 and at the end of 2002 (Fig. 3e and f) and the extreme RD values only obtained for those set-ups not retrieving the ILS parameters (especially in Fig. 6b). This behaviour is likely due to the ILS retrievals absorbing the most imprecise FTIR O3 retrievals, as mentioned in Sect. 4. However, the extreme RD values may also indicate measurement days with an unusual temperature vertical stratification, which might be wrongly captured by the Brewer and FTIR products assuming a fixed temperature (and pressure) profile (García et al., 2022).
An overview of the FTIR–Brewer comparison for all ILS set-ups, distinguishing between the instruments and periods, is given in Table 4. Consistently for both instruments, when the temperature fit is not considered in the retrieval strategy, the set-ups using the cell-derived MEA values (5A and 5H) seem to offer the best agreement with respect to Brewer data (less dispersion, greater accuracy, and correlation). Nonetheless, the inclusion of the simultaneous temperature estimation enhances the performance of those strategies fitting the MEA parameter (5DT, 5ET, 5FT, and 5GT), confirming the results obtained in the theoretical quality assessment (Sect. 3.3). Note that the PE retrieval also has a minor impact on the O3 products for both FTIR instruments. Considering the IFS 120/5HR periods as reference, the combined strategies provide the most precise O3 TCs with a scatter in the RD of ∼ 0.5 %–0.6 % (5DT, 5ET, 5FT, and 5GT), while it increases up to ∼ 0.6 %–0.7 % when using the cell-derived MEA values (5AT and 5HT) and up to ∼ 0.7 %–0.8 % when the MEA is assumed to be ideal (5BT and 5CT). However, this improvement is not good enough to completely cancel out the negative cross-interference between the temperature retrieval and instrumental performance for an unstable FTIR spectrometer such as the IFS 120M. In that case, the most precise O3 TCs are obtained considering the cell-derived ILS data and without performing a simultaneous temperature fit in the O3 retrieval procedure.
Table 4Summary of statistics for the Brewer–FTIR comparison for the set-ups 5A, 5AT, 5B, 5BT, 5C, 5CT, 5D, 5DT, 5E, 5ET, 5F, 5FT, 5G, 5GT, 5H, and 5HT: median (M, in %) and standard deviation (σ, in %) of the RD (FTIR–Brewer) and Pearson correlation coefficient (R) for the periods 1999–2004, 2005–May 2008, and June 2008–2018 and for the entire time series (1999–2018). The number of coincident FTIR–Brewer measurements is 89, 169, and 1722 for the three periods, respectively, and 1980 for the whole dataset. Note that the set-ups 5G′ and 5GT′ stand for the FTIR O3 data estimated using the retrieved ILS parameters from the set-ups 5G and 5GT, respectively, but averaged on a annual basis (see details in the text). The strategies showing the best performance (smallest M and σ, and largest R) are highlighted in bold for each period.
Regarding systematic differences, the FTIR–Brewer bias ranges from 3 % to 6 %, which is compatible with errors of ∼ 3 % in the O3 infrared spectroscopy as documented by the theoretical uncertainty analysis. Such differences are consistent with previous studies (e.g. Schneider et al., 2008a; García et al., 2012) and with ultraviolet, infrared, and microwave intercomparison experiments carried out in laboratory conditions (e.g. Piquet-Varrault et al., 2005; Gratien et al., 2010; Tyuterev et al., 2019). Nonetheless, the simultaneous ILS and temperature retrievals and the instrument status also contribute to the observed offset. As shown in Table 4, the combined (ILS and temperature) approaches increase the differences with respect to Brewer data as compared to the usage of the cell-derived ILS values (consistent with that documented in Sect. 4, Table 3). Note that the reduction of the FTIR–Brewer bias between the two IFS 120/5HR periods is likely introduced by punctual interventions on the FTIR spectrometer (García et al., 2014, 2022).
The O3 concentrations are expected to be impacted by the different ILS approaches at a seasonal scale. To examine this effect, Fig. 6 also includes the averaged annual cycle of the RD for the more stable IFS 120/5HR period (2009–2018). Independently of the temperature treatment, the O3 strategies using the cell-derived MEA values show the lowest RD seasonal amplitudes. They vary from 0.62 % (5A) to 0.69 % (5AT) and from 0.57 % (5H) to 0.62 % (5HT), while for the most refined ILS set-up the annual peak-to-peak amplitude ranges from 0.74 % (5G) to 0.69 % (5GT). The latter is even larger than those observed when assuming an ideal MEA value and not considering the simultaneous temperature retrieval (0.66 % for the set-ups 5B and 5C). These results suggest that the artificial annual cycle of the retrieved ILS parameters comes along with a misinterpretation of the retrieved seasonal cycle of O3, as already pointed out by the comparison of the cell-derived and the retrieved ILS time series (Sect. 4): the simultaneous ILS fitting leads to an underestimation of the actual O3 seasonality.
In order to reduce this seasonal artefact an additional approach has been assessed, which is based on the retrieved MEA and PE parameters from the most sophisticated ILS configuration (5G and 5GT) (so-called 5G′ and 5GT′ set-ups). Firstly, the estimated ILS parameters are averaged on an annual basis in the three periods analysed independently. Following this, the annually averaged ILS values are used to compute the O3 retrievals in a second step. As shown in Table 4, this approach indeed improves the agreement with respect to Brewer data for the IFS 120/5HR instrument, when the simultaneous temperature fit is not applied and the seasonality of the retrieved ILS values is therefore more evident. At a seasonal scale, the peak-to-peak amplitude of RD is also reduced when the ILS parameters are averaged annually, from 0.74 % (5G) to 0.63 % (5G′) (Fig. 6). However, this strategy does not offer similar results if the temperature fit is also considered in the retrieval procedure. It slightly increases the dispersion in the straightforward comparison to the Brewer database (Table 4) and the seasonal amplitude of RD (from 0.69 % to 0.70 %). Finally, for the IFS 120M spectrometer this approach has not been found to improve the comparability to Brewer data due to the high variability of the retrieved ILS parameters and their remarkable temporal degradation.
5.2 FTIR and ECC ozone vertical profiles
The ILS characterization is especially critical in the retrieval of the O3 vertical distribution, as illustrated in Fig. 7. It depicts the median and standard deviation of the relative difference between the FTIR O3 profiles obtained with different ILS set-ups and coincident ECC sondes for the three periods considered. As ECC sondes usually burst between 30 and 35 km, only those sondes with information up to 29 km have been paired to the FTIR profiles within a temporal window of ± 3 h around the sonde launch (∼ 12:00 UT). These matching criteria provide 277 coincidences in the 1999–2018 period. In addition, to account for the limited FTIR vertical sensitivity, the ECC sondes were vertically smoothed using the averaging kernels obtained in the O3 retrieval procedure (García et al., 2022, and references therein). Note that although only the 5A, 5AT, 5B, 5BT, 5G, and 5GTs set-ups are depicted in Fig. 7 for simplicity, Table 5 summarizes the comparison statistics for all set-ups in the O3 layers that are sufficiently detectable well by the FTIR system, i.e. the partial column (PC) between 2.37–13, 12–23, and 22–29 km (the DOFS for all these layers is typically larger than 1) (Schneider and Hase, 2008; García et al., 2012; Vigouroux et al., 2015; García et al., 2022).
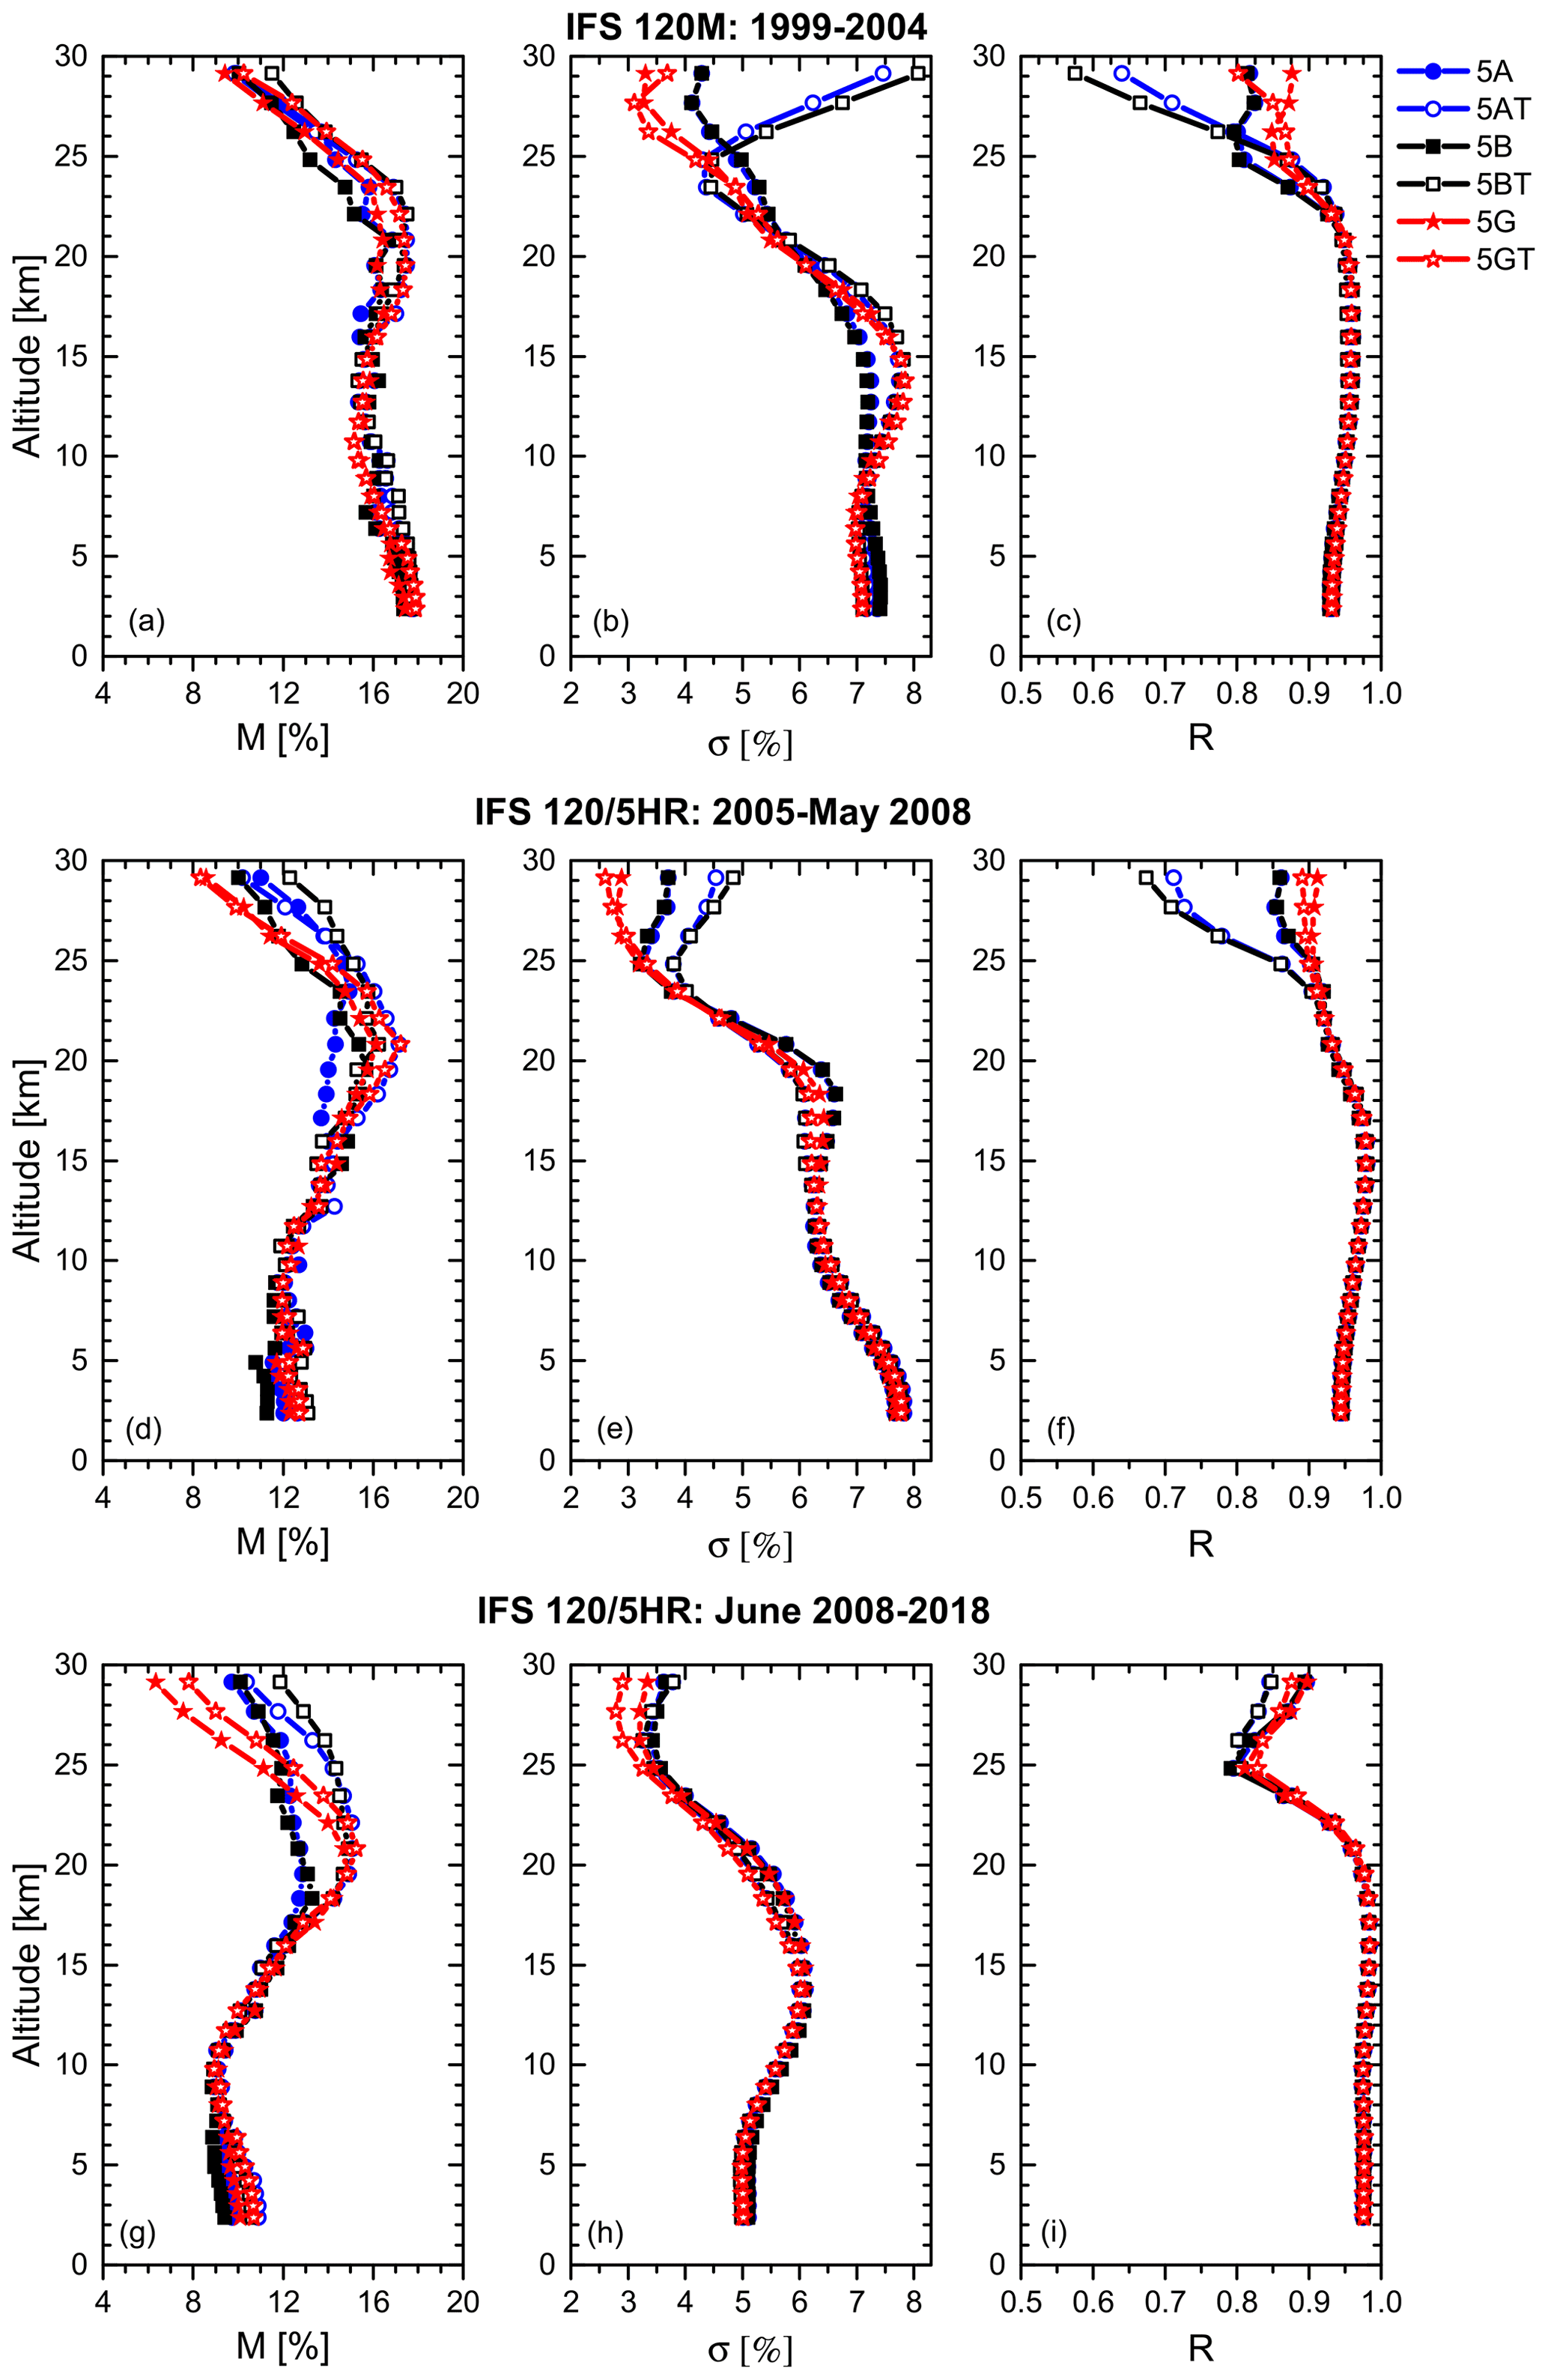
Figure 7Summary of FTIR-smoothed ECC comparison for the periods 1999–2004, 2005–May 2008, and June 2008–2018. Panels (a), (d), and (g) display the vertical profiles of the median (M) RD (FTIR-ECC, in %) for the three periods, respectively. Panels (b), (e), and (h) are the same as (a), (d), and (g) but for the standard deviation of RD distributions (σ, in %). Panels (c), (f), and (i) are the same as (a), (d), and (g) but for the Pearson correlation coefficient. The number of coincident FTIR-ECC measurements is 56, 49, and 167 for the periods 1999–2004, 2005–May 2008, and June 2008–2018, respectively.
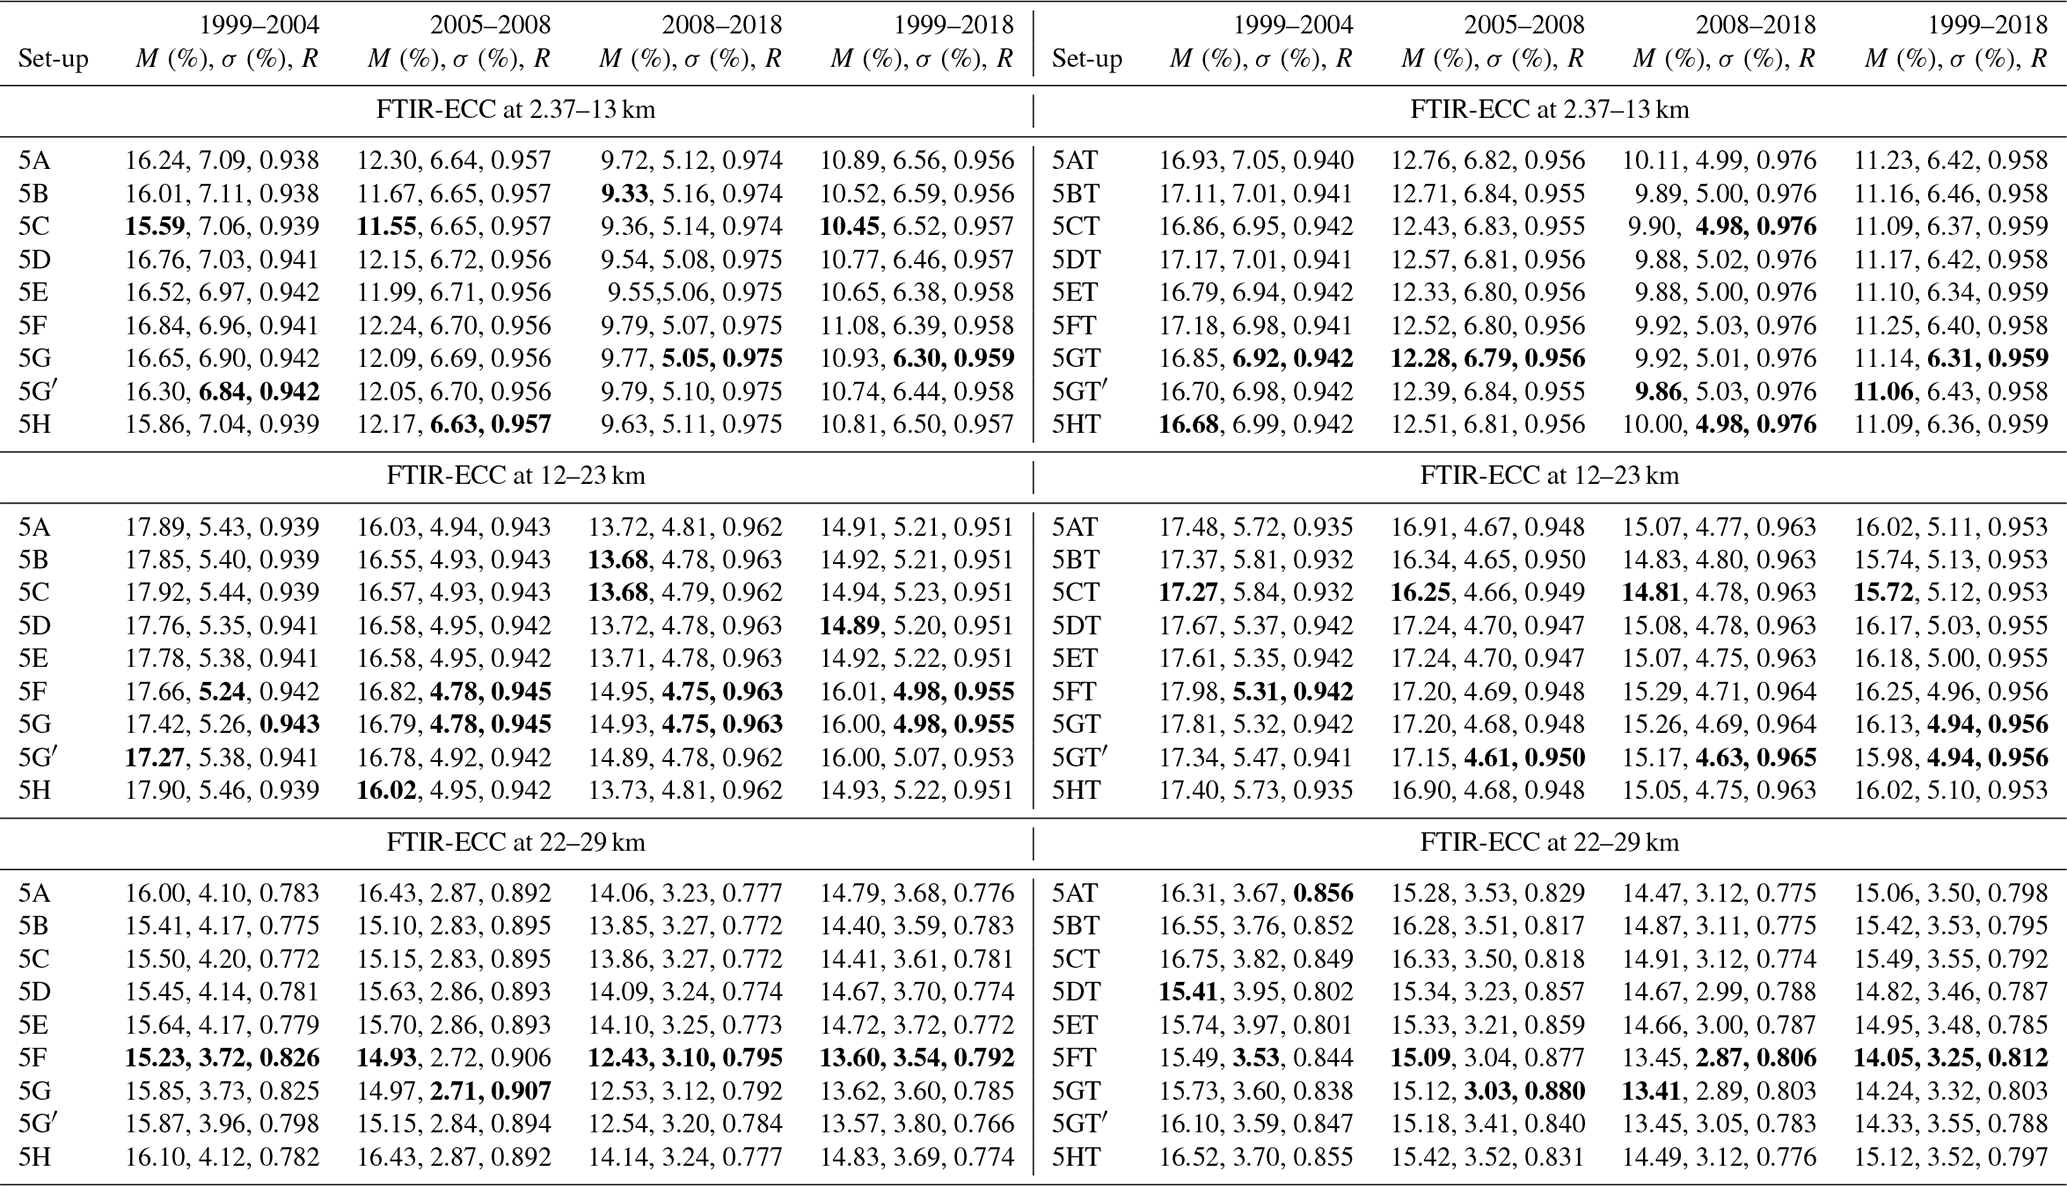
Table 5The same as Table 4 but for the FTIR-smoothed ECC comparison for the O3 partial columns computed between 2.37–13, 12–23, and 22–29 km. The number of coincident FTIR-ECC measurements is 56, 49, and 167 for the periods 1999–2004, 2005–May 2008, and June 2008–2018, respectively, and 272 for the whole dataset. The strategies showing the best performance (smallest M and σ and largest R) are highlighted in bold for each period.
The impact of the instrumental characterization exhibits a clear vertical stratification, which depends on the FTIR instrument's status. Below the UTLS region the vertical performance of the different ILS characterization approaches is quite similar for the two FTIR spectrometers (slightly superior for the most refined set-ups), with scatter values of ∼ 6 %–8 % for the IFS 120M and for the 2005–2008 period of the IFS 120/5HR instrument (∼ 6 %–8 % for the PCs at 2.37–13 and 12–23 km, Table 5). When the latter was aligned better (2008–2018 period), the dispersion between FTIR and smoothed ECC sondes is reduced by ∼ 5 %–6 % (∼3% for the PCs at 2.37–13 and 12–23 km). As expected, the effect of the temperature retrieval becomes noticeable beyond the UTLS region.
In the middle stratosphere (above ∼ 25 km), Fig. 7 illustrates that for both IFS systems the best overall agreement with respect to ECC data is reached when the ILS, including the MEA parameter, and the temperature fits are simultaneously carried out with the O3 vertical retrieval (5DT, 5ET, 5FT, and 5GT). In fact, a substantial improvement is documented for the more sophisticated ILS retrievals (5FT and 5GT) as compared to the strategy using the cell-derived MEA values (5AT and 5HT). The scatter values at 29 km range from 4.5 % (5AT and 5HT) to 2.6 % (5FT and 5GT) and from 3.8 % (5AT and 5HT) to 2.9 % (5FT and 5GT) for the 2005–May 2008 and June 2008–2018 periods, respectively. Nonetheless, if only the temperature fit is applied (5AT, 5BT, 5CT, and 5HT), the cross-interference between the temperature retrieval and the instrumental performance (ILS uncertainties and spectral measurement noise) worsens the comparability to the ECC data. This is especially critical for the IFS 120M, for which the scatter values increase from ∼ 4 % up to ∼ 7 %–8 %, while for the well-aligned IFS 120/5HR period the dispersion increases by less than 0.2 % at 29 km. Refer to Table 5 for the comparison statistics between PCs.
In relation to systematic differences, the altitude dependence of bias is found to consistently decline as the FTIR instrument gains stability and become better aligned. The IFS 120M is less sensitive to changes between the ILS set-ups and temperature treatments: bias is ∼ 15 %–18 % up to the UTLS region and drops by up to ∼ 9 %–12 % in the middle stratosphere for all configurations. Nonetheless, for the IFS 120/5HR, together with an overall reduction of the bias (especially up to the UTLS altitudes), the cross-interference between the ILS, temperature, and O3 concentrations becomes evident in the middle stratosphere. Considering the 2008–2018 period as reference (better instrumental alignment and more FTIR-ECC coincidences), above the middle stratosphere the most accurate O3 profiles are obtained with the most refined ILS set-ups with and without temperature retrieval (5F and 5FT, 5G and 5GT′) with bias ranging between ∼ 6 %–8 % (∼ 13 %–14 % for the PCs 2.37–13 and 12–23 km, Table 5). At lower altitudes, the differences between the strategies are not so significant and lie within the overall variance.
More remarkable discrepancies between the ILS approaches would be expected beyond the middle stratosphere, as suggested by the uncertainty analysis (see Fig. 2). In addition, compensations between the ILS, temperature, measurement errors, and O3 vertical distribution might occur at these altitudes to be consistent with the findings from the O3 TC comparison (e.g. the subtle improvement due to the PE fit considering the cell-derived MEA values). Unfortunately, the ECC database does not allow these effects to be examined in detail given its limited altitude coverage. Other measurement techniques, such as ground-based lidar or microwave radiometers capable of probing the O3 profile at higher altitudes, could therefore provide an added value for the O3 vertical profile analysis.
A precise instrumental characterization is indispensable to retrieve correct information from the measured solar absorption spectra by ground-based FTIR (Fourier transform infrared) spectrometers, since it directly affects the absorption line shapes of atmospheric gases. Currently, different approaches are used to deal with the FTIR instrumental response through the spectrometer's ILS (instrumental line shape) function. The most widely used options are to assume an ideal instrument, to retrieve the instrumental information simultaneously with the atmospheric gas concentrations from the measured solar absorption spectra, or to determine it from independent gas cell measurements. In this context, this paper has assessed the impact of these strategies on the quality of the FTIR ozone (O3) products (total columns and vertical profiles) using the 20-year time series of FTIR measurements acquired at the subtropical Izaña Observatory (IZO) between 1999 and 2018.
The theoretical and experimental quality assessment addressed by this work has documented how critical the treatment of the ILS function can be. Assuming an ideal ILS can provide imprecise O3 concentrations, especially when the instrument is not properly aligned, while retrieving the ILS information in the inversion procedure has proven to lead to a misinterpretation of the actual O3 variations on a daily and seasonal scale (the more sophisticated the ILS fit, the more pronounced this artefact). The optimal approach to deal with the FTIR instrumental characterization is therefore the continuous monitoring of the ILS function by means of independent data, such as the low-pressure N2O cell measurements used in this study. These measurements should be routinely taken about every 2 months for stable FTIR instruments, such as IFS 120/5HR, and even more frequently for IFS 120M spectrometers.
Nonetheless, if the simultaneous ILS retrieval is carried out due to technical necessities of the FTIR station (e.g. in absence of gas cell measurements), an atmospheric temperature profile retrieval is strongly recommended to improve the precision of the O3 retrievals and reduce the cross-interference between the atmospheric temperature and instrumental performance. However, this enhancement is only achieved provided the FTIR spectrometer is stable over time. For unstable instruments, the temperature retrieval exhibits a drastic negative impact on O3 products even though the ILS fit is simultaneously performed. In this sense, it is worth highlighting that retrieving only the ILS jointly to the O3 concentrations (without a simultaneous temperature retrieval) might worsen the precision of the FTIR O3 products, and it may be a better approach to assume an ideal ILS function.
Other tentative approaches to assess the FTIR instrumental performance from atmospheric trace gas retrievals have been also evaluated in this study (e.g. CO2 and HF). This analysis reveals that (in absence of independent ILS measurements) the most promising option is indeed the retrieval of the ILS parameters jointly with O3 concentrations (provided the ILS estimates are averaged annually to reduce seasonal effects). Nonetheless, it is important to be aware that the selection of the ILS characterization approach (and the instrumental degradation) can significantly affect the determination of the O3 vertical distributions. The impact is especially critical beyond the lower stratosphere, where most of the O3 recovery is currently taking place and instrumental artefacts might lead to imprecise observational estimates of its evolution. Given that the projected O3 trends are rather small, the use of the highest-quality O3 measurements is mandatory.
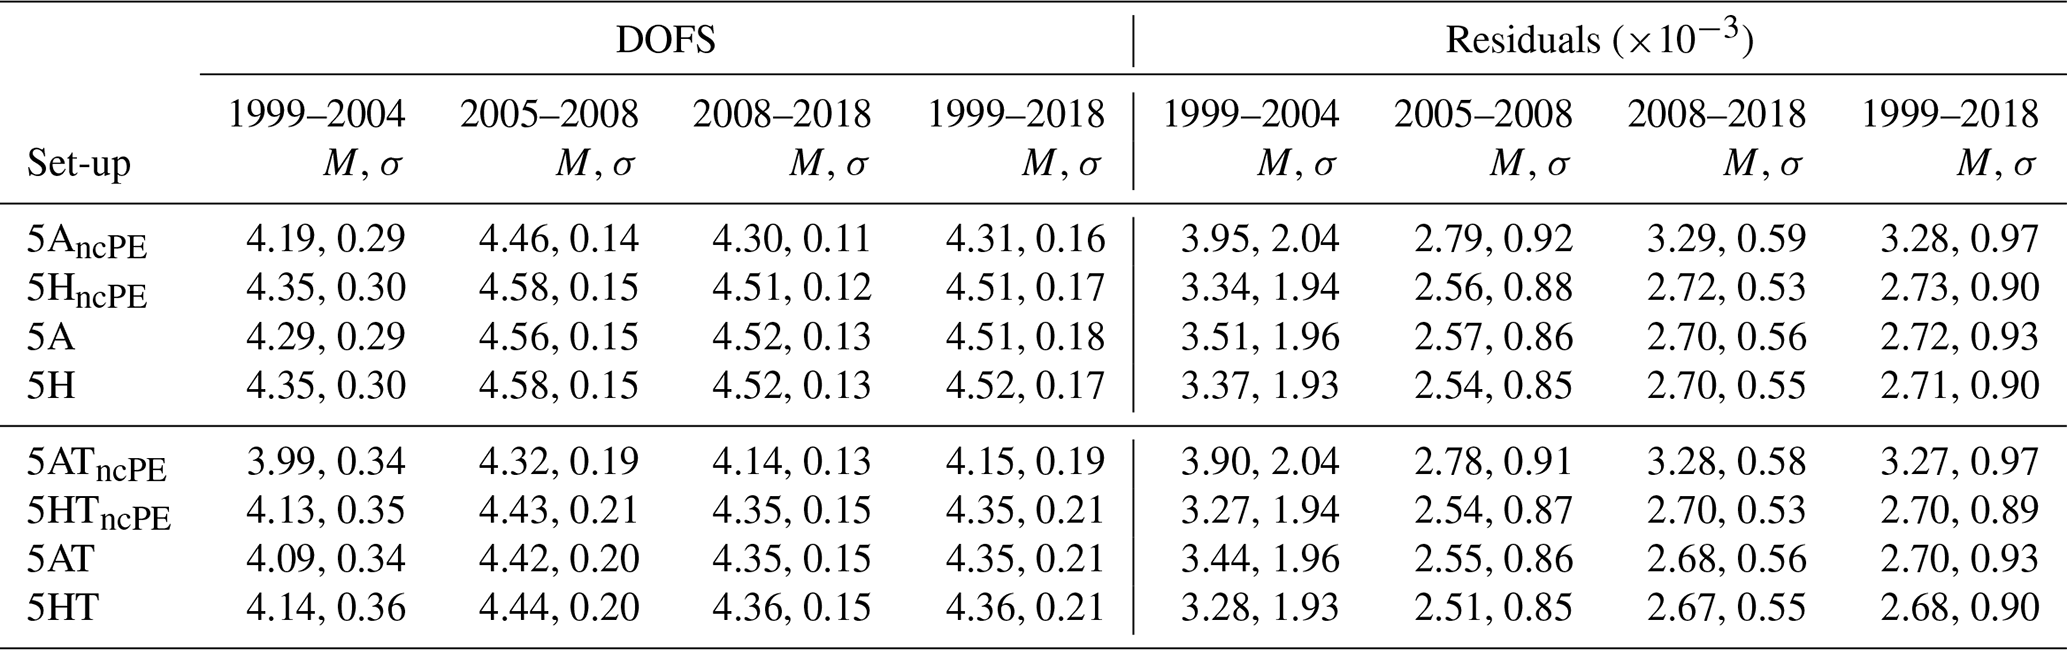
Figure A1 shows the ILS time series evaluated from the N2O cell measurements assuming a non-clamped PE retrieval (i.e. free PE) at ZPD, as described by Hase (2012). Figure A1 furthermore includes the comparison between the cell-derived PE time series at an OPD of 133 cm for the clamped and non-clamped approaches, as well as the retrieved PE values from the O3 atmospheric retrievals using the set-up 5H, which superimposes a simultaneous fit of a PE offset to the retrieved path-dependent cell-derived PE. A remarkable discrepancy between the approaches is clearly observed, especially for the IFS 120M instrument. While the clamped PE retrievals from cell and solar spectra are rather consistent, the cell-derived non-clamped retrieval provides larger and more erratic PE corrections, which are in turn reproduced by the retrieved PE values from atmospheric spectra (set-up 5H). This fact seems to point to the conclusion that N2O cell measurements may not contain enough information to allow for a precise PE retrieval at ZPD. In addition, Table A1 summarizes the comparison of the theoretical performance of the O3 retrieval strategies using both cell-derived ILS estimates in terms of the obtained DOFS and fitting residuals. The clamped ILS approach consistently offers the best performance independent of the instrument's status or period: it provides a better vertical sensitivity and a superior interpretation of the measured atmospheric spectra. These results further corroborate the idea that a clamped PE retrieval at ZPD when evaluating the N2O cell measurements is a superior choice to characterize the instrumental performance of the NDACC FTIR spectrometers.
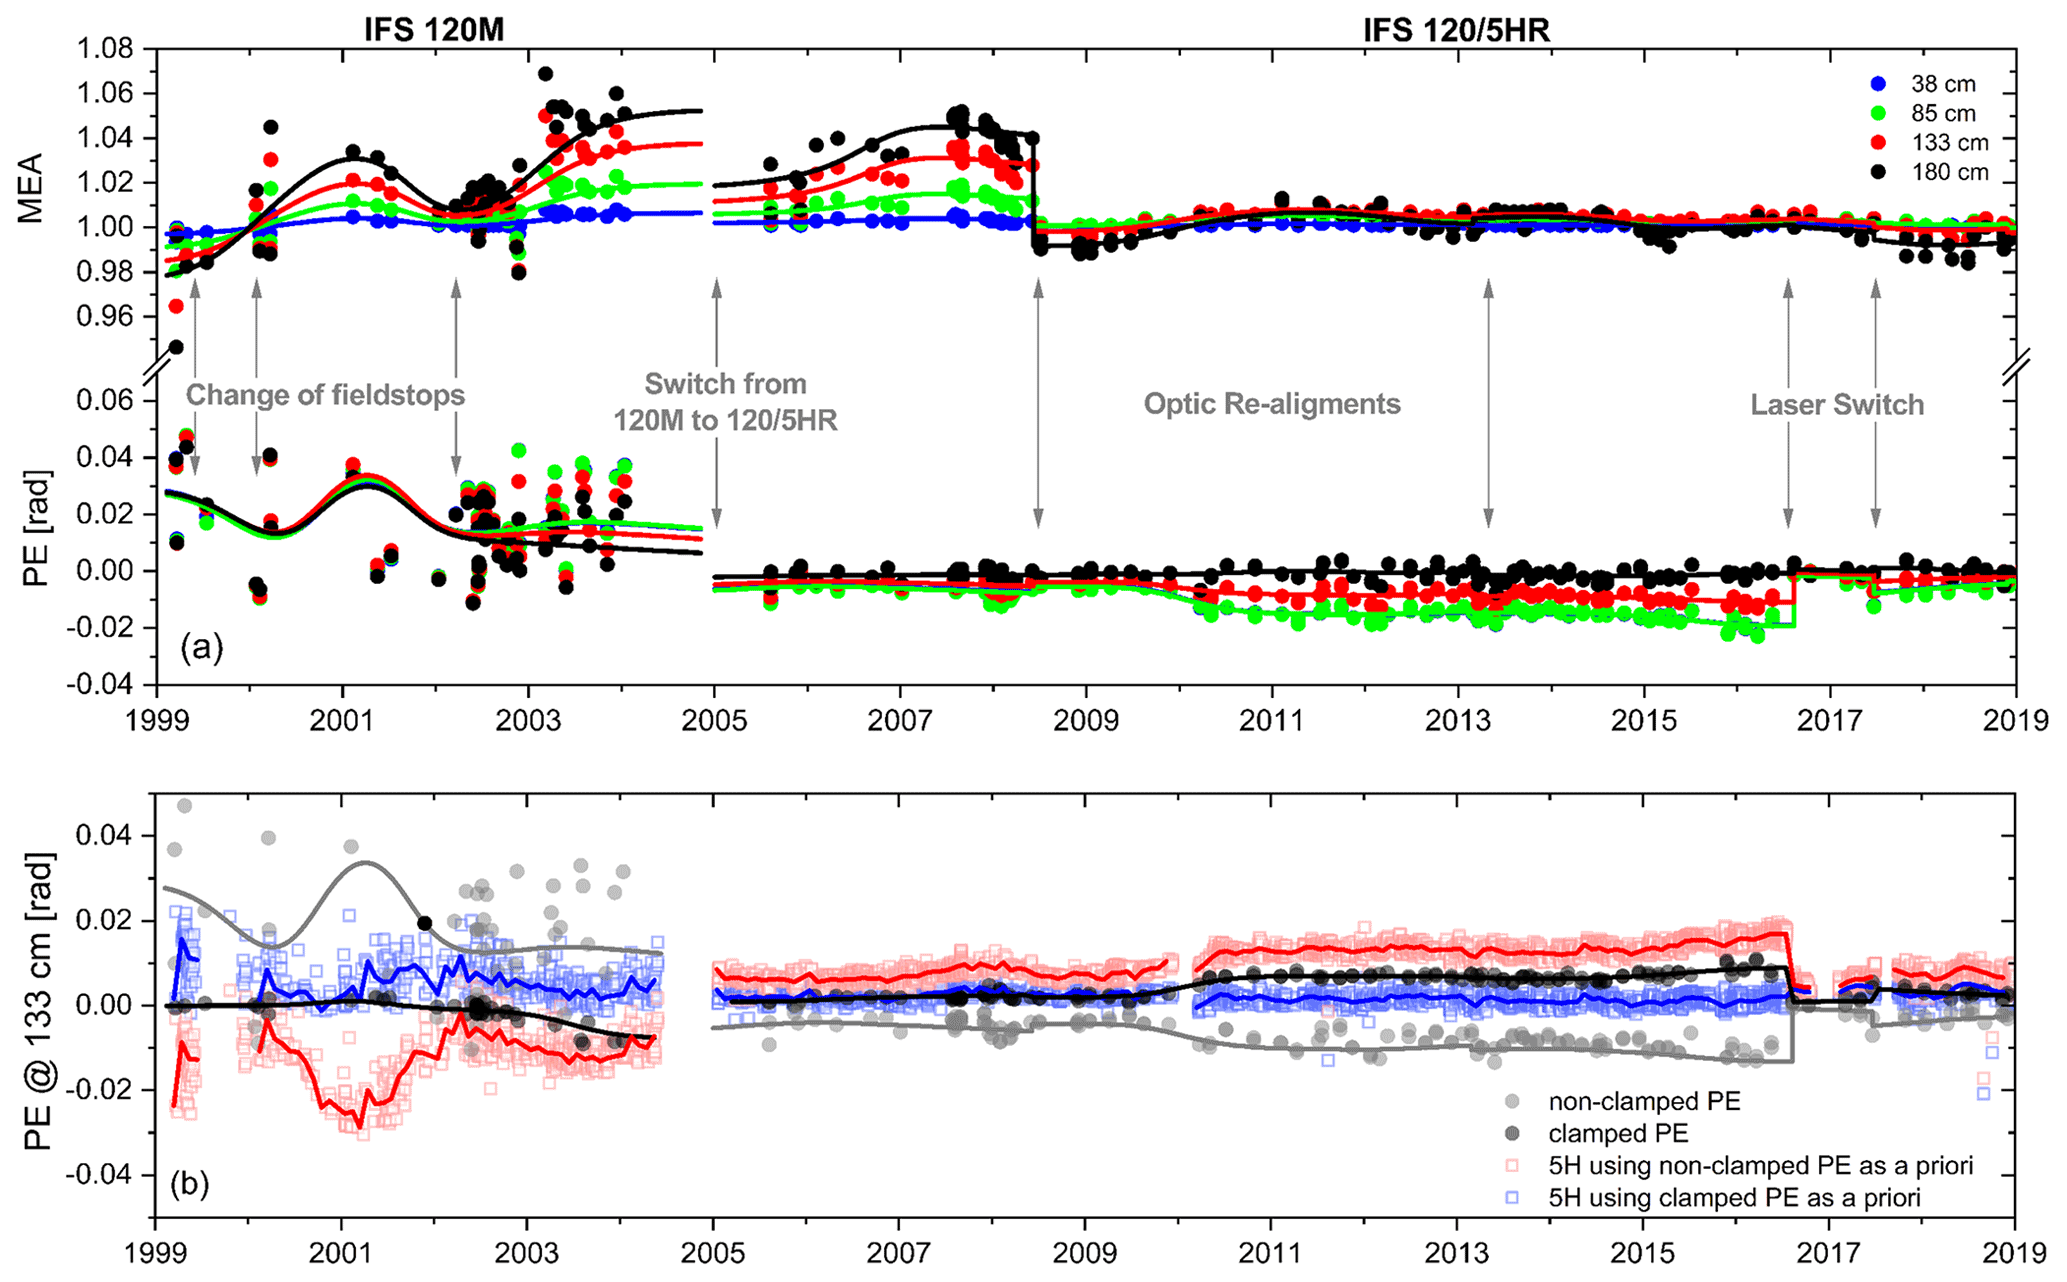
Figure A1(a) Time series of the normalized MEA and PE values at four OPDs (38, 85, 133, and 180 cm) between 1999 and 2018. Data points represent individual N2O cell measurements, and solid lines depict the smoothed MEA and PE curves. The solid grey arrows indicate punctual interventions made regarding the IZO FTIR instruments: changes in the field stop instruments between 1999 and 2004, the switch from the IFS 120M to the IFS 120/5HR in January 2005, optical re-alignments in June 2008 and February 2013, and internal laser replacements in August 2016 and June 2017. (b) Time series of the PE values at an OPD of 133 cm (including the non-clamped and clamped PE retrieval at ZPD) and the time series of the retrieved PE values from the O3 retrievals using the 5H set-up (including the non-clamped and clamped PE retrievals as a priori information). Note that the retrieved PE from the 5H set-ups is constant throughout the whole OPD range.
Table A1The same as Table 2 but for the O3 retrievals using the cell-derived ILS time series considering non-clamped PE retrievals at ZPD (Fig. A1) (so-called 5XncPE). For a better comparison, the DOFS and fitting residuals obtained with the clamped cell-derived ILS time series have also been included (5A, 5AT, 5H, and 5HT).
An alternative approach to ensure the independence of the ILS and O3 retrievals in cases where ILS measurements are not available might be to retrieve the ILS information from atmospheric trace gas retrievals with well-known vertical distribution. For this purpose, the ILS parameters have also been evaluated from the measured absorption lines of very stable tropospheric and stratospheric gases, such as CO2 and HF, respectively. For the CO2 approach, the four isolated CO2 lines between 960–970 cm−1 considered in the simultaneous temperature fit have been used, while the HF strategy retrieves the ILS parameters jointly with the HF concentrations from two micro-windows in the 4000.90–4001.05 and 4038.85–4039.08 cm−1 spectral ranges. Figure B1 displays the obtained ILS time series from the two approaches.
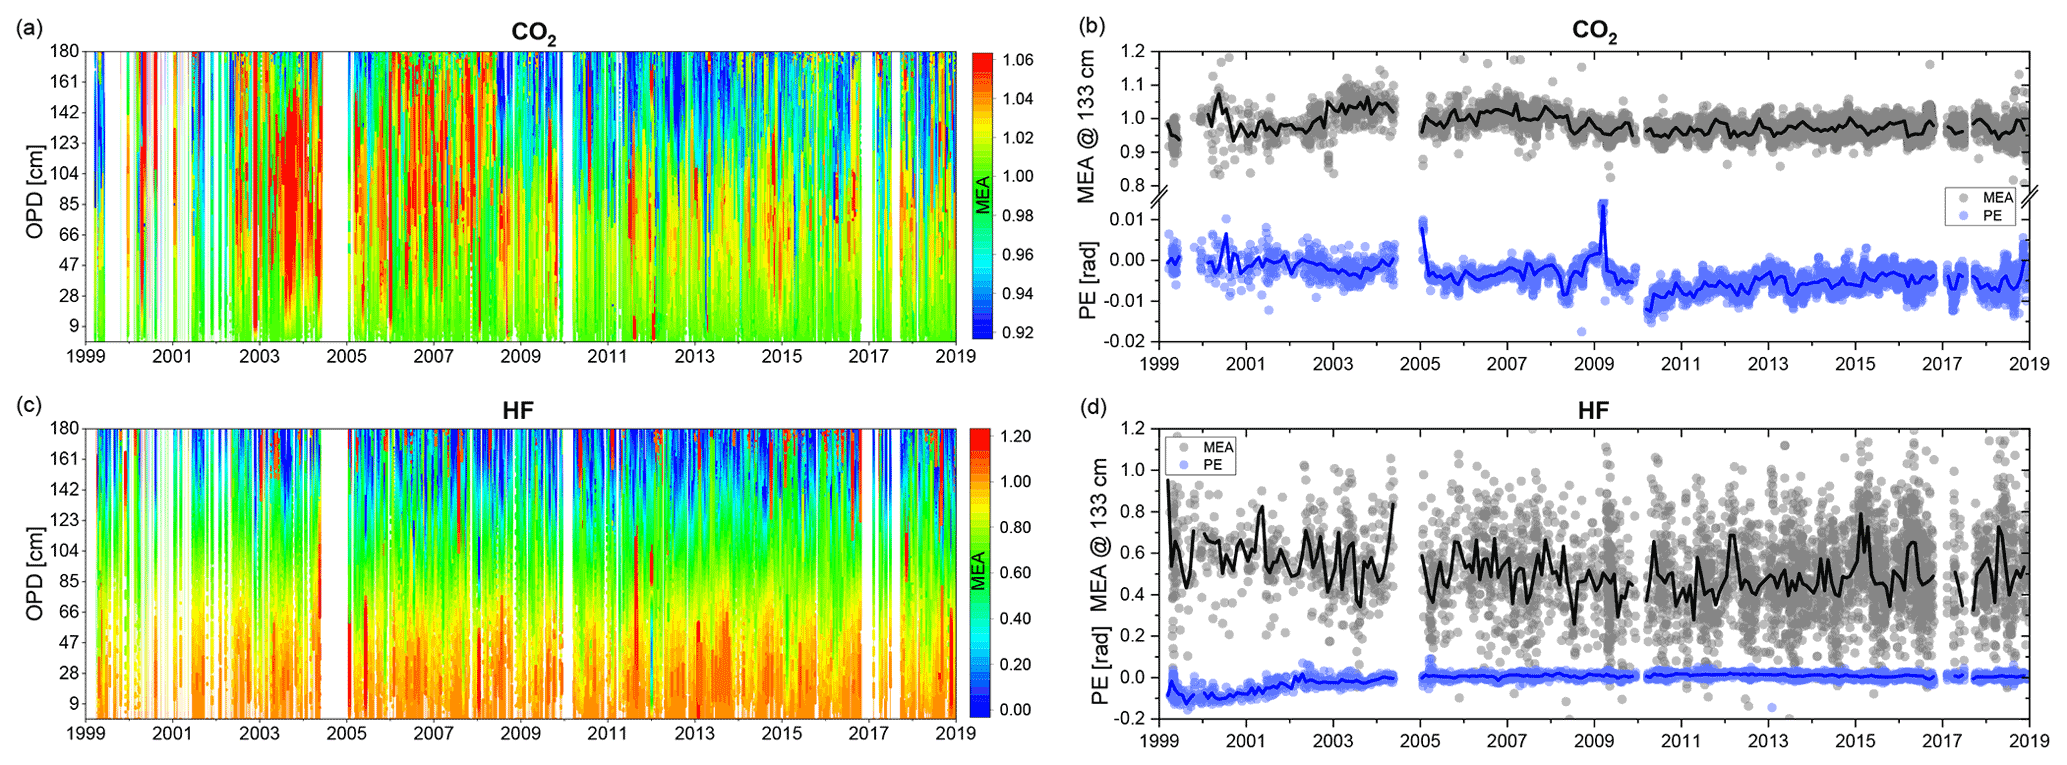
Figure B1Time series of the MEA as a function of the OPD from 1999 to 2018 evaluated from simultaneous ILS retrievals (a) from CO2 and (c) from HF absorbing lines. Panels (b) and (d) are the same as (a) and (c) but for the MEA at an OPD of 133 cm and including the phase error (PE), which is constant throughout the whole OPD range. Note that the coloured scale for the MEA is different between (a) and (c).
Both strategies are found to produce unrealistic ILS estimates (especially the HF approach) and a strong artificial annual cycle in the retrieved MEA and PE values. The tropospheric CO2 absorbing lines seem to be too broad to allow us to accurately estimate the ILS, while the HF strategy is strongly affected by the mix between the ILS signatures and dynamical signals (seasonal shift of the tropopause height and stratosphere–troposphere exchange events). In light of these results, the most promising approach to characterize the instrumental performance might be to retrieve the ILS parameters jointly with O3 concentrations in the absence of independent ILS measurements (provided the ILS estimates are averaged annually to reduce seasonal effects).
The FTIR and Brewer data are available by request to the corresponding authors, and the ozone sondes are available at the NDACC archive (http://www.ndaccdemo.org/stations/iza%C3%B1a-tenerife-spain, NDACC, 2022).
The manuscript was prepared by OEG and ES with contributions from all co-authors. FH developed the LINEFIT and PROFFIT retrieval codes. FH, MS, and TB discussed the results and participated in the retrieval analysis. OGE, MS, and ES have performed the routine FTIR measurements and regular cell measurements since 1999 and performed the maintenance and quality control of the FTIR instruments. AR, SFLL, and VC managed the Brewer spectrometers and elaborated on the ozone observations. Finally, CT and NP are in charge of the ozone sonde programme at IZO.
At least one of the (co-)authors is a member of the editorial board of Atmospheric Measurement Techniques. The peer-review process was guided by an independent editor, and the authors also have no other competing interests to declare.
Publisher's note: Copernicus Publications remains neutral with regard to jurisdictional claims in published maps and institutional affiliations.
The Izaña FTIR station has been supported by the German Bundesministerium für Wirtschaft und Energie (BMWi), the Helmholtz Association, the Karlsruhe Institute of Technology (KIT) and the State Meteorological Agency of Spain. The authors also acknowledge the support of the KIT and Izaña Observatory staff for maintaining and quality assuring all the instrumentation.
The Izaña FTIR station has been supported by the German Bundesministerium für Wirtschaft und Energie (BMWi) via the DLR under grant no. 50EE1711A and by the Helmholtz Association via the research programme ATMO. In addition, this research was funded by the European Research Council under FP7/(2007–2013)/ERC grant agreement no. 256961 (project MUSICA), by the Deutsche Forschungsgemeinschaft for the project MOTIV (Geschäftszeichen SCHN 1126/2-1), the Ministerio de Economía y Competitividad of Spain through the projects CGL2012-37505 (project NOVIA) and CGL2016-80688-P (project INMENSE), and EUMETSAT under its fellowship programme (project VALIASI).
This paper was edited by Mark Weber and reviewed by two anonymous referees.
Barret, B., de Mazière, M., and Demoulin, P.: Retrieval and characterization of ozone profiles from solar infrared spectra at the Jungfraujoch, J. Geophys. Res., 107, 4788, https://doi.org/10.1029/2001JD001298, 2002. a, b
Barthlott, S., Schneider, M., Hase, F., Wiegele, A., Christner, E., González, Y., Blumenstock, T., Dohe, S., García, O. E., Sepúlveda, E., Strong, K., Mendonca, J., Weaver, D., Palm, M., Deutscher, N. M., Warneke, T., Notholt, J., Lejeune, B., Mahieu, E., Jones, N., Griffith, D. W. T., Velazco, V. A., Smale, D., Robinson, J., Kivi, R., Heikkinen, P., and Raffalski, U.: Using XCO2 retrievals for assessing the long-term consistency of NDACC/FTIR data sets, Atmos. Meas. Tech., 8, 1555–1573, https://doi.org/10.5194/amt-8-1555-2015, 2015. a, b
Barthlott, S., Schneider, M., Hase, F., Blumenstock, T., Kiel, M., Dubravica, D., García, O. E., Sepúlveda, E., Mengistu Tsidu, G., Takele Kenea, S., Grutter, M., Plaza-Medina, E. F., Stremme, W., Strong, K., Weaver, D., Palm, M., Warneke, T., Notholt, J., Mahieu, E., Servais, C., Jones, N., Griffith, D. W. T., Smale, D., and Robinson, J.: Tropospheric water vapour isotopologue data (HO, HO, and HD16O) as obtained from NDACC/FTIR solar absorption spectra, Earth Syst. Sci. Data, 9, 15–29, https://doi.org/10.5194/essd-9-15-2017, 2017. a, b
Cuevas, E., González, Y., Rodríguez, S., Guerra, J. C., Gómez-Peláez, A. J., Alonso-Pérez, S., Bustos, J., and Milford, C.: Assessment of atmospheric processes driving ozone variations in the subtropical North Atlantic free troposphere, Atmos. Chem. Phys., 13, 1973–1998, https://doi.org/10.5194/acp-13-1973-2013, 2013. a, b
Cuevas, E., Milford, C., Bustos, J. J., R., García, O. E., García, R. D., Gómez-Peláez, A. J., Guirado-Fuentes, C., Marrero, C., Prats, N., Ramos, R., Redondas, A., Reyes, E., Rivas-Soriano, P. P., Rodríguez, S., Romero-Campos, P. M., Torres, C. J., Schneider, M., Yela, M., Belmonte, J., del Campo-Hernández, R., Almansa, F., Barreto, A., López-Solano, C., Basart, S., Terradellas, E., Werner, E., Afonso, S., Bayo, C., Berjón, A., Carreño, V., Castro, N. J., Chinea, N., Cruz, A. M., Damas, M., De Ory-Ajamil, F., García, M., Gómez-Trueba, V., Hernández, C., Hernández, Y., Hernández-Cruz, B., León-Luís, S. F., López-Fernández, R., López-Solano, J., Parra, F., Rodríguez, E., Rodríguez-Valido, M., Sálamo, C., Sanromá, E., Santana, D., Santo Tomás, F., Sepúlveda, E., and Sosa, E.: Izaña Atmospheric Research Center Activity Report 2017–2018, edited by: Cuevas, E., Milford, C., and Tarasova, O., State Meteorological Agency (AEMET), Madrid, Spain, and World Meteorological Organization (WMO), Geneva, Switzerland, WMO/GAW Report No. 247, https://library.wmo.int/index.php?lvl=notice_display&id=21651#.YvDbAXbMLGI (last access: 31 January 2022), 2019. a, b
Davis, S., Abrams, M., and Brault, J. (Eds.): Fourier Transform Spectrometry, Academic Press, Cambridge, Maryland, USA, https://doi.org/10.1016/B978-0-12-042510-5.X5000-8, 2001. a
De Mazière, M., Thompson, A. M., Kurylo, M. J., Wild, J. D., Bernhard, G., Blumenstock, T., Braathen, G. O., Hannigan, J. W., Lambert, J.-C., Leblanc, T., McGee, T. J., Nedoluha, G., Petropavlovskikh, I., Seckmeyer, G., Simon, P. C., Steinbrecht, W., and Strahan, S. E.: The Network for the Detection of Atmospheric Composition Change (NDACC): history, status and perspectives, Atmos. Chem. Phys., 18, 4935–4964, https://doi.org/10.5194/acp-18-4935-2018, 2018. a, b, c
García, O. E., Schneider, M., Redondas, A., González, Y., Hase, F., Blumenstock, T., and Sepúlveda, E.: Investigating the long-term evolution of subtropical ozone profiles applying ground-based FTIR spectrometry, Atmos. Meas. Tech., 5, 2917–2931, https://doi.org/10.5194/amt-5-2917-2012, 2012. a, b, c, d, e
García, O. E., Schneider, M., Hase, F., Blumenstock, T., Sepúlveda, E., and González, Y.: Quality assessment of ozone total column amounts as monitored by ground-based solar absorption spectrometry in the near infrared (>3000 cm−1), Atmos. Meas. Tech., 7, 3071–3084, https://doi.org/10.5194/amt-7-3071-2014, 2014. a, b
García, O. E., Sepúlveda, E., Schneider, M., Hase, F., August, T., Blumenstock, T., Kühl, S., Munro, R., Gómez-Peláez, Á. J., Hultberg, T., Redondas, A., Barthlott, S., Wiegele, A., González, Y., and Sanromá, E.: Consistency and quality assessment of the Metop-A/IASI and Metop-B/IASI operational trace gas products (O3, CO, N2O, CH4, and CO2) in the subtropical North Atlantic, Atmos. Meas. Tech., 9, 2315–2333, https://doi.org/10.5194/amt-9-2315-2016, 2016. a
García, O. E., Schneider, M., Sepúlveda, E., Hase, F., Blumenstock, T., Cuevas, E., Ramos, R., Gross, J., Barthlott, S., Röhling, A. N., Sanromá, E., González, Y., Gómez-Peláez, Á. J., Navarro-Comas, M., Puentedura, O., Yela, M., Redondas, A., Carreño, V., León-Luis, S. F., Reyes, E., García, R. D., Rivas, P. P., Romero-Campos, P. M., Torres, C., Prats, N., Hernández, M., and López, C.: Twenty years of ground-based NDACC FTIR spectrometry at Izaña Observatory – overview and long-term comparison to other techniques, Atmos. Chem. Phys., 21, 15519–15554, https://doi.org/10.5194/acp-21-15519-2021, 2021. a, b, c
García, O. E., Sanromá, E., Schneider, M., Hase, F., León-Luis, S. F., Blumenstock, T., Sepúlveda, E., Redondas, A., Carreño, V., Torres, C., and Prats, N.: Improved ozone monitoring by ground-based FTIR spectrometry, Atmos. Meas. Tech., 15, 2557–2577, https://doi.org/10.5194/amt-15-2557-2022, 2022. a, b, c, d, e, f, g, h, i, j, k, l, m, n
Gil-Ojeda, M., Navarro-Comas, M., Redondas, A., Puentedura, O., Hendrick, F., van Roozendael, M., Iglesias, J., and Cuevas, E.: Total ozone measurements from the NDACC Izaña Subtropical Station: Visible spectroscopy versus Brewer and satellite instruments, in: Quadrennial Ozone Symposium 2012 (QOS 2012), vol. ID:6064, Toronto, Canada, https://nors.aeronomie.be/ProjectDir/PDF/Poster%20Ozone%20from%20Iza%C3%B1a%20NDACC.pdf (last access: 31 January 2022), 2012. a
Gordon, I., Rothman, L., Hargreaves, R., Hashemi, R., Karlovets, E., Skinner, F., Conway, E., Hill, C., Kochanov, R., Tan, Y., Wcisło, P., Finenko, A., Nelson, K., Bernath, P., Birk, M., Boudon, V., Campargue, A., Chance, K., Coustenis, A., Drouin, B., Flaud, J., Gamache, R., Hodges, J., Jacquemart, D., Mlawer, E., Nikitin, A., Perevalov, V., Rotger, M., Tennyson, J., Toon, G., Tran, H., Tyuterev, V., Adkins, E., Baker, A., Barbe, A., Canè, E., Császár, A., Dudaryonok, A., Egorov, O., Fleisher, A., Fleurbaey, H., Foltynowicz, A., Furtenbacher, T., Harrison, J., Hartmann, J., Horneman, V., Huang, X., Karman, T., Karns, J., Kassi, S., Kleiner, I., Kofman, V., Kwabia–Tchana, F., Lavrentieva, N., Lee, T., Long, D., Lukashevskaya, A., Lyulin, O., Makhnev, V., Matt, W., Massie, S., Melosso, M., Mikhailenko, S., Mondelain, D., Müller, H., Naumenko, O., Perrin, A., Polyansky, O., Raddaoui, E., Raston, P., Reed, Z., Rey, M., Richard, C., Tóbiás, R., Sadiek, I., Schwenke, D., Starikova, E., Sung, K., Tamassia, F., Tashkun, S., Vander Auwera, J., Vasilenko, I., Vigasin, A., Villanueva, G., Vispoel, B., Wagner, G., Yachmenev, A., and Yurchenko, S.: The HITRAN2020 molecular spectroscopic database, J. Quant. Spectrosc. Ra., 277, 107949, https://doi.org/10.1016/j.jqsrt.2021.107949, 2022. a
Gratien, A., Picquet-Varrault, B., Orphal, J., Doussin, J.-F., and Flaud, J.-M.: New Laboratory Intercomparison of the Ozone Absorption Coefficients in the Mid-infrared (10 µm) and Ultraviolet (300–350 nm) Spectral Regions, J. Phys. Chem., 114, 10045–10048, https://doi.org/10.1021/jp103992f, 2010. a
Gröbner, J., Redondas, A., Weber, M., and Bais, A.: Final report of the project Traceability for atmospheric total column ozone (ENV59, ATMOZ), Tech. rep., EURAMET, https://www.euramet.org/research-innovation/search-research-projects/details/project/traceability-for-atmospheric-total-column-ozone/ (last access: 31 January 2022), 2017. a
Hase, F.: Improved instrumental line shape monitoring for the ground-based, high-resolution FTIR spectrometers of the Network for the Detection of Atmospheric Composition Change, Atmos. Meas. Tech., 5, 603–610, https://doi.org/10.5194/amt-5-603-2012, 2012. a, b, c, d, e
Hase, F., Blumenstock, T., and Paton-Walsh, C.: Analysis of the instrumental line shape of high-resolution Fourier transform IR spectrometers with gas cell measurements and new retrieval software, Appl. Optics, 38, 3417–3422, https://doi.org/10.1364/AO.38.003417, 1999. a, b, c, d, e
Hase, F., Hannigan, J., Coffey, M., Goldman, A., Hopfner, M., Jones, N., Rinsland, C., and Wood, S.: Intercomparison of retrieval codes used for the analysis of high-resolution, ground-based FTIR measurements, J. Quant. Spectrosc. Ra., 87, 25–52, https://doi.org/10.1016/j.jqsrt.2003.12.008, 2004. a, b, c
Hegglin, M. I. and Shepherd, T. G.: Large climate-induced changes in ultraviolet index and stratosphere-to-troposphere ozone flux, Nat. Geosci., 2, 687–691, https://doi.org/10.1038/ngeo604, 2009. a
IRWG: Uniform Retrieval Parameter Summary, http://www.acom.ucar.edu/irwg/IRWG_Uniform_RP_Summary-3.pdf (last access: 31 January 2022), 2014. a, b
Komhyr, W. D.: Operations handbook-Ozone measurements to 40-km altitude with model 4A electrochemical concentration cell (ECC) ozonesondes (used with 1680 MHz radiosondes), Tech. rep., National Oceanic and Atmospheric Administration Technical Memorandum ERL-ARL-149, Air Resources Laboratory, Boulder, USA, OSTI Identifier 6966940, Report Number PB-87-113874/XAB, NOAA-TM-ERL-ARL-149, https://www.osti.gov/biblio/6966940 (last access: 31 January 2022), 1986. a
León-Luis, S. F., Redondas, A., Carreño, V., López-Solano, J., Berjón, A., Hernández-Cruz, B., and Santana-Díaz, D.: Internal consistency of the Regional Brewer Calibration Centre for Europe triad during the period 2005–2016, Atmos. Meas. Tech., 11, 4059–4072, https://doi.org/10.5194/amt-11-4059-2018, 2018. a
Li, F., Stolarski, R. S., and Newman, P. A.: Stratospheric ozone in the post-CFC era, Atmos. Chem. Phys., 9, 2207–2213, https://doi.org/10.5194/acp-9-2207-2009, 2009. a
Lindenmaier, R., Batchelor, R. L., Strong, K., Fast, H., Goutail, F., Kolonjari, F., C. T. McElroy, R. L. M., and Walker, K. A.: An evaluation of infrared microwindows for ozone retrievals using the Eureka Bruker 125HR Fourier transform spectrometer, J. Quant. Spectrosc. Ra., 111, 569–585, 2010. a
Marsh, D. R., Mills, M., Kinnison, D., Lamarque, J.-F., Calvo, N., and Polvani, L.: Climate change from 1850 to 2005 simulated in CESM1 (WACCM), J. Climate, 26, 7372–7391, https://doi.org/10.1175/JCLI-D-12-00558.1, 2013. a
NDACC: Measurements at the Izaña, Tenerife, Spain Station, NDACC [data set], http://www.ndaccdemo.org/stations/iza%C3%B1a-tenerife-spain, last access: 31 January 2022. a
Piquet-Varrault, B., Orphal, J., Doussin, J. F., Carlier, P., and Flaud, J. M.: Laboratory Intercomparaison of the Ozone Absorption Coefficients in the Mid-infrared (10 µm) and Ultarviolet (300–350 nm) Spectral Regions, J. Phys. Chem., 109, 1008–1014, https://doi.org/10.1021/jp0405411, 2005. a
Redondas, A., Carreño, V., León-Luis, S. F., Hernández-Cruz, B., López-Solano, J., Rodriguez-Franco, J. J., Vilaplana, J. M., Gröbner, J., Rimmer, J., Bais, A. F., Savastiouk, V., Moreta, J. R., Boulkelia, L., Jepsen, N., Wilson, K. M., Shirotov, V., and Karppinen, T.: EUBREWNET RBCC-E Huelva 2015 Ozone Brewer Intercomparison, Atmos. Chem. Phys., 18, 9441–9455, https://doi.org/10.5194/acp-18-9441-2018, 2018. a
Rinsland, C. P., Smith, M. A. H., Rinsland, P. L., Goldman, A., Brault, J. W., and Stokes, G. M.: Ground-based infrared spectroscopic measurements of atmospheric hydrogen cyanide, J. Geophys. Res., 87, 11119–11125, https://doi.org/10.1029/JC087iC13p11119, 1982. a
Rodgers, C.: Inverse Methods for Atmospheric Sounding: Theory and Praxis, World Scientific Publishing Co., Singapore, 2000. a
Schneider, M. and Hase, F.: Technical Note: Recipe for monitoring of total ozone with a precision of around 1 DU applying mid-infrared solar absorption spectra, Atmos. Chem. Phys., 8, 63–71, https://doi.org/10.5194/acp-8-63-2008, 2008. a, b, c, d, e, f, g
Schneider, M., Blumenstock, T., Chipperfield, M. P., Hase, F., Kouker, W., Reddmann, T., Ruhnke, R., Cuevas, E., and Fischer, H.: Subtropical trace gas profiles determined by ground-based FTIR spectroscopy at Izaña (28∘ N, 16∘ W): Five-year record, error analysis, and comparison with 3-D CTMs, Atmos. Chem. Phys., 5, 153–167, https://doi.org/10.5194/acp-5-153-2005, 2005. a
Schneider, M., Redondas, A., Hase, F., Guirado, C., Blumenstock, T., and Cuevas, E.: Comparison of ground-based Brewer and FTIR total column O3 monitoring techniques, Atmos. Chem. Phys., 8, 5535–5550, https://doi.org/10.5194/acp-8-5535-2008, 2008a. a, b, c, d
Schneider, M., Hase, F., Blumenstock, T., Redondas, A., and Cuevas, E.: Quality assessment of O3 profiles measured by a state-of-the-art ground-based FTIR observing system, Atmos. Chem. Phys., 8, 5579–5588, https://doi.org/10.5194/acp-8-5579-2008, 2008b. a, b
Sepúlveda, E., Schneider, M., Hase, F., Barthlott, S., Dubravica, D., García, O. E., Gomez-Pelaez, A., González, Y., Guerra, J. C., Gisi, M., Kohlhepp, R., Dohe, S., Blumenstock, T., Strong, K., Weaver, D., Palm, M., Sadeghi, A., Deutscher, N. M., Warneke, T., Notholt, J., Jones, N., Griffith, D. W. T., Smale, D., Brailsford, G. W., Robinson, J., Meinhardt, F., Steinbacher, M., Aalto, T., and Worthy, D.: Tropospheric CH4 signals as observed by NDACC FTIR at globally distributed sites and comparison to GAW surface in situ measurements, Atmos. Meas. Tech., 7, 2337–2360, https://doi.org/10.5194/amt-7-2337-2014, 2014. a
SPC: Operator's Manual Model 6A ECC OzoneSonde, Tech. rep., Science Pump Corporation, Camden, USA, 1996. a
Steinbrecht, W., Froidevaux, L., Fuller, R., Wang, R., Anderson, J., Roth, C., Bourassa, A., Degenstein, D., Damadeo, R., Zawodny, J., Frith, S., McPeters, R., Bhartia, P., Wild, J., Long, C., Davis, S., Rosenlof, K., Sofieva, V., Walker, K., Rahpoe, N., Rozanov, A., Weber, M., Laeng, A., von Clarmann, T., Stiller, G., Kramarova, N., Godin-Beekmann, S., Leblanc, T., Querel, R., Swart, D., Boyd, I., Hocke, K., Kämpfer, N., Maillard Barras, E., Moreira, L., Nedoluha, G., Vigouroux, C., Blumenstock, T., Schneider, M., García, O., Jones, N., Mahieu, E., Smale, D., Kotkamp, M., Robinson, J., Petropavlovskikh, I., Harris, N., Hassler, B., Hubert, D., and Tummon, F.: An update on ozone profile trends for the period 2000 to 2016, Atmos. Chem. Phys., 17, 10675–10690, https://doi.org/10.5194/acp-17-10675-2017, 2017. a
Sun, Y., Palm, M., Liu, C., Hase, F., Griffith, D., Weinzierl, C., Petri, C., Wang, W., and Notholt, J.: The influence of instrumental line shape degradation on NDACC gas retrievals: total column and profile, Atmos. Meas. Tech., 11, 2879–2896, https://doi.org/10.5194/amt-11-2879-2018, 2018. a, b, c, d, e
Takele Kenea, S., Mengistu Tsidu, G., Blumenstock, T., Hase, F., von Clarmann, T., and Stiller, G. P.: Retrieval and satellite intercomparison of O3 measurements from ground-based FTIR Spectrometer at Equatorial Station: Addis Ababa, Ethiopia, Atmos. Meas. Tech., 6, 495–509, https://doi.org/10.5194/amt-6-495-2013, 2013. a
Tyuterev, V. G., Barbeb, A., Jacquemart, D., Janssen, C., Mikhailenko, S. N., and Starikova, E. N.: Ab initio predictions and laboratory validation for consistent ozone intensities in the MW, 10 and 5 µm ranges, J. Chem. Phys., 150, 184303, https://doi.org/10.1063/1.5089134, 2019. a
Vigouroux, C., De Mazière, M., Demoulin, P., Servais, C., Hase, F., Blumenstock, T., Kramer, I., Schneider, M., Mellqvist, J., Strandberg, A., Velazco, V., Notholt, J., Sussmann, R., Stremme, W., Rockmann, A., Gardiner, T., Coleman, M., and Woods, P.: Evaluation of tropospheric and stratospheric ozone trends over Western Europe from ground-based FTIR network observations, Atmos. Chem. Phys., 8, 6865–6886, https://doi.org/10.5194/acp-8-6865-2008, 2008. a, b, c, d
Vigouroux, C., Blumenstock, T., Coffey, M., Errera, Q., García, O., Jones, N. B., Hannigan, J. W., Hase, F., Liley, B., Mahieu, E., Mellqvist, J., Notholt, J., Palm, M., Persson, G., Schneider, M., Servais, C., Smale, D., Thölix, L., and De Mazière, M.: Trends of ozone total columns and vertical distribution from FTIR observations at eight NDACC stations around the globe, Atmos. Chem. Phys., 15, 2915–2933, https://doi.org/10.5194/acp-15-2915-2015, 2015. a, b, c, d, e, f, g
Vigouroux, C., Bauer Aquino, C. A., Bauwens, M., Becker, C., Blumenstock, T., De Mazière, M., García, O., Grutter, M., Guarin, C., Hannigan, J., Hase, F., Jones, N., Kivi, R., Koshelev, D., Langerock, B., Lutsch, E., Makarova, M., Metzger, J.-M., Müller, J.-F., Notholt, J., Ortega, I., Palm, M., Paton-Walsh, C., Poberovskii, A., Rettinger, M., Robinson, J., Smale, D., Stavrakou, T., Stremme, W., Strong, K., Sussmann, R., Té, Y., and Toon, G.: NDACC harmonized formaldehyde time series from 21 FTIR stations covering a wide range of column abundances, Atmos. Meas. Tech., 11, 5049–5073, https://doi.org/10.5194/amt-11-5049-2018, 2018. a
WMO (World Meteorological Organization): Quality assurance and quality control for ozonesonde measurements in GAW, Report No. 201, Tech. rep., edited by: Smit, H. G. J. and ASOPOS panel, World Meteorological Organization, Geneva, Switzerland, https://library.wmo.int/index.php?lvl=notice_display&id=19463#.YvDyZHbMLGI (last access: 31 January 2022), 2014. a
WMO (World Meteorological Organization): Scientific Assessment of Ozone Depletion: 2018, Global Ozone Research and Monitoring Project, Report No. 58, 588 pp., Geneva, Switzerland, https://library.wmo.int/index.php?lvl=notice_display&id=20763#.YvDyi3bMLGI (last access: 31 January 2022), 2018. a
Zhou, M., Wang, P., Langerock, B., Vigouroux, C., Hermans, C., Kumps, N., Wang, T., Yang, Y., Ji, D., Ran, L., Zhang, J., Xuan, Y., Chen, H., Posny, F., Duflot, V., Metzger, J.-M., and De Mazière, M.: Ground-based Fourier transform infrared (FTIR) O3 retrievals from the 3040 cm−1 spectral range at Xianghe, China, Atmos. Meas. Tech., 13, 5379–5394, https://doi.org/10.5194/amt-13-5379-2020, 2020. a
- Abstract
- Introduction
- Izaña Observatory and its ozone programme
- FTIR ILS and ozone observations
- Comparison of the cell-derived and retrieved ILS and ozone observations
- Comparison to reference observations
- Summary and conclusions
- Appendix A: Monitoring of the ILS function from N2O-cell measurements: non-clamped phase error retrieval
- Appendix B: Monitoring of the ILS function from CO2 and HF retrievals
- Data availability
- Author contributions
- Competing interests
- Disclaimer
- Acknowledgements
- Financial support
- Review statement
- References