the Creative Commons Attribution 4.0 License.
the Creative Commons Attribution 4.0 License.
 | 27 Jan 2022
A systematic re-evaluation of methods for quantification of bulk particle-phase organic nitrates using real-time aerosol mass spectrometry
Pedro Campuzano-Jost
Benjamin A. Nault
Brett B. Palm
Weiwei Hu
Hongyu Guo
Paul J. Wooldridge
Ronald C. Cohen
Kenneth S. Docherty
J. Alex Huffman
Suzane S. de Sá
Scot T. Martin
Jose L. Jimenez
Organic nitrate (RONO2) formation in the atmosphere represents a sink of NOx (NOx = NO + NO2) and termination of the (HOx = HO2 + OH) ozone formation and radical propagation cycles, can act as a NOx reservoir transporting reactive nitrogen, and contributes to secondary organic aerosol formation. While some fraction of RONO2 is thought to reside in the particle phase, particle-phase organic nitrates (pRONO2) are infrequently measured and thus poorly understood. There is an increasing prevalence of aerosol mass spectrometer (AMS) instruments, which have shown promise for determining the quantitative total organic nitrate functional group contribution to aerosols. A simple approach that relies on the relative intensities of NO+ and ions in the AMS spectrum, the calibrated ratio for NH4NO3, and the inferred ratio for pRONO2 has been proposed as a way to apportion the total nitrate signal to NH4NO3 and pRONO2. This method is increasingly being applied to field and laboratory data. However, the methods applied have been largely inconsistent and poorly characterized, and, therefore, a detailed evaluation is timely. Here, we compile an extensive survey of ratios measured for various pRONO2 compounds and mixtures from multiple AMS instruments, groups, and laboratory and field measurements. All data and analysis presented here are for use with the standard AMS vaporizer. We show that, in the absence of pRONO2 standards, the pRONO2 ratio can be estimated using a ratio referenced to the calibrated NH4NO3 ratio, a so-called “Ratio-of-Ratios” method (RoR = 2.75 ± 0.41). We systematically explore the basis for quantifying pRONO2 (and NH4NO3) with the RoR method using ground and aircraft field measurements conducted over a large range of conditions. The method is compared to another AMS method (positive matrix factorization, PMF) and other pRONO2 and related (e.g., total gas + particle RONO2) measurements, generally showing good agreement/correlation. A broad survey of ground and aircraft AMS measurements shows a pervasive trend of higher fractional contribution of pRONO2 to total nitrate with lower total nitrate concentrations, which generally corresponds to shifts from urban-influenced to rural/remote regions. Compared to ground campaigns, observations from all aircraft campaigns showed substantially lower pRONO2 contributions at midranges of total nitrate (0.01–0.1 up to 2–5 µg m−3), suggesting that the balance of effects controlling NH4NO3 and pRONO2 formation and lifetimes – such as higher humidity, lower temperatures, greater dilution, different sources, higher particle acidity, and pRONO2 hydrolysis (possibly accelerated by particle acidity) – favors lower pRONO2 contributions for those environments and altitudes sampled.
- Article
(5170 KB) - Full-text XML
-
Supplement
(23494 KB) - BibTeX
- EndNote


Organic nitrate (RONO2) formation in the atmosphere, through oxidation of VOCs (volatile organic compounds) in the presence of NOx (NOx = NO + NO2), represents a sink of NOx and termination of the catalytic NOx/HOx (HOx = OH + HO2) ozone formation and radical propagation cycles, can act as a NOx reservoir transporting (or removing) reactive nitrogen, and contributes to secondary organic aerosol formation (Zare et al., 2018 and references therein). Particle-phase organic nitrates (pRONO2) have been shown to contribute substantial mass to organic aerosol (OA) (Ng et al., 2017 and references therein), can provide insight into the chemistry controlling secondary organic aerosol (SOA) formation (e.g., Pye et al., 2015; Xu et al., 2015b; Lee et al., 2016; Ng et al., 2017), may constitute a semivolatile component of OA and dynamically partition between the gas and particle phases (e.g., Fry et al., 2013; Rollins et al., 2013; Pye et al., 2015), and represent a loss mechanism for RONO2 or reactive nitrogen oxides (e.g., via hydrolysis or deposition) (Fisher et al., 2016; Lee et al., 2016; Zare et al., 2018). However, pRONO2 has infrequently been measured in ambient air until recently and thus is still poorly understood (Ng et al., 2017).
The recent emergence of a variety of online and offline methods of both speciated and bulk pRONO2 and their applications to ambient aerosol measurements are summarized in Ng et al. (2017). Instrumentation and methods include (online bulk) aerosol mass spectrometry (using an AMS; Jayne et al., 2000) and its monitoring versions (known as aerosol chemical speciation monitors, ACSMs; Ng et al., 2011; Fröhlich et al., 2013); thermal dissociation–laser-induced fluorescence (TD-LIF; Day et al., 2002); (online speciated) filter inlet for gases and aerosols (FIGAERO)–chemical ionization mass spectrometry (CIMS) (Lopez-Hilfiker et al., 2014); (offline speciated) high-pressure liquid chromatography–mass spectrometry (HPLC/MS), often with electrospray ionization (ESI) (Surratt et al., 2006); and (offline bulk) Fourier transform infrared (FTIR) spectroscopy (Maria et al., 2002). While speciated methods can provide more detailed source or mechanistic information, they are slow, and, to date, none (online nor offline) has demonstrated quantitative measurement of the bulk of pRONO2 for ambient measurements. Therefore, bulk measurements provide useful constraints on the budgets, formation, and loss rates of gas- and aerosol-phase RONO2 in the atmosphere; and fast online methods are essential when ambient concentrations are rapidly changing, especially for aircraft sampling.
For most field applications of the AMS, typically aerosol nitrate concentrations have been reported as a single total (organic plus inorganic) concentration, due to the fact that nearly all of the signal of the nitrate functional group for any nitrate type (or nitrite) is measured at a couple of common ion peaks (NO+ and in high-resolution (HR) instruments or 30 and 46 in unit mass resolution (UMR) instruments) (Farmer et al., 2010). Early on in the application of the AMS, an implicit assumption was often made that ammonium nitrate (NH4NO3) typically dominated aerosol nitrate, based on early urban studies that showed semivolatile behavior consistent with NH4NO3 (e.g., Jimenez et al., 2003; Hogrefe et al., 2004; Zhang et al., 2004). However, a few early reports on field measurements using a UMR AMS (Allan et al., 2004, 2006) showed that the 46 to 30 ratio (hereinafter “ ratio”) was too low to be associated with only NH4NO3, suggesting substantial contributions from mineral nitrates (NaNO3, Ca(NO3)2), pRONO2, or possibly other reduced organonitrogen or organic ion interferences. In a study focusing on cluster analysis of ambient (UMR) AMS spectra, Marcolli et al. (2006) also reported ratios substantially smaller than NH4NO3 and found several spectra cluster categories with dominant 30 peaks (but not 46) and suggested that these signals may be associated with organic nitrates. Similarly, Alfarra et al. (2006) reported ratios from chamber-generated SOA (photooxidation of trimethyl benzene and α-pinene) ∼ 2–4 times lower than NH4NO3, which they attributed to pRONO2 or nitro compounds. A few years later, reports from chamber studies where pRONO2-rich SOA was generated (β-pinene or isoprene+NO3 radicals), using an HR-AMS, showed ratios (hereafter “ ratio”) ∼ 2–4 times lower than pure NH4NO3 (Fry et al., 2009; Rollins et al., 2009).
Subsequently, broader surveys of the fragmentation patterns of aerosol nitrates (and nitrites) in the AMS were reported, including consistently low ratios for pRONO2 (Bruns et al., 2010; Farmer et al., 2010). Farmer et al. (2010) evaluated the fragmentation patterns of single-component pRONO2 isolated from SOA and showed that ∼ 95 % the nitrogen-containing signal was observed as ions with the balance as and very little signal at CxHyOzN+ ions. Farmer et al. evaluated several methods for constraining pRONO2 contribution to AMS nitrate signal, including using (1) ratios, (2) ions, (3) CxHyOzN+ ions, (4) “ammonium balance”, and (5) AMS total nitrate comparison to inorganic nitrate measured with another instrument (typically ion-chromatography-based). For the urban dataset evaluated in that study, all methods appeared to be associated with relatively large uncertainties. Bruns et al. (2010) reported ratios for SOA formed from several monoterpenes and isoprene (with NO3 radicals) as well as NaNO3 and NaNO2 (with the sodium salts showing greatly reduced ratios). Other studies have used the ammonium balance (hereafter NH4_Bal) of AMS data or comparisons to other instruments to estimate pRONO2 content (Aiken et al., 2009; Zaveri et al., 2010; Docherty et al., 2011; Häkkinen et al., 2012; Xu et al., 2015a); however, in most cases, uncertainties were large or not assessed. Since the Farmer et al. study, several other laboratory studies have reported ratios for pRONO2-containing SOA, which are summarized in Sect. 3. Additionally, a number of analyses of field studies have used the ratio (or its UMR equivalent) to support qualitative or semi-quantitative statements about the presence (or low contribution) of pRONO2 (Setyan et al., 2012; Brown et al., 2013; Xu et al., 2016; Schneider et al., 2017; Bottenus et al., 2018) or to quantify pRONO2 (Fry et al., 2013, 2018; Ayres et al., 2015; Kostenidou et al., 2015; Xu et al., 2015a, 2021; Fisher et al., 2016; Kiendler-Scharr et al., 2016; Lee et al., 2016, 2019; Nault et al., 2016; Zhou et al., 2016; Zhu et al., 2016, 2021; Florou et al., 2017; Palm et al., 2017; Brito et al., 2018; de Sá et al., 2018, 2019; Reyes-Villegas et al., 2018; Schulz et al., 2018; Avery et al., 2019; Dai et al., 2019; Huang et al., 2019a, b; Yu et al., 2019; Chen et al., 2020, 2021; Lin et al., 2021). Yu et al. (2019) also used the particle size dependence of the ratio to investigate particle size and temporal (diurnal and seasonal) trends in pRONO2. Other studies have used positive matrix factorization (PMF) of AMS spectra including both the OA and signals to quantify pRONO2 (Sun et al., 2012; Hao et al., 2014; Xu et al., 2015a; Zhang et al., 2016; Kortelainen et al., 2017; Yu et al., 2019; Lin et al., 2021; Zhu et al., 2021). Recently, Xu et al. (2021) demonstrated another method, using AMS thermal denuder measurements. Thus there is promising use of AMS measurements for quantifying bulk pRONO2 functional group contribution to ambient aerosols (and in addition, providing higher quality NH4NO3 concentrations). However, the methods have not been standardized, and uncertainties of the different methods have not been well characterized and were reported to be large by at least some studies. Together with the increasing prevalence of AMS (and ACSM) field measurements, a detailed evaluation of pRONO2 quantification methods is timely.
Here we explore the application of the AMS ratio method to separate and quantify inorganic and organic nitrate and discuss the methods in detail, as well as comparison to other methods and some scientific applications. In addition to drawing from available literature whenever possible, new analyses for several field and laboratory datasets are used extensively throughout this paper to explore and support findings. Descriptions of those datasets and data processing methods can be found in Sect. S1 in the Supplement (including Fig. S1). All data, analysis, and recommendations presented here are for use with the standard AMS vaporizer; while in practice, similar methods could be applied to explore the possibility of using data from an AMS equipped with the capture vaporizer to apportion nitrate, although it would likely have higher detection limits (Hu et al., 2017a).
An equation for quantitative apportionment of the AMS nitrate signal into pRONO2 and NH4NO3 using the ratio was first presented by Farmer et al. (2010) (Eq. 1 from Farmer et al., and derived in their supporting information, here substituting different notation for some terms for consistency with this paper):
where is the fraction of total AMS nitrate (hereafter pNO3) that is pRONO2, and , , and Rambient are the ratios () for pure NH4NO3, pure pRONO2, and the ambient aerosol nitrate mixture measured, respectively. Note that here we use the ratio for all terms, while Farmer et al. and some others have used . This formulation is preferred since tends to be lower than NO+ for all nitrates, and thus using avoids ratios trending toward infinity as detection limits are approached. This usage has been applied in several publications, such as Fry et al. (2013) and Kiendler-Scharr et al. (2016), as presented in Eqs. (11) and (1) in those papers, respectively. The equation is identical regardless of the inversion of the ratio. That can be shown by simply swapping all the instances of NO and NO2 in the definitions and derivation shown in Farmer et al. or by substituting for each ratio term in Eq. (1) above, multiplying all parenthetical terms by , factoring out the same term in the numerator and denominator then canceling, and finally multiplying the first parenthetical terms in the numerator and denominator by −1. While typically is measured frequently as pure NH4NO3 is periodically sampled by the AMS as a primary calibrant for sensitivity (Canagaratna et al., 2007), regular calibration using pRONO2 is generally not practical. Moreover, it is not immediately clear that all pRONO2 produce the same in the AMS. Values reported in the literature for and both appear to have a substantial range (factor of ∼ 3), and generally is 2–4 times lower than (see Sects. 1 and 3).
Several studies have applied Eq. (1) to quantify pRONO2 and NH4NO3, using different assumptions regarding . Farmer et al. applied their measurements of from their lab study to estimate an upper limit of 50 % for the pRONO2 contribution to pNO3 for the urban SOAR campaign, substantially higher than with other methods they applied. They considered that method to be a high upper limit, due to the possible influence of non-refractory nitrates. However, we note that the used in that early study was nearly a factor of 2 different than we suggest in this study, in the direction favorable to higher pRONO2 fractions. For calculation of pRONO2 for the BEACHON-RoMBAS campaign, Fry et al. (2013) assert that and likely co-vary for an instrument and therefore define the term “Ratio-of-Ratios” (hereafter RoR = /) in order to estimate from in-field measurements and literature reports of and . The RoR value applied by Fry et al. (2013) was 2.25, based on the Farmer et al. average. On the other hand, in an analysis of pRONO2 contribution to OA throughout Europe, Kiendler-Scharr et al. (2016) applied a fixed of 0.1 based on literature reports of and the argument that it was the minimum ratio observed in the ambient datasets examined (noting that “such low ratios of were also detected in some data sets where was reported high”). Those authors state that their approach represents a lower limit of pRONO2. Similarly, Brito et al. (2018), Schulz et al. (2018), Huang et al. (2019a, b), and Avery et al. (2019), applied a fixed of 0.1 (citing Kiendler-Sharr et al., 2016) for aircraft measurements in West Africa, aircraft measurements in the Amazon, rural forest and urban sites in Germany, and seasonal variations of indoor/outdoor air, respectively. The same method has been applied to laboratory studies of biomass burning aging (Tiitta et al., 2016), composition from photooxidation of terpenes (Zhao et al., 2018; Pullinen et al., 2020), and the composition, optical properties, and aging of particles from a wide variety of biomass burning fuel sources (Cappa et al., 2020; McClure et al., 2020). However, in the latter study, the organic component is classified as “organonitrogen”, assuming it includes contributions from both organic nitrate and nitro-organic (i.e., nitroaromatics) functional groups (and assumed to have the same ratio).
In a regional and seasonal survey of pRONO2 in the SE United States, Xu et al. (2015a) used the RoR concept. They estimated lower (2.2) and upper (4.4) limits for RoR (or = 0.1–0.2 for their corresponding ) from literature reports of SOA formed from isoprene+NO3 radicals (Bruns et al., 2010) and β-pinene+NO3 radicals (Fry et al., 2009; Bruns et al., 2010; Boyd et al., 2015), respectively. The rationale for their approach is that, for their region of study, those two BVOCs may represent major contributions to the mixture of pRONO2 and that the literature suggests there may be some source/composition dependence of . For the same region, Chen et al. (2020) used bounds of (0.1–0.2), based on similar logic, however not derived from a RoR calculation (however equivalent to a RoR of 1.7–3.3). In a study of pRONO2 and SOA formation from Alberta oil sands extraction emissions from ground and aircraft measurements, Lee et al. (2019) used the same bounds of (0.1–0.2), also not derived from a RoR calculation and citing Xu et al. (2015a) and Farmer et al. (2010) (equivalent to a RoR of 1.4–2.9 and 1.5–3.0 for the two datasets). The same methods as Xu et al. (2015a) were used (applying the same range of RoR) for measurements conducted in Houston, TX (Dai et al., 2019), and the North China Plain (Xu et al., 2021). However, Xu et al. (2021) adjusted the to match the highest ratios observed, since it was substantially higher than the calibration (assuming for those periods, nitrate was purely NH4NO3). Thus, those five studies report their concentrations and inorganic–organic nitrate split accordingly and report lower and upper bounds; however, Lee et al. (2019) largely focused on results for the upper limit pRONO2 concentrations for the scientific analysis (with equivalent RoRs: ). Zhou et al. (2016), Zhu et al. (2016), and Yu et al. (2019) applied the RoR concept, citing a range of 2–4 from the literature, and thus reported estimated lower/upper limit averages for the contribution of pRONO2 to pNO3 in New York City (summer, 67 %/95 %), a background site in China (spring, 15 %/22 %), and an urban site in China (during spring, 13 %/21 %; summer, 41 %/64 %; autumn, 16 %/25 %), respectively. Similarly, Zhu et al. (2021) applied the RoR concept, citing a range of 1.4–4.0 from the literature and reporting upper (12 %) and lower (7.8 %) bounds for the contribution of pRONO2 to pNO3 at a rural site in the North China Plain during summer. Kostenidou et al. (2015), on the other hand, estimated the as the minimum Rambient observed in ambient data during the campaigns, resulting in effective RoRs of 5.6 and 12 for the two campaigns investigated. The same method is used by Reyes-Villegas et al. (2018) (using and resulting in an effective RoR of 5) and Florou et al. (2017) (resulting in high effective RoRs of 14 and 15 for the two campaigns investigated). Other field studies have followed the methods of Fry et al. (2013) (but using a few different fixed values for the RoR) using HR data (Ayres et al., 2015; Fisher et al., 2016; Lee et al., 2016; Palm et al., 2017; de Sá et al., 2018, 2019; Nault et al., 2018; Chen et al., 2021) or UMR data (Fry et al., 2018; Schulz et al., 2018).
Given the numerous applications of ratios to separate pRONO2 and NH4NO3 in AMS measurements, yet the many variations in methods and the numerical values used within each method, we have conducted a systematic survey of literature values and trends of ratios for different nitrates. Such data compilation is aimed at evaluating the evidence that supports using a fixed RoR to estimate from the calibration and to investigate the variability in produced from different sources. Figure 1 shows a compilation of RoR values for pRONO2 derived for chamber-generated SOA, isolated compounds (from chamber SOA or standards), and ambient measurements (using instrument comparisons or PMF separation). Figure 1 also shows the RoR for the same data as a histogram and average, as well as the correlations of the pRONO2 vs. NH4NO3 (inverse) ratios. Details of the values used to compute the ratios and uncertainties, data sources, and any additional calculations for the information included in Fig. 1, are provided in Table S1 in the Supplement.
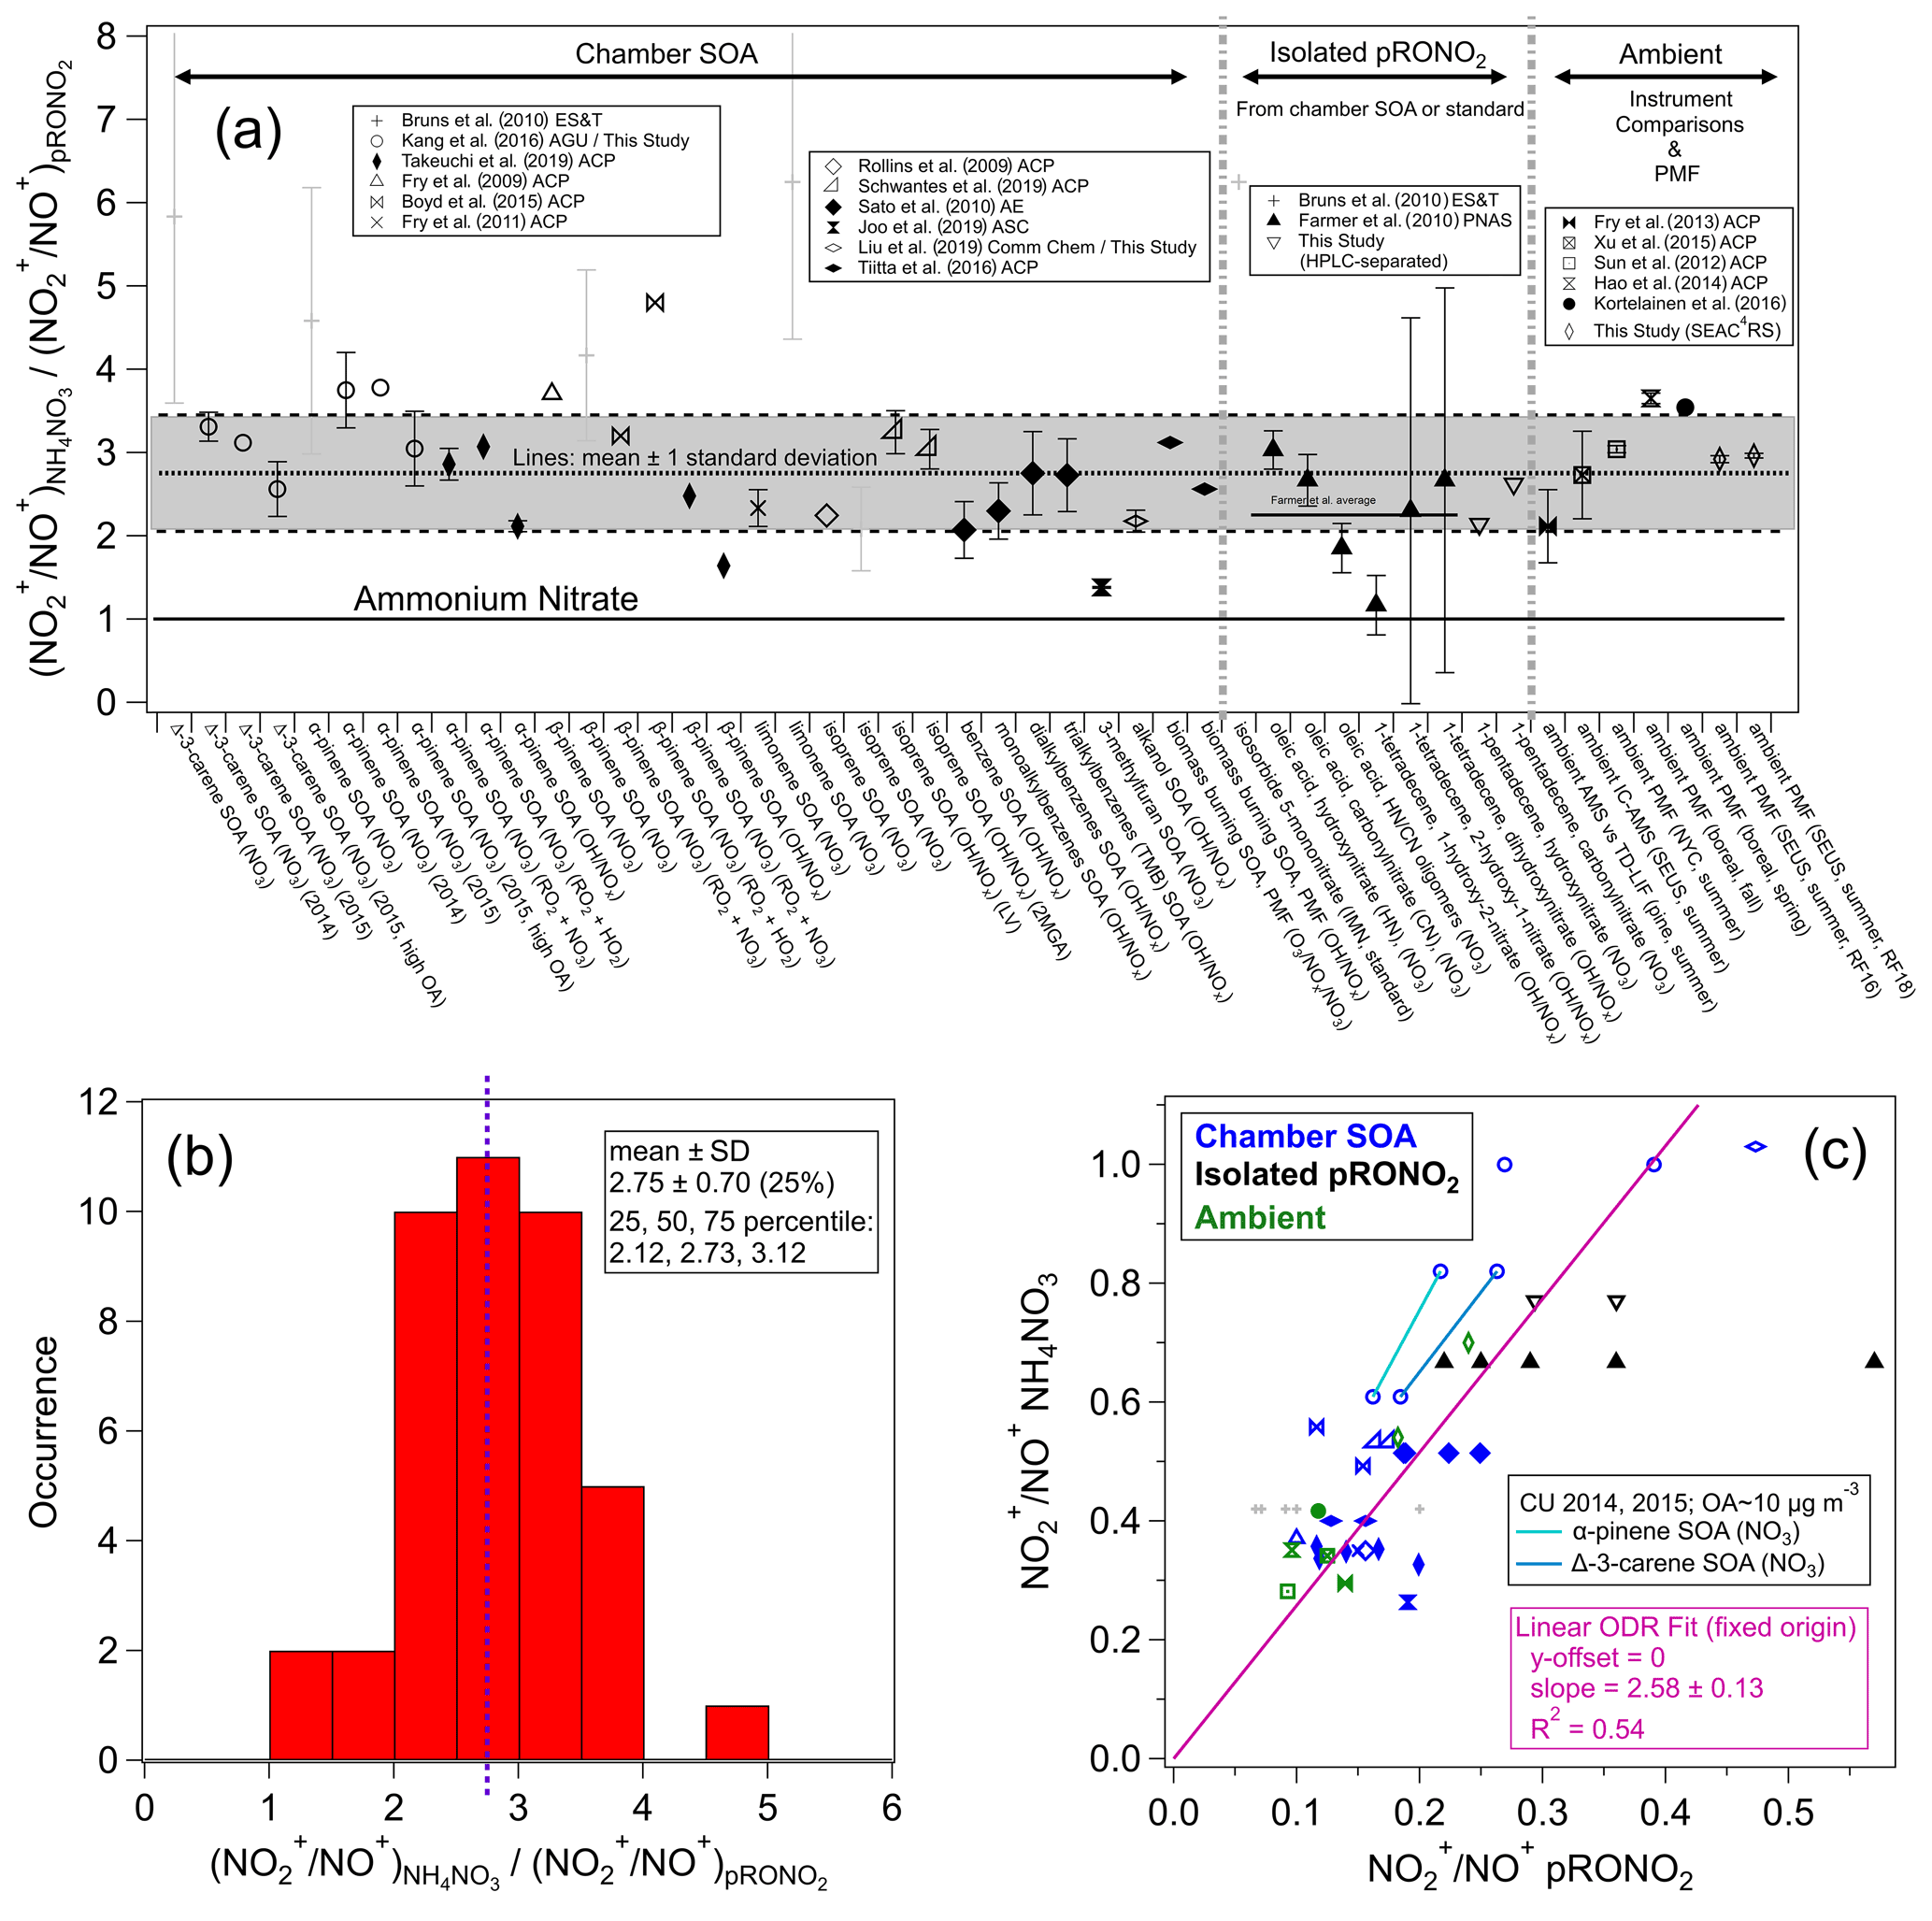
Figure 1(a) Survey of “Ratio-of-Ratios” (RoR) computed from ratios reported for chamber studies, pure organic nitrates, and field observations (using instrument comparisons or PMF separation). The mean (2.75) and standard deviation (± 0.70, ± 25 %) are also shown (standard error for n=41: ± 0.11, ± 4.0 %). The light grey shading (“+” markers) indicates data that were not used in the average here, nor in the fits below (see Table S1 for rationale). Details of the values used to compute the ratios and uncertainties, data source, and any additional calculations for the information included in Fig. 1 are provided in Table S1. (b) Histogram and statistics of RoR. (c) Scatterplot of vs. . Linear least-squares lines are shown with orthogonal distance regression (ODR) fit (with intercept constrained through the origin, since offsets from unconstrained fits were not significant and for consistency with the apportionment equation). The data connected by cyan and green lines are averages from experiments conducted in our lab with two different AMSs (with substantially different calibration ) while sampling the same type of SOA particles produced using the same two precursors mixtures. See Fig. S3 for the equivalent scatterplot, instead using ratios and swapping the axes ( vs. ).
The correlation between the and is fairly strong (R2 = 0.54), considering the variety of data sources and substantial measurement uncertainties. It provides strong evidence that, to first order, the RoR method is consistent and supported by various methods, species/mixtures, instruments, and operating conditions. The slope of the linear regression constrained to a zero intercept using an orthogonal distance regression (ODR) fit (2.66 ± 0.11; assuming both variables contribute comparable uncertainty) is equivalent to an overall RoR and is similar to the average of the individual RoR data points (mean ± standard error: 2.75 ± 0.11). Highlighted in the scatterplot in Fig. 1 are a couple of pairs of data points that are averages from several experiments conducted in our laboratory with two different AMSs during 2 different years, with substantially different measured calibration while sampling the same chamber SOA (see Sect. S1.2). The trends in those points are similar to the overall trend and provide an example of the validity of the RoR method when only differences in instrument/operating conditions are present. Figure S2 shows a complementary histogram to that in Fig. 1 for the , without normalizing to . Compared to the normalized values shown in Fig. 1 (i.e., RoRs), relative variability that is larger by a factor of 2 is apparent, with a relative standard deviation of 49 % compared to 25 %. Also of note is that the average value is 0.21 ± 0.10, twice as high as used in several literature studies. Finally, Fig. S3 shows a complementary plot to the scatterplot in Fig. 1, with the inverse ratios and axes swapped, which emphasizes different data and outliers and yields similar but slightly higher (< 10 %) RoR slopes and the same degree of correlation. While the representation in Fig. S3 uses the inverse ratio of that used throughout this paper, it places the on the x axis, and thus a non-ODR fit may be appropriate under the assumption that most uncertainty is contributed by the pRONO2 ratios. The ODR and non-ODR fits (2.83 ± 0.12, 2.66 ± 0.12, respectively) bracket the simple average value (2.75).
The compilation shown in Fig. 1 allows for consideration of dependencies of the RoR on species/mixtures or methods. Generally, the RoRs cluster around 1.5–4 for most studies. The variability within duplicated VOC–oxidant pairs (e.g., β-pinene+NO3 SOA), similar compound classes (e.g., monoterpenes, isoprene, aromatics, long-chain alkanes or alkenes), or measurement methods (SOA mixtures, isolated compounds, ambient measurements) is similar to the variability between such groupings. Therefore, given the data currently available, there does not appear to be any strong evidence to support any general chemical dependence of the pRONO2 RoR. While such a dependence may in fact exist, evaluation likely would require comparison of several organic nitrate molecules and/or mixtures systematically with the same instrumentation, operation conditions, and analysis methods, together with duplication by different instruments.
Therefore, for applications and further evaluation described in this paper, we use the average and variability of the RoR determined from data highlighted in Fig. 1: 2.75 (mean) and standard deviation (± 0.70, 25 %) or standard error (± 0.11, 4.0 %). The 25th, 50th, and 75th percentiles are 2.12, 2.73, and 3.12 (thus with an interquartile range relative to the median of −22 % to +14 %). Given the approximate symmetry for the limited statistics available, we treat the variability and uncertainty of the RoR as approximately a normal distribution. The standard deviation should be considered an upper limit of the uncertainty of the applicable RoR and corresponds to the assumption that the variability in reported values is primarily attributable to true differences in ratios for different types of pRONO2. The lack of clear differences among different sources suggests that some of the variability may instead be instrument-/operator-related and that the standard error may be a more relevant characterization of the uncertainty. Complex mixtures of pRONO2 in the atmosphere would likely represent an ensemble of those ratios and thus result in values closer to the average. In fact, for the limited (seven) examples of ambient-derived RoRs, the average is similar and the variability somewhat smaller (2.99 ± 0.51, ± 17 %) compared to the overall survey data. The standard error of the overall survey can be considered a measure of the uncertainty under the assumption that the RoR is invariable with source/type, and the for an instrument is a perfect predictor of . A separate paper will include further discussions on the RoR uncertainty and applications to estimation of the overall nitrate apportionment and concentrations uncertainties.
We recommend the use of the average RoR value computed here for future separations of pRONO2 and NH4NO3 in ambient aerosol with an AMS until there is additional information available to support a different or more complex formulation. On the other hand, where additional constraints on the expected pRONO2 ratio response may be available, a more specific value may be applied. For example, Takeuchi and Ng (2019) measured RoRs during dry chamber experiments for different SOA types where only pRONO2 nitrate was generated and then used those system-specific RoRs to separate pRONO2 and NH4NO3 during wet experiments where substantial NH4NO3 was also formed. We note that in a recent study, Xu et al. (2021) inferred a substantial variability in for ambient measurements on diurnal timescales and with varying pollution levels; however, that relied on comparison of the ratio method to a newly proposed method using thermal denuder profiles, which they acknowledge has several potentially large uncertainties or biases that were not quantified.
It is important to emphasize that under strong influence of particle-phase nitrites or semi/non-refractory nitrates (e.g., NaNO3, Ca(NO3)2), quantitative separation of nitrate types may be hindered or simply not feasible (Schroder et al., 2018). As a few studies have reported, nitrites and mineral nitrates produce substantially lower ratios (thus higher RoR) in the AMS. For example, RoRs of ∼ 10–60 for NaNO3 (Alfarra, 2004; Bruns et al., 2010; Hu et al., 2017b), 17 for Ca(NO3)2 (Alfarra, 2004), 3.9 for Mg(NO3)2 (Alfarra, 2004), 9.7 for KNO3 (Drewnick et al., 2015), and ∼ 300 for NaNO2 (Alfarra, 2004) have been previously reported. We report additional measurements from our laboratory for NaNO3, KNO3, and KNO2 showing similarly high values. Table S2 provides additional details, and Fig. S4 shows a graphical representation and comparison to pRONO2 for literature reports and our new data. Consequently, even if the expected ratios of other compounds were accurately known, apportioning the different nitrates or nitrites using a formulation like Eq. (1) would be under-constrained, as there would be more unknowns than equations. Therefore, care must be taken to screen for measurements that may be substantially influenced by such interferences (e.g., sea salt, dust). Additionally, during a recent aircraft campaign focused on biomass burning, we conducted regular calibrations with 4-nitrocatechol, a nitroaromatic (Pagonis et al., 2021). The RoR was relatively similar to pRONO2 at 3.78 ± 0.15 (1σ standard deviation) (Table S2, Figs. S4 and S5).
A survey of ratios for multiple field studies is explored here in order to assess the framework of using measured calibration and a RoR to apportion NH4NO3 and pRONO2 concentrations. See Sect. S1.1 and Table S3 for details and a summary of all field campaigns for which data are used within this paper. Figure 2 shows frequency distributions of Rambient for ambient aerosol from two aircraft-based remote continental (SEAC4RS, DC3) and two ground-based forest campaigns (SOAS, BEACHON-RoMBAS). The data are shown as the calibration divided by Rambient, so that all data are comparable. For all campaigns, the large majority of the data fall between the (1 on Fig. 2, indicating all NH4NO3) and the RoR-determined (2.75 on Fig. 2, indicating all pRONO2). The small fraction of data outside that range may be due to a combination of instrument noise, drifts in the instrument ratio response not captured by periodic calibrations, and/or the inability of the fixed RoR to perfectly capture the response. However, these results show that under a large range of chemical conditions and instrument (spanning a factor of 2.4 for these campaign averages), the data are generally consistent with the RoR apportionment model. Figure S6 shows the same distributions as Fig. 2, except as simple frequency distributions, rather than weighted by mass concentration as in Fig. 2. The broadening and shift to the right for simple frequency distributions (compared to those weighted by mass concentration) reflect the typical trend that pRONO2 tends to constitute higher fractions of pNO3 when pNO3 is lower. Distributions are similar for other campaigns (not shown in Figs. 2 and S6), as can be inferred from Figs. 5 and S9.

Figure 2Histograms of ambient ratios for aircraft and ground-based campaigns. The data are shown as the calibration divided by Rambient, so that all data are on the same reference coordinates. The histograms are weighted by pNO3 concentration. Cumulative distributions are shown in all plots, and an additional curve only in the SOAS panel shows the () for these coordinates (would be identical in all panels). The data used were 1 min averages and screened for pNO3 detection limits for the aircraft campaigns (SEAC4RS, DC3) and 1 h averages for the ground-based campaign (SOAS, BEACHON-RoMBAS). Measured values for these studies were as follows: SEAC4RS (range 0.40–1.49, mean and SD 0.80 ± 0.31), DC3 (0.71 ± 0.04), SOAS (0.44 ± 0.02), and BEACHON-RoMBAS (0.295 ± 0.005). See Fig. S6 for equivalent plots where distributions are not weighted by mass concentration.
The effects of estimating using time-variant vs. constant is explored in Fig. S7. For the SEAC4RS campaign, the flight-to-flight calibration was highly variable due to some instrument instability (range: 0.40–1.49, mean ± SD: 0.80 ± 0.31; Figs. S8 and S9e), compared to the very stable ratios measured during the other campaigns (see Fig. 2 caption). Therefore, two histograms are shown overlaid in Fig. S7, one normalized to flight-dependent calibration and the other normalized to the campaign-averaged . For the standard frequency distributions (Fig. S7a), there is substantial narrowing when using the flight-dependent ratios, indicating that application of the time-variant ratios provides better constraints on the instrument response to the NH4NO3–pRONO2 mixture. Conversely, normalizing to arbitrary would be expected to broaden the distribution. The most prominent differences for the mass concentration-weighted distributions (Fig. S7b) are largely due to data with high NH4NO3 concentrations where the measured Rambient values were beyond the campaign-averaged (resulting in a substantial fraction of the distribution < 1). There is also subtle broadening toward the pRONO2 portion of the distribution. These comparisons support that using the variable calibration better represents ambient NH4NO3 ratios (left side of plots), and tying to (i.e., using the RoR method, rather than fixed ) better represents pRONO2 ratios (right side of plot).
Additional support for the practice of using the measured calibration and anchoring the to those calibrations with a fixed RoR can be drawn from the Rambient vs. pNO3 plots shown in Fig. S9a and b. Five studies shown in those figures had relatively constant (within each campaign), but differing (among campaigns; factor of 3.2 range), calibration (SOAR, MILAGRO, SOAS, BEACHON-RoMBAS, KORUS-AQ; 0.47, 0.84, 0.44, 0.30, 0.97, respectively). However, as pNO3 increases for the urban-influenced studies (SOAR, MILAGRO, SOAS, KORUS-AQ) or for the oxidation flow reactor (OFR) measurements during SOAS (Fig. S9c), Rambient tends to approximately converge at the calibration . This suggests that NH4NO3 in mixed ambient aerosol is well represented by offline calibrations for a range of conditions and instruments. Additionally, the corresponding average ratios at the lowest pNO3 concentration (same five studies in Fig. S9a and b) converge at a similar range of ratios (0.26, 0.52, 0.15, 0.10, 0.40, respectively; range of 4.0). If assuming that the low-pNO3 observed Rambient values approximate pure pRONO2 ratios, a relatively narrower range is computed for an inferred RoR (1.6–3.0, factor of 1.9; 2.36 ± 0.63), which is also similar to expected RoRs (albeit low possibly due to urban ground studies never sampling pure pRONO2).
Further evidence supporting the use of calibration and the RoR using ambient data is presented in Sect. S2 using campaign datasets where the calibration showed large variability (DAURE, SEAC4RS campaigns). Exploration of the ratios vs. pNO3 relationships showed similar relationships to those discussed above for campaigns where was constant or changed little but with the curves shifting with the measured . Similar values of RoR to those presented in the literature survey in Sect. 3 were also inferred from the SEAC4RS dataset. Finally, both datasets were used to evaluate biases when using a fixed value of vs. estimation of a dynamic value using the RoR method. Additional evidence from ambient measurements supporting use of calibration and the RoR is presented in Sect. 5.2 where applications of PMF separation are discussed.
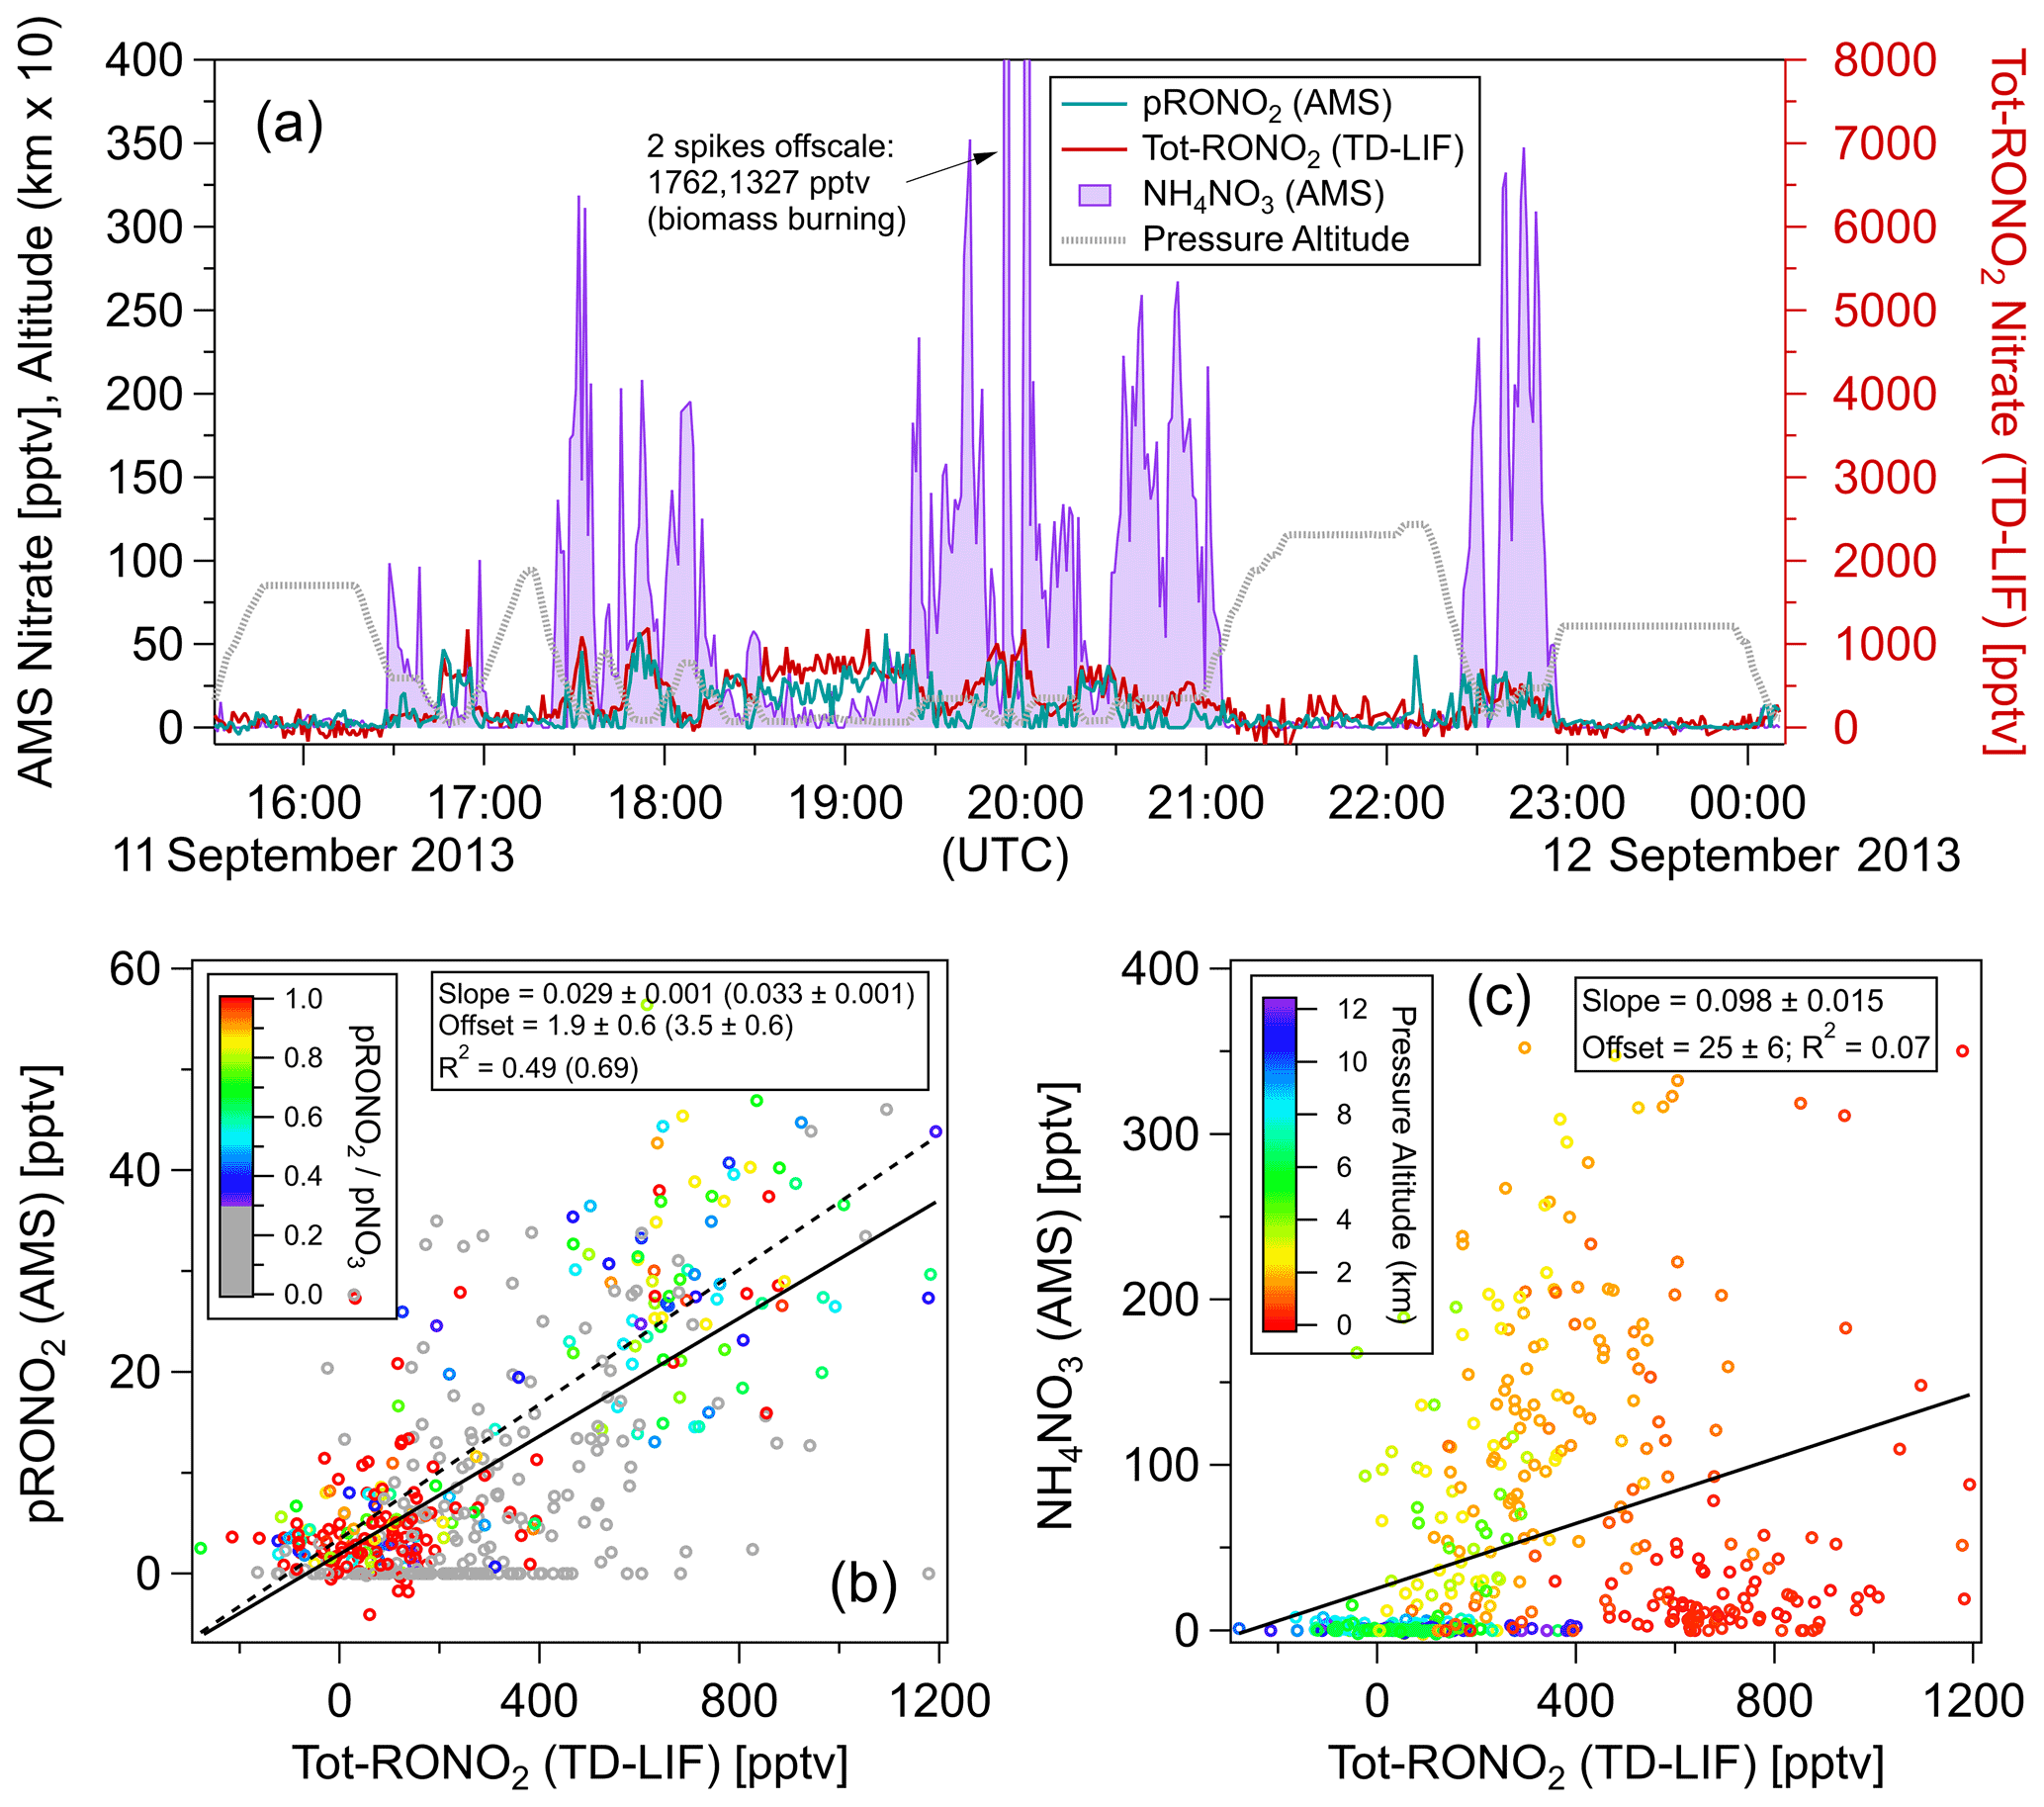
Figure 3Comparisons of AMS pRONO2 and NH4NO3 with TD-LIF total (gas + particles) organic nitrate (Tot-RONO2) during a SEAC4RS flight (RF16) in the Southeast United States (1 min averages). The time series (a) and scatterplots of pRONO2 (b) or NH4NO3 (c) vs. Tot-RONO2 are shown. Measured calibration (consistent with PMF results in Sect. 5.2.2), a RoR of 2.75, and Eq. (1) were used to apportion the AMS nitrate. Linear least-squares lines are orthogonal distance regression (ODR). For the pRONO2 vs. Tot-RONO2 plot (b), an additional line (dotted) and fits (parentheses) are shown for data including only when () is greater than 0.3 (and data points with < 0.3 are greyed). Figure S10 shows the flight track and timing of different source types sampled.
5.1 pRONO2–NH4NO3 separation compared to total (gas + particle) RONO2 (Tot-RONO2)
Figure 3 shows time series of AMS pRONO2 and NH4NO3 concentrations for a SEAC4RS flight (RF16) in the Southeast United States. The nitrate components were apportioned according to Eq. (1) and a RoR of 2.75. “Total RONO2” (gas + particle; hereafter Tot-RONO2) concentrations, as measured by thermal dissociation–laser-induced fluorescence (TD-LIF) (Day et al., 2002; Perring et al., 2009), are shown for comparison. A wide range of sources were sampled, including (and indicated by) biogenic (monoterpenes and/or isoprene and photochemical products such as IEPOX, MVK), anthropogenic (e.g., NOx, NOy, aromatics), biomass burning (e.g., acetonitrile and f60, an AMS tracer, Cubison et al., 2011), and likely agricultural, as well as mixtures of these sources or relatively clean free tropospheric air. Flight tracks are shown in Fig. S10, and approximate periods and corresponding source influences are listed in the caption. A large and variable range of pNO3 was observed (< 10 ng m−3 or < 4 ppt up to ∼ 5 µg m−3 or ∼ 1800 ppt) and ranging from pRONO2-dominated to NH4NO3-dominated. The pRONO2 and Tot-RONO2 tracked remarkably closely. NH4NO3 concentrations exhibited more plume-like behavior, rapidly increasing and decreasing, often while both pRONO2 and Tot-RONO2 remained relatively constant or in some cases showed moderate and similar increases. Overall, pRONO2 was correlated with Tot-RONO2 (R2 = 0.49 for all data, R2 = 0.69 for data with > 0.3) with a regression slope of 0.029 (0.033), indicating that on average ∼ 3 % of RONO2 was in the particle phase (Fig. 3b). NH4NO3 showed little overall relationship to Tot-RONO2 beyond the trend that at higher altitudes, well above the boundary layer and outside of plumes, both concentrations tended to be low (Fig. 3a and c). Note that the reference in the particle nitrate apportionment here (in Eq. 1) was 0.70, which was based on the measured calibration and PMF results (see Sect. 5.2 just below). Measured values during calibrations in days bracketing this flight were 0.96 (2 d before) and 0.71 (1 d after). PMF results support a value of 0.70 (see Sect. 5.2.2), which was used here since it was similar to the nearest calibrations and provides an additional constraint on the otherwise variable calibration characteristic of this campaign (see Sect. 4). Using a higher increases the pRONO2 vs. Tot-RONO2 slope in Fig. 4 (bottom left) and can improve the correlation a bit (mainly by moving the low values at low toward the regression line).
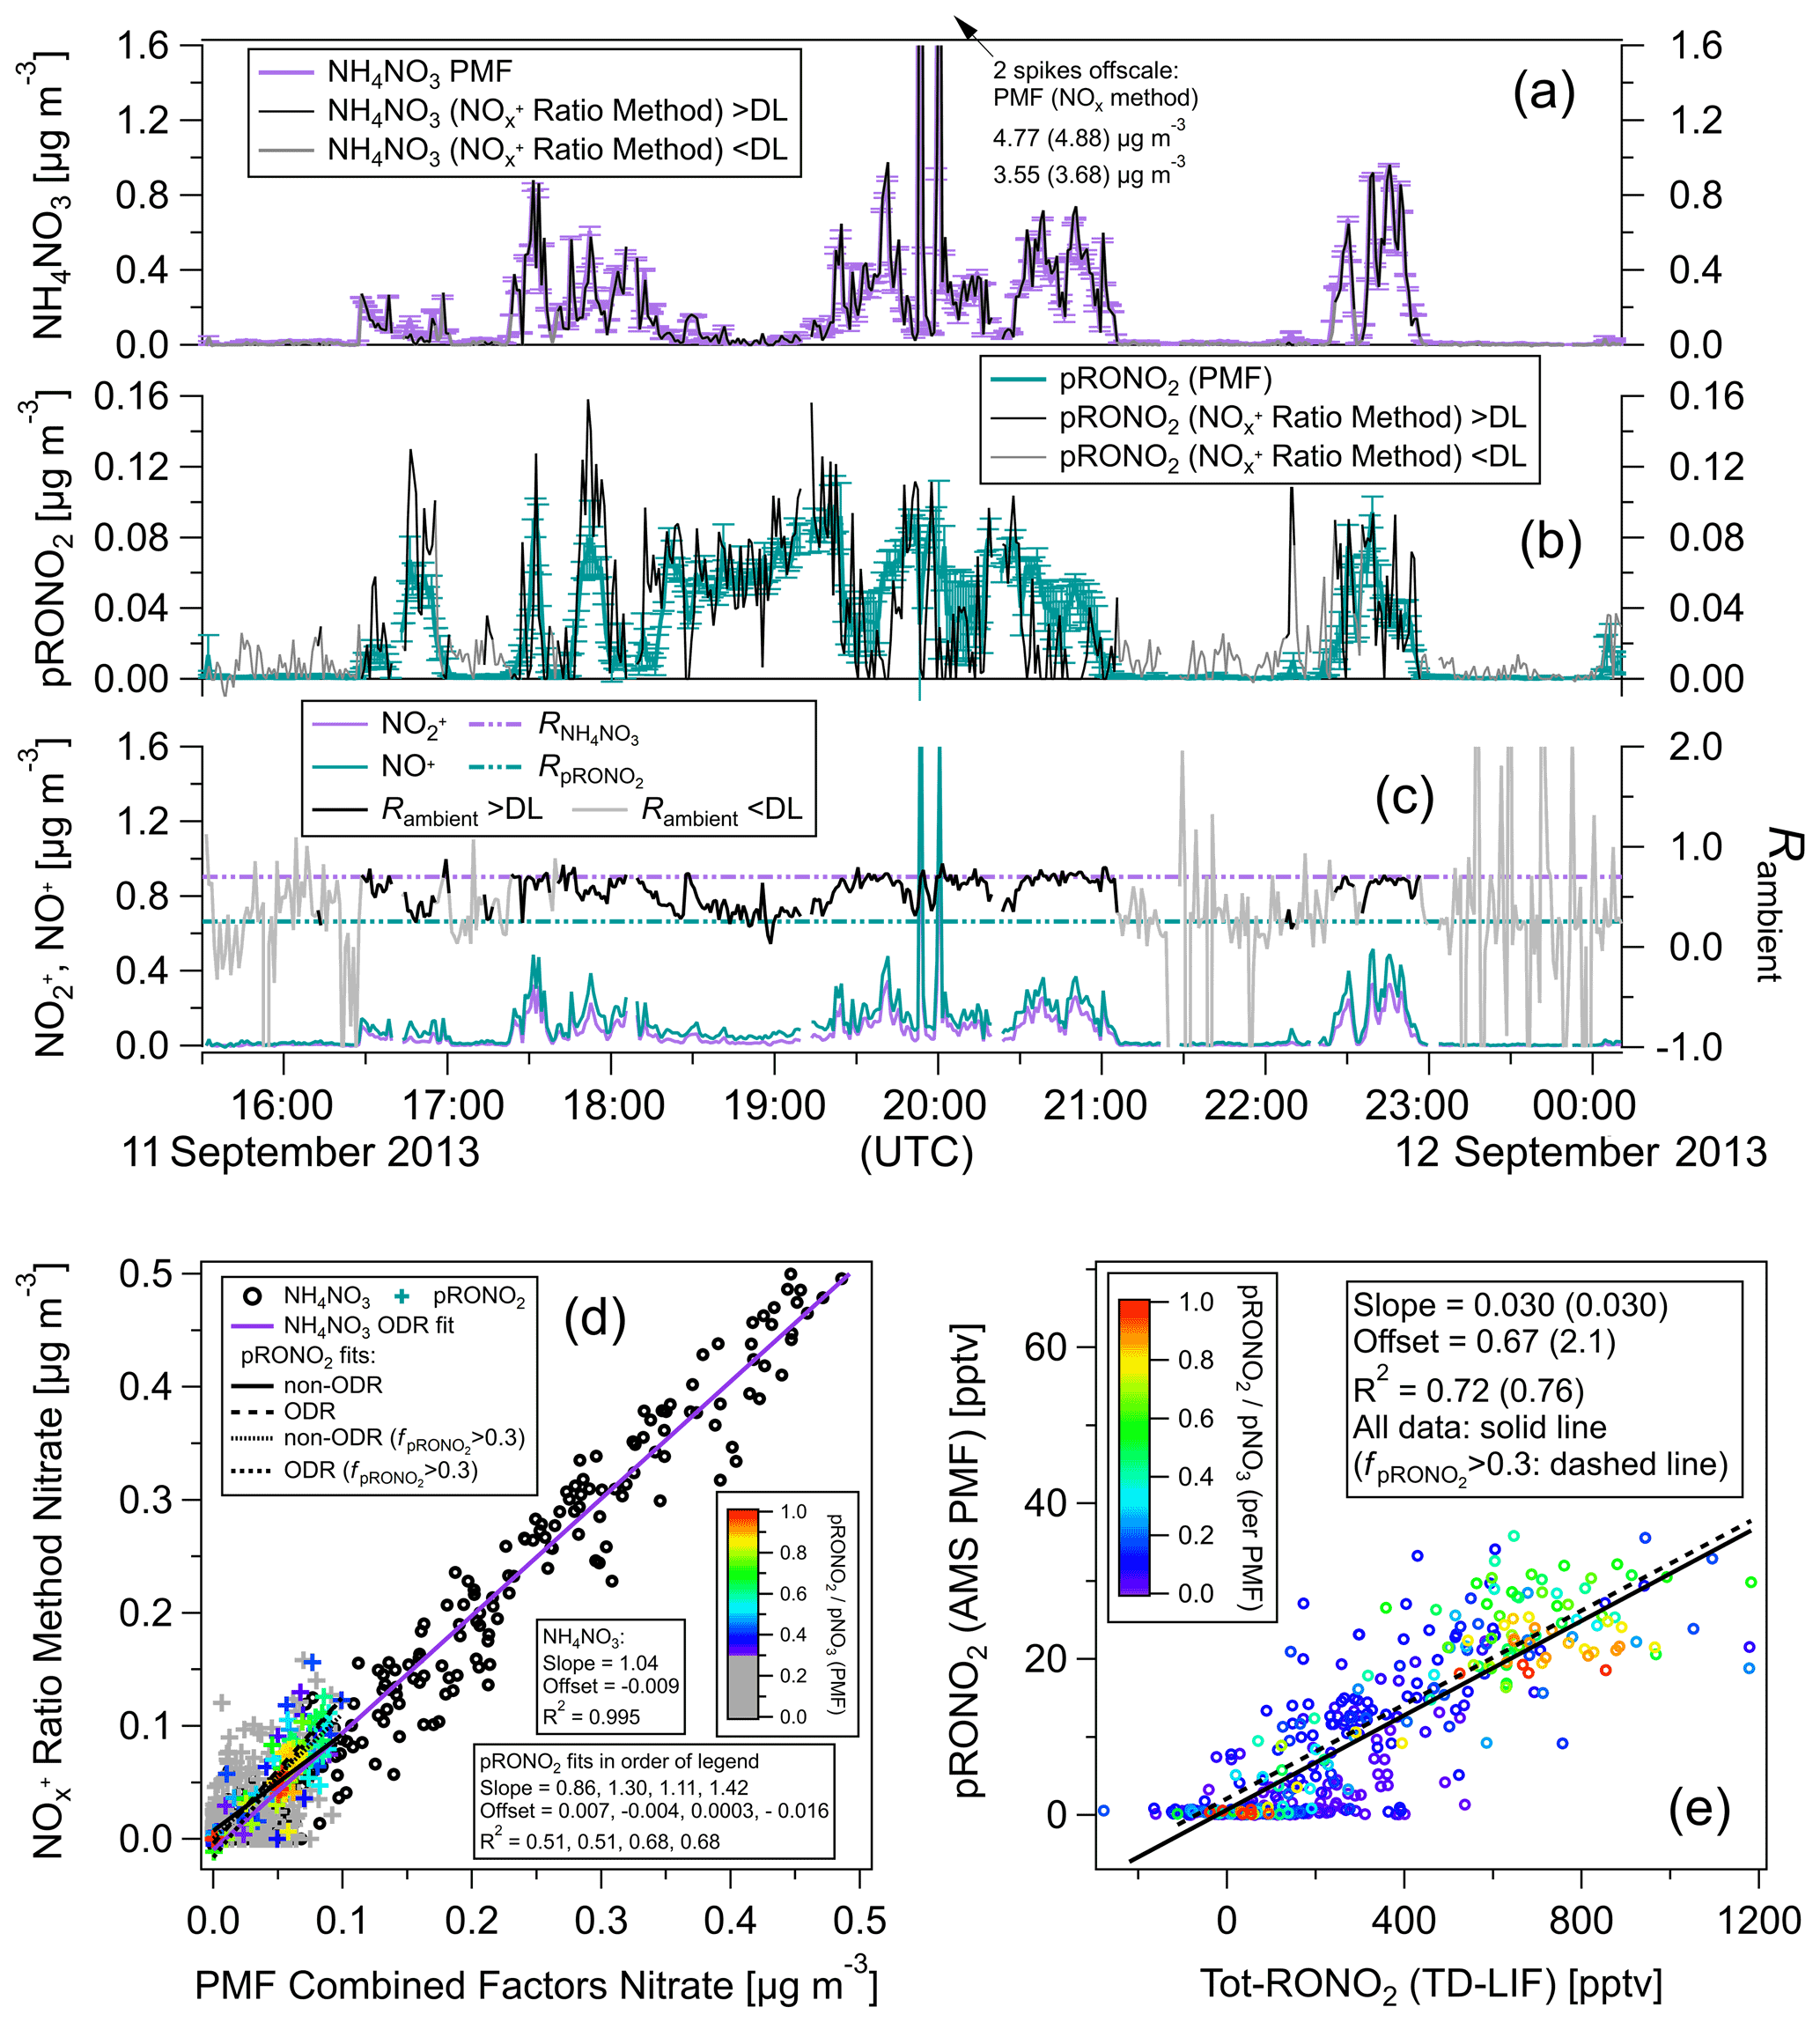
Figure 4Comparison of ratio vs. PMF methods for calculation of NH4NO3 and pRONO2 as time series (a–c) and as scatterplots (d) for same flight shown in Fig. 3. Concentration time series calculated using the RoR method (as well as the measured signals and ratios) are shown for all data as well as only when above the Rambient detection limit (DL; approximated as when both ions are above standard AMS detection limits; Drewnick et al., 2009). (e) PMF pRONO2 vs. TD-LIF Tot-RONO2 (equivalent to Fig. 3b, which instead shows pRONO2 from RoR method). pRONO2 values in scatterplots are colored by the () as computed using the PMF method. Regression line fits, slopes, offsets, and correlation coefficients are shown using different fitting methods and criterion as indicated in legends (including where data are limited to > 0.3). All PMF-derived concentrations are averages (and standard deviations) of 100 bootstrapping runs (similar results using seeding runs are shown in Fig. S21).
Taken together, these observations indicate that the AMS nitrate apportionment method effectively separated pRONO3 and NH4NO3 over a large range of concentrations, relative contributions, and source influences. However, it is clear that there are limitations when the is very low (see Sect. 5.2). It would not be surprising if the pRONO2 and Tot-RONO2 showed large variability in relative ratios for different sources and locations, since (1) pRONO2 is only a small subset of Tot-RONO2, and (2) changes in chemical composition and ambient conditions (e.g., OA concentration and temperature) could have large impacts on gas–particle partitioning. However, in this case, those effects do not appear to be large factors (or fortuitously cancel out), which in part may be due to relatively similar temperatures and OA concentrations combined with regionally consistent biogenic chemical sources of RONO2 compounds. Regardless of the exact reasons for the relatively invariant partitioning, it provides an excellent test case, since it would be very unlikely that the strong temporal/spatial correlation would be observed if there were major artifacts in either or both of the AMS and TD-LIF methods.
There were no measurements of inorganic nitrate on board the aircraft with fast enough time resolution to compare with the rapidly changing NH4NO3 concentrations calculated from the AMS. Therefore, as a rough indicator of possible changes in the NH4 related to NH4NO3, “excess NH4” was calculated as the AMS-measured NH4 − 1.2 × SO4 (as molar concentrations). A molar ratio of 1.2 was roughly consistent with the observed ratio when no indications of NH4NO3 were present (NH4 = 1.2 × SO4) and substantial concentrations of SO4 were present, as shown in Fig. S11. That ratio represents a mixture of (NH4)2SO4 and ammonium bisulfate or an ammonium balance (NH4_Bal) of ∼ 0.7 (NH4_Bal = molar ratio of ). During periods of elevated NH4NO3 concentrations, the measured NH4NO3 tracked the estimated “excess NH4” very closely with roughly half the concentration (Fig. S11). As suggested by some negative “excess NH4” values and the factor of 2 between NH4NO3 and “excess NH4”, the assumption of constant ratios based on composition in the absence of NH4NO3 is not always valid (and not surprising), and clearly a more sophisticated thermodynamic model would be required to accurately predict NH4NO3 concentrations. Nonetheless, the similar features suggest the assignment of NH4NO3 is consistent with variations in the other AMS-measured inorganic compounds. The factor of 2 suggests that around half of the “excess NH4” was associated with sulfate and half with nitrate. During this flight, with the exception of the large biomass burning plume, the elevated NH4NO3 concentrations were observed when the aircraft flew at altitudes of ∼ 2000–4000 m and never during the low-altitude (∼ 300–400 m) legs (Fig. S11 bottom left). This effect may have been due to the substantially cooler temperatures (0–15 vs. 25–30 ∘C) at those altitudes (Fig. S11, bottom middle), favoring partitioning to the particle phase, since there did not appear to be any clear relationship between NH4NO3 and gas-phase HNO3 (Fig. S11, bottom right). Increases in available NH3 gas (not measured) could also be a factor (and consistent with both more sulfate- and nitrate-associated ammonium).
Another example for a different flight (RF18) during the SEAC4RS aircraft campaign is shown in Fig. S12 and was also selected due to large relative and absolute variability in calculated pRONO2 and NH4NO3 concentrations and diverse source types sampled (see Fig. S13 for flight track and description). Similarly, the pRONO2 and Tot-RONO2 track remarkably well during periods when NH4NO3 concentrations are low or elevated and variable, and there is little correlation between NH4NO3 and Tot-RONO2. Overall, pRONO2 was correlated with Tot-RONO2 (R2 = 0.51 for all data, R2 = 0.71 for data with > 0.3) with a regression slope of 0.050 (0.068), indicating that on average ∼ 5 %–7 % of RONO2 was in the particle phase (Fig. S12a, bottom left). The measured NH4NO3 tracked the estimated “excess NH4” reasonably well and showed similarly sharp features (and roughly half the concentration; Fig. S12b, top). In contrast to RF16 discussed above, for RF18, most of the elevated NH4NO3 was observed in the warm boundary layer and often coincident with elevated pRONO2 (Fig. S12a and b).
5.2 Positive matrix factorization separation of AMS nitrate
5.2.1 Prior studies using PMF for pRONO2 separation
For the vast majority of analyses of AMS data using PMF, only traditional OA ions have been included in the input data matrices. Ions typically associated with nitrate, sulfate, ammonium, and chloride have generally been excluded, with the mindset that they are already separated as unambiguous inorganic species using the standard AMS analyses. However, since organic molecules (e.g., organic nitrates, organosulfates, reduced organic nitrogen) can in fact produce some of the same ions as those inorganic species, inclusion with the OA ions in PMF analysis may allow for separation of inorganic and organic components, as well help identify associations with more well-established source factors.
A few studies have reported results for using PMF of ambient AMS spectra including both the OA and signals to quantify pRONO2 (and sometimes NH4NO3), with mixed results (Sun et al., 2012; Hao et al., 2014; Xu et al., 2015a, 2021; Zhang et al., 2016; Kortelainen et al., 2017; Yu et al., 2019; Zhu et al., 2021). Additionally, a couple other studies have reported results where ions or calculated pRONO2 (using the ratio method) are included in PMF analysis, while not explicitly apportioning the inorganic–organic nitrate directly with the PMF results in the laboratory (Tiitta et al., 2016) and field (Kim et al., 2018; Reyes-Villegas et al., 2018). Lin et al. (2021) conducted PMF using only the ions and nitro-polycyclic aromatic hydrocarbon (NPAH) ions. Details and discussions of those studies are presented in Sect. S3, and key results are summarized in Table S4, as related to the PMF analyses.
5.2.2 New results for PMF separation of pRONO2 and comparison to RoR method
We conducted PMF on the combined OA and ion time series for the same two flights from the SEAC4RS campaign (as discussed above in Sect. 5.1; RF16, RF18) to test PMF separation of nitrates and the information it can provide, explore strategies, and compare to the RoR method. Details and an extended discussion of that analysis are documented in Sect. S4, and key results are summarized in Table S4, alongside previous published analyses. A brief summary is provided here.
As discussed in Sect. 5.1, those two flights included sampling of a wide range of source types and concentrations. PMF was conducted initially on 1 s data; however, although robust overall factors were separated, results suggested that the signal-to-noise ratio was not adequate to apportion the ions to secondary factors at ratios that reflected pRONO2 ratios. Therefore, all analyses discussed here are from 1 min measurements (which were more effective). Several strategies were used to explore the separation of OA, nitrate, and the ratios (in separate and combined factors), including number of factors, rotations (varying FPEAK), upweighting and downweighting ions, bootstrapping, seeding, constraining ratios, and removing large biomass burning plumes. For both flights, five factors were robustly separated: NH4NO3, BBOA (biomass burning OA), IEPOX-SOA (IEPOX-derived SOA), LO-OOA (less-oxidized oxygenated OA), and MO-OOA (more-oxidized OOA) (Figs. S14–S28). See the Glossary and Sects. S3 and S4 for more details on factor types. Generally, the best separations with the most information were for FPEAK at or near 0, using the standard ion signal-to-noise ratio (no downweighting/upweighting), not constraining ratios, not removing any plume data, and using bootstrapping to extract averages and assess uncertainty and robustness.
The NH4NO3 factors and the BBOA factors had very similar ratios that were consistent with calibration , with little variability across the 100 bootstrapping runs (Figs. S17 and S25). While the apportionment of nitrate between the NH4NO3 and BBOA factors was very consistent across bootstrapping runs, changes in FPEAK had large effects on that relative apportionment as well as the amount of OA ions in the NH4NO3 factor spectrum. For the OOA/SOA factors (IEPOX-SOA, LO-OOA, and MO-OOA) the ratios for LO-OOA and the combination of all three factors were consistent with expected pRONO2 ratios using the RoR (Figs. S17 and S25). Across bootstrapping runs, there was modest variability for those ratios (Figs. S17 and S25), including some solutions where the LO-OOA had only NO+ (but not for the combined OOA–SOA factor). The averages and standard deviations of the ratios for the combined OOA–SOA factor are included in the survey of pRONO2 RoRs (Fig. 1, Table S1). For calculation of NH4NO3 and pRONO2 concentrations, the nitrate contributions from the NH4NO3 and BBOA factors were summed as were the three OOA/SOA factors, respectively. The majority of the pRONO2 was contributed by the LO-OOA factor, followed by MO-OOA and then IEPOX-SOA (Figs. S18 and S27). The variability in the factor spectra ratios and nitrate concentration apportionment across bootstrapping tended to follow the same trend (higher variability for factors with lower pRONO2 contribution; e.g., Figs. S17, S18a, S25, and S27). Additionally, substantial trends were observed between factor spectra ratios and the amount of nitrate apportioned to that factor for some OOA/SOA factors. Bootstrapping and exploration of FPEAK were useful to investigate those dependencies.
Comparisons of NH4NO3 and pRONO2 concentrations using the RoR and PMF methods are shown for each flight in Figs. 4 and S12a as time series and scatterplots. For both flights there is very good agreement (near unity slope, 0.99–1.04, and R2 > 0.99) between methods for NH4NO3, certainly in part due to the dominance of NH4NO3 during higher concentrations periods. There is reasonable agreement for pRONO2 (slopes of 0.86–1.50, R2 of 0.51–0.65 depending on the flight and fitting method; it improved to slopes of 1.04–1.42, R2 of 0.68–0.84 for > 0.3) but with notable differences. pRONO2 concentrations tended to be noisier for the RoR method compared to the PMF method when nitrate was dominated by NH4NO3 or when pNO3 was very low. This may be due to the additional signal-to-noise ratio and constraints that the inclusion of the other OA ions provide, as well as the sensitivity (for both precision and accuracy) of apportionment for the RoR method when ratios approach the limit. On the other hand, the PMF method may dampen some real variability due to the fact that the factor spectra are fixed and cannot chemically evolve in the PMF model. In order to assess the true accuracy of either method, an independent and reliable determination of pRONO2 would be required. Finally, the comparison between the PMF-determined pRONO2 and the TD-LIF Tot-RONO2 showed substantially improved correlation (compared to using the RoR method) for one of the two flights (Fig. 4 vs. Fig. 3).
5.2.3 Summary of PMF method for nitrate separation
The results from our investigation of PMF and analyses described in the literature summarized above highlight some general aspects, as well as some potential advantages and disadvantages of using PMF to apportion nitrate between organic and inorganic. One major potential advantage is that with PMF, the nitrates can be immediately associated with different source factors. On the other hand, the ratio method can be used first, and then correlations of nitrates with OA-only factors can be explored and even apportioned. PMF may provide additional resolving power and higher signal-to-noise ratio by inclusion of associated OA ions, potentially more precisely separating nitrate concentrations, especially when either pRONO2 or NH4NO3 dominate the nitrate. Also, prior knowledge of the ratio for NH4NO3 (or pRONO2) may not be necessary if the ratios are robustly resolved with PMF. Additionally, the ratios resolved for PMF factors are a product of exploring ratios for ambient aerosol response and validating application of offline calibration and RoRs derived largely from laboratory studies. PMF may also be useful in separating other species that produce ions (e.g., nitrites, nitro-organics, mineral nitrates), from just NH4NO3 and pRONO2, when they are present and have a unique ratio.
Some potential drawbacks or cautionary aspects are as follows. Since the PMF model requires fixed profile spectra, this means that nitrate-to-OA ratios are fixed for each factor. Therefore, if this ratio is in fact substantially variable over the period/space of analysis, for example, driven by processes such as pRONO2 hydrolysis or gas–particle partitioning, substantial biases or uncertainties in nitrate apportionment can be introduced. While consideration of additional factors could help mitigate such effects, PMF is not designed to concisely separate profiles that are a continuum. Sometimes factors with clear NH4NO3 or pRONO2 ratio signatures are not resolved. We suspect that datasets where neither type of nitrate is dominant for some periods may be more susceptible to that issue; however, these issues may sometimes be resolvable with more extensive investigation with available PMF exploration tools (e.g., seeding, bootstrapping, FPEAK, constraining a NH4NO3 factor from offline calibrations). Otherwise, apportioning nitrate using results with profile spectra that do not have clear nitrate signatures may introduce large uncertainties which are difficult to estimate. Variable ratios due to instrument drifts or changes (e.g., vaporizer bias voltage drifts or tuning) may lead to uncertainty in nitrate apportionment since PMF computes fixed factor spectra. In practice, for using the ratio method this is not problematic, as long as regular offline NH4NO3 calibrations were performed. For PMF, separating the dataset into periods where the ratio was stable/constant and performing PMF separately for each period is one option to mitigate instrument drift issues; however, this can be very laborious if the dataset requires separate analysis of multiple periods. Another option may be to apply the “rolling method” recently made available with ME-2/SoFi, where a sub-window is moved across the PMF input along the time coordinate, allowing factor profiles to vary with each sub-window shift (Canonaco et al., 2021). Theoretically, offline calibration ratios of NH4NO3 may not be necessary for such application, although they would be preferable to have for validation.
A few other notable trends and observations are as follows (with details provided in Sects. S3 and S4). PMF-resolved pRONO2 often tends to have the largest contribution from (and association with) LO-OOA/SV-OOA, followed by MO-OOA/LV-OOA, especially for biogenically influenced locations (Sun et al., 2012; Hao et al., 2014; Xu et al., 2015a; Zhang et al., 2016; Kortelainen et al., 2017; Yu et al., 2019; Sect. S3, Table S4). That is consistent with pRONO2 forming in fresh SOA (i.e., LO-OOA/SV-OOA) and being partly lost as the OA ages and/or MO-OOA/LV-OOA consisting of a mix of aged OA, some of which was not associated with pRONO2. Nitrate associated with aged ambient BBOA can be dominated by NH4NO3 (shown with aircraft data with PMF in this study and discussed more broadly in Nault et al., 2021); however, primary and secondary pRONO2 (or other oxidized organic nitrogen) associated with BBOA emission has been reported in the laboratory and field, sometimes as large contributions (Tiitta et al., 2016; Reyes-Villegas et al., 2018; McClure et al., 2020; Lin et al., 2021). When NH4NO3 factors are resolved, they tend to contain substantial contributions (∼ 15 %–80 %) of OA (non-) ions (Sun et al., 2012; Hao et al., 2014; Xu et al., 2015a; Zhang et al., 2016; Kortelainen et al., 2017). Generally, those non- contributions seem to be higher for strongly biogenically influenced measurements and less so during cooler wintertime periods when NH4NO3 comprises a larger fraction of nitrates (Xu et al., 2015a; this study). Our experience through exploration of various approaches (e.g., upweighting the ions, increasingly positive FPEAK, increasing number of factors) suggests that efforts at “cleaning” the NH4NO3 factor tend to be ineffective and/or lead to degradation of the overall PMF solutions. Since the OA contained in the NH4NO3 tends to not be a large overall fraction of the OA, this does not appear to be a major issue. Finally, evidence suggests that inclusion of ions in PMF does not tend to have much influence on overall OA-dominated factors (factor spectra nor concentration time series), which is not surprising given that their overall contribution to the signal-to-noise ratio among the many OA ions is fairly small. Consequently, there does not appear to be any drawbacks or complications associated with also including ions when running PMF on AMS data.
Overall, PMF appears to be a useful tool for apportioning nitrates and investigating their associations with sources. The case for quantitative apportionment of nitrate with PMF is strongly bolstered when the ratios resolved for both the NH4NO3 factor and separate or combined pRONO2-associated factors are similar to NH4NO3 calibration and expected pRONO2 ratios. When those criteria are not met, using the ratio method may be better, as it is likely less prone to such biases or ambiguities, and uncertainties can be better defined.
5.3 Comparison of pRONO2 quantification with an AMS and other instruments in the lab and field
Several studies have reported quantitative comparisons of pRONO2 concentrations, as measured by an AMS vs. other instrumental methods (alternate AMS-based methods, FTIR, TD-(LIF/CRDS/CAPS), and FIGAERO-CIMS). Section S5 provides details and discussions, and Table S5 presents a summary of key aspects of those comparisons. Overall, those comparisons show good agreement in most cases (1:1 within known uncertainties) and substantial differences in a few cases (factors up to 2–4). In some of the cases where substantial differences were observed, possible explanations were discussed and sometimes explored. There do not appear to be any consistent reasons for the differences. In some of the field comparisons and all of the laboratory experiments, the nitrate sampled was dominated by (or exclusively) pRONO2 and thus largely serves as a test of pRONO2 quantification (general calibration/quantification factors, relative ionization efficiency (RIE), and collection efficiency, etc.). Consequently, taken together, the evidence available does not support use of an RIE for pRONO2 quantification with an AMS that is significantly different from that measured for (and regularly calibrated with) NH4NO3. In order to narrow the uncertainties in pRONO2 quantification (in the field and laboratory), controlled laboratory-based intercomparisons of total and speciated organic nitrates using an AMS and other methods are needed.
As Farmer et al. (2010) point out, it is probable that a large fraction of RONO2 molecules thermally decompose to RO and NO2 at the AMS vaporizer after which NO2 gas is ionized. For example, the TD-LIF technique (and CRDS/CAPS equivalent methods) rely on quantitative thermal dissociation of RONO2 to NO2 in the gas phase, which occurs at ∼ 350 ∘C in ∼ 50 ms at near-ambient pressures (Day et al., 2002). The timescale of evaporation, decomposition, ionization, and detection for the AMS are on the order of tens of microseconds (µs) (Drewnick et al., 2015; Jimenez et al., 2016); however, at 600 ∘C the dissociation rate coefficient for pRONO2 is ∼ 4 orders of magnitude larger (compared to 350 ∘C). That said, it is not clear what the pressures or temperatures of the gases are in the evaporation plume. Nevertheless, Farmer et al. note that thermal decomposition of pRONO2 to NO2 in the AMS would be consistent with the higher ratios observed for pRONO2 than NH4NO3. Their reasoning is that reported ratios of NO2 gas ionization (3.0) are substantially higher than those reported for HNO3 (0.5) gas as well as their measurements of particle-phase NH4NO3. Using the simplest assumption that only NO2 (from RONO2 thermal decomposition) and HNO3 (from NH4NO3 evaporation) are ionized would yield a RoR of 6, which is double that observed. Moreover, fixed values would be expected for pRONO2 and NH4NO3 rather than the observed range of ∼ 4. Clearly, the behavior is more complicated than this simple model. Given that mass discrimination (ion transmission or detector efficiency differences) for the range of the NO+ and ions is expected to be minor for the AMS (Hu et al., 2017b), the values and variability in ratios likely originate in the vaporizer and/or ionizer region. As discussed in Hu et al. (2017b), the values and range of ratios observed for NH4NO3 (combined with other observations) are consistent with electron ionization (EI) from a combination of HNO3, NO2, and NO gases that are formed through thermal decomposition. They show the greatly enhanced importance of such neutral gas-phase decomposition for measurements where a “capture vaporizer” is substituted for the standard AMS vaporizer. The capture vaporizer has a different geometry (optimized for limiting particle bounce) that results in longer gas-phase residence time near the hot vaporizer surfaces. Consequently, a ratio that is an order of magnitude lower is observed for NH4NO3 (0.04–0.07), likely due to a shift in ionization toward primarily NO gas. Similar thermal decomposition processes would be expected for RONO2. However, thermal decomposition to RO and NO2 may occur much faster and always to near completion, given the thermal instability of the O–NO2 bond and near-absence of CxHyOzN+ fragments in AMS pRONO2 spectra (Farmer et al.). Hu et al. (2017a) report a large reduction in the ratios for pRONO2 when using the capture vaporizer compared to the standard vaporizer (with a pRONO2 ratio 10 times lower than for NH4NO3 with the capture vaporizer).
As shown in Drewnick et al. (2015) and Jimenez et al. (2016), single-particle detection timescales for ions when sampling NH4NO3 show a range of a factor of 2 (and ∼ 25 µs differences), primarily with NO+ being longer than and ions. These observations are interpreted as evidence for additional processes occurring at longer timescales than flash vaporization at the nominal temperature such as vaporization at lower effective temperatures, slower vaporization or thermal decomposition, and adsorption/desorption from ionizer surfaces. They also showed that the single-particle detection timescales were insensitive to vaporizer temperatures above 300 ∘C. On the other hand, Hu et al. (2017b) showed a small dependence of the on vaporizer temperature decreasing by 25 % from 200 to 800 ∘C, consistent with more thermal decomposition to NO2 and NO gases. Other studies have reported no dependence of ratios on vaporizer temperature (∼ 200–600 ∘C) for pRONO2-containing chamber SOA (Fry et al., 2009) or ambient (mixed nitrate) aerosol (Docherty et al., 2015). Overall, these observations point toward the timescales of interaction and the effects of spatial distribution of competing processes playing a more important role in affecting observed ion ratios, rather than vaporizer temperature. In part, this relative insensitivity to vaporizer temperature may be because the physical process of particle vaporization occurs at lower temperature than the nominal vaporizer temperature due to evaporative cooling (Saleh et al., 2017). Another observation that Hu et al. reported for using the capture vaporizer was that the detection timescales (based on UMR PToF distributions) when sampling NH4NO3 were much longer for NO+ than for , but the reverse was true for pRONO2. Such apparent spatiotemporal differences in thermal decomposition and ionization could potentially be used as another method for differentiating nitrates. However, the low signal-to-noise ratio of , differences in sizes and broader distributions for ambient aerosol nitrates, and the possibility that some of the differences Hu et al. observed were from may seriously limit such an approach and would require further evaluation (using HR-PToF).
A few other evaluations of , described in Hu et al. (2017b) (using the standard vaporizer), showed dependencies of ratios of only < 20 %, including varying the location on which particles impact the vaporizer (by horizontally translating the aerodynamic lens position) and varying the vaporizer bias voltage over ranges expected for typical AMS operation. On the other hand, varying the vaporizer bias voltage over a wider range, such as slightly beyond the settings where the aerosol signal peaks and where the gaseous “airbeam” signal peaks, can result in a shift in the by nearly a factor of 2 (Fig. S29). This behavior reflects the ability of the vaporizer bias voltage tuning to preferentially sample ions produced in different regions of the ionizer. It has also been shown for the signals of other ions, such as (Jayne et al., 2015). While proper tuning of the AMS vaporizer bias voltage typically aims at optimizing the aerosol signal, that may not always be performed by AMS operators, and likely in some cases the airbeam signal may be optimized instead (which can be different than the particle signal peak as in Fig. S29, although not always). Therefore, variability in this tuning parameter may explain a substantial fraction of the range in NH4NO3 (and possibly pRONO2) ratios shown in Fig. 1. Another effect that appears to be able to substantially alter the ratios is related to exposure to high concentrations of OA for extended periods, possibly coating the vaporizer (and is possibly related to the “Pieber effect” where nitrate aerosol produces signal from interactions at the vaporizer surface), and will be discussed in a future publication. Taking all the evidence available at present, the range in ratios for NH4NO3 and pRONO2 among instruments, settings, and operating conditions appears to be driven by changes in the amount of chemical decomposition and the overlap of those products with the ionizing electron beam. This aspect highlights the importance of periodic measurement of the ratios with a standard (i.e., NH4NO3), especially after making significant instrument changes, when quantifying pRONO2 and NH4NO3 with the AMS.
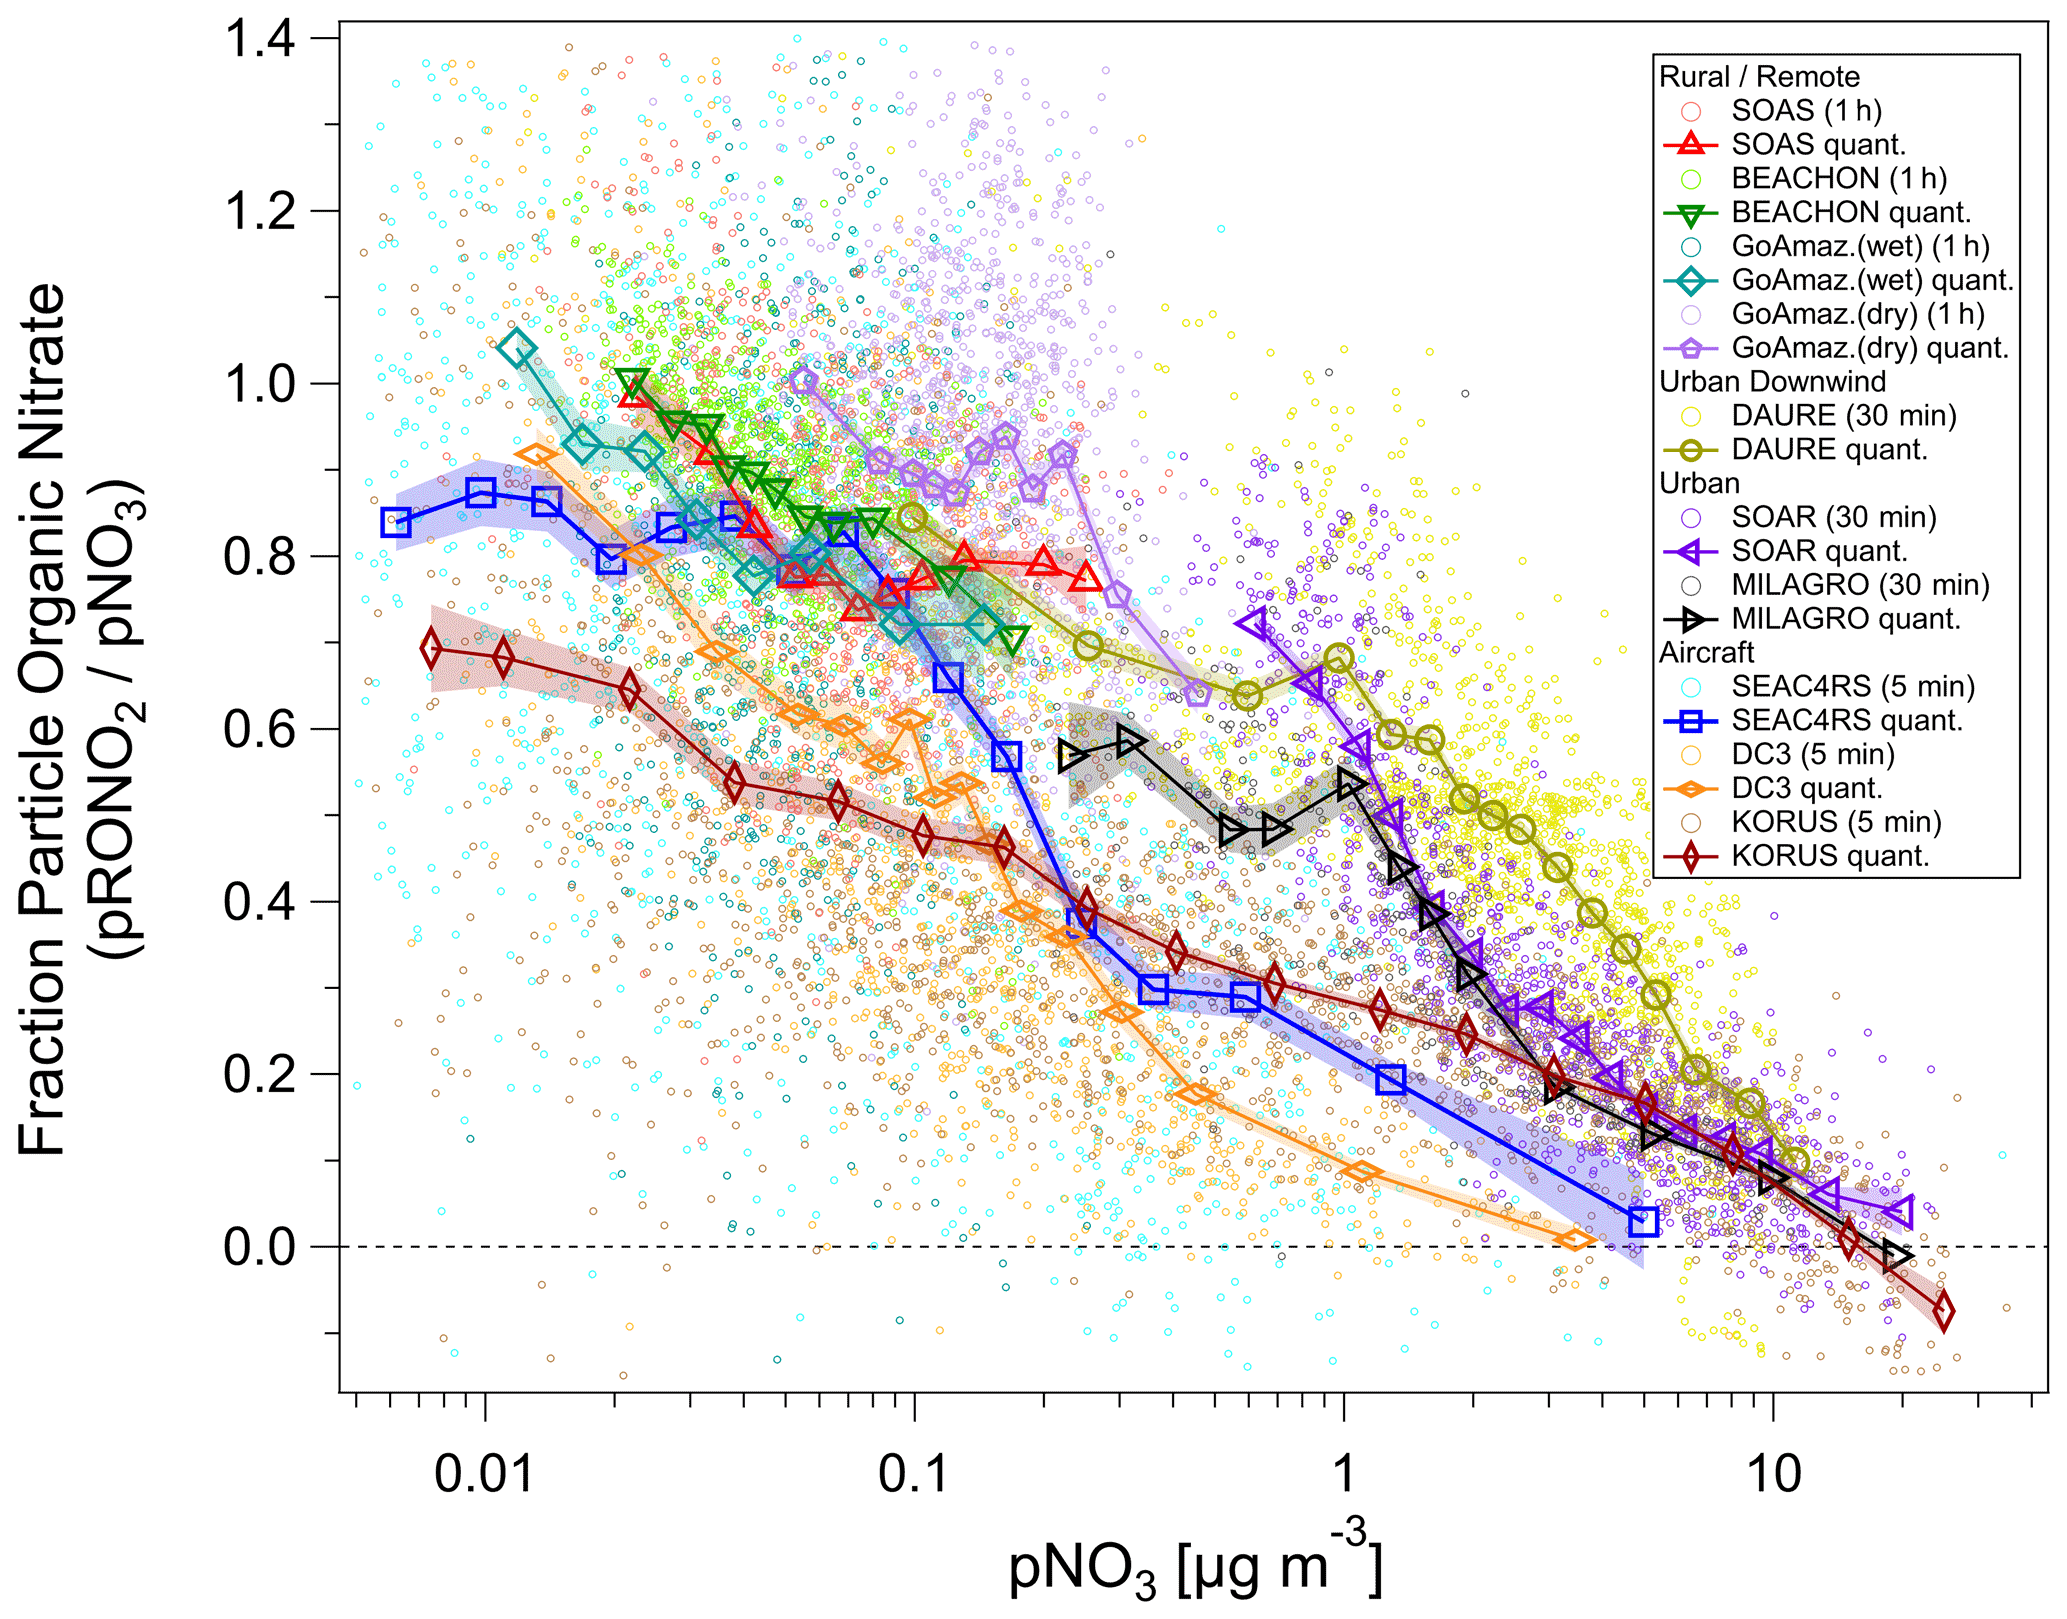
Figure 5Fraction of total non-refractory submicron nitrate that is organic () vs. total nitrate concentration (pNO3) for several ground and aircraft campaigns. Campaigns span late winter to summer across the Northern Hemisphere and wet/dry seasons near the Equator, from ground level to the upper troposphere, and urban to remote locations. ion signals were first averaged, and then data were conservatively screened for detection limits (signal-to-noise ratio > 1–3) using both ions (small circles). Quantile averages (means, 7–15 bins) are also shown for each campaign. Additionally, for all campaigns, one additional average was calculated and included with the quantile averages for the highest 1 % (3 %) of pNO3 for urban/aircraft (rural/remote) campaigns in order to extend the pNO3 by a factor of ∼ 1.3–3 (undersampled chemical regime but with a sufficiently high signal-to-noise ratio). The average of the lowest 3 % of pNO3 for the MILAGRO campaign is also included. Shaded swaths indicate the standard error for the quantile averages. Many are no larger than the markers and thus may not be very apparent. See Fig. S31 for a simplified version, showing only binned averages and standard error bars.
An overview of the inorganic vs. organic nitrate apportionment for all of the campaigns discussed in this paper is shown in Fig. 5. The apportionment was conducted using the RoR method. The campaigns span late winter to summer across the Northern Hemisphere and wet/dry seasons near the Equator, from ground level to the upper troposphere, and urban to remote locations. Overall, the shows an inverse relationship with the pNO3, approaching 100 % at low pNO3, primarily at rural/remote locations. At high pNO3 and strongly urban-influenced locations, the nitrate is dominantly NH4NO3. However, urban and urban-influenced locations can often exceed 50 % contributions from pRONO2, when pNO3 is lower (< 1–2 µg m−3). At the urban ground sites (MILAGRO, SOAR), the modulation of the variability in pNO3 tended to be driven by large increases in NH4NO3 from photochemical production of HNO3 during morning to early afternoon, followed by evaporation at higher temperatures during afternoon driving concentrations to minima that were generally sustained through nighttime (Aiken et al., 2009; Docherty et al., 2011). At the rural/remote sites, nitrate is nearly always dominated by pRONO2 and with low concentrations. At the mid-latitude sites (BEACHON, SOAS), a large contribution to the variability in concentrations was attributed to nighttime production of pRONO2 from BVOCs (Fry et al., 2013; Xu et al., 2015b). For the Amazon studies, substantial variability was observed on sub-day and synoptic timescales, especially during the lower concentration wet season measurements, with episodic elevated inorganic contributions (de Sá et al., 2018, 2019). Thus, variability may have largely been driven by transport changes and large-scale regional processes; however, the factors controlling particle-phase nitrate for those studies have not been thoroughly explored. For DAURE, an urban downwind site with high pNO3, consistent diurnal patterns were not observed, and pNO3 variability was likely dominantly driven by variability in transport (Minguillón et al., 2011; Zhang and Jimenez, 2021).
The aircraft campaigns span the entire range of the urban and rural/remote sites combined, since they include urban and biomass burning sampling, as well as rural/remote and free tropospheric sampling. However, there are notable differences among them and compared to ground-based studies. A major difference is the shift toward lower or pNO3 in the intermediate ranges by factors of ∼ 2 or ∼ 10, respectively. The large divergence as pNO3 decreases from ∼ 2 to ∼ 0.2 µg m−3 coincides with the range where the aircraft measurements show NH4_Bal transitions from balanced (NH4_Bal ∼ 1) to a modest deficit in ammonium (NH4_Bal ∼ 0.75–0.9) (see Fig. S30). Lower NH4_Bal can be indicative of more acidic aerosol (Nault et al., 2021; Schueneman et al., 2021), making particle-phase NH4NO3 less thermodynamically stable. In comparison, the NH4_Bal values for the ground-based urban-influenced studies (SOAR, MILAGRO, DAURE) were consistently near unity (Aiken et al., 2009; Docherty et al., 2011; this work for DAURE, not shown). However, such effects alone would result in higher in the aircraft studies, not lower as observed, due to sulfate not balanced by ammonium and acidity making ammonium nitrate thermodynamically unstable. Therefore, other factors must be at play, such as very different sources being sampled, lower temperatures, and higher relative humidity (RH) for the aircraft measurements (making NH4NO3 more thermodynamically stable; see Sect. 5.1, Fig. S11), dilution shifting the curves, or higher acidity shortening the lifetime of pRONO2 (such as accelerating hydrolysis). At the lower range of pNO3 (< 0.2 µg m−3) the is substantially different following the order KORUS <DC3 <SEAC4RS. Considering again the NH4_Bal (Fig. S30), for SEAC4RS the aerosol inorganics are much less balanced by ammonium (NH4_Bal ∼ 0.08–0.75) compared to DC3 (NH4_Bal ∼ 0.5–0.8) and KORUS (NH4_Bal ∼ 0.5–0.9) at the lower pNO3 range, suggesting a possible role of acidity and NH3 availability. On the other hand, it does not appear that acidity plays a dominant role in favoring the high at the rural/remote ground-based studies, as BEACHON tended to be fully balanced (NH4_Bal ≥ 0.9), while SOAS was not (NH4_Bal ∼ 0.5–0.7) (Fry et al., 2013; Hu et al., 2016).
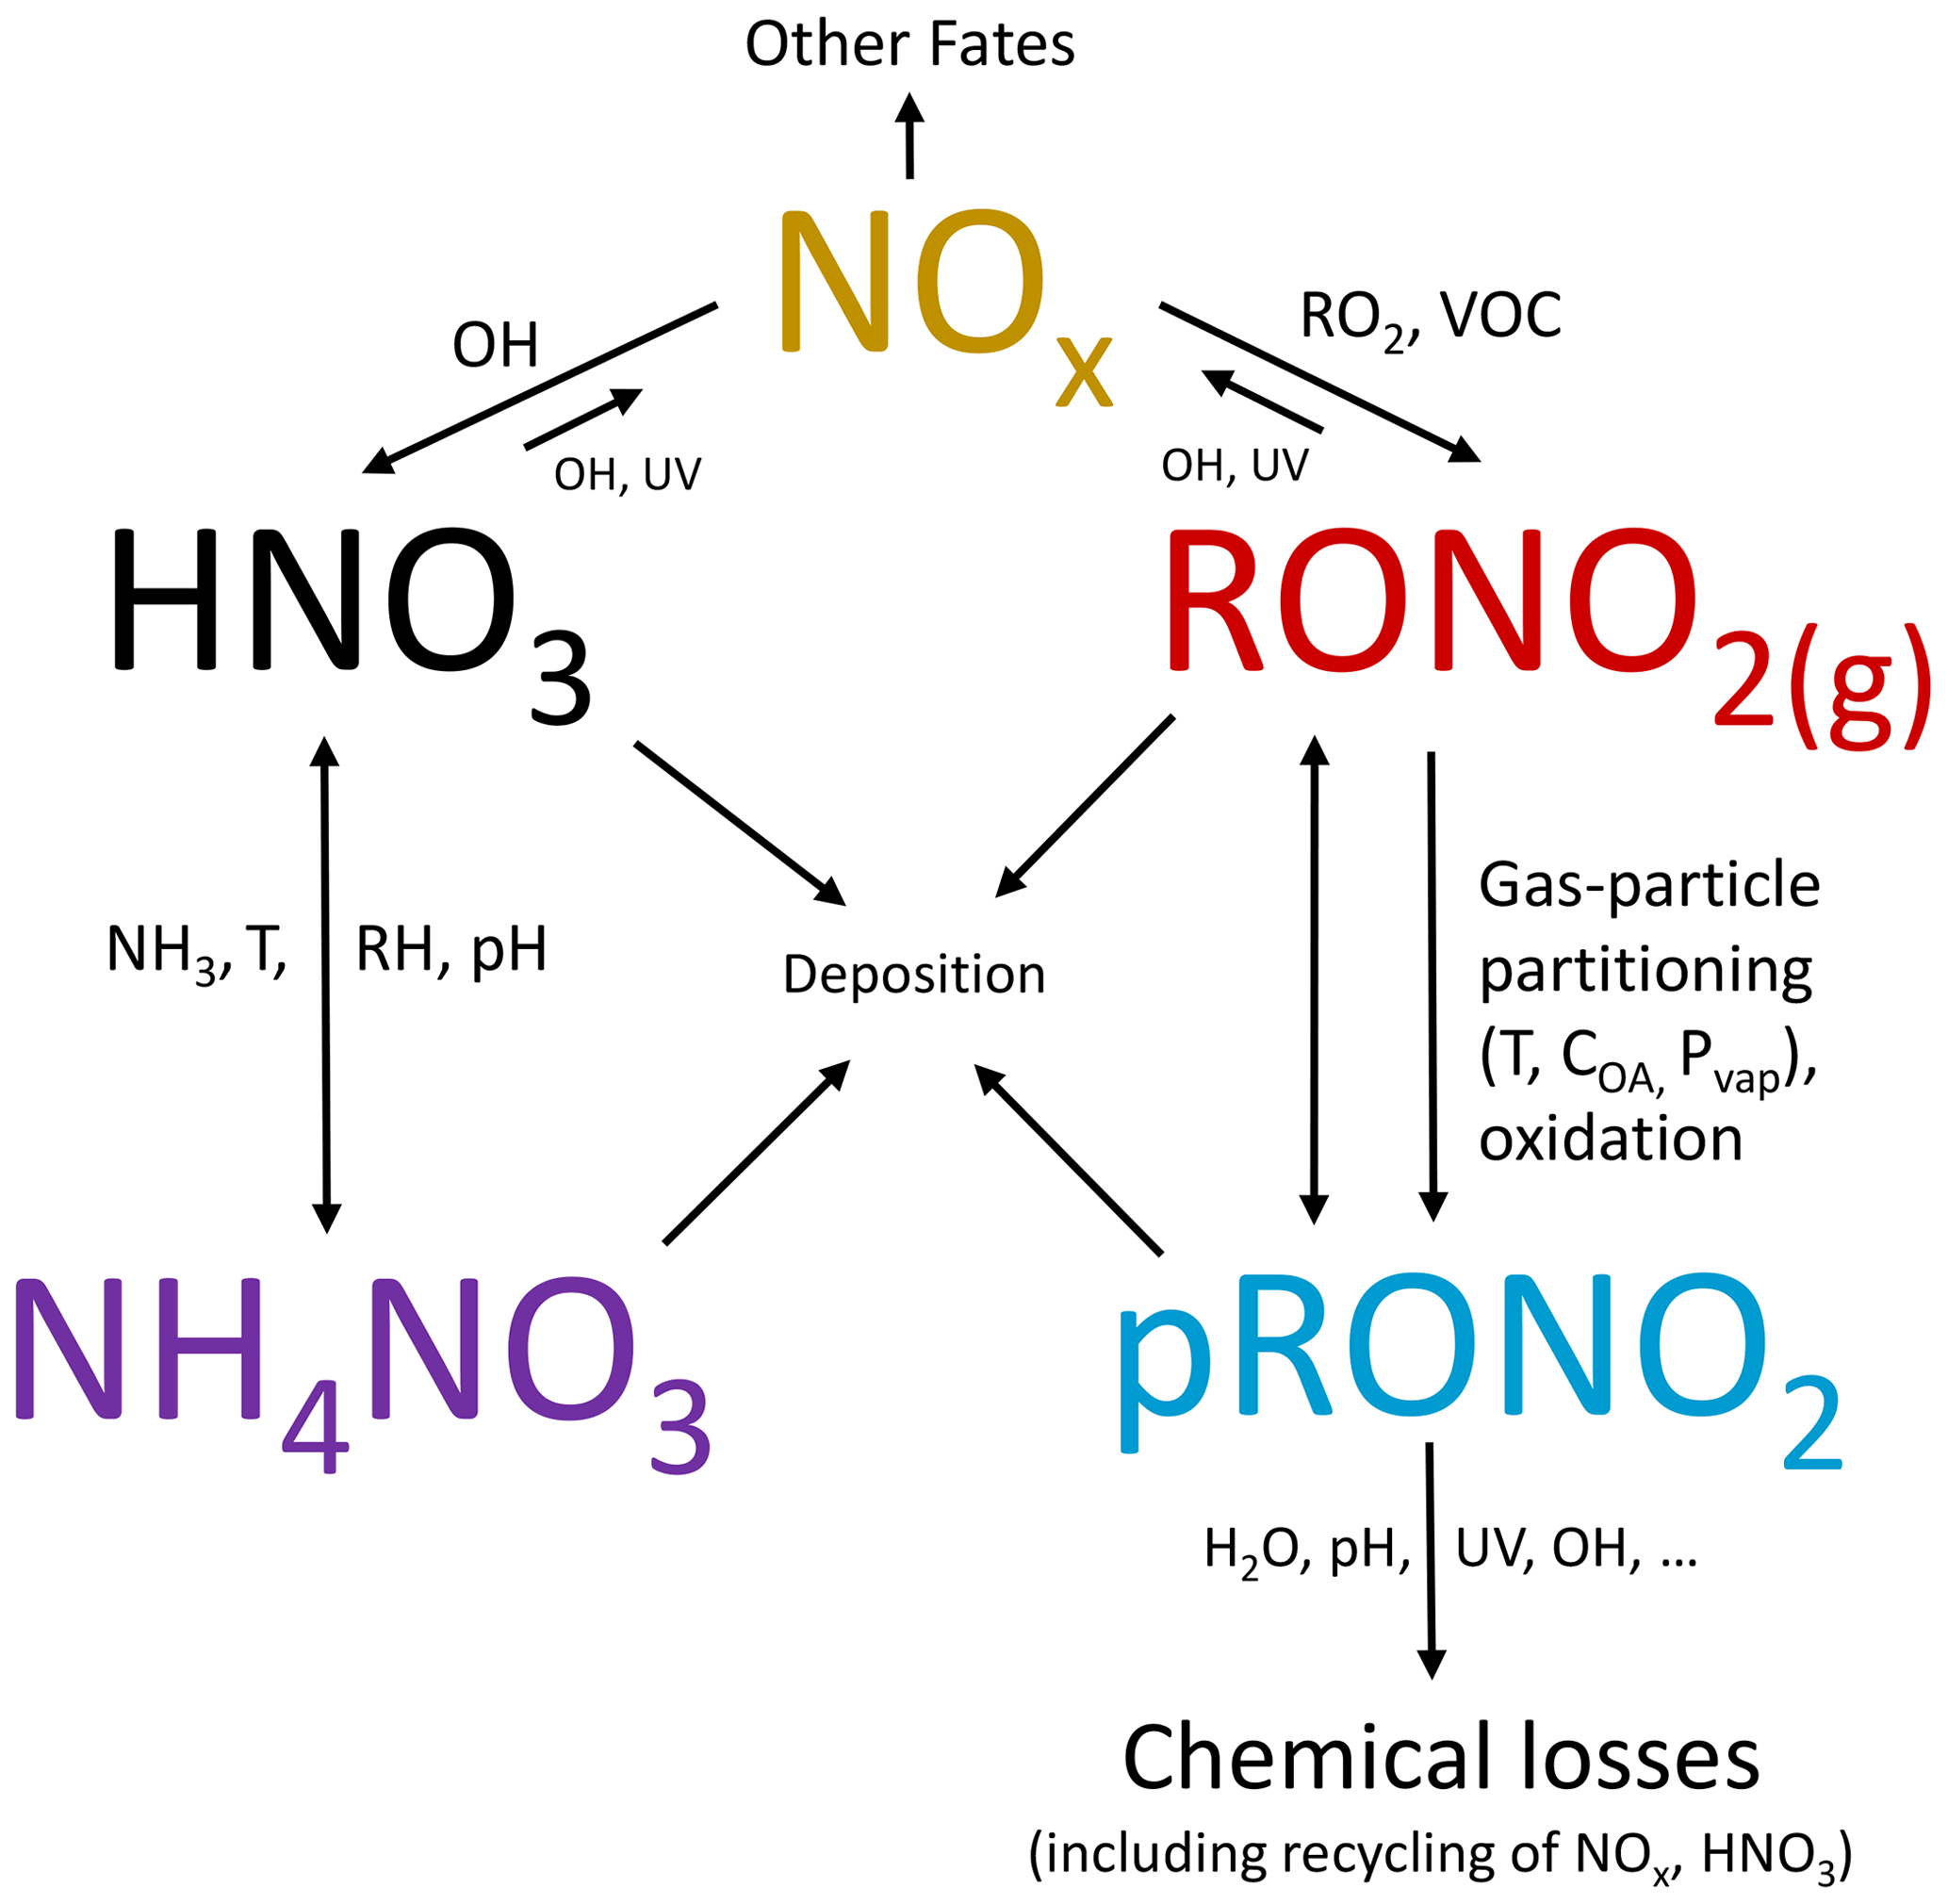
Many different chemical and physicochemical processes interplay to control the concentrations and relative proportions of NH4NO3 and pRONO2 in the atmosphere. Figure 6 shows a schematic of these key processes. The differentiation can be viewed as effectively beginning with the branching of the radical–radical reaction of NOx with OH vs. RO2 or VOCs (NO+RO2, NO2 + RC(O)O2, NO3 + RC = CR′) to produce gas-phase HNO3 vs. RONO2. The relative amount of these pathways can vary widely, in large part controlled by relative amounts of NOx concentrations compared to VOC reactivity; the RONO2 formation pathway can become dominant below modest NOx concentrations, particularly at biogenically influenced rural sites (e.g., Browne and Cohen, 2012; Romer, 2018). However, the partitioning of HNO3 and RONO2 into the particle phase can depend on numerous factors such as NH3 availability, RH, temperature, particle acidity, RONO2 volatility, or OA concentrations. Subsequent chemical, photochemical, evaporation, and deposition losses of gas and particle components will also exert controls on concentrations and lifetimes. In large part, the general trend shown in Fig. 5, over more than 3 orders of magnitude pNO3, may be driven by the ability of HNO3 formation in the presence of sufficient NH3 at increasing pollution levels (i.e., NOx) to overwhelm more modest pRONO2 formation, combined with the high volatility of NH4NO3 prone to evaporation upon dilution. In contrast, at rural and remote locations, the formation of RONO2 becomes more favorable, producing pRONO2 of which a substantial portion is not prone to rapid chemical or evaporative loss, thus dominating widespread background nitrate composition. However, this is a very simplified picture of the complex processes at play, and more detailed investigations combining corresponding measurements with modeling to better understand the dominant processes controlling the trends shown in Fig. 5 are needed. In a recent study of 11 aircraft campaigns from throughout the globe, Nault et al. (2021) showed overall trends of decreasing pH and NH4_Bal with remoteness (as indicated by decreasing total inorganic PM1), which was not well represented in many current models. While there may be some connections between that phenomenon and the one shown in Fig. 5 (e.g., via acidity and NH3 availability), inorganic PM1 concentration is more closely related to remoteness than pNO3, as it is often dominated by sulfate, which is less chemically reactive and less volatile than pRONO2 and NH4NO3, and its formation is less coupled to VOC conditions. For a ground-based study in a Chinese megacity during fall, a strong trend of increasing inorganic fraction of pNO3 with increasing calculated aerosol pH (pH = 1.5–3.5) was observed, which was attributed to numerous coincident factors during pollution episodes favoring NH4NO3 precursor availability and gas-to-particle partitioning (Chen et al., 2021).
We note that the data included in Fig. 5 are generally weighted toward warmer periods or regions. Xu et al. (2015a) reported wintertime (within November–February) measurements of organic and inorganic nitrate at two urban and one rural site in the Southeast United States. Campaign averages of pNO3 ranged 0.8–1.4 µg m−3 (with 1σ variability of ± 90 %–100 %), and average was 0 %–30 % across the sites and the apportionment methods considered. pNO3 and inorganic nitrate showed strong diurnal cycles, peaking mid-morning with minima mid-afternoon to late afternoon. Nitrate apportionment vs. pNO3 was not reported, so it is unclear if similar trends to those in Fig. 5 were present (e.g., if increased during afternoon pNO3 minima). However, on average, all three campaigns fell in the chemical coordinate space of the urban-influenced studies shown in Fig. 5. The fact that the rural site was similar to the urban sites may be due to the cooler winter temperature (and higher RH) as well as reduced biogenic influences, compared to warm rural studies shown in Fig. 5. A few other studies have shown AMS data as supplementary material, that suggest similar relationships to those in Fig. 5 for individual studies. Those include plots of NO+ vs. ions which appear to have higher ratios of at lower signals (Docherty et al., 2015; Zhou et al., 2016) or decreasing ratios with decreasing pNO3 (Kiendler-Scharr et al., 2016). Additionally, a recent analysis of three datasets in the North China Plain (urban summer and winter and rural winter) showed a strong decreasing trend in vs. PM1 during the urban summer measurements and weak trends for the wintertime measurements (and lower overall ) (Xu et al., 2021). Those observations are generally consistent with the trends with pNO3 during summer and with seasonality discussed above.
From simply inspecting the relationships of and ratios vs. pNO3 in Figs. 5 and S9 or the variability of ratios shown in Fig. 2, it could be postulated that such trends could simply be driven by changing pNO3 concentrations or some other confounding factor such as matrix effects. Thus, here we review several pieces of evidence presented in this paper and prior literature that, taken together, provide overwhelming support that the variability of measured Rambient between the calibrated and the RoR-derived values is dominantly controlled by the continuum of inorganic–organic nitrate contributions. We emphasize that this discussion is relevant only to conditions where refractory nitrates (NaNO3, Ca(NO3)2, e.g., from dust or sea salt) or nitrites are not substantial components of the aerosol, since they produce different ratios and the apportionment equation becomes under-constrained.
Kiendler-Sharr et al. (2016) present laboratory data of ratios for over a range of NH4NO3 concentrations and mixtures (Sect. S1, Fig. S1 in that paper). They conclude that “fragmentation behaviour as a function of mass concentration, composition of the particles and particle size of NH4NO3 and mixtures of NH4NO3 with (NH4)2SO4 and glutaric acid, were observed to be constant, independent of mass concentration down to 0.1 µg m−3 in the laboratory aerosol”. We regularly generate scatterplots of the two ions over a range of NH4NO3 concentrations recorded during calibrations. This is the typical method we use and recommend for quantifying the and inspecting for any irregularity in the relationships (such as nonlinearity). The insensitivity of with concentration is a consistent feature. We have systematically explored concentration and matrix effects of NH4NO3 and pRONO2 in the laboratory and with field data and show that under typical ambient conditions, effects, if present, are small. This will be presented as part of a future paper exploring the uncertainties of these apportionment and quantifications methods. We note that this result contrasts with a similar study that assessed the viability of apportioning inorganic and organic sulfate using and ion ratios (Schueneman et al., 2021). Strong dependencies on aerosol composition (i.e., acidity and nitrate mass fraction but generally not OA concentration) were found for those ions, making sulfate apportionment not possible under a substantial fraction of conditions found in the atmosphere.
Inspection of the ratios vs. pNO3 shown in Fig. S9a for the three urban field studies shows that ratios generally plateau at when the nitrate is only ∼ 30 % of the bulk aerosol – and thus still dominated by other compounds – supporting the finding that mixing with other complex ambient components does not alter the ratio produced from NH4NO3. Furthermore, at lower pNO3, ratios for all campaigns generally approach expected pRONO2 ratios. While this certainly does not prove that at the lower pNO3 range, the nitrates are primarily organic and primarily NH4NO3 at the higher pNO3 range, such consistent behavior would be highly coincidental. We also point to the comparisons of AMS-apportioned pRONO2 with independent measurements of total RONO2, shown in Figs. 3 and S12a. There is a high level of tracking between the two independent organic nitrate components, while flying through intermittent plumes with elevated inorganic nitrate, which were sometimes correlated with elevated OA while in other cases not (Figs. S11 and S12b). This provides strong evidence that the use of ratios is indeed effectively apportioning nitrate, and changing non-nitrate fractions are not hindering the method. Similarly, the apportioned NH4NO3 tracks well with estimates of NH4 not associated with sulfate for those same aircraft flights (Figs. S11 and S12b).
Finally, the exploration of ratio apportionment with PMF shows the distinct signature of pRONO2 ratios for secondary OA factors and that of NH4NO3 for the other components (Figs. S17 and S25). That result would be highly unlikely if the continuum of ratios in the total aerosol were dominantly controlled by concentration or matrix artifacts. While this preponderance of evidence strongly supports the effectiveness of this method, further laboratory and field data studies and analyses, including instrument comparisons, should be conducted to better constrain uncertainties and improve the method.
We have explored the viability of using the ion ratios produced in the AMS spectrum from nitrates to separate and quantify NH4NO3 and pRONO2 concentrations in ambient aerosols. The use of NH4NO3 calibration ratios and an inferred ratio for pRONO2 that tracks the NH4NO3 ratio (“Ratio-of-Ratios”) is investigated and tested. An extensive range of data and approaches are utilized for this investigation including a diverse collection of ambient field datasets, chamber studies, oxidation flow reactors, pure compounds, comparisons to AMS PMF methods and other pRONO2 or related measurements, and a compilation of a broad literature survey.
It is shown that the method is robust and effective under typical ambient sampling conditions. Methods and practical considerations for calculating concentrations are described. The Ratio-of-Ratios ratio method produced similar results to conducting PMF on the expanded mass spectra series (including both OA and ions) to apportion nitrates. While using the PMF method may have advantages of an improved signal-to-noise ratio and can provide connections between pRONO2 and OA sources, it is much more labor-intensive and can lead to substantial biases if not explored and applied carefully.
A broad survey of nitrate apportionment shows a pervasive relationship of increasing (decreasing) pRONO2 relative contributions to nitrate with decreasing (increasing) total nitrate concentrations. These trends generally follow from urban-influenced to rural/remote regions. However, there are some clear differences in these trends between different sampling regions and conditions. Further investigation of the processes that control particle nitrate composition is required to understand the factors responsible for these observed trends and differences.
Previous studies reporting nitrate quantification using AMS ratios (or PMF using ions) have employed a range different approaches and assumptions, based on generally limited information. In some instances, likely substantial biases were present, and rarely has the accuracy of the results been considered. This investigation will help provide a more consistent, accurate, and transparent approach to the quantification and exploration of bulk particle-phase nitrates in the atmosphere with AMSs (and related instrumentation). Comparisons of this method to other instrumentation capable of quantifying bulk or speciated particle-phase organic nitrates, in the laboratory and field, should be an ongoing focus to help better constrain uncertainties, identify biases, and improve this method (and others).
The data for the NASA airborne campaigns are archived as follows: DC3 at https://doi.org/10.5067/Aircraft/DC3/DC8/Aerosol-TraceGas (NASA LaRC Airborne Science Data for Atmospheric Composition, 2022a), SEAC4RS at https://doi.org/10.5067/Aircraft/SEAC4RS/Aerosol-TraceGas-Cloud (NASA LaRC Airborne Science Data for Atmospheric Composition, 2022c), and KORUS-AQ at https://doi.org/10.5067/Suborbital/KORUSAQ/DATA01 (NASA LaRC Airborne Science Data for Atmospheric Composition, 2022b). Data for SOAS are archived at https://csl.noaa.gov/groups/csl7/measurements/2013senex/Ground/DataDownload/ (last access: 12 January 2022; NOAA, 2022), for BEACHON-RoMBAS at https://manitou.acom.ucar.edu/#data (last access: 12 January 2022; NCAR-ACOM, 2022a; https://doi.org/10.5065/D61V5CDP), for DAURE and SOAR (and also for AMS data from other ground-based campaigns) at https://sites.google.com/site/amsglobaldatabase (last access: 12 January 2022; Zhang et al., 2022, https://doi.org/10.6084/m9.figshare.3486719), for MILAGRO at https://data.eol.ucar.edu/dataset/93.117 (last access: 12 January 2022; NCAR-ACOM, 2022b), and for GoAmazon at https://www.arm.gov/research/campaigns/amf2014goamazon (last access: 12 January 2022; ARM user facility, 2022). All figures presented in the paper, and data used to construct them, are archived at http://cires1.colorado.edu/jimenez/group_pubs.html (last access: 12 January 2022; Jimenez-CIRES, 2022). Additional data used for or generated during intermediate stages of the analysis are archived on a data server at the University of Colorado and can be provided upon request by the corresponding authors.
The supplement related to this article is available online at: https://doi.org/10.5194/amt-15-459-2022-supplement.
DAD, PCJ, and JLJ designed the analysis, DAD, BAN, PCJ, and JLJ wrote the paper. All authors collected and analyzed data. All authors reviewed and provided comments on the paper.
The contact author has declared that neither they nor their co-authors have any competing interests.
This work has not been formally reviewed by the US EPA. The views expressed are solely those of the authors, and the US EPA does not endorse any products or commercial services mentioned in this work.
Publisher's note: Copernicus Publications remains neutral with regard to jurisdictional claims in published maps and institutional affiliations.
We thank John Crounse and Paul Wennberg (Caltech) for use of nitric acid measurements in Figs. S11 and S12.
This research has been supported by the National Aeronautics and Space Administration (grant nos. 80NSSC18K0630 and 80NSSC19K0124), the National Science Foundation (grant no. NSF AGS-1822664), the National Oceanic and Atmospheric Administration (grant no. NA18OAR4310113), and the U.S. Environmental Protection Agency STAR Graduate Fellowship (grant no. FP-91761701-0 to Brett B. Palm).
This paper was edited by Mingjin Tang and reviewed by two anonymous referees.
Aiken, A. C., Salcedo, D., Cubison, M. J., Huffman, J. A., DeCarlo, P. F., Ulbrich, I. M., Docherty, K. S., Sueper, D., Kimmel, J. R., Worsnop, D. R., Trimborn, A., Northway, M., Stone, E. A., Schauer, J. J., Volkamer, R. M., Fortner, E., de Foy, B., Wang, J., Laskin, A., Shutthanandan, V., Zheng, J., Zhang, R., Gaffney, J., Marley, N. A., Paredes-Miranda, G., Arnott, W. P., Molina, L. T., Sosa, G., and Jimenez, J. L.: Mexico City aerosol analysis during MILAGRO using high resolution aerosol mass spectrometry at the urban supersite (T0) – Part 1: Fine particle composition and organic source apportionment, Atmos. Chem. Phys., 9, 6633–6653, https://doi.org/10.5194/acp-9-6633-2009, 2009.
Alfarra, M. R.: Insights into atmospheric organic aerosols using an aerosol mass spectrometer, PhD thesis, University of Manchester Institute of Science and Technology, 2004.
Alfarra, M. R., Paulsen, D., Gysel, M., Garforth, A. A., Dommen, J., Prévôt, A. S. H., Worsnop, D. R., Baltensperger, U., and Coe, H.: A mass spectrometric study of secondary organic aerosols formed from the photooxidation of anthropogenic and biogenic precursors in a reaction chamber, Atmos. Chem. Phys., 6, 5279–5293, https://doi.org/10.5194/acp-6-5279-2006, 2006.
Allan, J. D., Bower, K. N., Coe, H., Boudries, H., Jayne, J. T., Canagaratna, M. R., Millet, D. B., Goldstein, A. H., Quinn, P. K., Weber, R. J., and Worsnop, D. R.: Submicron aerosol composition at Trinidad Head, California, during ITCT 2K2: Its relationship with gas phase volatile organic carbon and assessment of instrument performance, J. Geophys. Res., 109, D23S24, https://doi.org/10.1029/2003JD004208, 2004.
Allan, J. D., Alfarra, M. R., Bower, K. N., Coe, H., Jayne, J. T., Worsnop, D. R., Aalto, P. P., Kulmala, M., Hyötyläinen, T., Cavalli, F., and Laaksonen, A.: Size and composition measurements of background aerosol and new particle growth in a Finnish forest during QUEST 2 using an Aerodyne Aerosol Mass Spectrometer, Atmos. Chem. Phys., 6, 315–327, https://doi.org/10.5194/acp-6-315-2006, 2006.
ARM (Atmospheric Radiation Measurement) user facility: GoAmazon Campaign Data Sets, ARM Data Center [data set], available at: https://www.arm.gov/research/campaigns/amf2014goamazon, last access: 12 January 2022.
Avery, A. M., Waring, M. S., and DeCarlo, P. F.: Seasonal variation in aerosol composition and concentration upon transport from the outdoor to indoor environment, Environ. Sci.-Proc. Imp., 21, 528–547, https://doi.org/10.1039/c8em00471d, 2019.
Ayres, B. R., Allen, H. M., Draper, D. C., Brown, S. S., Wild, R. J., Jimenez, J. L., Day, D. A., Campuzano-Jost, P., Hu, W., de Gouw, J., Koss, A., Cohen, R. C., Duffey, K. C., Romer, P., Baumann, K., Edgerton, E., Takahama, S., Thornton, J. A., Lee, B. H. H., Lopez-Hilfiker, F. D., Mohr, C., Wennberg, P. O., Nguyen, T. B., Teng, A., Goldstein, A. H., Olson, K., and Fry, J. L.: Organic nitrate aerosol formation via NO3 + biogenic volatile organic compounds in the southeastern United States, Atmos. Chem. Phys., 15, 13377–13392, https://doi.org/10.5194/acp-15-13377-2015, 2015.
Bottenus, C. L. H. H., Massoli, P., Sueper, D., Canagaratna, M. R., VanderSchelden, G., Jobson, B. T., and Vanreken, T. M.: Identification of amines in wintertime ambient particulate material using high resolution aerosol mass spectrometry, Atmos. Environ., 180, 173–183, https://doi.org/10.1016/j.atmosenv.2018.01.044, 2018.
Boyd, C. M., Sanchez, J., Xu, L., Eugene, A. J., Nah, T., Tuet, W. Y., Guzman, M. I., and Ng, N. L.: Secondary organic aerosol formation from the β-pinene+NO3 system: effect of humidity and peroxy radical fate, Atmos. Chem. Phys., 15, 7497–7522, https://doi.org/10.5194/acp-15-7497-2015, 2015.
Brito, J., Freney, E., Dominutti, P., Borbon, A., Haslett, S. L., Batenburg, A. M., Colomb, A., Dupuy, R., Denjean, C., Burnet, F., Bourriane, T., Deroubaix, A., Sellegri, K., Borrmann, S., Coe, H., Flamant, C., Knippertz, P., and Schwarzenboeck, A.: Assessing the role of anthropogenic and biogenic sources on PM1 over southern West Africa using aircraft measurements, Atmos. Chem. Phys., 18, 757–772, https://doi.org/10.5194/acp-18-757-2018, 2018.
Brown, S. S., Dubé, W. P., Bahreini, R., Middlebrook, A. M., Brock, C. A., Warneke, C., de Gouw, J. A., Washenfelder, R. A., Atlas, E., Peischl, J., Ryerson, T. B., Holloway, J. S., Schwarz, J. P., Spackman, R., Trainer, M., Parrish, D. D., Fehshenfeld, F. C., and Ravishankara, A. R.: Biogenic VOC oxidation and organic aerosol formation in an urban nocturnal boundary layer: aircraft vertical profiles in Houston, TX, Atmos. Chem. Phys., 13, 11317–11337, https://doi.org/10.5194/acp-13-11317-2013, 2013.
Browne, E. C. and Cohen, R. C.: Effects of biogenic nitrate chemistry on the NOx lifetime in remote continental regions, Atmos. Chem. Phys., 12, 11917–11932, https://doi.org/10.5194/acp-12-11917-2012, 2012.
Bruns, E. A., Perraud, V., Zelenyuk, A., Ezell, M. J., Johnson, S. N., Yu, Y., Imre, D., Finlayson-Pitts, B. J., Alexander, M. L., Bruns, A. E., Perraud, V., Zelenyuk, A., Ezell, M. J., Johnson, S. N., Yu, Y., Imre, D., Finlayson-Pitts, B. J., and Alexander, M. L.: Comparison of FTIR and particle mass spectrometry for the measurement of particulate organic nitrates, Environ. Sci. Technol., 44, 1056–1061, https://doi.org/10.1021/es9029864, 2010.
Canagaratna, M. R., Jayne, J. T., Jimenez, J. L., Allan, J. D., Alfarra, M. R., Zhang, Q. Q., Onasch, T. B., Drewnick, F., Coe, H., Middlebrook, A. M., Delia, A., Williams, L. R., Trimborn, A. M., Northway, M. J., DeCarlo, P. F., Kolb, C. E., Davidovits, P., and Worsnop, D. R.: Chemical and microphysical characterization of ambient aerosols with the Aerodyne Aerosol Mass Spectrometer, Mass Spectrom. Rev., 26, 185–222, https://doi.org/10.1002/mas.20115, 2007.
Canonaco, F., Tobler, A., Chen, G., Sosedova, Y., Slowik, J. G., Bozzetti, C., Daellenbach, K. R., El Haddad, I., Crippa, M., Huang, R.-J., Furger, M., Baltensperger, U., and Prévôt, A. S. H.: A new method for long-term source apportionment with time-dependent factor profiles and uncertainty assessment using SoFi Pro: application to 1 year of organic aerosol data, Atmos. Meas. Tech., 14, 923–943, https://doi.org/10.5194/amt-14-923-2021, 2021.
Cappa, C. D., Lim, C. Y., Hagan, D. H., Coggon, M., Koss, A., Sekimoto, K., de Gouw, J., Onasch, T. B., Warneke, C., and Kroll, J. H.: Biomass-burning-derived particles from a wide variety of fuels – Part 2: Effects of photochemical aging on particle optical and chemical properties, Atmos. Chem. Phys., 20, 8511–8532, https://doi.org/10.5194/acp-20-8511-2020, 2020.
Chen, W., Ye, Y., Hu, W., Zhou, H., Pan, T., Wang, Y., Song, W., Song, Q., Ye, C., Wang, C., Wang, B., Huang, S., Yuan, B., Zhu, M., Lian, X., Zhang, G., Bi, X., Jiang, F., Liu, J., Canonaco, F., Prevot, A. S. H., Shao, M., and Wang, X.: Real-time characterization of aerosol compositions, sources and aging processes in Guangzhou during PRIDE-GBA 2018 campaign, J. Geophys. Res.-Atmos., 126, e2021JD035114, https://doi.org/10.1029/2021jd035114, 2021.
Chen, Y., Takeuchi, M., Nah, T., Xu, L., Canagaratna, M. R., Stark, H., Baumann, K., Canonaco, F., Prévôt, A. S. H., Huey, L. G., Weber, R. J., and Ng, N. L.: Chemical characterization of secondary organic aerosol at a rural site in the southeastern US: insights from simultaneous high-resolution time-of-flight aerosol mass spectrometer (HR-ToF-AMS) and FIGAERO chemical ionization mass spectrometer (CIMS) measurements, Atmos. Chem. Phys., 20, 8421–8440, https://doi.org/10.5194/acp-20-8421-2020, 2020.
Cubison, M. J., Ortega, A. M., Hayes, P. L., Farmer, D. K., Day, D., Lechner, M. J., Brune, W. H., Apel, E., Diskin, G. S., Fisher, J. A., Fuelberg, H. E., Hecobian, A., Knapp, D. J., Mikoviny, T., Riemer, D., Sachse, G. W., Sessions, W., Weber, R. J., Weinheimer, A. J., Wisthaler, A., and Jimenez, J. L.: Effects of aging on organic aerosol from open biomass burning smoke in aircraft and laboratory studies, Atmos. Chem. Phys., 11, 12049–12064, https://doi.org/10.5194/acp-11-12049-2011, 2011.
Dai, Q., Schulze, B. C., Bi, X., Bui, A. A. T., Guo, F., Wallace, H. W., Sanchez, N. P., Flynn, J. H., Lefer, B. L., Feng, Y., and Griffin, R. J.: Seasonal differences in formation processes of oxidized organic aerosol near Houston, TX, Atmos. Chem. Phys., 19, 9641–9661, https://doi.org/10.5194/acp-19-9641-2019, 2019.
Day, D. A., Wooldridge, P. J., Dillon, M. B., Thornton, J. A., and Cohen, R. C.: A thermal dissociation laser-induced fluorescence instrument for in situ detection of NO2, peroxy nitrates, alkyl nitrates, and HNO3, J. Geophys. Res., 107, 4046–4046, https://doi.org/10.1029/2001JD000779, 2002.
de Sá, S. S., Palm, B. B., Campuzano-Jost, P., Day, D. A., Hu, W., Isaacman-VanWertz, G., Yee, L. D., Brito, J., Carbone, S., Ribeiro, I. O., Cirino, G. G., Liu, Y., Thalman, R., Sedlacek, A., Funk, A., Schumacher, C., Shilling, J. E., Schneider, J., Artaxo, P., Goldstein, A. H., Souza, R. A. F., Wang, J., McKinney, K. A., Barbosa, H., Alexander, M. L., Jimenez, J. L., and Martin, S. T.: Urban influence on the concentration and composition of submicron particulate matter in central Amazonia, Atmos. Chem. Phys., 18, 12185–12206, https://doi.org/10.5194/acp-18-12185-2018, 2018.
de Sá, S. S., Rizzo, L. V., Palm, B. B., Campuzano-Jost, P., Day, D. A., Yee, L. D., Wernis, R., Isaacman-VanWertz, G., Brito, J., Carbone, S., Liu, Y. J., Sedlacek, A., Springston, S., Goldstein, A. H., Barbosa, H. M. J., Alexander, M. L., Artaxo, P., Jimenez, J. L., and Martin, S. T.: Contributions of biomass-burning, urban, and biogenic emissions to the concentrations and light-absorbing properties of particulate matter in central Amazonia during the dry season, Atmos. Chem. Phys., 19, 7973–8001, https://doi.org/10.5194/acp-19-7973-2019, 2019.
Docherty, K. S., Aiken, A. C., Huffman, J. A., Ulbrich, I. M., DeCarlo, P. F., Sueper, D., Worsnop, D. R., Snyder, D. C., Peltier, R. E., Weber, R. J., Grover, B. D., Eatough, D. J., Williams, B. J., Goldstein, A. H., Ziemann, P. J., and Jimenez, J. L.: The 2005 Study of Organic Aerosols at Riverside (SOAR-1): instrumental intercomparisons and fine particle composition, Atmos. Chem. Phys., 11, 12387–12420, https://doi.org/10.5194/acp-11-12387-2011, 2011.
Docherty, K. S., Lewandowski, M., and Jimenez, J. L.: Effect of Vaporizer Temperature on Ambient Non-Refractory Submicron Aerosol Composition and Mass Spectra Measured by the Aerosol Mass Spectrometer, Aerosol Sci. Tech., 49, 485–494, https://doi.org/10.1080/02786826.2015.1042100, 2015.
Drewnick, F., Hings, S. S., Alfarra, M. R., Prevot, A. S. H., and Borrmann, S.: Aerosol quantification with the Aerodyne Aerosol Mass Spectrometer: detection limits and ionizer background effects, Atmos. Meas. Tech., 2, 33–46, https://doi.org/10.5194/amt-2-33-2009, 2009.
Drewnick, F., Diesch, J.-M., Faber, P., and Borrmann, S.: Aerosol mass spectrometry: particle–vaporizer interactions and their consequences for the measurements, Atmos. Meas. Tech., 8, 3811–3830, https://doi.org/10.5194/amt-8-3811-2015, 2015.
Farmer, D. K., Matsunaga, A., Docherty, K. S., Surratt, J. D., Seinfeld, J. H., Ziemann, P. J., and Jimenez, J. L.: Response of an aerosol mass spectrometer to organonitrates and organosulfates and implications for atmospheric chemistry, P. Natl. Acad. Sci. USA, 107, 6670–6675, https://doi.org/10.1073/pnas.0912340107, 2010.
Fisher, J. A., Jacob, D. J., Travis, K. R., Kim, P. S., Marais, E. A., Chan Miller, C., Yu, K., Zhu, L., Yantosca, R. M., Sulprizio, M. P., Mao, J., Wennberg, P. O., Crounse, J. D., Teng, A. P., Nguyen, T. B., St. Clair, J. M., Cohen, R. C., Romer, P., Nault, B. A., Wooldridge, P. J., Jimenez, J. L., Campuzano-Jost, P., Day, D. A., Hu, W., Shepson, P. B., Xiong, F., Blake, D. R., Goldstein, A. H., Misztal, P. K., Hanisco, T. F., Wolfe, G. M., Ryerson, T. B., Wisthaler, A., and Mikoviny, T.: Organic nitrate chemistry and its implications for nitrogen budgets in an isoprene- and monoterpene-rich atmosphere: constraints from aircraft (SEAC4RS) and ground-based (SOAS) observations in the Southeast US, Atmos. Chem. Phys., 16, 5969–5991, https://doi.org/10.5194/acp-16-5969-2016, 2016.
Florou, K., Papanastasiou, D. K., Pikridas, M., Kaltsonoudis, C., Louvaris, E., Gkatzelis, G. I., Patoulias, D., Mihalopoulos, N., and Pandis, S. N.: The contribution of wood burning and other pollution sources to wintertime organic aerosol levels in two Greek cities, Atmos. Chem. Phys., 17, 3145–3163, https://doi.org/10.5194/acp-17-3145-2017, 2017.
Fröhlich, R., Cubison, M. J., Slowik, J. G., Bukowiecki, N., Prévôt, A. S. H., Baltensperger, U., Schneider, J., Kimmel, J. R., Gonin, M., Rohner, U., Worsnop, D. R., and Jayne, J. T.: The ToF-ACSM: a portable aerosol chemical speciation monitor with TOFMS detection, Atmos. Meas. Tech., 6, 3225–3241, https://doi.org/10.5194/amt-6-3225-2013, 2013.
Fry, J. L., Kiendler-Scharr, A., Rollins, A. W., Wooldridge, P. J., Brown, S. S., Fuchs, H., Dubé, W., Mensah, A., dal Maso, M., Tillmann, R., Dorn, H.-P., Brauers, T., and Cohen, R. C.: Organic nitrate and secondary organic aerosol yield from NO3 oxidation of β-pinene evaluated using a gas-phase kinetics/aerosol partitioning model, Atmos. Chem. Phys., 9, 1431–1449, https://doi.org/10.5194/acp-9-1431-2009, 2009.
Fry, J. L., Draper, D. C., Zarzana, K. J., Campuzano-Jost, P., Day, D. A., Jimenez, J. L., Brown, S. S., Cohen, R. C., Kaser, L., Hansel, A., Cappellin, L., Karl, T., Hodzic Roux, A., Turnipseed, A., Cantrell, C., Lefer, B. L., and Grossberg, N.: Observations of gas- and aerosol-phase organic nitrates at BEACHON-RoMBAS 2011, Atmos. Chem. Phys., 13, 8585–8605, https://doi.org/10.5194/acp-13-8585-2013, 2013.
Fry, J. L., Brown, S. S., Middlebrook, A. M., Edwards, P. M., Campuzano-Jost, P., Day, D. A., Jimenez, J. L., Allen, H. M., Ryerson, T. B., Pollack, I., Graus, M., Warneke, C., de Gouw, J. A., Brock, C. A., Gilman, J., Lerner, B. M., Dubé, W. P., Liao, J., and Welti, A.: Secondary organic aerosol (SOA) yields from NO3 radical + isoprene based on nighttime aircraft power plant plume transects, Atmos. Chem. Phys., 18, 11663–11682, https://doi.org/10.5194/acp-18-11663-2018, 2018.
Häkkinen, S. A. K., Äijälä, M., Lehtipalo, K., Junninen, H., Backman, J., Virkkula, A., Nieminen, T., Vestenius, M., Hakola, H., Ehn, M., Worsnop, D. R., Kulmala, M., Petäjä, T., and Riipinen, I.: Long-term volatility measurements of submicron atmospheric aerosol in Hyytiälä, Finland, Atmos. Chem. Phys., 12, 10771–10786, https://doi.org/10.5194/acp-12-10771-2012, 2012.
Hao, L. Q., Kortelainen, A., Romakkaniemi, S., Portin, H., Jaatinen, A., Leskinen, A., Komppula, M., Miettinen, P., Sueper, D., Pajunoja, A., Smith, J. N., Lehtinen, K. E. J., Worsnop, D. R., Laaksonen, A., and Virtanen, A.: Atmospheric submicron aerosol composition and particulate organic nitrate formation in a boreal forestland–urban mixed region, Atmos. Chem. Phys., 14, 13483–13495, https://doi.org/10.5194/acp-14-13483-2014, 2014.
Hogrefe, O., Schwab, J. J., Drewnick, F., Lala, G. G., Peters, S., Demerjian, K. L., Rhoads, K., Felton, H. D., Rattigan, O. V., Husain, L., and Dutkiewicz, V. A.: Semicontinuous PM2.5 sulfate and nitrate measurements at an urban and a rural location in New York: PMTACS-NY summer 2001 and 2002 campaigns, J. Air Waste Manage., 54, 1040–1060, https://doi.org/10.1080/10473289.2004.10470972, 2004.
Hu, W., Palm, B. B., Day, D. A., Campuzano-Jost, P., Krechmer, J. E., Peng, Z., de Sá, S. S., Martin, S. T., Alexander, M. L., Baumann, K., Hacker, L., Kiendler-Scharr, A., Koss, A. R., de Gouw, J. A., Goldstein, A. H., Seco, R., Sjostedt, S. J., Park, J.-H., Guenther, A. B., Kim, S., Canonaco, F., Prévôt, A. S. H., Brune, W. H., and Jimenez, J. L.: Volatility and lifetime against OH heterogeneous reaction of ambient isoprene-epoxydiols-derived secondary organic aerosol (IEPOX-SOA), Atmos. Chem. Phys., 16, 11563–11580, https://doi.org/10.5194/acp-16-11563-2016, 2016.
Hu, W., Campuzano-jost, P., Day, D. A., Croteau, P., Canagaratna, R., Jayne, J. T., Worsnop, D. R., Jimenez, J. L., Hu, W., Campuzano-jost, P., Day, D. A., Croteau, P., Canagaratna, R., Jayne, J. T., Worsnop, D. R., and Jimenez, J. L.: Evaluation of the new capture vaporizer for aerosol mass spectrometers (AMS) through field studies of inorganic species, Aerosol Sci. Tech., 51, 735–754, https://doi.org/10.1080/02786826.2017.1296104, 2017a.
Hu, W., Campuzano-Jost, P., Day, D. A., Croteau, P., Canagaratna, M. R., Jayne, J. T., Worsnop, D. R., and Jimenez, J. L.: Evaluation of the new capture vapourizer for aerosol mass spectrometers (AMS) through laboratory studies of inorganic species, Atmos. Meas. Tech., 10, 2897–2921, https://doi.org/10.5194/amt-10-2897-2017, 2017b.
Huang, W., Saathoff, H., Shen, X., Ramisetty, R., Leisner, T., and Mohr, C.: Chemical Characterization of Highly Functionalized Organonitrates Contributing to Night-time Organic Aerosol Mass Loadings and Particle Growth, Environ. Sci. Technol., 53, 1165–1174, https://doi.org/10.1021/acs.est.8b05826, 2019a.
Huang, W., Saathoff, H., Shen, X., Ramisetty, R., Leisner, T., and Mohr, C.: Seasonal characteristics of organic aerosol chemical composition and volatility in Stuttgart, Germany, Atmos. Chem. Phys., 19, 11687–11700, https://doi.org/10.5194/acp-19-11687-2019, 2019b.
Jayne, J. T., Croteau, P. L., Lambe, A. T., Xu, W., Onasch, T. B., Wolff, L., and Canagaratna, M. R.: Investigation of f44 variability in AMS and ACSM instruments, in: 16th Aerosol Mass Spectrometer Users' Meeting, Milan, Italy, 12 September 2015, available at: http://cires1.colorado.edu/jimenez-group/UsrMtgs/UsersMtg16/Jayne_f44Intro.pdf (last access: 2 December 2021), 2015.
Jayne, J. T., Leard, D. C., Zhang, X. F., Davidovits, P., Smith, K. A., Kolb, C. E., and Worsnop, D. R.: Development of an aerosol mass spectrometer for size and composition analysis of submicron particles, Aerosol Sci. Tech., 33, 49–70, https://doi.org/10.1080/027868200410840, 2000.
Jimenez, J. L., Jayne, J. T., Shi, Q., Kolb, C. E., Worsnop, D. R., Yourshaw, I., Seinfeld, J. H., Flagan, R. C., Zhang, X. F., Smith, K. A., Morris, J. W., and Davidovits, P.: Ambient aerosol sampling using the Aerodyne Aerosol Mass Spectrometer, J. Geophys. Res., 108, 8425–8425, https://doi.org/10.1029/2001JD001213, 2003.
Jimenez, J. L., Canagaratna, M. R., Drewnick, F., Allan, J. D., Alfarra, M. R., Middlebrook, A. M., Slowik, J. G., Zhang, Q., Coe, H., Jayne, J. T., and Worsnop, D. R.: Comment on “The effects of molecular weight and thermal decomposition on the sensitivity of a thermal desorption aerosol mass spectrometer”, Aerosol Sci. Tech., 50, i–xv, https://doi.org/10.1080/02786826.2016.1205728, 2016.
Jimenez-CIRES (Jimenez Group – CIRES Server): Jimenez Group Peer-Reviewed Journal Publications, available at: http://cires1.colorado.edu/jimenez/group_pubs.html, last access: 12 January 2022.
Kiendler-Scharr, A., Mensah, A. A., Friese, E., Topping, D., Nemitz, E., Prevot, A. S. H., Äijälä, M., Allan, J., Canonaco, F., Canagaratna, M., Carbone, S., Crippa, M., Dall Osto, M., Day, D. A., DeCarlo, P., Di Marco, C. F., Elbern, H., Eriksson, A., Freney, E., Hao, L., Herrmann, H., Hildebrandt, L., Hillamo, R., Jimenez, J. L., Laaksonen, A., McFiggans, G., Mohr, C., O'Dowd, C., Otjes, R., Ovadnevaite, J., Pandis, S. N., Poulain, L., Schlag, P., Sellegri, K., Swietlicki, E., Tiitta, P., Vermeulen, A., Wahner, A., Worsnop, D., and Wu, H.-C.: Organic nitrates from night-time chemistry are ubiquitous in the European submicron aerosol, Geophys. Res. Lett., 43, 7735–7744, https://doi.org/10.1002/2016GL069239, 2016.
Kim, H., Zhang, Q., and Heo, J.: Influence of intense secondary aerosol formation and long-range transport on aerosol chemistry and properties in the Seoul Metropolitan Area during spring time: results from KORUS-AQ, Atmos. Chem. Phys., 18, 7149–7168, https://doi.org/10.5194/acp-18-7149-2018, 2018.
Kortelainen, A., Hao, L., Tiitta, P., Jaatinen, A., Miettinen, P., Kulmala, M., Smith, J. N., Laaksonen, A., Worsnop, D. R., and Virtanen, A.: Sources of particulate organic nitrates in the boreal forest in Finland, Boreal Environ. Res., 22, 13–26, available at: http://www.borenv.net/BER/archive/ber221-6.htm (last access: 12 January 2022), 2017.
Kostenidou, E., Florou, K., Kaltsonoudis, C., Tsiflikiotou, M., Vratolis, S., Eleftheriadis, K., and Pandis, S. N.: Sources and chemical characterization of organic aerosol during the summer in the eastern Mediterranean, Atmos. Chem. Phys., 15, 11355–11371, https://doi.org/10.5194/acp-15-11355-2015, 2015.
Lee, A. K. Y., Adam, M. G., Liggio, J., Li, S.-M., Li, K., Willis, M. D., Abbatt, J. P. D., Tokarek, T. W., Odame-Ankrah, C. A., Osthoff, H. D., Strawbridge, K., and Brook, J. R.: A large contribution of anthropogenic organo-nitrates to secondary organic aerosol in the Alberta oil sands, Atmos. Chem. Phys., 19, 12209–12219, https://doi.org/10.5194/acp-19-12209-2019, 2019.
Lee, B. H., Mohr, C., Lopez-Hilfiker, F. D., Lutz, A., Hallquist, M., Lee, L., Romer, P., Cohen, R. C., Iyer, S., Kurtén, T., Hu, W., Day, D. A., Campuzano-Jost, P., Jimenez, J. L., Xu, L., Ng, N. L., Guo, H., Weber, R. J., Wild, R. J., Brown, S. S., Koss, A., de Gouw, J., Olson, K., Goldstein, A. H., Seco, R., Kim, S., McAvey, K., Shepson, P. B., Starn, T., Baumann, K., Edgerton, E. S., Liu, J., Shilling, J. E., Miller, D. O., Brune, W., Schobesberger, S., D'Ambro, E. L., and Thornton, J. A.: Highly functionalized organic nitrates in the southeast U. S.: Contribution to secondary organic aerosol and reactive nitrogen budgets, P. Natl. Acad. Sci. USA, 113, 1516–1521, https://doi.org/10.1073/pnas.1508108113, 2016.
Lin, C., Huang, R.-J., Duan, J., Zhong, H., and Xu, W.: Primary and Secondary Organic Nitrate in Northwest China: A Case Study, Environ. Sci. Technol. Lett., 8, 947–953, https://doi.org/10.1021/acs.estlett.1c00692, 2021.
Lopez-Hilfiker, F. D., Mohr, C., Ehn, M., Rubach, F., Kleist, E., Wildt, J., Mentel, Th. F., Lutz, A., Hallquist, M., Worsnop, D., and Thornton, J. A.: A novel method for online analysis of gas and particle composition: description and evaluation of a Filter Inlet for Gases and AEROsols (FIGAERO), Atmos. Meas. Tech., 7, 983–1001, https://doi.org/10.5194/amt-7-983-2014, 2014.
Marcolli, C., Canagaratna, M. R., Worsnop, D. R., Bahreini, R., de Gouw, J. A., Warneke, C., Goldan, P. D., Kuster, W. C., Williams, E. J., Lerner, B. M., Roberts, J. M., Meagher, J. F., Fehsenfeld, F. C., Marchewka, M., Bertman, S. B., and Middlebrook, A. M.: Cluster Analysis of the Organic Peaks in Bulk Mass Spectra Obtained During the 2002 New England Air Quality Study with an Aerodyne Aerosol Mass Spectrometer, Atmos. Chem. Phys., 6, 5649–5666, https://doi.org/10.5194/acp-6-5649-2006, 2006.
Maria, S. F., Russell, L. M., Turpin, B. J., and Porcja, R. J.: FTIR measurements of functional groups and organic mass in aerosol samples over the Caribbean, Atmos. Environ., 36, 5185–5196, https://doi.org/10.1016/S1352-2310(02)00654-4, 2002.
McClure, C. D., Lim, C. Y., Hagan, D. H., Kroll, J. H., and Cappa, C. D.: Biomass-burning-derived particles from a wide variety of fuels – Part 1: Properties of primary particles, Atmos. Chem. Phys., 20, 1531–1547, https://doi.org/10.5194/acp-20-1531-2020, 2020.
Minguillón, M. C., Perron, N., Querol, X., Szidat, S., Fahrni, S. M., Alastuey, A., Jimenez, J. L., Mohr, C., Ortega, A. M., Day, D. A., Lanz, V. A., Wacker, L., Reche, C., Cusack, M., Amato, F., Kiss, G., Hoffer, A., Decesari, S., Moretti, F., Hillamo, R., Teinilä, K., Seco, R., Peñuelas, J., Metzger, A., Schallhart, S., Müller, M., Hansel, A., Burkhart, J. F., Baltensperger, U., and Prévôt, A. S. H.: Fossil versus contemporary sources of fine elemental and organic carbonaceous particulate matter during the DAURE campaign in Northeast Spain, Atmos. Chem. Phys., 11, 12067–12084, https://doi.org/10.5194/acp-11-12067-2011, 2011.
NASA LaRC Airborne Science Data for Atmospheric Composition: DC3 – Deep Convective Clouds & Chemistry, NASA LaRC [data set], https://doi.org/10.5067/Aircraft/DC3/DC8/Aerosol-TraceGas, 2022a.
NASA LaRC Airborne Science Data for Atmospheric Composition: KORUS-AQ – An International Cooperative Air Quality Field Study in Korea, NASA LaRC [data set], https://doi.org/10.5067/Suborbital/KORUSAQ/DATA01, 2022b.
NASA LaRC Airborne Science Data for Atmospheric Composition: SEAC4RS – Studies of Emissions and Atmospheric Composition, Clouds and Climate Coupling by Regional Surveys, NASA LaRC [data set], https://doi.org/10.5067/Aircraft/SEAC4RS/Aerosol-TraceGas-Cloud, 2022c.
Nault, B. A., Garland, C., Wooldridge, P. J., Brune, W. H., Campuzano-Jost, P., Crounse, J. D., Day, D. A., Dibb, J., Hall, S. R., Huey, L. G., Jimenez, J. L., Liu, X., Mao, J., Mikoviny, T., Peischl, J., Pollack, I. B., Ren, X., Ryerson, T. B., Scheuer, E., Ullmann, K., Wennberg, P. O., Wisthaler, A., Zhang, L., and Cohen, R. C.: Observational Constraints on the Oxidation of NOx in the Upper Troposphere, J. Phys. Chem. A, 120, 1468–1478, https://doi.org/10.1021/acs.jpca.5b07824, 2016.
Nault, B. A., Campuzano-Jost, P., Day, D. A., Schroder, J. C., Anderson, B., Beyersdorf, A. J., Blake, D. R., Brune, W. H., Choi, Y., Corr, C. A., de Gouw, J. A., Dibb, J., DiGangi, J. P., Diskin, G. S., Fried, A., Huey, L. G., Kim, M. J., Knote, C. J., Lamb, K. D., Lee, T., Park, T., Pusede, S. E., Scheuer, E., Thornhill, K. L., Woo, J.-H., and Jimenez, J. L.: Secondary organic aerosol production from local emissions dominates the organic aerosol budget over Seoul, South Korea, during KORUS-AQ, Atmos. Chem. Phys., 18, 17769–17800, https://doi.org/10.5194/acp-18-17769-2018, 2018.
Nault, B. A., Campuzano-Jost, P., Day, D. A., Jo, D. S., Schroder, J. C., Allen, H. M., Bahreini, R., Bian, H., Blake, D. R., Chin, M., Clegg, S. L., Colarco, P., Crounse, J., Cubison, M. J., DeCarlo, P. F., Dibb, J., Diskin, G. S., Hodzic, A., Hu, W., Katich, J. M., Kim, M. J., Kodros, J., Kupc, A., Lopez-Hilfiker, F. D., Marais, E. A., Middlebrook, A., Neuman, J. A., Nowak, J. B., Palm, B. B., Paulot, F., Pierce, J., Schill, G. P., Scheuer, E., Thornton, J. A., Tsigaridis, P. R., Wennberg, P. O., Williamson, C. J., and Jimenez, J. L.: Models underestimate the increase of acidity with remoteness biasing radiative impact calculations, Communications Earth & Environment, 2, 93, https://doi.org/10.1038/s43247-021-00164-0, 2021.
NCAR-ACOM (National Center for Atmospheric Research Atmospheric Chemistry Observations and Modeling): Manitou Experimental Forest Observatory Field Site, NCAR-ACOM, [data set], https://doi.org/10.5065/D61V5CDP, 2022a.
NCAR-ACOM (National Center for Atmospheric Research Atmospheric Chemistry Observations and Modeling): T0 Ambient Non-Refractory Submicron Aerosol Composition, NCAR-ACOM, [data set], available at: https://data.eol.ucar.edu/dataset/93.117, last access: 12 January 2022b.
Ng, N. L., Herndon, S. C., Trimborn, A., Canagaratna, M. R., Croteau, P. L., Onasch, T. B., Sueper, D., Worsnop, D. R., Zhang, Q., Sun, Y. L., and Jayne, J. T.: An Aerosol Chemical Speciation Monitor (ACSM) for Routine Monitoring of the Composition and Mass Concentrations of Ambient Aerosol, Aerosol Sci. Tech., 45, 780–794, https://doi.org/10.1080/02786826.2011.560211, 2011.
Ng, N. L., Brown, S. S., Archibald, A. T., Atlas, E., Cohen, R. C., Crowley, J. N., Day, D. A., Donahue, N. M., Fry, J. L., Fuchs, H., Griffin, R. J., Guzman, M. I., Herrmann, H., Hodzic, A., Iinuma, Y., Jimenez, J. L., Kiendler-Scharr, A., Lee, B. H., Luecken, D. J., Mao, J., McLaren, R., Mutzel, A., Osthoff, H. D., Ouyang, B., Picquet-Varrault, B., Platt, U., Pye, H. O. T., Rudich, Y., Schwantes, R. H., Shiraiwa, M., Stutz, J., Thornton, J. A., Tilgner, A., Williams, B. J., and Zaveri, R. A.: Nitrate radicals and biogenic volatile organic compounds: oxidation, mechanisms, and organic aerosol, Atmos. Chem. Phys., 17, 2103–2162, https://doi.org/10.5194/acp-17-2103-2017, 2017.
NOAA: SOAS 2013 Centreville Site Data Download, NOAA ESRL [data set], available at: https://csl.noaa.gov/groups/csl7/measurements/2013senex/Ground/DataDownload, last access: 12 January 2022.
Pagonis, D., Campuzano-Jost, P., Guo, H., Day, D. A., Schueneman, M. K., Brown, W. L., Nault, B. A., Stark, H., Siemens, K., Laskin, A., Piel, F., Tomsche, L., Wisthaler, A., Coggon, M. M., Gkatzelis, G. I., Halliday, H. S., Krechmer, J. E., Moore, R. H., Thomson, D. S., Warneke, C., Wiggins, E. B., and Jimenez, J. L.: Airborne extractive electrospray mass spectrometry measurements of the chemical composition of organic aerosol, Atmos. Meas. Tech., 14, 1545–1559, https://doi.org/10.5194/amt-14-1545-2021, 2021.
Palm, B. B., Campuzano-Jost, P., Day, D. A., Ortega, A. M., Fry, J. L., Brown, S. S., Zarzana, K. J., Dube, W., Wagner, N. L., Draper, D. C., Kaser, L., Jud, W., Karl, T., Hansel, A., Gutiérrez-Montes, C., and Jimenez, J. L.: Secondary organic aerosol formation from in situ OH, O3, and NO3 oxidation of ambient forest air in an oxidation flow reactor, Atmos. Chem. Phys., 17, 5331–5354, https://doi.org/10.5194/acp-17-5331-2017, 2017.
Perring, A. E., Bertram, T. H., Wooldridge, P. J., Fried, A., Heikes, B. G., Dibb, J., Crounse, J. D., Wennberg, P. O., Blake, N. J., Blake, D. R., Brune, W. H., Singh, H. B., and Cohen, R. C.: Airborne observations of total RONO2: new constraints on the yield and lifetime of isoprene nitrates, Atmos. Chem. Phys., 9, 1451–1463, https://doi.org/10.5194/acp-9-1451-2009, 2009.
Pullinen, I., Schmitt, S., Kang, S., Sarrafzadeh, M., Schlag, P., Andres, S., Kleist, E., Mentel, T. F., Rohrer, F., Springer, M., Tillmann, R., Wildt, J., Wu, C., Zhao, D., Wahner, A., and Kiendler-Scharr, A.: Impact of NOx on secondary organic aerosol (SOA) formation from α-pinene and β-pinene photooxidation: the role of highly oxygenated organic nitrates, Atmos. Chem. Phys., 20, 10125–10147, https://doi.org/10.5194/acp-20-10125-2020, 2020.
Pye, H. O. T., Luecken, D. J., Xu, L., Boyd, C. M., Ng, N. L., Baker, K. R., Ayres, B. R., Bash, J. O., Baumann, K., Carter, W. P. L., Edgerton, E. S., Fry, J. L., Hutzell, W. T., Schwede, D. B., and Shepson, P. B.: Modeling the current and future roles of particulate organic nitrates in the southeastern United States, Environ. Sci. Technol., 49, 14195–14203, https://doi.org/10.1021/acs.est.5b03738, 2015.
Reyes-Villegas, E., Priestley, M., Ting, Y.-C., Haslett, S., Bannan, T., Le Breton, M., Williams, P. I., Bacak, A., Flynn, M. J., Coe, H., Percival, C., and Allan, J. D.: Simultaneous aerosol mass spectrometry and chemical ionisation mass spectrometry measurements during a biomass burning event in the UK: insights into nitrate chemistry, Atmos. Chem. Phys., 18, 4093–4111, https://doi.org/10.5194/acp-18-4093-2018, 2018.
Rollins, A. W., Kiendler-Scharr, A., Fry, J. L., Brauers, T., Brown, S. S., Dorn, H.-P., Dubé, W. P., Fuchs, H., Mensah, A., Mentel, T. F., Rohrer, F., Tillmann, R., Wegener, R., Wooldridge, P. J., and Cohen, R. C.: Isoprene oxidation by nitrate radical: alkyl nitrate and secondary organic aerosol yields, Atmos. Chem. Phys., 9, 6685–6703, https://doi.org/10.5194/acp-9-6685-2009, 2009.
Rollins, A. W., Pusede, S., Wooldridge, P., Min, K.-E., Gentner, D. R., Goldstein, A. H., Liu, S., Day, D. A., Russell, L. M., Rubitschun, C. L., Surratt, J. D., and Cohen, R. C.: Gas/particle partitioning of total alkyl nitrates observed with TD-LIF in Bakersfield, J. Geophys. Res.-Atmos., 118, 6651–6662, https://doi.org/10.1002/jgrd.50522, 2013.
Romer, P. S.: Chemical removal of nitrogen oxides from the atmosphere: Impacts on air quality and effects of temperature, PhD thesis, University of California, Berkeley, available at: http://digitalassets.lib.berkeley.edu/etd/ucb/text/Romer_berkeley_0028E_18182.pdf (last access: 2 December 2021), 2018.
Saleh, R., Robinson, E. S., Ahern, A. T., Donahue, N. M., Saleh, R., Robinson, E. S., Ahern, A. T., and Donahue, N. M.: Evaporation rate of particles in the vaporizer of the Aerodyne aerosol mass spectrometer, Aerosol Sci. Tech., 51, 501–508, https://doi.org/10.1080/02786826.2016.1271109, 2017.
Schneider, J., Mertes, S., van Pinxteren, D., Herrmann, H., and Borrmann, S.: Uptake of nitric acid, ammonia, and organics in orographic clouds: mass spectrometric analyses of droplet residual and interstitial aerosol particles, Atmos. Chem. Phys., 17, 1571–1593, https://doi.org/10.5194/acp-17-1571-2017, 2017.
Schroder, J. C., Campuzano-Jost, P., Day, D. A., Shah, V., Larson, K., Sommers, J. M., Sullivan, A. P., Campos, T., Reeves, J. M., Hills, A., Hornbrook, R. S., Blake, N. J., Scheuer, E., Guo, H., Fibiger, D. L., McDuffie, E. E., Hayes, P. L., Weber, R. J., Dibb, J. E., Apel, E. C., Jaeglé, L., Brown, S. S., Thornton, J. A., and Jimenez, J. L.: Sources and Secondary Production of Organic Aerosols in the Northeastern United States during WINTER, J. Geophys. Res.-Atmos., 123, 7771–7796, https://doi.org/10.1029/2018JD028475, 2018.
Schueneman, M. K., Nault, B. A., Campuzano-Jost, P., Jo, D. S., Day, D. A., Schroder, J. C., Palm, B. B., Hodzic, A., Dibb, J. E., and Jimenez, J. L.: Aerosol pH indicator and organosulfate detectability from aerosol mass spectrometry measurements, Atmos. Meas. Tech., 14, 2237–2260, https://doi.org/10.5194/amt-14-2237-2021, 2021.
Schulz, C., Schneider, J., Amorim Holanda, B., Appel, O., Costa, A., de Sá, S. S., Dreiling, V., Fütterer, D., Jurkat-Witschas, T., Klimach, T., Knote, C., Krämer, M., Martin, S. T., Mertes, S., Pöhlker, M. L., Sauer, D., Voigt, C., Walser, A., Weinzierl, B., Ziereis, H., Zöger, M., Andreae, M. O., Artaxo, P., Machado, L. A. T., Pöschl, U., Wendisch, M., and Borrmann, S.: Aircraft-based observations of isoprene-epoxydiol-derived secondary organic aerosol (IEPOX-SOA) in the tropical upper troposphere over the Amazon region, Atmos. Chem. Phys., 18, 14979–15001, https://doi.org/10.5194/acp-18-14979-2018, 2018.
Setyan, A., Zhang, Q., Merkel, M., Knighton, W. B., Sun, Y., Song, C., Shilling, J. E., Onasch, T. B., Herndon, S. C., Worsnop, D. R., Fast, J. D., Zaveri, R. A., Berg, L. K., Wiedensohler, A., Flowers, B. A., Dubey, M. K., and Subramanian, R.: Characterization of submicron particles influenced by mixed biogenic and anthropogenic emissions using high-resolution aerosol mass spectrometry: results from CARES, Atmos. Chem. Phys., 12, 8131–8156, https://doi.org/10.5194/acp-12-8131-2012, 2012.
Sun, Y. L., Zhang, Q., Schwab, J. J., Yang, T., Ng, N. L., and Demerjian, K. L.: Factor analysis of combined organic and inorganic aerosol mass spectra from high resolution aerosol mass spectrometer measurements, Atmos. Chem. Phys., 12, 8537–8551, https://doi.org/10.5194/acp-12-8537-2012, 2012.
Surratt, J. D., Murphy, S. M., Kroll, J. H., Ng, N. L., Hildebrandt, L., Sorooshian, A., Szmigielski, R., Vermeylen, R., Maenhaut, W., Claeys, M., Flagan, R. C., and Seinfeld, J. H.: Chemical composition of secondary organic aerosol formed from the photooxidation of isoprene, J. Phys. Chem. A, 110, 9665–9690, https://doi.org/10.1021/jp061734m, 2006.
Takeuchi, M. and Ng, N. L.: Chemical composition and hydrolysis of organic nitrate aerosol formed from hydroxyl and nitrate radical oxidation of α-pinene and β-pinene, Atmos. Chem. Phys., 19, 12749–12766, https://doi.org/10.5194/acp-19-12749-2019, 2019.
Tiitta, P., Leskinen, A., Hao, L., Yli-Pirilä, P., Kortelainen, M., Grigonyte, J., Tissari, J., Lamberg, H., Hartikainen, A., Kuuspalo, K., Kortelainen, A.-M., Virtanen, A., Lehtinen, K. E. J., Komppula, M., Pieber, S., Prévôt, A. S. H., Onasch, T. B., Worsnop, D. R., Czech, H., Zimmermann, R., Jokiniemi, J., and Sippula, O.: Transformation of logwood combustion emissions in a smog chamber: formation of secondary organic aerosol and changes in the primary organic aerosol upon daytime and nighttime aging, Atmos. Chem. Phys., 16, 13251–13269, https://doi.org/10.5194/acp-16-13251-2016, 2016.
Xu, L., Suresh, S., Guo, H., Weber, R. J., and Ng, N. L.: Aerosol characterization over the southeastern United States using high-resolution aerosol mass spectrometry: spatial and seasonal variation of aerosol composition and sources with a focus on organic nitrates, Atmos. Chem. Phys., 15, 7307–7336, https://doi.org/10.5194/acp-15-7307-2015, 2015a.
Xu, L., Guo, H., Boyd, C. M., Klein, M., Bougiatioti, A., Cerully, K. M., Hite, J. R., Isaacman-VanWertz, G., Kreisberg, N. M., Knote, C., Olson, K., Koss, A., Goldstein, A. H., Hering, S. V., de Gouw, J., Baumann, K., Lee, S.-H., Nenes, A., Weber, R. J., and Ng, N. L.: Effects of anthropogenic emissions on aerosol formation from isoprene and monoterpenes in the southeastern United States, P. Natl. Acad. Sci. USA, 112, 37–42, https://doi.org/10.1073/pnas.1417609112, 2015b.
Xu, L., Williams, L. R., Young, D. E., Allan, J. D., Coe, H., Massoli, P., Fortner, E., Chhabra, P., Herndon, S., Brooks, W. A., Jayne, J. T., Worsnop, D. R., Aiken, A. C., Liu, S., Gorkowski, K., Dubey, M. K., Fleming, Z. L., Visser, S., Prévôt, A. S. H., and Ng, N. L.: Wintertime aerosol chemical composition, volatility, and spatial variability in the greater London area, Atmos. Chem. Phys., 16, 1139–1160, https://doi.org/10.5194/acp-16-1139-2016, 2016.
Xu, W., Takeuchi, M., Chen, C., Qiu, Y., Xie, C., Xu, W., Ma, N., Worsnop, D. R., Ng, N. L., and Sun, Y.: Estimation of particulate organic nitrates from thermodenuder–aerosol mass spectrometer measurements in the North China Plain, Atmos. Meas. Tech., 14, 3693–3705, https://doi.org/10.5194/amt-14-3693-2021, 2021.
Yu, K., Zhu, Q., Du, K., and Huang, X.-F.: Characterization of nighttime formation of particulate organic nitrates based on high-resolution aerosol mass spectrometry in an urban atmosphere in China, Atmos. Chem. Phys., 19, 5235–5249, https://doi.org/10.5194/acp-19-5235-2019, 2019.
Zare, A., Romer, P. S., Nguyen, T., Keutsch, F. N., Skog, K., and Cohen, R. C.: A comprehensive organic nitrate chemistry: insights into the lifetime of atmospheric organic nitrates, Atmos. Chem. Phys., 18, 15419–15436, https://doi.org/10.5194/acp-18-15419-2018, 2018.
Zaveri, R. A., Berkowitz, C. M., Brechtel, F. J., Gilles, M. K., Hubbe, J. M., Jayne, J. T., Kleinman, L. I., Laskin, A., Madronich, S., Onasch, T. B., Pekour, M. S., Springston, S. R., Thornton, J. A., Tivanski, A. V., and Worsnop, D. R.: Nighttime chemical evolution of aerosol and trace gases in a power plant plume: Implications for secondary organic nitrate and organosulfate aerosol formation, NO3 radical chemistry, and N2O5 heterogeneous hydrolysis, J. Geophys. Res.-Atmos., 115, 1–22, https://doi.org/10.1029/2009JD013250, 2010.
Zhang, J. K., Cheng, M. T., Ji, D. S., Liu, Z. R., Hu, B., Sun, Y., and Wang, Y. S.: Characterization of submicron particles during biomass burning and coal combustion periods in Beijing, China, Sci. Total Environ., 562, 812–821, https://doi.org/10.1016/j.scitotenv.2016.04.015, 2016.
Zhang, Q. and Jimenez, J. L.: Aerosol Mass Spectrometry (AMS) Global Database, available at: https://sites.google.com/site/amsglobaldatabase/urban-down-wind/montseny-spain, last access: 2 December 2021.
Zhang, Q., Stanier, C. O., Canagaratna, M. R., Jayne, J. T., Worsnop, D. R., Pandis, S. N., and Jimenez, J. L.: Insights into the chemistry of new particle formation and growth events in Pittsburgh based on aerosol mass spectrometry, Environ. Sci. Technol., 38, 4797–4809, https://doi.org/10.1021/Es035417u, 2004.
Zhang, Q., Parworth, C., Lechner, M., and Jimenez, J. L.: Aerosol Mass Spectrometer Global Database, Figshare [data set], https://doi.org/10.6084/m9.figshare.3486719, 2022 (data available at: https://sites.google.com/site/amsglobaldatabase, last access: 12 January, 2022).
Zhao, D., Schmitt, S. H., Wang, M., Acir, I.-H., Tillmann, R., Tan, Z., Novelli, A., Fuchs, H., Pullinen, I., Wegener, R., Rohrer, F., Wildt, J., Kiendler-Scharr, A., Wahner, A., and Mentel, T. F.: Effects of NOx and SO2 on the secondary organic aerosol formation from photooxidation of α-pinene and limonene, Atmos. Chem. Phys., 18, 1611–1628, https://doi.org/10.5194/acp-18-1611-2018, 2018.
Zhou, S., Collier, S., Xu, J., Mei, F., Wang, J., Lee, Y.-N., Sedlacek, A. J., Springston, S. R., Sun, Y., and Zhang, Q.: Influences of upwind emission sources and atmospheric processing on aerosol chemistry and properties at a rural location in the Northeastern U.S., J. Geophys. Res.-Atmos., 121, 6049–6065, https://doi.org/10.1002/2015JD024568, 2016.
Zhu, Q., He, L.-Y., Huang, X.-F., Cao, L.-M., Gong, Z.-H., Wang, C., Zhuang, X., and Hu, M.: Atmospheric aerosol compositions and sources at two national background sites in northern and southern China, Atmos. Chem. Phys., 16, 10283–10297, https://doi.org/10.5194/acp-16-10283-2016, 2016.
Zhu, Q., Cao, L.-M., Tang, M.-X., Huang, X.-F., Saikawa, E., and He, L.-Y.: Characterization of Organic Aerosol at a Rural Site in the North China Plain Region: Sources, Volatility and Organonitrates, Adv. Atmos. Sci., 38, 1115–1127, https://doi.org/10.1007/s00376-020-0127-2, 2021.
- Abstract
- Introduction
- Previous use and methods for pRONO2 quantification using AMS NO ratios
- Survey of ratios for particle-phase nitrates
- Evaluation of calibration and RoR using ambient data
- Demonstrations of RoR apportionment and comparisons to other measurements/methods
- Physical basis for ratios observed for nitrate types and variability among instruments
- Multi-site survey of inorganic–organic nitrate fractionation
- Further discussion of the efficacy and support for ratio apportionment
- Conclusions
- Data availability
- Author contributions
- Competing interests
- Disclaimer
- Acknowledgements
- Financial support
- Review statement
- References
- Supplement