the Creative Commons Attribution 4.0 License.
the Creative Commons Attribution 4.0 License.
 | 15 Aug 2022
Measurement of enantiomer percentages for five monoterpenes from six conifer species by cartridge-tube-based passive sampling adsorption–thermal desorption (ps-ATD)
Ying Wang
Wentai Luo
Todd N. Rosenstiel
James F. Pankow
Many monoterpenes have at least two different stereochemical forms, and many biosynthetic pathways are known to favor one product over the other(s). A rapid method was developed and used in the determination of the ()-enantiomeric distributions for α-pinene, β-pinene, camphene, limonene, and β-phellandrene as emitted by plant material from six conifer species. The six species included the two pine species Pseudotsuga menziesii and Pinus ponderosa, as well as the four cypress species Chamaecyparis lawsoniana, Thuja plilcata, Juniperus chinensis, and Thuja occidentalis. The method involved passive sampling adsorption–thermal desorption (ps-ATD). During sampling, the cartridge tube was placed in a 60 mL glass vial with plant material for 1 h. Sample analytes were thermally transferred to a chiral gas chromatography (GC) column. Detection was by mass spectrometry (MS). The six species exhibited different emission patterns for the five monoterpenes in the totals, although within a given species the distributions among the five monoterpenes were similar across multiple plants. β-pinene dominated in P. menziesii and P. ponderosa, and α-pinene dominated in T. plicata and T. occidentalis. The chiral separations revealed differences in the enantiomeric distributions among the species. The (−)-enantiomers of α-pinene and β-pinene dominated strongly in P. menziesii and P. ponderosa; the (−)-enantiomer of β-phellandrene dominated in C. lawsoniana. The dependence of the method precision on percent enantiomer abundance is discussed.
- Article
(1587 KB) - Full-text XML
- BibTeX
- EndNote


Atmospheric emissions of gaseous non-methane organic compounds from plants are both substantial and chemically complex (Guenther et al., 1995; Pankow et al., 2012; de Piva et al., 2019). Plant emissions are greater than those from animals and are believed to be related to a variety of purposes, including repulsion of herbivorous insects and attraction of pollinators and parasites of herbivores (Dicke and Loon, 2000). Isoprene (C5H8) and compounds derived from isoprene are particularly prominent in plant emission profiles. Guenther et al. (1995) estimated that isoprene and monoterpenes constitute approximately 11 % and 55 %, respectively, of global non-methane emissions. Their oxidation in the atmosphere leads to products that promote the formation of ozone (Porter et al., 2017) and which condense as secondary organic aerosol particulate matter (Pankow 1994a, b; Zhang et al., 2018).
Monoterpenes that possess chiral carbons can exist in two mirror-image “enantiomeric” forms for α-pinene, (−) α-pinene, and (+) α-pinene. For a given compound, different biochemical synthesis pathways in different plants can favor one enantiomer over the other, and many biochemical interaction loci are chiral (López et al., 2011). An example pertains to carvone. The form predominantly found in caraway seeds (Carum carvi) is S (+) carvone, while the form predominantly found in spearmint (Mentha spicata) is R (−) carvone.
In forests, where legion species emit innumerable compounds for which many have multiple enantiomers, the matter is obviously exceedingly complex. For example, it required careful study by Williams et al. (2007) just to be able to conclude that in tropical forests, emission of (−) α-pinene is light-dependent and that in boreal forests emission of (+) α-pinene is temperature-dependent. Stephanou (2007) has argued that careful and data-driven studies of chirality will be required to fully understand the mechanisms of atmospheric emission of volatile organic compounds by plants. Accordingly, improvements in the requisite analytical methods will be useful.
Table 1Summary of methods used to sample then analyze plant-derived chiral biogenic volatile organic compounds.
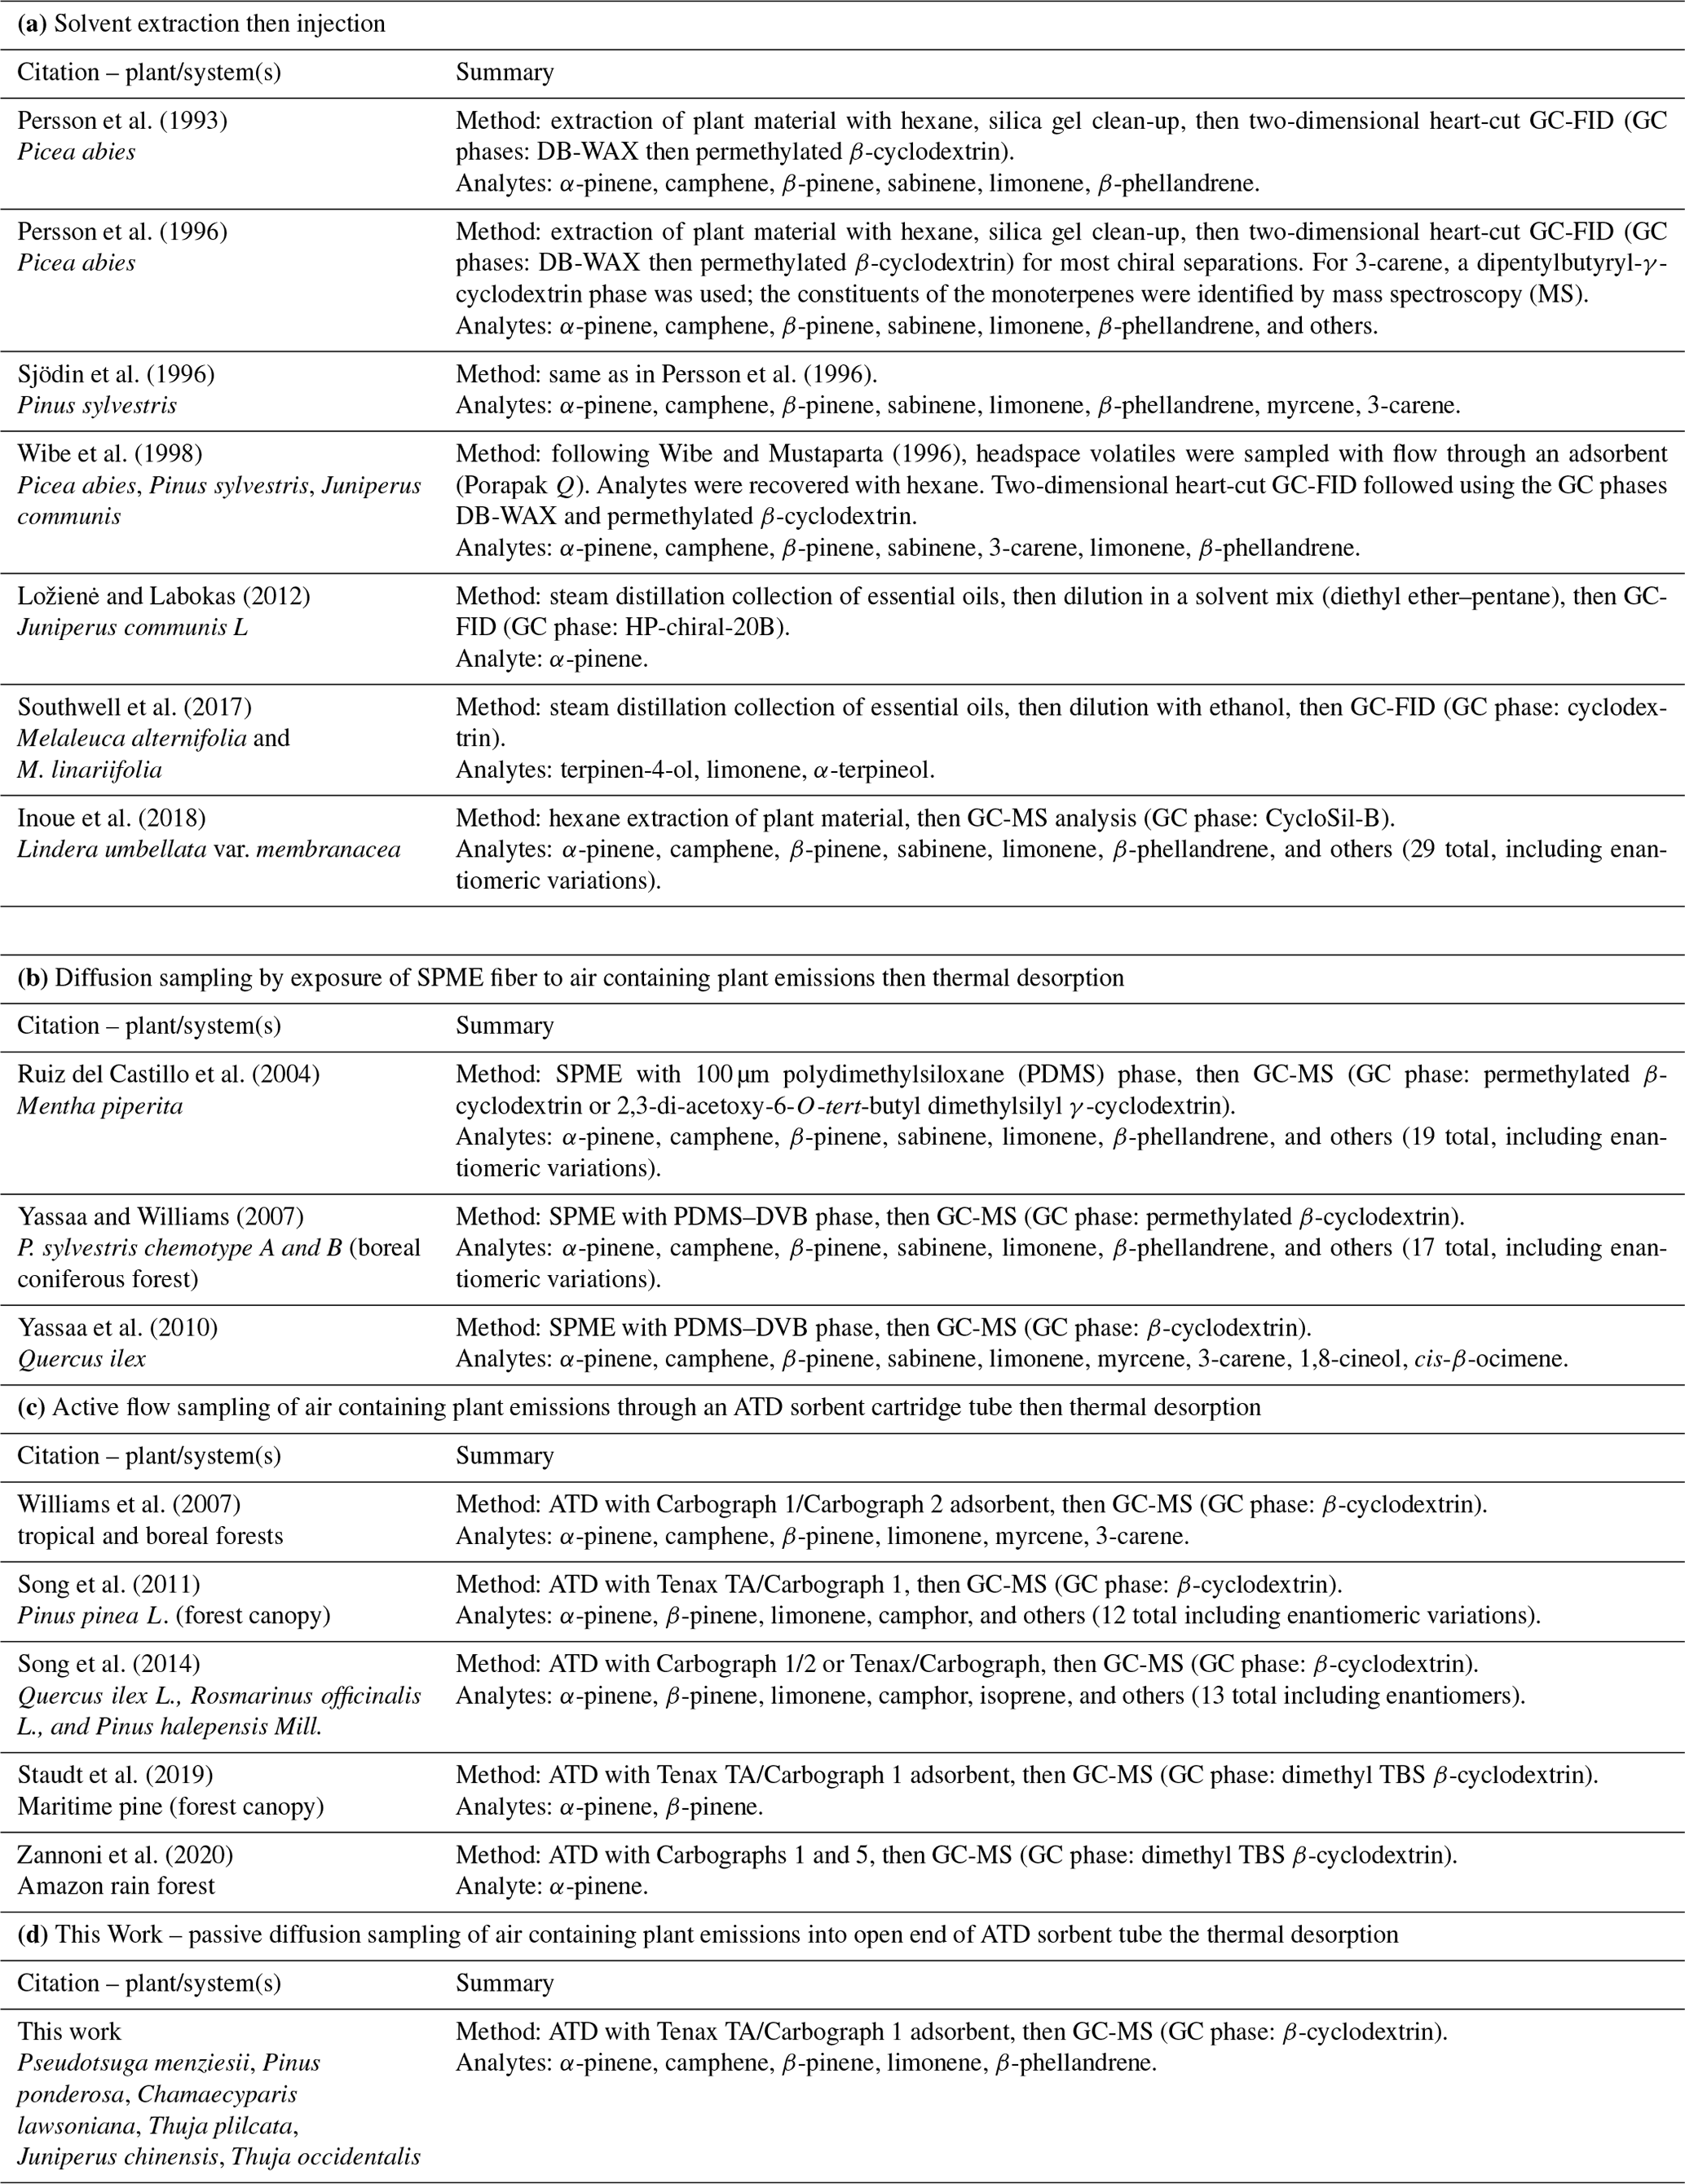
Table 1 provides a summary of the methodologies used to carry out chiral determinations of plant monoterpenes. Analyte collection occurred using solvents in various ways and by sorption of volatilized (gaseous) analytes in air. Following sampling, analytes were subjected to quantitation of the enantiomer forms using chiral gas chromatography (GC). The acquisition of terpenoid analytes from plant samples can be accomplished in different ways. With solvent extraction as executed for the examples cited in Table 1 (e.g., with hexane), there are the disadvantages of (1) difficulties posed by large organic solvent signals, (2) generally negative implications that solvent injection carries for peak sharpness in GC, and (3) sensitivity problems when the analytes in the extract are not sufficiently concentrated. With sorptive sampling and SPME, gaseous monoterpenes can be acquired using passive diffusion-limited transfer into the coatings of solid-phase microextraction (SPME) fibers. With sorptive sampling and adsorption–thermal desorption (ATD), sample gas flow is pulled through an ATD cartridge tube (Pankow, 1988). For sampling and placement of analytes on a GC column, SPME can lead to better chromatographic resolution than ATD: less time and gas volume are needed to thermally transfer the analytes from the sorption phase to the column. When optimized, automated SPME can be cost-effective if the main goal is the accurate determination of chiral ratios. Automated SPME, however, is less prevalent and more complicated than automated ATD, the latter being well optimized and available on multiple commercial instrument platforms. Since ATD interfaced with chiral GC in our laboratory has been found to give adequate enantiomeric resolution for monoterpenes of interest, the goal of this work was to develop and test passive sampling ATD (ps-ATD) as a simple and low-labor method for carrying out enantiomeric analyses of monoterpenes emitted by plant materials. The method is based on passive sampling with ATD cartridges followed by automated ATD. Since only enantiomeric fractions and not actual enantiomer concentrations were sought in this work, use of passive diffusion sampling carried no drawbacks (e.g., diffusion coefficients of enantiomer pairs are identical as indicated by Fuller's equation, Tang et al., 2014).
2.1 Percent (−)-enantiomer format
Two distinctly different formats are available for presenting enantiomer data. The first is the abundance ratio for the two forms (or the log of the ratio); the second is as a percent of one form, e.g., the percent of the (−) form. The ratio format has advantages in the study of the molecular specificity of biosynthetic pathways; the percentage format complements source apportionment work wherein abundances of 0.5 % and 1 % of a given (−) molecule would not likely lead to meaningfully different model conclusions. This work will use the (−)-enantiomer format.
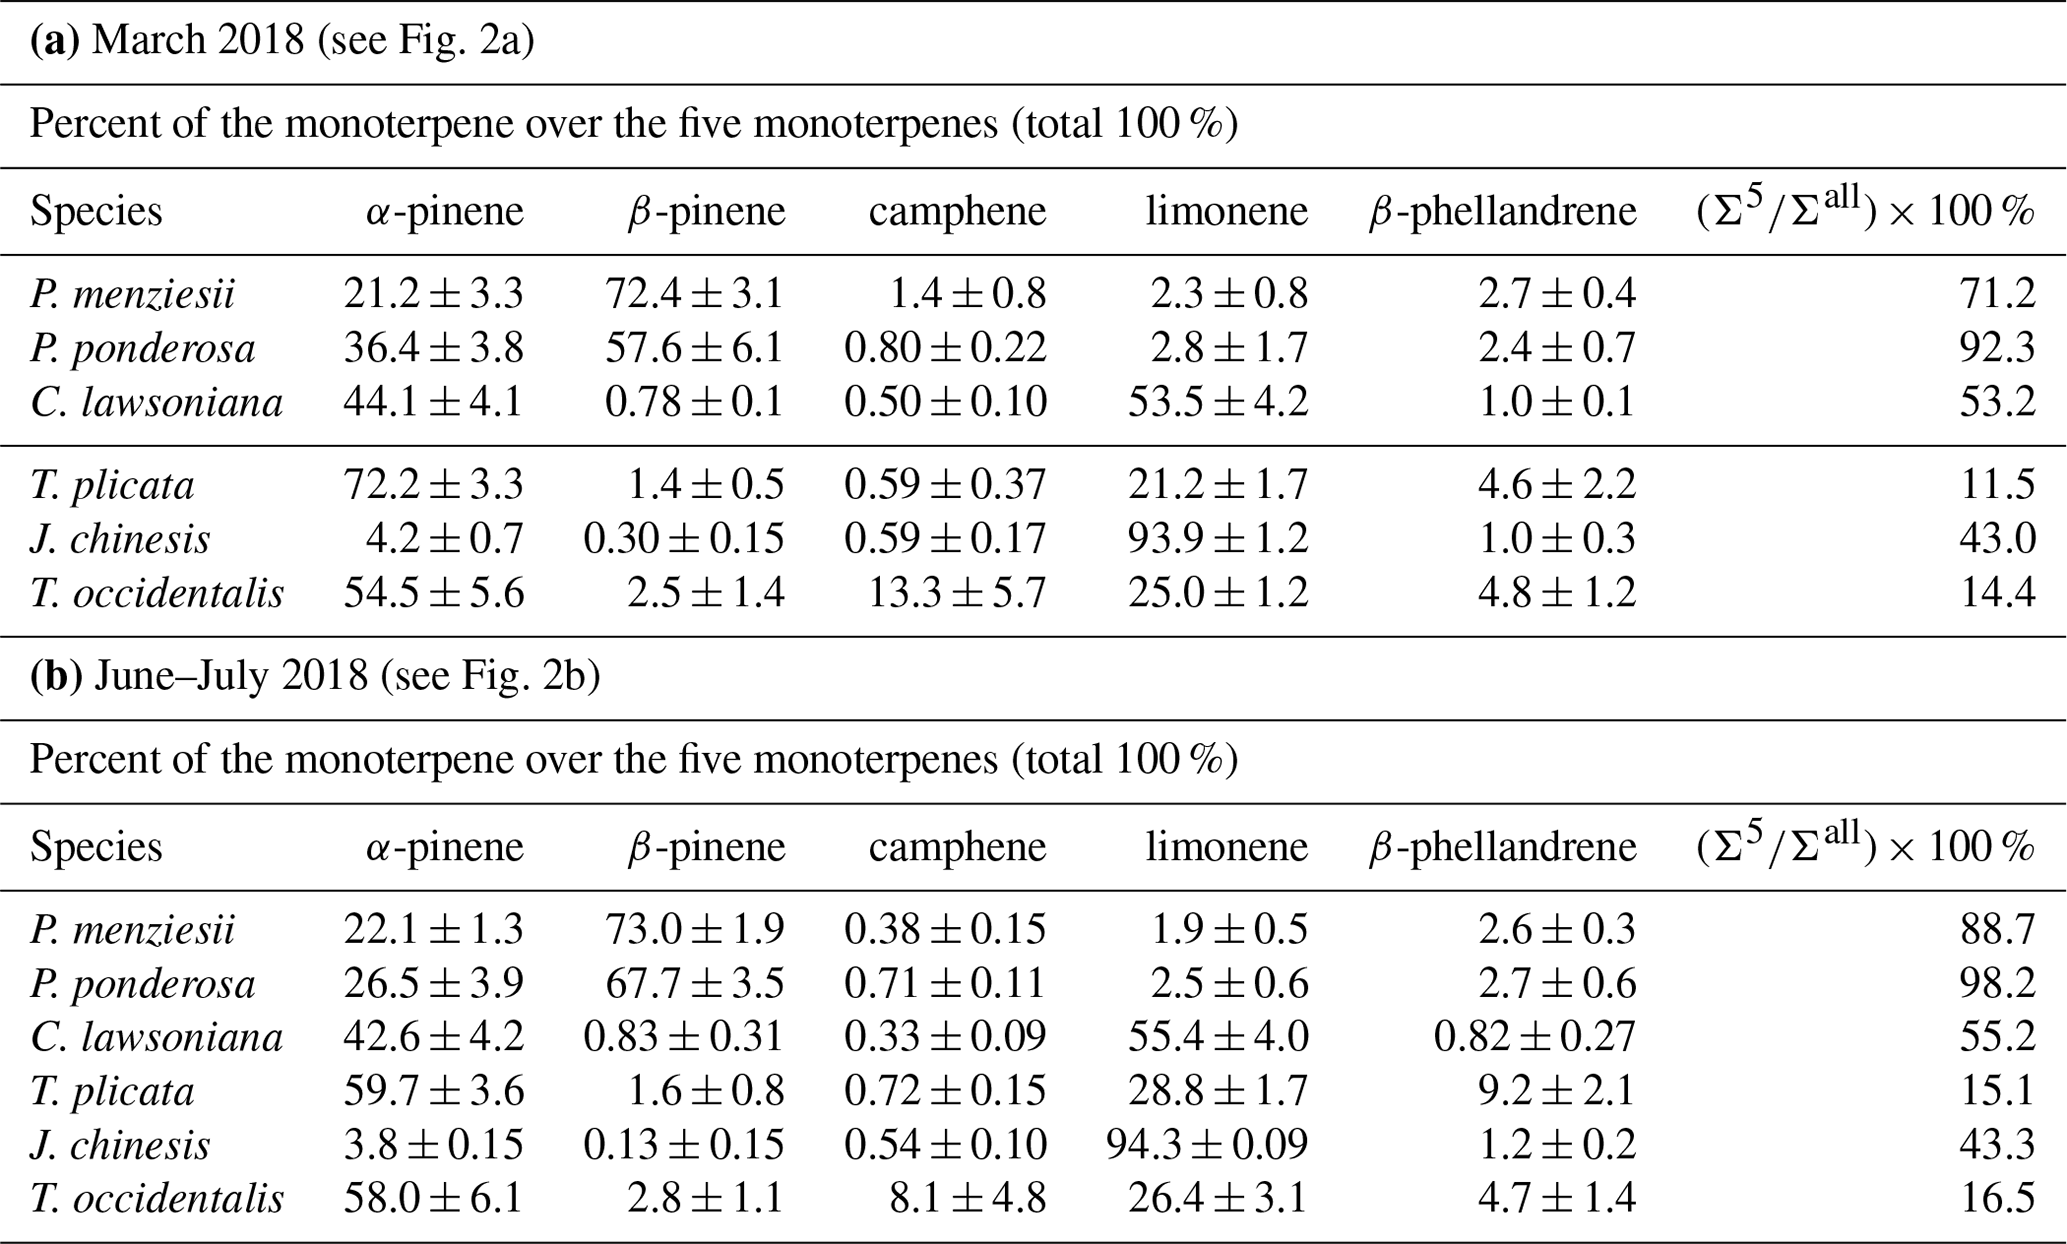
Table 2Mass fraction values (including both enantiomers) for each of five chiral monoterpenes over those five monoterpenes and average values of () × 100 % (mass fractions for the mass sum for those five terpenes over all detected monoterpenes). The nursery-purchased plants were located at PSU and sampled in March 2018 and again in June–July 2018. Number of plant sample replicates N=4 for all species, except N=3 for P. ponderosa. For each plant sample replicate, a separate sample of plant material was analyzed once.
2.2 Plant samples
Purchased nursery plants (six species). Six coniferous species were purchased as ∼ 1 m high potted (∼ 8 L pots) saplings from a local nursery in January of 2018. These included the two pine species Pseudotsuga menziesii (four plants) and Pinus ponderosa (three plants) as well as the four cypress species Chamaecyparis lawsoniana, Thuja plicata, Juniperus chinensis, and Thuja occidentalis (four plants each). The saplings were placed on the roof of the SRTC building on the PSU campus and were watered daily. The high and low temperature ranges for Portland during 2018 were in March at 19.4 and 4.3 ∘C, April at 30.0 and 6.7 ∘C, May at 31.7 and 12.3 ∘C, June at 34.4 and 13.1 ∘C, July at 35.6 and 16.7 ∘C, and August at 35.0 and 16.6 ∘C. The elevation of the PSU campus is 52 m (above sea level). A foliage sample was collected from each plant at mid-height in March 2018 and again in June–July 2018 using clean pruning shears. The samples were immediately taken to the laboratory for processing.
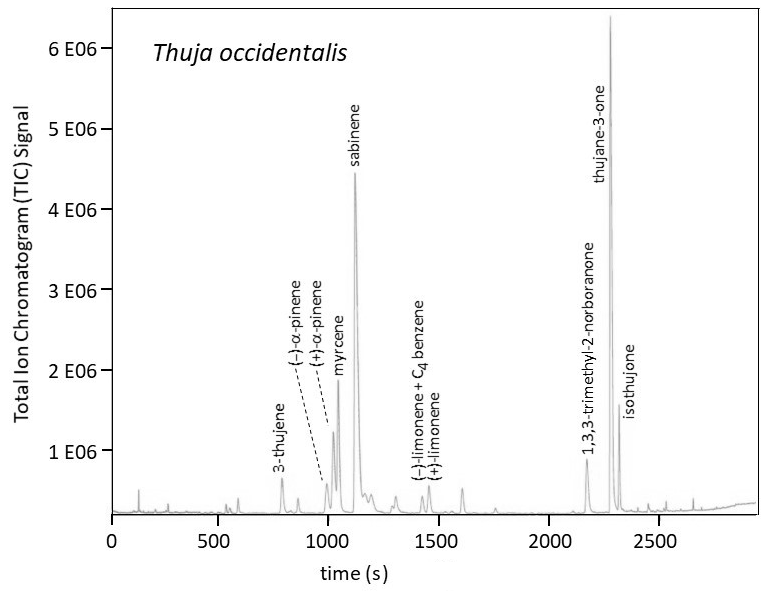
Figure 1Total ion chromatogram (TIC) by GC-MS (gas chromatography–mass spectrometry) using a Supelco Beta DEX™ 120 chiral capillary column (0.25 µm film thickness, 0.25 mm i.d., and 30 m long; Supelco Inc., Bellefonte, PA) for a T. occidentalis sample. The peak marked for (−)-limonene contains a contribution from an unidentified C4-benzene. The two α-pinene enantiomers and the two limonene enantiomers were quantitated using the ion .

Figure 2(a) Bar graph showing percentages among five monoterpenes in March 2018 for six nursery-purchased conifer species. Within a given species, the largest value is designated “A”; thereafter, a different capital letter indicates a significant difference between the monoterpenes. For a given monoterpene, the largest value is designated “a”; thereafter, a different lowercase letter indicates a significant difference between the species. The percentage values that the five monoterpenes represent as a sum relative to the sum of all detected monoterpenes ( × 100 %) are given. The error bars are ± 1 SD. The data values are given in Table 2a. (b) Bar graph showing the percentages among five monoterpenes in June–July 2018 for six nursery-purchased conifer species. Within a given species, the largest value is designated “A”; thereafter, a different capital letter indicates a significant difference between the monoterpenes. For a given monoterpene, the largest value is designated “a”; thereafter, a different lowercase letter indicates a significant difference between the species. The percentage values that the five monoterpenes represent as a sum relative to the sum of all detected monoterpenes ( × 100 %) are given. The error bars are ± 1 SD. The data values are given in Table 2b.
Purchased nursery T. occidentalis – time of day samples. Foliage samples from the purchased T. occidentalis plants were collected at mid-height with clean shears on 20 August 2018 at 06:00, 13:00, 19:00, and 21:00. The temperatures and light intensities were recorded. The samples were immediately taken to the laboratory for analysis.
Established residential T. occidentalis. Samples from six to seven established (5 years, ∼ 3 m tall) specimens of T. occidentalis were collected between 13 and 26 February 2018 from residential locations in each of three suburban vicinities in Oregon (Hillsboro, Seaside, and Sandy). The approximate time of day for the sampling, the annual mean high and low temperatures, the annual mean precipitation, and the elevation above sea level for each were as follows: Hillsboro, 18:30 to 19:30, 17.2 ∘C and 6.7 ∘C, 97.0 cm, 52 m; Seaside, 08:30 to 10:00, 13.9 ∘C and 6.7 ∘C, 191.4 cm, 8 m; and Sandy, 14:00 to 15:30, 15.6 ∘C and 6.1 ∘C, 198.9 cm, 299 m. For each sample, a 15 to 20 cm branch of foliage at ∼ 1.5 m above ground was clipped using clean shears. The cut end of each sample was wrapped with a wet paper towel at the cut. Each sample was stored in an unzipped ziplock bag with the cut end inside the bag. The samples from Hillsboro arrived within 14 h and were analyzed immediately. The samples from Seaside and Sandy arrived at the laboratory within 2 h and were processed immediately.
2.3 Sample preparation
Plant samples were rinsed with deionized water; surface water was removed by blotting with a clean paper towel. Sample material was cut into ∼ 1 cm pieces with clean laboratory scissors. Each plant replicate subsample of ∼ 0.3 g was transferred to clear 60 mL volatile organic analysis (VOA) vials (Restek Corporation, Bellefonte, PA). Each vial was sealed with a 0.125 in. thick PTFE-lined septum (Restek Corporation, Bellefonte, PA) and held at 20 ± 0.5 ∘C for 60 min. Passive sampling with an ATD cartridge then GC-MS analysis proceeded as described below.
2.4 Chemical standards
The five monoterpenes examined here were α-pinene, β-pinene, camphene, limonene, and β-phellandrene. Authentic chiral and racemic standards were purchased from Sigma Aldrich Inc. (St. Louis, MO) at ≥ 98 % purity.
2.5 Gas chromatography (GC)
Relative total amounts of the monoterpenes (total () α-pinene, total () β-pinene, etc.) and the enantiomeric fractions for the (−) forms were determined by GC. The elution order was established by analysis of standards. The chiral column stationary phase was Supelco Beta DEX™ 120 (Supelco Inc., Bellefonte, PA) with 0.25 µm film thickness, 0.25 mm i.d., and 30 m length. After gaseous introduction of each sample into the column, the GC oven temperature program was as follows: (1) hold at 60 ∘C for 2 min, (2) ramp to 90 ∘C at 1 ∘C min−1, (3) ramp to 105 ∘C at 3 ∘C min−1, (4) ramp to 220 ∘C at 10 ∘C min−1, and then (5) hold at 220 ∘C for 2 min. The gas flow rate (helium) through the column was approximately 1.0 mL min−1. Figure 1 provides an example of a chromatogram for a sample.
Table 3Percent (−)-enantiomer values ± 1 standard deviation (SD) for five chiral monoterpenes in six conifer species in nursery-purchased plants located at PSU sampled in March 2018 and again in June–July 2018. (The data were obtained from the same set of analyses carried out to generate the data in Table 2.)

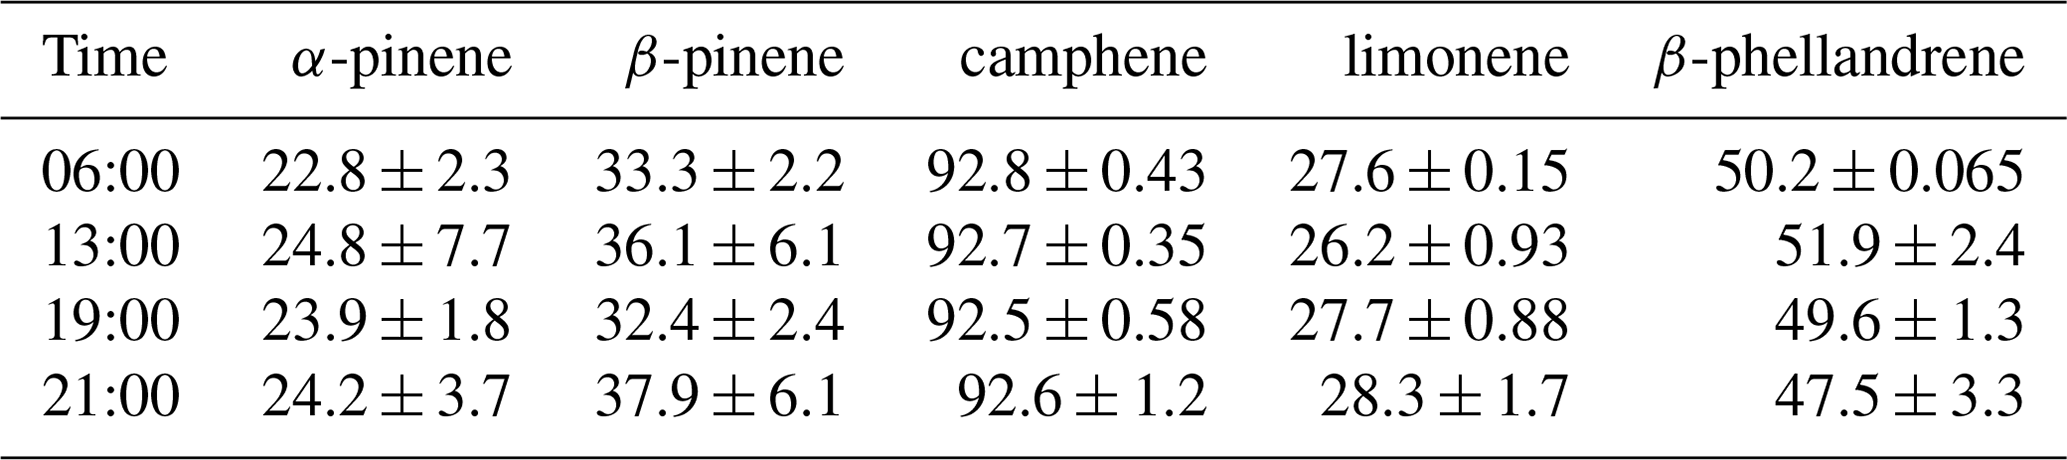
Table 4Percent (−)-enantiomer values ± 1 standard deviation (SD) for five chiral monoterpenes in Thuja occidentalis in four nursery-purchased plants located at PSU sampled once each (N=4) in March 2018 and once each in June–July 2018 (see also Fig. 4).
2.6 Headspace sampling, analyte transfer to GC, and mass spectrometric (MS) analysis
The VOA vials used were from Restek Corporation (Bellefonte, PA). The 40 mL standard vials contained ∼ 1 mg of neat liquid standard. As noted below, the 60 mL vials were loaded with ∼ 0.3 g of plant material. In all cases, sampling proceeded in a passive manner by exposing the inlet end of an ATD gas sampling cartridge to the vial headspace. Before exposure, each cartridge was otherwise wrapped with clean aluminum foil. For standards, sampling of the gas phase involved a 2 s exposure with the cartridge held in the inlet in the headspace of an open vial. For samples, each cartridge was placed in its vial for 60 min with the vial capped. No flow through into the cartridge was required to acquire adequate analyte mass for any given analysis (∼ 0.05 ng of an enantiomer on an ATD cartridge, or ∼ 0.1 ng on-column, was required to obtain a signal-to-noise – – ratio of 50:1). Passive sampling was used because the primary interest was the enantiomeric percentages of the subject compounds, and not emission rates or consequent ecosystem concentrations. The ATD cartridges were from Camsco Inc. (Houston, TX), as packed with 100 mg of mesh Tenax TA on the inlet side followed by 200 mg of mesh Carbograph 1TD.
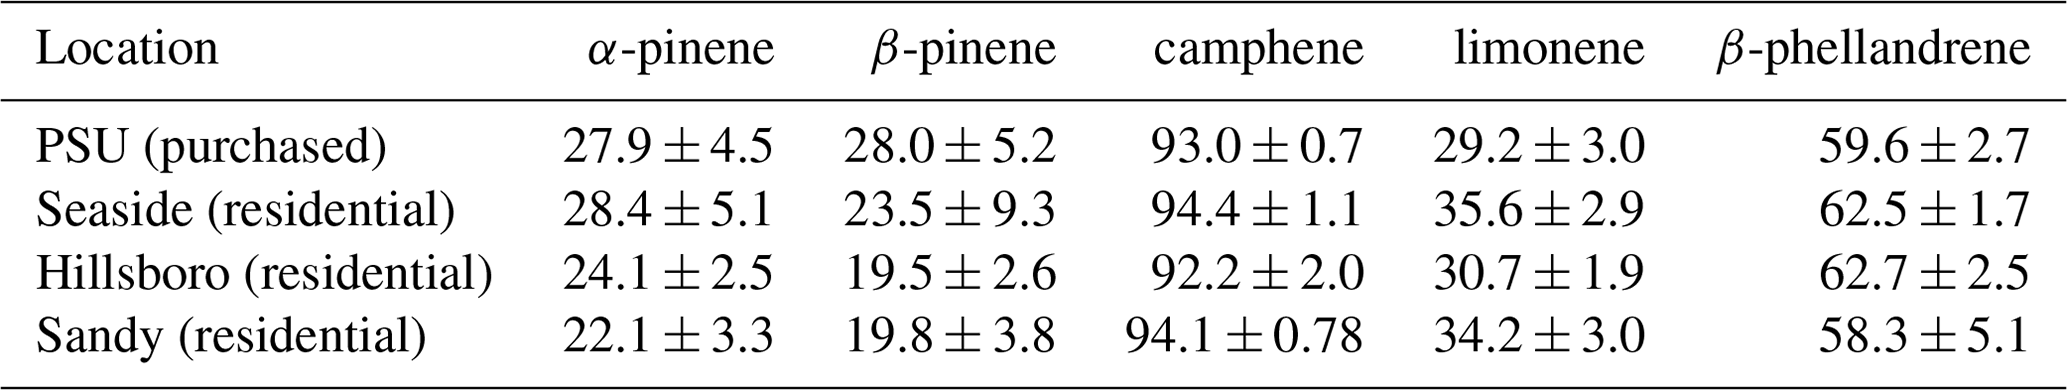
Table 5Percent (−)-enantiomer values ± 1 standard deviation (SD) for five chiral monoterpenes in Thuja occidentalis in four nursery-purchased plants located at PSU and sampled once each (N=4) in March 2018, as well as in residentially planted samples found in a field trip to three suburban areas in Oregon (Seaside, N=7 plants sampled once each; Hillsboro, N=6 plants sampled once each; Sandy, N=7 plants sample once each; data are plotted in Fig. 5).
ATD cartridges were auto-processed using a TurboMatrix 650 ATD (PerkinElmer Inc., Waltham, MA) unit interfaced to a Leco Pegasus 4D GC × GC-TOFMS (Leco Corporation, St. Joseph, MI) used in 1-D GC mode (i.e., without application of a secondary column). (TOFMS: time-of-flight mass spectrometer.) In the Turbomatrix 650 unit, the analytes on each ATD cartridge were thermally desorbed (270 ∘C, 10 min, 65 mL min−1 He, backflush mode – outlet to inlet – direction) onto an intermediate Tenax TA focusing trap held at −10 ∘C. 25 mL min−1 of the 65 mL min−1 desorption flow was discarded as “split” flow. The focusing trap was then thermally desorbed at 280 ∘C for 5 min at 16 psi constant He pressure. About 2 mL min−1 of the flow passed onto the GC column in the TOFMS unit via a 225 ∘C transfer line; the remaining ∼ 20 mL min−1 split flow was discarded. MS data acquisition began upon initiating thermal desorption of the focusing trap.
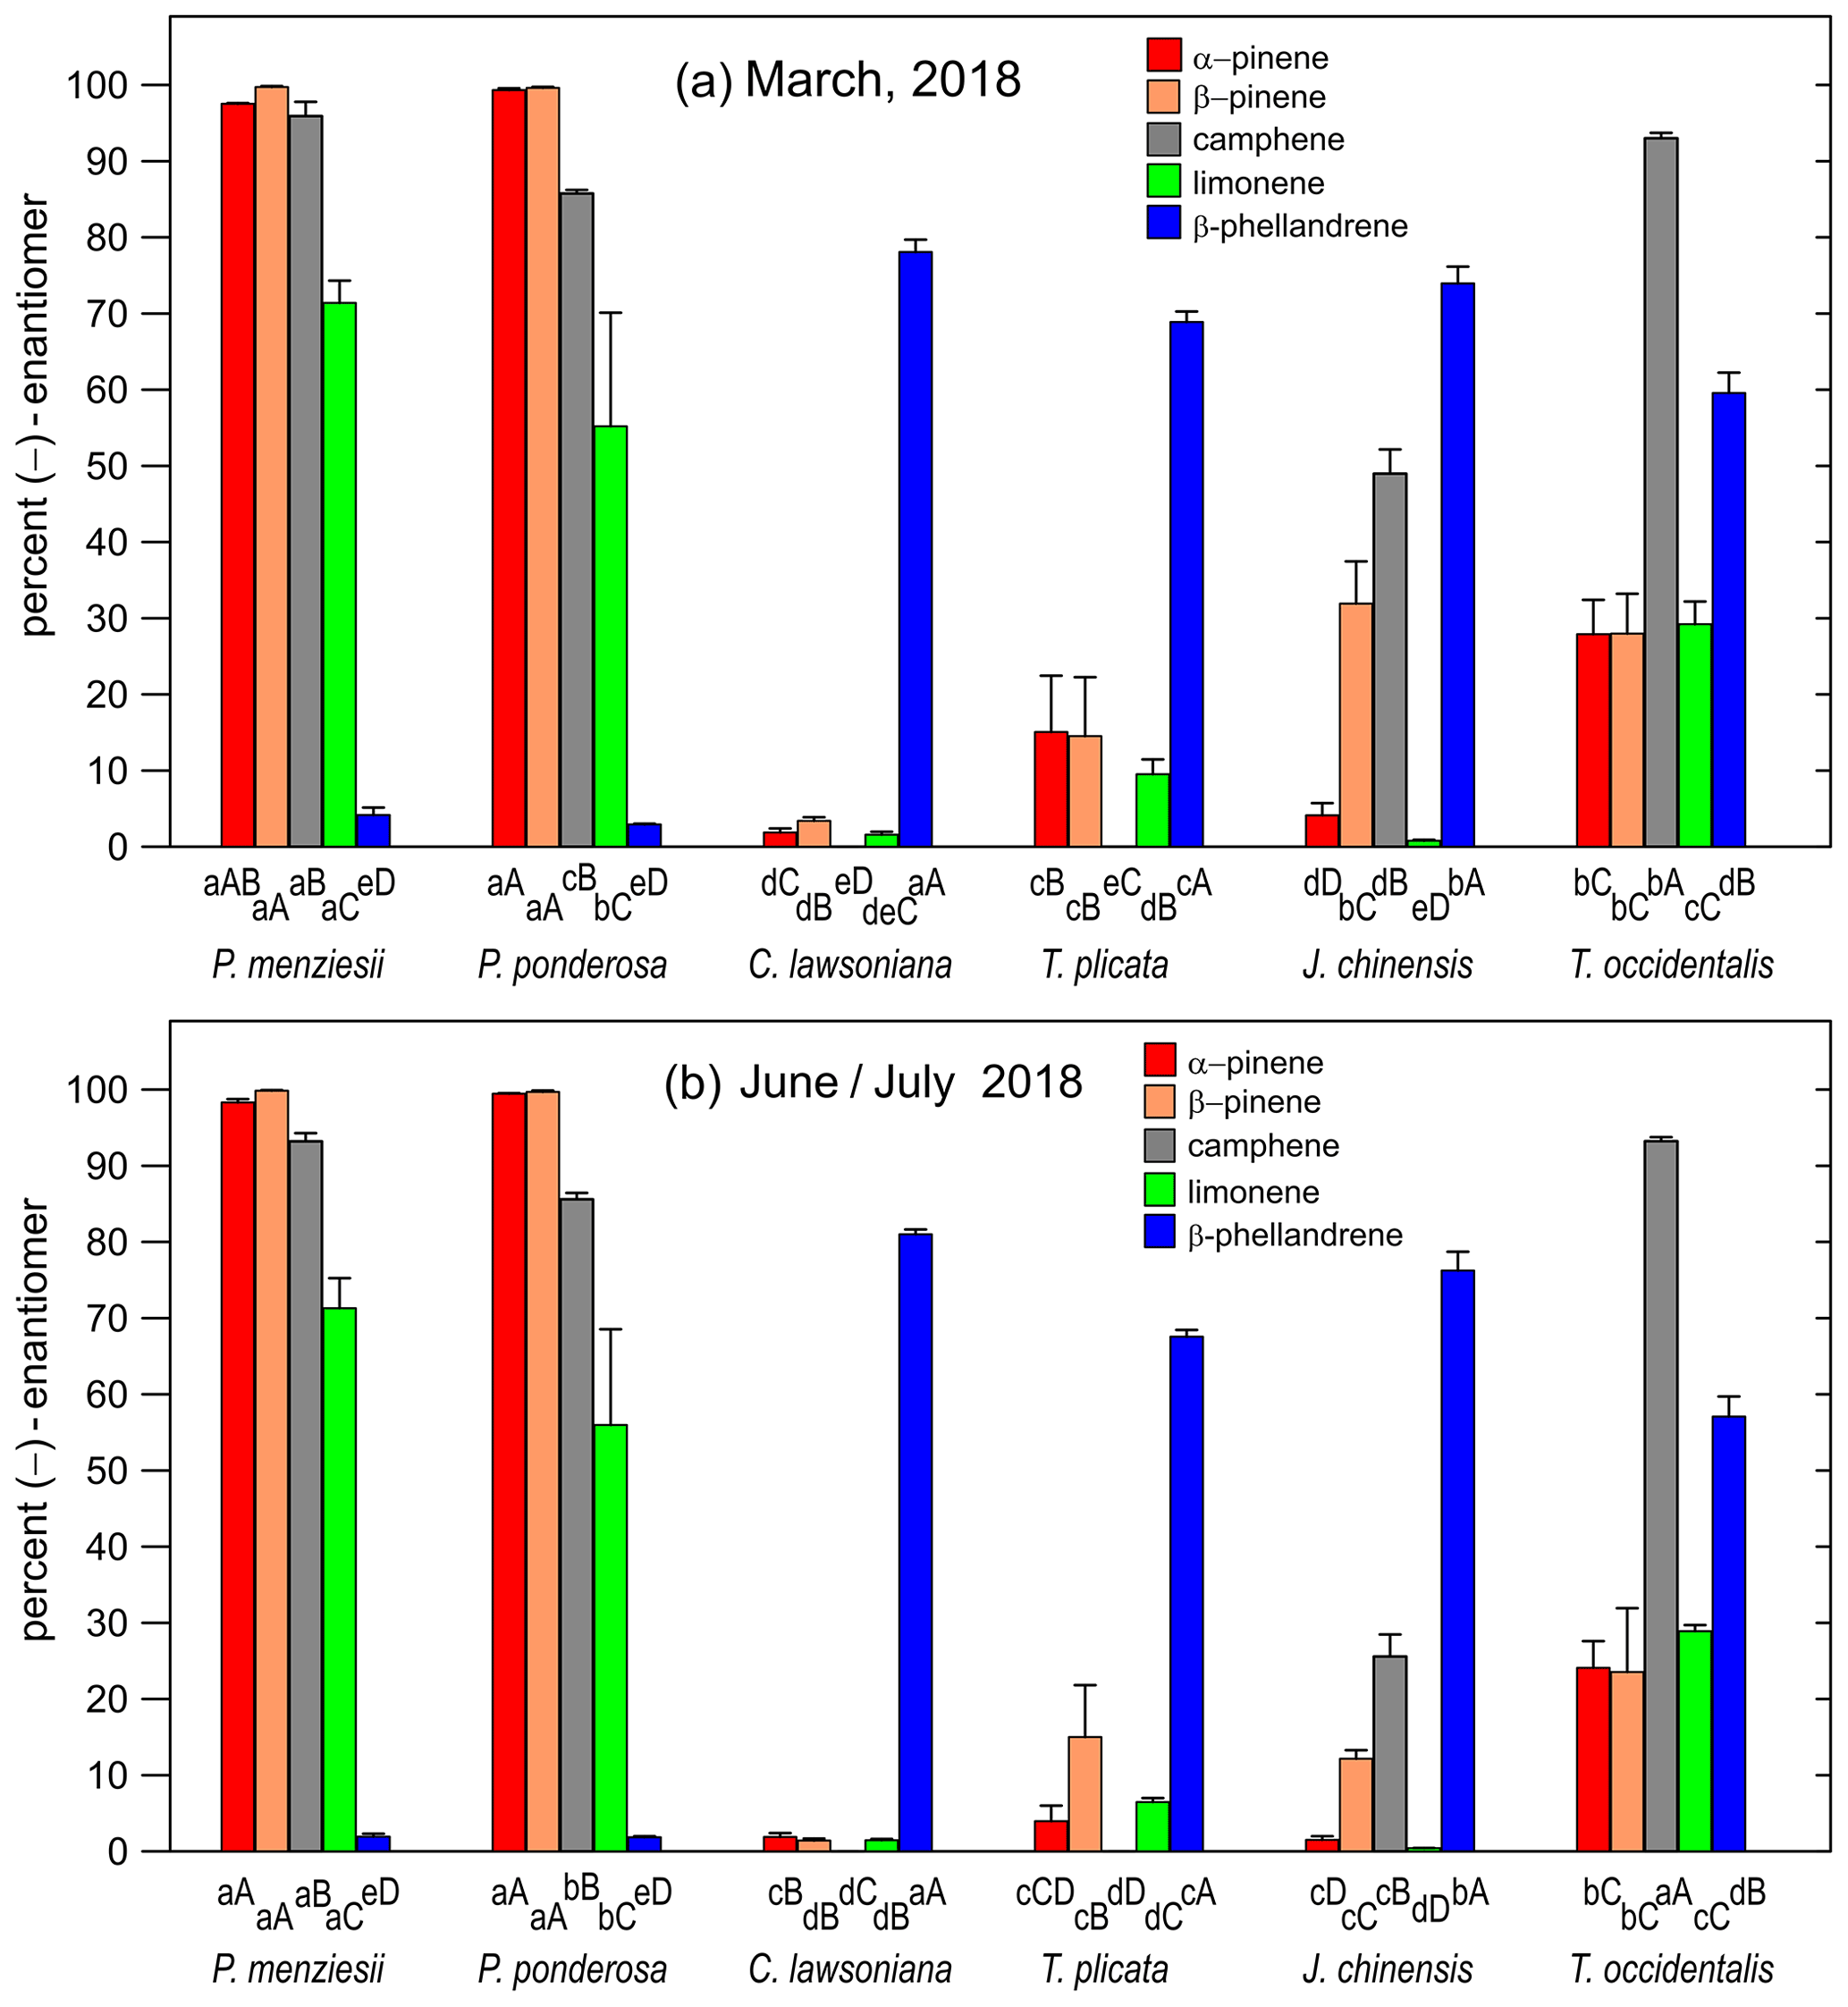
Figure 3(a) Bar graph showing the percentage values for the (−)-enantiomer for five monoterpenes in March 2018 for six nursery-purchased conifer species. Within a given species, the largest value is designated “A”; thereafter, a different capital letter indicates a significant difference between the monoterpenes. For a given monoterpene, the largest value is designated “a”; thereafter, a different lowercase letter indicates a significant difference between the species. The error bars are ± 1 SD. The data values are given in Table 3a. (b) Percent of the (−)-enantiomer for five monoterpenes in June–July 2018 for six nursery-purchased conifer species. Within a given species, the largest value is designated “A”; thereafter, a different capital letter indicates a significant difference between the monoterpenes. For a given monoterpene, the largest value is designated “a”; thereafter, a different lowercase letter indicates a significant difference between the species. The error bars are ± 1 SD. The data values are given in Table 3b.
For α-pinene, camphene, limonene, and β-phellandrene, for the percent enantiomer determinations, the MS quantitation ion used was . For β-pinene, was used. For each compound in a given sample, the percent of each enantiomer was calculated using the area for each deconvoluted peak (in any case of co-elution) for the enantiomer quantitation ion divided by the corresponding sum for both enantiomers. Note here that both enantiomers in a given pair will have exhibited the exact same (1) diffusion coefficient during sampling, (2) transfer efficiencies during analysis, and (3) detector sensitivities.

Figure 4Percent of the (−)-enantiomer for five monoterpenes in nursery-purchased samples of Thuja occidentalis on 20 August 2018. For a given time, the largest value is designated “A”; thereafter, a different capital letter indicates a significant difference between the monoterpenes. For a given monoterpene, the largest value is designated “a”; thereafter, a different lowercase letter indicates a significant difference between the times. The error bars are ± 1 SD. The data values are given in Table 4.
The fractional mass distribution among the five monoterpenes was calculated for each sample using the peak pair sums, each of which was normalized using response factors based on total ion chromatogram (TIC) relative to α-pinene (RRFα-pinene). Obtained from analyses of replicate ATD cartridges onto which known amounts (∼ 10 ng) of each monoterpene in 4 µL of methanol acetone had been loaded (by syringe), the measured TIC RRFα-pinene values were α-pinene 1.00, β-pinene 0.83, camphene 0.93, limonene 0.83, and β-phellandrene 0.44. Inherent in these calculations of the fractional mass distributions among the five monoterpenes are the assumptions that (1) the passive sampling rate by gaseous diffusion was essentially the same for all of the compounds (per Fuller's equation), and (2) the desorption transfer efficiencies to the analytical unit were very similar for all of the compounds.
The average of the above five TIC RRFα-pinene values (0.81) was used to obtain an estimate of the mass percentage for each sampling of the sum of the five monoterpenes (10 enantiomers) relative to all detected monoterpenes () × 100 %). The LECO software was used to deconvolute (1) each of the 10 enantiomer TIC peaks for the five compounds and (2) each of the other compound TIC peaks identified (based on mass spectral matching and GC retention time window) as probable monoterpenes. The most abundant of these were sabinene and myrcene. The deconvoluted TIC peak areas (A) were integrated and then used with the TIC response factors.
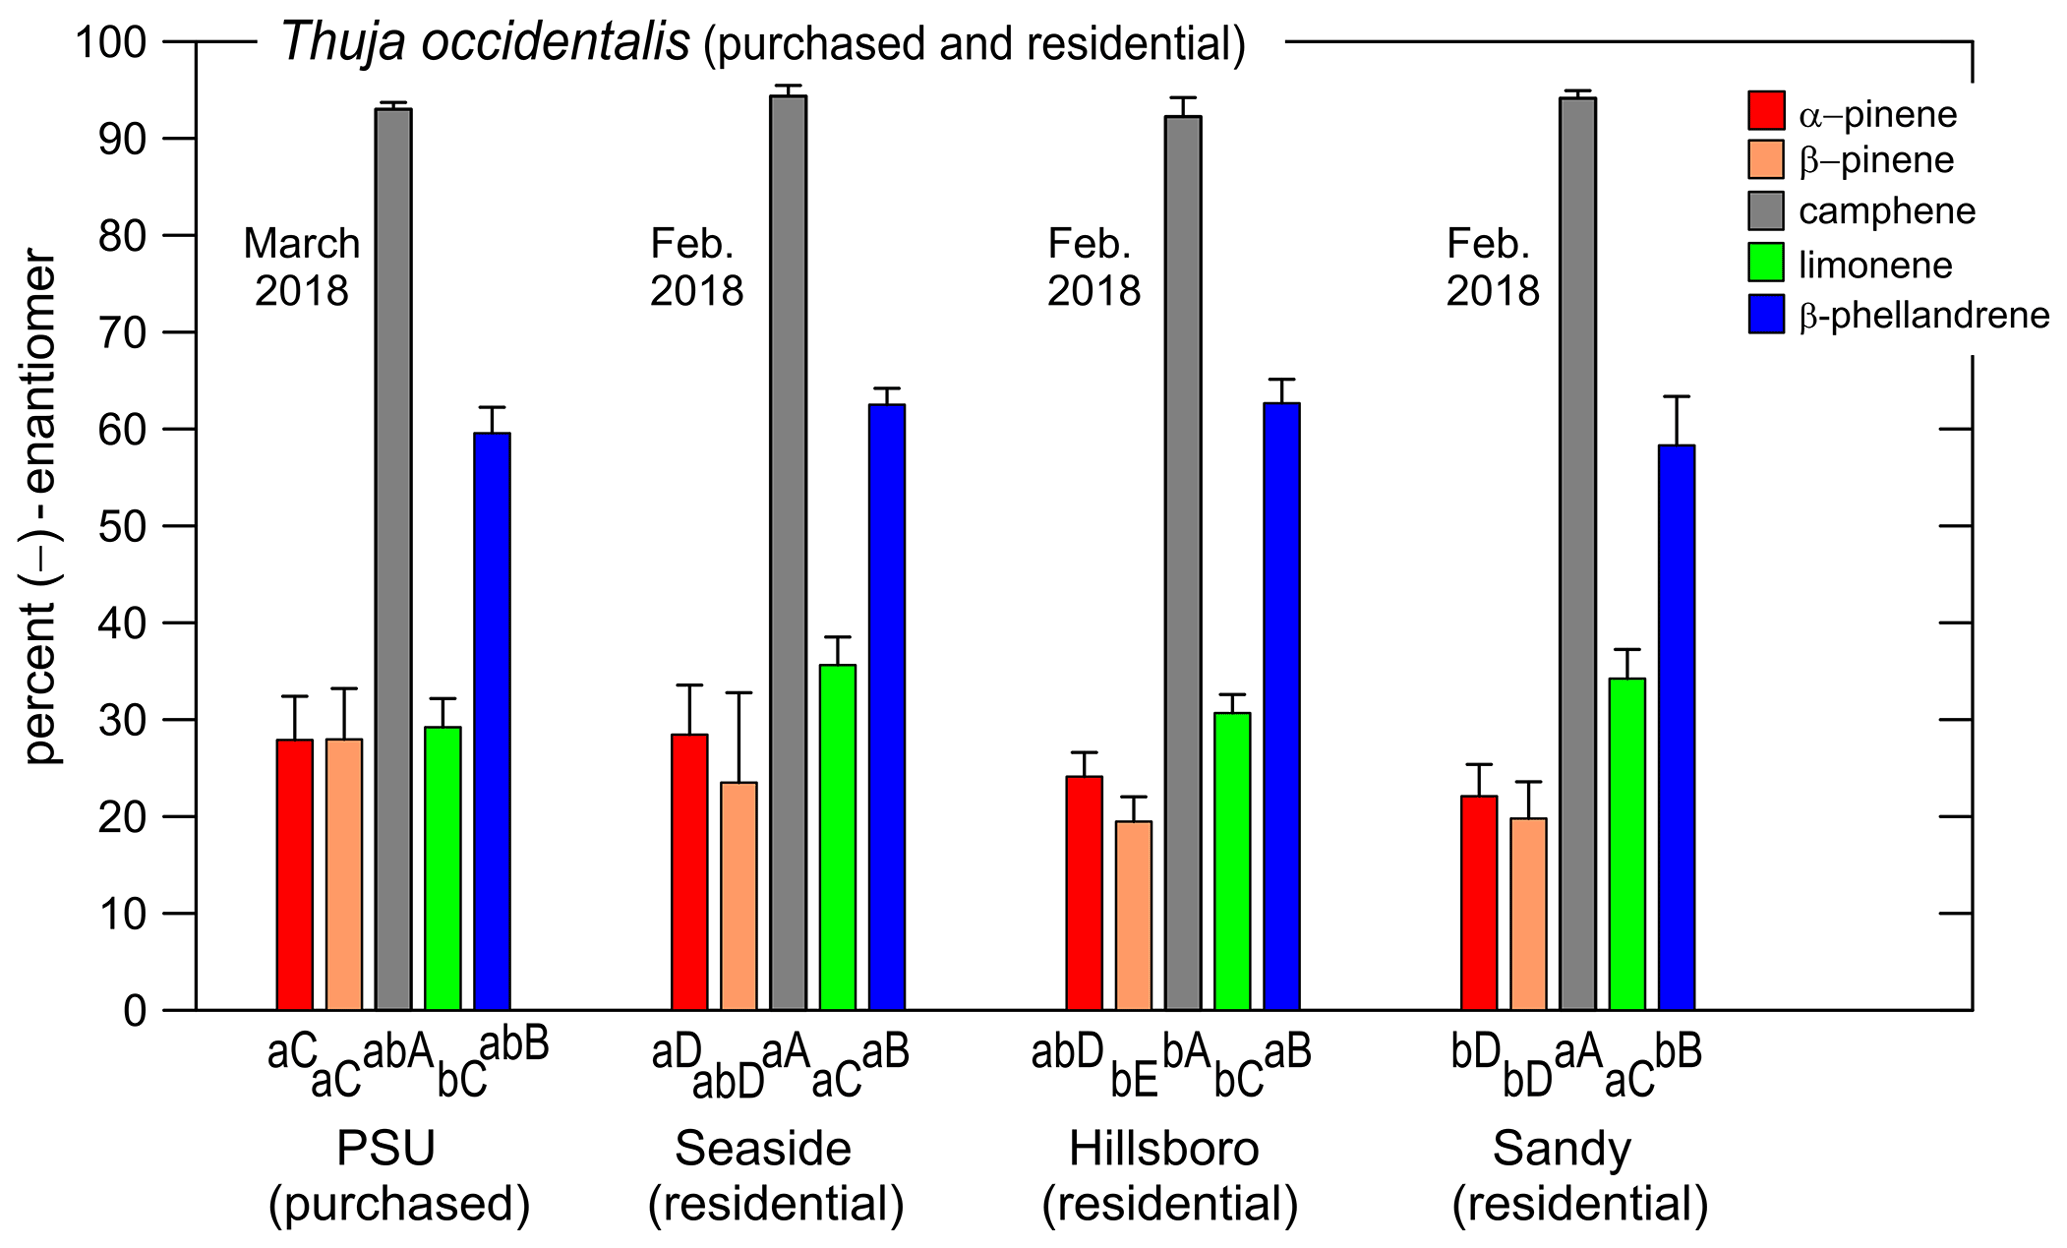
Figure 5Percent of the (−)-enantiomer for five monoterpenes in nursery-purchased (March 2018) and residential (February 2018) samples of Thuja occidentalis. For a given sample location, the largest value is designated “A”; thereafter, a different capital letter indicates a significant difference between the monoterpenes. For a given monoterpene, the largest value is designated “a”; thereafter, a different lowercase letter indicates a significant difference between the locations. The error bars are ± 1 SD. The data values are given in Table 5. The data for the “PSU (purchased)” plants also appear in Fig. 3a.
2.7 Statistical analyses
One-way analysis of variance (ANOVA) was used to analyze variables such as the proportion of monoterpenes and enantiomeric ratios among six species, as well as enantiomeric ratios in T. occidentalis under different conditions. Multiple comparisons among different species, different sampling time, and different positions were detected using the least significant difference (LSD) test, with a critical significance level of p=0.05. All analyses were performed using SPSS statistical software (version 27.0, IBM Inc., Armonk, NY, USA).
Table 6Hypothetical enantiomer peak area data with associated percent (−)-enantiomer values and associated statistical values.

a SD: standard deviation. b CV: standard deviation × 100 % mean.
3.1 Proportion of monoterpenes among different nursery-purchased species
Mass percent values among the five target monoterpenes for the six nursery-purchased species and their () × 100 % values are given in Fig. 2a and b (and Table 2a and b). These values were obtained using the combined (enantiomer pair) deconvoluted TIC peak area data for each monoterpene together with the corresponding RRFα-pinene values. α-Pinene and β-pinene were found to be the dominant monoterpenes in the two pine species P. menziesii and P. ponderosa, and α-pinene and limonene dominated in C. lawsoniana. Limonene represented more than 90 % of the five compounds for J. chinensis.
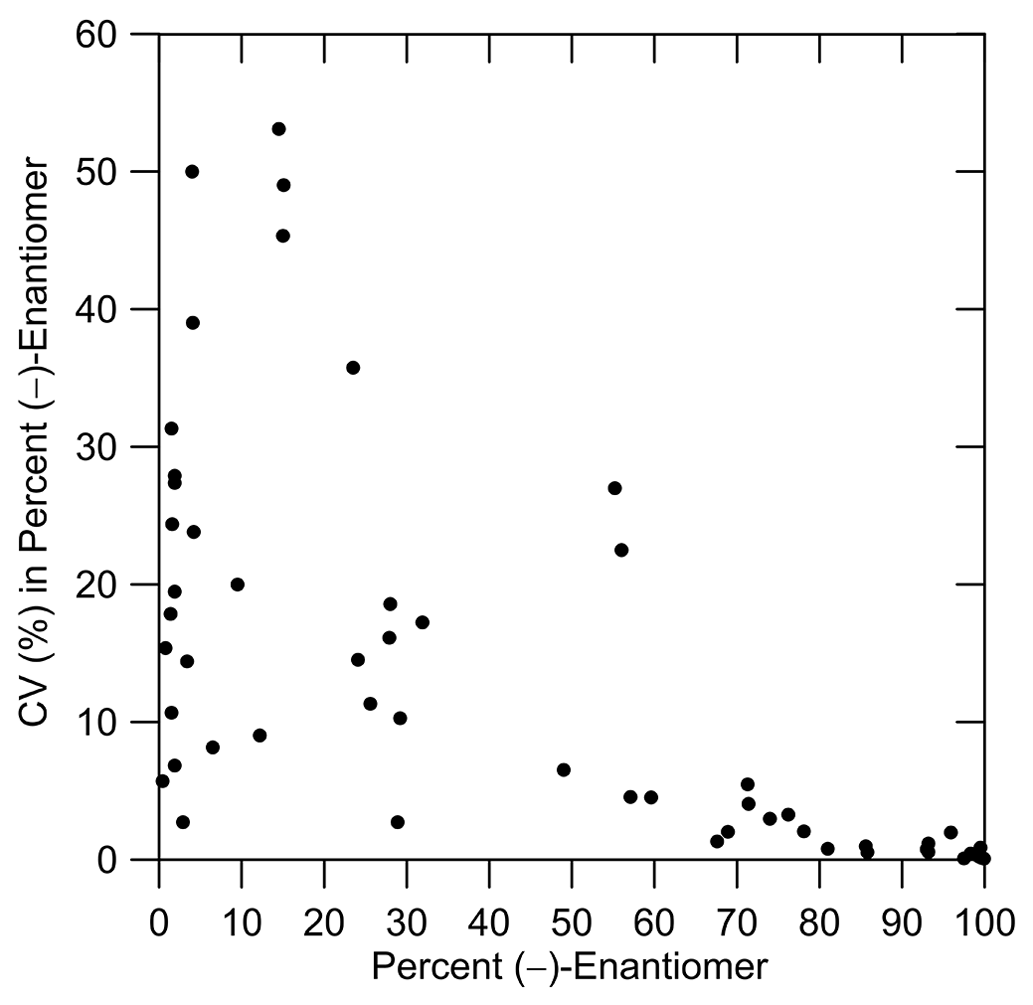
Figure 6Coefficient of variation (CV, %) values for the percent (−)-enantiomer vs. percent of the (−)-enantiomer (based on data in Table 3a and b). CV < 20 % for 75 % of the data points.
3.2 Enantiomer percentages among different nursery-purchased species
The percentages of the (−) form for the five compounds in the six species for March and June–July are given in Fig. 3a and b (and Table 3a and b). For all species, the results were similar for the two sampling times. The results for the two pine species (P. menziesii and P. ponderosa) were similar, but the results varied among the four cypress species (C. lawsoniana, T. plicata, J. chinensis, and Thuja occidentalis). In the two pine species, the percentages of the (−) form were >90 %, >90 %, and >50 % for α-pinene, β-pinene, and limonene, respectively. The lowest percentages of the (−) form for α-pinene and limonene were observed in C. lawsoniana and J. chinensis. The lowest percentages of the (−) form for β-pinene were observed in C. lawsoniana and T. plicata. The (−) form of camphene strongly dominated in C. lawsoniana. The (−) form of β-phellandrene was highest in C. lawsoniana.
3.3 Enantiomer percentages in nursery-purchased T. occidentalis from 06:00 to 21:00
The percentages of the (−) form for the five compounds in the nursery-purchased T. occidentalis plants in one day in August 2018 are given in Fig. 4 (and Table 4). The enantiomeric profiles were very similar for the four different sampling times.
3.4 Enantiomer percentages in nursery-purchased vs. residential T. occidentalis
The percentages of the (−) form for the five compounds in nursery-purchased and residential T. occidentalis plants (sampled in March 2018 and February 2018, respectively) are given in Fig. 5 (and Table 5). The enantiomeric profiles were all remarkably similar.
3.5 Enantiomer percentage method precision
When relative enantiomer abundance is expressed in terms of the percent of one of the forms, a decreasing abundance will tend to be accompanied by an increasing coefficient of variation: CV = (standard deviation of abundance mean abundance) × 100 %. For example, in the hypothetical data in Table 6, for both monoterpene 1 and monoterpene 2 the standard deviation of the (−) abundance is 0.28 %; however, for monoterpene 1 at 99 % abundance the CV value is much smaller than for monoterpene 2 at 1 % abundance. For the data in Table 3a and b obtained here, the effect of a decreasing percent for the (−)-enantiomer on the CV (%) is shown in Fig. 6. Nevertheless, CV < 20 % for 75 % of the data points. And, as with the hypothetical data for monoterpene 2, the CV values in this format provide an overly harsh view of the method precision, as will be a topic of future interest.
Because of the above property of the CV for the percent of the (−)-enantiomer at low (−)-enantiomer abundance, we note as a final point here that there is significant merit in using the log of the ratio as the measure of the enantiomer abundance. The hypothetical data in Table 6 illustrate how this measure does not suffer from a misleading inflation of the CV at low abundance of one (or by extension, the other) of the enantiomers.
The method allowed differences to be discerned in the relative abundances of the enantiomers for multiple monoterpenes in six plant species. The relative precision values tended to deteriorate at low percent values for the (−)-enantiomer; since the replicates analyses were carried out on plant sample replicates (i.e., each with a different plant subsample), that deterioration was due at least in some measure to biological variability in the subsamples.
All data for this study have been included in this paper (Tables 2–5).
YW, WL, TNR, and JFP designed the experiments. YW and WL carried out the sampling, measurements, and data reduction. YW, WL, and JFP prepared the tables and figures. JFP and YW wrote the paper.
The contact author has declared that none of the authors has any competing interests.
Publisher's note: Copernicus Publications remains neutral with regard to jurisdictional claims in published maps and institutional affiliations.
Support for this work was provided to Ying Wang by the Education Department of Jilin Province (grant nos. JJKH2016058 and JJKH20210273KJ). Additional support for the project was provided by the Maseeh Foundation.
This paper was edited by Eric C. Apel and reviewed by two anonymous referees.
de O. Piva, L. R., Jardine, K. J., Gimenez, B. O., de Olivera Perdiz, R., Menezes, V. S., Durgante, F. M., Cobello, L. O., Higuchi, N., and Chambers, J. Q.: Volatile monoterpene “fingerprints” of resinous Protium tree species in the Amazon rainforest, Phytochemistry, 160, 61–70, 2019.
Dicke, M. and Loon, J. J. A.: Multitrophic effects of herbivore-induced plant volatiles in an evolutionary context, Entomol. Exp. Appl., 97, 237–249, 2000.
Guenther, A., Hewitt, C. N., Erickson, D., Fall, R., Geron, C., Graedel, T., Harley, P., Klinger, L., Lerdau, M., McKay, W. A., Pierce, T., Scholes, B., Steinbrecher, R., Tallamraju, R., Taylor, J., and Zimmermann, P.: A global model of natural volatile organic compound emissions, Geophys. Res., 100, 8873–8892, 1995.
Inoue, R., Takahashi, K., Iiduka, Y., Arai, D., and Ashitani, T.: Enantiomeric analysis of monoterpenes in Oba-kuromozi (Lindera umbellata var. membranacea), J. Wood Sci., 64, 164–168, 2018.
López, M. F., Cano-Ramírez, C., Shibayama, M., and Zúñiga, G.: α-pinene and myrcene induce ultrastructural changes in the midgut of Dendroctonus valens (Coleoptera: Curculionidae: Scolytinae), Ann. Entomol. Soc. Am., 104, 553–561, 2011.
Ložienė, K. and Labokas, J.: Effects of abiotic environmental conditions on amount and enantiomeric composition of α-pinene in Juniperus communis L, Biochem. Syst. Ecol., 44, 36–43, 2012.
Pankow, J. F.: Gas phase retention volume behavior of organic compounds on the sorbent poly (oxy-m-terphenyl-2′,5′-ylene), Anal. Chem., 60, 950–958, 1988.
Pankow, J. F.: An absorption model of gas/particle partitioning in the atmosphere, Atmos. Environ., 28, 185–188, 1994a.
Pankow, J. F.: An absorption model of the gas/aerosol partitioning involved in the formation of secondary organic aerosol, Atmos. Environ., 28, 189–193, 1994b.
Pankow, J. F., Luo, W., Melnychenko, A. N., Barsanti, K. C., Isabelle, L. M., Chen, C., Guenther, A. B., and Rosenstiel, T. N.: Volatilizable Biogenic Organic Compounds (VBOCs) with two dimensional Gas Chromatography-Time of Flight Mass Spectrometry (GC × GC-TOFMS): sampling methods, VBOC complexity, and chromatographic retention data, Atmos. Meas. Tech., 5, 345–361, https://doi.org/10.5194/amt-5-345-2012, 2012.
Persson, M., Borg-Karlson, A., and Norin, T.: Enantiomeric composition of six chiral monoterpene hydrocarbons in different tissues of Picea Abies, Phytochemistry, 33, 303–307, 1993.
Persson, M., Sjödin, K., Borg-Karlson, A., Norin, T., and Ekberg, I.: Relative amounts and enantiomeric compositions of monoterpene hydrocarbons in xylem and needles of Picea abies, Phytochemistry, 42, 1289–1297, 1996.
Porter, W. C., Safieddine, S. A., and Heald, C. L.: Impact of aromatics and monoterpenes on simulated tropospheric ozone and total OH reactivity, Atmos. Environ., 169, 250–257, 2017.
Ruiz del Castillo, M. L., Blanch, G. P., and Herraiz, M.: Natural variability of the enantiomeric composition of bioactive chiral terpenes in Mentha piperita, J. Chromatogr. A, 1054, 87–93, 2004.
Sjödin, K., Persson, K., Borg-Karlson, A., and Norin, T.: Enantiomeric compositions of monoterpene hydrocarbons in different tissues of four individuals of Pinus sylvestris, Phytochemistry, 41, 439–445, 1996.
Song, W., Williams, J., Yassaa, N., Martinez, M., Carnero, J. A. A., Hidalgo, P. J., Bozem, H., and Lelieveld, J.: Winter and summer characterization of biogenic enantiomeric monoterpenes and anthropogenic BTEX compounds at a Mediterranean Stone Pine forest site, J. Atmos. Chem., 68, 233–250, 2011.
Song, W., Staudt, M., Bourgeois, I., and Williams, J.: Laboratory and field measurements of enantiomeric monoterpene emissions as a function of chemotype, light and temperature, Biogeosciences, 11, 1435–1447, https://doi.org/10.5194/bg-11-1435-2014, 2014.
Southwell, I., Dowell, A., Morrow, S., Allen. G., Savins, D., and Shepherd, M.: Monoterpene chiral ratios: Chemotype diversity and interspecific commonality in Melaleuca alternifolia and M. linariifolia, Ind. Crops Prod., 109, 805–856, 2017.
Staudt, M., Byron, J., Piquemal, K., and Williams, J.: Compartment specific chiral pinene emissions identified in a Maritime pine forest, Sci. Total Environ., 654, 1158–1166, 2019.
Stephanou, E. G.: Atmospheric chemistry: A forest air of chirality, Nature, 446, p. 991, 2007.
Tang, M. J., Cox, R. A., and Kalberer, M.: Compilation and evaluation of gas phase diffusion coefficients of reactive trace gases in the atmosphere: volume 1. Inorganic compounds, Atmos. Chem. Phys., 14, 9233–9247, https://doi.org/10.5194/acp-14-9233-2014, 2014.
Wibe, A. and Mustaparta, H.: Encoding of plant odours by receptor neurons in the pine weevil (Hylobius abietis) studied by linked gas chromatography-electrophysiology, J. Comp. Physiol. A, 179, 331–344, 1996.
Wibe, A., Borg-Karlson, A., Persson, M., Norin, T., and Mustaparta, H.: Enantiomeric composition of monoterpene hydrocarbons in some conifers and receptor neuron discrimination of α-pinene and limonene enantiomers in the pine weevil, Hylobius abietis, J. Chem. Ecol., 24, 273–287, 1998.
Williams, J., Yassaa, N., Bartenbach, S., and Lelieveld, J.: Mirror image hydrocarbons from Tropical and Boreal forests, Atmos. Chem. Phys., 7, 973–980, https://doi.org/10.5194/acp-7-973-2007, 2007.
Yassaa, N. and Williams, J.: Enantiomeric monoterpene emissions from natural and damaged Scots pine in a boreal coniferous forest measured using solid-phase microextraction and gas chromatography/mass spectrometry, J. Chromatogr. A, 1141, 138–144, 2007.
Yassaa, N., Custer, T., Song, W., Pech, F., Kesselmeier, J., and Williams, J.: Quantitative and enantioselective analysis of monoterpenes from plant chambers and in ambient air using SPME, Atmos. Meas. Tech., 3, 1615–1627, https://doi.org/10.5194/amt-3-1615-2010, 2010.
Zannoni, N., Leppla, D., Lembo Silveira de Assis, P.I., Hoffmann, T., Sá, M., Araújo, A., and Williams, J.: Surprising chiral composition changes over the Amazon rainforest with height, time and season, Commun. Earth Environ., 1, https://doi.org/10.1038/s43247-020-0007-9 2020.
Zhang, H., Yee, L. D., Lee, B. H., Curtis, M. P., Worton, D. R., Isaacman-VanWertz, G., Offenberg, J. H., Lewandowski, M., Kleindienst, T. E., Beaver, M. R., Holder, A. L., Lonneman, W. A., Docherty, K. S., Jaoui, M., Pye, H. O. T., Hu, W., Day, D. A., Campuzano-Jost, P., Jimenez, J. L., Guo, H., Weber, R. J., de Gouw, J., Koss, A. R., Edgerton, E. S., Brune, W., Mohr, C., Lopez-Hilfiker, F. D., Lutz, A., Kreisberg, N. M., Spielman, S. R., Hering, S. V., Wilson, K. R., Thornton, J. A., and Goldstein, A. H.: Monoterpenes are the largest source of summertime organic aerosol in the southeastern United States, P. Natl. Acad. Sci. USA, 15, 2038–2043, https://doi.org/10.1073/pnas.1717513115, 2018.