the Creative Commons Attribution 4.0 License.
the Creative Commons Attribution 4.0 License.
 | 17 Aug 2022
Combined organic and inorganic source apportionment on yearlong ToF-ACSM dataset at a suburban station in Athens
Olga Zografou
Maria Gini
Manousos I. Manousakas
Gang Chen
Athina C. Kalogridis
Evangelia Diapouli
Athina Pappa
Konstantinos Eleftheriadis
The current improvements in aerosol mass spectrometers in resolution and sensitivity, and the analytical tools for mass spectra deconvolution, have enabled the in-depth analysis of ambient organic aerosol (OA) properties. Although OA constitutes a major fraction of ambient aerosol, its properties are determined to a great extent by the mixing characteristics of both organic and inorganic components of ambient aerosol. This work applies a new methodology to a year-long ACSM dataset to assess the sources of organic and total non-refractory species in the Athens background aerosol and provides insights into the interactions between organic and inorganic species. The use of innovative tools for applying positive matrix factorization (PMF, rolling window) enables the study of the temporal variability of the contribution of these sources and seasonal changes in their composition. The mass spectra of both organic and inorganic aerosol were obtained by a time-of-flight aerosol mass spectrometer (ToF-ACSM) for PMF analysis. The results revealed five factors when organic aerosol was analysed separately. Three of them were primary OA factors: hydrocarbon-like organic aerosol (HOA), cooking-related organic aerosol (COA) and biomass burning organic aerosol (BBOA). The remaining two were secondary, less and more oxidized oxygenated organic aerosol (LO-OOA and MO-OOA respectively). The relative contributions of these factors were HOA 15 %, COA 18 %, BBOA 9 %, MO-OOA 34 % and LO-OOA 24 % (yearly averaged). When a combined organic and inorganic aerosol matrix was analysed, two additional factors were identified that were mainly composed of ammonium sulfate (83.5 %) and ammonium nitrate (73 %). Moreover, two secondary factors were resolved, containing both organics and inorganics and were named more (MOA) and less oxidized aerosol (LOA). The relative contributions on a yearly average of these factors were HOA 7 %, COA 9 %, BBOA 3 %, ammonium nitrate 3 %, ammonium sulfate 28 %, MOA 24 % and LOA 26 %.
- Article
(1704 KB) - Full-text XML
-
Supplement
(2181 KB) - BibTeX
- EndNote


The adverse effects of atmospheric aerosols on human health and the environment have been addressed by many studies (Ramanathan and Feng, 2009; Wilson and Suh, 1997; Pope, 2000; Jacobson, 2001). Particulate air pollution is one of the most important causes of respiratory diseases (Dominici et al., 2006; Medina-Ramón et al., 2006). Apart from the negative consequences on human health, atmospheric aerosol may also be considered responsible for direct and indirect effects on climate. Ambient aerosols are mixtures of different chemical components that may cause both light absorption and scattering. For example, black carbon can absorb light at all wavelengths, brown carbon absorbs ultraviolet and visible radiation (Moosmüller et al., 2009), and organic aerosol (except for brown carbon), nitrate and sulfate particles are responsible mainly for light scattering (Cabada, 2004). Additionally, aerosol particles can act as cloud condensation nuclei (CCN) particles affecting cloud microstructure and lifetime (Rosenfeld et al., 2008). The overall effect of aerosols on climate and the aerosol–cloud interaction remains highly uncertain. Therefore, it has become essential to study ambient aerosol's physical and chemical properties thoroughly.
The organic fraction comprises 20 %–90 % of ambient fine aerosols (Kanakidou et al., 2005; Chen et al., 2022). Depending on their origin and formation process, the organic aerosols can be categorized as either primary (POA) or secondary (SOA) organic aerosols. They are considered primary when they are directly emitted from a source, either anthropogenic or natural. Secondary organic aerosols are the organic aerosols that are generally formed through the oxidation of volatile organic compounds (VOCs). VOCs quickly react with oxidants, such as hydroxyl radical (OH−), ozone (O3) and NO radical, to form semi-volatile and low-volatility organic vapours (Robinson et al., 2007), which then condense onto pre-existing aerosol forming secondary organic aerosols (SOAs). SOAs can stay airborne in the atmosphere long enough to undergo continuous oxidation and growth via coagulation and gas-to-particle condensation.
Inorganic species also comprise a significant fraction of atmospheric particulate matter. Secondary sulfates are found in the atmosphere mainly in the form of (NH4)2SO4 and NH4HSO4, after the neutralization of sulfuric acid by ammonia (Biggins and Harrison, 1979). Ambient ammonium nitrate is formed through the oxidation of anthropogenic NOx emissions (NO and NO2) to nitric acid (HNO3), which eventually reacts with ammonia (NH3) (Stelson et al., 1979). Ammonia is emitted into the atmosphere from different sources and processes, such as biomass burning, vehicle emissions, livestock emissions, the use of NH3-based fertilizers and pesticides in agriculture, etc. (Behera et al., 2013; Schlesinger and Hartley, 1992). Chloride-containing particles are also released into the atmosphere during biomass combustion or are found in the form of NH4Cl (Lobert et al., 1999).
Over the years, mass spectrometry instruments have gained more reliability since their time resolution, sensitivity and selectiveness have improved, making them powerful tools for on-line and real-time chemical characterization of ambient aerosol. The time-of-flight aerosol chemical speciation monitor (ToF-ACSM) is a descendant instrument of the aerosol mass spectrometer (AMS), which enables the real-time quantification and chemical characterization of the non-refractory PM1 (particulate matter < 1 µm) species (species that rapidly vaporize at 600 ∘C under vacuum conditions): organic, sulfate, nitrate, ammonium and chloride (Fröhlich et al., 2013). The application of different source apportionment (SA) techniques (e.g. positive matrix factorization) to the derived mass spectra has enabled the in-depth investigation of the sources and formation processes of organic aerosols (Ulbrich et al., 2009; Crippa et al., 2014; Zhang et al., 2019).
Previous studies on particulate matter source apportionment in Greece have mainly focused on inorganic datasets (Karanasiou et al., 2009; Argyropoulos et al., 2017; Diapouli et al., 2017a; Manousakas et al., 2017a, b, 2020, 2021), while only a few of them focused on measurements of the organic fraction measured by aerosol mass spectrometers (AMS/ACSM) (Stavroulas et al., 2019; Florou et al., 2017; Kostenidou et al., 2015). SA of organic aerosol is typically performed using the positive matrix factorization (PMF) algorithm. One of the latest advances in source apportionment modelling is the rolling window technique (Parworth et al., 2015; Canonaco et al., 2021; Chen et al., 2021; Tobler et al., 2021) that is based on the modelling of a moving period of the initial dataset at each iteration. This technique has been found useful in order to examine the temporal variation in the identified factors and especially for the oxygenated organic aerosols, whose chemical fingerprint can vary in time. A few studies have included in source apportionment schemes both the organic fraction and the inorganics from mass spectrometric instruments (Sun et al., 2012; McGuire et al., 2014; Hao et al., 2014; Äijälä et al., 2019). All of these studies revealed that the inclusion of inorganics in SA studies improves both the solution obtained and the understanding of atmospheric processes and mixing between species. Long-term source apportionment studies on organic aerosols in recent years have covered a wide range of sites. Nevertheless, a long period of combined organic and inorganic source apportionment study spanning a period of a year has not yet been published, leaving a gap in the comprehension of ambient aerosol sources, formation processes and mixing state.
This study is the first one to present the results of two PMF analyses, one on the organic fraction and another on the combined organic and inorganic 1-year-long dataset of a ToF-ACSM. A comparison between the two solutions was performed, and the mixing state of organics and inorganics in different seasons was investigated. The validity of the retrieved factors from both analyses was assessed based on the model residuals, the statistical uncertainty of each one of the retrieved solutions and their correlation with specific external data.
2.1 Measurement site
Measurements were performed at the Demokritos station (DEM), a member of the Global Atmosphere Watch program (GAW) and part of the Aerosol, Clouds, and Trace Gases Research Infrastructure (ACTRIS) and the PANhellenic infrastructure for Atmospheric Composition and climatE chAnge (PANACEA) (37.995∘ N, 23.816∘ E), at 270 m above sea level (a.s.l.) (Eleftheriadis et al., 2021). The station is located within the National Centre for Scientific Research (NCSR) “Demokritos” campus, a vegetated area at the foot of Mount Hymettus, about 8 km to the northeast of Athens' city centre (Fig. 1). The measurement site can be considered representative of the atmospheric aerosol in the suburbs of the Athens Metropolitan Area, since during the day it is exposed to pollution transported from the urban area of Athens under most atmospheric conditions (western wind direction), whereas it is also occasionally influenced by incoming regional aerosol.
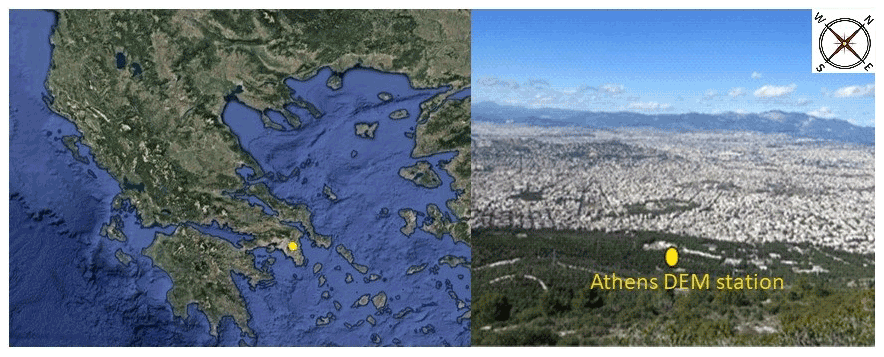
Figure 1The Demokritos Atmospheric Aerosol Measurement station in Ag. Paraskevi, Athens, Greece, DEM (GAW, ACTRIS). The maps were obtained from © Google Maps (http://maps.google.com, last access: 25 January 2022) imagery 2021 Terrametrics, Mapdata 2021 and modified by the authors.
2.2 Instrumentation
Measurements of mass concentrations of non-refractory species (NRS) of PM1 (i.e. organic; sulfate, SO; nitrate, NO; ammonium, NH; chloride, Cl−) were performed from November 2017 to October 2018 by a time-of-flight aerosol chemical speciation monitor (ToF-ACSM) (Aerodyne Research Inc., Billerica, MA, USA). The ToF-ACSM was operated with a time resolution of 10 min, and the data were afterward averaged to 30 min. The 10 min detection limit for each species measured with the ToF-ACSM is 0.062 for organics, 0.006 for SO, 0.007 for NO, 0.058 for NH and 0.003 for Cl− (Fröhlich et al., 2013). A detailed description of the instrument's main components and the principle of operation is given by Fröhlich et al. (2013). In short, the instrument sampled dried (RH < 40 % with a Nafion drier) ambient aerosol through a PM2.5 virtual impactor. The aerosol entered the instrument through the inlet system which consists of an automatic three-way valve switching system (i.e. a filter was interposed, every 20 s, into the flow of ambient air to the instrument to measure the background signal), a critical orifice (i.e. sample flow 85 mL min−1) and an aerodynamic lens. The aerodynamic lens focuses the submicron aerosol particles in a narrow beam into the vacuum chamber, at the end of which the particles impact on a heated (600 ∘C) tungsten plate. The non-refractory species are flash vaporized on the plate and subsequently ionized by electron impact (EI) at 70 eV and detected, according to their mass-to-charge ratios, by the Tofwerk time-of-flight mass analyser (ETOF).
The relative ionization efficiencies (RIEs) used for organics, NO and Cl− were 1.4, 1.1 and 1.3 respectively (Fröhlich et al., 2013), while the RIE values for SO and NH were found after calibration to be 1.2 and 3.4 respectively. Additionally, a collection efficiency (CE) correction factor was applied to all ACSM data, to compensate for particle losses during their collection. The collection efficiency chosen depends on three parameters (Middlebrook et al., 2012): firstly, on the particulate water content. To account for that, a Nafion drier was placed in the inlet line. CE also depends on the ammonium nitrate fraction of the aerosol (ANMF), which was calculated to be lower than 0.4 for 99.9 % of the data, indicating that a constant CE value of 0.5 should be optimum. Finally, it depends on the acidity of the aerosol. Based on that, the CE was calculated to be 0.52 for NDJF, 0.49 for MAM, 0.55 for JJA and 0.56 for SO, while for the yearlong period it was 0.52. Therefore, the constant value of 0.5 was selected, and this small variability should not affect the solution given also that the overall uncertainty for CE is 30 % (Bahreini et al., 2009).
The equivalent black carbon (eBC) mass concentrations were also measured by an Aethalometer AE33 (Magee Scientific Corp., Berkeley, CA 94703, USA). The AE33 provides a real-time compensation for multiple scattering in the filter matrix and loading effects using the DualSpot Technology (Drinovec et al., 2015). The light absorption coefficients and the respective eBC concentrations (using an appropriate mass absorption cross section number, MAC) at seven wavelengths (370, 470, 520, 590, 660, 880 and 950 nm) are provided by the instrument. In this study, the eBC concentrations are reported at λ=880 nm (Petzold et al., 2013), considering a MAC number to convert absorption coefficient to eBC concentration equal to 4.6 m2 g−1 (Kalogridis et al., 2018). Additionally, the contribution of wood burning and fossil fuel to the total eBC mass concentrations can be found with application of the Aethalometer model as described by Sandradewi et al. (2008) and shown in Eqs. (1)–(3):
where αff and αwb are the absorption Ångström exponents for pure fossil fuel combustion and pure wood burning aerosol respectively; babs(λUV) and babs(λIR) are the absorption coefficients measured at the UV (470 nm) and IR (950 nm) wavelengths, and babs(λUV)wb and babs(λIR)wb as well as babs(λUV)ff and babs(λIR)ff are the corresponding absorption coefficients at these two wavelengths that are related to wood burning (wb) and fossil fuel combustion (ff). According to the earlier sensitivity study for our area, αff and αwb values were found to be equal to 0.9 and 2 respectively (Diapouli et al., 2017a; Kalogridis et al., 2018).
In addition, the elemental carbon (EC) and organic carbon (OC) mass concentrations were measured by the thermo-optical transmittance method (OC EC semi-continuous field analyser, Sunset Lab, Inc.). The instrument collected aerosol samples on a 3 h basis from a PM2.5 cut-off inlet and a flow rate of 8 L m−1. The sampling inlet was equipped with an activated carbon denuder for the removal of organic gases from the air stream (Diapouli et al., 2017b). The sample analysis was performed applying the EUSAAR2 thermal protocol (Panteliadis et al., 2015). Moreover, a high-energy polarization geometry energy-dispersive X-ray fluorescence spectrometer (Epsilon 5 by PANAnalytical, Almelo) was used for analysis on PM2.5 filters, which measured the following elements: Na, Mg, Al, Si, S, Cl, K, Ca, Ti, V, Cr, Mn, Fe, Co, Ni, Cu, Zn, Br, Sr and Pb (Manousakas et al., 2017b). Nitrogen oxides (NOx) and ozone (O3) measurements with a 1 h time resolution were obtained from the air quality monitoring station of the Greek Ministry of Environment and Energy air quality network located at the grounds of the NCSR Demokritos campus. Standard meteorological parameters (T, solar radiation, RH, wind speed and wind direction) were recorded at an hourly time interval. The meteorological sensors were installed on a meteorological mast, at 10 m height above ground.
2.3 Positive matrix factorization (PMF)
The data derived from the ToF-ACSM were analysed using the Aerodyne software Tofware version 3.2. The concentration in nitrate-equivalent mass and the error matrices of each species were exported from Tofware for further assessment via the PMF model. The method was implemented within the Source Finder Pro software package (SoFi Pro, Datalystica Ltd, Villigen, Switzerland) that uses the multilinear engine ME-2 (Paatero, 1999) as a PMF solver (Canonaco et al., 2021). PMF is a bilinear model used to describe a non-negative matrix X using two factors (G and F), while there is also a residual matrix (E) containing the data that could not be described with G and F (Eq. 4):
For our data, the matrix X is the mass spectra of organics or total NRSs through time, G is the time series of each factor and F is the matrix of the factors' profile as described by Eq. (4).
The aim of this model is to find the minimum of the quantity Q, which is the sum of the square of the ratio of the residuals (e) to the uncertainties (σ) of all the X matrix data as given by Eq. (5):
where m is the number of rows of F and n is the number of columns of the matrix G. The minimization of this quantity ensures that data points with low signal-to-noise ratio are taken less into consideration.
Partially constrained G and/or F matrix, or the a-value approach, is one of the techniques used in order to cope with the model's rotational ambiguity, which is the potential of F and G matrices to rotate, thus giving a very high number of solutions. The a value represents the value to which the solution is supposed to vary from a reference value as shown in Eqs. (6) and (7):
where fj and gi are rows and columns of the matrices F and G respectively.
An important feature of the SoFi Pro software is that it enables the user to apply specific or random a values to constrain the input profiles and/or time series with auxiliary reference data (Canonaco et al., 2013). Moreover, SoFi supports the downweighting of the data for which the signal-to-noise ratio is low, in order to minimize their effect on the solution. In order to assess the statistical uncertainty resulting from the changes in factor profiles, a resampling strategy is usually applied in PMF modelling, called bootstrapping (Efron, 2000). This uncertainty is estimated based on variations in the obtained factor profiles coming after the rearrangement of the original input that generates a new set of initial matrices at each iteration. SoFi Pro includes the rolling window technique that allows the user to track the variability of the factors by applying a window with selected length (usually 7, 14 or 28 d, depending on the size of the studied dataset) that moves with a chosen step. Calculations are repeated in that moving span, providing the temporal changes in both profile and time series of the factors (Canonaco et al., 2021).
2.4 Wind air mass trajectory analysis
To investigate the potential location of NRS emission sources, wind and air mass backward trajectory analysis was performed. The wind analysis used the conditional probability function (CPF) to provide directional information concerning the major sources of NRS. The CPF calculates the probability that in a particular wind sector and wind speed interval, the concentration of a species is greater than some specified value, which is usually expressed as a high percentile of the species of interest (e.g. 75th percentile). In the present study, CPF analysis was performed by using the OpenAir software (Carslaw and Ropkins, 2012). A wide range of percentile values was examined to get a more complete insight into the sources of each species and each factor.
To assess the potential influence of long-range transport events to NRS concentrations, the air mass backward trajectories were calculated using the NOAA Hybrid Single-Particle Lagrangian Integrated Trajectory (HYSPLIT-4) model (Draxler and Hess, 1998; Stein et al., 2015). The 120 h backward trajectories were computed every hour, at a height level of 1000 m above ground level (a.g.l.) using the Global Data Assimilation System (GDAS) meteorological dataset and then further analysed using ZeFir v3.7 (Petit et al., 2017) for the identification of the potential aerosol sources from the potential source contribution function (PSCF). The PSCF values can be interpreted as a conditional probability describing the potential contribution of a grid cell to the high air pollutant loadings at the receptor site. Specifically, the basis of PSCF is that if a source is located at (i,j), an air parcel back trajectory passing through that location indicates that material from the source can be collected and transported along the trajectory to the receptor site. The PSCF is calculated as shown in Eq. (8):
where nij is the number of times that the trajectories passed through the cell (i,j) and mij is the number of times that a source concentration was high when the trajectories passed through the cell (i,j). The criterion for determining mij is based on the distribution of the measured values (i.e. 90th percentile).
3.1 Data analysis
In the present study, two different PMF analyses were performed to apportion the sources of organic and inorganic aerosol. The first analysis included only the mass spectra of the organic aerosol (organic aerosol matrix), whereas in the second analysis the mass spectra of organic and inorganic aerosol (combined matrix) were combined for PMF analysis, in order to investigate the sources of the total non-refractory PM1 aerosol. In the following, profile refers to the mass spectrum of a given factor and variable refers to an individual mass-to-charge ratio ().
For the deconvolution of the sources of the total NRSs, the organic and inorganic variables and error time series matrices were exported from Tofware for each species separately (org, SO, NO, NH, Cl−) without applying RIEs or the CE correction, with a time resolution of 10 min, which was then averaged to 30 min. In order to create the combined matrix, the variables of the inorganics that are characteristic for each species were added to the organics matrix; these are 18, 32, 48, 64, 80, 81 and 98 for SO; 30 and 46 for NO,; 16 and 17 for NH; and 35 and 36 for Cl−. The variables of inorganic species selected as representative correlated perfectly with the respective species (R2 ≈ 1) and accounted for the major fraction of their total mass concentration (> 76 %). The error values for each inorganic variable were downweighted before PMF analysis by a factor of (Ulbrich et al., 2009), where N is the number of ions of each species that are duplicate according to the fragmentation table (Allan et al., 2004).
In order to correct the results from nitrate-equivalent to real-mass concentrations, the RIEs and CE needed to be applied. This took place easily in the case of the organic matrix, by dividing the respective variables with the CE (0.5) and RIE of organics (1.4). In the case of the combined matrix though, the factors contained more than one species, so the application of the RIEs was more complicated. The time series of each factor were decomposed to the time series of all the variables that constitute each factor using SoFi. Then, at each variable, the RIE of the respective species that this variable belonged to was applied, as was the CE, and afterwards the time series of these variables were added to form the initial factor time series. After applying PMF analysis, the mass concentration of each species was calculated based on the contribution of the variables included in the initial matrix to the total mass concentration of each species.
3.2 PMF analysis and factor identification
The first step for source apportionment was to perform PMF analysis on the winter months (November–February) in order to identify the number of factors. For this purpose, unconstrained winter simulations took place examining a broad number of sources (3–12 factors). To identify the optimum number of factors, the slope of the Q/Qexp plot was examined, as well as the residuals of the diurnals and of the factor profiles. This resulted in a five-factor solution for the organic aerosol matrix and a seven-factor solution for the combined matrix. As previously mentioned, the OA matrix was described by hydrocarbon-related OA (HOA), cooking OA (COA), a biomass burning OA (BBOA) and two secondary OAs (MO-OOA and LO-OOA). The combined organic–inorganic matrix was best described with the same primary factors, two secondary inorganic factors (ammonium sulfate and ammonium nitrate) and two secondary aerosols (MOA and LOA). The next step for both analyses was to study each season separately, applying random a values from 0 to 0.5 to the constant profiles of the primary factors and enabling the bootstrap technique for 100 simulations in order to assess the uncertainties and check the stability of the solution obtained. Specific criteria were applied to the organic matrix to select the environmentally reasonable solutions (Chen et al., 2021), which are summarized in Table S1 in the Supplement. Specifically, the correlation between HOA and eBCff was used as a criterion for this factor, and for BBOA its correlation with eBCwb was used as well as the variation of 60, 73 and 115 explained by this factor. A t test was also used for these criteria, and a p value lower than 0.05 was chosen; more details of the t test were introduced in the Supplement of Chen et al. (2021). In the case of the COA factor, the ratio of its concentration at lunchtime (14:00 local time) over its concentration in the morning (average COA concentration between 09:00 and 10:00 LT) was chosen to be larger than 1. Concerning the SOAs, the fractions of 43 and 44 were monitored and set to be higher than 0.
PMF analysis was then conducted on a subset of data defined by a small window of 14 d that was moved in 1 d increments across the entire dataset and as such allowed the capture of the variations in the factor profiles (Canonaco et al., 2021). This resulted in a total of 17 200 runs. The mass spectra of the three primary factors obtained through the seasonal PMF simulations were used afterwards as reference profiles for the rolling window runs. In order to select the best solutions, the same criteria for selection were used as described before (Table S1). The averaged solution for both organic aerosol and combined matrix analyses is further discussed in Sect. 4.
It needs to be mentioned that in the combined matrix analysis, for the deconvolution of organic and inorganic sources, the primary OA factors and the two inorganic factors (ammonium sulfate and ammonium nitrate) were constrained with the respective factors identified in winter under the unconstrained simulations, for both seasonal and rolling PMF simulations. Overall, tighter constraints than those applied in the OA modelling were used, allowing for a maximum variability from the anchor profiles of up to ±20 % (random a value 0–0.2). The criteria used in this case were the same as that of the OA interpretation that appears in Table S1.
4.1 Fine aerosol chemical characterization
4.1.1 Seasonal and diel variability
In Fig. S1 the time series of the NRS derived from the ToF-ACSM are presented. All time-related plots are in local time. The time series imply strong temporal variation in the NRS mass concentration. The maximum 30 min average total NRS concentration recorded during this campaign was 61.6 µg m−3, while, overall, the total NRS concentration was higher than 5 µg m−3 for 74 % of the period studied. As highlighted in Table S2, the organic fraction, as well as the total NRS concentration, presented higher values in spring and summer rather than winter at our site. This was probably connected to the topographical characteristics of our site, which is located at the suburbs of Athens. In winter, higher contribution of the anthropogenic emissions (e.g. BBOA) to the total organic mass concentration was observed compared to spring and summer. In the latter case, the absence of precipitation and the increased production of biogenic volatile organic compounds in the forest near our station (Lappalainen et al., 2009) combined with enhanced photochemical activity may have led to higher formation of SOA, consequently resulting in higher organics concentrations (Table S2). Simultaneously, sulfate levels were the result of regional transport, photochemical activity and local meteorology. The regional character of sulfate for all seasons is indicated by the HYSPLIT back trajectories in Fig. S2. In winter, sulfate values are lower due to enhanced precipitation, although regional sulfate was being transported to the station, while in the other seasons regional transport combined with local photochemical activity and less precipitation results in higher sulfate values (Stavroulas et al., 2019; Theodosi et al., 2018; Cusack et al., 2012; Dayan et al., 2017). Nitrate, which is semivolatile, presented, as expected, higher concentrations in the cold months when the lower temperature favours the formation of ammonium nitrate and partitioning nitrate into the particle phase, instead of the gas phase in which it appears when the temperature rises and nitrate is predominantly in the HNO3 form (Lin and Cheng, 2007). Ammonium presented higher concentrations in warmer months, following a similar pattern to that of sulfate. Chloride exhibited its highest concentration in winter, correlating its emission to biomass burning, as was also resolved by the combined matrix PMF analysis discussed in Sect. 4.2.2.
In comparison to the results reported in a previous study conducted in the centre of Athens (Stavroulas et al., 2019) by the National Observatory of Athens (NOA), the suburban site presented lower concentrations for all NRSs in wintertime, which is mainly attributed to the higher anthropogenic emissions that generally occur in the urban area of Athens. Specifically, we observed that all NRSs presented concentration levels 3 to 4 times lower than those at the centre of Athens in winter except for sulfate for which concentrations were more similar. For the other seasons, the inorganic species presented similar concentration levels at both sites (i.e. higher contribution of secondary aerosol than primary emissions to the observed NRS levels), while organics were higher at the suburban site in spring and autumn. This is probably related to the enhanced SOA formation at the suburban area, which is dominated by pine tree vegetation. Black carbon exhibits lower concentrations in the suburbs, in agreement with the comparison study conducted by Kalogridis et al. (2018).
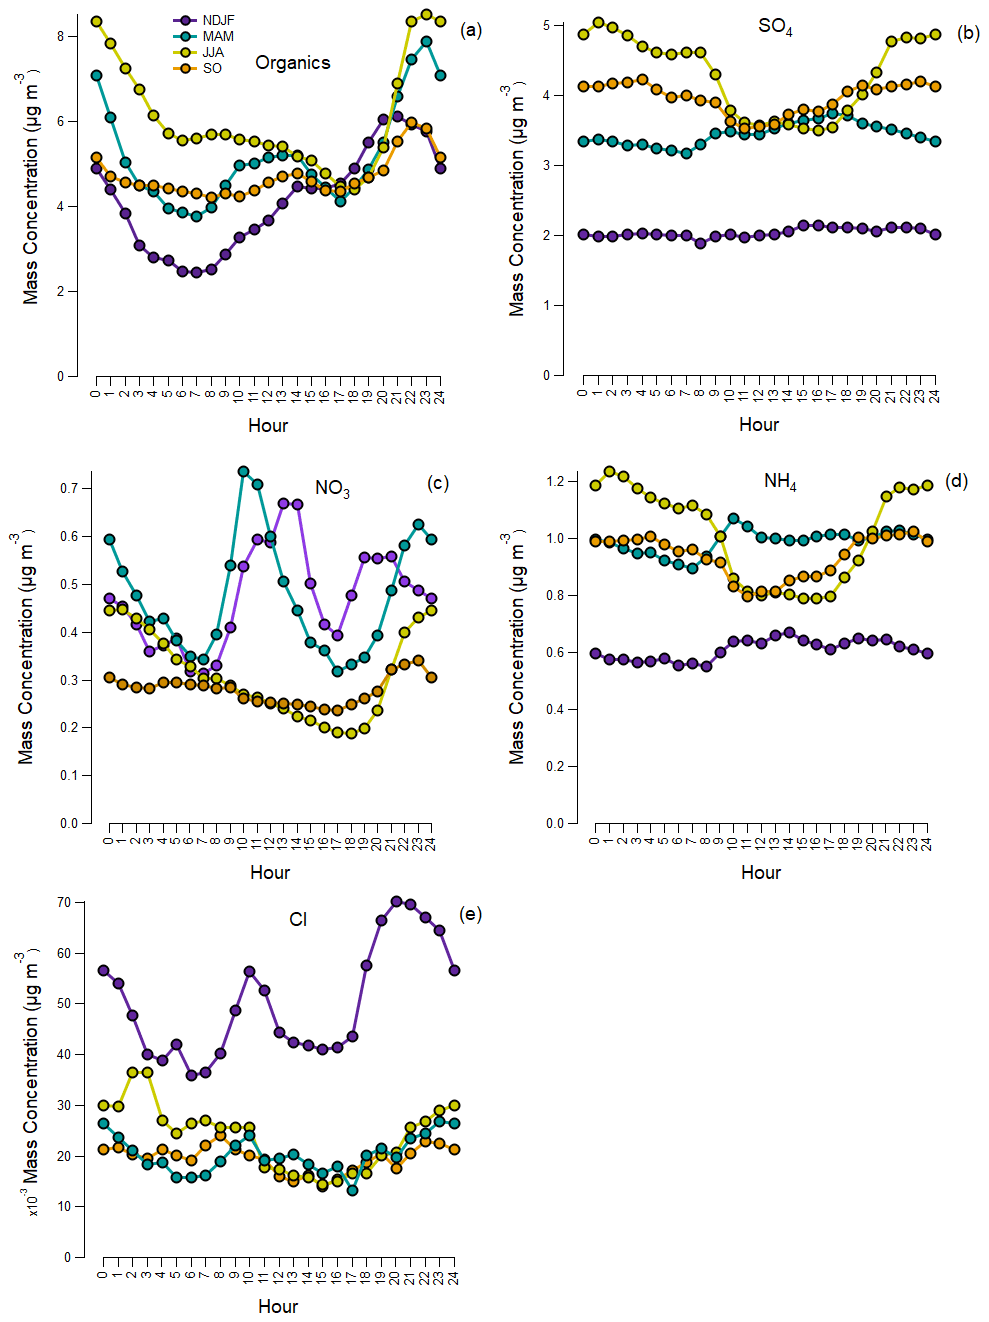
Figure 2Mean diurnal variation in hourly concentrations of organics (a), sulfate (b), nitrate (c), ammonium (d) and chloride (e) for each period: November–February (NDJF), March–May (MAM), June–August (JJA) and September–October (SO) in local time.
Figure 2 presents the daily variability of NRS for each period studied. Nitrate always increased during the night. However, in winter and spring a distinct morning peak also appeared, which is probably linked to photochemical activity, meteorological conditions (gas-to-particle equilibrium) and ammonia availability. On the other hand, the diurnal profile of sulfate was flat in winter, consistent with regional sources and meteorological conditions that do not favour local photochemical activity. In spring, summer and early autumn sulfate presents a diurnal structure that is related to local photochemical activity and boundary layer height. Ammonium seasonal diurnal variability agreed quite well with that of sulfate. Chloride presented two distinct peaks (i.e. morning and evening) for all the seasons, related to temperature-dependent gas–particle partitioning of chlorine (i.e. chloride is primarily detected as ammonium chloride), biomass burning emissions and prevailing atmospheric conditions. The organic fraction showed a midday–early afternoon peak and an evening peak. Its diurnal cycle was most likely a combination of primary emissions from various sources and secondary aerosol formation during the day. It has to be noted that all NRSs appeared to have increased concentrations during the night, which may also be attributed to the increased atmospheric stability during the night (shallow nocturnal boundary layer).
On average, during the period of this campaign particulate matter consisted of 51.3 % organics, 34.7 % sulfate, 9.4 % ammonium, 4.4 % nitrate and 0.2 % chloride. In Fig. S3 the wind rose plots for each season appear, while Fig. S4 presents the seasonal bivariate CPF polar plots for all NRSs to investigate the potential source regions of these species. The polar plots for organics showed the highest concentrations for low and moderate wind speeds near the centre area as well as in the SE and NE directions indicative of both local emissions and regional transport. High concentrations of sulfate were observed for low, moderate and high wind speeds from the SE sector, suggesting that a combination of local emissions and regional and long-range transport may significantly contribute to the observed sulfate levels. This was also the case for ammonium, underlying the common origin of these species. Nitrate was primarily locally produced. The high potential source region of particulate nitrate coincided with the one observed for NOx, linking the particulate nitrate with the traffic-related NOx emissions (vehicle exhausts). High concentrations of chloride were observed at relatively low wind speed, implying that it was rather locally emitted, probably linked to local secondary aerosol formation and biomass burning emissions, as will also be discussed in Sect. 4.3.
4.1.2 Data from collocated instruments
Figure S5 depicts the time series of auxiliary data from collocated instruments, that is eBC, NOx, O3, EC OC, temperature, relative humidity, wind speed and wind direction. As shown, equivalent BCff presented a quite stable contribution to ambient particulate matter throughout the year, while eBCwb had a stronger influence in winter as expected due to biomass burning emissions related to residential heating. During the study period, the cold months (October–March) were characterized by high humidity (74 % mean) and relatively low temperatures (12.7 ∘C mean), while the warm months (May–September) were characterized by moderate humidity (54 % mean) and temperature (24 ∘C mean) levels. The prevailing wind speed and direction are presented for each season. As highlighted also in Fig. S3, winter was influenced mainly by southwestern winds, implying a significant contribution from the emissions related to anthropogenic activities from the city centre. In spring the air masses originated mainly from the southwest (urban city centre) and southeast (downslope wind) directions, possibly associated with Saharan dust events as well. In summer, the wind originated mainly from the southeast and northeast directions, underlying the role of regional transport along with the local aerosol emissions and formation processes, while in September and October the measurement site was mainly affected by northwestern wind directions (regional and long-range-transported aerosol).
4.2 PMF analysis of organic aerosols
The profiles of the five factors for 10 to 100 are presented in Fig. 3a, along with the time series (Fig. 3b) and the diurnal variation patterns (Fig. 3c) of the respective mass concentrations. The remaining part of the mass spectrum is depicted in Fig. S6. In Fig. S7a, the polar plots present the spatial distribution for each factor, while in Fig. S7b the polar plots for external data (eBCff, eBCwb, NOx and O3) are depicted. The relative contribution and actual mass loadings for each factor and season are summarized in Table S3. The mass spectra, diurnal variations and potential sources of these factors will be discussed in detail in the following sections.
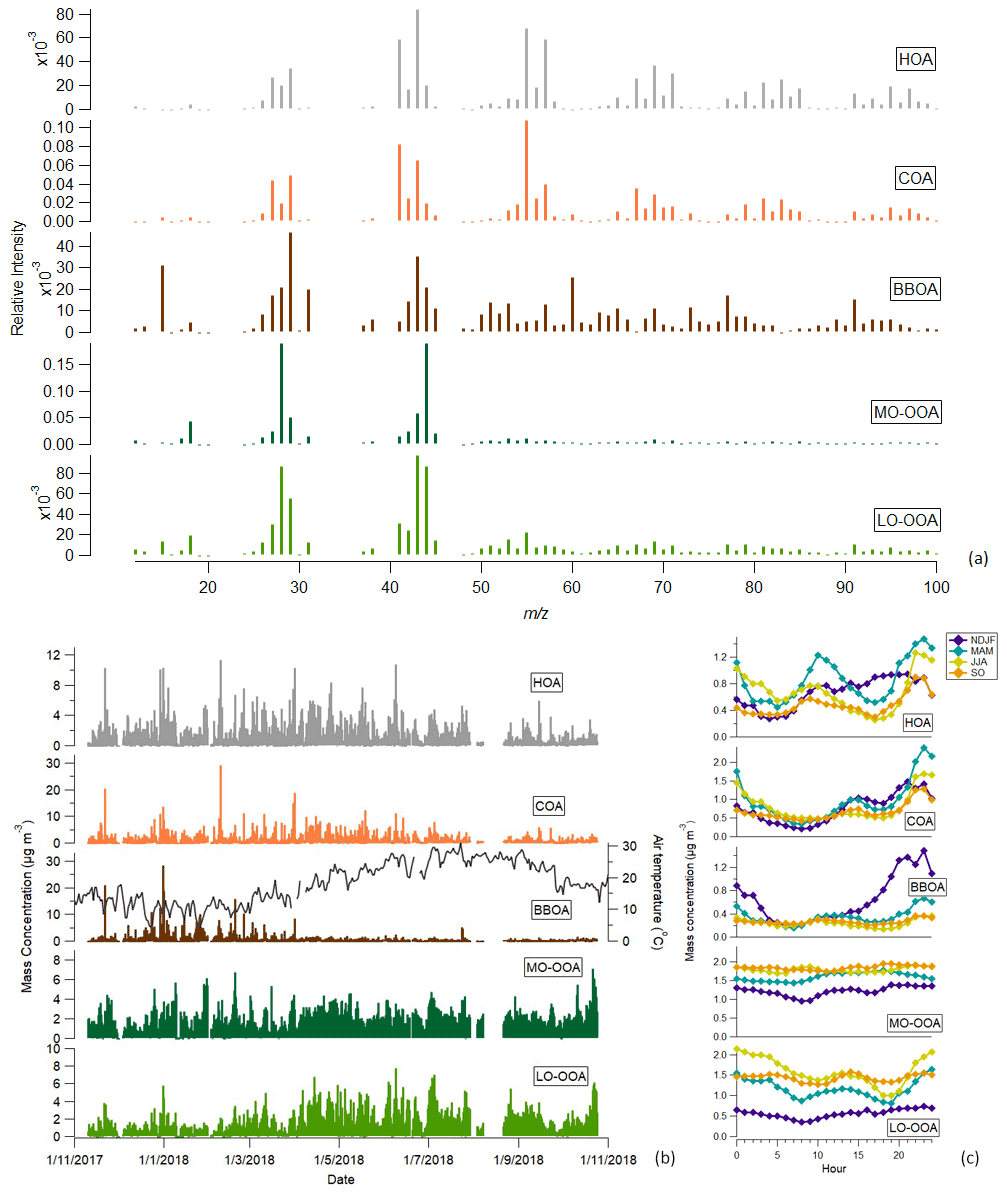
Figure 3Mass spectra (a), time series (b) and diurnal trends (c) of the five organic aerosol factors.
4.2.1 Primary organic aerosols
The hydrocarbon-related (HOA) factor, linked to fossil fuel combustion emissions, was identified based on its distinctive mass spectrum and attributed to the traffic-related emissions from the urban area of Athens, which are transported to the measurement site under westerly wind directions (Fig. S7a). From the plots in Fig. S7b it can be seen that HOA shared the same emission origin with NOx and eBCff. The HOA profile was dominated by peaks characteristic of the alkanes, with a high contribution of at 27, 41 and 55 (CnH) and 29, 43 and 57 (CnH) (Zhang et al., 2005). The fingerprint of the traffic-related factor profile has been identified to be quite stable over spatially different sites across Europe (Crippa et al., 2014). In the present study, the unconstrained HOA profile obtained was highly correlated with the HOA profile from Crippa et al. (2013) (R2=0.98), which is typically used to constrain the HOA profile in urban environments. The HOA factor presented an overall good correlation with the time series of fossil-fuel combustion indicators like NOx (R-Pearson = 0.69), eBCff (R-Pearson = 0.69) and EC (R-Pearson = 0.58) as shown in Table S4. The good agreement between the HOA and the traffic-related external parameters validated the correct identification of the HOA profile and the accurate separation of COA from HOA. In general, the peaks observed at the time series of this factor coincided with peaks also observed in the respective external data time series, eBCff and NOx, except for the peaks observed on 8 February (connected to cooking emissions) and at the end of March, which both will be discussed in detail below. The diurnal variability of HOA's mass concentration presented two peaks, one morning peak at 09:00 LT and one evening peak at 21:00 LT, coinciding with the morning rush hours and the evening traffic emissions and the shallow nocturnal boundary layer. As summarized in Table S3, HOA's average contribution to the total OA was 15 %, with its seasonal contribution at 18 % for winter and spring decreasing to 10 %–13 % in summer and early autumn. The latter decrease in HOA mass concentration and OA contribution was expected, since traffic-related emissions are reduced during the summer in Athens (Stavroulas et al., 2019), while SOA formation is enhanced.
The mass spectrum representative of cooking emissions was also identified in our study. The chemical fingerprint of the COA factor profile was similar to HOA's, as the same variables that dominated the HOA profile were also present in the COA emissions profile, but the at 55 was the prevailing one. On 8 February, a distinct peak in COA was observed that was related to the barbecue festival “smokey Thursday”. The simultaneous peak observed on that day in HOA time series was attributed to the enhanced organic aerosol emissions during this event that impede the model from separating the two factors. The diurnal variability pattern of COA mass concentration presented a bimodal pattern (Fig. 3c), with the two peaks coinciding with lunch and dinner time. The OA loading from cooking emissions over the day was lower than the loading from traffic, with a total duration of 8 h. COA's seasonal contribution to total OA followed the same trend as HOA, decreasing from 19 % in colder months to 14 %–16 % in warmer months, while the average contribution of this factor was 17.7 %. As shown in Fig. S7a, this factor had a local character, linked to the cooking emissions originating from the urban environment in close proximity to the measurement site.
We were able to resolve a factor dominated by wood burning ( 60 and 73) and PAH ( 77, 91, 115, 128, 165, 167) tracers. In order to ensure that the PAHs presented in the BBOA profile were attributed to biomass burning (Li et al., 2009), we conducted PMF runs constraining the profile of our BBOA factor with the BBOA profile retrieved from another study (Ng et al., 2011), trying to resolve a PAH-related factor in case it exists; no environmentally reasonable solution could be reached. Additionally, since PAHs can also be generated by gasoline car exhaust emissions (Okuda et al., 2010), we constrained our HOA and BBOA profiles up to the variables at 100 and conducted 100 simulations. Afterwards, using the criteria list, we eliminated the runs in which the PAH-related variables were attributed to HOA instead of BBOA and found out that for more than 70 % of the simulations these variables were associated with BBOA. Other PAH sources may include coal combustion (Okuda et al., 2010), but coal is generally not used in Greece for heating purposes, while the correlation of this factor with industry-related markers measured by XRF analysis on PM2.5 filters was very low (Pearson R < 0.2 between BBOA and Pb, Cu, Mn, Zn, Sn, Cr, Cd, Rb, S, Fe, V, Ni). Moreover, polar plots revealed no connection between this factor and port emissions (Fig. S7a). Thus, we concluded that this factor indeed originated primarily from biomass burning. The time series of this factor highly correlated with the time series of the wood burning fraction of eBC (eBCwb) obtained from the Aethalometer (Pearson R = 0.74), as illustrated in Table S4. The strong dependence of the concentration of biomass burning on the temperature is also depicted in Fig. 3b, where it is clear that the increased contribution of BBOA to OA concentrations generally occurred at low temperature (wintertime). However, the peaks in the time series of this factor were also connected to wild forest fires, like the one that occurred on 23 July in the region of Attica. In any case, all these peaks observed in the BBOA time series were also confirmed by peaks in the eBCwb time series. The winter contribution of BBOA to OA mass concentration was close to 18 % in winter and decreased to 5 % in summer (Table S3). BBOA's spatial distribution (Fig. S7a) confirmed the strong local character of this factor, although long-range transport from the north sector may also have contributed to the increased BBOA levels.
4.2.2 Oxygenated organic aerosols
The oxygenated organic factors retrieved in the current study were of two types: one more oxidized oxygenated organic aerosol (MO-OOA) and one less oxidized (LO-OOA). Oxygenated organic aerosols (OOAs) have as main tracers the variables at 28, 29, 43 and 44. The MO-OOA profile was dominated by 44 (corresponding to the CO2+ ion) instead of 43; the fraction at 44 (f44) provides information regarding the degree of oxygenation of the respective factor. On the other hand, the LO-OOA mass spectrum was represented by almost equal contributions of 43 and 44 (C2H3O+) (Ulbrich et al., 2009). LO-OOA was significantly affected by temperature and presented a pronounced seasonal variation pattern (Fig. 3b). LO-OOA's contribution to OA mass concentration in summer (31 %) was double that of winter (14 %) (Table S3). MO-OOA's contribution to the total OA was on average 34 % with no significant seasonal variability. LO-OOA exhibited similar correlation with the three inorganic ions (SO, NO and NH), except for summer when it was highly correlated with NO. MO-OOA showed good correlation with SO and NH in all seasons and with NO only in September–October. These relationships imply the complicated internal mixing of organic and inorganic species that will be further discussed in Sect. 4.3. From the polar plots presented in Fig. S7 it can be seen that the areas where the probability of SOAs were higher were similar to those of the oxidants NOx and O3. More specifically, MO-OOA originated from areas rich in both NOx and O3 concentrations, while LO-OOA was mainly found on the NE and SE of our station, where O3 primarily appeared. This highlights possibly different oxidation mechanisms that take place to form the two types of SOAs in our site.
4.3 PMF analysis of submicron aerosols
Figure 4 depicts the average profiles (Fig. 4a) of the seven factors resolved from the combined input matrix PMF analysis for up to 100. The profiles are the result of the average of 100 simulations, after applying the bootstrap technique and a rolling window of 14 d for the PMF runs. In the same figure, the time series (Fig. 4b) and the diurnal trends (Fig. 4c) of each factor are presented, while Table S5 shows the actual mass loadings of each factor and their relative contribution to the total NRS mass concentration for each season. Figure S8 presents the mass spectrum of NRS factors for 100–200, and Fig. S9 depicts the CPF polar plots of the seven sources identified. Figures S10 and S11 survey the contribution of each species in the NRS factors and the contribution of each NRS factor in the non-refractory species respectively in both relative (Figs. S10a and S11a) and absolute (Figs. S10b and S11b) terms.
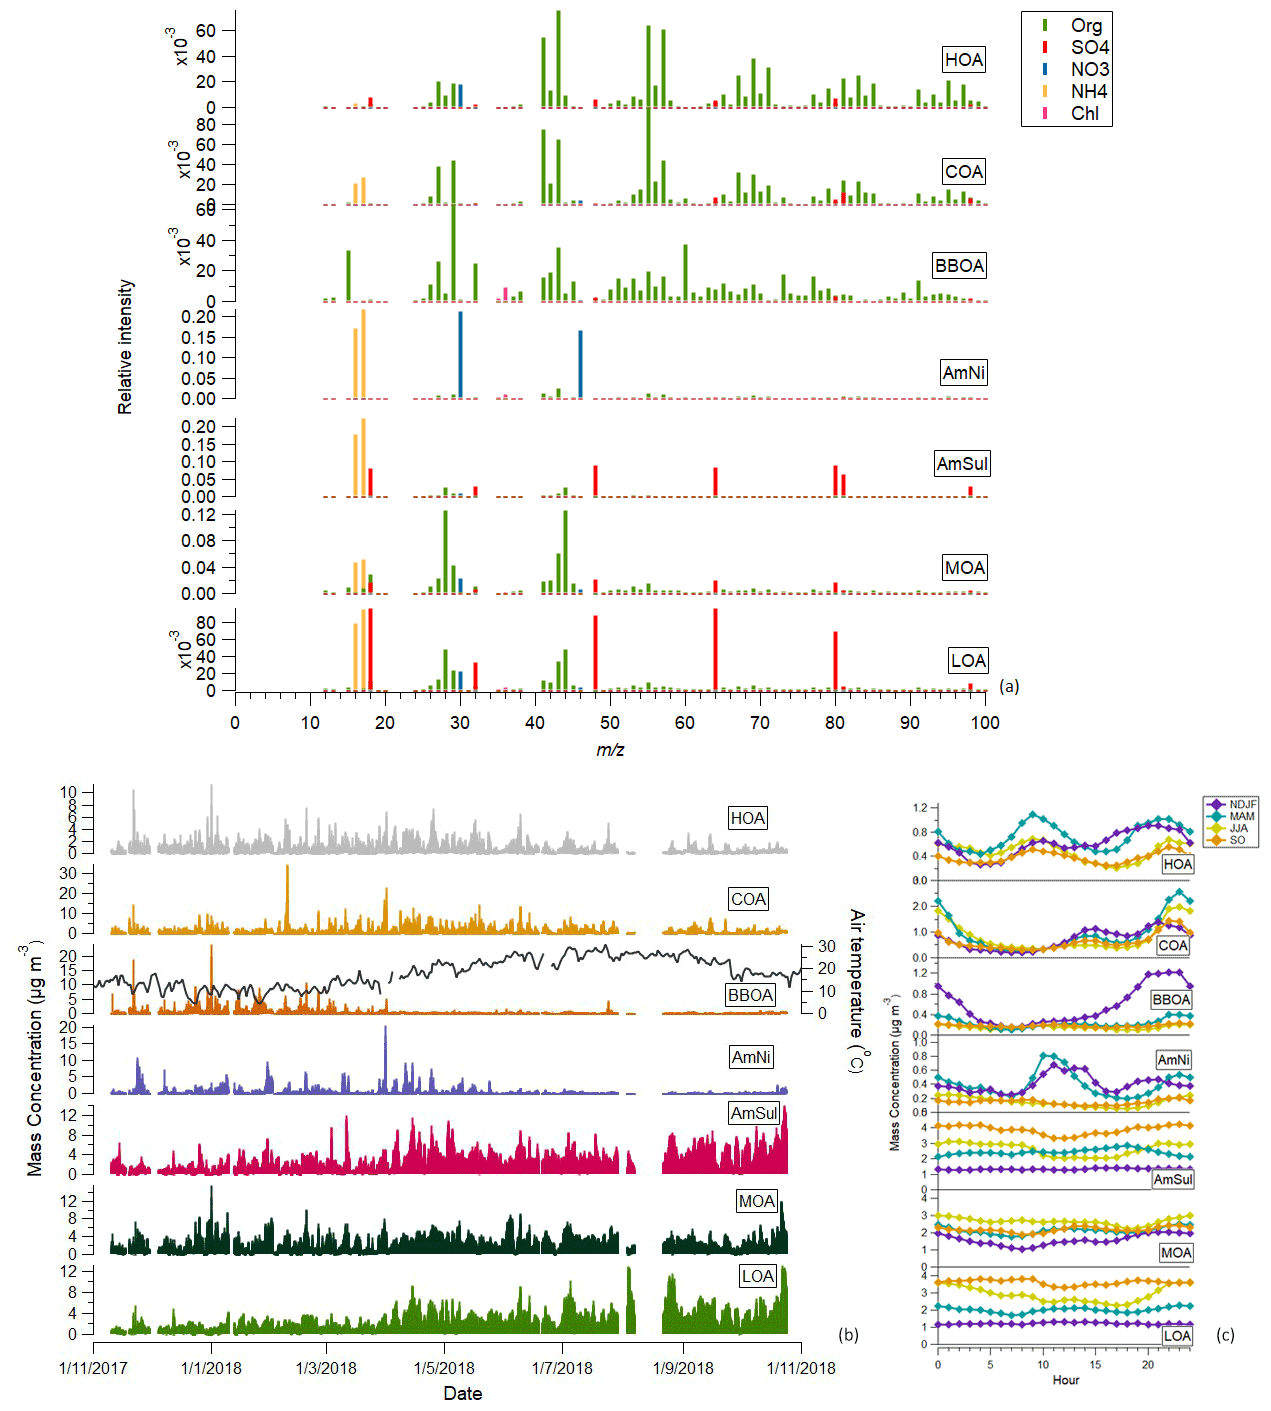
Figure 4Mass spectra (a), time series (b) and diurnal plots (c) of the seven submicron factors and (d) diurnal plot of AmNi with relative humidity and air temperature.
4.3.1 Primary organic factors
The hydrocarbon-related factor that was retrieved with the combined matrix PMF method indicated the contribution of the same variables to the mass spectral profile of organics as the previously described HOA factor. The deconvolution of the combined organic and inorganic dataset matrix revealed a small contribution of inorganic species in this traffic-related factor (Fig. S10). More specifically, combined HOA contained 94 % organics, 3.6 % SO and 2.3 % NO. The peaks of the previously resolved HOA (Sect. 4.2) that were attributed to poor separation of the OA factors were not present in the combined matrix analysis, highlighting the improvement of the solution. The polar plot of combined HOA is similar to the one from OA PMF analysis, as well as those of fossil-fuel markers (eBCff and NOx), implying the good agreement of this factor between both analyses (Figs. S7 and S9).
Cooking-related emissions were again resolved as COA. As also shown in Fig. S10, this factor consisted mainly of organics (93.7 %) and presented low contributions of inorganic ions: NH (2 %), SO (3.8 %) and NO (0.5 %). COA's mass spectral profile resolved from combined PMF analysis resembled the previously identified one. The diurnal pattern of this factor again presented two peaks that coincided with lunch and dinner time. Moreover, the polar plots of COA again revealed local emissions (Fig. S9).
The factor connected to biomass burning was also identified through the combined PMF analysis. In this factor the inorganics presented a lower contribution than on the other two POA factors (Fig. S10). Combined BBOA was composed almost entirely of organics (97.8 % organics, 1 % SO and 1 % Cl−). The two BBOAs presented similar diurnal patterns. Again, this factor's directionality (Fig. S9) showed that it was a source affected by the city on the west and northwest of our site.
4.3.2 Ammonium nitrate (AmNi)
The ammonium nitrate factor resolved in this study was composed of 55 % NO and 18 % NH (Fig. S10). The remaining part of this factor is of an organic nature and is linked to the condensation of organic vapours at the nitrate particles, which takes place especially at night. The NH4 : NO3 ratio was 0.33, which is close to the theoretical ratio of 0.29 for pure ammonium nitrate. The respective ratio obtained by Sun et al. (2012) was 0.36, while Äijälä et al. (2019) reported a ratio of 0.46. In our study, nitrate was primarily present as ammonium nitrate; this factor accounted for 81.5 % of total nitrate. Ammonium nitrate's temporal variation agreed well with nitrate's (Pearson R = 0.90). The diurnal variation in this factor showed enhanced concentration at noon (Fig. 4c). Moreover, it was observed that the ammonium nitrate peak in cold months occurred 3 h after the morning HOA peak, which further indicated the formation of ammonium nitrate through the reaction of traffic-related NOx and ammonia (Fig. 4c). In warm months, on the other hand, no morning peak existed, which, combined with the lower particulate nitrate concentration levels during these months, led to the conclusion that the background NOx mainly participated in ammonium nitrate formation in summertime. Generally, the pronounced peaks identified in AmNi time series coincided with peaks observed in NH4 and NO3 time series, as measured with the ToF-ACSM. The CPF polar plot in Fig. S9 further confirms that ammonium nitrate was locally formed.
4.3.3 Ammonium sulfate (AmSul)
A factor predominantly composed of sulfate and ammonium was retrieved in this study. A total of 64 % of the mass of this factor was attributed to SO and 19.5 % to NH (Fig. S10). The theoretical ammonium-to-sulfate aerosol ratio typically ranges between 0.18 (NH4HSO4) and 0.36 ((NH4)2SO4). In our case, the respective NH4 : SO4 ratio was 0.31, indicating that the sulfate presented in this factor was almost neutralized as (NH4)2SO4, further supporting the successful deconvolution of this factor. This factor contained 53 % of the total sulfate, and it highly correlated with ACSM SO (Pearson R = 0.91) (Table S6). Sun et al. (2012) also retrieved a SO4-OA factor, but in that study, 18 % of the mass of this factor was organic with a high degree of oxidation (O C = 0.69), the highest among the other factors retrieved, while the NH4 : SO4 ratio was 0.34, which is close to the theoretical one for pure ammonium sulfate. Äijälä et al. (2019) retrieved a factor of ammonium sulfate with a NH4 : SO4 ratio between 0.2 and 0.24.
4.3.4 Secondary aerosols (MOA, LOA)
Two factors representative of secondary aerosols were identified, i.e. less oxidized, LOA (less oxidized aerosol), and more oxidized, MOA (more oxidized aerosol), categorized as more and less oxidized based on the oxidation state of the organic part of their mass spectra (f44). Inorganic components significantly contributed to these factors. As noted before for the OA PMF analysis, LO-OOA and MO-OOA retrieved by PMF analysis on the organic fraction were well correlated with the inorganic species (Table S4), implying that an intrinsic relationship between aged organic and inorganic species exists. The application of the combined organic and inorganic PMF analysis can shed light on the mixing characteristics between organics and inorganics. On a yearly average, MOA consisted of 81 % organics, 11 % SO, 4 % NH and 4 % NO, while LOA included 41 % organics and mixed a high amount of SO (47.7 %), and also 3.3 % NO, 7.4 % NH and 0.6 % Cl−.
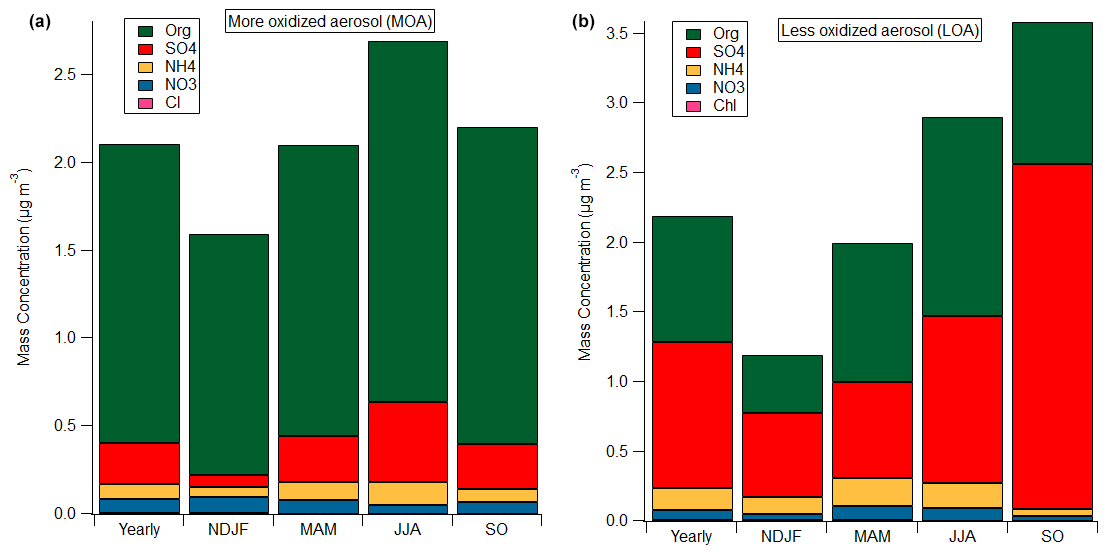
Figure 5Mass concentration of each species in MOA (a) and LOA (b) in different seasons: yearly, November–February (NDJF), March–May (MAM), June–August (JJA) and September–October (SO).
Figures 5 and S12 present the seasonal composition of the oxidized factors. As appears, LOA exhibited different composition in each season; in spring and summer organics and inorganics equally contributed to the LOA's mass concentration, while in winter and early autumn inorganics are seen to be higher than organics in LOA. The more oxidized aerosol presented a more stable composition throughout the year, with organics being the prevalent species, accounting for 76 % (JJA) to 86 % (NDJF) of MOA concentration. The apportionment of inorganic species in these factors confirms the internal mixing of SOAs with inorganic species, as addressed by Zhang et al. (2005).
MOA presented a strong correlation with MO-OOA (Pearson R = 0.86), whereas LOA showed a lower but still significant correlation with LO-OOA (Pearson R = 0.68). LOA, as well as LO-OOA, presented a strong correlation with temperature (Fig. 4b). LOA's seasonal contribution to total NRSs was at a minimum in winter (19 %) and higher in summer (29 %) and September–October (33 %), whereas MOA's contribution to total NRSs also peaked in summer at 27 % but dropped in September–October to 20 %. The bivariate polar plots of MOA and LOA resembled the respective plots of MO-OOA and LO-OOA (Figs. S7a and S9). Specifically, higher concentrations of MOA and LOA for low and moderate wind speeds around the centre area as well as from NE and SE were observed, suggesting that a combination of local and regional sources may have contributed to the observed concentrations. These regions were also associated with increased concentrations of inorganics (NO3, NH4 and SO4) and O3.
An overview of the species that contributed to each factor is shown in Fig. S11. As demonstrated, the organics were present in all the factors, but they contributed less to the inorganic factors, AmNi and AmSul. Sulfate was mainly present in AmSul and in LOA. Ammonium was equally and mainly distributed in the two inorganic factors (AmNi and AmSul) while nitrate was primarily present in the AmNi factor. Chloride, although present in very low concentrations, was equally attributed to ammonium nitrate and BBOA factors, highlighting the two main sources of chloride: secondary formation of particulate ammonium chloride and biomass burning emissions.
4.4 Comparison of the two analyses
Integrating the inorganics in the PMF analysis adds valuable information concerning the mixing characteristics of organic and inorganic species over time, while rendering results that are qualitatively comparable to the widely used organic aerosol PMF. Obtaining a better understanding on the sources and evolution processes of the total NRSs, instead of merely OA, by applying source apportionment methods in combined organic and inorganic datasets for various site locations and for long-term datasets, can be proven beneficial for atmospheric studies and climate models. The two analyses applied in the present study provided acceptable solutions in terms of both uncertainty (spread of the factors) and scaled residuals, as explained in the paragraphs below.
Since PMF provides a range of possible solutions, there is a need to determine how many of these solutions are within the acceptable limits and how much they vary from each other. The variability in this part refers to the variability of the many repeats of the model that can be translated as uncertainty. Moreover, uncertainty arises by the generation of each data point many times after the application of the random a-value constraints, the resampling technique of bootstrapping and the technique of the rolling window. Thus, the ratio of the interquartile to the median concentration is used as a measure of this uncertainty (Canonaco et al., 2021). Overall, higher spread was observed for SOA than POA factors, and all the factors of the combined PMF analysis were associated with lower spread than the OA factors (9.5 % for combined HOA instead of 10 % for OA HOA, 5 % for combined COA instead of 7 % for OA COA, 3 % for combined matrix BBOA instead of 5 % and 13 % on average for oxidized aerosols rather than 19 % for SOAs). The scaled residuals of the solutions were also evaluated in order to confirm that the modelling is mathematically correct. In the organics PMF analysis, 99 % of the scaled residuals were in the range of ±3, which is a reasonable range as suggested by Paatero and Hopke (2003). This percentage was reduced to 91 % for the combined analysis, although it remained high enough to assume the model fitted the data well. The points at which the scaled residuals exceeded these thresholds were associated with peaks in SOAs in the OA PMF analysis and in oxidized aerosols (MOA and LOA) in the combined PMF analysis, which was expected since these factors are linked to higher uncertainties due to the fact that they are unconstrained.
Moreover, the primary factors obtained by both analyses were highly correlated with each other in terms of temporal variation, suggesting that the inclusion of the inorganics in the PMF scheme did not adversely affect the quality of the initial solution. More specifically, the time series of the HOA factor obtained from the combined matrix presented good correlation with the organic matrix resolved HOA factor (Pearson R = 0.87). Combined COA time series agreed with the previously resolved COA time series (Pearson R = 0.92). The BBOAs resolved from the two different analyses were highly correlated with each other (Pearson R = 0.88). Finally, the correlation between the factors obtained and external tracers appears in Table S6, from which a slight improvement can be seen for spring. For the other seasons the degree of correlation was almost the same between the factors from the two analyses and their respective external tracers, which confirms the successful deconvolution of the primary factors by both analyses.
The scope of this study was the characterization and source apportionment analysis of a yearly ToF-ACSM dataset at a suburban site in Athens. PMF was employed for two different analyses: one on the organic fraction and one combining the organic and the inorganic species (SO, NO, NH and Cl−) of the ToF-ACSM dataset. From the first analysis, five organic aerosol factors were retrieved, while combined PMF analysis yielded seven factors. With both analyses three primary organic aerosol factors were resolved: one hydrocarbon-related (HOA) from traffic emissions, one from cooking emissions (COA) and one related to biomass burning (BBOA). The organic aerosol interpretation produced two more factors: one more oxidized (MO-OOA) and one less oxidized OOA (LO-OOA), while these factors were mixed with inorganic species when resolved in the combined PMF analysis (named MOA and LOA respectively). Two additional factors identified with the latter analysis were mostly inorganic: ammonium nitrate (AmNi) and ammonium sulfate (AmSul). The temporal composition of factors in combined PMF was investigated seasonally, and higher variability in composition by seasons was observed for LOA.
With regards to the significance of the combined PMF analysis over organics PMF, it was shown that incorporating the inorganics in the PMF analysis may lead to a better understanding of the sources and mixing characteristics of the non-refractory organic and inorganic species of PM1, while at the same time maintaining the quality of the solution obtained. A comparison of the two analyses in terms of residuals of the solution and uncertainties (spread) of each factor, as well as the correlations between the factors from the two analyses and the factors with their respective external tracers, took place and yielded motivating results in favour of the combined PMF analysis.
Data are available upon request to the author (o.zografou@ipta.demokritos.gr).
The supplement related to this article is available online at: https://doi.org/10.5194/amt-15-4675-2022-supplement.
OZ performed the formal analysis and wrote the original draft. ACK, MG and KE helped with funding acquisition, project administration and resources. OZ, ACK and MG performed the investigation and data curation. MIM, GC and OZ provided the methodology and conceptualization. MIM and GC helped in running SoFi Pro and with discussions on the results. MG, MIM and KE provided supervision and validation. MG, MIM, GC, ACK, KE, ED and AP contributed to reviewing and editing the manuscript.
The contact author has declared that none of the authors has any competing interests.
Publisher’s note: Copernicus Publications remains neutral with regard to jurisdictional claims in published maps and institutional affiliations.
This work was supported by COLOSSAL CA16109 and Co-financed by the European Union and Greek national funds through the Operational Program Competitiveness, Entrepreneurship and Innovation, under the call RESEARCH – CREATE – INNOVATE (project code: T1EDK-03437). We also acknowledge partial support by the project “PANhellenic infrastructure for Atmospheric Composition and climatE change” (MIS 5021516), which is implemented under the Action “Reinforcement of the Research and Innovation Infrastructure”, funded by the Operational Program “Competitiveness, Entrepreneurship and Innovation” (NSRF 2014-2020) and co-financed by Greece and the European Union (European Regional Development Fund). The authors gratefully acknowledge the NOAA Air Resources Laboratory (ARL) for the provision of the HYSPLIT transport and dispersion model used in this publication.
This research has been supported by COLOSSAL CA16109; the European Union; Greek national funds (Operational Program Competitiveness, Entrepreneurship and Innovation, under the call RESEARCH – CREATE – INNOVATE, project code: T1EDK-03437); the project “PANhellenic infrastructure for Atmospheric Composition and climatE change” (MIS 5021516), which is implemented under the action “Reinforcement of the Research and Innovation Infrastructure”, funded by the Operational Program “Competitiveness, Entrepreneurship and Innovation” (NSRF 2014-2020) and co-financed by Greece and the European Union (European Regional Development Fund); the Swiss National Science Foundation, Source apportionment using long-term Aerosol Mass Spectrometry and Aethalometer Measurements (SAMSAM, IZCOZ0_177063); and the EU Horizon 2020 Framework Programme via the Research Infrastructures Services Reinforcing Air Quality Monitoring Capacities in European Urban & Industrial AreaS (RI-URBANS) project (GA-101036245), the ERA-PLANET projects SMURBS and iCUPE (grant agreement no. 689443).
This paper was edited by Daniela Famulari and reviewed by two anonymous referees.
Äijälä, M., Daellenbach, K. R., Canonaco, F., Heikkinen, L., Junninen, H., Petäjä, T., Kulmala, M., Prévôt, A. S. H., and Ehn, M.: Constructing a data-driven receptor model for organic and inorganic aerosol – a synthesis analysis of eight mass spectrometric data sets from a boreal forest site, Atmos. Chem. Phys., 19, 3645–3672, https://doi.org/10.5194/acp-19-3645-2019, 2019.
Allan, J. D., Delia, A. E., Coe, H., Bower, K. N., Alfarra, M. R., Jimenez, J. L., Middlebrook, A. M., Drewnick, F., Onasch, T. B., Canagaratna, M. R., Jayne, J. T., and Worsnop, D. R.: A generalised method for the extraction of chemically resolved mass spectra from Aerodyne aerosol mass spectrometer data, J. Aerosol Sci., 35, 909–922, https://doi.org/10.1016/j.jaerosci.2004.02.007, 2004.
Argyropoulos, G., Samara, C., Diapouli, E., Eleftheriadis, K., Papaoikonomou, K., and Kungolos, A.: Source apportionment of PM10 and PM2.5 in major urban Greek agglomerations using a hybrid source-receptor modeling process, Sci. Total Environ., 601–602, 906–917, https://doi.org/10.1016/j.scitotenv.2017.05.088, 2017.
Bahreini, R., Ervens, B., Middlebrook, A. M., Warneke, C., de Gouw, J. A., DeCarlo, P. F., Jimenez, J. L., Brock, C. A., Neuman, J. A., Ryerson, T. B., Stark, H., Atlas, E., Brioude, J., Fried, A., Holloway, J. S., Peischl, J., Richter, D., Walega, J., Weibring, P., Wollny, A. G., and Fehsenfeld, F. C.: Organic aerosol formation in urban and industrial plumes near Houston and Dallas, Texas, J. Geophys. Res., 114, D00F16, https://doi.org/10.1029/2008JD011493, 2009.
Behera, S., Sharma, M., Aneja, V., and Balasubramanian, R.: Ammonia in the atmosphere: A review on emission sources, atmospheric chemistry and deposition on terrestrial bodies, Environ. Sci. Pollut. Res., 20, 8092–8131, https://doi.org/10.1007/s11356-013-2051-9, 2013.
Biggins, P. D. E. and Harrison, R. M.: Characterization and Classification of Atmospheric Sulfates, JAPCA J. Air Waste Ma., 29, 838–840, https://doi.org/10.1080/00022470.1979.10470871, 1979.
Cabada, J. C.: Light scattering by fine particles during the Pittsburgh Air Quality Study: Measurements and modeling, J. Geophys. Res., 109, D16S03, https://doi.org/10.1029/2003JD004155, 2004.
Canonaco, F., Crippa, M., Slowik, J. G., Baltensperger, U., and Prévôt, A. S. H.: SoFi, an IGOR-based interface for the efficient use of the generalized multilinear engine (ME-2) for the source apportionment: ME-2 application to aerosol mass spectrometer data, Atmos. Meas. Tech., 6, 3649–3661, https://doi.org/10.5194/amt-6-3649-2013, 2013.
Canonaco, F., Tobler, A., Chen, G., Sosedova, Y., Slowik, J. G., Bozzetti, C., Daellenbach, K. R., El Haddad, I., Crippa, M., Huang, R.-J., Furger, M., Baltensperger, U., and Prévôt, A. S. H.: A new method for long-term source apportionment with time-dependent factor profiles and uncertainty assessment using SoFi Pro: application to 1 year of organic aerosol data, Atmos. Meas. Tech., 14, 923–943, https://doi.org/10.5194/amt-14-923-2021, 2021.
Carslaw, D. C. and Ropkins, K.: openair – An R package for air quality data analysis, Environ. Model. Softw., 27–28, 52–61, https://doi.org/10.1016/j.envsoft.2011.09.008, 2012.
Chen, G., Sosedova, Y., Canonaco, F., Fröhlich, R., Tobler, A., Vlachou, A., Daellenbach, K. R., Bozzetti, C., Hueglin, C., Graf, P., Baltensperger, U., Slowik, J. G., El Haddad, I., and Prévôt, A. S. H.: Time-dependent source apportionment of submicron organic aerosol for a rural site in an alpine valley using a rolling positive matrix factorisation (PMF) window, Atmos. Chem. Phys., 21, 15081–15101, https://doi.org/10.5194/acp-21-15081-2021, 2021.
Chen, G., Canonaco, F., Tobler, A., Aas, W., Alastuey, A., Allan, J., Atabakhsh, S., Aurela, M., Baltensperger, U., Bougiatioti, A., De Brito, J. F., Ceburnis, D., Chazeau, B., Chebaicheb, H., Daellenbach, K. R., Ehn, M., El Haddad, I., Eleftheriadis, K., Favez, O., Flentje, H., Font, A., Fossum, K., Freney, E., Gini, M., Green, D. C., Heikkinen, L., Herrmann, H., Kalogridis, A.-C., Keernik, H., Lhotka, R., Lin, C., Lunder, C., Maasikmets, M., Manousakas, M. I., Marchand, N., Marin, C., Marmureanu, L., Mihalopoulos, N., Močnik, G., Nęcki, J., O'Dowd, C., Ovadnevaite, J., Peter, T., Petit, J.-E., Pikridas, M., Matthew Platt, S., Pokorná, P., Poulain, L., Priestman, M., Riffault, V., Rinaldi, M., Różański, K., Schwarz, J., Sciare, J., Simon, L., Skiba, A., Slowik, J. G., Sosedova, Y., Stavroulas, I., Styszko, K., Teinemaa, E., Timonen, H., Tremper, A., Vasilescu, J., Via, M., Vodička, P., Wiedensohler, A., Zografou, O., Cruz Minguillón, M., and Prévôt, A. S. H.: European aerosol phenomenology – 8: Harmonised source apportionment of organic aerosol using 22 Year-long ACSM/AMS datasets, Environ. Int., 166, 107325, https://doi.org/10.1016/j.envint.2022.107325, 2022.
Crippa, M., DeCarlo, P. F., Slowik, J. G., Mohr, C., Heringa, M. F., Chirico, R., Poulain, L., Freutel, F., Sciare, J., Cozic, J., Di Marco, C. F., Elsasser, M., Nicolas, J. B., Marchand, N., Abidi, E., Wiedensohler, A., Drewnick, F., Schneider, J., Borrmann, S., Nemitz, E., Zimmermann, R., Jaffrezo, J.-L., Prévôt, A. S. H., and Baltensperger, U.: Wintertime aerosol chemical composition and source apportionment of the organic fraction in the metropolitan area of Paris, Atmos. Chem. Phys., 13, 961–981, https://doi.org/10.5194/acp-13-961-2013, 2013.
Crippa, M., Canonaco, F., Lanz, V. A., Äijälä, M., Allan, J. D., Carbone, S., Capes, G., Ceburnis, D., Dall'Osto, M., Day, D. A., DeCarlo, P. F., Ehn, M., Eriksson, A., Freney, E., Hildebrandt Ruiz, L., Hillamo, R., Jimenez, J. L., Junninen, H., Kiendler-Scharr, A., Kortelainen, A.-M., Kulmala, M., Laaksonen, A., Mensah, A. A., Mohr, C., Nemitz, E., O'Dowd, C., Ovadnevaite, J., Pandis, S. N., Petäjä, T., Poulain, L., Saarikoski, S., Sellegri, K., Swietlicki, E., Tiitta, P., Worsnop, D. R., Baltensperger, U., and Prévôt, A. S. H.: Organic aerosol components derived from 25 AMS data sets across Europe using a consistent ME-2 based source apportionment approach, Atmos. Chem. Phys., 14, 6159–6176, https://doi.org/10.5194/acp-14-6159-2014, 2014.
Cusack, M., Alastuey, A., Pérez, N., Pey, J., and Querol, X.: Trends of particulate matter (PM2.5) and chemical composition at a regional background site in the Western Mediterranean over the last nine years (2002–2010), Atmos. Chem. Phys., 12, 8341–8357, https://doi.org/10.5194/acp-12-8341-2012, 2012.
Dayan, U., Ricaud, P., Zbinden, R., and Dulac, F.: Atmospheric pollution over the eastern Mediterranean during summer – a review, Atmos. Chem. Phys., 17, 13233–13263, https://doi.org/10.5194/acp-17-13233-2017, 2017.
Diapouli, E., Kalogridis, A.-C., Markantonaki, C., Vratolis, S., Fetfatzis, P., Colombi, C., and Eleftheriadis, K.: Annual Variability of Black Carbon Concentrations Originating from Biomass and Fossil Fuel Combustion for the Suburban Aerosol in Athens, Greece, Atmosphere, 8, 234, https://doi.org/10.3390/atmos8120234, 2017a.
Diapouli, E., Manousakas, M., Vratolis, S., Vasilatou, V., Maggos, T., Saraga, D., Grigoratos, T., Argyropoulos, G., Voutsa, D., Samara, C., and Eleftheriadis, K.: Evolution of air pollution source contributions over one decade, derived by PM10 and PM2.5 source apportionment in two metropolitan urban areas in Greece, Atmos. Environ., 164, 416–430, https://doi.org/10.1016/j.atmosenv.2017.06.016, 2017b.
Dominici, F., Peng, R. D., Bell, M. L., Pham, L., McDermott, A., Zeger, S. L., and Samet, J. M.: Fine Particulate Air Pollution and Hospital Admission for Cardiovascular and Respiratory Diseases, JAMA-J. Am. Med. Assoc., 295, 1127, https://doi.org/10.1001/jama.295.10.1127, 2006.
Draxler, R. R. and Hess, G. D.: An overview of the HYSPLIT_4 modeling system of trajectories, dispersion, and deposition, Aust. Meteor. Mag., 47, 295–308, 1998.
Drinovec, L., Močnik, G., Zotter, P., Prévôt, A. S. H., Ruckstuhl, C., Coz, E., Rupakheti, M., Sciare, J., Müller, T., Wiedensohler, A., and Hansen, A. D. A.: The ”dual-spot” Aethalometer: an improved measurement of aerosol black carbon with real-time loading compensation, Atmos. Meas. Tech., 8, 1965–1979, https://doi.org/10.5194/amt-8-1965-2015, 2015.
Efron, B.: The Bootstrap and Modern Statistics, J. Am. Stat. Assoc., 95, 1293–1296, https://doi.org/10.1080/01621459.2000.10474333, 2000.
Eleftheriadis, K., Gini, M. I., Diapouli, E., Vratolis, S., Vasilatou, V., Fetfatzis, P., and Manousakas, M. I.: Aerosol microphysics and chemistry reveal the COVID19 lockdown impact on urban air quality, Sci. Rep., 11, 14477, https://doi.org/10.1038/s41598-021-93650-6, 2021.
Florou, K., Papanastasiou, D. K., Pikridas, M., Kaltsonoudis, C., Louvaris, E., Gkatzelis, G. I., Patoulias, D., Mihalopoulos, N., and Pandis, S. N.: The contribution of wood burning and other pollution sources to wintertime organic aerosol levels in two Greek cities, Atmos. Chem. Phys., 17, 3145–3163, https://doi.org/10.5194/acp-17-3145-2017, 2017.
Fröhlich, R., Cubison, M. J., Slowik, J. G., Bukowiecki, N., Prévôt, A. S. H., Baltensperger, U., Schneider, J., Kimmel, J. R., Gonin, M., Rohner, U., Worsnop, D. R., and Jayne, J. T.: The ToF-ACSM: a portable aerosol chemical speciation monitor with TOFMS detection, Atmos. Meas. Tech., 6, 3225–3241, https://doi.org/10.5194/amt-6-3225-2013, 2013.
Hao, L. Q., Kortelainen, A., Romakkaniemi, S., Portin, H., Jaatinen, A., Leskinen, A., Komppula, M., Miettinen, P., Sueper, D., Pajunoja, A., Smith, J. N., Lehtinen, K. E. J., Worsnop, D. R., Laaksonen, A., and Virtanen, A.: Atmospheric submicron aerosol composition and particulate organic nitrate formation in a boreal forestland–urban mixed region, Atmos. Chem. Phys., 14, 13483–13495, https://doi.org/10.5194/acp-14-13483-2014, 2014.
Jacobson, M. Z.: Strong radiative heating due to the mixing state of black carbon in atmospheric aerosols, Nature, 409, 695–697, https://doi.org/10.1038/35055518, 2001.
Kalogridis, A.-C., Vratolis, S., Liakakou, E., Gerasopoulos, E., Mihalopoulos, N., and Eleftheriadis, K.: Assessment of wood burning versus fossil fuel contribution to wintertime black carbon and carbon monoxide concentrations in Athens, Greece, Atmos. Chem. Phys., 18, 10219–10236, https://doi.org/10.5194/acp-18-10219-2018, 2018.
Kanakidou, M., Seinfeld, J. H., Pandis, S. N., Barnes, I., Dentener, F. J., Facchini, M. C., Van Dingenen, R., Ervens, B., Nenes, A., Nielsen, C. J., Swietlicki, E., Putaud, J. P., Balkanski, Y., Fuzzi, S., Horth, J., Moortgat, G. K., Winterhalter, R., Myhre, C. E. L., Tsigaridis, K., Vignati, E., Stephanou, E. G., and Wilson, J.: Organic aerosol and global climate modelling: a review, Atmos. Chem. Phys., 5, 1053–1123, https://doi.org/10.5194/acp-5-1053-2005, 2005.
Karanasiou, A. A., Siskos, P. A., and Eleftheriadis, K.: Assessment of source apportionment by Positive Matrix Factorization analysis on fine and coarse urban aerosol size fractions, Atmos. Environ., 43, 3385–3395, https://doi.org/10.1016/j.atmosenv.2009.03.051, 2009.
Kostenidou, E., Florou, K., Kaltsonoudis, C., Tsiflikiotou, M., Vratolis, S., Eleftheriadis, K., and Pandis, S. N.: Sources and chemical characterization of organic aerosol during the summer in the eastern Mediterranean, Atmos. Chem. Phys., 15, 11355–11371, https://doi.org/10.5194/acp-15-11355-2015, 2015.
Lappalainen, H. K., Sevanto, S., Bäck, J., Ruuskanen, T. M., Kolari, P., Taipale, R., Rinne, J., Kulmala, M., and Hari, P.: Day-time concentrations of biogenic volatile organic compounds in a boreal forest canopy and their relation to environmental and biological factors, Atmos. Chem. Phys., 9, 5447–5459, https://doi.org/10.5194/acp-9-5447-2009, 2009.
Li, M., Chen, H., Wang, B.-F., Yang, X., Lian, J.-J., and Chen, J.-M.: Direct quantification of PAHs in biomass burning aerosols by desorption electrospray ionization mass spectrometry, Int. J. Mass Spectrom., 281, 31–36, https://doi.org/10.1016/j.ijms.2008.11.013, 2009.
Lin, Y.-C. and Cheng, M.-T.: Evaluation of formation rates of NO2 to gaseous and particulate nitrate in the urban atmosphere, Atmos. Environ., 41, 1903–1910, https://doi.org/10.1016/j.atmosenv.2006.10.065, 2007.
Lobert, J. M., Keene, W. C., Logan, J. A., and Yevich, R.: Global chlorine emissions from biomass burning: Reactive Chlorine Emissions Inventory, J. Geophys. Res., 104, 8373–8389, https://doi.org/10.1029/1998JD100077, 1999.
Manousakas, M., Diapouli, E., Papaefthymiou, H., Kantarelou, V., Zarkadas, C., Kalogridis, A.-C., Karydas, A.-G., and Eleftheriadis, K.: XRF characterization and source apportionment of PM10 samples collected in a coastal city, X-Ray Spectrom., 47, 190–200, https://doi.org/10.1002/xrs.2817, 2017a.
Manousakas, M., Papaefthymiou, H., Diapouli, E., Migliori, A., Karydas, A. G., Bogdanovic-Radovic, I., and Eleftheriadis, K.: Assessment of PM2.5 sources and their corresponding level of uncertainty in a coastal urban area using EPA PMF 5.0 enhanced diagnostics, Sci. Total Environ., 574, 155–164, https://doi.org/10.1016/j.scitotenv.2016.09.047, 2017b.
Manousakas, M., Diapouli, E., Belis, C. A., Vasilatou, V., Gini, M., Lucarelli, F., Querol, X., and Eleftheriadis, K.: Quantitative assessment of the variability in chemical profiles from source apportionment analysis of PM10 and PM2.5 at different sites within a large metropolitan area, Environ. Res., 192, 110257, https://doi.org/10.1016/j.envres.2020.110257, 2021.
Manousakas, M. I., Florou, K., and Pandis, S. N.: Source Apportionment of Fine Organic and Inorganic Atmospheric Aerosol in an Urban Background Area in Greece, Atmosphere, 11, 330, https://doi.org/10.3390/atmos11040330, 2020.
McGuire, M. L., Chang, R. Y.-W., Slowik, J. G., Jeong, C.-H., Healy, R. M., Lu, G., Mihele, C., Abbatt, J. P. D., Brook, J. R., and Evans, G. J.: Enhancing non-refractory aerosol apportionment from an urban industrial site through receptor modeling of complete high time-resolution aerosol mass spectra, Atmos. Chem. Phys., 14, 8017–8042, https://doi.org/10.5194/acp-14-8017-2014, 2014.
Medina-Ramón, M., Zanobetti, A., and Schwartz, J.: The Effect of Ozone and PM10 on Hospital Admissions for Pneumonia and Chronic Obstructive Pulmonary Disease: A National Multicity Study, Am. J. Epidemiol., 163, 579–588, https://doi.org/10.1093/aje/kwj078, 2006.
Middlebrook, A. M., Bahreini, R., Jimenez, J. L., and Canagaratna, M. R.: Evaluation of composition-dependent collection efficiencies for the aerodyne aerosol mass spectrometer using field data, Aerosol Sci. Tech., 46, 258–271, 2012.
Moosmüller, H., Chakrabarty, R., and Arnott, W.: Aerosol light absorption and its measurement: A review, J. Quant. Spectrosc. Ra., 110, 844–878, https://doi.org/10.1016/j.jqsrt.2009.02.035, 2009.
Ng, N. L., Herndon, S. C., Trimborn, A., Canagaratna, M. R., Croteau, P. L., Onasch, T. B., Sueper, D., Worsnop, D. R., Zhang, Q., Sun, Y. L., and Jayne, J. T.: An Aerosol Chemical Speciation Monitor (ACSM) for Routine Monitoring of the Composition and Mass Concentrations of Ambient Aerosol, Aerosol Sci. Tech., 45, 780–794, https://doi.org/10.1080/02786826.2011.560211, 2011.
Okuda, T., Okamoto, K., Tanaka, S., Shen, Z., Han, Y., and Huo, Z.: Measurement and source identification of polycyclic aromatic hydrocarbons (PAHs) in the aerosol in Xi'an, China, by using automated column chromatography and applying positive matrix factorization (PMF), Sci. Total Environ., 408, 1909–1914, https://doi.org/10.1016/j.scitotenv.2010.01.040, 2010.
Paatero, P.: The Multilinear Engine: A Table-Driven, Least Squares Program for Solving Multilinear Problems, including the n-Way Parallel Factor Analysis Model, J. Comput. Graph. Stat., 8, 854–888, https://doi.org/10.2307/1390831, 1999.
Paatero, P. and Hopke, P. K.: Discarding or downweighting high-noise variables in factor analytic models, Anal. Chim. Acta, 490, 277–289, https://doi.org/10.1016/S0003-2670(02)01643-4, 2003.
Panteliadis, P., Hafkenscheid, T., Cary, B., Diapouli, E., Fischer, A., Favez, O., Quincey, P., Viana, M., Hitzenberger, R., Vecchi, R., Saraga, D., Sciare, J., Jaffrezo, J. L., John, A., Schwarz, J., Giannoni, M., Novak, J., Karanasiou, A., Fermo, P., and Maenhaut, W.: ECOC comparison exercise with identical thermal protocols after temperature offset correction – instrument diagnostics by in-depth evaluation of operational parameters, Atmos. Meas. Tech., 8, 779–792, https://doi.org/10.5194/amt-8-779-2015, 2015.
Parworth, C., Fast, J., Mei, F., Shippert, T., Sivaraman, C., Tilp, A., Watson, T., and Zhang, Q.: Long-term measurements of submicrometer aerosol chemistry at the Southern Great Plains (SGP) using an Aerosol Chemical Speciation Monitor (ACSM), Atmos. Environ., 106, 43–55, https://doi.org/10.1016/j.atmosenv.2015.01.060, 2015.
Petit, J.-E., Favez, O., Albinet, A., and Canonaco, F.: A user-friendly tool for comprehensive evaluation of the geographical origins of atmospheric pollution: Wind and trajectory analyses, Environ. Model. Softw., 88, 183–187, https://doi.org/10.1016/j.envsoft.2016.11.022, 2017.
Petzold, A., Ogren, J. A., Fiebig, M., Laj, P., Li, S.-M., Baltensperger, U., Holzer-Popp, T., Kinne, S., Pappalardo, G., Sugimoto, N., Wehrli, C., Wiedensohler, A., and Zhang, X.-Y.: Recommendations for reporting “black carbon” measurements, Atmos. Chem. Phys., 13, 8365–8379, https://doi.org/10.5194/acp-13-8365-2013, 2013.
Pope, C. A.: Review: Epidemiological Basis for Particulate Air Pollution Health Standards, Aerosol Sci. Tech., 32, 4–14, https://doi.org/10.1080/027868200303885, 2000.
Ramanathan, V. and Feng, Y.: Air pollution, greenhouse gases and climate change: Global and regional perspectives, Atmos. Environ., 43, 37–50, https://doi.org/10.1016/j.atmosenv.2008.09.063, 2009.
Robinson, A. L., Donahue, N. M., Shrivastava, M. K., Weitkamp, E. A., Sage, A. M., Grieshop, A. P., Lane, T. E., Pierce, J. R., and Pandis, S. N.: Rethinking Organic Aerosols: Semivolatile Emissions and Photochemical Aging, Science, 315, 1259–1262, https://doi.org/10.1126/science.1133061, 2007.
Rosenfeld, D., Lohmann, U., Raga, G. B., O'Dowd, C. D., Kulmala, M., Fuzzi, S., Reissell, A., and Andreae, M. O.: Flood or Drought: How Do Aerosols Affect Precipitation?, Science, 321, 1309–1313, https://doi.org/10.1126/science.1160606, 2008.
Sandradewi, J., Prévôt, A. S. H., Szidat, S., Perron, N., Alfarra, M. R., Lanz, V. A., Weingartner, E., and Baltensperger, U.: Using Aerosol Light Absorption Measurements for the Quantitative Determination of Wood Burning and Traffic Emission Contributions to Particulate Matter, Environ. Sci. Technol., 42, 3316–3323, https://doi.org/10.1021/es702253m, 2008.
Schlesinger, W. H. and Hartley, A. E.: A global budget for atmospheric NH3, Biogeochemistry, 15, 191–211, https://doi.org/10.1007/BF00002936, 1992.
Stavroulas, I., Bougiatioti, A., Grivas, G., Paraskevopoulou, D., Tsagkaraki, M., Zarmpas, P., Liakakou, E., Gerasopoulos, E., and Mihalopoulos, N.: Sources and processes that control the submicron organic aerosol composition in an urban Mediterranean environment (Athens): a high temporal-resolution chemical composition measurement study, Atmos. Chem. Phys., 19, 901–919, https://doi.org/10.5194/acp-19-901-2019, 2019.
Stein, A. F., Draxler, R. R., Rolph, G. D., Stunder, B. J., Cohen, M. D., and Ngan, F.: NOAA's HYSPLIT atmospheric transport and dispersion modeling system, B. Am. Meteorol. Soc., 96, 2059–2077, 2015.
Stelson, A. W., Friedlander, S. K., and Seinfeld, J. H.: A note on the equilibrium relationship between ammonia and nitric acid and particulate ammonium nitrate, Atmos. Environ., 13, 369–371, https://doi.org/10.1016/0004-6981(79)90293-2, 1979.
Sun, Y. L., Zhang, Q., Schwab, J. J., Yang, T., Ng, N. L., and Demerjian, K. L.: Factor analysis of combined organic and inorganic aerosol mass spectra from high resolution aerosol mass spectrometer measurements, Atmos. Chem. Phys., 12, 8537–8551, https://doi.org/10.5194/acp-12-8537-2012, 2012.
Theodosi, C., Tsagkaraki, M., Zarmpas, P., Grivas, G., Liakakou, E., Paraskevopoulou, D., Lianou, M., Gerasopoulos, E., and Mihalopoulos, N.: Multi-year chemical composition of the fine-aerosol fraction in Athens, Greece, with emphasis on the contribution of residential heating in wintertime, Atmos. Chem. Phys., 18, 14371–14391, https://doi.org/10.5194/acp-18-14371-2018, 2018.
Tobler, A. K., Skiba, A., Canonaco, F., Močnik, G., Rai, P., Chen, G., Bartyzel, J., Zimnoch, M., Styszko, K., Nęcki, J., Furger, M., Różański, K., Baltensperger, U., Slowik, J. G., and Prevot, A. S. H.: Characterization of non-refractory (NR) PM1 and source apportionment of organic aerosol in Kraków, Poland, Atmos. Chem. Phys., 21, 14893–14906, https://doi.org/10.5194/acp-21-14893-2021, 2021.
Ulbrich, I. M., Canagaratna, M. R., Zhang, Q., Worsnop, D. R., and Jimenez, J. L.: Interpretation of organic components from Positive Matrix Factorization of aerosol mass spectrometric data, Atmos. Chem. Phys., 9, 2891–2918, https://doi.org/10.5194/acp-9-2891-2009, 2009.
Wilson, W. E. and Suh, H. H.: Fine Particles and Coarse Particles: Concentration Relationships Relevant to Epidemiologic Studies, J. Air Waste Manage., 47, 1238–1249, https://doi.org/10.1080/10473289.1997.10464074, 1997.
Zhang, Q., Alfarra, M. R., Worsnop, D. R., Allan, J. D., Coe, H., Canagaratna, M. R., and Jimenez, J. L.: Deconvolution and Quantification of Hydrocarbon-like and Oxygenated Organic Aerosols Based on Aerosol Mass Spectrometry, Environ. Sci. Technol., 39, 4938–4952, https://doi.org/10.1021/es048568l, 2005.
Zhang, Y., Favez, O., Petit, J.-E., Canonaco, F., Truong, F., Bonnaire, N., Crenn, V., Amodeo, T., Prévôt, A. S. H., Sciare, J., Gros, V., and Albinet, A.: Six-year source apportionment of submicron organic aerosols from near-continuous highly time-resolved measurements at SIRTA (Paris area, France), Atmos. Chem. Phys., 19, 14755–14776, https://doi.org/10.5194/acp-19-14755-2019, 2019.