the Creative Commons Attribution 4.0 License.
the Creative Commons Attribution 4.0 License.
 | 22 Aug 2022
Evaluation of MOPITT and TROPOMI carbon monoxide retrievals using AirCore in situ vertical profiles
Merritt N. Deeter
Bianca C. Baier
Kathryn McKain
Helen Worden
Tobias Borsdorff
Colm Sweeney
Ilse Aben
AirCore in situ vertical profiles sample the atmosphere from near the surface to the lower stratosphere, making them ideal for the validation of satellite tropospheric trace gas data. Here we present intercomparison results of AirCore carbon monoxide (CO) measurements with respect to retrievals from MOPITT (Measurements of Pollution In The Troposphere; version 8) and TROPOMI (TROPOspheric Monitoring Instrument), on board the NASA Terra and ESA Sentinel 5-Precursor satellites, respectively. Mean MOPITT/AirCore total column bias values and their standard deviation (0.4 ± 5.5, 1.7 ± 5.6, and 0.7 ± 6.0 for MOPITT thermal-infrared, near-infrared, and multispectral retrievals, respectively; all in %) are similar to results obtained in MOPITT/NOAA aircraft flask data comparisons from this study and from previous validation efforts. MOPITT CO retrievals are systematically validated using in situ vertical profiles from a variety of aircraft campaigns. Because most aircraft vertical profiles do not sample the troposphere's entire vertical extent, they must be extended upwards in order to be usable in validation. Here we quantify, for the first time, the error introduced in MOPITT CO validation by the use of shorter aircraft vertical profiles extended upwards by analyzing validation results of MOPITT with respect to full and truncated AirCore CO vertical profiles. Our results indicate that the error is small, affects mostly upper tropospheric retrievals (at 300 hPa: ∼ 2.6, 0.8, and 3.2 percent points for MOPITT thermal-infrared, near-infrared, and multispectral, respectively), and may have resulted in the overestimation of MOPITT retrieval biases in that region. TROPOMI can retrieve CO under both clear and cloudy conditions. The latter is achieved by quantifying interfering trace gases and parameters describing the cloud contamination of the measurements together with the CO column; then, the reference CO profiles used in the retrieval are scaled based on estimated above-cloud CO rather than on estimated total CO. We use AirCore measurements as the reference to evaluate the error introduced by this approach in cloudy TROPOMI retrievals over land after accounting for TROPOMI's vertical sensitivity to CO (relative bias and its standard deviation = 2.02 % ± 11.13 %). We also quantify the null-space error, which accounts for differences between the shape of TROPOMI reference profiles and that of AirCore measured profiles (for TROPOMI cloudy enull=0.98 % ± 2.32 %).
- Article
(2256 KB) - Full-text XML
- BibTeX
- EndNote


Tropospheric CO (carbon monoxide) is mostly produced by incomplete combustion of fuels, biomass burning, and atmospheric oxidation of CH4 (methane) and other hydrocarbons. Its main sink is oxidation by OH (the hydroxyl radical) (Spivakovsky et al., 2000; Lelieveld et al., 2016). CO is of great importance in understanding climate and for monitoring and predicting air quality because it has an indirect positive radiative forcing (Szopa et al., 2021) and is an excellent tracer for identifying pollution sources, transport, and sinks. A long, consistent global tropospheric CO record allows for the detection of spatial, seasonal, and long-term trends as well as for the placement of individual CO-emitting events into context, which is key to a better understanding of their significance.
The MOPITT (Measurements of Pollution In The Troposphere) instrument (Drummond and Mand, 1996; Drummond et al., 2010), onboard NASA's Terra satellite, provides the longest global record of tropospheric CO available to date (2000–present). The MOPITT dataset is consistent and, thus, useful in climate and air quality analyses because it is systematically validated with respect to both aircraft data (Emmons et al., 2004; Deeter et al., 2010, 2012, 2013, 2014, 2017, 2018, 2019) and ground-based measurements (Buchholz et al., 2017; Hedelius et al., 2019). The vertical extent of most aircraft in situ profiles that are used to validate satellite retrievals of tropospheric trace gases is largely determined by the range of the aircraft used to collect them and is often not sufficient to sample in its entirety the vertical column sensed by the satellite instruments. In those cases, the aircraft measurements closest to the tropopause and modeled a priori vertical profiles of the species of interest are used to extend upwards the measured aircraft profiles to allow for comparison to satellite-retrieved values (see, for example, Martínez-Alonso et al., 2014, 2020); the error associated with this approach is unknown.
TROPOMI (the TROPOspheric Monitoring Instrument) (Veefkind et al., 2012), onboard the ESA Sentinel-5 Precursor platform, measures CO, among other species, at high spatial resolutions. Unlike MOPITT, TROPOMI can retrieve CO under both clear and cloudy conditions. TROPOMI retrieves parameters describing the cloud contamination of the measurement (cloud height, cloud optical thickness) and interfering trace gases together with the CO column. TROPOMI retrievals are based on the profile-scaling method (Borsdorff et al., 2014; Landgraf et al., 2016). Under cloudy conditions, the scaling of the profile is estimated by the CO concentration in higher altitudes in the atmosphere instead of by the real total CO column; this is fully described by the total column AK (averaging kernel) supplied with the data product. The error introduced by this approach on cloudy TROPOMI retrievals over bodies of water has been previously quantified (on the order of a few percent; Martínez-Alonso et al., 2020). Errors over land could in theory be larger, since most pollution sources are on land and close to the surface (i.e., below cloud top).
Here we use AirCore data (Tans, 2009; Karion et al., 2010) to estimate for the first time the error introduced in MOPITT validation results by the use of shorter aircraft vertical CO profiles extended upwards. We also investigate the error introduced by clouds on TROPOMI land CO retrievals by comparing them to AirCore vertical profiles. AirCore provides calibrated, high-precision measurements of CO and other long-lived species along vertical profiles from near the surface to the lower stratosphere. Because of its ability to sample such a large vertical range, AirCore is a great candidate for validating tropospheric satellite instruments. The AirCore atmospheric sampling system consists of an airborne coiled tube, typically flown on a balloon and filled with a gas of known composition, which is evacuated during ascent; once the balloon's altitude ceiling is reached, the now-empty tube starts a parachute-based descent, during which it fills with the air it encounters. After recovery, the whole-air sample collected is analyzed in the laboratory for various long-lived atmospheric trace gases.
In the following sections we describe the datasets used in this study (Sect. 2), detail the methodology used in the analyses outlined above (Sect. 3), present our results (Sect. 4), and discuss their relevance (Sect. 5). In Sect. 6 we offer conclusions.
2.1 AirCore
The AirCore (Tans, 2009; Karion et al., 2010; Tans, 2022) is an innovative atmospheric sampling system comprised of a long tubing coil that is used to passively sample the atmosphere on high-altitude balloons. Before launch the AirCore is filled with a gas mixture of known composition: the “fill gas”, which is comprised of ambient levels of CO2 (carbon dioxide) and CH4 but is spiked with high CO mole fractions. With one end closed and the other open to the outside air, the AirCore evacuates the fill gas as the balloon ascends to ∼ 30 km above mean sea level. Once the AirCore is released from the balloon, it collects a continuous sample of ambient air as it descends from the altitude ceiling to the ground. Upon landing, the open end of the coil is automatically closed, thus preserving the sample air inside. Mixing (which is only a result of molecular diffusion and Taylor dispersion) is relatively insignificant: ∼ 0.5 m in both directions over the 4 h typically needed to retrieve and analyze the air sample; thus, in the case of the NOAA AirCore design used for this analysis, approximately 100 discrete samples can be measured in these 100 m long, uniform-diameter tubing coils (Tans, 2022). The quantified altitude uncertainty of trace gas profiles retrieved using this technique, provided in the data files, is dependent upon the bi-directional diffusion of molecules of a gas of interest in the AirCore sample and is larger at higher altitudes because the air sampled first (i.e., that in the stratosphere) has a longer diffusion time in the tubing coil. While not empirically quantified in NOAA AirCore CO profiles presented here, others have quantified the uncertainty in AirCore altitude registration due to incorrect assumptions in the AirCore tubing pressure equilibrium during balloon descent (Wagenhaeuser et al., 2021). NOAA profiles attempt to correct for pressure disequilibrium in the AirCore tubing and for its effect on the total mass of air entering the AirCore at each altitude through comparisons of modeled pressure equilibrium and that measured in situ between ambient air and the closed end of the AirCore. This uncertainty is largest at lower atmospheric pressures (i.e., at more than ∼ 20 km above mean sea level) than at higher ones. We hypothesize that this potential uncertainty component is likely to be of smaller magnitude than that calculated for CO diffusion at altitudes up to 15–20 km (above which a higher uncertainty is likely, but these portions of the CO profiles are discarded, as described below). Therefore, we believe this potential uncertainty component would have a negligible influence on the results presented here. AirCore sample trace gas profiles retrieved are calibrated and traceable to World Meteorological Organization standard scales. The AirCore trace gas measurements have been rigorously evaluated and have shown comparable repeatability (precision) to those from aircraft data collected from continuous analyzers and sampled in silicate glass flasks (Karion et al., 2010). The most recent AirCore dataset (13 August 2021 version; Baier et al., 2021) contains over 130 vertical profiles of CO, CO2, CH4, temperature, and relative humidity acquired at several locations worldwide (Fig. 1) between January 2012 and July 2021. Unlike most aircraft vertical profiles, AirCore profiles sample from near the surface to the lower stratosphere and, therefore, do not need to be extended upwards with their closest measurement to the tropopause and a priori values in order to represent the full tropospheric column as measured by satellite instruments.
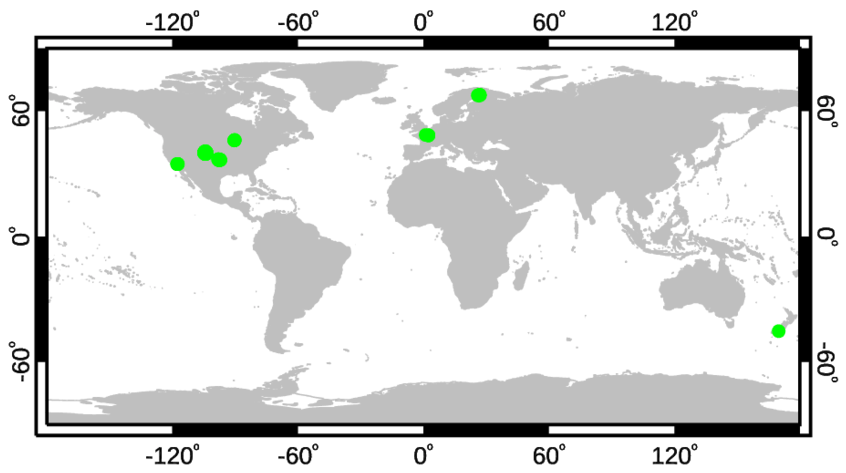
Figure 1AirCore vertical profile locations listed from west to east. USA: Edwards Air Force Base (California), Boulder (Colorado), Lamont (Oklahoma), and Park Falls (Wisconsin). France: Traînou. Finland: Sodankylä. New Zealand: Lauder.
Current techniques for retrieving trace gas profiles rely on the use of a CO-spiked fill gas – all of which except ∼ 1 % evacuates during balloon ascent – and a high CO mole fraction “push gas” that follows the AirCore sample during analysis. Both mixtures are used to identify the beginning and end of the air sample collected but affect the topmost (stratospheric) and bottommost (near-surface) portions of the profile through end-member mixing. With this method, CO is used to correct for “end-member” mixing in other trace gas profiles (Karion et al., 2010). The top- and bottommost portions of AirCore CO profiles used for this correction are thus discarded, resulting in CO profiles that extend from the near-surface to between 15 and 20 km above mean sea level. CO in AirCore samples is measured by cavity ringdown-spectroscopy (CRDS) at a precision typically less than 5 ppb (Karion et al., 2013) for ∼ 0.5 Hz measurements. AirCore CO is, however, still considered a developmental product due to its use for correcting end-member mixing in other trace gas profiles. Comparisons of stratospheric AirCore CO profiles have sometimes shown differences up to ∼ 15 ppb, which could be a result of AirCore tubing surface interactions, uncertainties in the altitude registration of the AirCore CO profile, or diffusion effects. It is also possible that chemical interactions or measurement interferences from other trace gas species or incorrect AirCore sample end-member assumptions have been made. Given these uncertainties and the number of independent CO measurements in each AirCore sample, we derive an estimated AirCore XCO uncertainty of ∼ 1.3 ppb (2 sigma), equivalent to ∼ 1.8 %.
The NOAA AirCore systems are typically deployed in pairs on the same balloon flight string. We have quantified the repeatability of retrieved CO profiles by comparing the 41 pairs of AirCore profiles launched simultaneously (i.e., with zero minutes lag time) and from the same site. Each profile was resampled to a common 20 000-level vertical grid, and intra-pair differences were calculated. Figure 2 shows that, at most altitudes, mean differences are well below ±2 ppb (average 0.03 ppb). Mean differences at the top of the profiles (between 50 and 70 hPa, approximately) are slightly larger (5–15 ppb); this is consistent with the higher uncertainty in AirCore stratospheric CO retrievals described by Chen et al. (2022).
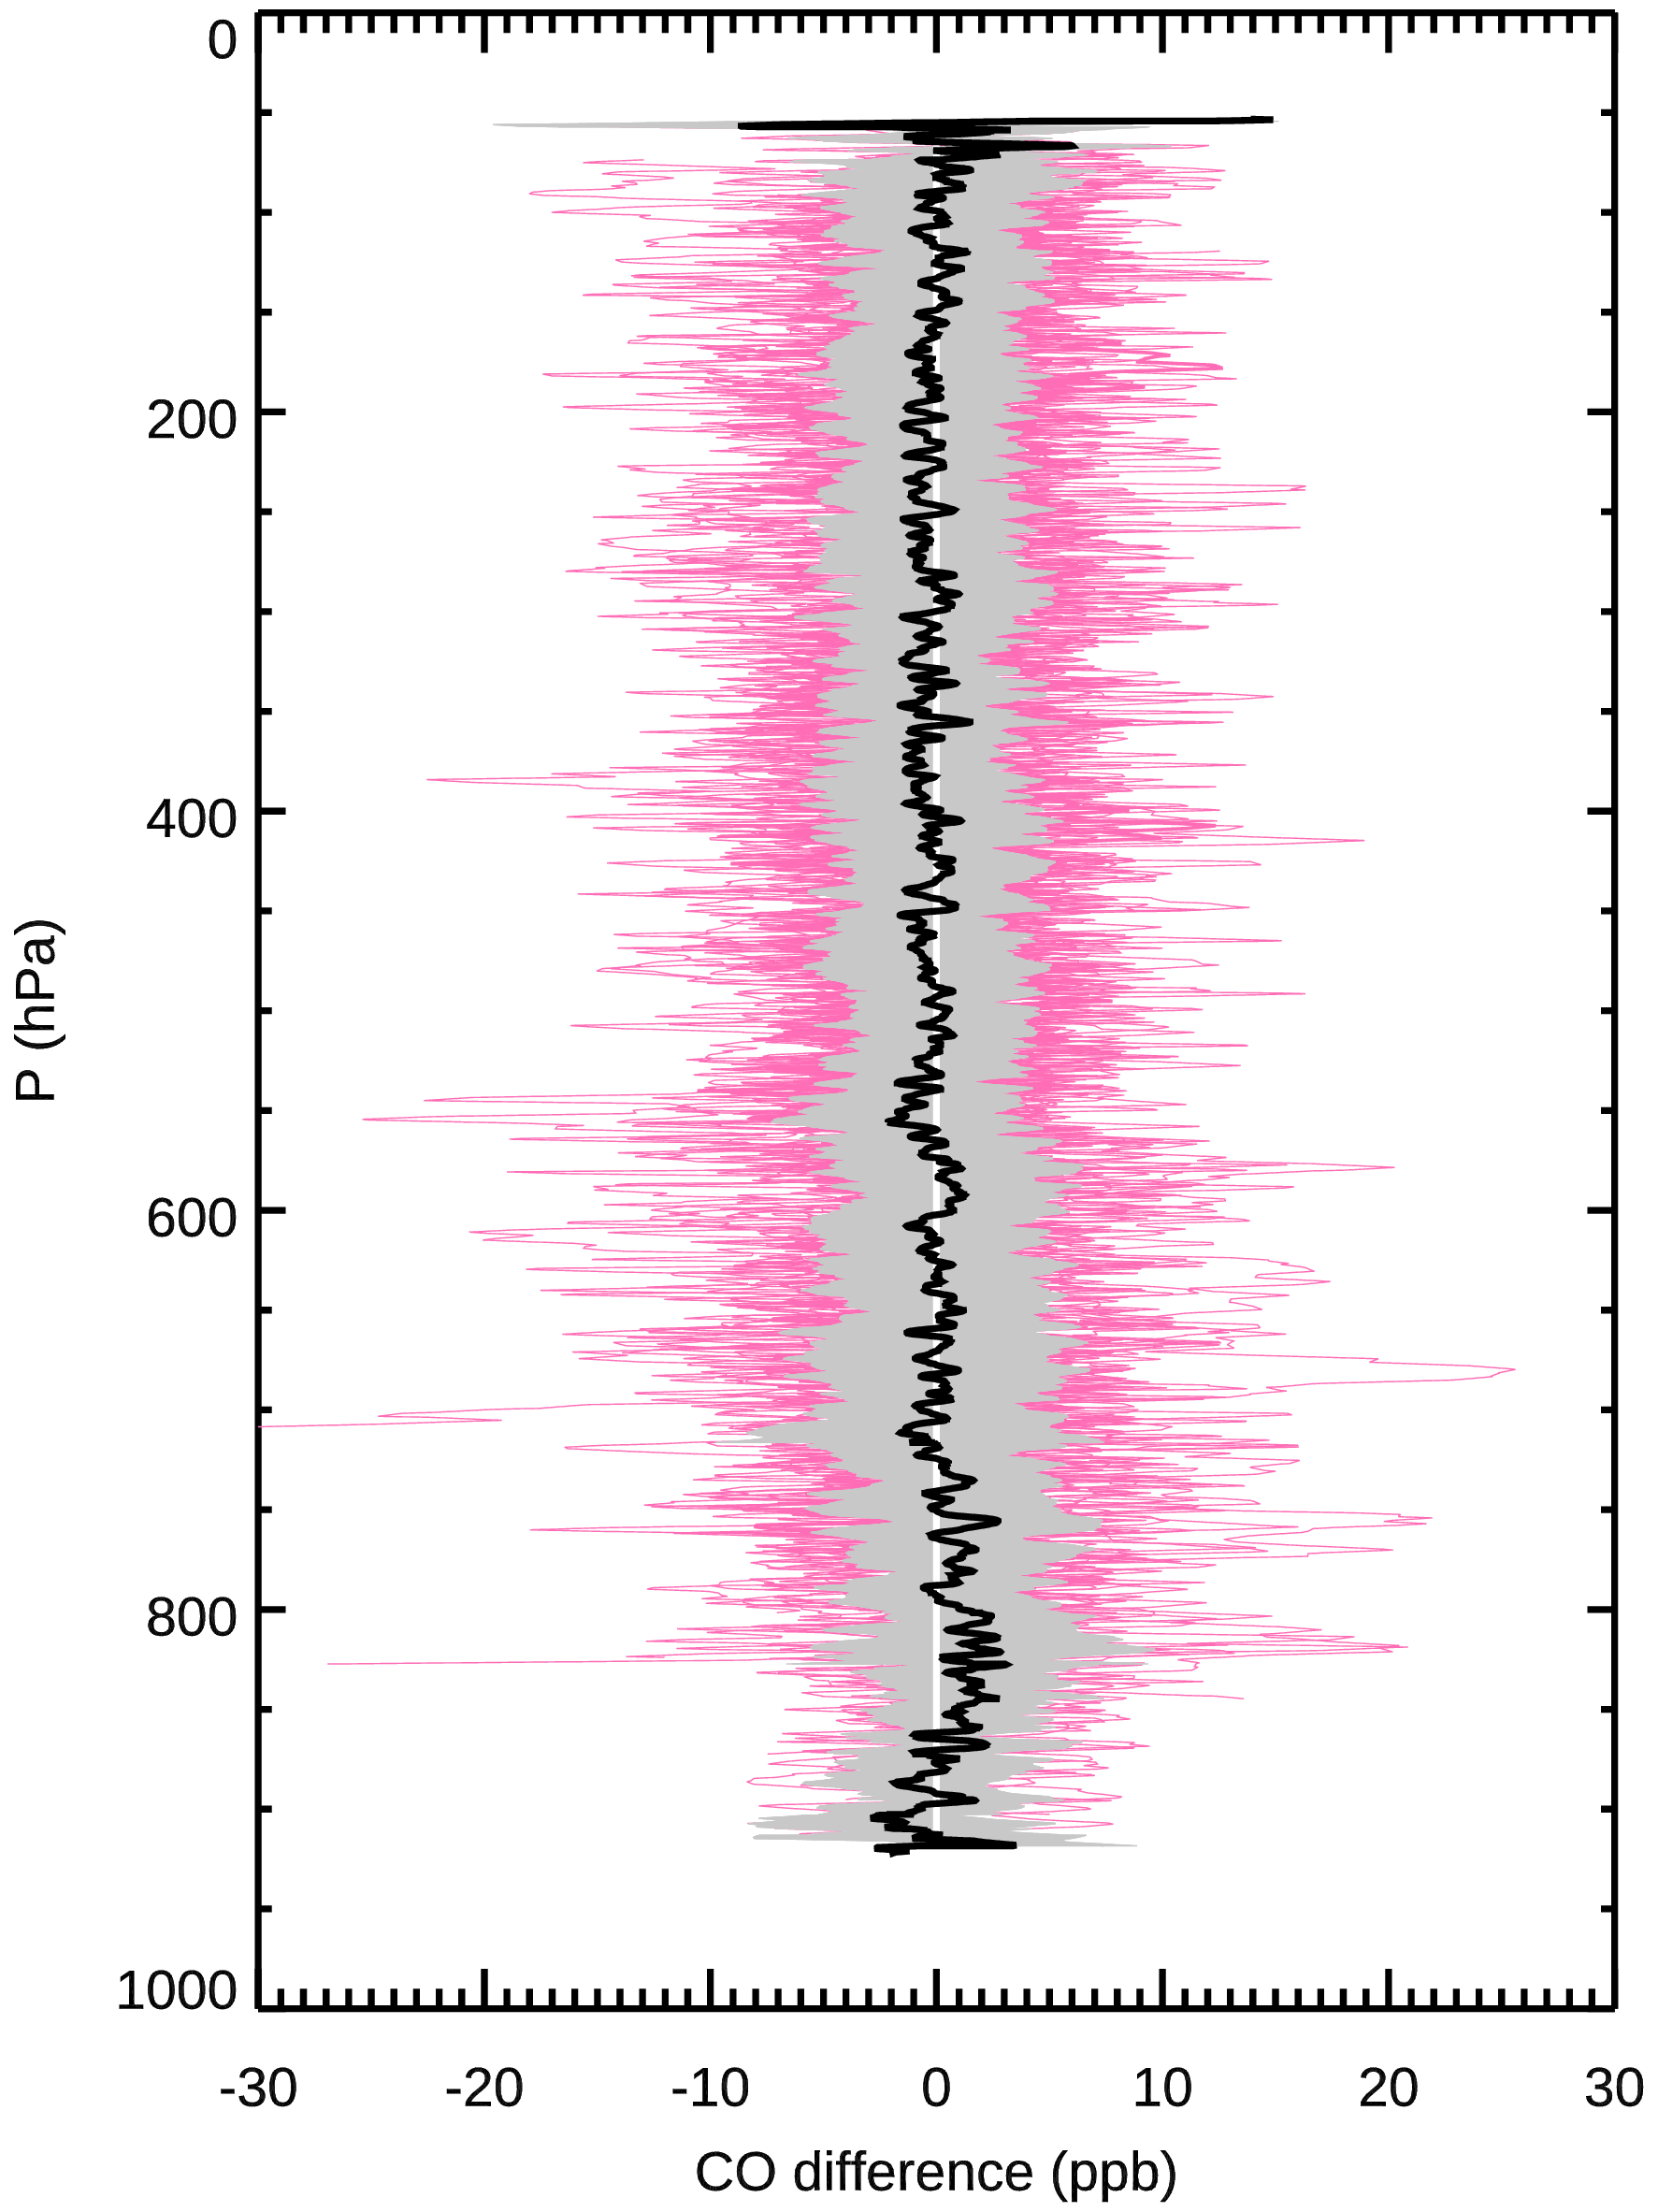
Figure 2Differences between CO vertical profiles acquired by pairs of AirCore systems deployed simultaneously and from the same location. Pink: biases for each AirCore pair. Black: mean of all biases. Gray: mean ±1 standard deviation (SD).
We have compared the AirCore-retrieved CO profiles to colocated CO vertical profiles from the NOAA aircraft flask dataset (GLOBALVIEWplus v2.0 ObsPack; Sweeney et al., 2021) in order to quantify biases of the former with respect to the latter (∼ accuracy). The NOAA aircraft flask dataset (or “aircraft dataset” for simplicity) has been described in detail by Sweeney et al. (2015) and used extensively in MOPITT validation (Deeter et al., 2019, and references therein). We analyzed the two datasets in their entirety (i.e., all sites and dates). Only profiles from the Southern Great Plains site (in Oklahoma, USA; 36.607∘ N, −97.489∘ E) acquired between January 2012 and July 2018 satisfied the different colocation criteria imposed. The averaged biases (AirCore minus aircraft data) for the five available colocated pairs acquired less than 2 h and 15 km apart range between approximately −6 and +6 ppb (near 750 and 920 hPa, respectively), with a 0.6 ppb overall average bias (Fig. 3a). Allowing larger distances between colocated pairs results in more colocated pairs and a slight increase in biases closer to the surface: up to 13 ppb for colocation distance <25 km (Fig. 3b) and up to 20 ppb for colocation distance <50 km (Fig. 3c) at ∼ 875 hPa in both cases. Biases at lower pressure levels remain similarly low to those obtained with the most restricted colocation thresholds. Increasing biases near the surface with larger colocation distances is consistent with CO values being more variable near the surface, where emissions take place. Horizontal displacements between the start and end of AirCore profiles are on average 26 km ± 10 km, similar to those between the start and end of NOAA aircraft flask profiles (14 km ± 18 km at the Park Falls, Wisconsin site; 53 km ± 28 km at the East Trout Lake, Saskatchewan site).
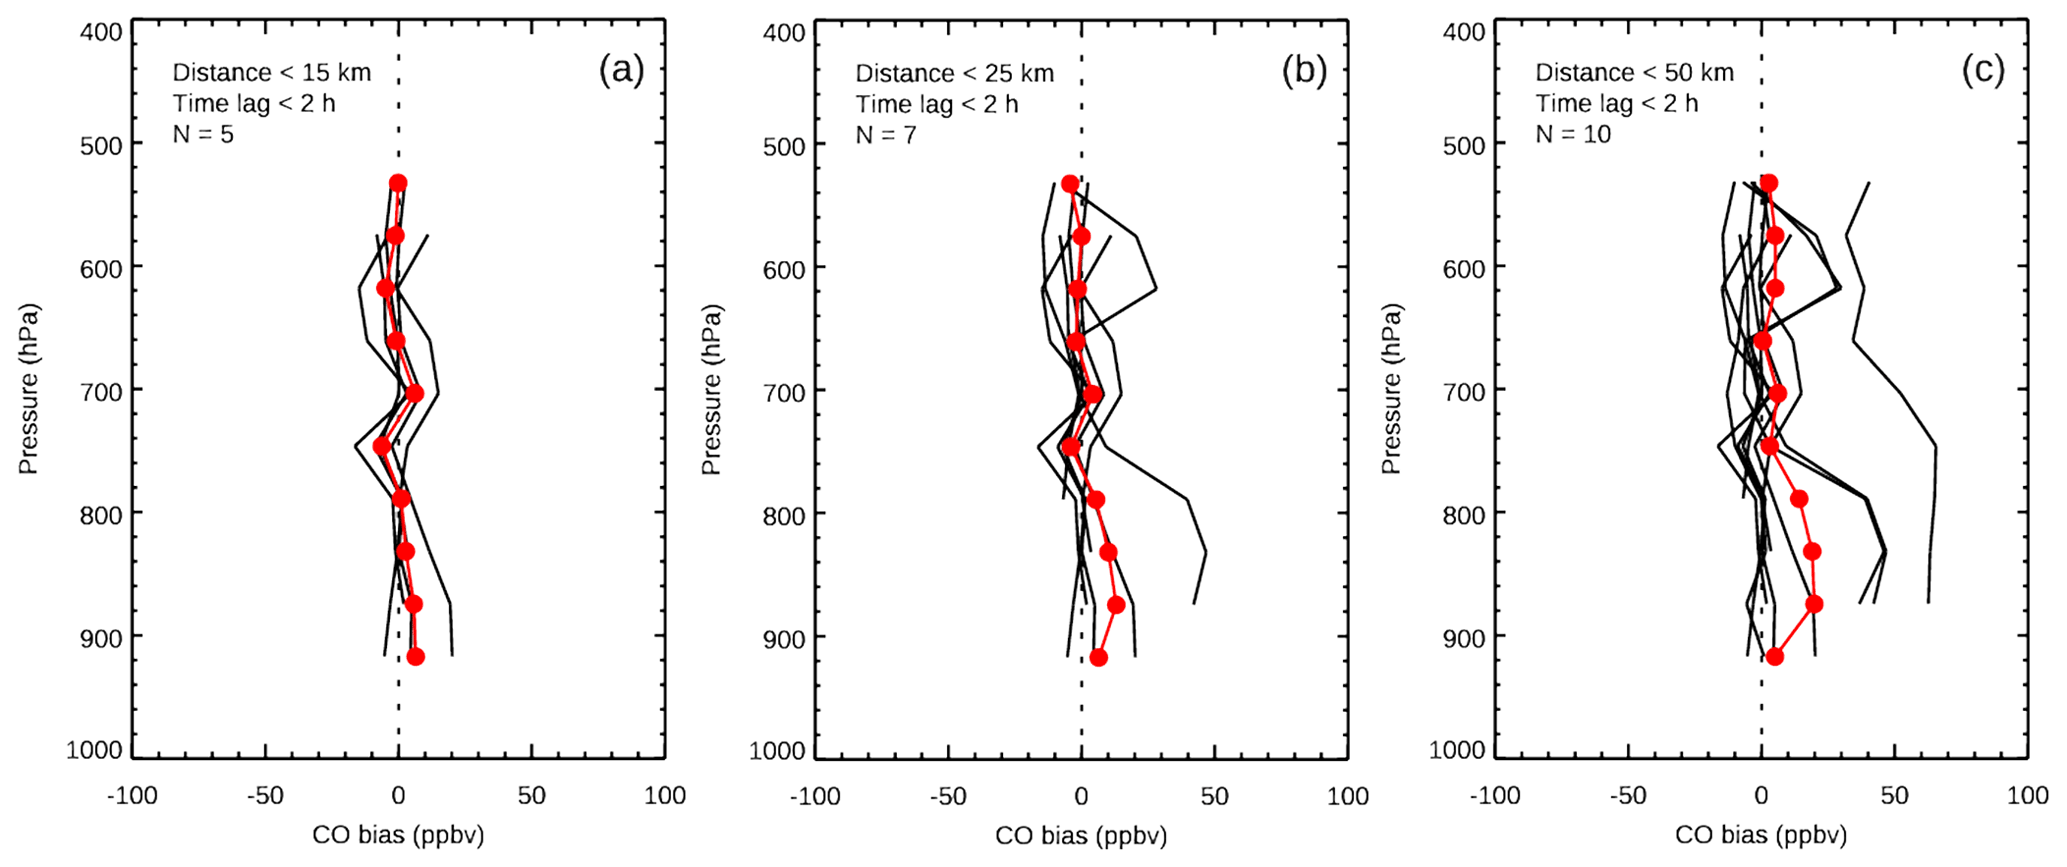
Figure 3Differences between colocated CO vertical profiles from AirCore and NOAA aircraft flask campaign (AirCore minus aircraft data). Black lines show the bias for each colocated pair, while averaged biases from all pairs are shown in red. Colocation criteria and number of colocated pairs are indicated in each panel.
2.2 MOPITT
MOPITT, onboard NASA's Terra satellite, is a cross-track scanning gas correlation radiometer (Drummond and Mand, 1996; Drummond et al., 2010; Worden et al., 2013). From its sun-synchronous orbit at 705 km of altitude and 10:30 LST (local standard time) Equator-crossing time, it provides global coverage approximately every 3 d with a 22×22 km2 footprint at nadir. It measures radiances in two spectral bands: one in the near-infrared (NIR, at ∼ 2.3 µm), the other in the thermal-infrared (TIR, at ∼ 4.7 µm). Tropospheric CO profiles and total CO column values are derived separately from measurements in each of these two bands as well as from their combined multispectral radiances (TIR+NIR). MOPITT is currently the only satellite instrument capable of multispectral CO retrievals, which have enhanced sensitivity to CO near the surface in some land observations (Worden et al., 2010). MOPITT CO profiles are provided for 10 levels (surface, 900 hPa, …, 100 hPa), where each retrieval level corresponds to a uniformly weighted layer immediately above that level (Deeter et al., 2013). MOPITT retrievals are performed under clear conditions only, allowing ≤5 % cloud areal coverage inside the field of view. Here we use level 2 TIR, NIR, and multispectral standard archival files (Deeter et al., 2017) from MOPITT version 8 (Deeter et al., 2019).
2.3 TROPOMI
TROPOMI is a push-broom imaging spectrometer in a sun-synchronous orbit at 824 km of altitude and with a 13:30 LST Equator-crossing time (Veefkind et al., 2012). Because of its wide (2600 km) swath width, it provides quasi-global daily coverage. Its spatial resolution at nadir has been near 7×5.5 km2 (across × along track) since 6 August 2019, down from around 7×7 km2 before that date. A change in the Copernicus Sentinel-5P operations scenario resulted in this resolution improvement (Landgraf et al., 2021). TROPOMI measures radiance in the ultraviolet, visible, and reflected-infrared; total CO column values are retrieved from the latter (from a ∼ 2.3 µm band, like MOPITT). CO retrievals over land are obtained in both clear and cloudy conditions; the latter is possible by retrieving effective parameters (cloud height and optical thickness) that describe the cloud contamination of the measurements simultaneously with the trace gas columns (Landgraf et al., 2016) and then approximating partial CO columns under cloud tops with scaled reference profiles from the global chemical transport model TM5 (Krol et al., 2005). Even though reflected-infrared radiances are used, this approach allows for the retrieval of CO over bodies of water if clouds are present; in their absence, most of the incoming radiation is absorbed by the water. We have used, for any given day, TROPOMI data files from the most recent processor version available (1 January–1 April 2000), either offline or reprocessed.
We compare tropospheric total CO column retrievals from MOPITT and TROPOMI with respect to their colocated AirCore counterparts. Additional comparisons of colocated MOPITT and truncated AirCore vertical profiles were also performed. Colocation criteria required that observations from the two instruments involved were acquired within ≤12 h from each other and that their horizontal distance was ≤50 km, which are the same thresholds routinely used in MOPITT validations over land (e.g., Deeter et al., 2019).
Comparisons of remote sounder retrievals obtained with optimal estimation-based methods and in situ measurements must take into account the characteristics of the retrieval, e.g., its averaging kernels, or AK, and a priori (Rodgers and Connor, 2003). The MOPITT algorithm is based on optimal estimation, as developed by Rodgers (2000); thus, for MOPITT,
where Cret is the retrieved total column value, Ca is the a priori total column value, Ac is the total column averaging kernel, Xtrue is the true profile value (i.e., the actual atmospheric composition at the time and location of the remote observation, approximated in practice with in situ measurements), and Xa is the a priori profile value. Ac is unitless, and all other variables are expressed in column density, i.e., molecules per unit area. By applying Eq. (1) to the in situ profile, we can simulate the effects of the remote sounder retrieval and produce a “smoothed” version of the in situ measurement, which can then be directly compared to the sounder retrieval.
The Rodgers and Connor (2003) methodology is not applicable to TROPOMI retrievals because the TROPOMI algorithm is not based on the optimal-estimation method but rather on Tikhonov regularization (Vidot et al., 2012; Borsdorff et al., 2014; Landgraf et al., 2016, and references therein). For TROPOMI,
Applying Eq. (2) to the in situ profile results in a retrieval-simulated (smoothed) version of the in situ measurement, which can be directly compared to the TROPOMI retrieval.
Prior to obtaining smoothed AirCore total CO columns, complete (e.g., from the surface to the top of the atmosphere) AirCore CO profiles were generated following the standard method for MOPITT validation with aircraft data (Martínez-Alonso et al., 2020). AirCore profiles were interpolated to match the MOPITT a priori 35-level vertical grid, which preserves high vertical resolution in the troposphere. Empty levels at the bottom of each interpolated profile (levels with no CO value) were filled with the interpolated measurement closest to the surface. Empty levels between the top of the interpolated profile and the tropopause would usually be filled with the interpolated measurement closest to the tropopause; however, because all AirCore profiles reached the tropopause, this step was not necessary. Finally, empty levels above the tropopause were filled with colocated MOPITT a priori CO values. The now complete AirCore profiles were interpolated to match the 10-level vertical grid of the MOPITT retrievals. Total CO column values were derived from the vertical profiles as follows:
where C is the total column value in molec. cm−2, the constant 2.12×10¹³ is in molec. cm−2 hPa−1 ppb−1, n is the number of partial columns in the profile, Δpi is the thickness of partial column i in hPa, and xi is the mean volume mixing ratio (VMR) for the layer above level i reported in ppb units. The derivation of Eq. (3) can be found in Deeter (2009).
Statistical values from the comparison of the satellite datasets (MOPITT, TROPOMI) with respect to AirCore in situ measurements were then calculated (satellite minus AirCore).
Additionally, we calculated the error introduced by approximating TROPOMI's partial columns below cloud-top with the TROPOMI reference profiles by calculating the null-space error (enull) of the TROPOMI retrieval process (Borsdorff et al., 2014; Landgraf et al., 2016):
where I (a vector of ones) is the total column operator. The TROPOMI null-space error is indicative of differences between the shape of TROPOMI CO reference profiles and that of true CO profiles, which may result in differences between the true and TROPOMI-retrieved total CO column values. This error is only important when total column TROPOMI AKs are not used in retrieval comparisons or validations; otherwise, enull is, by definition, zero.
4.1 MOPITT vs. AirCore
CO values from the MOPITT version 8 and AirCore datasets were compared following the standard validation procedure, as described above. Additionally, for reference, we performed an analogous comparison of MOPITT data with respect to the NOAA aircraft flask dataset traditionally used in MOPITT validation. To avoid ambiguities, we constrained both sets of comparisons to the period between January 2012 (the start of the AirCore dataset) and December 2019 (the most recent aircraft data officially available at the time of writing). Figure 4 summarizes CO bias values obtained in these comparisons; those values are also shown in Table 1, where full MOPITT validation results for the 2000–2018 period with respect to the aircraft dataset (from Deeter et al., 2019) are included for reference.
Table 1Statistics from the comparison of MOPITT CO with respect to AirCore and to NOAA aircraft flask data for the 2012–2019 period. Statistics from the validation of MOPITT CO with respect to aircraft data for 2000–2018 (Deeter et al., 2019) are also included for reference. Column bias and SD are provided in percent (%) and in units of 1017 molec. cm−2 (in parentheses). Column bias r from VMR values (in parentheses) are lower than r from percent values because VMR results are presented in terms of log(VMR) after subtracting the a priori values (see Deeter et al., 2017); thus, the a priori variability does not contribute to the correlation. Partial column relative bias and SD in %. Partial column results only shown for even pressure levels, for simplicity.
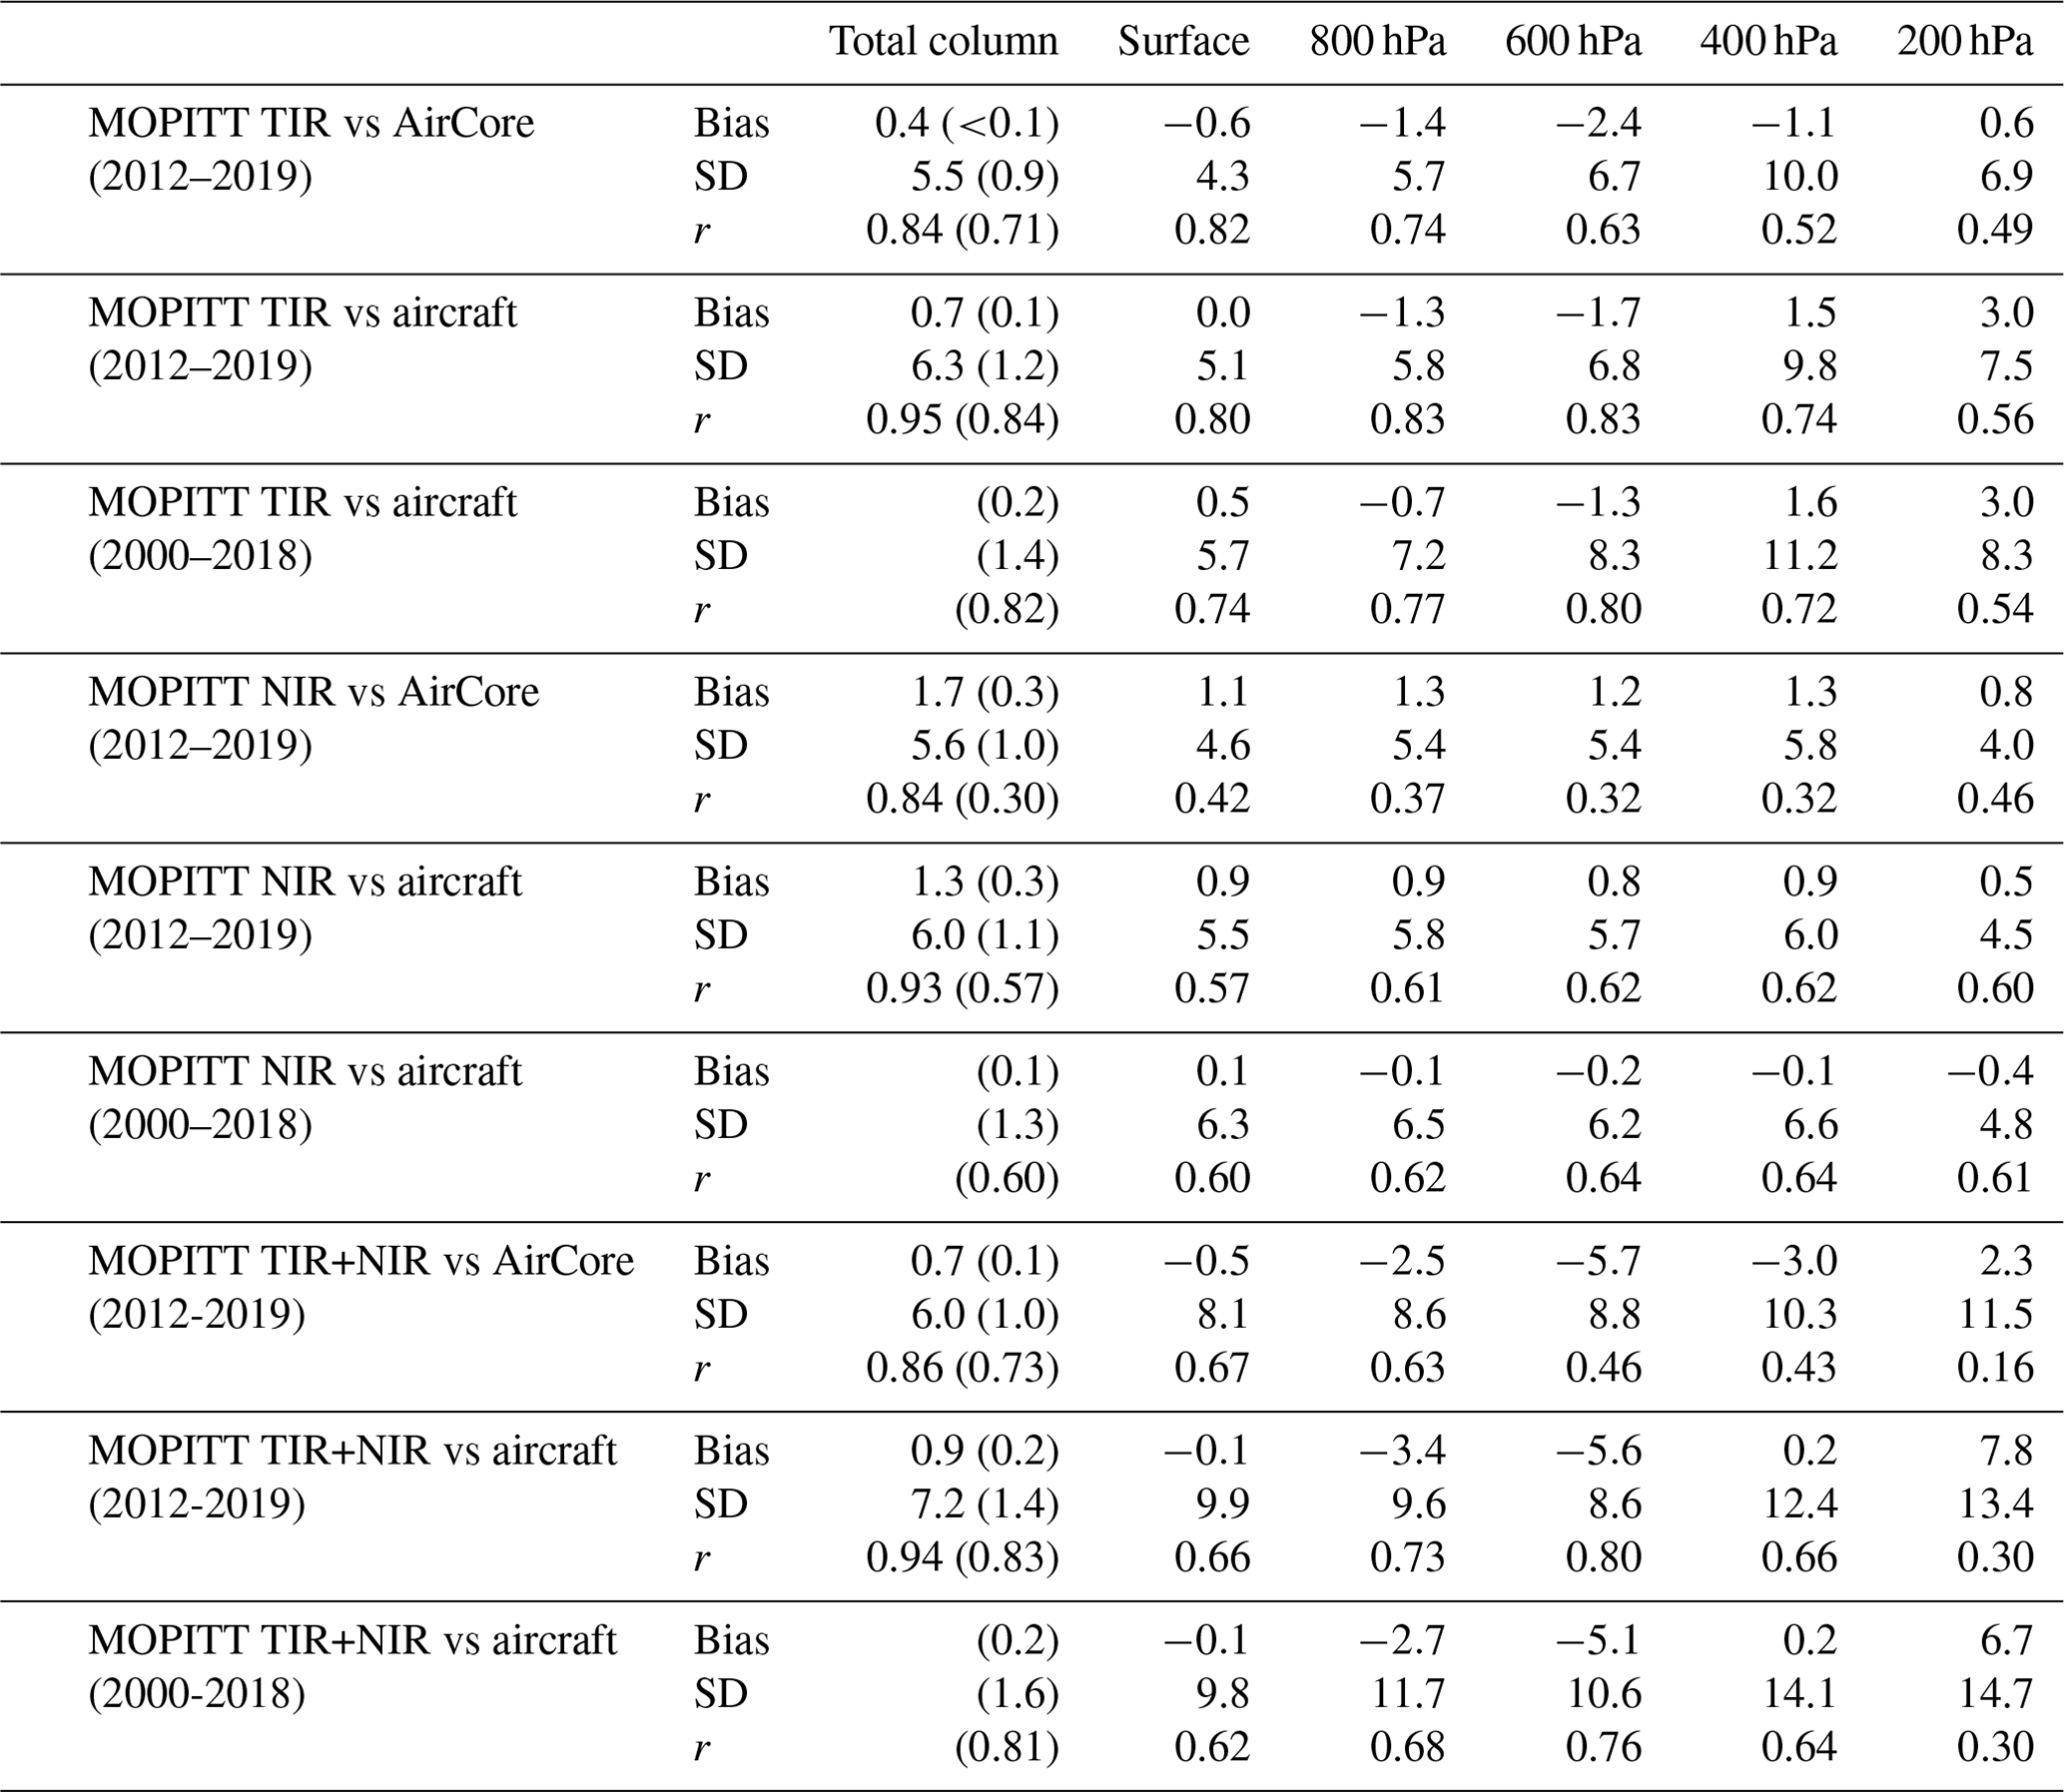
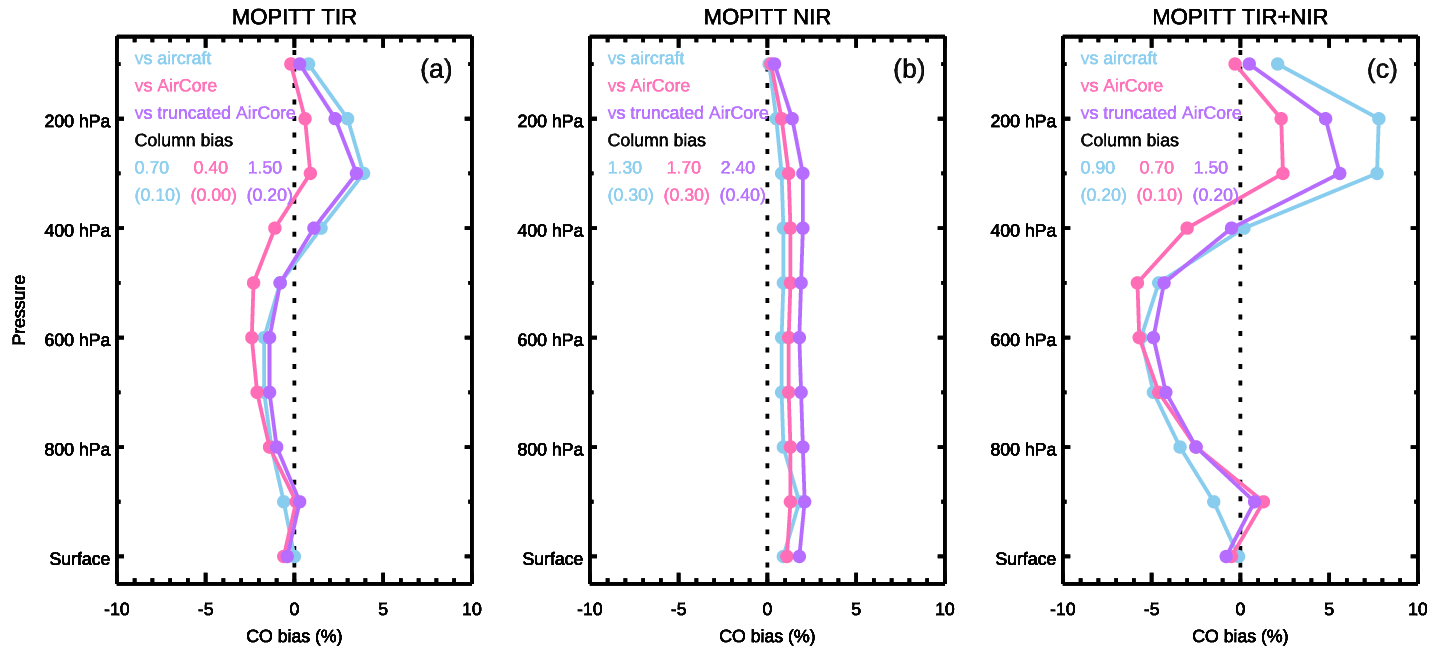
Figure 4CO biases for the 2012–2019 period from the comparison of MOPITT with respect to NOAA aircraft flask data (blue), AirCore profiles (pink), and truncated AirCore profiles extended upwards (purple). (a) For MOPITT TIR. (b) For MOPITT NIR. (c) For MOPITT multispectral. Column bias values are provided in percent (%) and in units of 1017 molec. cm−2 (in parentheses). The ±10 % CO bias range is equal to the MOPITT target accuracy (Francis et al., 2017).
Biases between the three MOPITT variants (TIR, NIR, and multispectral) relative to AirCore are well below the MOPITT 10 % target accuracy (Francis et al., 2017) in all cases. MOPITT TIR partial column biases range from −2.4 % at 600 hPa and 0.9 % at 300 hPa; their mean is −0.85 %. MOPITT TIR total column bias is below 0.1×10¹⁷ molec. cm−2. MOPITT NIR partial column biases are even smaller, ranging between 0.2 % at 100 hPa and 1.3 % at 900, 800, 500, and 400 hPa, with a 1.1 % mean. The NIR total column bias is 0.3×10¹⁷ molec. cm−2. Partial column biases for the MOPITT multispectral variant are between −5.8 % and 2.4 % at 500 and 300 hPa, respectively; the mean is −1.64 %. MOPITT multispectral total column bias is 0.1×10¹⁷ molec. cm−2. Partial column standard deviation (SD) values range from 1.4 (for MOPITT TIR at 100 hPa) to 13.5 % (TIR+NIR, 300 hPa), with a mean of 6.9 %. For total column, the SD values are between 0.9 and 1.0×10¹⁷ molec. cm−2 (mean molec. cm−2).
Biases between the three MOPITT variants and aircraft profiles are also analyzed here for reference; next we describe results for the same time period covered by AirCore. MOPITT TIR partial column biases range from −1.7 % at 700 and 600 hPa and 3.9 % at 300 hPa, with a 0.3 % mean. MOPITT TIR total column bias is 0.1×10¹⁷ molec. cm−2. MOPITT NIR partial column biases range between 0.1 % at 100 hPa and 1.8 % at 900 hPa; the mean is 0.84 %. MOPITT NIR total column bias is 0.3×10¹⁷ molec. cm−2. MOPITT multispectral total column biases range from −5.6 % at 600 hPa to 7.8 % at 200 hPa, with a −0.23 % mean. MOPITT multispectral total column bias is 0.2×10¹⁷ molec. cm−2. Partial column SD values range from 1.6 % (NIR, 100 hPa) to 16.5 % (TIR+NIR, 300 hPa), with a mean of 7.5 %. For total column, the SD values are between 1.1 and 1.4×10¹⁷ molec. cm−2 (mean = 1.23×10¹⁷ molec. cm−2). These statistical results are in good agreement with the values reported by Deeter et al. (2019) for the 2000–2018 period (Table 1).
MOPITT partial column biases with respect to both the AirCore and the aircraft datasets follow very similar vertical patterns (Fig. 4). The MOPITT multispectral variant displays the most extreme bias values. TIR and multispectral biases are close to zero near the surface, become negative between the surface and 500 hPa, and then become positive between 300 and 100 hPa. In general, MOPITT biases with respect to AirCore and aircraft data are similar in the low-mid troposphere (i.e., between the surface and 500 hPa) for the TIR and multispectral variants. In contrast, biases for these two variants are closer to zero in the upper troposphere (300–100 hPa) when AirCore is involved. The NIR variant shows very small positive biases at all pressure levels for both AirCore and aircraft data.
4.1.1 Effect of extending shorter aircraft profiles upwards
As stated earlier, aircraft profiles used in MOPITT validation do not, in most cases, sample the entire troposphere due to limitations in the maximum altitude reachable by the sampling aircraft. The aircraft profiles in these cases are extended to the tropopause using the interpolated aircraft measurement closest to the tropopause and above the tropopause using a priori data from the CAM-chem model (Community Atmosphere Model with chemistry, Lamarque et al., 2012) for the same location and month of the aircraft profile to be extended. The error introduced in validation by extending aircraft profiles upwards was expected to be small, but quantifying it had not been possible in the past due to the lack of suitable in situ measurements intrinsic to this problem. The AirCore dataset brings, for the first time, the opportunity to quantify this error. To this effect, we simulated a shorter AirCore dataset by truncating all AirCore profiles at 7000 m, i.e., slightly above the 400 hPa pressure threshold, which must be reached by aircraft profiles to be usable in MOPITT validation. The truncated AirCore profiles were then extended upwards using the closest measurement to the tropopause and a priori CO data and compared to the MOPITT dataset, as described earlier. For consistency, we constrained this analysis to the period between January 2012 and December 2019. Results are summarized in Table 2 and Fig. 4.
Table 2Statistics from the comparison of MOPITT CO with respect to truncated AirCore profiles extended upwards. Column bias and SD are provided in percent (%) and in units of 1017 molec. cm−2 (in parentheses). Column bias r from VMR values (in parentheses) are lower than r from percent values because VMR results are presented in terms of log(VMR), after subtracting the a priori values (see Deeter et al., 2017); thus, the a priori variability does not contribute to the correlation. Partial column relative bias and SD in %. Partial column results only shown for even pressure levels, for simplicity.

Biases between the three MOPITT variants and truncated AirCore are well below the MOPITT 10 % target accuracy. MOPITT TIR partial column biases range from −1.4 % at 600–700 hPa and 3.5 % at 300 hPa; their mean is 0.25 %. MOPITT TIR total column bias is 0.2×10¹⁷ molec. cm−2. MOPITT NIR partial column biases range between 0.4 % at 100 hPa and 2.1 % at 900 hPa, with a 1.73 % mean. The NIR total column bias is 0.4×10¹⁷ molec. cm−2. Partial column biases for MOPITT multispectral are between −4.9 % and 5.6 % at 600 and 300 hPa, respectively; the mean is −0.55 %. MOPITT multispectral total column bias is 0.2×10¹⁷ molec. cm−2. Partial column SD values range from 1.4 % (NIR, 100 hPa) to 11.6 % (TIR+NIR, 300 hPa), with a mean of 6.2 %. For total column, the SD values are between 0.8 and 0.9×10¹⁷ molec. cm−2 (mean = 0.84×10¹⁷ molec. cm−2). In general, MOPITT multispectral products exhibit more extreme retrieval errors compared to TIR and NIR retrievals because the effects of potential biases between measured and calculated radiances are amplified in the multispectral version of the retrieval algorithm. This amplification is done intentionally to boost the influence of the NIR radiances on the retrieval. In addition, multispectral retrievals are generally less stable than TIR and NIR retrievals because there is a greater chance that the radiances used in the retrieval will not be internally consistent (Deeter et al., 2012).
Figure 4 shows that biases between MOPITT and truncated AirCore partial columns differ from the MOPITT/AirCore biases described in Sect. 4.1. In general, biases between all three MOPITT variants and truncated AirCore profiles appear to shift to the right (i.e., increase slightly) with respect to the MOPITT/AirCore biases. For MOPITT TIR, biases increase mostly in the upper troposphere, by up to 2.6 p.p. (percent points) at 300 hPa, and mimic very closely in sign and magnitude those between MOPITT and the aircraft data. For MOPITT NIR, biases increase almost uniformly at all pressure levels, by 0.2–0.8 p.p. For MOPITT multispectral, the change in bias is larger (up to 3.2 p.p. at 300 hPa), mimicking once more the MOPITT/aircraft biases. For the total CO column, the biases between MOPITT and truncated AirCore increase by 0.20, 0.10, and 0.10×10¹⁷ molec. cm−2 (for the TIR, NIR, and multispectral variants, respectively).
4.2 TROPOMI vs AirCore
TROPOMI retrieves total CO column values from solar reflected radiances over land (under clear and cloudy conditions) and water (cloudy only). During TROPOMI, retrieval parameters describing the cloud contamination of the measurement and interfering trace gases are quantified together with the CO column. The reference CO profiles used in the retrieval are scaled based on estimated above-cloud CO rather than based on estimated total CO (Landgraf et al., 2016). A previous comparison of clear MOPITT and TROPOMI total CO column retrievals showed good agreement between the two datasets (Martínez-Alonso et al., 2020). In that same study, cloudy TROPOMI CO retrievals over bodies of water were also validated with respect to ATom (Atmospheric Tomography mission; Wofsy et al., 2018) aircraft profiles. The results showed that the enull (null-space error) of the profile scaling retrieval over water is very small (2.16 % with respect to the in situ measurements). The authors concluded that, since there are no major emission sources over water, CO values closer to the surface (most likely to be below cloud-top) are well characterized by the scaled reference profiles. Larger errors could occur, however, in cloudy TROPOMI land retrievals, particularly near CO emission sources, if not accounting for the TROPOMI AK. Their analysis could not be extended over land because the ATom campaign was designed to sample the troposphere mostly over oceans. Here we extend the Martínez-Alonso et al. (2020) analysis by characterizing the error introduced by clouds in land TROPOMI CO retrievals using CO profiles from the AirCore dataset.
We analyzed separately TROPOMI clear and cloudy data. TROPOMI clear-sky and clear-sky-like observations are defined by aerosol optical thickness <0.5 and cloud altitude values <500 m; they correspond to TROPOMI quality assurance (QA) value = 1.0. TROPOMI observations with mid-level clouds are those with aerosol optical thickness ≥0.5 and cloud altitude values <5000 m; QA = 0.7 (Landgraf et al., 2021). Comparisons of clear/cloudy TROPOMI total CO column values with respect to their colocated AirCore counterparts are summarized in Fig. 5 and Table 3. Under clear conditions, TROPOMI has similarly low bias values (1.27 % and 1.61 %) with respect to both unsmoothed and smoothed AirCore total CO column values; the latter account for TROPOMI vertical sensitivity to CO, as shown in Eq. (2). The Pearson correlation coefficient (R) values (0.81 and 0.82) indicate a slight improvement in the fit when the AK are applied. The slope of the fitted line remains unchanged (0.96). Under cloudy conditions, the change in biases is also small (1.03 % and 2.02 % for unsmoothed and smoothed AirCore values, respectively); the R values (0.74 and 0.76) and slope of the linearly fitted line (0.80 and 0.83) show larger improvement of the fit when the TROPOMI AK are accounted for. Figure 6 shows that, overall, the distribution of bias values is mostly symmetrical with respect to the zero % bias value; i.e., relative biases show no obvious latitudinal dependence, although the latitudinal coverage of available AirCore data is limited.
Table 3Summary of statistics from the comparison of total CO column values from TROPOMI (under either clear or cloudy conditions) and AirCore. Bias and SD values are provided in percent (%) and in units of 1017 molec. cm−2 (in parentheses).
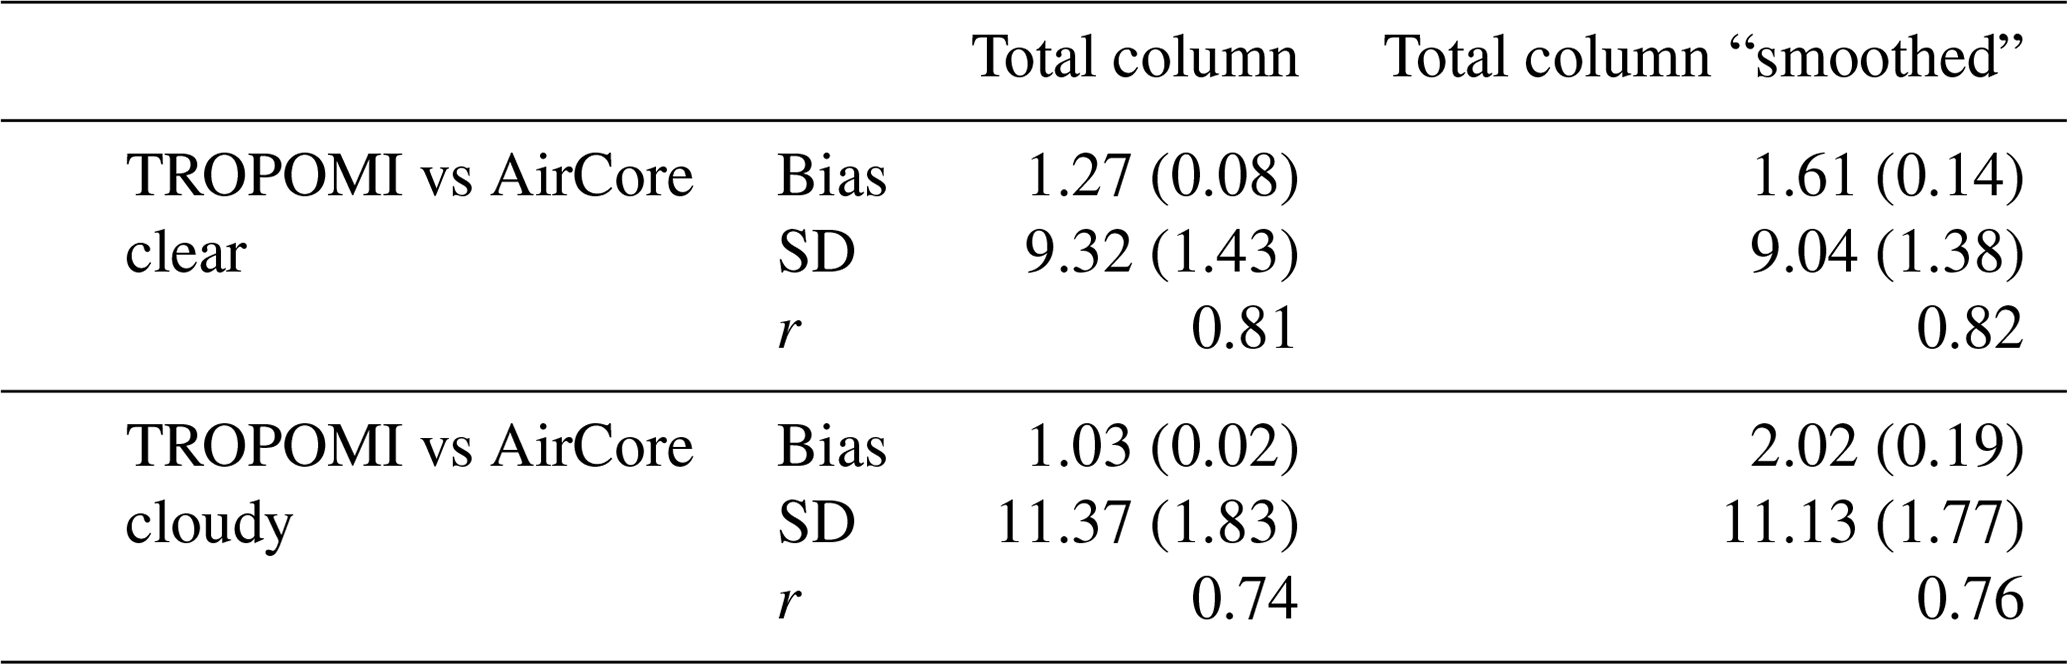

Figure 5Comparison of total CO column values from TROPOMI and AirCore for the November 2017–July 2021 period. Top row panels (a) and (b) are both for TROPOMI clear-sky and clear-sky-like observations (i.e., QA = 1.0). Bottom row panels (c) and (d) are for TROPOMI observations with mid-level clouds (i.e., QA = 0.7). Left column panels (a) and (c) show unsmoothed AirCore data. Right column panels (b) and (d) show smoothed AirCore data to account for TROPOMI vertical sensitivity to CO. Bias values are provided in percent (%) and in units of molec. cm−2.
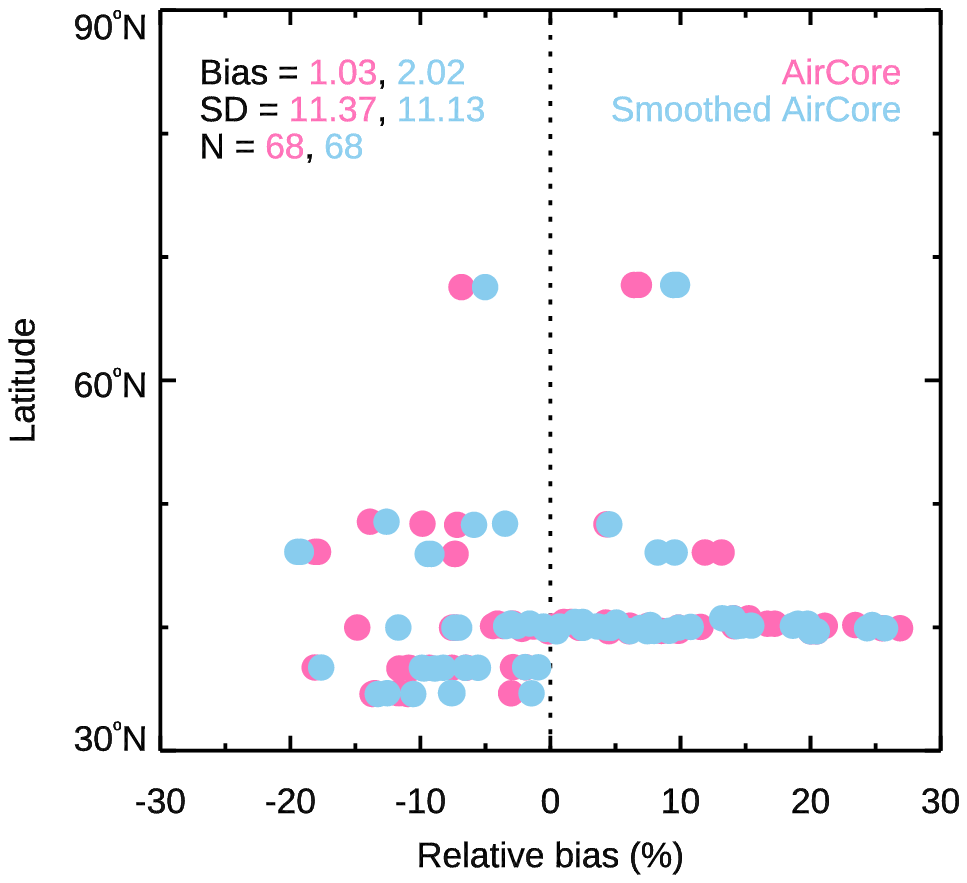
Figure 6Latitudinal distribution of bias values between TROPOMI and AirCore cloudy observations over land.
The TROPOMI null-space error (enull) quantifies the difference between the shapes of TROPOMI CO reference profiles and true CO profiles, which may result in differences between true and retrieved total CO column values. We have calculated enull values between TROPOMI and AirCore profiles over land using Eq. (4); results as a function of latitude are shown in Fig. 7. Under clear conditions, the TROPOMI total column averaging kernel Ac closely matches the total column operator I such that, according to Eq. (4), the null-space error e is close to zero. The relative mean and SD values of enull in this case are 0.36 % ± 0.66 %, or 0.61 ± 1.14×10¹⁶ molec. cm−2 (Fig. 7a). In cloudy conditions, TROPOMI is more sensitive to CO above the clouds than to CO below them; in these cases, if the shape of the TROPOMI reference profiles does not properly represent that of the actual CO profiles, a null-space error is introduced. Our results indicate that the relative mean and SD values of enull are in this case slightly larger: 0.98 % ± 2.32 %, or 1.65 ± 4.15×10¹⁶ molec. cm−2 (Fig. 7b).
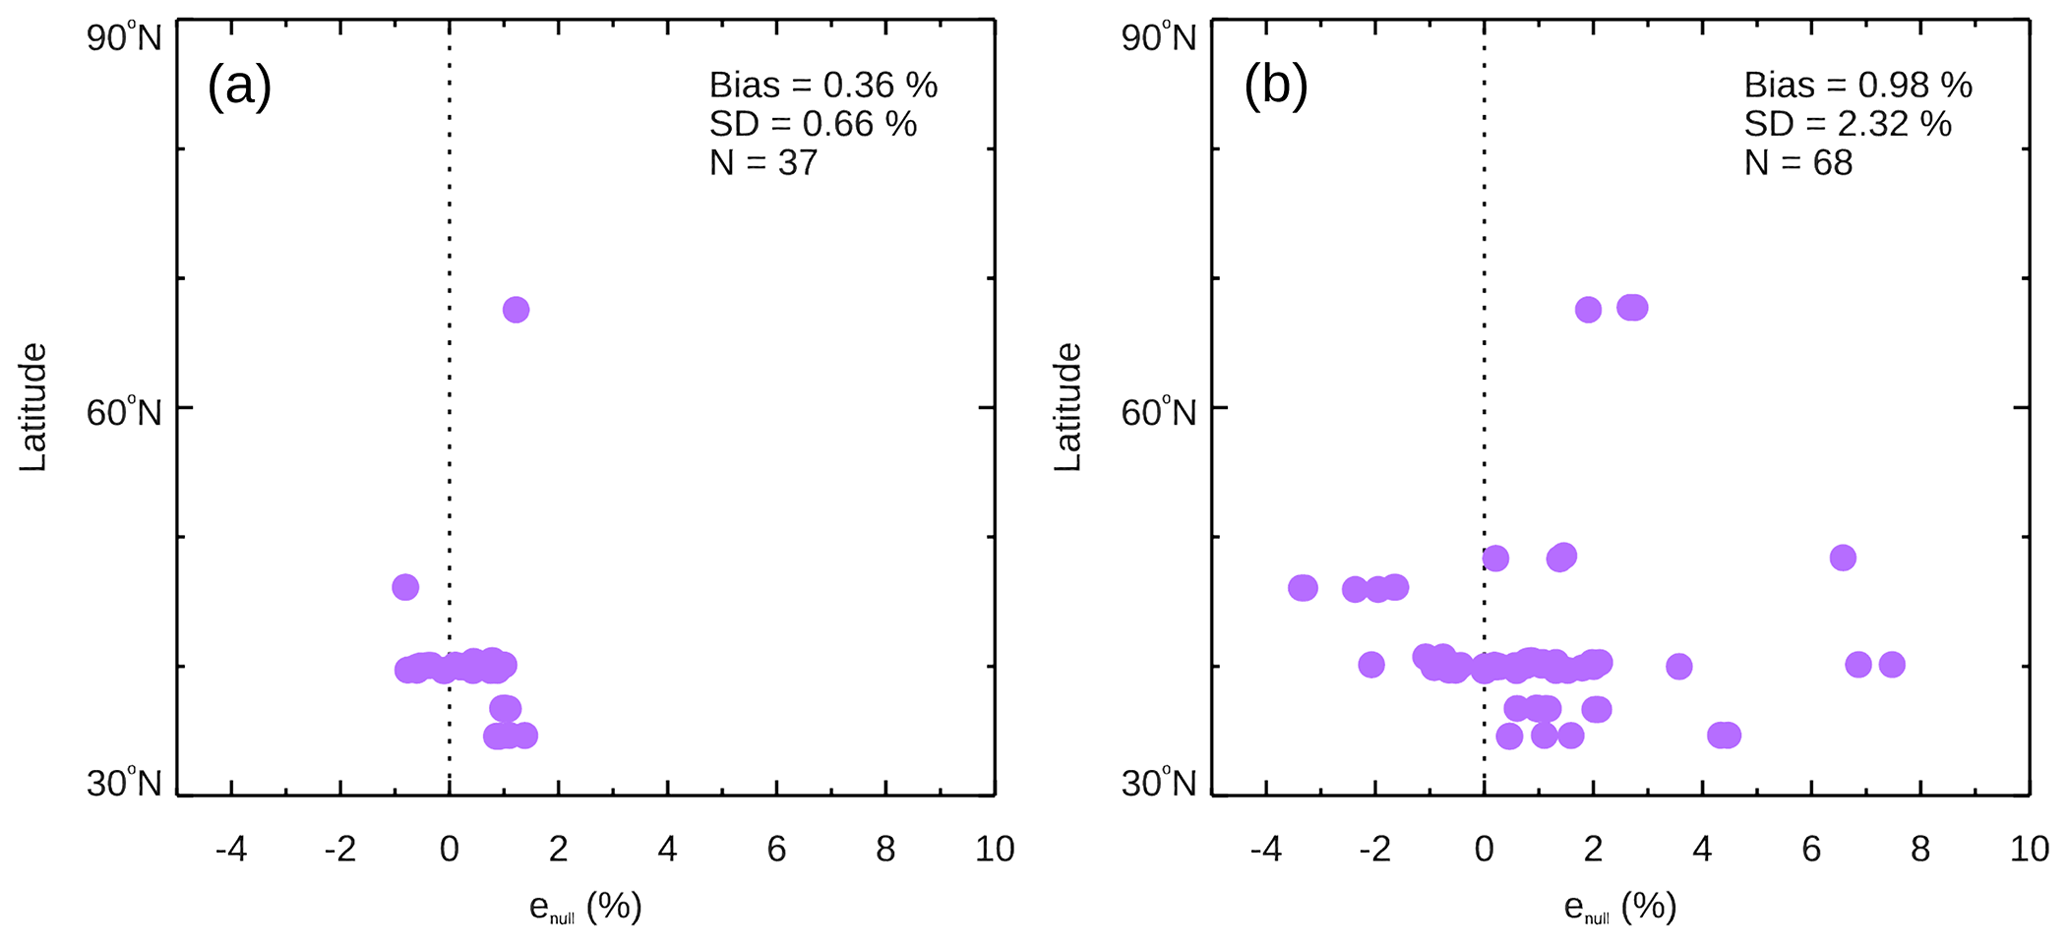
Figure 7Latitudinal distribution of null-space error between TROPOMI and AirCore observations over land. (a) For clear observations. (b) For cloudy observations.
Here we have evaluated the repeatability and biases of in situ AirCore CO vertical profiles. We have compared the AirCore profiles to the MOPITT version 8 CO dataset to assess their performance in validation efforts and to quantify errors introduced in validation by the use of CO vertical profiles lacking upper tropospheric in situ measurements, a common issue in aircraft datasets. Finally, we have used AirCore data to estimate the error introduced by clouds in TROPOMI land CO retrievals.
From CO profiles acquired by pairs of AirCore systems deployed simultaneously and from the same site, we have estimated that the average repeatability at most altitudes is well below ± 2 ppb (Fig. 2). Our analysis shows lower repeatability values (5–15 ppb) between 50 and 70 hPa, consistent with higher uncertainty in AirCore stratospheric CO retrievals attributable to AirCore surface effects, chemical interactions or measurement interferences from other trace gas species, or incorrect AirCore sample end-member assumptions (Chen et al., 2022). Colocated (<2 h and <15 km apart) CO profiles from AirCore and NOAA aircraft flask profiles indicate that AirCore biases are between −6 and +6 ppb, with a 0.6 ppb overall average bias (Fig. 3a).
Our MOPITT comparisons show that AirCore provides validation results that are analogous in magnitude and sign to those from the NOAA aircraft flask dataset (Fig. 4); in all cases, biases are well below the MOPITT 10 % target accuracy (Francis et al., 2017). MOPITT/AirCore and MOPITT/aircraft biases between the surface and 500 hPa differ very slightly (by <0.5 p.p. on average for all MOPITT variants). The same is true for MOPITT NIR/AirCore biases at all pressure levels. Between 400 and 200 hPa, though, AirCore is closer to MOPITT than the aircraft dataset is by (on average) 2.7 p.p. (TIR) and 4.7 p.p. (multispectral). Larger biases between MOPITT and the aircraft dataset at that pressure range are consistent with the fact that profiles from the latter do not, in most cases, reach above 400 hPa and have to be extended upwards. In contrast, the low MOPITT/AirCore biases indicate good agreement between the two datasets and imply that previous validation results may have overestimated the magnitude of MOPITT retrieval biases in that upper tropospheric region. Further up in the troposphere, at 100 hPa, both MOPITT/AirCore and MOPITT/aircraft biases approximate zero for all MOPITT variants. Because MOPITT profiles are less sensitive to CO at/above 100 hPa, the a priori dominates retrievals at that pressure level, leading to low biases (both MOPITT/AirCore and MOPITT/aircraft biases) due to cancellation of the dominant a priori term in the difference of retrieved and smoothed in situ profiles.
In order to investigate the effects of extending upwards shorter tropospheric aircraft CO profiles used in validation, we have simulated a truncated version of the AirCore CO dataset, which we have compared to MOPITT retrievals. Differences between MOPITT/AirCore and MOPITT/truncated-AirCore biases (Fig. 4) are small: <1 p.p. on average. We observe that, for the TIR and multispectral variants, MOPITT/truncated-AirCore biases depart from MOPITT/AirCore biases to mimic the MOPITT/aircraft biases. These results reinforce our interpretation regarding previous validation efforts having slightly overestimated the magnitude of MOPITT retrieval biases in the upper troposphere due to the use of shorter tropospheric aircraft CO profiles. While always small, the effects are relatively stronger (2 to 3 p.p.) at 400–200 hPa; more modest effects can also be seen at other pressure levels. This is because, at any given pressure level P, the MOPITT CO retrievals are sensitive not only to CO at that level but also to CO at other levels. That is, the MOPITT AK (with which the AirCore profiles are convolved prior to bias calculations) are not delta functions peaking at level P but rather are curves of increasing amplitude towards level P. We also observe that, for the NIR variant, the effects are similar at all pressure levels. This is consistent with the MOPITT NIR retrievals being sensitive to total CO column only, i.e., the MOPITT NIR AK are not curve-like but rather are flat. Our findings support the results of Tang et al. (2020), where in situ aircraft profiles extended with reanalysis data were compared to MOPITT multispectral retrievals. The authors found good agreement between MOPITT and the extended aircraft profiles at the surface layer; at upper levels (400 and 200 hPa), biases increased due to limited aircraft observations.
Finally, we have used the AirCore dataset to investigate cloud effects in TROPOMI total CO column retrievals over land. The mean relative bias between clear TROPOMI and smoothed AirCore (1.61 %) is only slightly smaller than that between cloudy TROPOMI and smoothed AirCore (2.02 %) (Fig. 5b and d). Mean relative biases between TROPOMI and unsmoothed AirCore are 1.27 % and 1.03 % (for clear and cloudy TROPOMI retrievals, respectively); we note that, although both are very small and differ by only 0.24 p.p., the mean bias is higher for clear observations. However, the other quality-of-fit indicators (R and linear fit slope) show that TROPOMI CO retrievals are closer in value to unsmoothed AirCore CO under clear conditions. Borsdorff et al. (2018) reported a similarly small difference in bias (0.2 ppb, equivalent to ∼ 0.25 p.p.) between clear and cloudy TROPOMI CO observations with respect to in situ ground measurements over nine remote sites. Our results indicate that TROPOMI/AirCore biases for cloudy observations over land do not show obvious latitudinal effects (Fig. 6). The spread in biases shown in this figure may reflect differences in the actual CO concentrations observed by each of the two instruments, which may be up to 12 h and 50 km apart.
The null-space error (enull) quantifies the expected difference between the true CO column and the retrieved TROPOMI CO column due to differences between the shape of the true profile and that of the TROPOMI reference profile. It is only relevant when the TROPOMI CO retrievals are compared with respect to other reference measurements without accounting for the sensitivity loss caused by clouds; enull can be completely avoided by using the TROPOMI total column AK provided in the data product. Our null-space error calculations using AirCore CO data show that the magnitude of the error introduced in cloudy TROPOMI CO retrievals over land by using scaled reference profiles is very small (0.98 % ± 2.32 %, or 1.65 ± 4.15×10¹⁶ molec. cm−2) and slightly skewed towards positive values (Fig. 7b). These observations are in agreement with results reported by Martínez-Alonso et al. (2020) in their analysis of cloudy CO observations from TROPOMI and ATom-4 over bodies of water (relative mean and SD values 2.16 % ± 2.23 %, or 3.70 ± 3.75×10¹⁶ molec. cm−2). The prevalence of positive null-space error values suggests that, on average, the TROPOMI reference profiles analyzed may have too much CO near the surface, thus resulting in TROPOMI retrievals that may overestimate the below-cloud partial column. No latitudinal dependence was observed in the null-space error values in this analysis nor in the Martínez-Alonso et al. (2020) study.
AirCore is a novel airborne sampler suited for the validation of satellite retrievals of tropospheric CO and, potentially, other relevant tropospheric gases and parameters such as CO2, CH4, temperature, and relative humidity because, unlike most aircraft platforms, it samples continuously from the lower stratosphere to near the surface. According to our analysis, the mean bias (with respect to the NOAA aircraft flask dataset) and repeatability of CO AirCore measurements are near 0.6 and 0.03 ppb, respectively. AirCore measurements from near the surface are currently being discarded because they are affected by end-member mixing with spiked CO push gas; higher stratospheric uncertainties of up to ∼ 15 ppb (this study; Chen et al., 2022) have also been identified. Efforts are being made towards solving these problems in the near future.
We have validated a temporal subset (2012–2019) of the MOPITT version 8 data with respect to AirCore profiles by applying the procedure used in previous MOPITT validation efforts with respect to aircraft in situ measurements (Deeter et al., 2019, and references therein). As a reference, we have also validated the same MOPITT temporal subset with respect to NOAA aircraft flask profiles. The resulting MOPITT/AirCore and MOPITT/aircraft biases are very similar and align well with the full MOPITT validation results reported by Deeter et al. (2019).
We find MOPITT/AirCore biases at 400–200 hPa to be smaller than their MOPITT/aircraft counterparts; it is also at that pressure range that MOPITT/AirCore and MOPITT/truncated-AirCore biases differ the most. Both pieces of evidence indicate that extending upwards shorter aircraft profiles (i.e., aircraft profiles that sample up to the required 400 hPa MOPITT validation threshold but not above it) results in small validation errors in the upper troposphere (up to 2–3 p.p. in the 400–200 hPa range) and, thus, in a slight overestimation of MOPITT retrieval biases in that region.
Our TROPOMI/AirCore analysis shows that the TROPOMI approach to retrieve total CO column values under cloudy conditions results in small biases over land (1 %–2 %); similarly, small biases over bodies of water had been previously reported by Martínez-Alonso et al. (2020). We must keep in mind, however, that this study's results may be representative of unpolluted areas only. AirCore in situ measurements are commonly performed away from CO emission sources such as heavily populated areas, industrial regions, or active fires, where CO concentrations at the boundary layer (and, thus, most likely below cloud-top) would be more variable and, thus, could depart from the TROPOMI reference profile values. AirCore measurements near CO emission sources would be needed to fully evaluate the TROPOMI approach and the performance of its reference profiles. Our null-space error calculations show that the magnitude of the error introduced in cloudy TROPOMI retrievals over land by using scaled reference profiles is very small (∼ 0.98 %), does not show latitudinal dependencies, and is slightly skewed towards positive values. While the AirCore dataset spans a ∼ 10-year time frame, it is still rather limited geographically; more latitudinally widespread measurements are needed to study whether there are substantial latitudinal dependencies in the TROPOMI retrievals.
AirCore data from the 13 August 2021 version are publicly available from the NOAA Global Monitoring Laboratory upon request: https://doi.org/10.15138/6AV0-MY81 (Baier et al., 2021). NOAA aircraft flask data version 2.0 from the 9 February 2021 version were obtained from https://doi.org/10.7289/V5N58JMF (Sweeney et al., 2021). MOPITT data from version 8 can be downloaded from https://doi.org/10.5067/TERRA/MOPITT/MOP02T_L2.008 (Ziskin, 2019c) (TIR), https://doi.org/10.5067/TERRA/MOPITT/MOP02N_L2.008 (Ziskin, 2019b) (NIR), and https://doi.org/10.5067/TERRA/MOPITT/MOP02J_L2.008 (Ziskin, 2019a) (TIR+NIR). TROPOMI level 2 CO retrievals for 7 November 2017 to 27 June 2018 were downloaded from https://s5pexp.copernicus.eu/ (last access: 27 November 2019) (ESA, 2018a); retrievals for dates after 28 June 2018 were downloaded from https://s5phub.copernicus.eu/ (last access: 9 February 2021) (ESA, 2018b).
SMA defined the concept and methodology of the paper, performed the formal analysis of data sets, conducted software development, and oversaw data presentation. MND provided additional software for MOPITT validation. SMA, MND, and HW oversaw the MOPITT data analysis. TB and IA oversaw the TROPOMI data analysis. BCB and CS oversaw the AirCore data analysis. KM and CS oversaw the NOAA aircraft flask data analysis. SMA wrote the original draft. All authors contributed to the review and editing of this paper.
At least one of the (co-)authors is a member of the editorial board of Atmospheric Measurement Techniques. The peer-review process was guided by an independent editor, and the authors also have no other competing interests to declare.
Publisher’s note: Copernicus Publications remains neutral with regard to jurisdictional claims in published maps and institutional affiliations.
NCAR internal reviews provided by Gene Francis and Wenfu Tang are greatly appreciated. This paper benefited from helpful comments from two anonymous reviewers. Sentinel-5 Precursor is part of the EU Copernicus program, and Copernicus (modified) Sentinel data for 2017–2021 have been used.
This material is based upon work supported by the National Center for Atmospheric Research (NCAR), which is a major facility sponsored by the National Science Foundation (grant no. 1852977). The NCAR MOPITT project is supported by the National Aeronautics and Space Administration (NASA) Earth Observing System (EOS) Program. AirCore work was funded in part by NASA ROSES award 80NSSC18K0898. The NOAA Cooperative Agreement with CIRES is NA17OAR4320101.
This paper was edited by Frank Hase and reviewed by two anonymous referees.
Baier, B., Sweeney, C., Tans, P., Newberger, T., Higgs, J., Wolter, S., and NOAA Global Monitoring Laboratory: NOAA AirCore atmospheric sampling system profiles (Version 20210813), NOAA GML [data set], https://doi.org/10.15138/6AV0-MY81, 2021. a, b
Borsdorff, T., Hasekamp, O. P., Wassmann, A., and Landgraf, J.: Insights into Tikhonov regularization: application to trace gas column retrieval and the efficient calculation of total column averaging kernels, Atmos. Meas. Tech., 7, 523–535, https://doi.org/10.5194/amt-7-523-2014, 2014. a, b, c
Borsdorff, T., aan de Brugh, J., Hu, H., Hasekamp, O., Sussmann, R., Rettinger, M., Hase, F., Gross, J., Schneider, M., Garcia, O., Stremme, W., Grutter, M., Feist, D. G., Arnold, S. G., De Mazière, M., Kumar Sha, M., Pollard, D. F., Kiel, M., Roehl, C., Wennberg, P. O., Toon, G. C., and Landgraf, J.: Mapping carbon monoxide pollution from space down to city scales with daily global coverage, Atmos. Meas. Tech., 11, 5507–5518, https://doi.org/10.5194/amt-11-5507-2018, 2018. a
Buchholz, R. R., Deeter, M. N., Worden, H. M., Gille, J., Edwards, D. P., Hannigan, J. W., Jones, N. B., Paton-Walsh, C., Griffith, D. W. T., Smale, D., Robinson, J., Strong, K., Conway, S., Sussmann, R., Hase, F., Blumenstock, T., Mahieu, E., and Langerock, B.: Validation of MOPITT carbon monoxide using ground-based Fourier transform infrared spectrometer data from NDACC, Atmos. Meas. Tech., 10, 1927–1956, https://doi.org/10.5194/amt-10-1927-2017, 2017. a
Chen, H., Hooghiem, J., Brownlow, R., Kivi, R., Heikkinen, P., Leuenberger, M., Nyfeler, P., Ramonet, M., Lopez, M., Engel, A., Wagenhaeuser, T., Laube, J., Baier, B., Sweeney, C., Danis, F., and Crevoisier, C.: Towards accurate vertical profile measurements of greenhouse gases using AirCore, in preparation, 2022. a, b, c
Deeter, M. N.: MOPITT Measurements Of Pollution In The Troposphere validation version 4 product users guide, Tech. rep., Atmospheric Chemistry Division, National Center for Atmospheric Research, 2009. a
Deeter, M. N., Edwards, D. P., Gille, J. C., Emmons, L. K., Francis, G., Ho, S. P., Mao, D., Masters, D., Worden, H., Drummond, J. R., and Novelli, P. C.: The MOPITT version 4 CO product: Algorithm enhancements, validation, and long-term stability, J. Geophys. Res.-Atmos., 115, D07306, https://doi.org/10.1029/2009JD013005, 2010. a
Deeter, M. N., Worden, H. M., Edwards, D. P., Gille, J. C., and Andrews, A. E.: Evaluation of MOPITT retrievals of lower-tropospheric carbon monoxide over the United States, J. Geophys. Res.-Atmos., 117, D13306, https://doi.org/10.1029/2012JD017553, 2012. a, b
Deeter, M. N., Martínez-Alonso, S., Edwards, D. P., Emmons, L. K., Gille, J. C., Worden, H. M., Pittman, J. V., Daube, B. C., and Wofsy, S. C.: Validation of MOPITT Version 5 thermal-infrared, near-infrared, and multispectral carbon monoxide profile retrievals for 2000–2011, J. Geophys. Res.-Atmos., 118, 6710–6725, https://doi.org/10.1002/jgrd.50272, 2013. a, b
Deeter, M. N., Martínez-Alonso, S., Edwards, D. P., Emmons, L. K., Gille, J. C., Worden, H. M., Sweeney, C., Pittman, J. V., Daube, B. C., and Wofsy, S. C.: The MOPITT Version 6 product: algorithm enhancements and validation, Atmos. Meas. Tech., 7, 3623–3632, https://doi.org/10.5194/amt-7-3623-2014, 2014. a
Deeter, M. N., Edwards, D. P., Francis, G. L., Gille, J. C., Martínez-Alonso, S., Worden, H. M., and Sweeney, C.: A climate-scale satellite record for carbon monoxide: the MOPITT Version 7 product, Atmos. Meas. Tech., 10, 2533–2555, https://doi.org/10.5194/amt-10-2533-2017, 2017. a, b, c, d
Deeter, M. N., Martínez-Alonso, S., Andreae, M. O., and Schlager, H.: Satellite-Based Analysis of CO Seasonal and Interannual Variability Over the Amazon Basin, J. Geophys. Res.-Atmos., 123, 5641–5656, https://doi.org/10.1029/2018JD028425, 2018. a
Deeter, M. N., Edwards, D. P., Francis, G. L., Gille, J. C., Mao, D., Martínez-Alonso, S., Worden, H. M., Ziskin, D., and Andreae, M. O.: Radiance-based retrieval bias mitigation for the MOPITT instrument: the version 8 product, Atmos. Meas. Tech., 12, 4561–4580, https://doi.org/10.5194/amt-12-4561-2019, 2019. a, b, c, d, e, f, g, h, i
Drummond, J. and Mand, G.: The measurements of pollution in the troposphere (MOPITT) instrument: Overall performance and calibration requirements, J. Atmos. Ocean. Tech., 13, 314–320, https://doi.org/10.1175/1520-0426(1996)013<0314:TMOPIT>2.0.CO;2, 1996. a, b
Drummond, J. R., Zou, J., Nichitiu, F., Kar, J., Deschambaut, R., and Hackett, J.: A review of 9-year performance and operation of the MOPITT instrument, Adv. Space Res., 45, 760–774, https://doi.org/10.1016/j.asr.2009.11.019, 2010. a, b
Emmons, L., Deeter, M., Gille, J., Edwards, D., Attie, J., Warner, J., Ziskin, D., Francis, G., Khattatov, B., Yudin, V., Lamarque, J., Ho, S., Mao, D., Chen, J., Drummond, J., Novelli, P., Sachse, G., Coffey, M., Hannigan, J., Gerbig, C., Kawakami, S., Kondo, Y., Takegawa, N., Schlager, H., Baehr, J., and Ziereis, H.: Validation of Measurements of Pollution in the Troposphere (MOPITT) CO retrievals with aircraft in situ profiles, J. Geophys. Res.-Atmos., 109, D03309, https://doi.org/10.1029/2003JD004101, 2004. a
ESA: Sentinel-5P Expert Users Data Hub, ESA [data set] https://s5pexp.copernicus.eu/ (last access: 27 November 2019), 2018a. a
ESA: Sentinel-5P Pre-Operations Data Hub, ESA [data set], https://s5phub.copernicus.eu/ (last access: 9 February 2021), 2018b. a
Francis, G. L., Deeter, M. N., Martínez-Alonso, S., Gille, J. C., Edwards, D. P., Mao, D., Worden, H. M., and Ziskin, D.: Measurement Of Pollution In The Troposphere algorithm theoretical basis document. Retrieval of carbon monoxide profiles and column amounts from MOPITT observed radiances (Level 1 to Level 2), Tech. rep., Atmospheric Chemistry Observations and Modeling Laboratory, National Center for Atmospheric Research, 2017. a, b, c
Hedelius, J. K., He, T.-L., Jones, D. B. A., Baier, B. C., Buchholz, R. R., De Mazière, M., Deutscher, N. M., Dubey, M. K., Feist, D. G., Griffith, D. W. T., Hase, F., Iraci, L. T., Jeseck, P., Kiel, M., Kivi, R., Liu, C., Morino, I., Notholt, J., Oh, Y.-S., Ohyama, H., Pollard, D. F., Rettinger, M., Roche, S., Roehl, C. M., Schneider, M., Shiomi, K., Strong, K., Sussmann, R., Sweeney, C., Té, Y., Uchino, O., Velazco, V. A., Wang, W., Warneke, T., Wennberg, P. O., Worden, H. M., and Wunch, D.: Evaluation of MOPITT Version 7 joint TIR–NIR XCO retrievals with TCCON, Atmos. Meas. Tech., 12, 5547–5572, https://doi.org/10.5194/amt-12-5547-2019, 2019. a
Karion, A., Sweeney, C., Tans, P., and Newberger, T.: AirCore: An Innovative Atmospheric Sampling System, J. Atmos. Ocean. Tech., 27, 1839–1853, https://doi.org/10.1175/2010JTECHA1448.1, 2010. a, b, c, d
Karion, A., Sweeney, C., Wolter, S., Newberger, T., Chen, H., Andrews, A., Kofler, J., Neff, D., and Tans, P.: Long-term greenhouse gas measurements from aircraft, Atmos. Meas. Tech., 6, 511–526, https://doi.org/10.5194/amt-6-511-2013, 2013. a
Krol, M., Houweling, S., Bregman, B., van den Broek, M., Segers, A., van Velthoven, P., Peters, W., Dentener, F., and Bergamaschi, P.: The two-way nested global chemistry-transport zoom model TM5: algorithm and applications, Atmos. Chem. Phys., 5, 417–432, https://doi.org/10.5194/acp-5-417-2005, 2005. a
Lamarque, J.-F., Emmons, L. K., Hess, P. G., Kinnison, D. E., Tilmes, S., Vitt, F., Heald, C. L., Holland, E. A., Lauritzen, P. H., Neu, J., Orlando, J. J., Rasch, P. J., and Tyndall, G. K.: CAM-chem: description and evaluation of interactive atmospheric chemistry in the Community Earth System Model, Geosci. Model Dev., 5, 369–411, https://doi.org/10.5194/gmd-5-369-2012, 2012. a
Landgraf, J., aan de Brugh, J., Scheepmaker, R., Borsdorff, T., Hu, H., Houweling, S., Butz, A., Aben, I., and Hasekamp, O.: Carbon monoxide total column retrievals from TROPOMI shortwave infrared measurements, Atmos. Meas. Tech., 9, 4955–4975, https://doi.org/10.5194/amt-9-4955-2016, 2016. a, b, c, d, e
Landgraf, J., Borsdorff, T., Langerock, B., and Keppens, A.: S5P mission performance centre carbon monoxide (L2 CO) readme, Tech. Rep. 02.02.00, 2021-07-05, Netherlands Institute for Space Research (SRON), 2021. a, b
Lelieveld, J., Gromov, S., Pozzer, A., and Taraborrelli, D.: Global tropospheric hydroxyl distribution, budget and reactivity, Atmos. Chem. Phys., 16, 12477–12493, https://doi.org/10.5194/acp-16-12477-2016, 2016. a
Martínez-Alonso, S., Deeter, M., Worden, H., Borsdorff, T., Aben, I., Commane, R., Daube, B., Francis, G., George, M., Landgraf, J., Mao, D., McKain, K., and Wofsy, S.: 1.5 years of TROPOMI CO measurements: comparisons to MOPITT and ATom, Atmos. Meas. Tech., 13, 4841–4864, https://doi.org/10.5194/amt-13-4841-2020, 2020. a, b, c, d, e, f, g, h
Martínez-Alonso, S., Deeter, M. N., Worden, H. M., Gille, J. C., Emmons, L. K., Pan, L. L., Park, M., Manney, G. L., Bernath, P. F., Boone, C. D., Walker, K. A., Kolonjari, F., Wofsy, S. C., Pittman, J., and Daube, B. C.: Comparison of upper tropospheric carbon monoxide from MOPITT, ACE-FTS, and HIPPO-QCLS, J. Geophys. Res.-Atmos., 119, 14144–14164, https://doi.org/10.1002/2014JD022397, 2014. a
Rodgers, C. and Connor, B.: Intercomparison of remote sounding instruments, J. Geophys. Res.-Atmos., 108, 4116, https://doi.org/10.1029/2002JD002299, 2003. a, b
Rodgers, C. D.: Inverse Methods for Atmospheric Sounding, World Scientific, 1st edition, https://doi.org/10.1142/3171, 2000. a
Spivakovsky, C., Logan, J., Montzka, S., Balkanski, Y., Foreman-Fowler, M., Jones, D., Horowitz, L., Fusco, A., Brenninkmeijer, C., Prather, M., Wofsy, S., and McElroy, M.: Three-dimensional climatological distribution of tropospheric OH: Update and evaluation, J. Geophys. Res.-Atmos., 105, 8931–8980, https://doi.org/10.1029/1999JD901006, 2000. a
Sweeney, C., McKain, K., Higgs, J., Wolter, S., Crotwell, A., Neff, D., Dlugokencky, E., Petron, G., Madronich, M., Moglia, E., Crotwell, M., and Mund, J.: NOAA Carbon Cycle and Greenhouse Gases Group aircraft-based measurements of CO2, CH4, CO, N2O, H2, and SF6 in flask-air samples taken since 1992, Tech. rep., NOAA Earth System Research Laboratories, Global Monitoring Laboratory [data set], https://doi.org/10.7289/V5N58JMF, 2021. a, b
Sweeney, C., Karion, A., Wolter, S., Newberger, T., Guenther, D., Higgs, J. A., Andrews, A. E., Lang, P. M., Neff, D., Dlugokencky, E., Miller, J. B., Montzka, S. A., Miller, B. R., Masarie, K. A., Biraud, S. C., Novelli, P. C., Crotwell, M., Crotwell, A. M., Thoning, K., and Tans, P. P.: Seasonal climatology of CO2 across North America from aircraft measurements in the NOAA/ESRL Global Greenhouse Gas Reference Network, J. Geophys. Res.-Atmos., 120, 5155–5190, https://doi.org/10.1002/2014JD022591, 2015. a
Szopa, S., Naik, V., Adhikary, B., Artaxo, P., Berntsen, T., Collins, W., Fuzzi, S., Gallardo, L., Kiendler-Scharr, A., Klimont, Z., Liao, H., Unger, N., and Zanis, P.: Short-Lived Climate Forcers, in Climate Change: The Physical Science Basis. Contribution of Working Group I to the Sixth Assessment Report of the Intergovernmental Panel on Climate Change, Cambridge University Press, Cambridge, United Kingdom and New York, NY, USA, https://www.ipcc.ch/report/ar6/wg1/downloads/report/IPCC_AR6_WGI_Chapter06.pdf (last access: 17 August 2022), 2021. a
Tang, W., Worden, H. M., Deeter, M. N., Edwards, D. P., Emmons, L. K., Martínez-Alonso, S., Gaubert, B., Buchholz, R. R., Diskin, G. S., Dickerson, R. R., Ren, X., He, H., and Kondo, Y.: Assessing Measurements of Pollution in the Troposphere (MOPITT) carbon monoxide retrievals over urban versus non-urban regions, Atmos. Meas. Tech., 13, 1337–1356, https://doi.org/10.5194/amt-13-1337-2020, 2020. a
Tans, P. P. : System and method for providing vertical profile measurements of atmospheric gases, United States Patent US 7597014 B2, 2009. a, b
Tans, P.: Fill dynamics and sample mixing in the AirCore, Atmos. Meas. Tech., 15, 1903–1916, https://doi.org/10.5194/amt-15-1903-2022, 2022. a, b
Veefkind, J. P., Aben, I., McMullan, K., Forster, H., de Vries, J., Otter, G., Claas, J., Eskes, H. J., de Haan, J. F., Kleipool, Q., van Weele, M., Hasekamp, O., Hoogeveen, R., Landgraf, J., Snel, R., Tol, P., Ingmann, P., Voors, R., Kruizinga, B., Vink, R., Visser, H., and Levelt, P. F.: TROPOMI on the ESA Sentinel-5 Precursor: A GMES mission for global observations of the atmospheric composition for climate, air quality and ozone layer applications, Remote Sens. Environ., 120, 70–83, https://doi.org/10.1016/j.rse.2011.09.027, 2012. a, b
Vidot, J., Landgraf, J., Hasekamp, O. P., Butz, A., Galli, A., Tol, P., and Aben, I.: Carbon monoxide from shortwave infrared reflectance measurements: A new retrieval approach for clear sky and partially cloudy atmospheres, Remote Sens. Environ., 120, 255–266, https://doi.org/10.1016/j.rse.2011.09.032, 2012. a
Wagenhäuser, T., Engel, A., and Sitals, R.: Testing the altitude attribution and vertical resolution of AirCore measurements with a new spiking method, Atmos. Meas. Tech., 14, 3923–3934, https://doi.org/10.5194/amt-14-3923-2021, 2021. a
Wofsy, S., Afshar, S., Allen, H., Apel, E., Asher, E., Barletta, B., Bent, J., Bian, H., Biggs, B., Blake, D., Blake, N., Bourgeois, I., Brock, C., Brune, W., Budney, J., Bui, T., Butler, A., Campuzano-Jost, P., Chang, C., Chin, M., Commane, R., Correa, G., Crounse, J., Cullis, P., Daube, B., Day, D., Dean-Day, J., Dibb, J., Digangi, J., Diskin, G., Dollner, M., Elkins, J., Erdesz, F., Fiore, A., Flynn, C., Froyd, K., Gesler, D., Hall, S., Hanisco, T., Hannun, R., Hills, A., Hintsa, E., Hoffman, A., Hornbrook, R., Huey, L., Hughes, S., Jimenez, J., Johnson, B., Katich, J., Keeling, R., Kim, M., Kupc, A., Lait, L., Lamarque, J.-F., Liu, J., Mckain, K., Mclaughlin, R., Meinardi, S., Miller, D., Montzka, S., Moore, F., Morgan, E., Murphy, D., Murray, L., Nault, B., Neuman, J., Newman, P., Nicely, J., Pan, X., Paplawsky, W., Peischl, J., Prather, M., Price, D., Ray, E., Reeves, J., Richardson, M., Rollins, A., Rosenlof, K., Ryerson, T., Scheuer, E., Schill, G., Schroder, J., Schwarz, J., St.Clair, J., Steenrod, S., Stephens, B., Strode, S., Sweeney, C., Tanner, D., Teng, A., Thames, A., Thompson, C., Ullmann, K., Veres, P., Vizenor, N., Wagner, N., Watt, A., Weber, R., Weinzierl, B., Wennberg, P., Williamson, C., Wilson, J., Wolfe, G., Woods, C., and Zeng, L.: ATom: Merged Atmospheric Chemistry, Trace Gases, and Aerosols (1.5), ORNL Distributed Active Archive Center, https://doi.org/10.3334/ORNLDAAC/1581, 2018. a
Worden, H. M., Deeter, M. N., Edwards, D. P., Gille, J. C., Drummond, J. R., and Nedelec, P.: Observations of near-surface carbon monoxide from space using MOPITT multispectral retrievals, J. Geophys. Res.-Atmos., 115, D18314, https://doi.org/10.1029/2010JD014242, 2010. a
Worden, H. M., Deeter, M. N., Frankenberg, C., George, M., Nichitiu, F., Worden, J., Aben, I., Bowman, K. W., Clerbaux, C., Coheur, P. F., de Laat, A. T. J., Detweiler, R., Drummond, J. R., Edwards, D. P., Gille, J. C., Hurtmans, D., Luo, M., Martínez-Alonso, S., Massie, S., Pfister, G., and Warner, J. X.: Decadal record of satellite carbon monoxide observations, Atmos. Chem. Phys., 13, 837–850, https://doi.org/10.5194/acp-13-837-2013, 2013. a
Ziskin, D.: Measurements Of Pollution In The Troposphere (MOPITT) Level 2 Derived CO (Near and Thermal Infrared Radiances) (MOP02J) V008, NASA Atmospheric Sciences Data Center [data set] https://doi.org/10.5067/TERRA/MOPITT/MOP02J_L2.008, 2019a. a
Ziskin, D.: Measurements Of Pollution In The Troposphere (MOPITT) Level 2 Derived CO (Near Infrared Radiances) (MOP02N) V008, NASA Atmospheric Sciences Data Center [data set] https://doi.org/10.5067/TERRA/MOPITT/MOP02N_L2.008, 2019b. a
Ziskin, D.: Measurements Of Pollution In The Troposphere (MOPITT) Level 2 Derived CO (Thermal Infrared Radiances) (MOP02T) V008, NASA Atmospheric Sciences Data Center [data set] https://doi.org/10.5067/TERRA/MOPITT/MOP02T_L2.008, 2019c. a