the Creative Commons Attribution 4.0 License.
the Creative Commons Attribution 4.0 License.
 | 24 Aug 2022
Improved retrieval of SO2 plume height from TROPOMI using an iterative Covariance-Based Retrieval Algorithm
Nicolas Theys
Christophe Lerot
Hugues Brenot
Jeroen van Gent
Isabelle De Smedt
Lieven Clarisse
Mike Burton
Matthew Varnam
Catherine Hayer
Benjamin Esse
Michel Van Roozendael
Knowledge of sulfur dioxide layer height (SO2 LH) is important to understand volcanic eruption processes, the climate impact of SO2 emissions and to mitigate volcanic risk for civil aviation. However, the estimation of SO2 LH from ground-based instruments is challenging in particular for rapidly evolving and sustained eruptions. Satellite wide-swath nadir observations have the advantage to cover large-scale plumes and the potential to provide key information on SO2 LH. In the ultraviolet, SO2 LH retrievals leverage the fact that, for large SO2 columns, the light path and its associated air mass factor (AMF) depends on the SO2 absorption (and therefore on the vertical distribution of SO2), and SO2 LH information can be obtained from the analysis of measured back-scattered radiances coupled with radiative transfer simulations. However, existing algorithms are mainly sensitive to SO2 LH for SO2 vertical columns of at least 20 DU. Here we develop a new SO2 LH algorithm and apply it to observations from the high-spatial-resolution TROPOspheric Monitoring Instrument (TROPOMI). It is based on an SO2 optical depth look-up table and an iterative approach. The strength of this scheme lies in the fact that it is a Covariance-Based Retrieval Algorithm (COBRA; Theys et al., 2021). This means that the SO2-free contribution of the measured optical depth is treated in an optimal way, resulting in an improvement of the SO2 LH sensitivity to SO2 columns as low as 5 DU, with a precision better than 2 km. We demonstrate the value of this new data through a number of examples and comparison with satellite plume height estimates (from IASI and CALIOP), and back-trajectory analyses. The comparisons indicate an SO2 LH accuracy of 1–2 km, except for some difficult observation conditions, in particular for optically thick ash plumes or partially SO2-filled scenes.
- Article
(8234 KB) - Full-text XML
- BibTeX
- EndNote


Volcanic eruptions can emit large quantities of rock fragments and fine particles (ash) into the atmosphere as well as several trace gases, such as carbon dioxide (CO2), sulfur species (SO2, H2S), halogens (HCl, HBr, HF), and water vapor. These volcanic ejecta can have a tremendous impact on human health, society, and nature, and on air traffic safety. In particular, injection of sulfur dioxide (SO2) receives considerable attention due to its subsequent conversion into aerosols and potentially strong effect on global climate (Robock, 2000). Among the emitted constituents, SO2 is also the easiest to detect from ultraviolet (UV) and thermal infrared (TIR) remote-sensing techniques and has been used for many decades to monitor volcanoes worldwide. In order to understand volcanic processes and assess the impact of eruptions, it is crucial to measure not only the total abundance of SO2 but also the height of the SO2 plume. This information is important for (1) aviation actors such as Volcanic Ash Advisory Centres (VAACs) in case ash and SO2 clouds are collocated (sulfur alone is also becoming increasingly recognized as causing long-term damage to aircraft engines, mainly because of sulfuric acid); (2) volcanology as it informs on eruption rate, eruption type, and underlying volcanic processes (e.g., Mastin et al., 2009); (3) atmospheric chemistry and climate research, e.g., to model the impact of volcanic eruptions on air quality (Schmidt et al., 2015) or to study the partly understood role of modest volcanic eruptions on climate forcing (Solomon et al., 2011; Vernier et al., 2011; Santer et al., 2014); and (4) the estimation of SO2 emissions, as the measured SO2 abundances are often directly dependent on the knowledge of the SO2 vertical distribution.
Ground-based cameras can be used to routinely monitor plume heights (e.g., Scollo et al., 2014), but these measurements are performed in the very near field. For large and sustained volcanic eruptions, estimation of plume heights is very difficult in practice – not to say impossible – and the available measurements generally suffer from poor or infrequent sampling of the volcanic plumes. Moreover, many volcanoes on the globe are not monitored. Consequently, satellite nadir sensors with large swaths and frequent revisiting time offer the best solution to cover completely the injected volcanic cloud.
Space nadir sensors have provided global measurements of SO2 vertical columns and masses for more than 40 years (Carn et al., 2016, and references therein). However, the retrieval of SO2 plume height (also referred to SO2 layer height, SO2 LH) from satellite hyperspectral measurements is a relatively recent development. In the TIR, global SO2 LH retrievals from the Infrared Atmospheric Sounding Interferometer (IASI) by Carboni et al. (2012) and Clarisse et al. (2014) and from the Cross-track Infrared Sounder (CrIS) by Hyman and Pavolonis (2020) proved to have an excellent sensitivity to the SO2 height above ∼ 5 km, even for SO2 columns at 1 DU level (Dobson unit – 1 DU: 2.69×10¹⁶ molecules cm−2). In the UV spectral range, the sensitivity to SO2 is better at lower altitudes, and the first studies using full radiative transfer calculation schemes were from Yang et al. (2010) and Nowlan et al. (2011), based on the Ozone Monitoring Instrument (OMI; Levelt et al., 2006) and the Global Ozone Monitoring Experiment-2 (GOME-2; Munro et al., 2006). More recently, new approaches based on inverse learning machine schemes have become available for GOME-2 (Efremenko et al., 2017), TROPOspheric Monitoring Instrument-TROPOMI (Hedelt et al., 2019), and OMI (Fedkin et al., 2021). These algorithms greatly improve the computational performance of the previously published techniques. However, all the UV schemes referenced above have demonstrated sensitivity to SO2 LH only for SO2 vertical columns of more than ∼ 20 DU, which limits their use to relatively large volcanic events. In this paper, we present a new UV spectral fitting algorithm allowing SO2 LH to be retrieved for SO2 columns as low as 5 DU, and for SO2 layer heights as low as 1 km. This scheme is an extension of our recently published SO2 Covariance-Based Retrieval Algorithm (COBRA; Theys et al., 2021) that enables drastic reduction in spectral interferences and retrieval noise. Here we combine COBRA with an iterative look-up-table (LUT) approach to treat the non-linear SO2 contribution to the measured signal. This allows joint retrieval of the SO2 vertical column density (VCD) and SO2 layer height with improved sensitivity while avoiding time-consuming on-line radiative transfer simulations. We apply this technique to measurements from TROPOMI (Veefkind et al., 2012) aboard the Sentinel-5 Precursor (S-5P) satellite. The motivation is its high spatial resolution of 3.5×5.5 km2. TROPOMI resolves locally enhanced SO2 columns much better than predecessor instruments like OMI (Theys et al., 2019). The retrieval of SO2 LH is therefore expected to be possible for several degassing volcanoes. This has the potential to enhance our capability of monitoring height-resolved volcanic plumes globally in the troposphere. In addition, for strong eruptions, retrieved SO2 LH (and SO2 vertical columns) at high spatial resolution can also provide unique insights into volcanic processes, atmosphere–plume interactions and transport (Pardini et al., 2018, references).
The paper is structured as follows. Sect. 2 describes the algorithm in detail and demonstrates the performance of the SO2 LH retrieval. In Sect. 3, the results are evaluated against other satellite datasets and dispersion model results. Conclusions and perspectives are given in Sect. 4.
The theoretical basis for a joint retrieval of SO2 column amount and layer altitude from satellite nadir back-scattered UV measurements is described by Yang et al. (2010) and Nowlan et al. (2011). The TROPOMI SO2 layer height algorithm, outlined in this section, is an iterative retrieval scheme. It is conceptually close to these pioneering algorithm studies in the way the SO2 absorption is handled but differs in the treatment of the other contributions to the measured signal.
We first define the measured top-of-atmosphere total optical depth (OD) by
All terms of the equation depend on wavelength (not labeled here, for simplicity). is the logarithmic ratio of the wavelength calibrated measured radiance (I) and irradiance (Io) over a given wavelength range, is the unknown SO2 optical depth, ybckg is the “background” optical depth (accounting for all contributions to the total OD except that of SO2), and ε is the measurement error.
In case of strong SO2 absorption, the optical depth is fundamentally a non-linear function of the VCD and LH of SO2, and solving Eq. (1) is non-trivial. However, we assume here that the expression can be linearized using a Taylor expansion:
is the SO2 OD at the linearization point ), VCD and LH are the corresponding partial derivatives with respect to the SO2 VCD and LH (Jacobians), and ΔVCD and ΔLH are the VCD and LH increments. Index i stands for the ith iteration.
To solve Eq. (2), we developed a hybrid method. To model the SO2 signal, the algorithm makes use of a large LUT of SO2 OD. At each iteration, improved estimations of VCD and LH become available. These results are used to update the SO2 OD and Jacobians for the next calculation, until convergence is reached. This part of the algorithm will be detailed in Sect. 2.1. To treat the background and error terms of Eq. (2), we propose a COBRA method. In brief, instead of fitting the background optical depth, the algorithm considers a representative set of measured spectra uncontaminated by SO2 and characterized by a mean optical depth and a covariance matrix S, to represent statistically ybckg+ε. The idea of the method, initially presented by Walker et al. (2011) and further developed in other studies (e.g., Carboni et al., 2012; Clarisse et al., 2014; Theys et al., 2021), is to consider ybckg+ε as an error term, and to interpret S as a generalized error covariance matrix. Thus, the solution of the inverse problem can be expressed as follows (Rodgers, 2000):
where is the retrieved state vector () and ki is the SO2 forward model ([]).
It should be emphasized that the matrix S accounts (if well-constructed) for most atmospheric background and instrumental-related variability of the spectra, including cross-correlations. The strength of the algorithm lies in the fact that only two parameters are retrieved (SO2 LH and VCD). As will be shown in Sect. 2.3 and 3.1, this constitutes a significant advance in terms of retrieval sensitivity compared to a classical fitting approach such as the differential optical absorption spectroscopy (DOAS; Platt and Stutz, 2008), where multiple parameters are fitted in addition to SO2 LH and VCD.
The following two sections describe in more detail the SO2 LUT approach and the specific algorithm settings.
2.1 SO2 optical depth look-up table: description
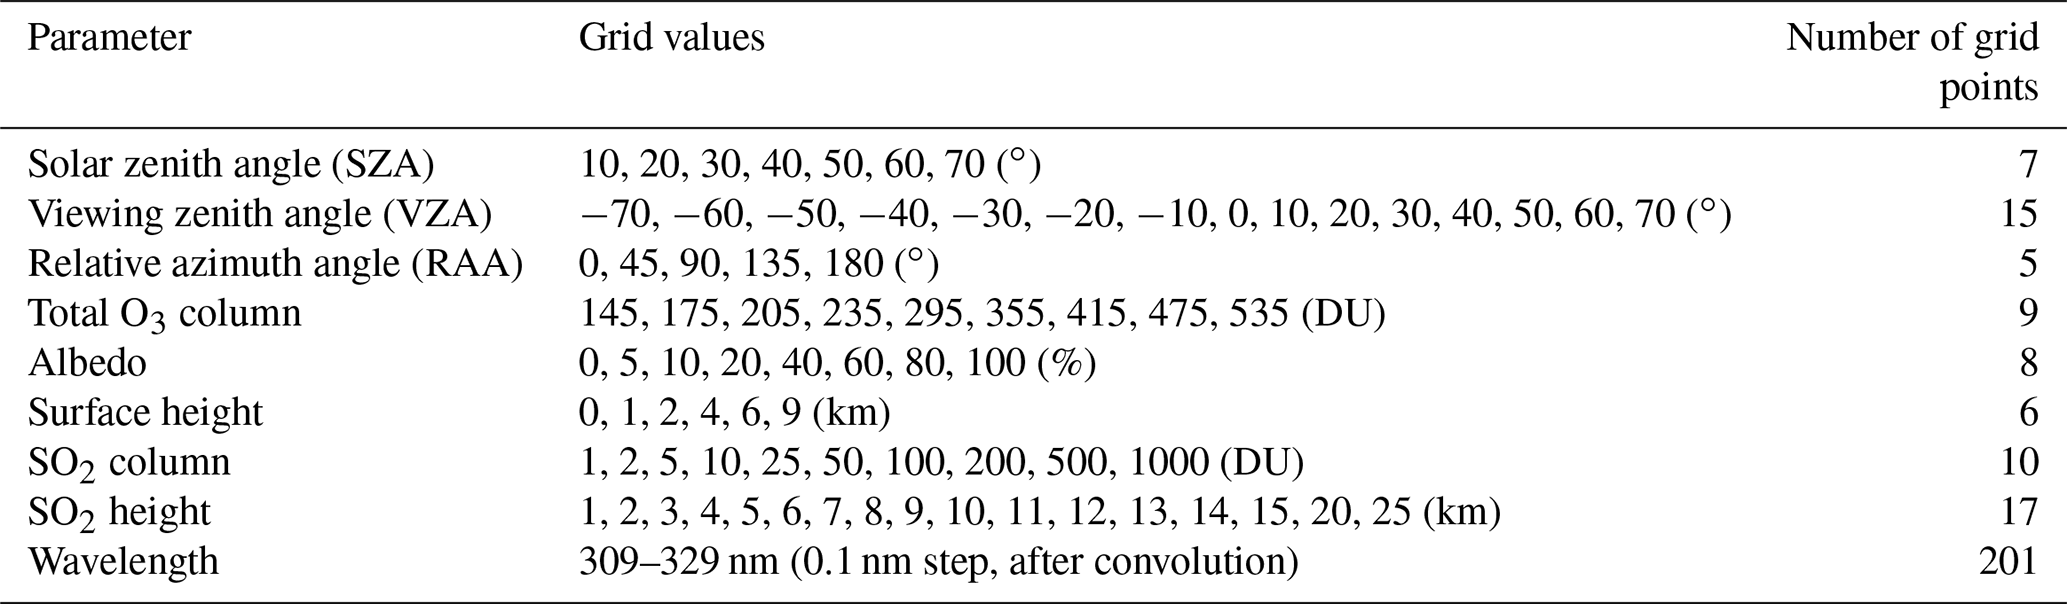
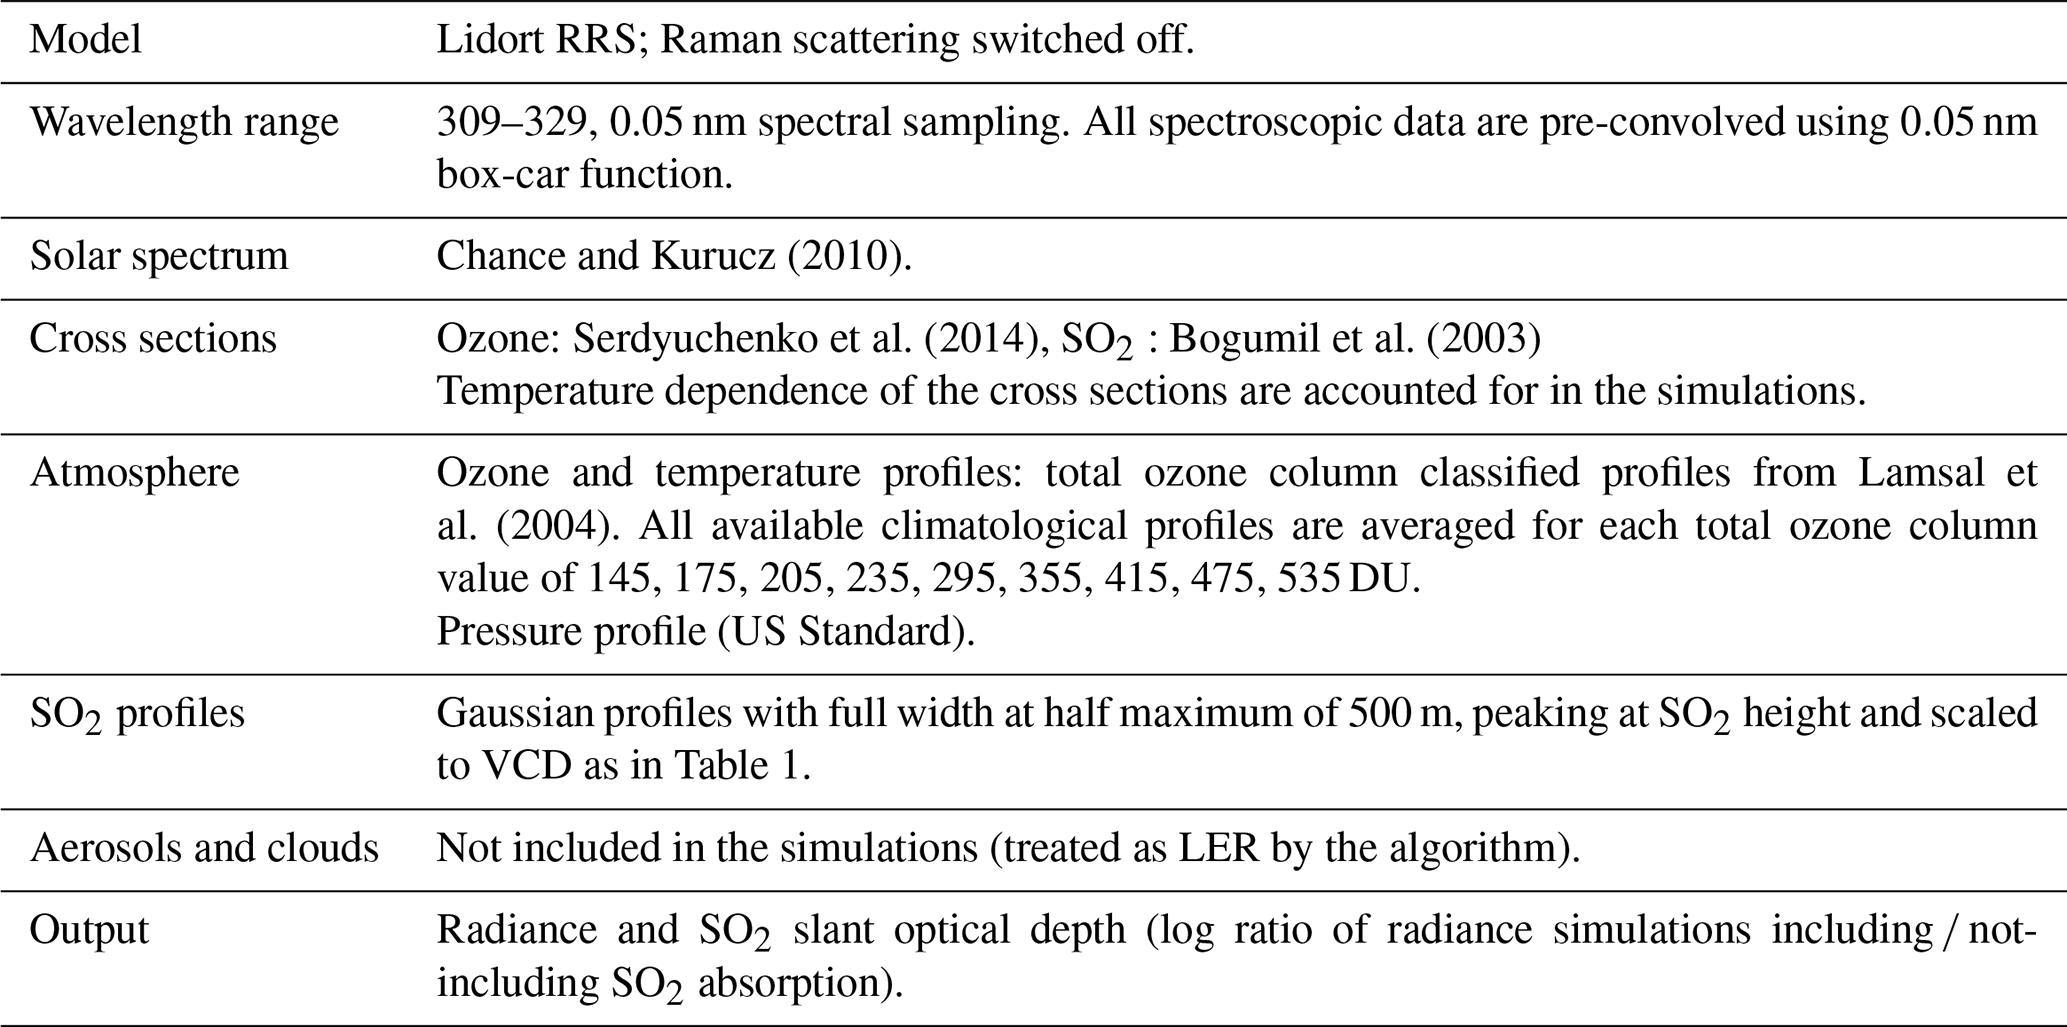
Forward modeled SO2 spectra are based on the LInearized Discrete Ordinate Radiative Transfer (LIDORT) model version RRS 2.2 (Spurr et al., 2008). The input data used to set the atmosphere and spectroscopy are detailed in Table A1. Simulations were carried out to cover a large range of possible measurement conditions, using different combinations of LUT entries for the observation geometry, total ozone column, surface non-directional Lambertian equivalent reflectivity (LER), and SO2 vertical profiles (Table 1). More details on LUT entries are given below. The simulation results are the SO2 slant optical depth spectra over a wavelength range from 309 to 329 nm and at a spectral sampling of 0.05 nm. Note that the spectroscopic input data (absorption cross sections and solar spectrum) were not pre-convolved with the Instrumental Spectral Response Function (ISRF) of TROPOMI but rather with a box-car function of 0.05 nm width. Therefore, the simulations are not instrument-specific. For application to TROPOMI, the SO2 slant OD spectra were convolved with the ISRF, and a specific correction for the so-called solar-Io effect (Aliwell et al., 2002) was applied, as it turned out to be important for large SO2 VCDs (100–1000 DU). The solar-Io correction accounts for the fact that on the one hand, the laboratory cross sections are measured with a spectrally flat light source, and on the other hand, the space-based atmospheric absorption is measured at a lower spectral resolution and with a highly structured solar light source. The convolved Io-corrected SO2 OD is written as follows:
where Io and OD are the “high-resolution” solar and SO2 optical depth spectra, respectively.
It should be noted that the TROPOMI ISRF parameters vary smoothly with the position across-track (450 positions in total). For practical ease of use, we assumed that the across-track dependence is well encapsulated by the viewing zenith angle (VZA) entry. To represent the full swath, we used the sign convention of negative and positive VZA for west and east, respectively. For each of the viewing zenith angle grid point (Table 1), a slit function of the TROPOMI detector column was associated with the closest mean VZA. This appears to be a good approximation for TROPOMI and avoids having 450 different LUTs.
From the LUT of SO2 slant OD spectra, the algorithm extracts a sub-LUT for a given TROPOMI measurement by linear interpolation. To do so, the observation angles at the ground pixel location are used. Input on total ozone is obtained from the TROPOMI off-line total ozone column product (Garane et al., 2019). The latter is well suited for the present application, as it is weakly affected by spectral interferences with SO2 (bias of only few percentage points in case of strong eruptions; see discussion in Lerot et al., 2014). In addition to the observation geometry and total ozone absorption, the measurement sensitivity to SO2 is also strongly dependent on the surface reflectance and the presence of clouds or aerosol layers. Here we assume that the radiative transfer in the atmosphere can be sufficiently represented through a lower-bound Lambertian equivalent reflector whose parameters are constrained by the radiance measurements. Treating clouds or aerosols as LERs works very well when the SO2 plume is above a cloud or aerosol layer. However, it has limited applicability for cases where SO2 and aerosols are mixed, especially for highly absorbing aerosols such as volcanic ash. This aspect will be further discussed in Sect. 3. The LER is characterized by effective parameters, height, and albedo, which are determined for each pixel. The LER height is computed as the cloud-fraction weighted mean of the cloud and ground altitudes. Cloud parameters are from the operational cloud product OCRA/ROCINN (Optical Cloud Recognition Algorithm/Retrieval of Cloud Information using Neural Networks) using the Cloud as Reflecting Boundaries (CRB) model of Loyola et al. (2018). For the LER albedo, it is constrained by TROPOMI measured radiance averaged over 339.5–340.5 nm, a range mostly unaffected by trace gas absorption (O3 and SO2). The LER albedo is retrieved by matching the measured mean radiance to a look-up table of radiances (generated in parallel to the SO2 OD LUT), and which depends on the angles, surface height, and albedo, with the same grid definition as in Table 1. The simulated radiances are convolved and averaged over the same wavelength range as TROPOMI.
Table 1Physical parameters that define the SO2 slant optical depth look-up table. The total number of spectra is about 38.5×10⁶. In practice, note that the look-up table interpolation is performed along the cosine of SZA and VZA.
From the interpolation step, a sub-LUT of SO2 OD spectra is obtained, which depends only on SO2 VCD and LH. From this table, the SO2 VCD and LH Jacobians are derived by simple discrete derivatives. These functions are essential for the retrieval (Eq. 3). Example SO2 LH Jacobians are presented in Fig. 1, for a fixed SO2 VCD of 25 DU and representative LER albedos of 5 % (panel a) and 80 % (panel b), representative of typical clear-sky and fully cloudy conditions, respectively. For this example, we observe the largest sensitivity to SO2 LH for low albedo and low SO2 peak height. This behavior is expected as most of the altitude information comes from the way SO2 alters the availability of photons to be scattered by air molecules below the SO2 layer (Yang et al., 2010). Conversely, for high SO2 height or high albedo (e.g., for an underlying cloud), the scattering weighting functions are weakly dependent on the altitude, and the information on SO2 LH appears to be less accessible. The performance of the algorithm under various conditions will be discussed further in Sect. 2.3.
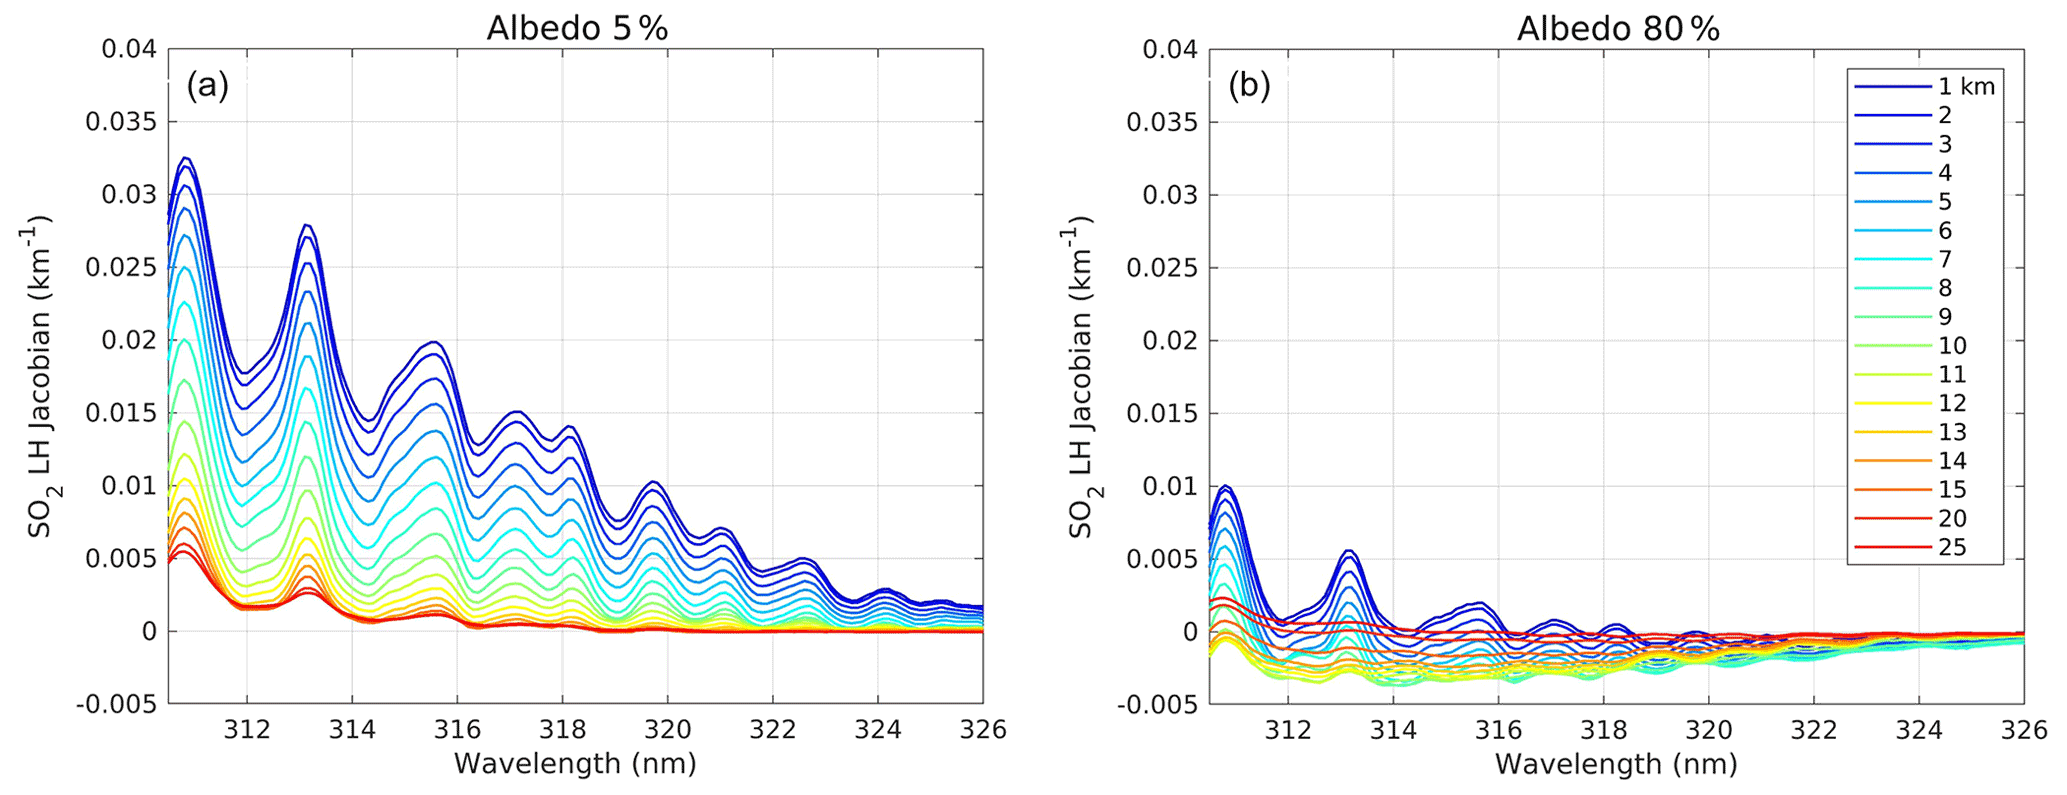
Figure 1Examples of SO2 optical depth Jacobians with respect to LH for different SO2 peak heights (1–25 km), and LER albedos of 5 % (a) and 80 % (b). The spectra correspond to SZA: 30∘, VZA: 0∘, RAA: 0∘, SO2 column: 25 DU, ozone column: 295 DU, surface height: 0 km.
2.2 LUT-COBRA settings
The retrieval of SO2 vertical column and height is performed from the analysis of measured radiances in the spectral range from 310.5 to 326 nm (TROPOMI band 3). The algorithm starts from an a priori pair (xo) of SO2 VCD and LH. The initial value VCDo is taken as the output of the operational TROPOMI SO2 column product for a plume height of 7 km (Theys et al., 2017). The height zo is 7 km, except if the LER height is greater than 5 km. In that case, zo is equal to the LER height + 2 km. First, the SO2 optical depth and Jacobian spectra for xo are derived from the LUT (as described in Sect. 2.1) and interpolated on the wavelength grid of the measurement. Then the results of the fit (Eq. 3) are used to calculate new SO2 spectra for the next calculation, and the retrieval is repeated until the inverted LH and VCD do not change from one iteration to the next by more than 500 m and 10 %, respectively, or if the number of iterations exceeds a limit value (fixed to 10). In practice, a solution is found typically after four iterations. We conducted a number of sensitivity tests and conclude that the retrieved SO2 LH and VCD are nearly independent of the prior xo. Moreover, using forward simulations, we have also estimated the interpolation errors due to the relatively coarse grids of the LUT and found that these are acceptably small in comparison to the noise level. Note that for some iterations, the algorithm gives SO2 LH occasionally outside the SO2 height grid. For those cases, the SO2 height is forced to the surface height +1 km or the grid maximum height −1 km (i.e., 24 km), depending on whether the height is below or above the surface or maximum height, respectively. More rarely, the same can happen for the retrieved SO2 VCD and then the SO2 VCD is set to VCDo for the next iteration.
A key information in the retrieval process is the covariance matrix S (and mean optical depth ), as it directly influences the sensitivity of the retrieval (Eq. 3). For the construction of S and we used a set of measured SO2-free spectra, following an approach analogous to our previous study (Theys et al., 2021). In brief, for each TROPOMI observation for which the SO2 LH algorithm is applied (see next section), we consider the spectral data of the corresponding orbit and TROPOMI row. To represent best the zonal dependence, we select the radiance spectra of 300 pixels along the flight direction (i.e., ±150 indices along track). This corresponds to a region of ∼ 1600 km. It permits us to sample a wide range of cloudiness so that the cloud condition of the pixel of interest is likely represented by the covariance (at least to some degree). Note that for the construction of S the pixels with observable SO2 amounts (with VCD > 2.5 × VCD retrieval error) are filtered out. To keep a viable number of spectra for the covariance calculation (at least 100), we also allow the number of pixels along the flight direction to increase, if necessary. Note that an upper limit on the SZA is fixed to 65∘ in order to exclude difficult conditions with high ozone absorption. This SZA limit applies both to the measurements to be analyzed for the SO2 height and for the construction of the covariance matrix S
It should be noted that the quality of the LUT-COBRA results depends strongly on the signal of SO2. This aspect is addressed in the next section.
2.3 Performance of the retrievals
Following Rodgers (2000), the estimated error covariance of the solution (Eq. 3) is given by the following:
This matrix can be calculated for each TROPOMI pixel and the square root of the diagonal elements of provide error estimates on the retrieved SO2 LH and VCD.
To demonstrate the sensitivity of the algorithm for different SO2 altitudes and vertical columns, the SO2 LH error was computed for predefined pairs of Jacobians, and a fixed covariance matrix S. The results are summarized in Fig. 2a for typical observation conditions in the tropics, over a land surface, free of snow and clouds. From this example, it is clear the SO2 LH retrieval uncertainty decreases for high SO2 columns. This is obvious as the SO2 signal dominates all variability contributions. The results also suggest that the algorithm performs better for SO2 at low heights. This behavior is logical and is in line with the dependence of the SO2 LH Jacobians with the SO2 height (see Fig. 1a, and related discussion). It is interesting to note that the observed retrieval performance dependence with SO2 height is complementary to the one found for thermal infrared nadir sounders, like IASI or CrIS. Indeed, Carboni et al. (2012) and Clarisse et al. (2014) demonstrated (using IASI) that the best SO2 height retrieval is achieved for SO2 plumes in the upper troposphere and lower stratosphere (UTLS), while in the lower troposphere (below 3–5 km), the sensitivity to the SO2 height is strongly reduced, as a result of water vapor absorption. This complementarity is further addressed in Sect. 3.
To compare the performance of the LUT-COBRA with more classical fitting approaches, we have also developed a modified DOAS algorithm, referred to as LUT-DOAS in the following. In short, the forward model matrix was expanded to include not only the LH and VCD Jacobians (grouped as ki) but also other spectra, used to fit the measured OD. Essentially, we implemented a linearized version of the DOAS scheme used in the operational TROPOMI SO2 algorithm (Theys et al., 2017). More precisely, 13 spectral functions are used to model the ozone absorption, Ring effect, broadband component (in the form of a third-order polynomial), spectral shift and squeeze (Beirle et al., 2013), and linear intensity offset. Based on this DOAS-type forward model matrix, the SO2 layer height error for the LUT-DOAS scheme was calculated using Eq. (5), by replacing the covariance matrix S with an identity matrix, divided by the square of the signal-to-noise ratio (SNR). The latter was fixed to 800, a typical SNR of TROPOMI radiances over the fitting window considered. The results are presented in Fig. 2b.
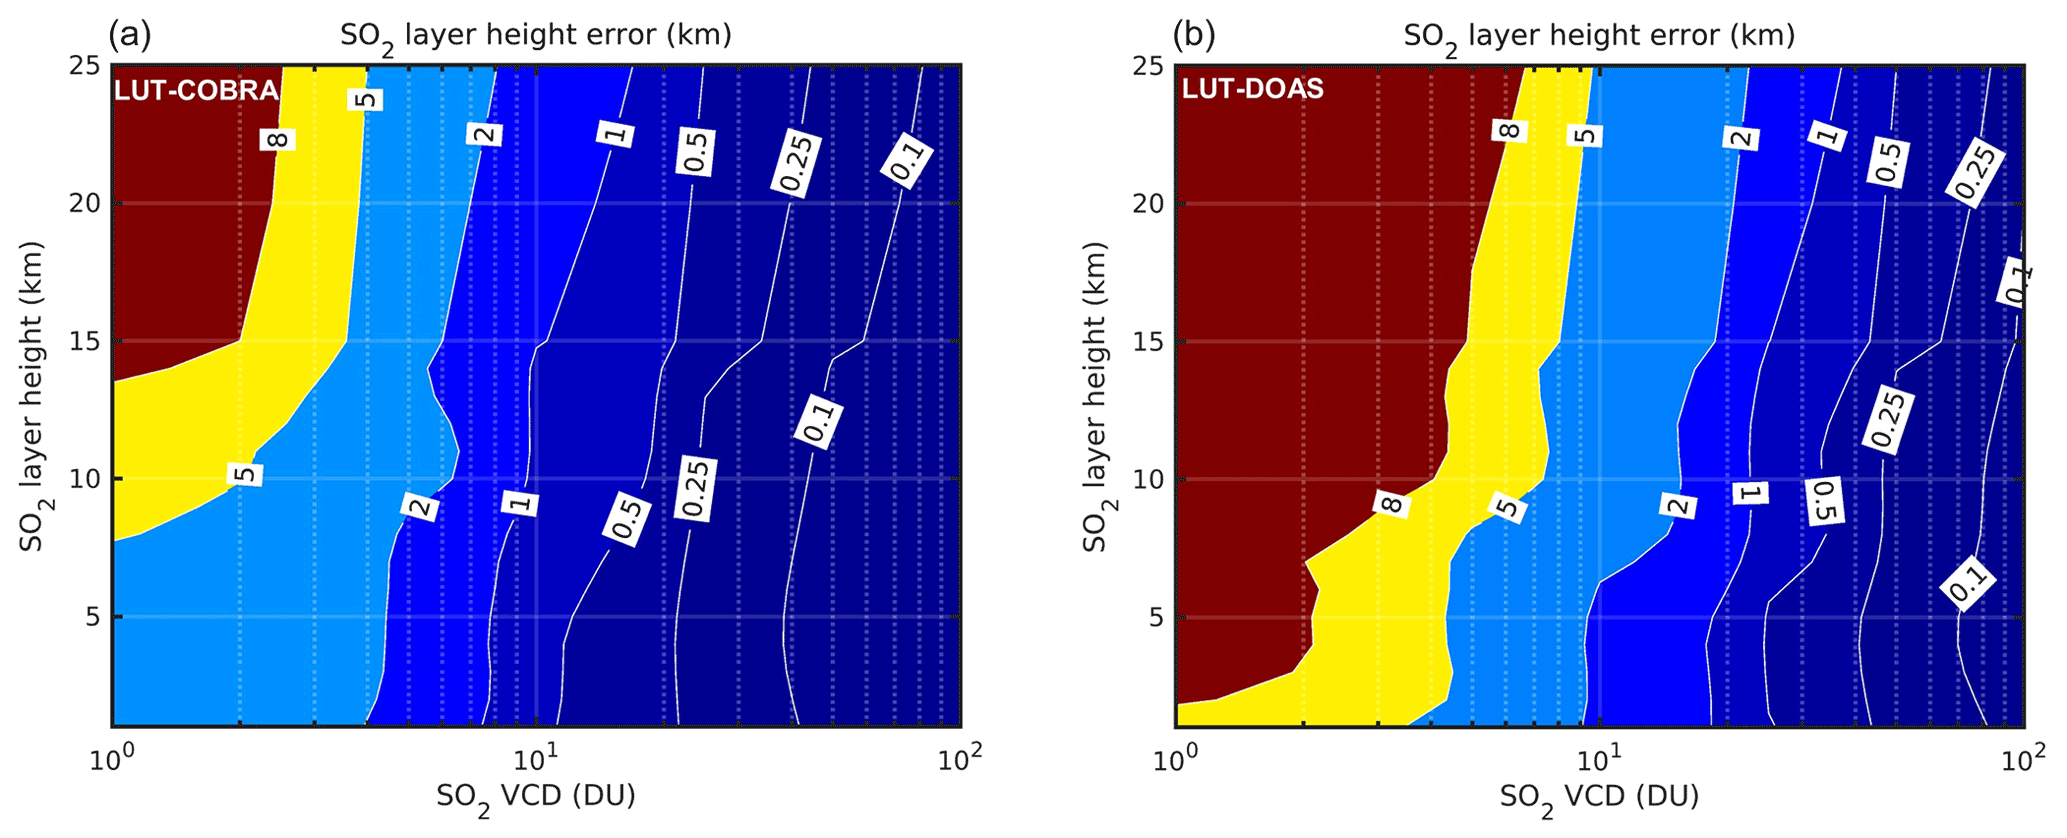
Figure 2SO2 layer height theoretical uncertainty for (a) LUT-COBRA and (b) LUT-DOAS schemes. The results correspond to SZA: 30∘, VZA: 0∘, RAA: 0∘, ozone column: 295 DU, surface height: 0 km, surface albedo: 5 %.
This example indicates that, in theory, the LUT-DOAS scheme yields reasonable height retrievals with uncertainty of 1–2 km for SO2 columns greater than 10–40 DU, depending on the SO2 height. This finding is mostly consistent with previous studies on UV retrievals of SO2 plume height (e.g., Nowlan et al., 2011; Hedelt et al., 2019).
However, compared to the LUT-DOAS algorithm, Fig. 2 suggests that our LUT-COBRA scheme significantly improves the SO2 layer height error by a factor of 2–3. This is an appealing aspect of the LUT-COBRA approach, as it enables the application of the SO2 LH retrievals to SO2 columns as low as 5 DU.
The performance results of Fig. 2 were repeated for other observation conditions. In particular, a high reflectance scenario (80 %) was tested to represent the situation of an SO2 plume lying above a cloud deck. The results show no significant change in the performance of the retrievals indicating that underlying clouds have little impact on the sensitivity to SO2 LH. In a way, this is counter-intuitive when looking at Fig. 1, but one should keep in mind that the algorithm retrieves both LH and VCD of SO2. Clearly, high reflectance conditions help better constrain the SO2 vertical column (especially for low SO2 heights) which in turn is beneficial to access the spectral information on SO2 LH. Another interesting result is to test the sensitivity of the retrieval as a function of the observation angles. For instance, increasing the solar zenith angle first leads to improved results, because the SO2 signal increases as the optical path through the SO2 layer gets longer, but then the performance quickly deteriorates for high angles due to large absorption by ozone. Those conditions are, however, discarded by the algorithm SZA cutoff of 65∘ (Sect. 2.2).
It should be emphasized that the SO2 layer height error presented here does not account for systematic uncertainties. It is clear that in many circumstances, forward model errors can actually dominate the total error in SO2 LH. These errors are generally difficult to evaluate and depend on the prevailing conditions. In Sect. 3, examples of TROPOMI results will be presented with specific attention to possible sources of error. We also refer to Yang et al. (2010) and Nowlan et al. (2011) for a presentation of the various sources of systematic uncertainties.
In practice, the SO2 layer height error (Eq. 5) can be computed for each TROPOMI pixel. This is useful as it helps diagnose the retrieval quality. In what follows, the retrievals are considered only for a SO2 layer height error lower than 2.5 km and retrieved VCD of at least 5 DU. In order to preselect the spectra that potentially fulfill these criteria (and limit the computational effort), the TROPOMI operational SO2 product was examined. Only measurements with slant column densities (a quantity independent of SO2 plume height) larger than 2.5 DU were selected and processed by the SO2 LH algorithm.
In this section, we present TROPOMI SO2 LH data and evaluate the results against independent plume height estimates from satellites and back-trajectory modeling.
3.1 Comparison with satellite plume height estimates
For a selection of eruption events, we performed comparisons with the IASI SO2 height data of Clarisse et al. (2014), readily available in near-real time in the Support to Aviation Control Service (SACS; Brenot et al., 2014, 2021). Another useful dataset to validate the TROPOMI SO2 height is from the Cloud-Aerosol Lidar with Orthogonal Polarization (CALIOP) instrument on board the Cloud-Aerosol Lidar and Infrared Pathfinder Satellite Observation (CALIPSO). Here we used the 532 nm total backscatter coefficient profiles from the standard CALIOP level-2 v4 product (CAL_LID_L2_05kmAPro-Standard-V4), available from NASA (https://www-calipso.larc.nasa.gov, last access: 30 March 2022). Although those datasets are very useful, we note that these can only be used to validate TROPOMI SO2 LH in a rather qualitative way because (1) IASI has a different overpass time than TROPOMI and (2) CALIOP has a narrow swath (resulting in limited sampling of what S-5P observes) and measures aerosols rather than SO2. Moreover, CALIOP is generally more representative of the top layer of the plume than TROPOMI-retrieved SO2 heights. More validation results are shown in Sect. 3.2 and 3.3.
The first example is for the Sierra Negra volcano (0.83∘ S, 91.17∘ W, Ecuador) that erupted on 26 June 2018 at ∼ 20:00 UTC, according to the Global Volcanism Program (https://volcano.si.edu/, last access: 30 March 2022). Coincidently, TROPOMI passed over the region shortly after the start of the eruption at ∼ 20:12 UTC and detected a freshly emitted and nearly undispersed SO2 plume with heights of 3–5 km, in good agreement with the S-5P Full-Physics Inverse Learning Machine (FP_ILM) results of Hedelt et al. (2019). On 27 June, the TROPOMI overpass (orbit 03652, approximate time 19:50 UTC) revealed an SO2 plume distributed at multiple heights. Figure 3a shows the results of the LUT-COBRA. The retrieved SO2 heights are as low as 1–2 km near the vent and up to 18 km further downwind. The characteristic pattern of SO2 height levels observed for the different parts of the plume is consistent with the retrievals of CrIS (Hyman and Pavolonis, 2020). Figure 3 also presents results from IASI on 28 June at ∼ 15:15 UTC (SO2 height images for other dates and acquisition times are accessible on the SACS web page; http://sacs.aeronomie.be, last access: 30 March 2022). As can be seen, the TROPOMI LUT-COBRA and IASI SO2 LH results agree qualitatively well considering the relatively large time difference of nearly 20 h between the two measurements. A notable difference though is for the SO2 plume located below 3 km, which is barely seen in the IASI data. For this particular example, this is partly because the volcano lies between two orbits, but inspection of other SO2 images does not reveal significant SO2 detections below 3 km by IASI. The reason is likely the limited sensitivity of IASI in the lowermost troposphere, particularly in the tropics.
In addition to the LUT-COBRA results, Fig. 3b also presents the corresponding retrievals from the LUT-DOAS implementation (introduced in Sect. 2.3). Here we show the results for retrieved SO2 VCDs greater than 20 DU in order to keep the SO2 height data with retrieval errors better than 1–2 km (Fig. 2b). This threshold is the same as in Hedelt et al. (2019). Overall, the SO2 LHs from LUT-DOAS are in close agreement with the LUT-COBRA results, for the pixels in common. The LUT-DOAS values also match very well the results of S-5P FP_ILM (Fig. 10b of Hedelt et al., 2019). However, this example of Fig. 3 clearly demonstrates that the LUT-COBRA is able to retrieve SO2 LH for many more pixels with greater sensitivity than the LUT-DOAS approach. In the following, only the LUT-COBRA results will be presented and discussed.
A second illustration of the LUT-COBRA SO2 LH results is for the Raikoke volcano (48.29∘ N, 153.25∘ E, Kuril Islands, Russia) that erupted on 21 June 2019 with multiple explosions that started at ∼ 18:00 UTC and lasted several hours. The eruption injected enormous amounts of SO2 in the atmosphere, around 1.5 Tg (e.g., de Leeuw et al., 2021), as well as volcanic ash. Raikoke is therefore a good case to test the SO2 LH algorithm under extreme conditions. Note that the eruption of Raikoke is also well documented and is the subject of a special issue from Atmospheric Chemistry and Physics, Atmospheric Measurement Techniques, and Geoscientific Model Development.
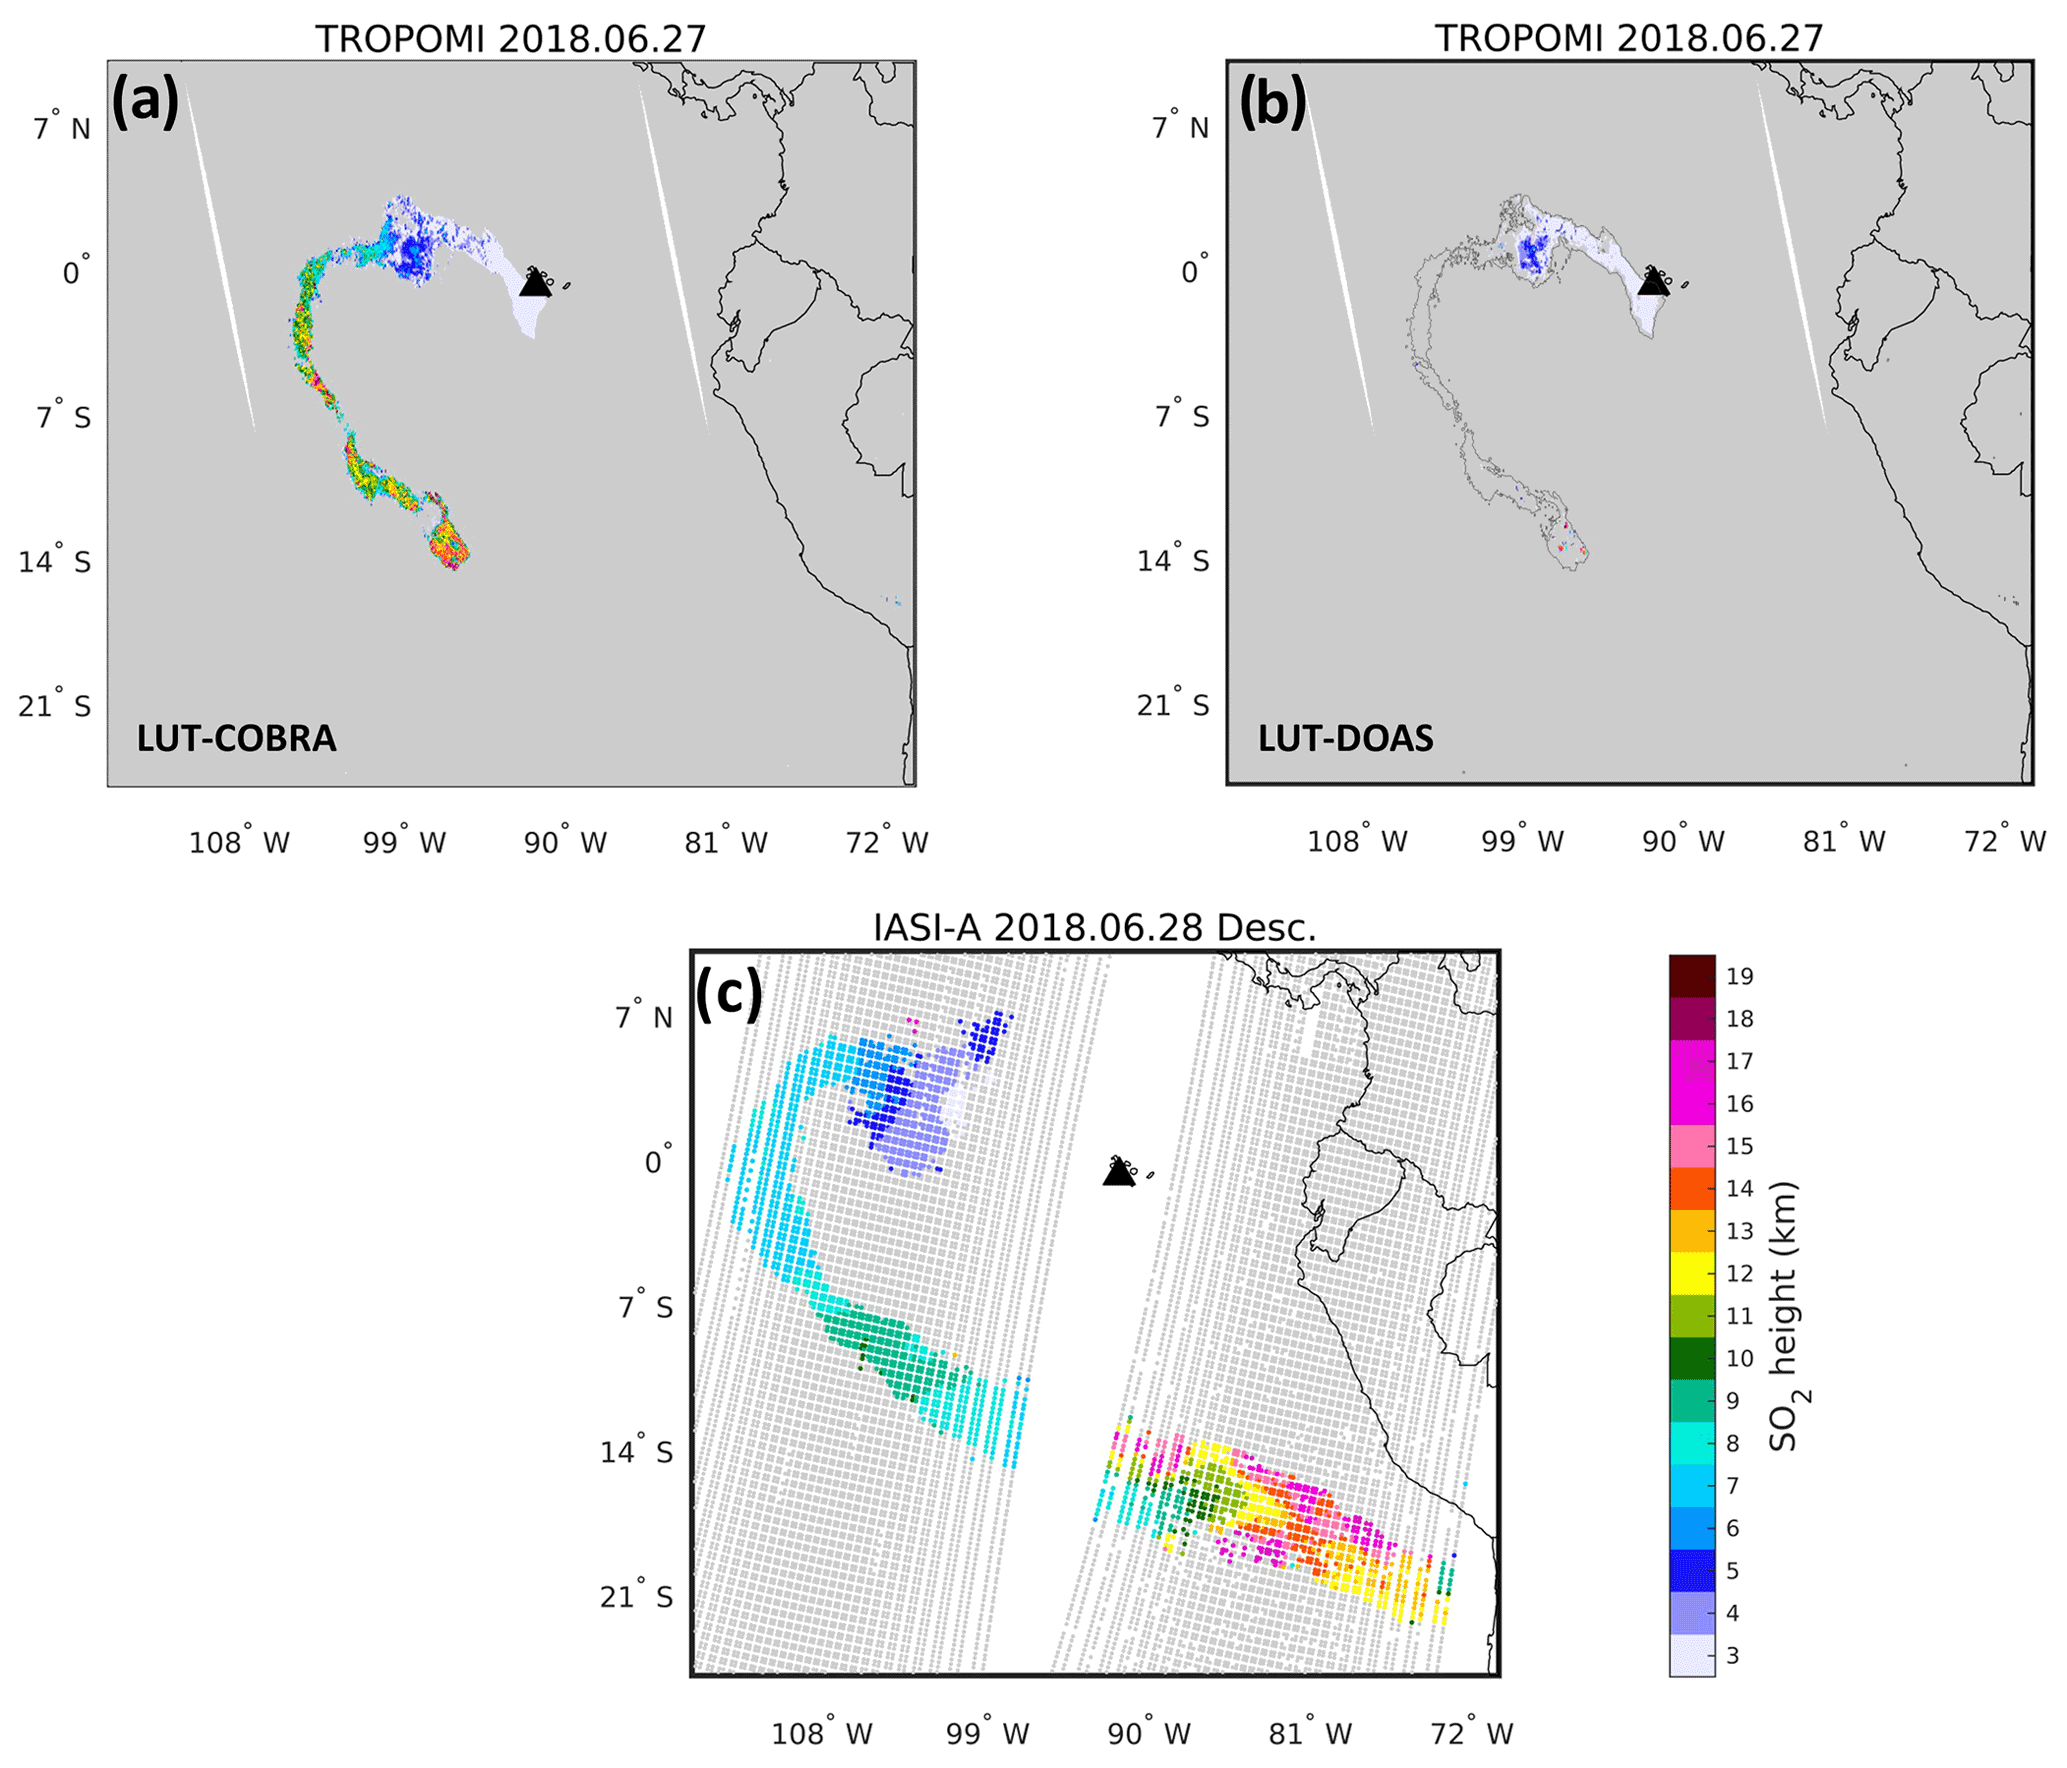
Figure 3SO2 layer height results for the eruption of Sierra Negra from (a) TROPOMI LUT-COBRA, (b) TROPOMI LUT-DOAS on 27 June 2018, and (c) IASI/MetOp-A on 28 June 2018 (descending orbit). The Sierra Negra volcano is marked by a black triangle. The gray pixels indicate the measurements with no SO2 height retrieval. For panel (b), the thin black line shows the 5 DU contour of SO2 VCD used as threshold for the LUT-COBRA results (a).
Figure 4a and c present two examples of SO2 LH results for Raikoke on the 23 June 2019. Most of the SO2 is found between 5 and 15 km, in agreement with Cai et al. (2022). The SO2 distribution as a function of height seen in this example is also observed by other satellite datasets. The core of the plume is located in the 8–14 km altitude range, similar to Hyman and Pavolonis (2020) and Hedelt et al. (2019), and is consistent with SO2 profiles from the Microwave Limb Sounder (MLS).
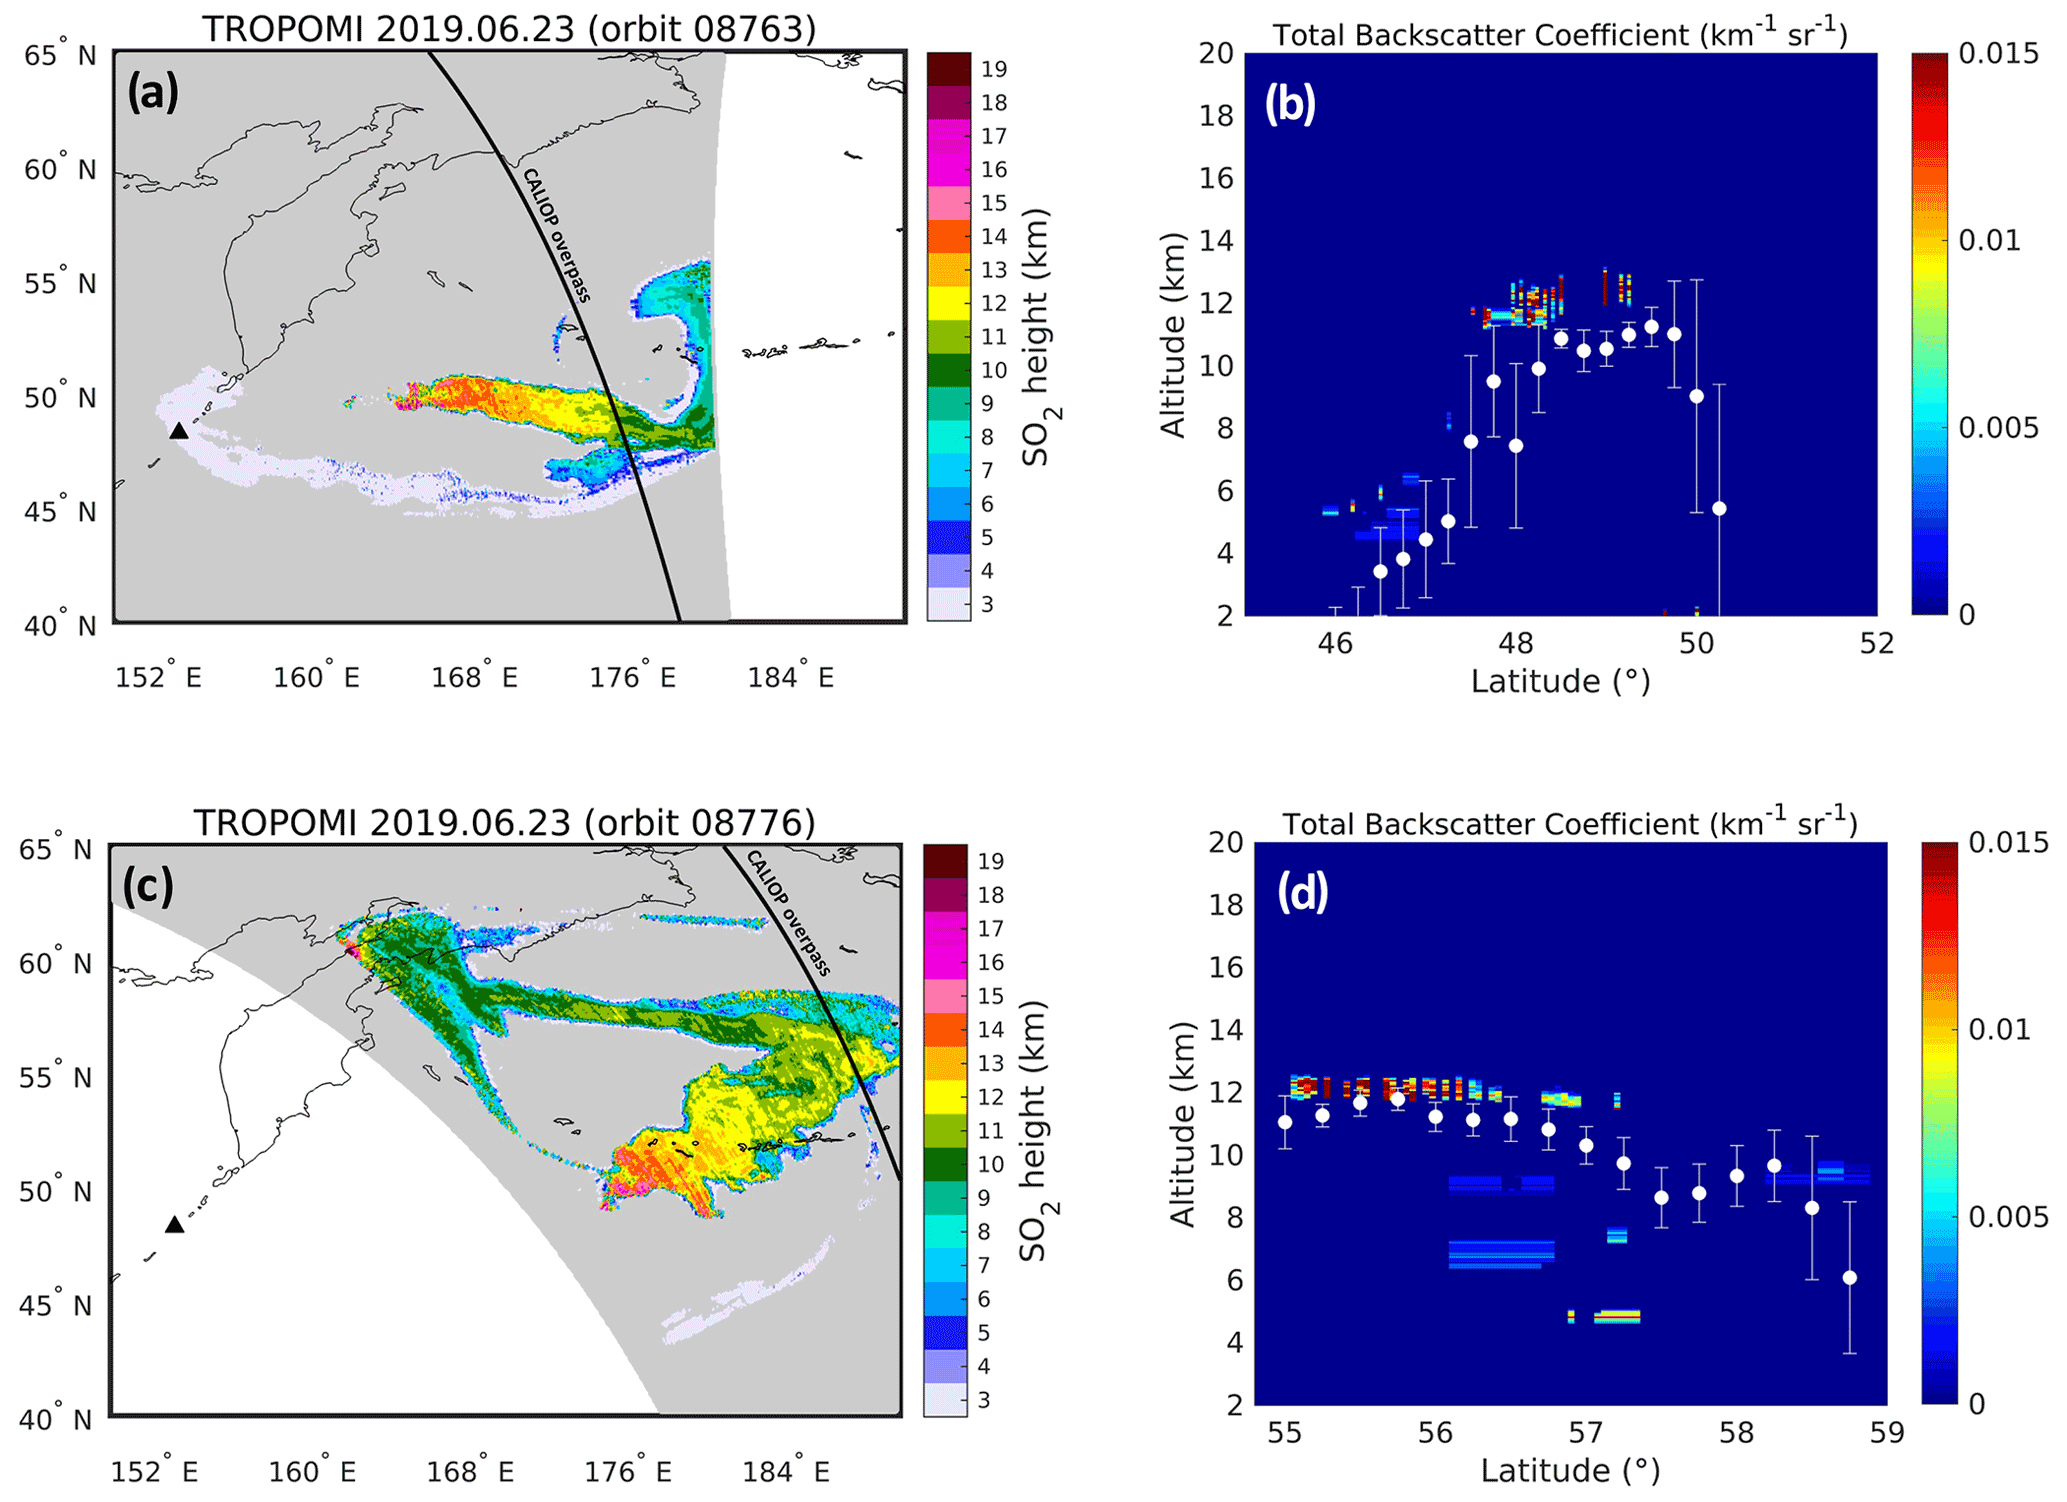
Figure 4SO2 layer height results from TROPOMI observations of the Raikoke plume on 23 June 2019, for orbits (a) 08763 and (c) 08776. The retrieved maximum SO2 VCD is 613 and 274 DU, respectively. The Raikoke volcano is marked by a black triangle. The gray pixels indicate the measurements with no SO2 height retrieval. The black lines indicate the CALIOP overpasses within 1 h. (b, d) Comparison between CALIOP plume detection from measured 532 nm total backscatter coefficient and TROPOMI SO2 LH results, for (a, c), respectively. The TROPOMI values (in white) are the mean and standard deviation of the SO2 LH results within 0.25∘ × 0.25∘ boxes, coincident with CALIOP.
Figure 4a and c also feature a plume at much lower altitude, which is consistently observed in other studies (e.g., Hyman and Pavolonis, 2020; de Leeuw et al., 2021; Muser et al., 2020). The TROPOMI results of Fig. 4 also agree reasonably well with IASI SO2 heights. However, the comparison is left out of this study, as it will be covered in a future publication (Vernier et al., 2022). Instead, we compare the TROPOMI SO2 LH with nearly coincident CALIOP observations of the Raikoke plume. Figure 4b and d show the comparison between the measured total backscattered coefficient of CALIOP and collocated TROPOMI SO2 LH, for the two orbits of Fig. 4a and c. Qualitatively, the TROPOMI SO2 LH is in agreement with the aerosol features detected by CALIOP. For instance, the plume at lower altitudes (∼ 46–48∘ N in Fig. 4b) is well captured by TROPOMI. However, it is clear that overall the retrieved SO2 heights are systematically lower than CALIOP by 1–3 km. This finding is in line with the results of Koukouli et al. (2022), who found similar low bias of the S-5P FP_ILM SO2 height product compared to CALIOP. Note also that the first TROPOMI observations of the Raikoke plume were made on 22 June 2019 (orbit 08749). For that plume, the algorithm retrieves SO2 heights of ∼ 8 km (not shown). Unfortunately, there was no CALIOP measurement available on that day, but it appears that these heights are much too low when compared to other data. This is not a problem specific to our algorithm, and it highlights the difficulty to retrieve the SO2 height in the UV range for a scene with a mixture of SO2 and ash (e.g., Yang et al., 2010; Hedelt et al., 2019). Under these conditions, the LUT and Lambertian equivalent reflector approximation fail to reproduce adequately the complex radiative transfer in the volcanic plume, leading to a low bias on the SO2 height, which can be as large as 5 km for fresh and thick ash plumes. In addition, the reference set of spectra used for the construction of the covariance matrix is likely not covering well these conditions of low UV intensities.
A last test case is for the Ulawun volcano (5.05∘ S, 151.33∘ E, Papua New Guinea) that erupted explosively on 26 June 2019 at around 04:30 UTC and injected SO2 at the tropical tropopause level in the form of a well-defined umbrella cloud. On 27 June, TROPOMI (orbit 08821, approximate time 04:00 UTC) observed an SO2 plume over the region of Ulawun (Fig. 5a, b) with SO2 LH distributed mainly between 15 and 21 km (Fig. 5d), with a center-of-mass height of 17.7 km. Conversely, the IASI/MetOp-A overpass at ∼ 11:20 UTC on the same day revealed a plume of SO2 injected in a narrower vertical layer, with center-of-mass height of 16.6 km, hence slightly lower than the TROPOMI estimate. It is interesting to note that the total SO2 mass inferred from TROPOMI is in rather good agreement with the IASI estimate, within 10 %. We argue that the difference in the SO2 mass distributions could actually relate to the limited sensitivity of the TROPOMI retrievals for that plume. Indeed, the SO2 columns from TROPOMI (Fig. 5b) are modest, smaller than 20 DU for most pixels, and 9 DU on average. At this VCD level, the retrieval error on TROPOMI SO2 LH (Fig. 2a) is significant for a SO2 plume in the UTLS, around 1.5 km. This is compatible with the observed spread of the TROPOMI SO2 mass distribution (Fig. 5d). Regarding the apparent ∼ 1 km difference between TROPOMI and IASI SO2 center-of-mass heights, we can of course not completely rule out a systematic error on the IASI retrievals, but it is unlikely to explain fully the observed offset. Importantly, for these conditions (low to medium VCD, high LH), the TROPOMI SO2 height retrieval is exposed to forward model errors that could easily explain a 1 km bias. For example, the look-up table uses a simplified representation of the atmosphere in terms of temperature and ozone profiles that can ultimately lead to systematic errors in the Jacobians used for the retrievals.
Overall, the examples presented in this section show that there is a general good agreement between TROPOMI SO2 LH and other satellite heights estimates. Nevertheless, the results also highlight limitations of the retrievals in some (difficult) conditions, in particular for optically thick ash clouds or lower stratospheric SO2 plumes. More work would be needed to improve these results.
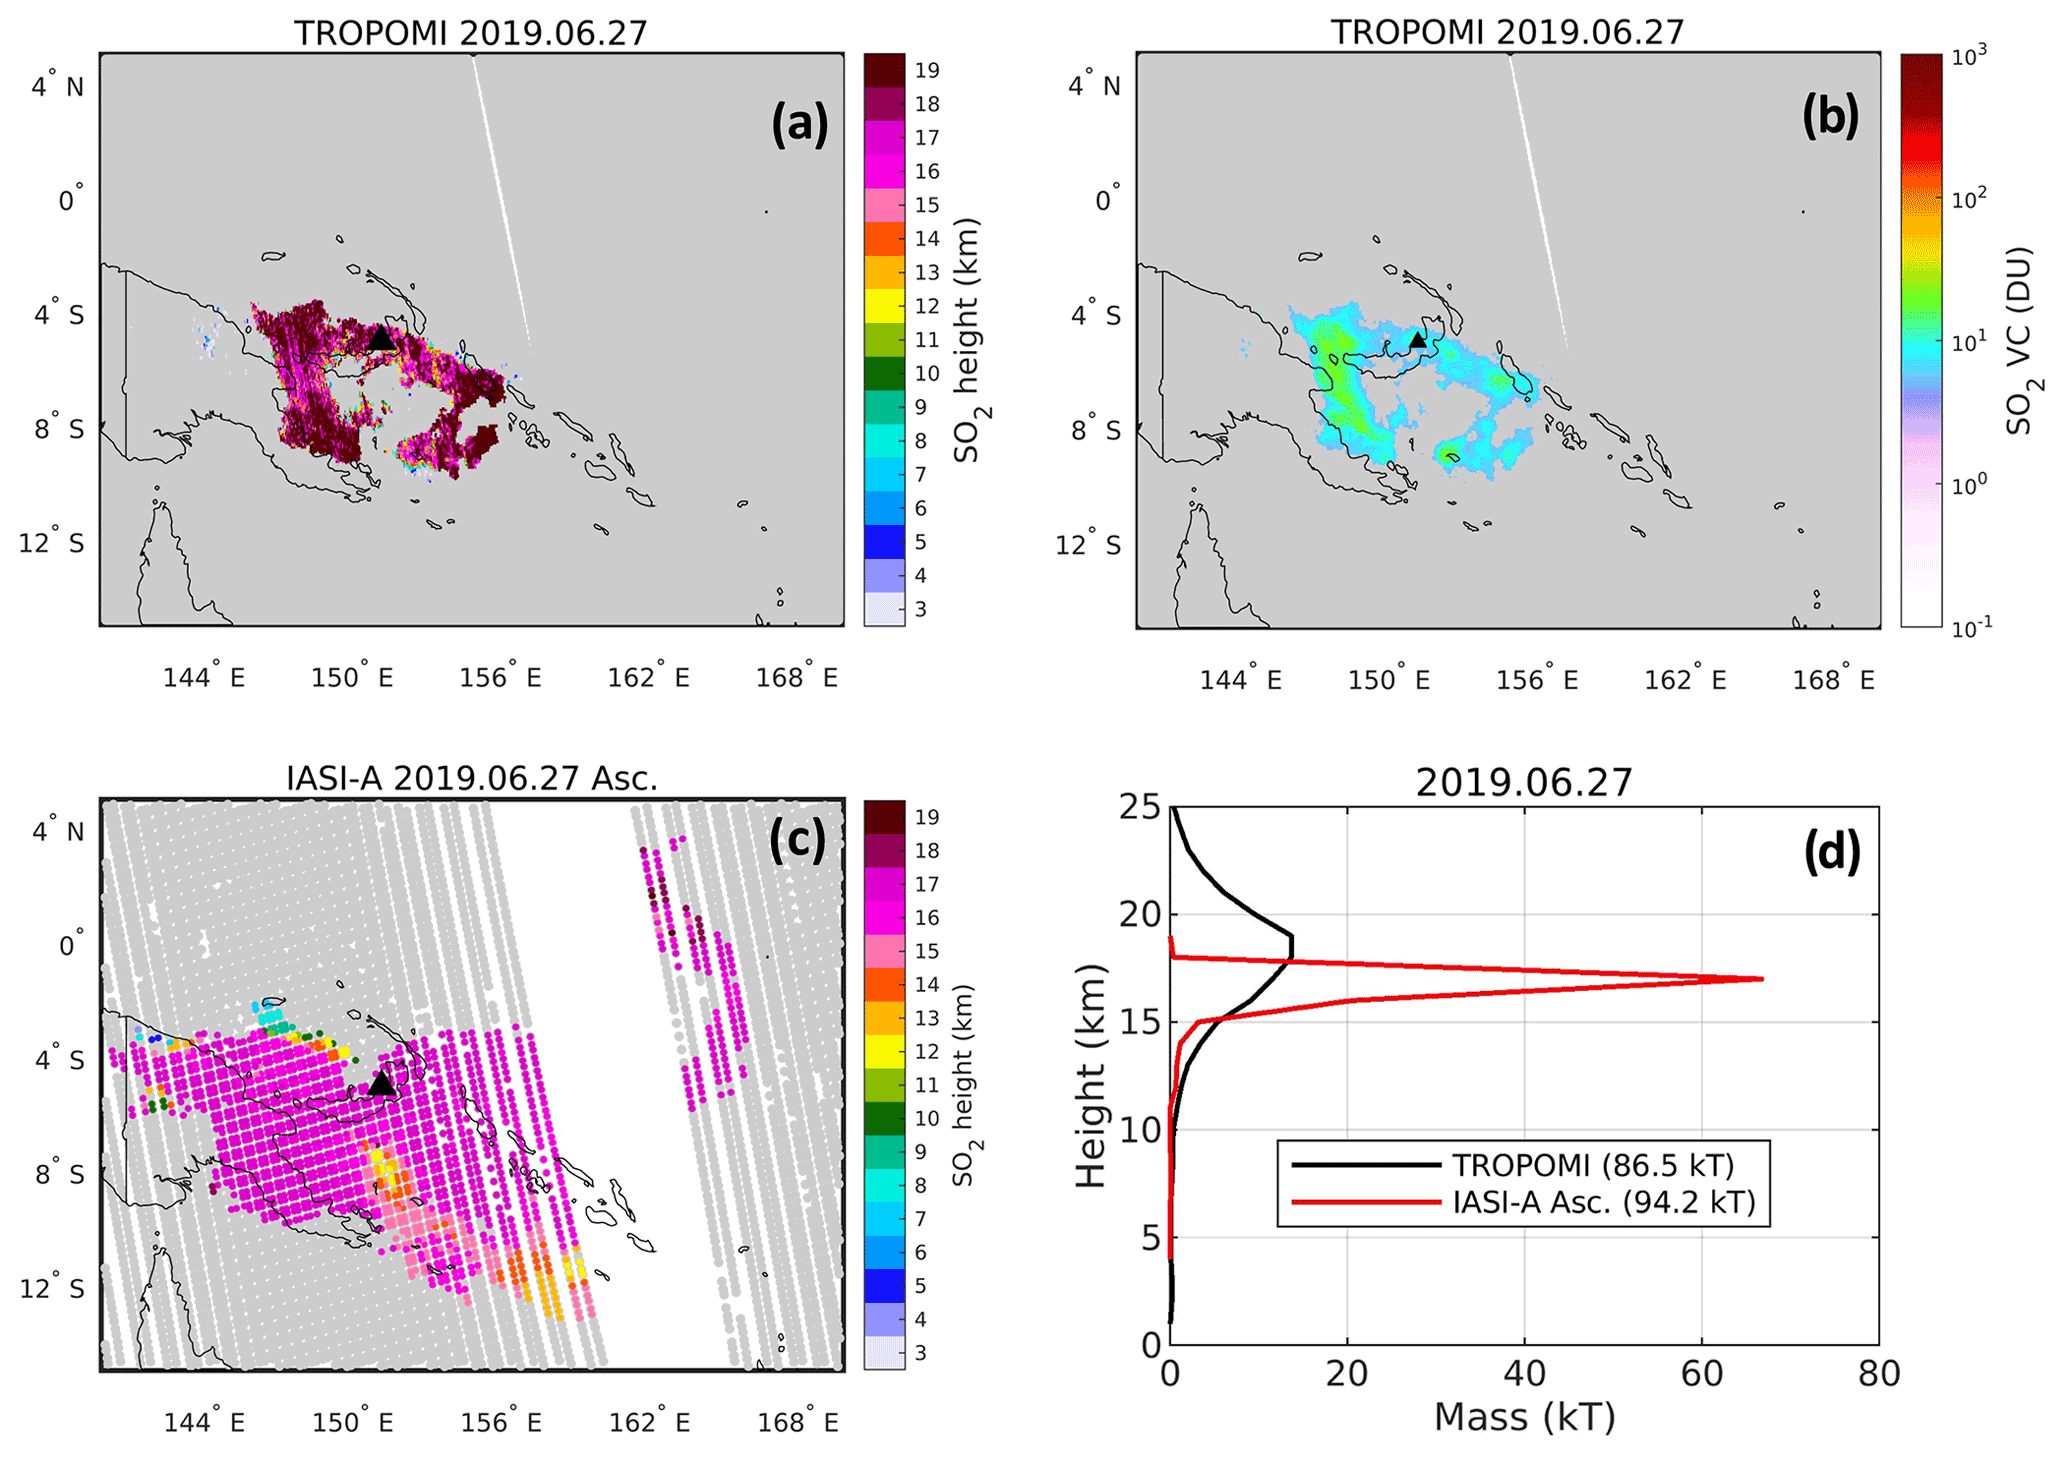
Figure 5SO2 plume on 27 June 2019 after the eruption of Ulawun. (a, b) TROPOMI retrievals of SO2 LH and VCD, respectively; (c) SO2 LH from IASI/MetOp-A (ascending orbit); (d) comparison of SO2 mass histograms between TROPOMI and IASI. Total masses are indicated in the legend. The Ulawun volcano is marked by a black triangle. The gray pixels indicate the measurements with no SO2 height retrieval.
3.2 Comparison with back-trajectory analysis from PlumeTraj: the Etna case
An independent validation of the SO2 height retrievals of TROPOMI can be obtained from back-trajectory analysis. Recently, a general algorithm has been developed called PlumeTraj (Pardini et al., 2017, 2018; Queißer et al., 2019), which allows the height and age of volcanic SO2 emissions to be quantified for each TROPOMI pixel in a SO2 image, using HYSPLIT back trajectories (Stein et al., 2015). PlumeTraj leverages the fact that, because of the wind shear in the atmosphere, only a limited range of back-trajectory altitudes connects a SO2 pixel location with a given volcanic vent. Importantly, when all pixels containing a volcanic plume are considered together, the height and age parameters inferred by this method can be used in combination with the SO2 column data to reconstruct height- and time-resolved SO2 emissions. This approach proves to be very powerful, as it provides unique insights into the volcanic processes driving eruptions (Burton et al., 2021). A similar technique was also applied by Wu et al. (2017) to derive emission time series from SO2 observations of the Atmospheric Infrared Sounder (AIRS).
Here we have analyzed and compared the height results of TROPOMI SO2 LH and PlumeTraj for 17 paroxysmal events of Mount Etna, Italy (37.75∘ N, 15∘ E), occurring in 2021.
Figure 6 presents an example of comparison, for a plume on 19 February 2021. It should be stressed that the SO2 plume heights, as shown in Fig. 6, are retrieved independently from each other, as PlumeTraj only needs as input the observation time and pixel coordinates. For this event, PlumeTraj derives SO2 heights typically between 5 and 9 km with the highest values for the eastern part of the plume and lower heights on the western part, and near the vent. Overall, this pattern is well reproduced by our TROPOMI SO2 LH retrievals – despite a few outliers. For the core of the plume, the agreement between TROPOMI SO2 LH and PlumeTraj is generally very good, with differences mainly within ±2 km. However, much larger differences are found for the edges of the plume, where the TROPOMI SO2 LH algorithm often retrieves SO2 plume heights much lower than PlumeTraj. We attribute this feature to an effect of the strong SO2 horizontal inhomogeneity within a TROPOMI pixel, which ultimately causes an underestimation of the retrieved SO2 height (consistent with Yang et al., 2010). This effect is also visible in Fig. 4.
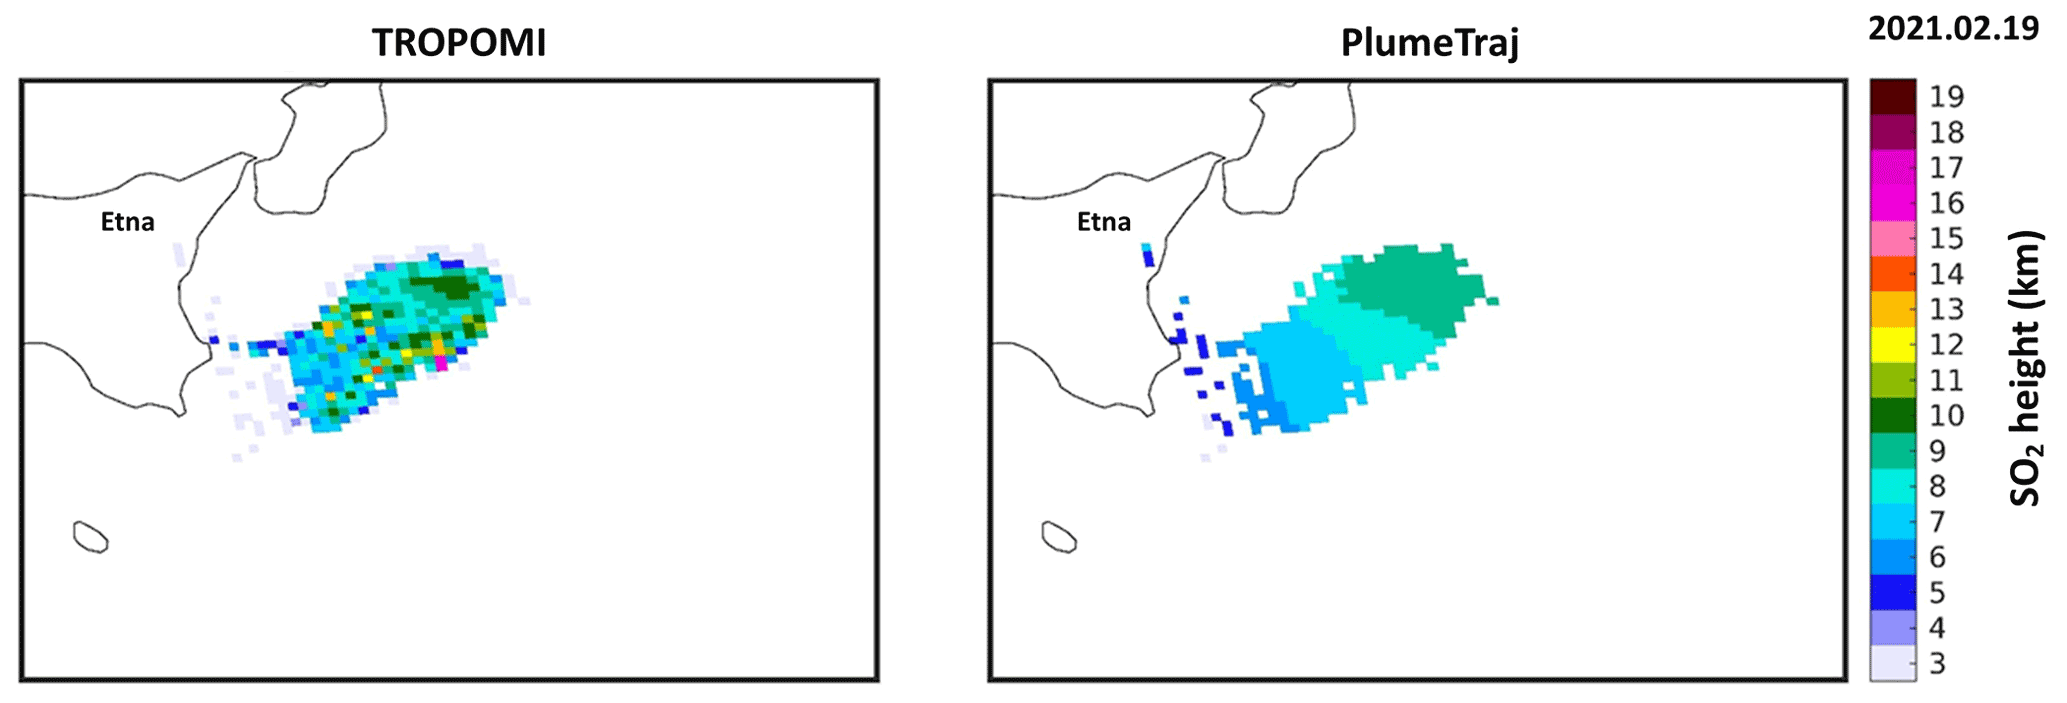
Figure 6Example of SO2 height results derived from TROPOMI and PlumeTraj for an Etna plume on 19 February 2021.
Figure 7a summarizes the TROPOMI and PlumeTraj SO2 height results, for all selected Etna events. For each SO2 plume, the center of mass height was calculated by averaging the SO2 height weighted by the SO2 column amount in each pixel. For TROPOMI SO2 LH, this is performed using the retrieved SO2 column data, while for PlumeTraj the SO2 column is estimated using linear interpolation of the TROPOMI operational SO2 column product (given at 1, 7, and 15 km; Theys et al., 2017) to the altitude returned from the trajectory analysis. Note that all pixels with retrieved SO2 heights < 1 km were excluded from the analysis, in an effort to reduce the impact of the pixels near the plume edges affected by pixel under-filling. As can be seen from Fig. 7a, TROPOMI and PlumeTraj capture comparable SO2 heights (in the range of ∼ 4–11 km) and similar variability (correlation coefficient of 0.85). The estimated total SO2 masses are also very consistent (not shown) and are in the range between 3.5 to 18.5 kt.
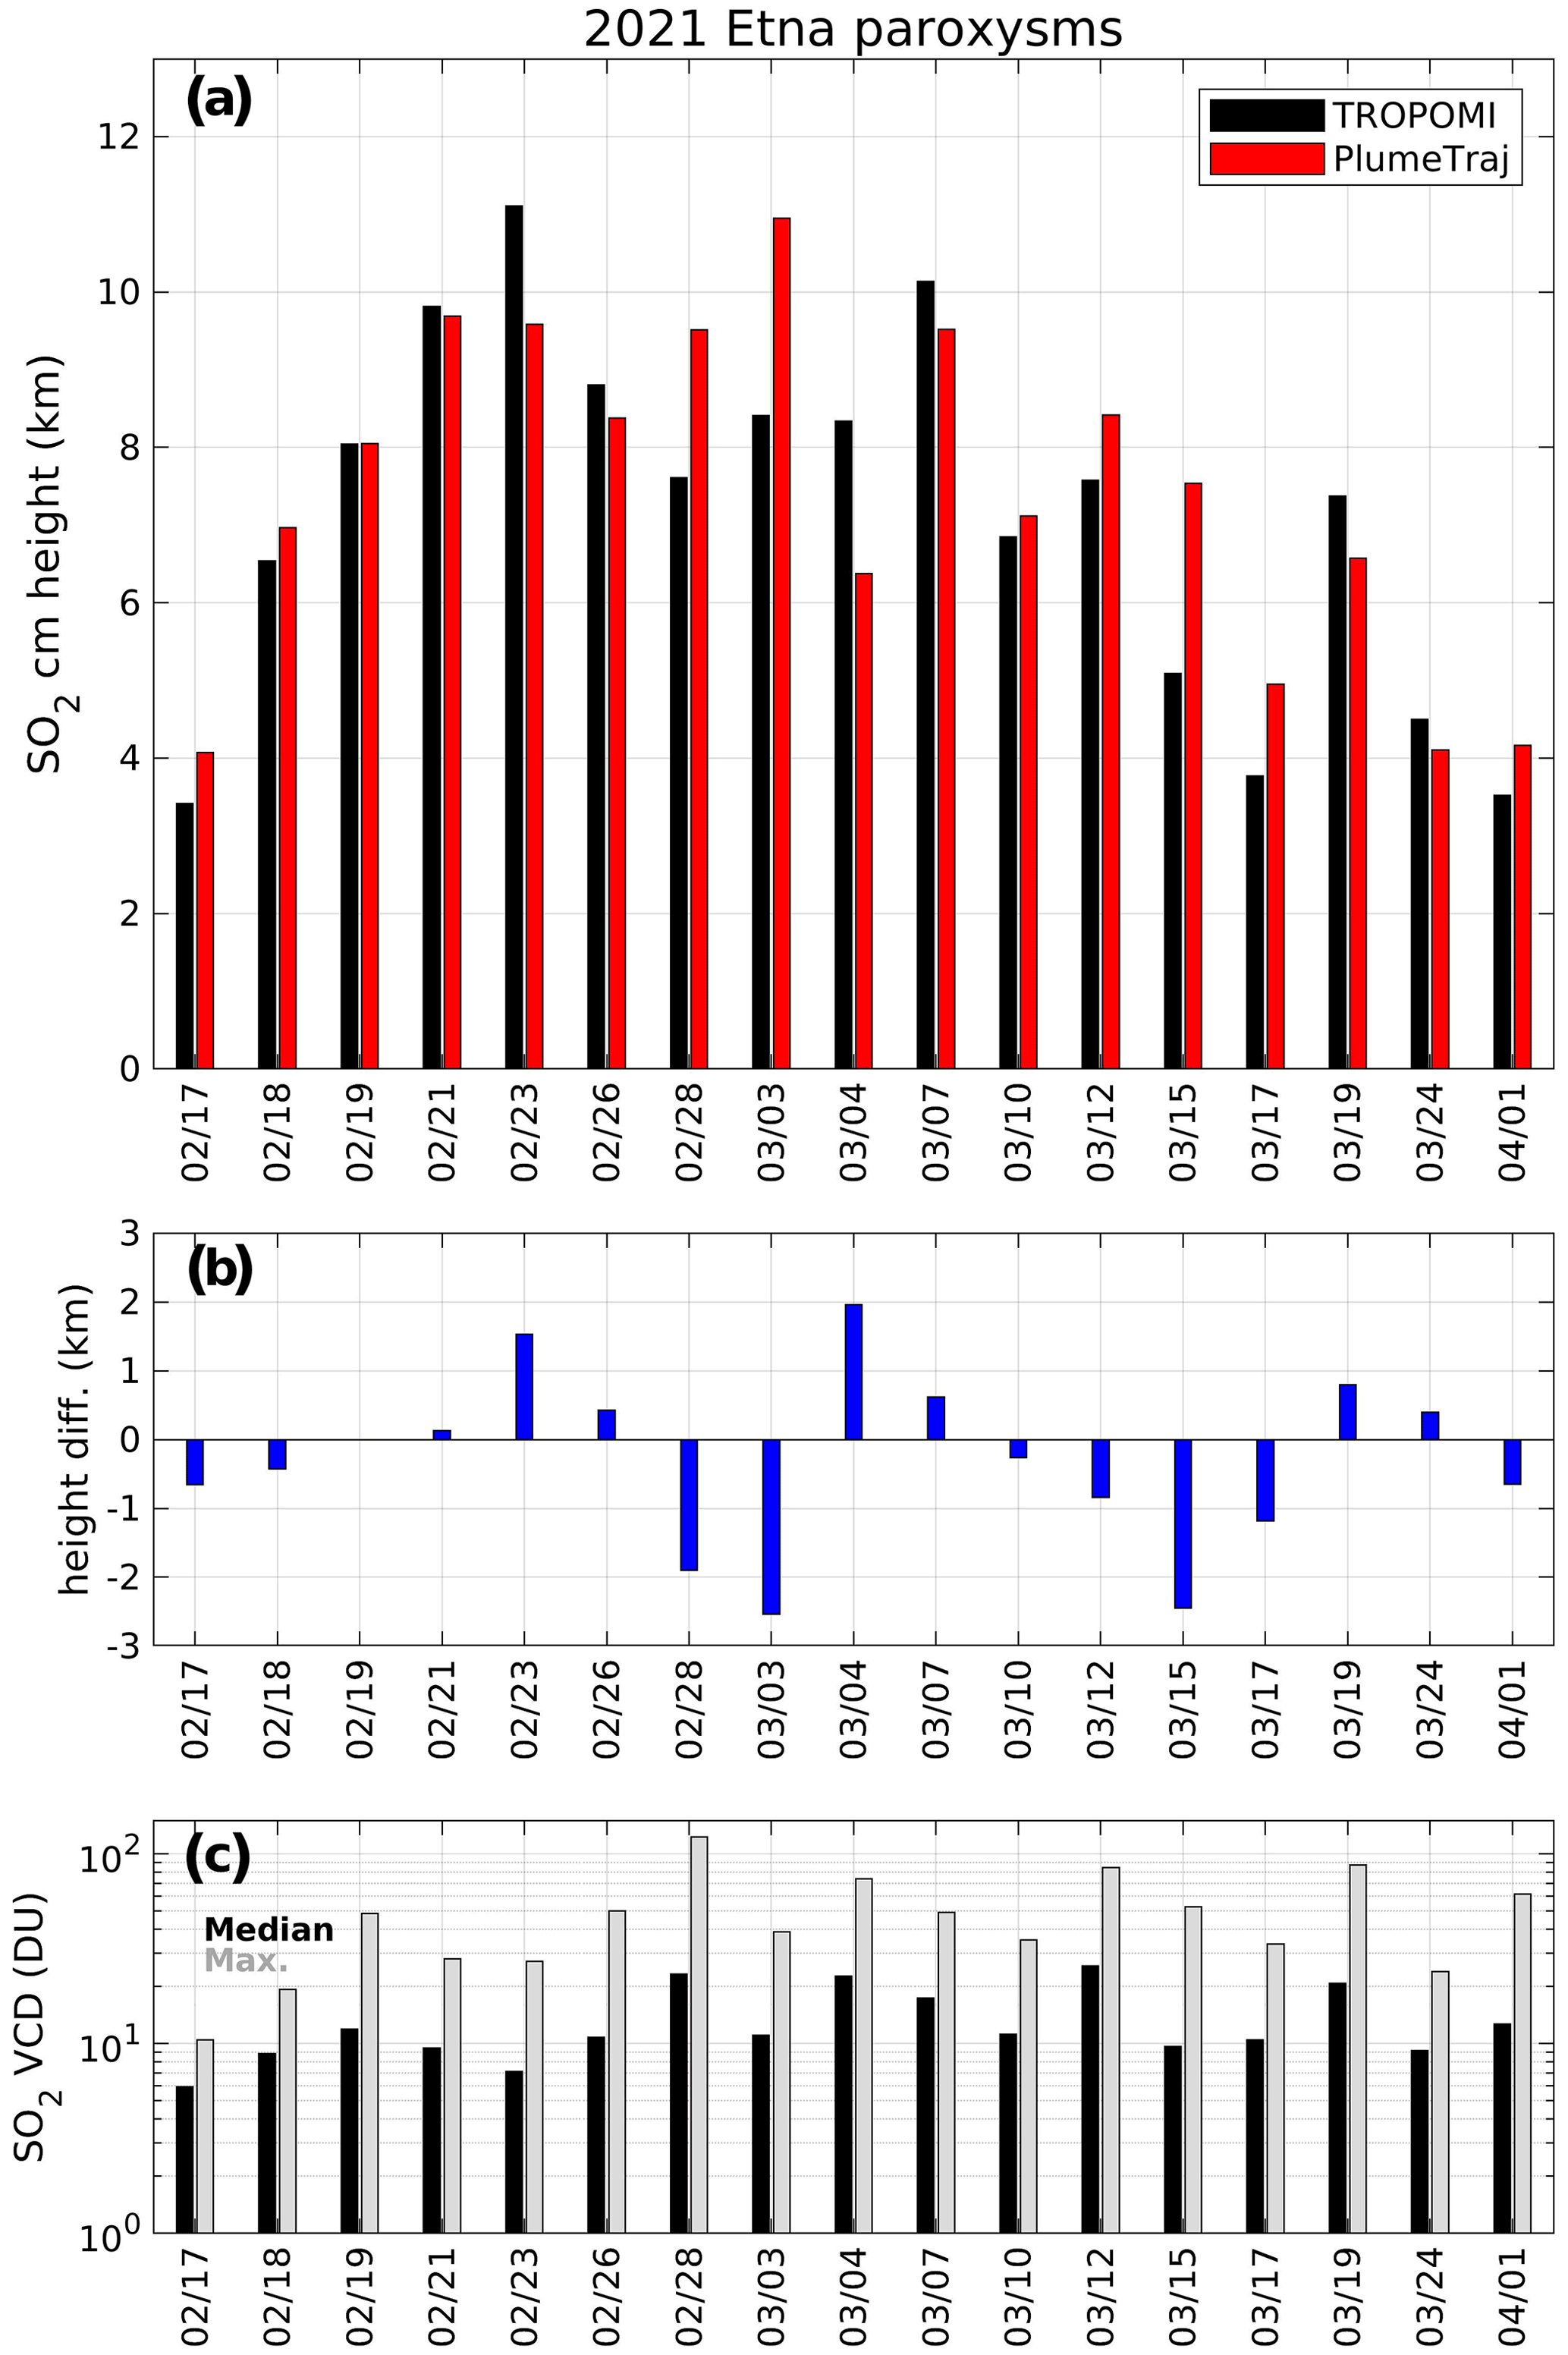
Figure 7(a) Comparison of SO2 center of mass height (km) from TROPOMI and PlumeTraj for 17 Etna paroxysmal events in 2021. (b) Differences of TROPOMI minus PlumeTraj SO2 height (root mean square error: 1.25 km). (c) Median and maximum SO2 columns retrieved by TROPOMI LUT-COBRA.
Figure 7b shows the differences in height between TROPOMI and PlumeTraj for all paroxysmal events, and Fig. 7c summarizes the corresponding median and maximum SO2 column values as retrieved by TROPOMI SO2 LUT-COBRA
For about two third of the cases, the height estimates agree within ±1 km. There are only a few instances for which the height difference is higher than 1.5 km (in absolute value). However, further investigation reveals that these cases correspond to particularly difficult conditions either for the satellite retrievals (e.g., due to the presence of volcanic ash or because the plume was narrow) or for PlumeTraj (unfavorable wind shear settings or because the plume was old (plume age ∼ 1 d)). Importantly, from Fig. 7b and c, we cannot find a relation between the height discrepancy and the SO2 loadings. The median SO2 VCD lies in the range between 6 and 25.6 DU, and Fig. 7 confirms that the TROPOMI SO2 LH algorithm is able to derive reasonable SO2 heights, even for modest SO2 vertical columns.
3.3 Temporal analysis over degassing volcanoes
Apart from eruptive events, TROPOMI is able to detect SO2 emissions from degassing volcanoes worldwide (Queißer et al, 2019; Theys et al., 2019, 2021; Fioletov et al., 2020), and it is therefore important to test our SO2 LH algorithm on some of these volcanic emitters. Previous studies have shown that IASI is sensitive to weaker volcanic emissions as well (Clarisse et al., 2012; Taylor et al., 2018), and thus it is interesting to compare the TROPOMI and IASI height retrievals. For this, we have considered two complete years of data (2020 and 2021) and analyzed time series of daily height estimates from TROPOMI and IASI/MetOp-B over many different volcanic regions. Because of the limited sensitivity of the satellites, it is clear that not all comparisons were meaningful. However, for some volcanoes, the height of SO2 was regularly retrieved by both instruments over the studied period. Examples of results are shown in Fig. 8 for five active volcanoes, namely Sabancaya, Peru (15.78∘ S, 71.85∘ W, summit elevation: 5967 m), Popocatepetl, Mexico (19.02∘ N, 98.62∘ W, 5426 m), Tungurahua, Ecuador (1.47∘ S, 78.44∘ W, 5023 m), Nyiragongo, DR Congo (1.52∘ S, 29.25∘ E, 3470 m), and Fagradalsfjall, Iceland (63.90∘ N, 22.27∘ E, 385 m). Note that the IASI height retrievals are the same as already introduced in Sect. 3.1, except that additional criteria were applied to select the data with sufficient SO2 signal and to make the results comparable to TROPOMI. In particular, the same lower threshold of 5 DU for the vertical column is applied.
As can be seen from Fig. 8, a remarkable agreement is found between TROPOMI and IASI SO2 heights. For Sabancaya, it is noticeable that successful SO2 LH retrievals are frequent for both instruments. The reason is likely due to the relatively high SO2 columns there but also because Sabancaya is an elevated site characterized by a dry atmosphere. To some extent, this is also true for Popocatepetl and Tungurahua. On the contrary, a site such as Nyiragongo has a summit at lower altitude and a wet atmosphere, resulting in fewer IASI retrievals. Finally, for Fagradalsfjall, SO2 was emitted much lower in the atmosphere (mainly below 2 km height) than for the other cases. However, the match between TROPOMI and IASI is very good. In this case, IASI seems to be able to retrieve SO2 LH below 2 km. This is the result of dry conditions over Iceland for the studied period. Note that the time series for Fagradalsfjall covers only a few months, after its 2021 fissure eruption.

Figure 8Time series of SO2 height over five volcanic regions from TROPOMI and IASI/MetOp-B (daytime observations) for January 2020 to December 2021. Daily estimates of SO2 center of mass height were calculated from quality-filtered data using fixed latitude–longitude boxes (from top to bottom) for Sabancaya (12–20∘ S, 70–78∘ W), Popocatepetl (15–22∘ N, 96.5–102∘ W), Tungurahua (5∘ S–1∘ N, 77–83∘ W), Nyiragongo (5∘ S–3∘ N, 25–32∘ E), and Fagradalsfjall (60–70∘ N, 10–32∘ W). For IASI, the same VCD lower threshold of 5 DU as TROPOMI is applied to select the data. The calculated SO2 heights are shown only for days with at least 2 pixels. The mean and standard deviation of the differences between TROPOMI and IASI SO2 daily heights for the complete period are given as an inset for each plot.
Figure 8 indicates that TROPOMI tends to retrieve slightly lower SO2 heights than IASI by ∼ 0.5 km, although there is significant scatter in the height differences (standard deviation of about 1 km). The nature of this small systematic difference is unknown. However, this result nicely demonstrates the value of the LUT-COBRA approach to infer the height of SO2 for degassing volcanoes or modest eruptions. For plumes in the lower troposphere, more frequent SO2 heights are retrieved with TROPOMI than IASI, which is an appealing aspect of the algorithm.
We have presented a new algorithm to retrieve the SO2 layer height and vertical column from TROPOMI UV observations. The retrieval scheme combines a large look-up table to model the SO2 signal and an error-covariance-based approach, to represent the SO2-free contribution of the spectrum. The method minimizes atmospheric or instrument-related spectral interferences and reduces the SO2 layer height error by a factor of 2 to 3 compared to a DOAS-fashioned implementation of the algorithm. This enables derivation of the SO2 layer height with a precision better than 2 km for SO2 columns as low as 5 DU and for a wide range of conditions. This is a significant improvement compared to other existing UV retrievals, which are limited to scenes of at least 20 DU of SO2 columns.
We have demonstrated this approach on a number of eruptive events. Comparison with satellite IASI and CALIOP measurements and back-trajectory analyses indicate an agreement within 1–2 km, except for specific observation conditions. The presence of ash, in large amounts and at the same altitude as SO2, causes the retrieval to underestimate the SO2 height by several kilometers, in line with previous studies. Moreover, partially SO2-filled scenes underestimate the SO2 layer height, and this is mostly seen at plume edges. Despite these limitations, the performance of the algorithm is particularly good, especially for plumes below 10–12 km. We investigated the results against back-trajectory analysis from the PlumeTraj toolkit, for relatively modest eruptions of Mount Etna in 2021. Using column-weighted average heights of SO2, we found a very good agreement with PlumeTraj, even for total SO2 masses of a few kilotons. Capitalizing on this, the temporal evolution of TROPOMI SO2 plume height was studied over some of the largest degassing volcanoes, for a period of 2 years. An excellent correspondence is found between TROPOMI and IASI with a mean difference of −0.5 km. This highlights the high sensitivity of the proposed technique for the determination of plume height.
The algorithm is fast and could be adapted for near-real-time implementation and used, for example, in the Support to Aviation Control Service, or other volcanic monitoring applications. The SO2 height results could also be helpful as a constraint for atmospheric dispersion modeling.
Future developments will focus on possibly enhancing the algorithm sensitivity, improving the retrievals in the presence of aerosols, expanding the algorithm to stratospheric injection heights (e.g., the 2022 eruption of Hunga Tonga–Hunga Ha'apai), and producing a proper quality assurance flag.
Table A1Input settings used to generate radiative transfer simulation.
The TROPOMI COBRA SO2 layer height dataset is available from the corresponding author on request. The ULB IASI SO2 dataset is available from Lieven Clarisse on request. The output of the PlumeTraj tool is available from Mike Burton on request. NASA CALIPSO data can be downloaded from https://asdc.larc.nasa.gov/ (NASA, 2022).
NT prepared the paper and figures with contributions from all the coauthors. NT, CL, JvG, HB, IDS, and MVR contributed to the development of the LUT-COBRA, processing of the data, and satellite comparison. LC analyzed and provided IASI data. MV, CH, BE and MB analyzed and provided PlumeTraj data. All authors contributed to the interpretation of the results and improvement of the paper.
At least one of the (co-)authors is a member of the editorial board of Atmospheric Measurement Techniques. The peer-review process was guided by an independent editor, and the authors also have no other competing interests to declare.
Publisher’s note: Copernicus Publications remains neutral with regard to jurisdictional claims in published maps and institutional affiliations.
We thank EU/ESA/KNMI/DLR for providing the TROPOMI/S5P Level 1 and Level 2 products. This paper contains modified Copernicus data (2018/2020) processed by BIRA-IASB. Lieven Clarisse is a research associate supported by the Belgian F.R.S-FNRS.
This research has been supported by ESA Level-2 Prototype Processor of the future Copernicus Sentinel- 5 satellite (contract no. 4000118463/16/NL/AI), ESA S5P MPC (grant no. 4000117151/16/I-LG), Belgium Prodex TRACE-S5P (grant no. PEA 5 4000105598), Horizon 2020 EUNADICS-AV (grant no. 723986), SESAR H2020 ALARM, and the OPAS Engage-KTN (grant no. 783287) projects. The ALARM project has received funding from the SESAR Joint Undertaking (JU) (grant no. 891467). The JU receives support from the European Union’s Horizon 2020 research and innovation programme and the SESAR JU members other than the those in the European Union.
This paper was edited by Lars Hoffmann and reviewed by three anonymous referees.
Aliwell, S. R., Van Roozendael, M., Johnston, P. V., Richter, A., Wagner, T., Arlander, D. W., Burrows, J. P., Fish, D. J., Jones, R. L., Tørnkvist, K. K., Lambert, J.-C., Pfeilsticker, K., and Pundt, I.: Analysis for BrO in zenith-sky spectra: An intercomparison exercise for analysis improvement, J. Geophys. Res., 107, ACH 10-1–ACH 10-20, https://doi.org/10.1029/2001JD000329, 2002.
Beirle, S., Sihler, H., and Wagner, T.: Linearisation of the effects of spectral shift and stretch in DOAS analysis, Atmos. Meas. Tech., 6, 661–675, https://doi.org/10.5194/amt-6-661-2013, 2013.
Bogumil, K., Orphal, J., Homann, T., Voigt, S., Spietz, P., Fleischmann, O., Vogel, A., Hartmann, M., Bovensmann, H., Frerick, J., and Burrows, J. P.: Measurements of molecular absorption spectra with the SCIAMACHY Pre-Flight Model: instrument characterization and reference data for atmospheric remote-sensing in the 230–2380 nm region, J. Photoch. Photobio. A, 157, 167–184, 2003.
Brenot, H., Theys, N., Clarisse, L., van Geffen, J., van Gent, J., Van Roozendael, M., van der A, R., Hurtmans, D., Coheur, P.-F., Clerbaux, C., Valks, P., Hedelt, P., Prata, F., Rasson, O., Sievers, K., and Zehner, C.: Support to Aviation Control Service (SACS): an online service for near-real-time satellite monitoring of volcanic plumes, Nat. Hazards Earth Syst. Sci., 14, 1099–1123, https://doi.org/10.5194/nhess-14-1099-2014, 2014.
Brenot, H., Theys, N., Clarisse, L., van Gent, J., Hurtmans, D. R., Vandenbussche, S., Papagiannopoulos, N., Mona, L., Virtanen, T., Uppstu, A., Sofiev, M., Bugliaro, L., Vázquez-Navarro, M., Hedelt, P., Parks, M. M., Barsotti, S., Coltelli, M., Moreland, W., Scollo, S., Salerno, G., Arnold-Arias, D., Hirtl, M., Peltonen, T., Lahtinen, J., Sievers, K., Lipok, F., Rüfenacht, R., Haefele, A., Hervo, M., Wagenaar, S., Som de Cerff, W., de Laat, J., Apituley, A., Stammes, P., Laffineur, Q., Delcloo, A., Lennart, R., Rokitansky, C.-H., Vargas, A., Kerschbaum, M., Resch, C., Zopp, R., Plu, M., Peuch, V.-H., Van Roozendael, M., and Wotawa, G.: EUNADICS-AV early warning system dedicated to supporting aviation in the case of a crisis from natural airborne hazards and radionuclide clouds, Nat. Hazards Earth Syst. Sci., 21, 3367–3405, https://doi.org/10.5194/nhess-21-3367-2021, 2021.
Burton, M., Hayer, C., Miller, C., and Christenson, B.: Insights into the 9 December 2019 eruption of Whakaari/White Island from analysis of TROPOMI SO2 imagery, Science Advances, 7, eabg1218, https://doi.org/10.1126/sciadv.abg1218, 2021.
Cai, Z., Griessbach, S., and Hoffmann, L.: Improved estimation of volcanic SO2 injections from satellite retrievals and Lagrangian transport simulations: the 2019 Raikoke eruption, Atmos. Chem. Phys., 22, 6787–6809, https://doi.org/10.5194/acp-22-6787-2022, 2022.
Carboni, E., Grainger, R., Walker, J., Dudhia, A., and Siddans, R.: A new scheme for sulphur dioxide retrieval from IASI measurements: application to the Eyjafjallajökull eruption of April and May 2010, Atmos. Chem. Phys., 12, 11417–11434, https://doi.org/10.5194/acp-12-11417-2012, 2012.
Carn, S. A., Clarisse, L. & Prata, A. J. Multi-decadal satellite measurements of global volcanic degassing. J. Volcanol. Geoth. Res., 311, 99–134, https://doi.org/10.1016/j.jvolgeores.2016.01.002, 2016.
Chance, K. and Kurucz, R. L.: An improved high-resolution solar reference spectrum for earth's atmosphere measurements in the ultraviolet, visible, and near infrared, J. Quant. Spectrosc. Ra., 111, 1289–1295, 2010.
Clarisse, L., Hurtmans, D., Clerbaux, C., Hadji-Lazaro, J., Ngadi, Y., and Coheur, P.-F.: Retrieval of sulphur dioxide from the infrared atmospheric sounding interferometer (IASI), Atmos. Meas. Tech., 5, 581–594, https://doi.org/10.5194/amt-5-581-2012, 2012.
Clarisse, L., Coheur, P.-F., Theys, N., Hurtmans, D., and Clerbaux, C.: The 2011 Nabro eruption, a SO2 plume height analysis using IASI measurements, Atmos. Chem. Phys., 14, 3095–3111, https://doi.org/10.5194/acp-14-3095-2014, 2014.
de Leeuw, J., Schmidt, A., Witham, C. S., Theys, N., Taylor, I. A., Grainger, R. G., Pope, R. J., Haywood, J., Osborne, M., and Kristiansen, N. I.: The 2019 Raikoke volcanic eruption – Part 1: Dispersion model simulations and satellite retrievals of volcanic sulfur dioxide, Atmos. Chem. Phys., 21, 10851–10879, https://doi.org/10.5194/acp-21-10851-2021, 2021.
Efremenko, D. S., Loyola R., D. G., Hedelt, P., and Spurr, R. J. D.: Volcanic SO2 plume height retrieval from UV sensors using a full-physics inverse learning machine algorithm, Int. J. Remote Sens., 38, 1–27, https://doi.org/10.1080/01431161.2017.1348644, 2017.
Fedkin, N. M., Li, C., Krotkov, N. A., Hedelt, P., Loyola, D. G., Dickerson, R. R., and Spurr, R.: Volcanic SO2 effective layer height retrieval for the Ozone Monitoring Instrument (OMI) using a machine-learning approach, Atmos. Meas. Tech., 14, 3673–3691, https://doi.org/10.5194/amt-14-3673-2021, 2021.
Fioletov, V., McLinden, C. A., Griffin, D., Theys, N., Loyola, D. G., Hedelt, P., Krotkov, N. A., and Li, C.: Anthropogenic and volcanic point source SO2 emissions derived from TROPOMI on board Sentinel-5 Precursor: first results, Atmos. Chem. Phys., 20, 5591–5607, https://doi.org/10.5194/acp-20-5591-2020, 2020.
Garane, K., Koukouli, M.-E., Verhoelst, T., Lerot, C., Heue, K.-P., Fioletov, V., Balis, D., Bais, A., Bazureau, A., Dehn, A., Goutail, F., Granville, J., Griffin, D., Hubert, D., Keppens, A., Lambert, J.-C., Loyola, D., McLinden, C., Pazmino, A., Pommereau, J.-P., Redondas, A., Romahn, F., Valks, P., Van Roozendael, M., Xu, J., Zehner, C., Zerefos, C., and Zimmer, W.: TROPOMI/S5P total ozone column data: global ground-based validation and consistency with other satellite missions, Atmos. Meas. Tech., 12, 5263–5287, https://doi.org/10.5194/amt-12-5263-2019, 2019.
Hedelt, P., Efremenko, D. S., Loyola, D. G., Spurr, R., and Clarisse, L.: Sulfur dioxide layer height retrieval from Sentinel-5 Precursor/TROPOMI using FP_ILM, Atmos. Meas. Tech., 12, 5503–5517, https://doi.org/10.5194/amt-12-5503-2019, 2019.
Hyman, D. M. and Pavolonis, M. J.: Probabilistic retrieval of volcanic SO2 layer height and partial column density using the Cross-track Infrared Sounder (CrIS), Atmos. Meas. Tech., 13, 5891–5921, https://doi.org/10.5194/amt-13-5891-2020, 2020.
Koukouli, M.-E., Michailidis, K., Hedelt, P., Taylor, I. A., Inness, A., Clarisse, L., Balis, D., Efremenko, D., Loyola, D., Grainger, R. G., and Retscher, C.: Volcanic SO2 layer height by TROPOMI/S5P: evaluation against IASI/MetOp and CALIOP/CALIPSO observations, Atmos. Chem. Phys., 22, 5665–5683, https://doi.org/10.5194/acp-22-5665-2022, 2022.
Lamsal, L. N., Weber, M., Tellmann, S., and Burrows, J. P.: Ozone column classified climatology of ozone and temperature profiles based on ozonesonde and satellite data, J. Geophys. Res., 109, D20304, https://doi.org/10.1029/2004JD004680, 2004.
Lerot, C., Van Roozendael, M., Spurr, R., Loyola, D., Coldewey-Egbers, M., Kochenova, S., Van Gent, J., Koukouli, M., Balis, D., Lambert, J.-C., Granville, J., and Zehner, C.: Homogenized total ozone data records from the European sensors GOME/ERS-2, SCIAMACHY/Envisat, and GOME-2/MetOp-A, J. Geophys. Res.-Atmos., 119, 1639–1662, https://doi.org/10.1002/2013JD020831, 2014.
Levelt, P. F., van den Oord, G. H., Dobber, M. R., Malkki, A., Visser, H., de Vries, J., Stammes, P., Lundell, J. O., and Saari, H.: The ozone monitoring instrument, IEEE T. Geosci. Remote, 44, 1093–1101, 2006.
Loyola, D. G., Gimeno García, S., Lutz, R., Argyrouli, A., Romahn, F., Spurr, R. J. D., Pedergnana, M., Doicu, A., Molina García, V., and Schüssler, O.: The operational cloud retrieval algorithms from TROPOMI on board Sentinel-5 Precursor, Atmos. Meas. Tech., 11, 409–427, https://doi.org/10.5194/amt-11-409-2018, 2018.
Mastin, L. G., Guffanti, M., Servranckx, R., Webley, P., Barsotti, S., Dean, K., Durant, A., Ewert, J. W., Neri, A., Rose, W. I., Schneider, D., Siebert, L., Stunder, B., Swanson, G., Tupper, A., Volentik, A., and Waythomas, C. F.: A multidisciplinary effort to assign realistic source parameters to models of volcanic ash-cloud transport and dispersion during eruptions, J. Volcanol. Geoth. Res., 186, 10–21, https://doi.org/10.1016/j.jvolgeores.2009.01.008, 2009.
Munro, R., Eisinger, M., Anderson, C., Callies, J., Corpaccioli, E., Lang, R., Lefebvre, A., Livschitz, Y., and Albiñana, A. P.: GOME-2 on MetOp, in: Proc. of the 2006 EUMETSAT Meteo- rological Satellite Conference, Helsinki, Finland, 12–16 June 2006, p. 48, EUMET-SAT, https://www.eumetsat.int/media/4899 (last access; 30 March 2022), 2006.
Muser, L. O., Hoshyaripour, G. A., Bruckert, J., Horváth, Á., Malinina, E., Wallis, S., Prata, F. J., Rozanov, A., von Savigny, C., Vogel, H., and Vogel, B.: Particle aging and aerosol–radiation interaction affect volcanic plume dispersion: evidence from the Raikoke 2019 eruption, Atmos. Chem. Phys., 20, 15015–15036, https://doi.org/10.5194/acp-20-15015-2020, 2020.
NASA: Standard CALIOP level-2 v4 product (CAL_LID_L2_05kmAPro-Standard-V4), https://asdc.larc.nasa.gov/, last access: 30 March 2022.
Nowlan, C. R., Liu, X., Chance, K., Cai, Z., Kurosu, T. P., Lee, C., and Martin, R. V.: Retrievals of sulfur dioxide from the Global Ozone Monitoring Experiment 2 (GOME-2) using an optimal estimation approach: Algorithm and initial validation, J. Geophys. Res., 116, D18301, https://doi.org/10.1029/2011JD015808, 2011.
Pardini, F., Burton, M., de' Michieli Vitturi, M., Corradini, S., Salerno, G., Merucci, L., and Di Grazia, G.: Retrieval and intercomparison of volcanic SO2 injection height and eruption time from satellite maps and ground-based observations, J. Volcanol. Geoth. Res., 331, 79–91, 2017.
Pardini, F., Burton, M., Arzilli, F., La Spina, G., and Polacci, M.: SO2 emissions, plume heights and magmatic processes inferred from satellite data: The 2015 Calbuco eruptions, J. Volcanol. Geoth. Res., 361, 12–24, 2018.
Platt, U. and Stutz, J.: Differential Optical Absorption Spectroscopy (DOAS), Principle and Applications, edited by: Guzzi, R., Imboden, D., Lanzerotti, L. J., and Platt, U., Springer Verlag, Heidelberg, ISBN 3-340-21193-4, 2008.
Queißer, M., Burton, M., Theys, N., Pardini, F., Salerno, G., Caltiabiano, T., Varnham, M., Esse, B., and Kazahaya, R.: TROPOMI enables high resolution SO2 flux observations from Mt. Etna (Italy), and beyond, Nature Scientific Reports, 9, 957, https://doi.org/10.1038/s41598-018-37807-w, 2019.
Robock, A.: Volcanic eruptions and climate, Rev. Geophys., 38, 191–219, https://doi.org/10.1029/1998RG000054, 2000.
Rodgers, C. D.: Inverse Methods for Atmospheric Sounding, Theory and Practice, World Scientific Publishing, Singapore-New-Jersey-London-Hong Kong, ISBN 981-02-2740-X, 2000.
Santer, B. D., Bonfils, C., Painter, J. F., Zelinka, M. D., Mears, C., Solomon, S., Schmidt, G. A., Fyfe, J. C., Cole, J. N. S., Nazarenko, L., Taylor, K. E., and Wentz, F. J.: Volcanic contribution to decadal changes in tropospheric temperature, Nat. Geosci., 7, 185–189, https://doi.org/10.1038/ngeo2098, 2014.
Schmidt, A., Leadbetter, S., Theys, N., Carboni, E., Witham, C. S., Stevenson, J. A., Birch, C. E., Thordarson, T., Turnock, S., Barsotti, S., Delaney, L., Feng, W., Grainger, R. G., Hort, M. C., Höskuldsson, A., Ialongo, I., Ilyanskaya, E., Jóhannsson, T., Kenny, P., Mather, T. A., Richards, N. A. D., and Sheperd, J.: Satellite detection, long-range transport and air quality impacts of volcanic sulfur dioxide from the 2014–15 flood lava eruption at Bárðarbunga (Iceland), J. Geophys. Res.-Atmos., 120, 9739–9757, https://doi.org/10.1002/2015JD023638, 2015.
Scollo, S., Prestifilippo, M., Pecora, E., Corradini, S., Merucci, L., Spata, G., and Coltelli, M.: Eruption column height estimation of the 2011–2013 Etna lava fountains, Ann. Geophys, 57, S0214, https://doi.org/10.4401/ag-6396, 2014.
Serdyuchenko, A., Gorshelev, V., Weber, M., Chehade, W., and Burrows, J. P.: High spectral resolution ozone absorption cross-sections – Part 2: Temperature dependence, Atmos. Meas. Tech., 7, 625–636, https://doi.org/10.5194/amt-7-625-2014, 2014.
Solomon, S., Daniel, J. S., Neely, R. R., Vernier, J. P., Dutton, E. G., and Thomason, L. W.: The persistently Variable ”Background” Stratospheric Aerosol Layer and Global Climate Change, Science, 333, 866–870, https://doi.org/10.1126/science.1206027, 2011.
Spurr, R. J. D., de Haan, J., van Oss, R., and Vasilkov, A.: Discrete Ordinate Theory in a Stratified Medium with First Order Rotational Raman Scattering; a General Quasi-Analytic Solution, J. Quant. Spectrosc. Ra., 109, 404–425, https://doi.org/10.1016/j.jqsrt.2007.08.011, 2008.
Stein, A. F., Draxler, R. R., Rolph, G. D., Stunder, B. J. B., Cohen, M. D., and Ngan, F.: NOAA's HYSPLIT Atmospheric Transport and Dispersion Modeling System, B. Am. Meteorol. Soc., 96, 2059–2077, https://doi.org/10.1175/BAMS-D-14-00110.1, 2015.
Taylor, I. A., Preston, J., Carboni, E., Mather, T. A., Grainger, R. G., Theys, N., Hidalgo, S., and McCormick Kilbride, B.: Exploring the utility of IASI for monitoring volcanic SO2 emissions, J. Geophys. Res.-Atmos., 123, 5588–5606, https://doi.org/10.1002/2017JD027109, 2018.
Theys, N., De Smedt, I., Yu, H., Danckaert, T., van Gent, J., Hörmann, C., Wagner, T., Hedelt, P., Bauer, H., Romahn, F., Pedergnana, M., Loyola, D., and Van Roozendael, M.: Sulfur dioxide retrievals from TROPOMI onboard Sentinel-5 Precursor: algorithm theoretical basis, Atmos. Meas. Tech., 10, 119–153, https://doi.org/10.5194/amt-10-119-2017, 2017.
Theys, N., Hedelt, P., De Smedt, I., Lerot, C., Yu, H., Vlietinck, J., Pedergnana, M., Arellano, S., Galle, B., Fernandez, D., Carlito, C. J. M., Barrington, C., Taisne, B., Delgado-Granados, H., Loyola, D., and Van Roozendael, M.: Global monitoring of volcanic SO2 degassing with unprecedented resolution from TROPOMI onboard Sentinel-5 Precursor, Nature Scientific Reports, 9, 2643, https://doi.org/10.1038/s41598-019-39279-y, 2019.
Theys, N., Fioletov, V., Li, C., De Smedt, I., Lerot, C., McLinden, C., Krotkov, N., Griffin, D., Clarisse, L., Hedelt, P., Loyola, D., Wagner, T., Kumar, V., Innes, A., Ribas, R., Hendrick, F., Vlietinck, J., Brenot, H., and Van Roozendael, M.: A sulfur dioxide Covariance-Based Retrieval Algorithm (COBRA): application to TROPOMI reveals new emission sources, Atmos. Chem. Phys., 21, 16727–16744, https://doi.org/10.5194/acp-21-16727-2021, 2021.
Veefkind, J. P., Aben, I., McMullan, K., Förster, H., de Vries, J., Otter, G., Claas, J., Eskes, H. J., de Haan, J. F., Kleipool, Q., van Weele, M., Hasekamp, O., Hoogeven, R., Landgraf, J., Snel, R., Tol, P., Ingmann, P., Voors, R., Kruizinga, B., Vink, R., Visser, H., and Levelt, P. F.: TROPOMI on the ESA Sentinel-5 Precursor: A GMES mission for global observations of the atmospheric composition for climate, air quality and ozone layer applications, Remote Sens. Environ., 120, 70–83, https://doi.org/10.1016/j.rse.2011.09.027, 2012.
Vernier, J.-P., Thomason, L.W., Pommereau, J.-P., Bourassa, A., Pelon, J., Garnier, A., Hauchecorne, A., Blanot, L., Trepte, C., Degnestein, D., and Vargas, F.: Major influence of tropical volcanic eruptions on the stratospheric aerosol layer during the last decade, Geophys. Res. Lett., 38, L12807, https://doi.org/10.1029/2011GL047563, 2011.
Vernier, J.-P., et al.: The SPARC-SSiRC Volcano Response activities after 2019 Raikoke eruption, Atmos. Chem. Phys., in preparation, 2022.
Walker, J. C., Dudhia, A., and Carboni, E.: An effective method for the detection of trace species demonstrated using the MetOp Infrared Atmospheric Sounding Interferometer, Atmos. Meas. Tech., 4, 1567–1580, https://doi.org/10.5194/amt-4-1567-2011, 2011.
Wu, X., Griessbach, S., and Hoffmann, L.: Equatorward dispersion of a high-latitude volcanic plume and its relation to the Asian summer monsoon: a case study of the Sarychev eruption in 2009, Atmos. Chem. Phys., 17, 13439–13455, https://doi.org/10.5194/acp-17-13439-2017, 2017.
Yang, K., Liu, X., Bhartia, P., Krotkov, N., Carn, S., Hughes, E., Krueger, A., Spurr, R., and Trahan, S.: Direct retrieval of sulfur dioxide amount and altitude from spaceborne hyperspectral UV measurements: Theory and application, J. Geophys. Res., 115, D00L09, https://doi.org/10.1029/2010JD013982, 2010.