the Creative Commons Attribution 4.0 License.
the Creative Commons Attribution 4.0 License.
 | 29 Aug 2022
Comparison of airborne measurements of NO, NO2, HONO, NOy, and CO during FIREX-AQ
Ilann Bourgeois
J. Andrew Neuman
Steven S. Brown
Hannah M. Allen
Pedro Campuzano-Jost
Matthew M. Coggon
Joshua P. DiGangi
Glenn S. Diskin
Jessica B. Gilman
Georgios I. Gkatzelis
Hongyu Guo
Hannah A. Halliday
Thomas F. Hanisco
Christopher D. Holmes
L. Gregory Huey
Jose L. Jimenez
Aaron D. Lamplugh
Young Ro Lee
Jakob Lindaas
Richard H. Moore
Benjamin A. Nault
John B. Nowak
Demetrios Pagonis
Pamela S. Rickly
Michael A. Robinson
Andrew W. Rollins
Vanessa Selimovic
Jason M. St. Clair
David Tanner
Krystal T. Vasquez
Patrick R. Veres
Carsten Warneke
Paul O. Wennberg
Rebecca A. Washenfelder
Elizabeth B. Wiggins
Caroline C. Womack
Kyle J. Zarzana
Thomas B. Ryerson
We present a comparison of fast-response instruments installed onboard the NASA DC-8 aircraft that measured nitrogen oxides (NO and NO2), nitrous acid (HONO), total reactive odd nitrogen (measured both as the total (NOy) and from the sum of individually measured species (ΣNOy)), and carbon monoxide (CO) in the troposphere during the 2019 Fire Influence on Regional to Global Environments and Air Quality (FIREX-AQ) campaign. By targeting smoke from summertime wildfires, prescribed fires, and agricultural burns across the continental United States, FIREX-AQ provided a unique opportunity to investigate measurement accuracy in concentrated plumes where hundreds of species coexist. Here, we compare NO measurements by chemiluminescence (CL) and laser-induced fluorescence (LIF); NO2 measurements by CL, LIF, and cavity-enhanced spectroscopy (CES); HONO measurements by CES and iodide-adduct chemical ionization mass spectrometry (CIMS); and CO measurements by tunable diode laser absorption spectrometry (TDLAS) and integrated cavity output spectroscopy (ICOS). Additionally, total NOy measurements using the CL instrument were compared with ΣNOy (= NO + NO2 + HONO + nitric acid (HNO3) + acyl peroxy nitrates (APNs) + submicrometer particulate nitrate (pNO3)). Other NOy species were not included in ΣNOy as they either contributed minimally to it (e.g., C1–C5 alkyl nitrates, nitryl chloride (ClNO2), dinitrogen pentoxide (N2O5)) or were not measured during FIREX-AQ (e.g., higher oxidized alkyl nitrates, nitrate (NO3), non-acyl peroxynitrates, coarse-mode aerosol nitrate). The aircraft instrument intercomparisons demonstrate the following points: (1) NO measurements by CL and LIF agreed well within instrument uncertainties but with potentially reduced time response for the CL instrument; (2) NO2 measurements by LIF and CES agreed well within instrument uncertainties, but CL NO2 was on average 10 % higher; (3) CES and CIMS HONO measurements were highly correlated in each fire plume transect, but the correlation slope of CES vs. CIMS for all 1 Hz data during FIREX-AQ was 1.8, which we attribute to a reduction in the CIMS sensitivity to HONO in high-temperature environments; (4) NOy budget closure was demonstrated for all flights within the combined instrument uncertainties of 25 %. However, we used a fluid dynamic flow model to estimate that average pNO3 sampling fraction through the NOy inlet in smoke was variable from one flight to another and ranged between 0.36 and 0.99, meaning that approximately 0 %–24 % on average of the total measured NOy in smoke may have been unaccounted for and may be due to unmeasured species such as organic nitrates; (5) CO measurements by ICOS and TDLAS agreed well within combined instrument uncertainties, but with a systematic offset that averaged 2.87 ppbv; and (6) integrating smoke plumes followed by fitting the integrated values of each plume improved the correlation between independent measurements.
- Article
(5778 KB) - Full-text XML
-
Supplement
(3388 KB) - BibTeX
- EndNote


Biomass burning (BB) can take multiple forms (e.g., wildfires, prescribed fires, agricultural burns, grass fires, peat fires) and accounts for a large fraction of global carbon emissions with consequences for climate (Bowman et al., 2009; van der Werf et al., 2010, 2017) and biogeochemical cycles (Crutzen and Andreae, 2016). BB also contributes substantially to the atmospheric burden of trace gases and aerosols (Andreae, 2019), causing poor air quality on regional to continental scales (Jaffe et al., 2020; O'Dell et al., 2019; Wotawa, 2000) and posing a major threat to public health (Johnston et al., 2012, 2021). In the United States (US), wildfires mainly occur in the western states and in Alaska and burned over 18 000 km2 in 2019 (US National Interagency Fire Center, https://www.nifc.gov/fire-information, last access: 15 November 2021). Wildfire frequency and severity are predicted to increase in response to a warmer, drier climate (Burke et al., 2021; Westerling, 2016) and also to increasing human-caused ignition (Balch et al., 2017). In comparison, prescribed fires, which are common practice in the southeastern US, burned an estimated 40 000 km2 in 2019, to which agricultural burns added another 8000–12 000 km2 (Melvin, 2020). While agricultural burns are usually smaller and less intense than wildfires or prescribed fires, they occur more frequently and throughout the whole year and can significantly impact local air quality (Dennis et al., 2002; McCarty, 2011).
Rising interest in the impact of fires on climate and air quality over the past decades has resulted in a series of laboratory studies of BB emissions in the US, such as the FLAME-4 experiment in 2012 (e.g., Stockwell et al., 2014) and the FIRELAB study in 2016 (e.g., Selimovic et al., 2018). Recent large-scale field studies such as AMMA (e.g., Liousse et al., 2010), BBOP (e.g., Collier et al., 2016), and WE-CAN (e.g., Juncosa Calahorrano et al., 2021) have been dedicated to sampling and characterizing emissions and atmospheric chemistry from fires. The focus of the joint National Oceanic and Atmospheric Administration (NOAA)/National Aeronautics and Space Administration (NASA) Fire Influence on Regional to Global Environments and Air Quality (FIREX-AQ) airborne campaign was to provide comprehensive observations to investigate the impact of summer time wildfires, prescribed fires, and agricultural burns on air quality and climate across the conterminous US (Warneke et al., 2022).
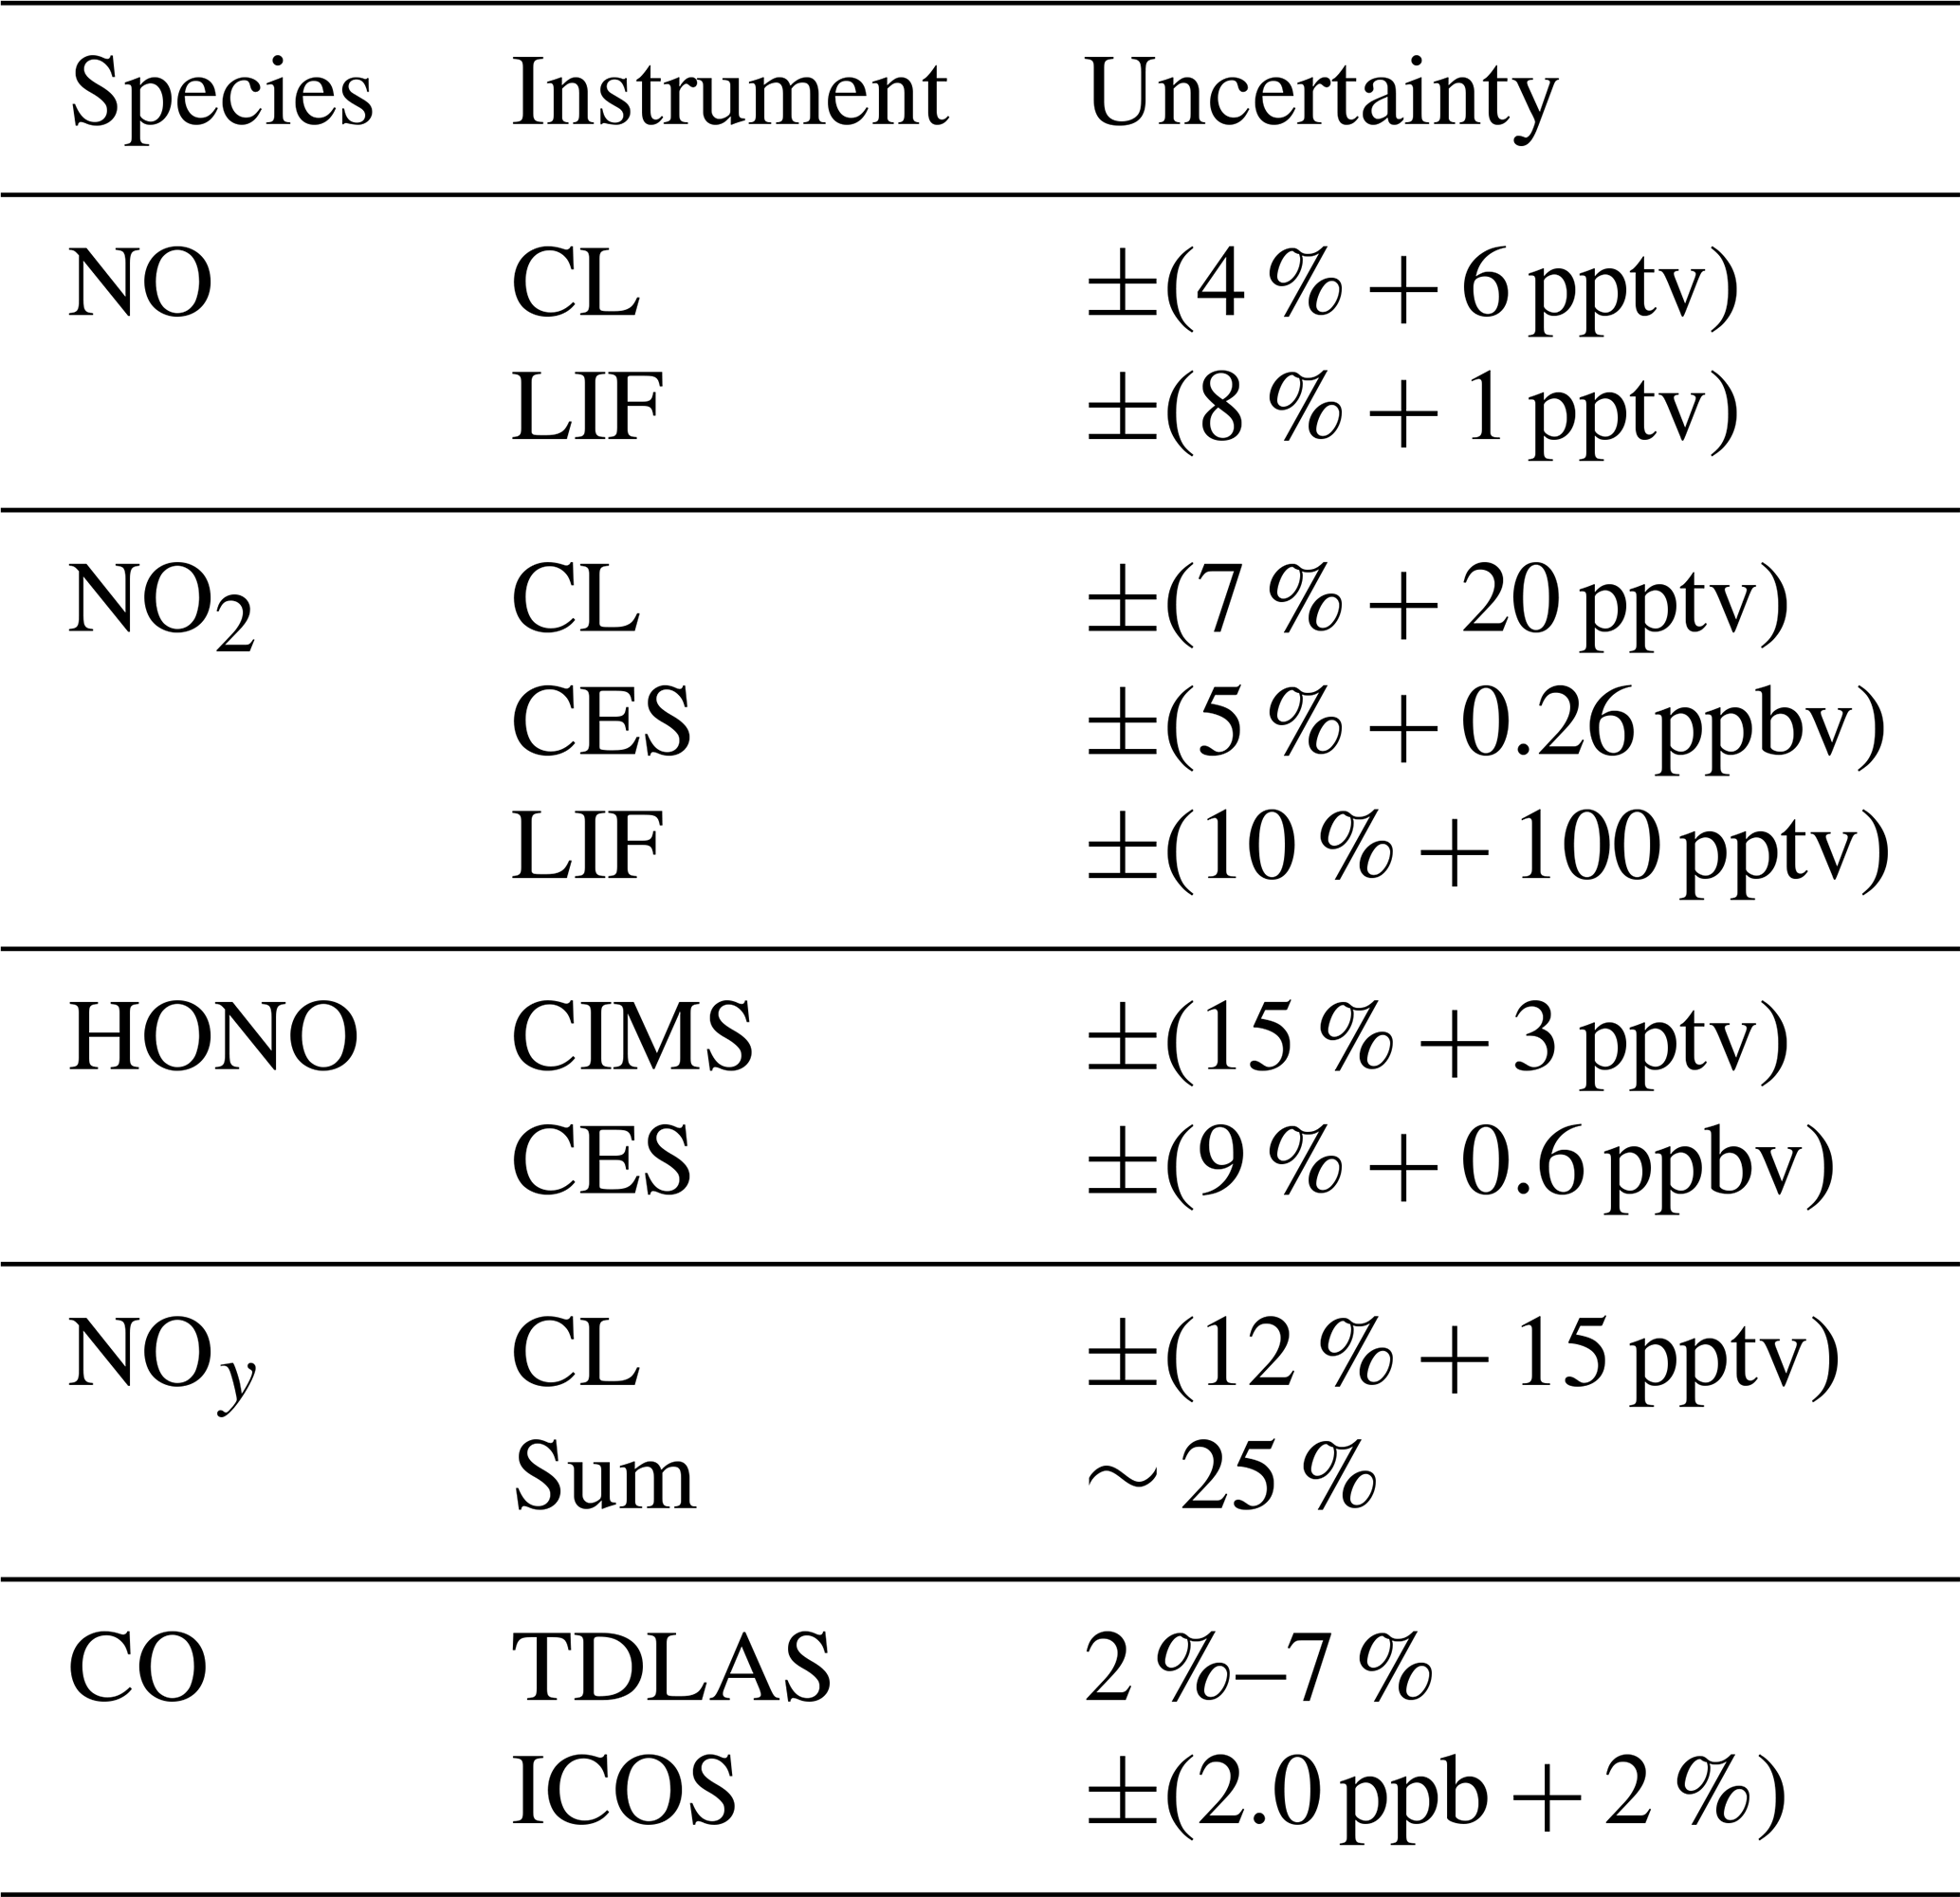
Accurate measurements facilitate understanding of fire emissions, processing, and impacts. In situ, fast-response measurements of trace gases in the atmosphere conducted from airborne platforms provide unique datasets that enhance our understanding of atmospheric composition and chemistry. One method for evaluating measurement accuracy is by comparison of independent measurements using different techniques. A relatively small body of literature reported comparisons of methods for in-flight detection of tropospheric carbon monoxide (CO) and reactive odd nitrogen species measured both as the total (NOy) and from the sum of individually measured species (ΣNOy), and these studies have shown that such comparisons are valuable for identifying instrument artifacts and quantifying measurement uncertainties (Eisele et al., 2003; Gregory et al., 1990a, b; Hoell et al., 1987a, b; Sparks et al., 2019). During FIREX-AQ, a large suite of airborne instruments, detailed in the following sections, performed independent in situ tropospheric measurements of one or more fire-science-relevant reactive nitrogen species and CO aboard the NASA DC-8 aircraft (Table 1). Additionally, FIREX-AQ provides a unique opportunity to investigate measurement accuracy in concentrated smoke plumes where hundreds of species coexist.
Table 1List of measured species and instruments, including the corresponding uncertainties, during FIREX-AQ. For uncertainties given as ±(x % ± y pptv), x represents the accuracy and y represents the 2σ precision in 1 s.
Nitric oxide (NO) and nitrogen dioxide (NO2) are among the largest components of the reactive nitrogen budget emitted by biomass burning and are produced by the oxidation of reduced nitrogen species present in the fuel in the flaming stage of combustion (Roberts et al., 2020). NOx, defined as the sum of NO and NO2, directly affects atmospheric oxidation rates and ozone (O3) production within fire plumes (Bourgeois et al., 2021; Robinson et al., 2021; Xu et al., 2022). It also contributes to the formation of secondary aerosols and N transport and deposition to ecosystems downwind (Galloway et al., 2003; Kroll and Seinfeld, 2008; Ziemann and Atkinson, 2012). Therefore, two independent NO measurements and three independent NO2 measurements were part of FIREX-AQ to provide continuous in situ observations, as described in Sect. 2 below.
Nitrous acid (HONO) is emitted directly to the atmosphere through various combustion processes including BB. The rapid production of OH from HONO at the early stage of smoke plume formation (Peng et al., 2020) results in rapid initiation of photochemistry, with a strong influence on downwind chemical evolution of smoke plumes Robinson et al., 2021; Theys et al., 2020).
Total NOy can be measured through conversion of individual species to NO (Fahey et al., 1985). It is a more conserved tracer for NOx emissions than NOx itself since it accounts for NOx oxidation products, and it provides a mean to assess the accuracy of ΣNOy budget closure from a mass balance approach (Bollinger et al., 1983; Fahey et al., 1986; Williams et al., 1997). Fahey et al. (1986) define ΣNOy as the sum of important nitrogen species, as illustrated by Eq. (1).
Other nitrogen compounds that can contribute to ΣNOy include alkyl nitrates (Day et al., 2003), acyl peroxynitrates (APNs; Juncosa Calahorrano et al., 2021), non-acyl peroxynitrates (RO2NO2; Murphy et al., 2004), nitryl chloride (ClNO2; Kenagy et al., 2018), and nitro compounds and nitroaromatics (Decker et al., 2021).
Carbon monoxide (CO) is emitted from incomplete combustion in fires and other sources, and is especially important for characterizing the combustion stage of fires (i.e., flaming vs. smoldering) through the use of the modified combustion efficiency (Yokelson et al., 1996). Due to its relatively long chemical lifetime, CO is commonly used as a conserved tracer to account for dilution with ambient air as smoke plumes are transported downwind, and accurate CO measurements are necessary to better constrain emission factors (EFs) used in emission inventories.
This study builds on past airborne instrument comparisons and extends these analyses to a new species (HONO), new measurement techniques (the first airborne deployment of the NOAA NO-LIF (laser-induced fluorescence) and the NOAA CO-ICOS (integrated cavity output spectroscopy) instruments) and new environments (concentrated fire smoke). In this paper we present a comparison of NO, NO2, HONO, NOy, and CO measurements, which are compounds of major interest for fire-related science, air quality, and climate. First, we describe the FIREX-AQ campaign, the deployed instruments, and the methodology used to perform the comparisons. Following this, we provide a detailed instrument comparison for each species.
2.1 FIREX-AQ airborne mission
The FIREX-AQ campaign (https://www-air.larc.nasa.gov/missions/firex-aq/index.html, last access: 15 February 2022; https://www.esrl.noaa.gov/csl/projects/firex-aq/, last access: 15 November 2021) took place from July to September 2019. FIREX-AQ included the deployment of multiple aircraft and mobile platforms over the course of the campaign; however, this study focuses on the heavily instrumented NASA DC-8 aircraft. The NASA DC-8 portion of the project achieved two flights over the Los Angeles (LA) Basin and the Central Valley in California, 13 flights originating from Boise in Idaho, and 7 flights based out of Salina in Kansas. The flights from Boise were conducted over the western US to sample smoke from wildfires, while the flights from Salina focused on agricultural and prescribed burns (hereafter referred to as eastern fires) in the southeastern US.
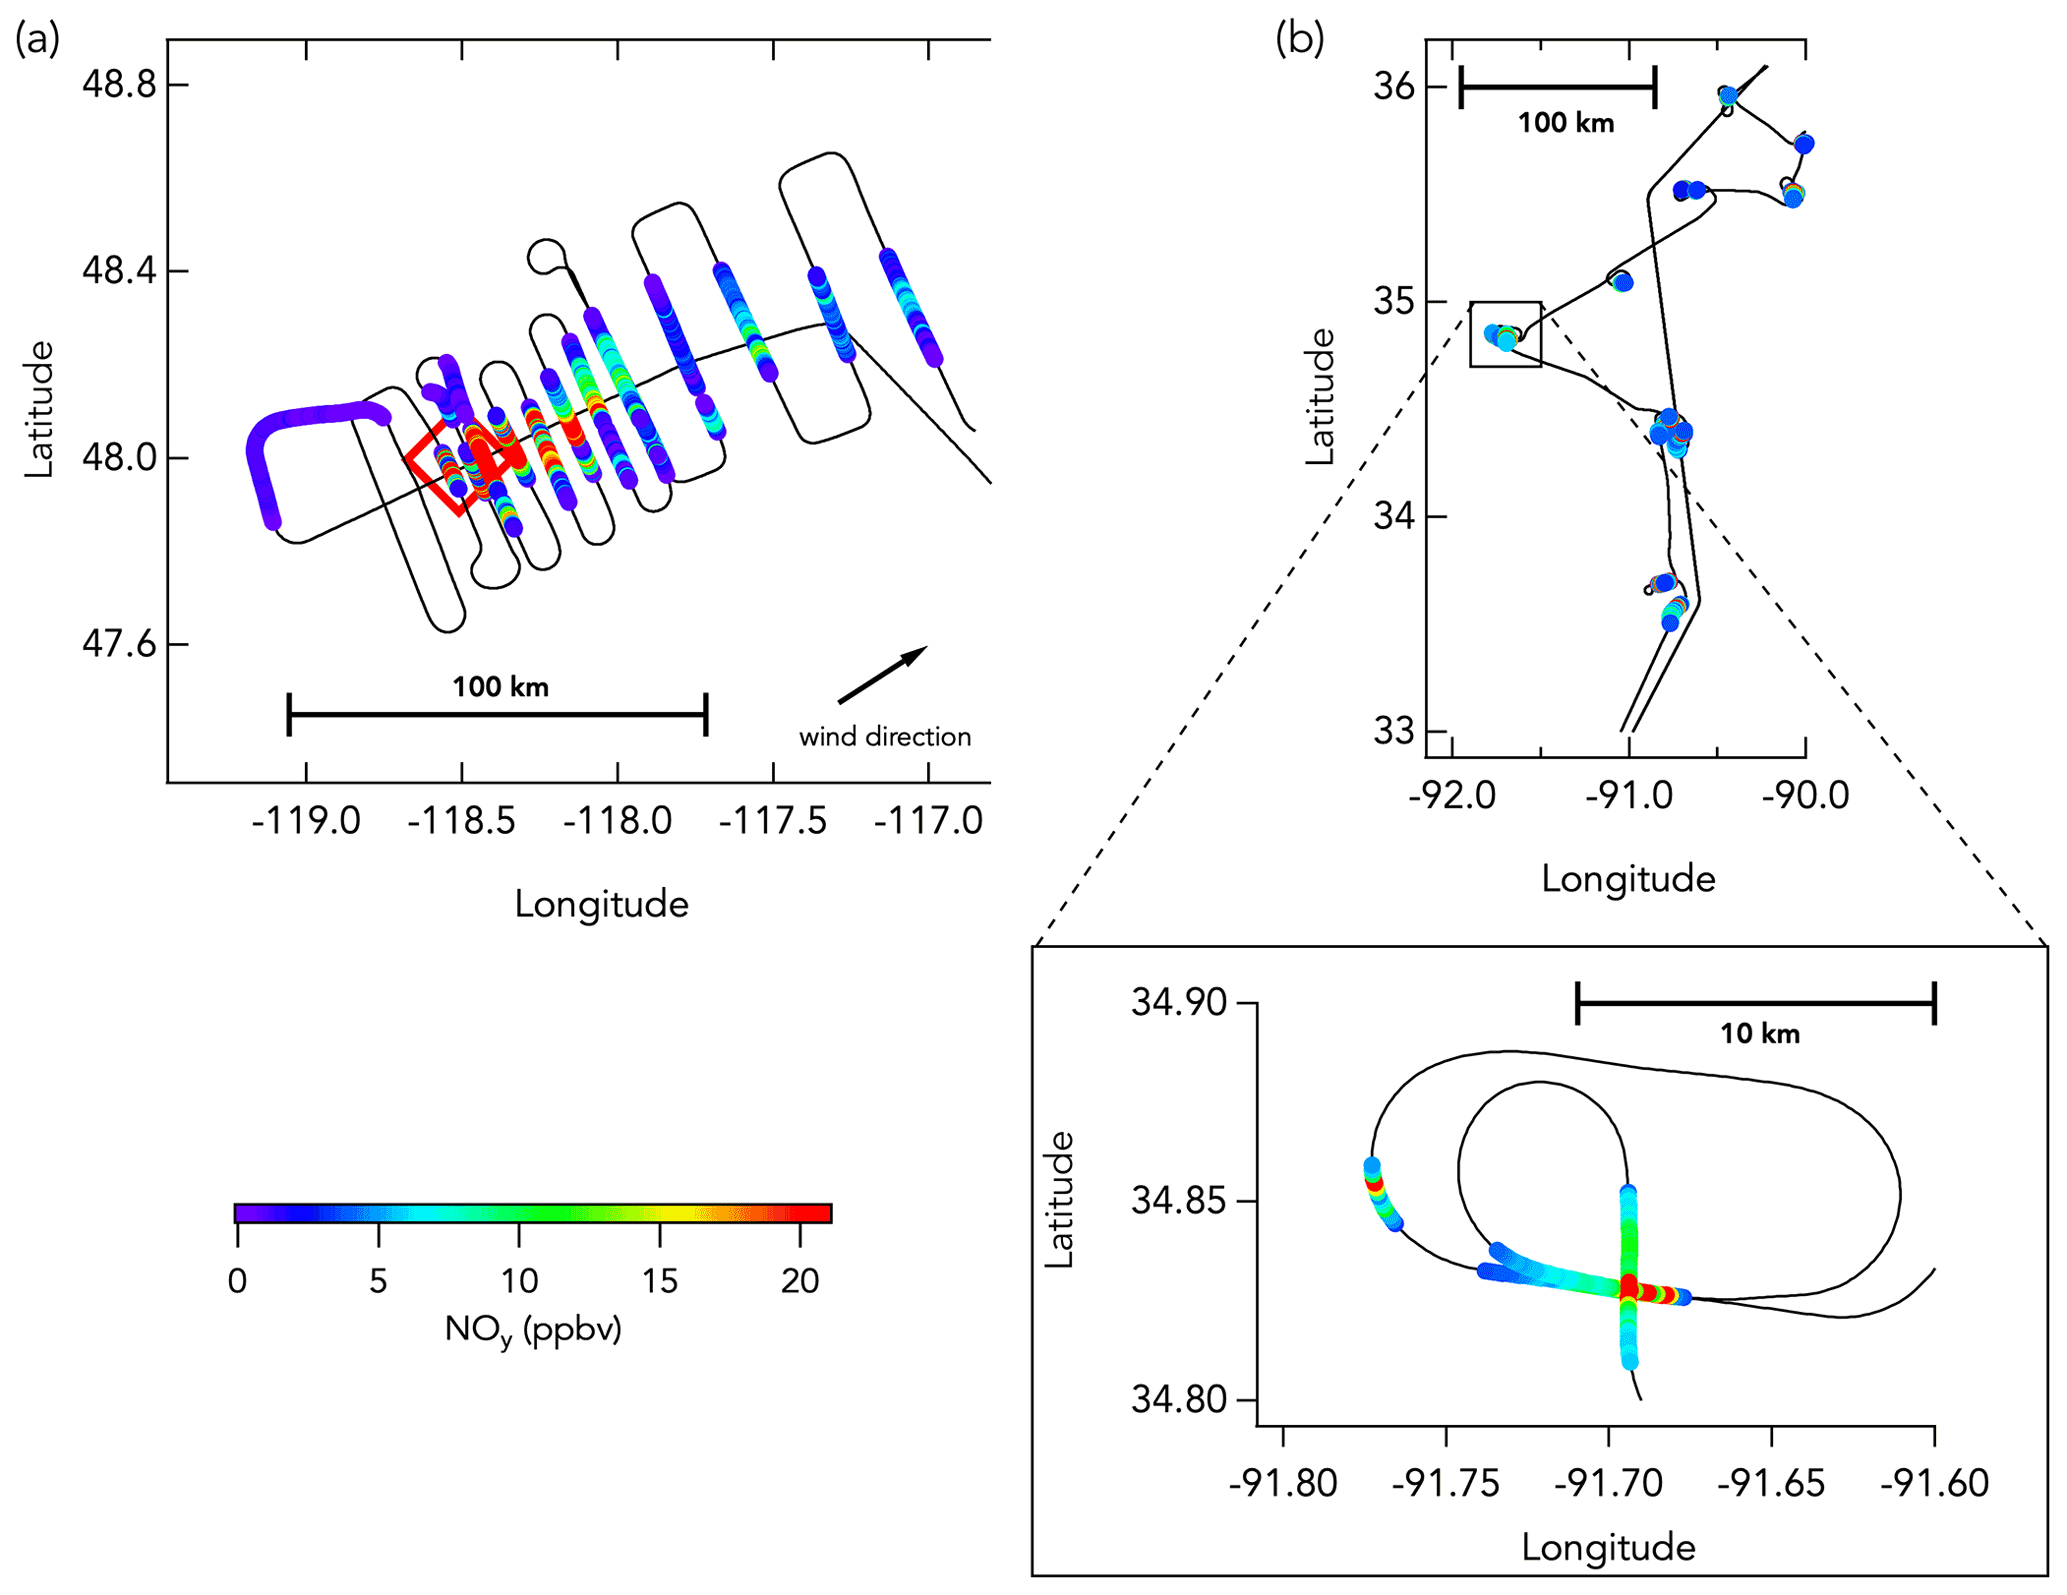
Figure 1Example DC-8 flight tracks from western wildfires and eastern agricultural fires. Panel (a) shows the DC-8 flight track (black line) during the sampling of the Williams Flat fire (3 August 2019; fire location indicated by the red box) smoke plume, colored by NOy mixing ratios (only data in smoke are colored here). Panel (b) shows the DC-8 flight track during the sampling of multiple agricultural burns (21 August 2019) that has also been colored by NOy mixing ratios (only data in smoke are colored here).
Most wildfire flights were designed to sample background mixing ratios, fresh emissions, and aged smoke, whereas the eastern fire flights typically transected numerous fresh smoke plumes several times each. For wildfires, the NASA DC-8 first flew upwind of the fire to characterize ambient conditions unaffected by targeted fire emissions. Subsequent cross-wind plume transects were conducted as close as possible to the fire to sample the emissions with the least possible atmospheric aging. Plume transects were designed to be perpendicular to the wind direction and through the center of the vertical extent of the plume, terrain permitting. The vertical structure of the plume was systematically assessed using a differential absorption lidar during a lengthwise overpass above the plume from end to start. The aircraft transected the smoke plume successively further downwind, at approximately 15–40 km intervals, to characterize smoke evolution in a “lawnmower” pattern (Fig. 1a). For several wildfires, the DC-8 also executed flight transects along the plume axis, both toward and away from the fire source. Most eastern fires sampled during FIREX-AQ did not produce plumes large enough to enable regularly spaced plume transects. Most smoke plumes were therefore sampled repetitively at the same location, sometimes with varying altitude and/or approach angle (Fig. 1b).
2.2 Instruments
2.2.1 Chemiluminescence (NO/NO2/NOy)
The NOAA chemiluminescence (CL) instrument has been frequently used for both ground-based and airborne measurements of NO, NO2, and NOy and uses the CL detection of NO with O3 added as reagent gas (Fontijn et al., 1970; Ridley and Grahek, 1990; Ridley and Howlett, 1974; Ryerson et al., 1999, 2000). NO, NO2, and NOy are measured on three independent channels of the instrument. The NO channel measures NO, the NO2 channel measures the sum of NO and photolyzed NO2 as NO, and the NOy channel measures the total reactive nitrogen oxides species reduced to NO. NO2 is determined from the difference between signals from the NO and NO2 channels. Ambient air is continuously sampled from a pressure-building ducted aircraft inlet to the instrument at a typical flow of 1045.1 ± 0.2, 1030.2 ± 0.2, and 1029.5 ± 0.2 standard cubic centimeters per minute (sccm) in flight for NO, NO2, and NOy, respectively. In the NO2 channel, NO2 is photolyzed to NO with a 40 ± 1 % conversion efficiency using two ultraviolet (UV) LEDs (Hamamatsu, model L11921) at 385 nm in a 45 cm long quartz cell (inner diameter of 1.2 cm) that is at a controlled pressure of 279.7 ± 0.4 hPa. In the NO channel, a similar quartz cell wrapped in aluminum foil to avoid NO2 photolysis and at a controlled pressure of 279.6 ± 0.4 hPa, ensures similar residence time of sampled air in both channels. In the NOy channel, reactive odd nitrogen species are first sampled through an inlet heated at 90.0 ± 0.1 ∘C then catalytically reduced to NO on a gold tube surface heated at 300.0 ± 0.2 ∘C in the presence of added pure CO flowing at 3.19 ± 0.01 sccm. Approximately 5 % O3 in oxygen is produced by corona discharge, delivered at 73.80 ± 0.02 (NO channel), 74.11 ± 0.03 (NO2 channel), and 74.60 ± 0.04 sccm (NOy channel), and mixed with sampled air in a pressure- (11.53 ± 0.03, 11.72 ± 0.03, 11.41 ± 0.03 hPa for NO, NO2, and NOy respectively) and temperature-controlled (25.0 ± 0.2, 25.1 ± 0.2, and 25.1 ± 0.2 ∘C for NO, NO2, and NOy, respectively) reaction vessel. O3-induced CL is detected with a red-sensitive photomultiplier tube controlled at −78 ∘C with dry ice, and the amplified digitized signal is recorded using an 80 MHz counter. Pulse coincidence at high count rates was calculated after the mission by fitting an inverse function to the curve between observed and theoretical count rates for known NO mixing ratios ranging from parts per billion by volume to parts per million by volume levels. Instrument calibrations were routinely performed both on the ground and during flight by standard addition of NO from a gravimetrically determined NO in N2 mixture (1.38 ± 0.03 ppmv) delivered at 4.04 ± 0.02 (NO channel), 4.84 ± 0.02 (NO2 channel), and 4.96 ± 0.02 sccm (NOy channel). All measurements were taken at a temporal resolution of 0.1 s, averaged to 1 s, and corrected for the dependence of instrument sensitivity on ambient water vapor content (Ridley et al., 1992). Finally, NO2 data were further corrected for a HONO interference (5 % of the HONO mixing ratios) due to HONO photolysis at 385 nm quantified from theoretical calculation and confirmed in the laboratory using a HONO source described in Lao et al. (2020). Under these conditions the total estimated 1 Hz uncertainty at sea level was ±(4 % + 6 pptv), ±(7 % + 20 pptv), and ±(12 % + 15 pptv) for NO, NO2, and NOy, respectively.
2.2.2 Laser-induced fluorescence (NO)
The NOAA NO-LIF measurements were performed using a custom-built laser-induced fluorescence instrument as detailed in Rollins et al. (2020). Air was continuously sampled from outside the aircraft through an optical cell in the DC-8 cabin held to near 90 hPa. The instrument utilizes a fiber laser system with a narrow-band laser tuned to a rotationally resolved NO spectral feature near 215 nm. Rapid dithering on and off of this resonance achieves 0.1 s measurements with a continuously monitored background to reduce uncertainty in the instrument zero. The laser-induced excitation of NO is followed by red-shifted fluorescence, which is detected by a photomultiplier tube operated in single-photon counting mode. The laser is directed through both a sampling and reference cell in a single pass for continuous monitoring of any changes in the instrument sensitivity due to changes in the laser spectrum or pressure of the optical cells. A total of 500 ppbv of NO in air was flown at 50 sccm through the reference cell to ensure that measurements are occurring with the laser tuned to the peak online wavelength. A constant flow of approximately 2500 sccm is maintained within the sampling cell through the use of a custom inlet valve (Gao et al., 1999), and the exhausts of both cells are tied together, allowing for any changes in sensitivity due to pressure fluctuations to be accounted for during data reduction. Hourly calibrations were performed during each flight in which 2–10 sccm of 5 ppmv NO in N2 mixture was added to the sample flow resulting in mixing ratios of 4–20 ppbv. As discussed in Rollins et al. (2020), given the sensitivity typically observed during FIREX, nonlinearity associated with saturation of the LIF instrument is not problematic until mixing ratios well above 100 ppbv are encountered. The sensitivity of the instrument was determined using the in-flight calibrations to be typically 10 counts per second per part per trillion by volume (CPS pptv−1) with 10 CPS background achieving a detection limit of 1 pptv for 1 s integration. The uncertainty of the instrument sensitivity is ± 6 %–9 %. The effect of water vapor, which reduces the sensitivity by quenching of the electronically excited NO, was accounted for during data reduction using water vapor measurements provided by an ICOS instrument on the DC-8. The NO measurement uncertainty is estimated to be ±(8 % + 1 pptv).
2.2.3 Laser-induced fluorescence (NO2)
The NASA Compact Airborne NO2 Experiment (CANOE) measured NO2 using non-resonant LIF. The instrument is a modified version of a formaldehyde (HCHO) instrument (St. Clair et al., 2019) with the excitation wavelength changed to 532 nm. The technique utilizes the pulsed (80 kHz) output of a fixed wavelength, 2 W, 532 nm laser to excite NO2 molecules and detects the resulting fluorescence with two identical detection axes consisting of a photomultiplier tube (PMT) and optical filters that transmit > 695 nm. Delayed time gate PMT counts are recorded at 10 Hz and a laboratory calibration, along with an intercept determined by preflight zeroing, are used to provide 1 Hz NO2 data. The NO2 measurement uncertainty is estimated to be ±(10 % + 100 pptv).
During FIREX-AQ, ambient air was sampled using a shared inlet that provided a large (10–25 standard liter per minute, slpm) bypass flow to the instrument rack. The inlet tube is a 45 cm length of 0.94 cm inner diameter Silcosteel (Restek) coated with FluoroPel (Cazorla et al., 2015). The CANOE instrument pulled its 750 sccm sample flow from a shared manifold (with another four instruments) at the instrument rack. An inline particle filter on the sample line prevented laser scatter by fine aerosol that were not removed by the particle-rejecting inlet. A manual three-way valve outside the instrument was used to sample from a scrubber (Drierite/molecular sieve) and provides a zero before and periodically during the flight. Pressure in the CANOE detection cell was maintained at 53 hPa by a pressure controller that precedes the cell in the flow path.
2.2.4 Cavity-enhanced spectroscopy (NO2/HONO)
NO2 and HONO were also measured by the NOAA airborne cavity-enhanced spectroscopy (ACES) instrument. This technique is based on incoherent broadband cavity-enhanced spectroscopy (CES, Fiedler et al., 2003). The CES instrument is described in full detail by Min et al. (2016) with only minor changes for FIREX-AQ. Briefly, the system consists of two parallel 45 cm optical cavities capped by highly reflective mirrors, with reflectivity curves centered at 365 nm (R = 0.99987) and 455 nm (R = 0.99992). Each cavity is illuminated by a broadband LED light source (centered at 365 and 455 nm respectively) collimated by an off-axis parabola, and passively coupled into the cavity. The light makes many passes before exiting the cavity into a fiber optic cable, which transmits the light to a grating spectrometer spanning 350–475 nm. The LEDs are modulated on for 0.4 s and off for 0.08 s for charged-couple device (CCD) readout, giving a total integration time of 0.48 s per light intensity spectrum. An absorption spectrum of the ambient air sample is determined using the procedure presented by Washenfelder et al. (2008). The procedure requires comparing the measured light intensity spectrum to a background spectrum of the cavity filled with cylinder zero air, which is determined here every 10 min. The mirror reflectivity is measured every hour using the Rayleigh scattering difference between helium and zero air, and the spectrometer dark counts and wavelength calibration are measured every 2 h. A small flow from a mixture of 25 ppm NO2 in air is diluted into the cavity every hour, resulting in NO2 concentrations between 50 and 100 ppbv, to assess the NO2 spectral retrieval features on the spectrometer. The absolute concentration was not used for calibration of the NO2 response but instead for providing a reference NO2 spectrum. Glyoxal reference spectra were obtained by bubbling zero air through a Teflon bubbler with 40 % glyoxal in water as in Min et al. (2016).
Ambient air is pulled through the inlet into the two optical cavities at a flow rate of 5.4 volumetric liters per minute per cavity by a scroll pump. The air passes through two 1 µm pore size Teflon filters (changed before each flight) before entering the instrument to remove any aerosol particles. Mirror cleanliness is maintained by flowing 150 sccm cylinder zero air over each mirror to prevent condensation of semi-volatile species. A pressure controller consisting of a Teflon orifice and a variable flow to a bypass maintains the internal pressure at one of two pressure set points: 400 hPa when the aircraft was below 7.3 km and 150 hPa above 7.3 km. The residence time of the air inside the optical cavities is estimated to be 0.5 s.
The measured absorption spectrum is fit to a linear combination of literature or reference spectra of absorbing gas-phase species and a polynomial to account for drifts in the cavity stability or light source intensity, as detailed by Min et al. (2016), using a Levenberg–Marquardt least-squares fitting algorithm. For the 365 nm channel, those species are NO2, HONO, O4, and a fourth-order polynomial. For the 455 nm channel, those species are NO2, glyoxal, methylglyoxal, H2O, and O4, and a zeroth order polynomial, though only NO2 is presented here. The algorithm uses reference spectra for NO2 and glyoxal, as measured in the field, scaled linearly to the literature spectra of Vandaele et al. (1998) at 296 K and Volkamer et al. (2005) at 294 K, respectively. The literature spectra from Stutz et al. (2000), Meller et al. (1991), Harder and Brault (1997), and Keller-Rudek et al. (2013) are used for HONO, methylglyoxal, H2O, and O4, respectively. The fitting range was 438–467 nm for the 455 nm channel and 362–387 nm for the 365 nm channel. No structure was observed in the fit residuals. Because the 455 nm channel has higher precision, only those NO2 data are presented here, although the two channels agree to within 3 %. The data are averaged to 1 s. The reported uncertainties are ±(9 % + 0.6 ppbv) for HONO and ±(5 % + 0.26 ppbv) for NO2, representing the accuracy and 2σ precision in 1 s.
2.2.5 Iodide-adduct chemical ionization mass spectrometry (HONO)
HONO was measured using a modified commercial time-of-flight chemical ionization mass spectrometer (TOF CIMS, Aerodyne Research, Inc.; Lee et al., 2014; Veres et al., 2020). Trace gases are ionized by mixing ambient air with reagent ions made in flight, and the resulting product ions are detected. Ions are separated by mass-to-charge ratio () using a time-of-flight mass spectrometer with a resolving power of 5000 and a range of mass to charge ratio up to 494 . Spectra were obtained at a 25 kHz repetition rate and then averaged to 1 s. High-resolution peak fitting was performed on the spectra, using over 500 known masses. Reagent ions were formed by flowing 1 slpm N2 through a temperature-controlled CH3I permeation tube followed by a 20 mCi 210Po radioactive source. Two reagent ions are generated: iodide ions (I−) are formed in the radioactive source, and iodide–water clusters (I−•H2O) are formed when I− reacts with water in the ion–molecule reactor (IMR). In the IMR, the reagent ions cluster with analyte gases to form stable iodide adducts. The IMR was controlled at 40 hPa pressure to reduce the effects of secondary ion chemistry that increase at higher pressures.
Ambient air was sampled through a mass-flow-controlled (6 slpm) heated perfluoroalkoxy (PFA) inlet (70 cm length, 0.64 cm inner diameter). A pressure control region upstream of a critical orifice at the entrance to the IMR was maintained at 140 hPa, and thus a constant flow of 1.2 slpm ambient air entered the IMR to mix with the 1 slpm ion source flow. A small nitrogen flow of about 20 sccm containing water vapor was added directly into the IMR region and controlled to maintain a measured I−•H2O : I− cluster ratio of 50 ± 2 % in order to maintain constant detection sensitivity. The reagent ion signals during FIREX-AQ were typically 2 MHz for I−•H2O and 4 MHz for I−, and they were stable as a function of aircraft altitude. In the most concentrated fire plumes with CO over 7 ppm, the abundance of reactants reduced the reagent ion signals by up to 15 %. The product cluster ions were normalized by the iodide (I−•H2O) signals to account for changes in reagent ions. The instrument background signal was determined in flight by overflowing the inlet with scrubbed ambient air for 30 s every 10 min through a port located 2 cm downstream of the inlet entrance. Calibrations with Cl2 and HNO3 permeation sources were performed hourly in flight to diagnose the stability of instrument sensitivity. The standard deviation of in flight calibrations was typically 10 %.
HONO was detected as a cluster with I− that has a mass-to-charge ratio of 173.90575 . Contributions from the 13C isotope of formic acid at 173.91342 are not completely mass-resolved but are accounted for using high resolution peak fitting and isotope ratios based on the formic acid signal at its most abundant isotope. We know of no other contributions to the signal at the mass used for HONO detection, consistent with previous studies (Neuman et al., 2016). The background HONO signals were typically equivalent to a mixing ratio of 40 ppt, and these were subtracted from the total signal to determine ambient HONO. Sensitivity to HONO was determined in the laboratory, using a tunable, calibrated HONO source that uses HCl reactions on humid NaNO2 to generate HONO (Lao et al., 2020). The output was calibrated spectroscopically using the NOAA ACES instrument (Min et al., 2016). The absolute sensitivity to HONO was 3.4 ion counts per second per part per trillion for typical conditions. Sensitivities normalized by the reagent ions are used to determine mixing ratios from the normalized product ion signals. The HONO measurement uncertainty at fixed temperature was ±(15 % + 3 pptv), where the first term was from the laboratory calibrations and the second was the variability of the in-flight background determinations. The HONO measurement precision was ±2 pptv for 1 s data. Calibrations and fieldwork conducted subsequent to FIREX-AQ identified a temperature dependence to the CIMS calibration. Section 3.3 below describes this sensitivity in more detail.
2.2.6 ΣNOy
To determine the extent of budget closure for reactive odd nitrogen species during FIREX-AQ, we compare measured NOy (see Sect. 2.2.1) with a simplified definition of ΣNOy as illustrated in the following equation:
Other nitrogen oxides were also measured during FIREX-AQ but were not included in this equation as they contributed on average less than 7 % to the NOy budget (see Sect. 3.4). Further, including these measurements would have decreased data availability for comparison with the total NOy measurement by more than 60 %. These minor NOy species are alkene hydroxy nitrates, nitromethane (CH3NO2), N2O5, ClNO2, and C1–C5 alkyl nitrates (Figs. S4 and S5 in the Supplement). Measurements used in Eq. (2) are CL NOx, CIMS HONO, CIMS HNO3, HR-AMS pNO3, and CIMS APNs. These measurements were primarily used because they had better precision. Using LIF NO, CES NO2, and CES HONO as primary measurements changed the correlation slope between ΣNOy and measured NOy by −2 %, −6 %, and 6 %, respectively (Table S1). In smoke, using LIF NO, CES NO2, and CES HONO as primary measurements changed the correlation slope between ΣNOy and measured NOy by −1 %, −8 %, and 9 %, respectively (Table S1).
-
Observations of HNO3, HCN, and hydroxyl nitrates produced from the oxidation of ethane, propene, butane, and isoprene were made by the California Institute of Technology Chemical Ionization Mass Spectrometer (CIT-CIMS) compact time-of-flight (cToF, TofWerk/Caltech) sensor using CF3O− ion chemistry (Crounse et al., 2006). In short, a large flow of ambient air (about 40 m3 s−1) was rapidly brought into the aircraft through a Teflon-coated glass inlet (warmed slightly above ambient temperature), where it was subsampled, diluted with dry N2, reacted with CF3O−, and underwent subsequent product ion analysis by time-of-flight mass spectrometry. The HF•NO ( 82) product ion is used to quantify HNO3. The HCN and hydroxy nitrates are detected as cluster ions. Laboratory-generated, T-dependent, and water-dependent calibration curves were performed to produce ambient mixing ratios from raw signals for HNO3 and hydroxy nitrates. The HCN sensitivity is tracked in situ based on the continuous addition of isotopically labeled H13C15N into the instrument from a custom-made gravimetrically based compressed gas cylinder. In-flight instrumental zeros were performed every ∼ 15 min using dry N2 and ambient air passed through NaHCO3-coated nylon wool. Continuous data, with the exception of zero and calibration periods, are reported with 1 Hz frequency. The uncertainties for HNO3, HCN, and hydroxy nitrates are ±(30 % + 50 pptv), ±(25 % + 70 pptv), and ±(25 % + 3 pptv), respectively.
-
Particulate nitrate (pNO3) was measured with a high-resolution time-of-flight aerosol mass spectrometer (AMS) (HR-AMS, Aerodyne Research, Inc., Billerica, MA, USA). The HR-AMS measured submicrometer (PM0.9; calibrated in the field as described in Guo et al., 2021) aerosol composition at high time resolution (0.1–1 s) by flash vaporization of the aerosol, 70 eV electron ionization of the volatilized gas phase, and subsequent analysis by mass spectrometry (DeCarlo et al., 2006; Canagaratna et al., 2007). pNO3 is detected in the HR-AMS as the sum of HxNO ions (mostly NO+ and NO). Typical 1 s detection limits for pNO3 were about 90 ng per standard cubic meter (30 pptv) for urban or background conditions. Given the size cut in the HR-AMS instrument, pNO3 does not include coarse nitrate from the reaction of HNO3 with sea salt or dust aerosol. It does include particulate organic nitrates (pRONO2; Day et al., 2022; Farmer et al., 2010), which are speciated using the algorithm described in Fry et al. (2013) and Day et al. (2022). Likewise, particulate aryl nitrates such as nitrocatechol also contribute to the total pNO3 signal (Guo et al., 2020). Nitrocatechol was also characterized by extractive electrospray ionization time-of-flight mass spectrometry (EESI-MS; Pagonis et al., 2021), and positive matrix factorization and tracer analysis suggests that total aryl nitrates could be 3–7 times the concentration of nitrocatechol.
-
APNs were measured using a thermal dissociation–chemical ionization mass spectrometer (TD-CIMS) method. The CIMS instrument used during the FIREX-AQ campaign was similar to that described in Slusher et al. (2004) and Lee et al. (2020). Briefly, ambient air is sampled into the TD-CIMS through heated Teflon tubing at a temperature of approximately 150 ∘C to thermally dissociate APNs. The thermal dissociation region was maintained at a constant pressure of 80 hPa using a commercial pressure controller (MKS 640) to minimize negative interference due to NO, NO2, and radical–radical reactions. In-flight calibrations were performed by continuous addition of isotopically labeled peroxyacetyl nitrate (PAN) standard quantified as acetate ion (61 ; C13H3C13(O)O−) in the TD-CIMS. NO was periodically added to the inlet (∼ 10 ppm) to react away peroxyacyl radicals and thus to measure the instrument background signal. APNs species measured during FIREX-AQ include PAN, acryloyl peroxynitrate (APAN), propionyl peroxynitrate (PPN), and peroxybutyryl nitrate (PBN) with an uncertainty of 20 %, 30 %, 30 %, and 30 %, respectively.
-
Nitromethane (CH3NO2), along with other volatile organic compounds (VOCs), was measured by proton-transfer-reaction time-of-flight mass spectrometry (PTR-ToF-MS; Gkatzelis et al., 2022). The PTR-ToF-MS sampled VOCs at 5 Hz through short (1 m) heated inlet. Periodically, instrument backgrounds were determined by passing ambient air through a platinum catalyst heated to 350 ∘C. The instrument response to VOCs was calibrated by gravimetrically prepared standards or by liquid calibration, as described by Gkatzelis et al. (2022). CH3NO2 mixing ratios were determined by liquid calibration with an uncertainty of 30 %.
-
N2O5 was detected as a cluster with I− at mass 234.88574 . Sensitivity was determined by standard addition laboratory calibrations, with N2O5 generated by reacting a NO2 calibration standard with O3 (Bertram et al., 2009) and quantified using cavity ring-down NOy measurements (Womack et al., 2017). For typical operating conditions during FIREX-AQ, N2O5 sensitivity was 70 ion counts per second per part per trillion. N2O5 was measured with ±(15 % + 2 pptv) accuracy and 0.1 pptv precision for 1 s data. Iodide ions cluster with a dimethyl sulfide (DMS) oxidation product, hydroperoxymethyl thioformate (HPMTF), which has a mass only 0.0074 amu greater than N2O5, and these two molecules cannot be completely resolved spectrometrically with the resolution ( = 5000) of this instrument (Veres et al., 2020). For these measurements over the continent, the contribution from HPMTF to the signal at the iodide N2O5 cluster is assumed to be negligible.
-
C1–C5 alkyl nitrates were measured by the NOAA-integrated whole air sampling system with off-line analysis by gas chromatography–mass spectrometry (iWAS/GC-MS as described in Lerner et al., 2017). There were 142 iWAS samples collected over the LA Basin with an average fill time of 5.2 ± 0.7 s. There were 897 wildfire samples and 467 eastern fire samples with average fill times of 7.6 ± 1.1 and 4.5 ± 0.8 s, respectively. Due to the relatively fast fill times and targeted, on-demand sampling capabilities of the iWAS, 88 % and 74 % were “full smoke” samples for wildfire and eastern fire samples, respectively. All samples were analyzed in the NOAA Chemical Science Laboratory within 213 h of sample collection with an average sample age of 87 ± 34 h between sample collection and sample analysis for FIREX-AQ.
2.2.7 Integrated cavity output spectroscopy (CO)
CO was measured using a modified commercial off-axis ICOS instrument (Los Gatos Research (LGR) N2O/CO-30-EP; Arévalo-Martínez et al., 2013; Baer et al., 2002) at 4.566 µm. The commercial instrument has two flow paths, a slow-flow path with cavity pressure controlled by an internal proportional valve, and a parallel high-flow path with a needle valve to control pressure. The instrument was modified to use only the high-flow path, but with an automatic cavity pressure controller. The needle valve was removed from the flow path in favor of a Piezo proportional valve (Horiba Stec UR-Z732M) located near the inlet.
Air was sampled from a ram-air intake inlet through 0.64 cm (outside diameter) stainless steel tubing. Cavity pressure was maintained at 113.3 ± 0.3 hPa in flight. Immediately inside the fuselage, two CO (and N2O) calibration gas standards known to within ± 0.4 ppb CO were regularly delivered to the inlet line during flight to evaluate instrument sensitivity between 58.4 and 993.3 ppb CO (both ICOS-CO and tunable diode laser absorption spectroscopy CO mixing ratios are reported as dry air mole fractions). The calibration standards were added to displace ambient air and overflow the inlet and were calibrated before and after the project using standard tanks tied to the World Meteorological Organization CO_X2014A scale from the NOAA Global Monitoring Laboratory (Hall et al., 2007; Novelli et al., 1991). The 1σ variability of the slope and intercept of all in-flight calibrations was 0.6 % and 0.9 ppb, respectively. A third calibration standard, referred to as a “target” (Peischl et al., 2010), was regularly introduced to the inlet between calibrations and treated as an unknown to evaluate long-term instrument performance. The retrieved value of 109 in-flight targets during FIREX-AQ was 301.6 ± 1.0 ppb CO compared with the calibrated value of 301.1 ± 0.4 ppb. The 1 Hz precision of the measurement in flight is estimated to be 0.4 ppb.
After the campaign, the H2O measurement was calibrated using a MBW 373LX chilled-mirror hygrometer (MBW Calibration AG; Rollins et al., 2020). The H2O measurement is estimated to have an uncertainty of ±(50 ppmv + 4 %) and was used to convert the CO measurement to a dry air mole fraction. The uncertainty of the dry air mole fraction of CO is estimated to be ±(2.0 ppb + 2 %) for mixing ratios below 1 ppm.
2.2.8 Tunable diode laser absorption spectroscopy (CO)
Carbon monoxide (CO) was measured by tunable diode laser absorption spectroscopy (TDLAS) using the DACOM (Differential Absorption Carbon monOxide Measurement) instrument (Sachse et al., 1987). The TDLAS instrument configuration used during FIREX-AQ also included channels for measurements of methane (CH4) and carbon dioxide isotopes (12CO2 and 13CO2). This instrument utilizes three single-mode tunable diode lasers, with CO measured using a quantum cascade laser (QCL) at approximately 4.7 µm. The three individual mid-infrared laser beams were combined by the use of dichroic filters and directed through a small volume (0.3 L) Herriott cell enclosing a 36 m optical path. After exiting the Herriott cell, the beams were spectrally separated and directed to individual HgCdTe (MCT) detectors.
The lasers were operated in a wavelength-modulated mode, each at an independent frequency, and line-locked to the centers of the species' selected absorption lines. Lines were selected to provide both good sensitivity and good isolation from any potential spectral interferences. Detector signals were demodulated at twice the lasers' modulation frequencies (2F detection) and normalized by average detected laser intensity.
Ambient air was sampled through an inlet probe, compressed, and passed through a permeable membrane dryer to remove water vapor prior to being introduced into the Herriott cell. Due to the need for very fast time response during FIREX-AQ, the instrument was operated with a flow of approximately 14 slpm with the Herriott cell at a pressure of approximately 67 hPa. The resulting time response, verified with a fast-acting valve, was faster than 0.2 s. Data were reported at both 0.2 and 1 s time steps.
The TDLAS instrument was calibrated using the same gas standards as for the ICOS instrument, nominally with a 4 min period but often advanced or delayed in time to avoid calibrating during fire plume encounters. Calibrations provided both slope and intercept values tying signals to species concentrations. The very large CO concentrations encountered necessitated post-campaign correction calibrations to account for response nonlinearity.
Post-campaign analysis of the TDLAS CO data indicated that measurement precision (1σ) was approximately 0.1 % at 1 s and 0.14 % at 0.2 s. Accuracy was dependent on CO mixing ratio and varied from 2 % to 7 %.
2.2.9 H2O
H2O was measured using the NASA diode laser hygrometer, an open-path infrared absorption spectrometer that uses a laser locked to one of three water vapor absorption features near 1.395 µm, depending on the abundance of water vapor (Diskin et al., 2002; Podolske et al., 2003). H2O mixing ratios were determined with an uncertainty of 5 %.
2.2.10 Smoke age
The age of smoke from emission to sampling by the aircraft was determined from an ensemble of upwind trajectories from the aircraft (Holmes et al., 2020). Trajectories were computed with HYSPLIT (Stein et al., 2015) using three meteorological datasets (HRRR, NAM CONUS Nest, and GFS 0.25∘). In each of the three trajectories, the advection time was determined from the point where the trajectory most closely approached the source fire. The age also includes plume rise time from the surface to trajectory altitude, which was estimated with a mean rise time of 7 ± 4 m s−1 (Lareau et al., 2018). Trajectories and ages that were grossly inconsistent with smoke transport patterns seen in geostationary satellite images were excluded from further analysis. The ensemble of age estimates was then averaged to provide a best estimate of smoke age. The median uncertainty in smoke age is about 27 %, as determined by the sum in quadrature of the spread among the ensemble of estimates; the uncertainties in the updraft speed, the fire location, and the wind speed; and uncertainties in the model.
2.3 Methodology
This study focuses on comparing the different techniques used for the measurements of one or several reactive nitrogen species and CO during FIREX-AQ. Here we compare both archived 1 s data (https://www-air.larc.nasa.gov/missions/firex-aq/index.html, last access: 15 February 2022) and the plume-integrated data. Plume-integrated data are obtained from integrating the 1 Hz data of a given measurement over a smoke plume transect. A smoke plume transect was identified using the time period between a CO and/or black carbon (BC) increase above a local background value (beginning of the plume transect) and the CO and/or BC decrease back to a background value (end of the plume transect). Background values on either side of a plume were different for some fires in spatially heterogeneous source regions. Note that any 10 s period of background air, even if experienced during a single smoke plume transect, was sufficient to mark the end of one transect and the start of the next. All 1 Hz data were time-aligned prior to comparison by synchronizing features in the time series of each species. Time shifts were typically less than 4 s. Some disagreement between measurement techniques is expected due to the rapid variations sampled during FIREX-AQ, particularly when those variations occur faster than the measurement period and/or with greater spatial heterogeneity than the distance between the sampling locations on a large aircraft that can reach 25 m in some cases. Comparisons in this manuscript are not blind as all PIs had access to other instruments measurements throughout the campaign.
We first calculated the slope of the linear least-squares (LLS) orthogonal distance regression (ODR; Boggs et al., 1987) to characterize the percent difference between measurements of a pair of instruments weighted by the inverse of the instrument precision. Here, we used a mixing ratio-independent instrument precision that corresponded to the 1σ precision in clean air. Weighting the fit by this term, rather than a more accurate but labor-intensive mixing-ratio-dependent precision, tend to overweight the highest measured mixing ratios. The slope and intercept resulting from the ODR regression analysis provide a measure of systematic or species-dependent instrumental biases. Additionally, we calculated the difference between a given pair of measurements. The difference, noted ΔYX1−X2 where X1 and X2 are the two measurement techniques for detection of the Y species, provides an understanding of the temporal evolution and environmental dependency of instrumental discrepancies. Note that the regression analysis yields slightly different information than the calculation of the difference: while the former is weighted more by fire plumes, where mixing ratios were greatest, the latter is weighted more by background conditions, where most of the measurements took place. Unless specified otherwise, all data available (i.e., both background and fire smoke data) were included in the following comparisons. We also calculated the fractional error (FE = where ) between pair of instruments using specifically fire smoke data to minimize measurements below instrument detection limits (Figs. S6 and S7). In the following sections, combined instrument uncertainties were calculated by adding in quadrature individual instrument uncertainties.
3.1 NO
3.1.1 Campaign-wide comparison
The 1 Hz data comparison between the CL and LIF instruments is shown in Fig. 2. The overall comparison slope (± combined instrument uncertainties) is 0.98 ± 0.08 (R2 = 0.93) with an intercept of −2 ± 0 pptv (Fig. 2a). Figures 3a and 4a show the two instruments' response in smoke from a wildfire and an eastern fire, respectively. While the NO signals track each other remarkably well, there is a difference in time response that is typical of the entire campaign. Figure S8 shows an expanded view of 10 Hz NO and CO measurements in a partial smoke plume transect, including the transition from smoke to background air sampling. The NO signal in the CL instrument exhibits less structure than in the LIF instrument and a tail following the plume-to-ambient-air transition. These tails were commonly observed during this transition. This effect in the CL instrument may partly explain the elevated scatter below the 1 : 1 line in Fig. 2b. Integrating the NO signal across plume passes reduces the scatter due to different instrument time responses: the regression analysis of smoke plume-integrated NO mixing ratios yields a slope of 0.99 (R2 = 0.95) for the whole dataset (Fig. 2c).
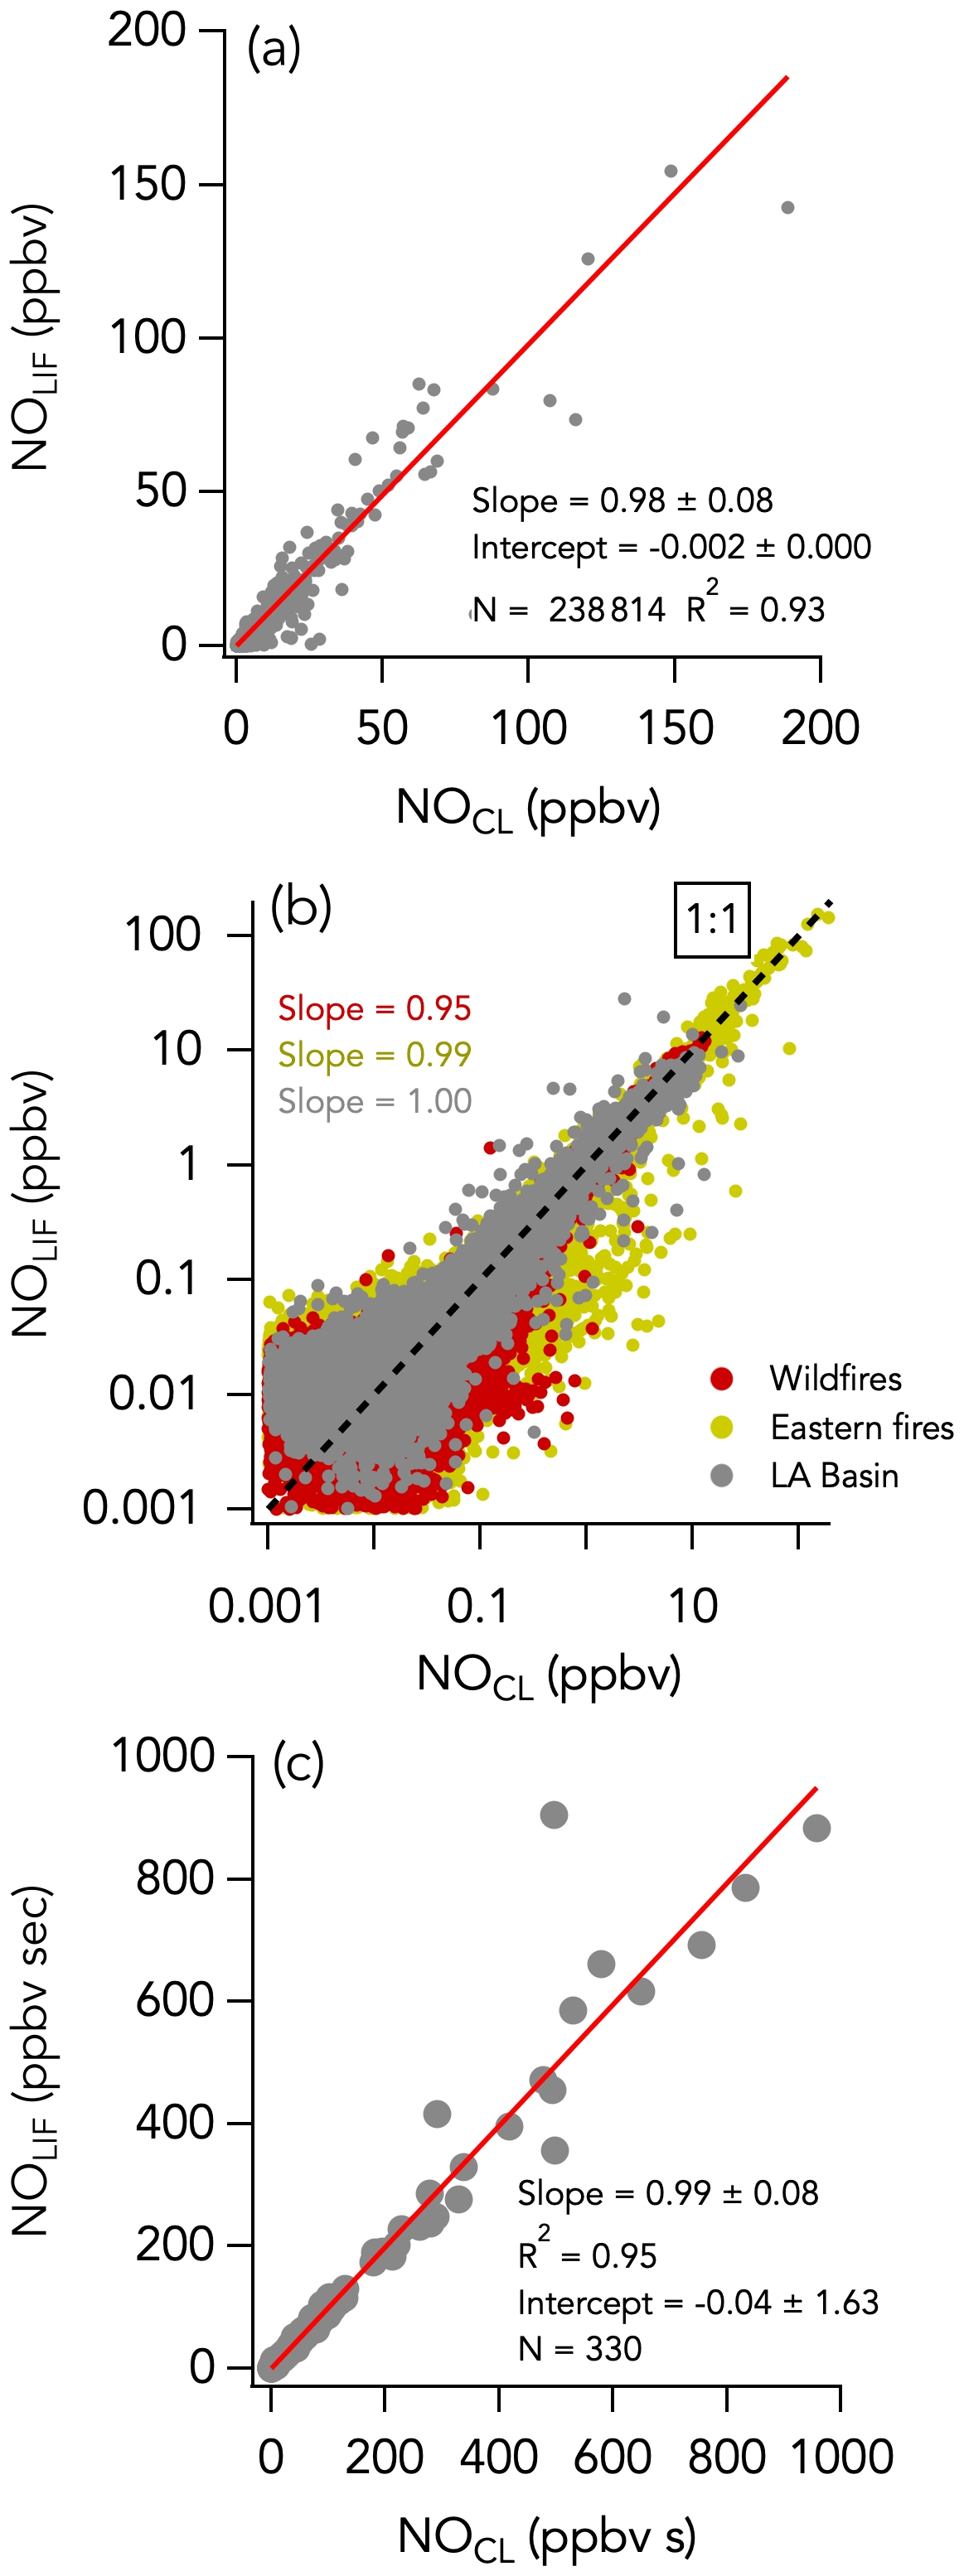
Figure 2NO measurements by LIF vs. CL with (a) all 1 s data on a linear scale, (b) all 1 s data on a log scale, and (c) integrals of 330 crosswind smoke plume transects. N is the number of independent 1 s observations or smoke plume transects that are compared. In panel (b), the three sampling periods are shown in different colors, with the wildfires sampling period in red, the eastern fires sampling period in mustard, and the Los Angeles (LA) Basin flights in grey. The red lines indicate the fit of the data. The dotted black line is the 1 : 1 line.
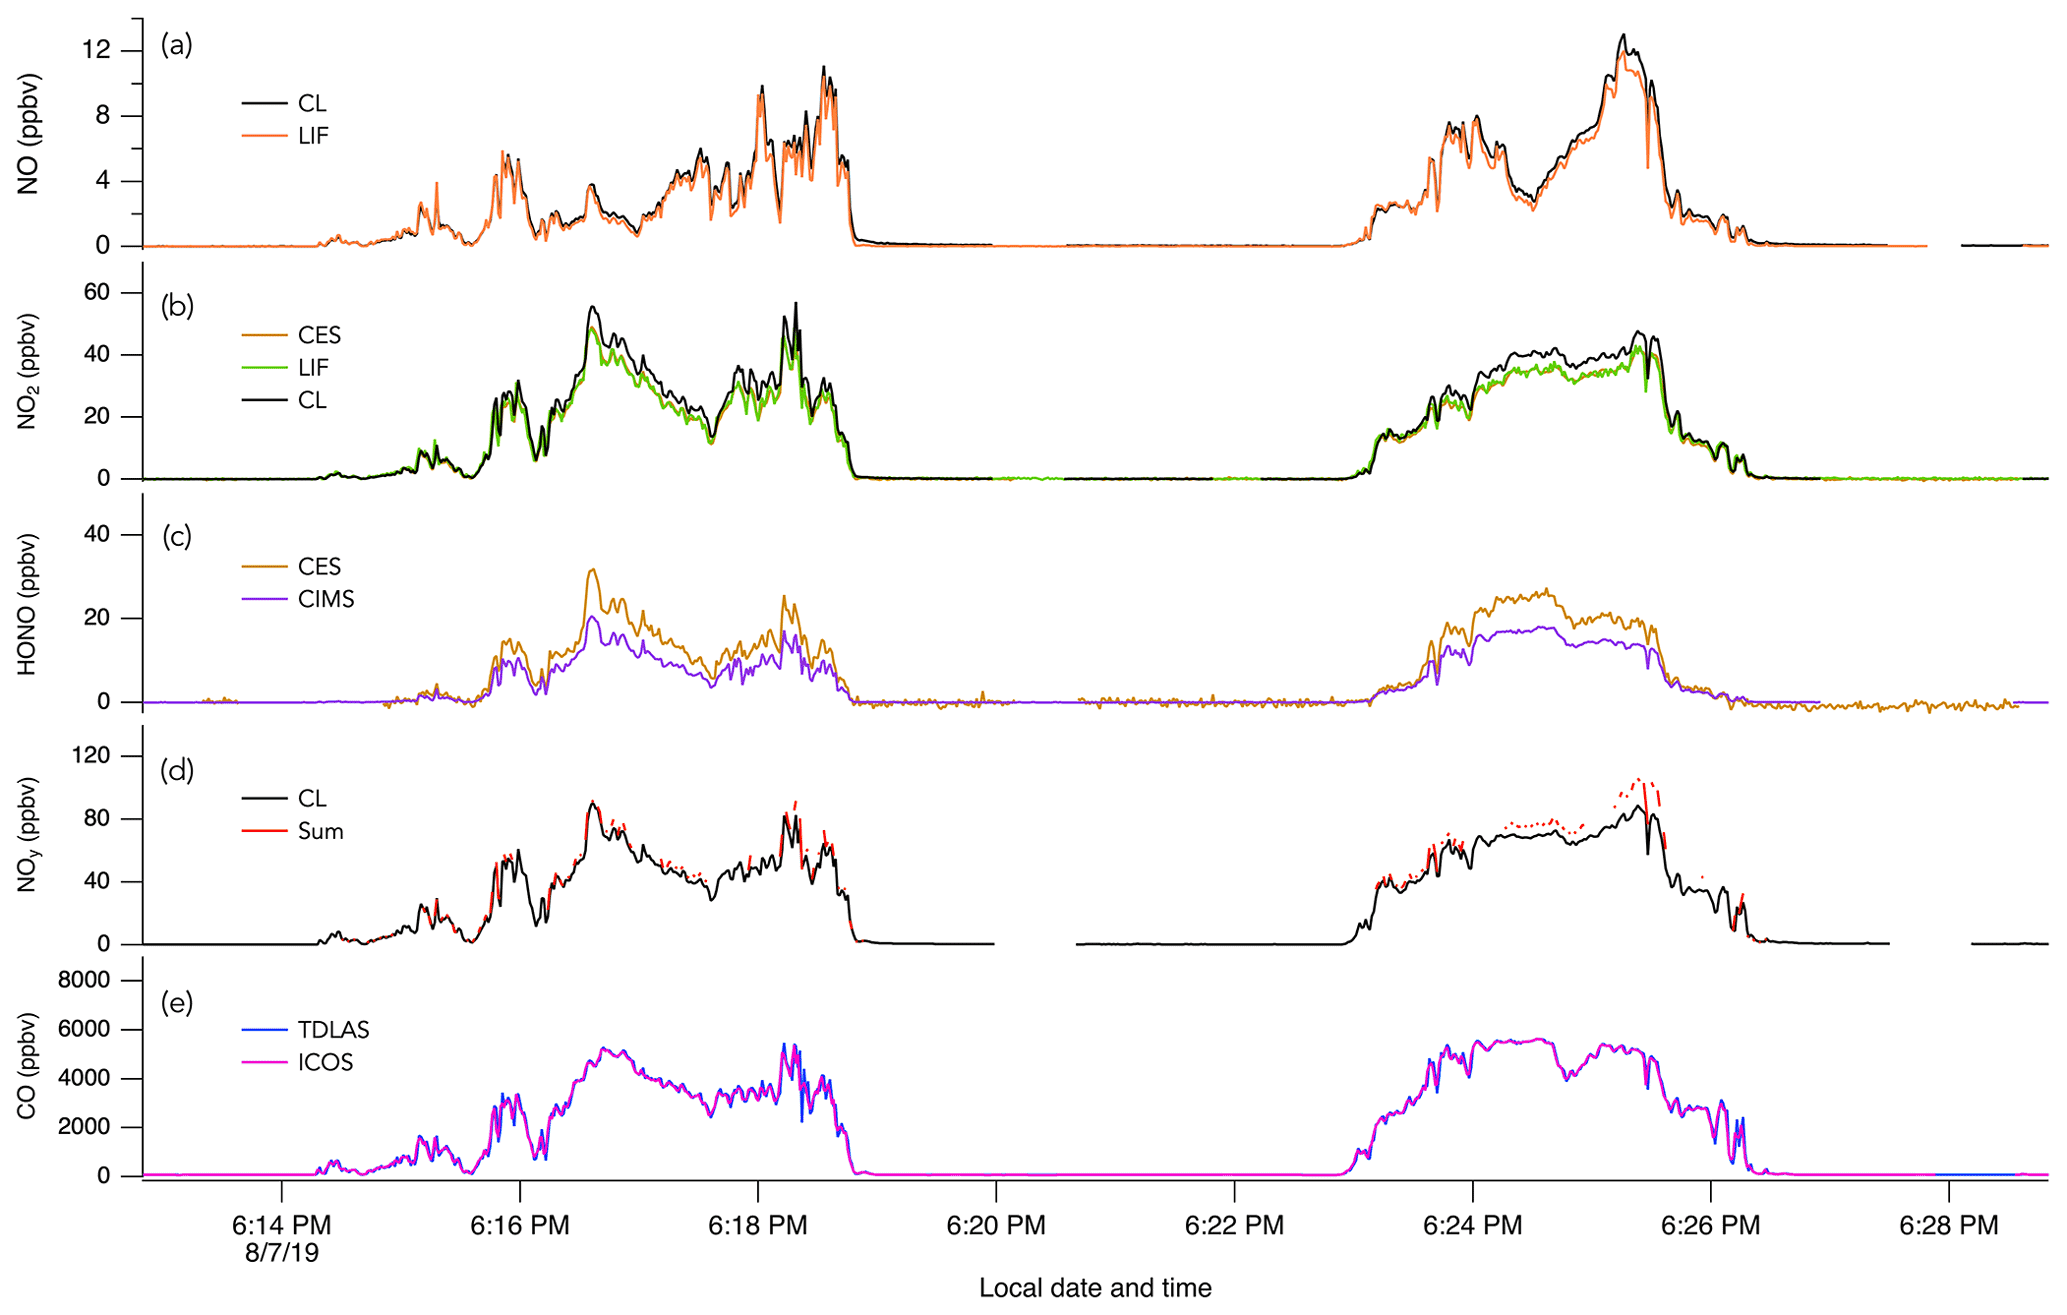
Figure 3The 1 s measurements of (a) NO, (b) NO2, (c) HONO, (d) NOy, and (e) CO during two crosswind plume transects of smoke from the Williams Flat fire on 7 August 2019. The plume transects were chosen due to the significant enhancement of all species at that time. Note that in panel (b) the NO2 trace from the CES instrument is hidden behind the NO2 trace from the LIF instrument.
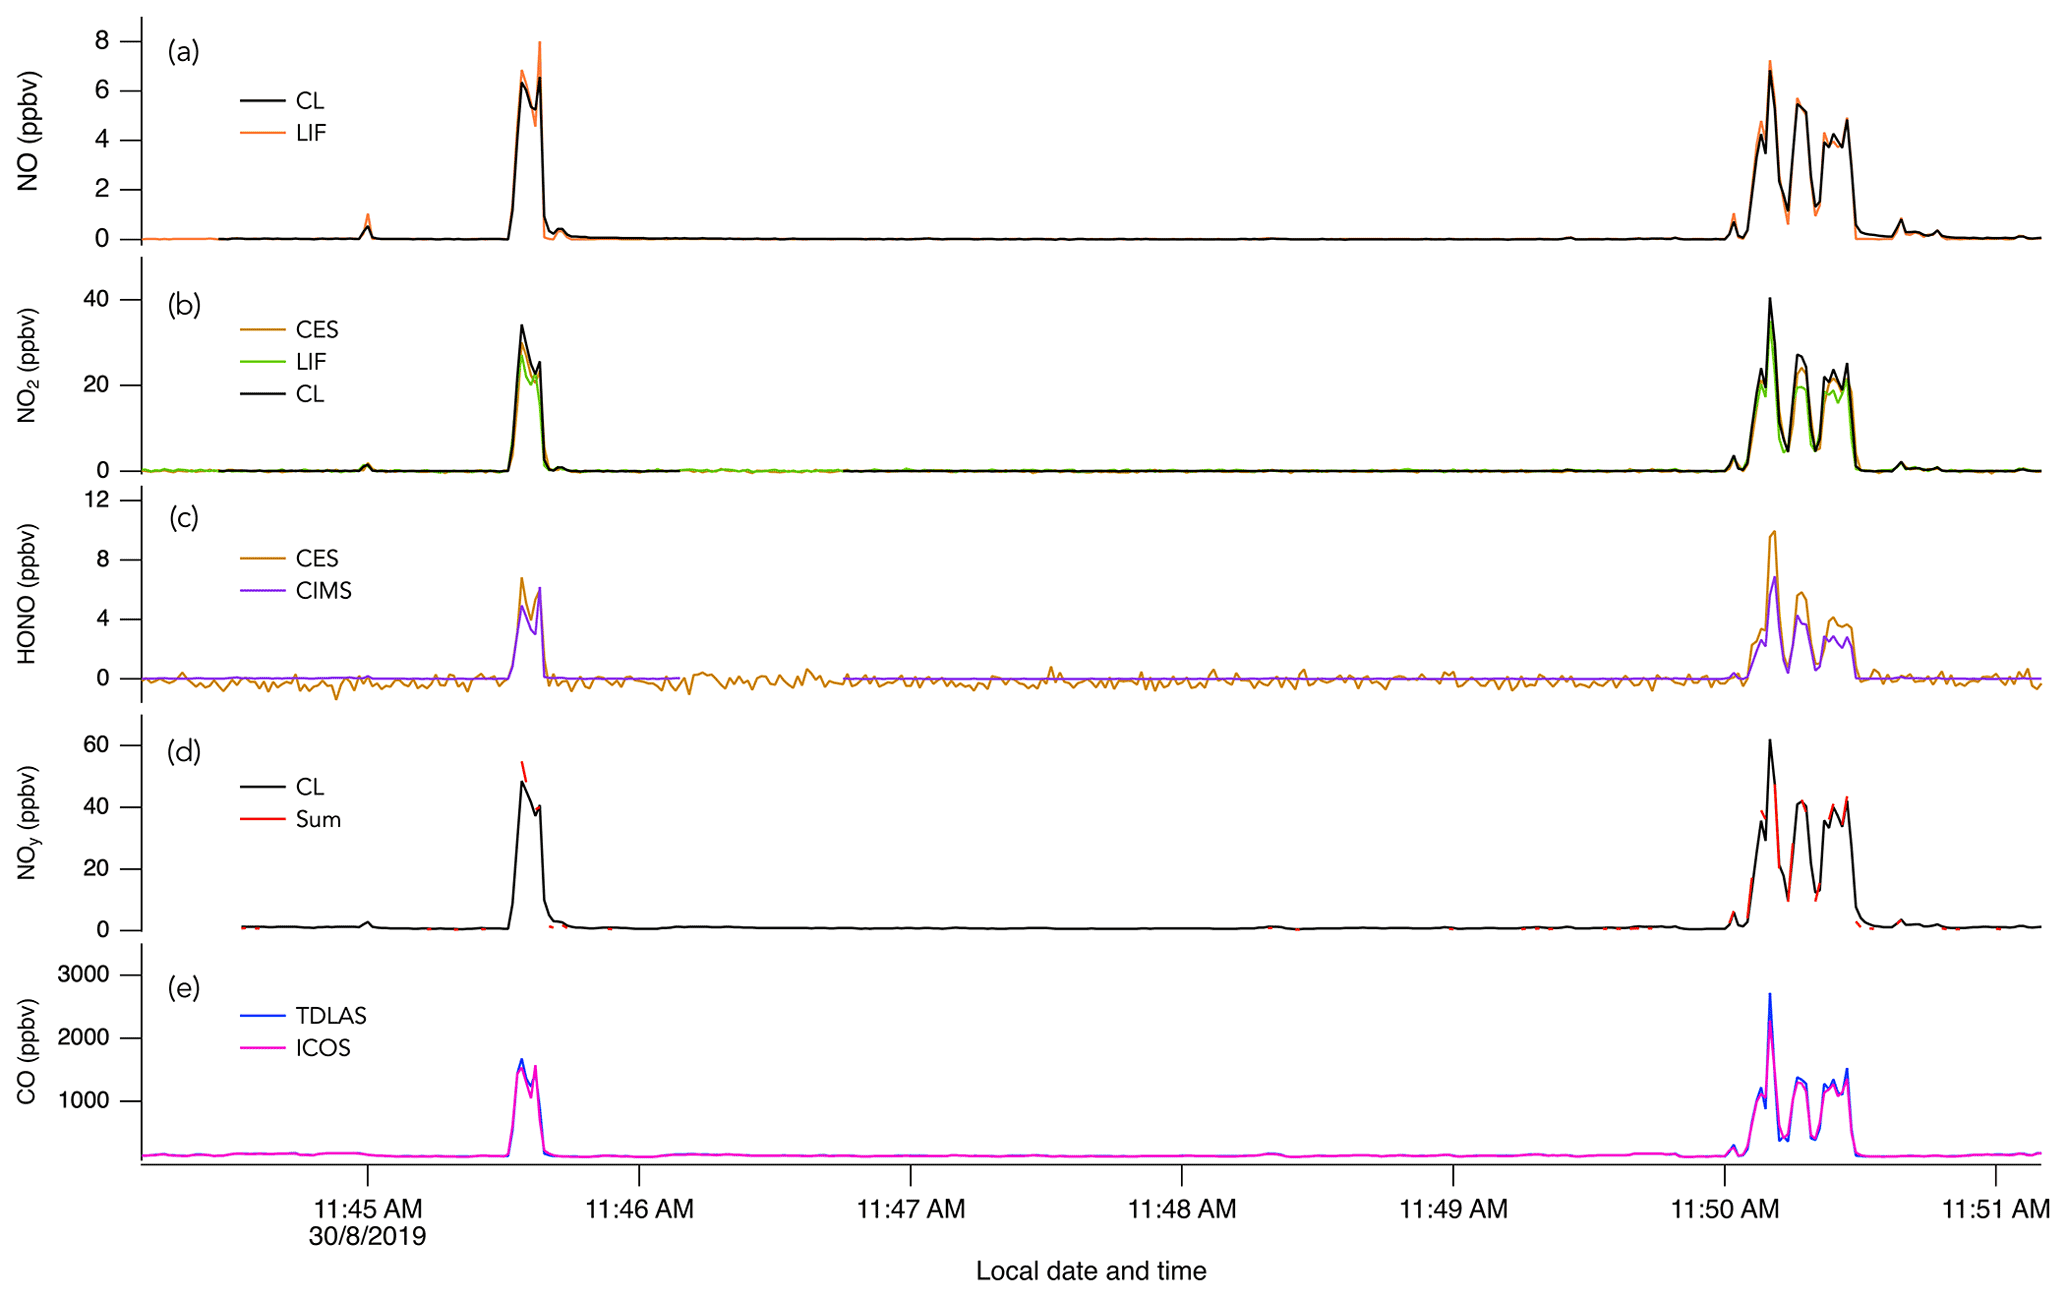
Figure 4The 1 s measurements of (a) NO, (b) NO2, (c) HONO, (d) NOy, and (e) CO during crosswind plume transects of smoke from crop burning in southeastern US on 30 August 2019.
A histogram of the absolute difference between LIF and CL (ΔNOLIF-CL) is shown in Fig. 5a. A total of 90 % of the values were between −44 and 43 pptv, and the whole dataset is normally distributed around 0 ± 0 pptv (central value of the Gaussian fit and standard deviation). ΔNOLIF-CL exhibits no significant correlation with NO and H2O mixing ratios, which suggests that there was no systematic bias between the two instruments over a wide range of NO mixing ratios and environmental conditions (Figs. S9a and 6a). Similar slopes and intercepts were obtained when separately comparing NO measurements during the wildfire, eastern fire, and LA Basin sampling periods (Figs. 2b and S7).

Figure 5Histograms of the absolute difference of 1 s measurements of (a) NO, (b–d) NO2, (e) HONO, (f) NOy, and (g) CO for the entire campaign. Parameters of the Gaussian fit to the histogram are indicated in each panel, with x0 and w0 being the central value and the width of the fit, respectively. Note that in panel (f) a double Gaussian was fitted to the histogram and that the parameters for the second mode are given by x1 and w1.

Figure 6Measurement difference (1 s data) for (a) NO, (b–d) NO2, (e) HONO, (f) NOy, and (g) CO as a function of water vapor for the entire campaign.
3.1.2 Literature aircraft NO measurement comparisons
Overall, the comparison between the two NO instruments shows an agreement within stated uncertainties. While the single-photon LIF detection of NO is a new technique that was evaluated for the first time during FIREX-AQ (Rollins et al., 2020), there are several studies that compared CL detection of NO to other measurement techniques during airborne field campaigns. The Global Tropospheric Experiment Chemical Instrumentation Test and Evaluation (GTE-CITE) was designed in the 1990s to intercompare airborne measurement techniques for trace species including NO, NO2, and CO. Comparison of two CL instruments and a two-photon LIF instrument showed agreement when NO mixing ratios were higher than 50 pptv but pointed out periods of disagreement when NO mixing ratios were lower than 20 pptv (Gregory et al., 1990a; Hoell et al., 1987b). The Deep Convective Clouds and Chemistry (DC3) experiment in 2012 allowed for side-by-side comparison of instruments aboard two aircraft at two level flight legs (7 and 12 km) for flight periods spanning 20–30 min. Pollack et al. (2016) showed that these NO measurements from two CL instruments agreed within 2 % for NO mixing ratios up to 1 ppbv. More recently, Sparks et al. (2019) reported an intercomparison of several NOy species measurements, including NO, from the Wintertime Investigation of Transport, Emissions, and Reactivity (WINTER) airborne experiment over the northeastern US in 2015. During WINTER, NO measured by cavity ring-down spectroscopy (CRDS) and CL differed on average by 16 % across all flights, which is outside of the combined instrument uncertainties. CL measurements were more consistent with an independent calculation of NO based on a photostationary state assumption.
3.2 NO2
3.2.1 Campaign-wide comparison
Three instruments measured NO2 mixing ratios during FIREX-AQ using CL, CES, and LIF detection techniques. The 1 Hz data comparison between all three instruments is shown in Fig. 7. We find that the LIF and CES overall comparison yields a slope (± combined instrument uncertainties) of 1.03 ± 0.08 (R2 = 0.98), well within the combined instrument uncertainties of 8 % (Fig. 7c). However, we find that comparing either the LIF or CES instruments to the CL instrument results in correlation slopes (± combined instrument uncertainties) ranging from 0.88 ± 0.12 to 0.90 ± 0.11 (R2 = 0.97), which is on the upper limit of the 8 %–11 % combined uncertainties for each pair of instruments (Fig. 7a and b). The higher NO2 mixing ratios measured by the CL instrument are further illustrated in the time series in Figs. 3b and 4b and are consistent with a calibration error in one or all instruments or an interference from another species in the CL instrument. However, it is unlikely that the difference between CL NO2 and other NO2 measurements was due to a calibration issue. If so, the CL NO measurement, which was calibrated using the same standard as for the CL NO2 measurement, would also have been 10 %–12 % higher than the NO LIF measurement (which was calibrated using an independent standard). This was not the case during FIREX-AQ (see Sect. 3.1). HONO is a known source of interference in measured NO2 by instruments that use photolysis in the near-UV region (Pollack et al., 2010). However, this interference was determined to be low (less than 5 % of HONO concentration; typical HONO to NO2 ratios ranged between 0.2–0.4 during FIREX-AQ) following laboratory tests using a HONO calibration source (Lao et al., 2020), and the NO2 measurement by CL was corrected for it. Additionally, we did not find a correlation between either ΔNO2CES-CL or ΔNO2LIF-CL and HONO mixing ratios. There was better agreement between the CL and the other two instruments when sampling the wildfires (slopes of 0.91) than the eastern fires (slopes of 0.75 and 0.87 for the LIF and CES, respectively) (Fig. 7d and e). Similarly, the agreement between the CES and the LIF instruments was near perfect during the first period (slope of 1.00) but worse during the latter period (slope of 1.13; Fig. 7f). Note that the LIF instrument did not report data for three flights out of seven during the eastern fires sampling period. The increased difference may be caused by the physical distance between instrument inlets combined with higher spatial heterogeneity of trace gases in the smaller and thinner eastern fire plumes, although higher mixing ratios of a potential interferent may still exist. Non-acyl peroxynitrate species such as pernitric acid (HO2NO2) and methyl peroxy nitrate (MPN) can be abundant in smoke plumes and interfere with NO2 measurements (Browne et al., 2011; Nault et al., 2015). This interference is the result of the thermal dissociation of HO2NO2 and MPN in heated inlets and sampling lines and impact each instrument differently depending on their flush time. During FIREX-AQ, the CES and CL instruments had similar flush time of about 750 ms, meaning that the thermal decomposition of non-acyl peroxynitrates is unlikely to explain the 10 %–12 % higher NO2 signal in the CL instrument. Further, ΔNO2CES-CL or ΔNO2LIF-CL did not depend on altitude or outside temperature, which also suggests little influence from thermally labile species. Nitrated phenolic compounds can be abundant in aged smoke (Decker et al., 2021) and have large UV cross sections (Chen et al., 2011). They are unlikely to contribute to the interference as their NO2 photolysis quantum yields are very low. Nevertheless, further laboratory work on the NO2 interference of such species in photolytic converters is of interest. The agreement between all three instruments for individual flights was generally within combined instrument uncertainties but with some variability (Figs. S11–S13).

Figure 7NO2 measurements by LIF, CES, and CL with (a–c) all 1 s data on a linear scale, (d–f) all 1 s data on a log scale, and (g–i) integrals of 208–320 crosswind smoke plume transects. N is the number of independent 1 s observations or smoke plume transects that are compared. In panels (d)–(f), the three sampling periods are shown in different colors, with the wildfires sampling period in red, the eastern fires sampling period in mustard, and the Los Angeles (LA) Basin flights in grey. The red lines indicate the fit of the data. The dotted black lines are the 1 : 1 line.
Histograms of the absolute difference between CES, LIF, and CL (ΔNO2LIF-CL, ΔNO2CES-CL, and ΔNO2CES-LIF) are shown in Fig. 5b–d. A total of 90 % of ΔNO2LIF-CL, ΔNO2CES-CL, and ΔNO2CES-LIF values were between −298 and 338, −469 and 302, and −576 and 393 pptv, respectively, and all are normally distributed around the central value of the Gaussian fit of 0.038 ± 0.001, −0.052 ± 0.001, and −0.071 ± 0.001, respectively. ΔNO2LIF-CL, ΔNO2CES-CL, and ΔNO2CES-LIF exhibit no significant trend with H2O mixing ratios (Fig. 6b–d), yet ΔNO2LIF-CL and ΔNO2CES-CL were weakly (R2 = 0.36 and 0.31, respectively) correlated with the absolute NO2 mixing ratio (Fig. S9b and d).
3.2.2 Literature aircraft NO2 measurement comparisons
Previous comparisons of NO2 airborne measurements often show periods of disagreement between instruments, although there were some occasions where instruments agreed within stated uncertainties. During the GTE-CITE experiment, the comparison of NO2 measurements using a two-photon NO LIF system with laser photolysis of NO2 to NO with a CL detector equipped with a xenon arc lamp for NO2 photolysis into NO showed agreement within 30 %–40 % (Gregory et al., 1990b). Pollack et al. (2016) showed that two NO2 measurements, both using CL but each in a different aircraft, agreed within 28 % during the DC3 campaign. During WINTER, NO2 measurements by CRDS and LIF agreed with an average proportional bias of 2 % across all flights – well within combined uncertainties (Sparks et al., 2019). During SENEX, three techniques were used to measure NO2: a CRDS instrument, a CES instrument, and a CL instrument. The agreement between CRDS and CES measurements with the CL technique was on average 6 % and 10 % (Warneke et al., 2016).
3.3 HONO
3.3.1 Campaign-wide comparison
The 1 Hz data comparison between the CES and the CIMS instruments is shown in Fig. 8, and time series of HONO measurements in wildfires and eastern fires are shown in Figs. 3c and 4c, respectively. The correlation between the CES and CIMS was very high in each plume transect (Figs. 3c and 4c), but the overall comparison yielded a slope (± combined instrument uncertainties) of 1.80 ± 0.16 (R2 = 0.77) and an intercept of −0.12 ± 1.10 ppbv (Fig. 8a). Integrating across plume transects yielded a slope of 1.34 ± 0.16 (Fig. 8c). The CIMS consistently reported less HONO than the CES in smoke plumes, and the average slope between the two measurements was considerably greater during the eastern fires compared to the wildfires (Figs. 8b and S9). However, flight averages of the absolute difference between the two measurements (ΔHONOCES-CIMS) ranged between −332 and 245 pptv throughout the campaign and were similarly scattered around zero during the two different time periods (Fig. S14). A histogram of ΔHONOCES-CIMS is shown in Fig. 5e. A total of 90 % of the values were between −965 and 880 pptv, and the whole dataset is normally distributed around the central value of the Gaussian fit (± standard deviation) of −119 ± 2 pptv. ΔHONOCES-CIMS exhibits no significant slope with HONO (Fig. S9e). While the deployment out of Salina was operated under noticeably more humid conditions (H2O ranged from 0.002 % to 2.944 %) than out of Boise (H2O ranged from 0.004 % to 1.479 %), we find no significant correlation between ΔHONOCES-CIMS and H2O mixing ratios (Fig. 6e).

Figure 8The same as Fig. 2 but comparing HONO measurements by CES and CIMS. No slope is given for the Los Angeles (LA) flights in panel (c) as most of the HONO signal at that time was below the instruments' detection limits. Data from the entire campaign are presented in panels (a) and (b).
However, further laboratory studies, field measurements, and examination of this comparison has revealed that the CIMS sensitivity to HONO is reduced when the instrument reaches temperatures greater than 30 ∘C (Fig. S15). This sensitivity dependence on temperature does not affect all compounds measured by the CIMS, and the sensitivity to Cl2 and HNO3 used for in-flight calibrations was independent of instrument temperature. The aircraft cabin temperature was greatest during the eastern agricultural flights, when the CIMS instrument temperatures were often 40 ∘C and far greater than the typical 25 ∘C instrument temperatures in the laboratory when the CIMS HONO sensitivity was determined. As a consequence, the reported CIMS HONO values were spuriously low, especially during the eastern fires, and particularly later in flights when the aircraft temperatures were greatest. This intercomparison has yielded new insights into the CIMS HONO detection sensitivity, and future work will identify and implement appropriate corrections to this measurement (Robinson et al., 2022).
3.3.2 Literature aircraft and ground HONO measurement comparisons
The interpretation of the literature suggests that HONO measurements are notoriously difficult due to the potential for artifacts associated with inlet surfaces and interferences associated with some methods (e.g., Kleffmann et al., 2006; Xu et al., 2019). Past ground-based intercomparisons often revealed significant discrepancies in HONO measurements. For example, six ground-based HONO measurement techniques including a CIMS instrument were compared during the Study of Houston Atmospheric Radical Precursors (SHARP) campaign in 2009 (Pinto et al., 2014). While three out of six of these techniques agreed within 20 %, larger deviations were found when the other three instruments were considered and attributed to the physical separation of these instruments. Three different techniques, including a CIMS instrument, were used to measure HONO in the urban area of Shanghai, China (Bernard et al., 2016). The percent difference between these measurements ranged from 27 % to 46 %. In 2019, six HONO measurement techniques were again compared in a Chinese urban area, this time in Beijing, and included a CIMS instrument and two broadband cavity-enhanced absorption spectrometers (BBCEAS) (Crilley et al., 2019). Percent differences up to 39 % were observed during this intercomparison and again attributed to the physical distance separating inlets coupled to high spatial heterogeneity of HONO mixing ratios. Airborne measurements of HONO by CIMS and CES were made during the Southeast Nexus Experiment (SENEX), and the CES instrument was approximatively 25 % higher than the CIMS instrument (Neuman et al., 2016).
3.4 NOy
3.4.1 Campaign-wide comparison
The 1 Hz data comparison between the total NOy measurement by CL and ΣNOy is shown in Fig. 9. ΣNOy definition is given by Eq. (2) (see Sect. 2.2.6). C1–C5 alkyl nitrates and other minor NOy species (including ClNO2, N2O5, CH3NO2, and alkene hydroxy nitrates) contributed less than 7 % of the NOy budget on average and were not included in ΣNOy (Fig. 10). Based on comparisons of HR-AMS pNO3 with on-board filters collecting aerosols with a size cut around 4 µm (Dibb et al., 2002; Brock et al., 2019), coarse-mode particulate nitrate did not significantly contribute to the total NOy budget during FIREX-AQ. Additionally, coarse-mode particulate nitrate was not measured by either the HR-AMS or the NOy inlet in the CL instrument and therefore does not contribute to the intercomparison presented here. The overall comparison yielded a slope (± combined instrument uncertainties) of 1.00 ± 0.25 (R2 = 0.98) and an intercept of −0.52 ± 0.01 ppbv (Fig. 9a). The regression analysis of smoke plume-integrated NOy mixing ratios yields a slope of 1.00 (R2 = 0.99) for the whole dataset (Fig. 9c). Comparison ΣNOy to CL NOy in fresh (< 1 h since emission) and aged (> 1 h since emission) smoke during the wildfires sampling period showed similar agreement (slopes of 0.98 and 1.05, respectively) despite the chemical evolution of NOy species, highlighted by the different proportion of those species to the NOy balance (Fig. S16). Including minor NOy species (i.e., ClNO2, N2O5, CH3NO2, and alkene hydroxy nitrates) in the ΣNOy had little effect on the correlation between ΣNOy and CL NOy and resulted in a slope of 1.02 ± 0.25 (R2 = 0.94) and an intercept of −0.68 ± 0.01 ppbv (Fig. S17).
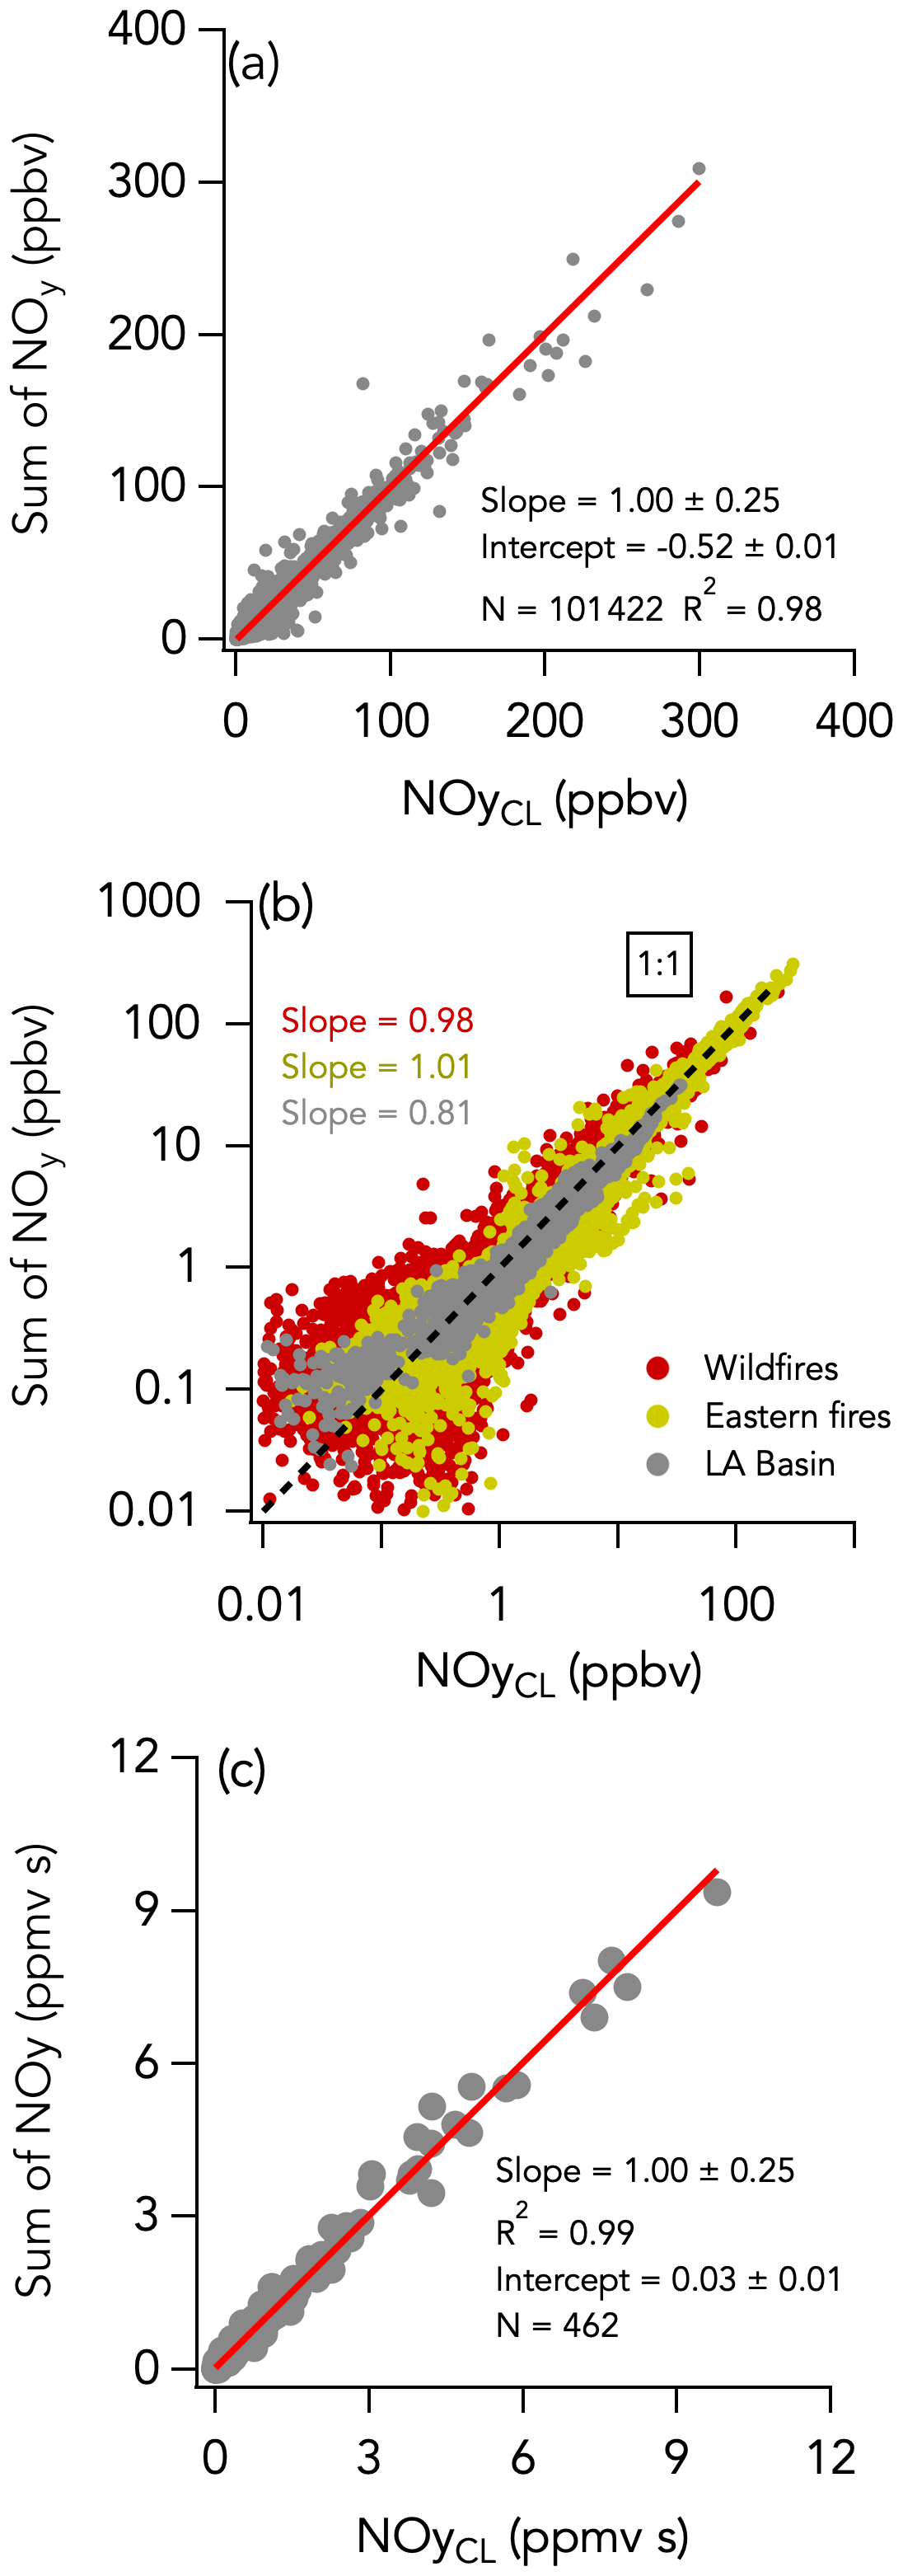
Figure 9The same as Fig. 2 but comparing the sum of individually measured NOy species (= NOx + HONO + HNO3 + APNs + pNO3) with the total NOy measurement by CL. Data from the entire campaign are presented in panels (a) and (b).

Figure 10Contribution of individually measured reactive odd nitrogen species to the total NOy budget during FIREX-AQ. The campaign is separated in three periods (wildfires sampling period in red, eastern fires sampling period in yellow, and Los Angeles (LA) Basin flights in grey). Panel (a) shows the NOy budget in smoke plumes, while panel (b) shows that in background air. C1–C5 alkyl nitrates are referred to as C1–C5 ANs. Other nitrogen species include N2O5, CH3NO2, and alkene hydroxy nitrates. The box and whisker plots show the 10th, 25th, 50th, 75th, and 90th percentiles.
Despite this correlation, two modes are apparent in the overall distribution of the absolute difference (ΔNOyCL-Sum) between ΣNOy and the total NOy measurement (Fig. 5f). The first mode is distributed around −0.068 ± 0.001 ppbv (central value of the first mode of the Gaussian fit), while the second is distributed around an average value of 0.158 ± 0.009 ppbv (central value of the second mode of the Gaussian fit). Separating the comparison into three time periods reveals that this two-mode distribution of ΔNOyCL-Sum comes from the eastern fires sampling period and from the LA Basin flights, whereas during the wildfires sampling period ΔNOyCL-Sum distribution is unimodal (Fig. 11).
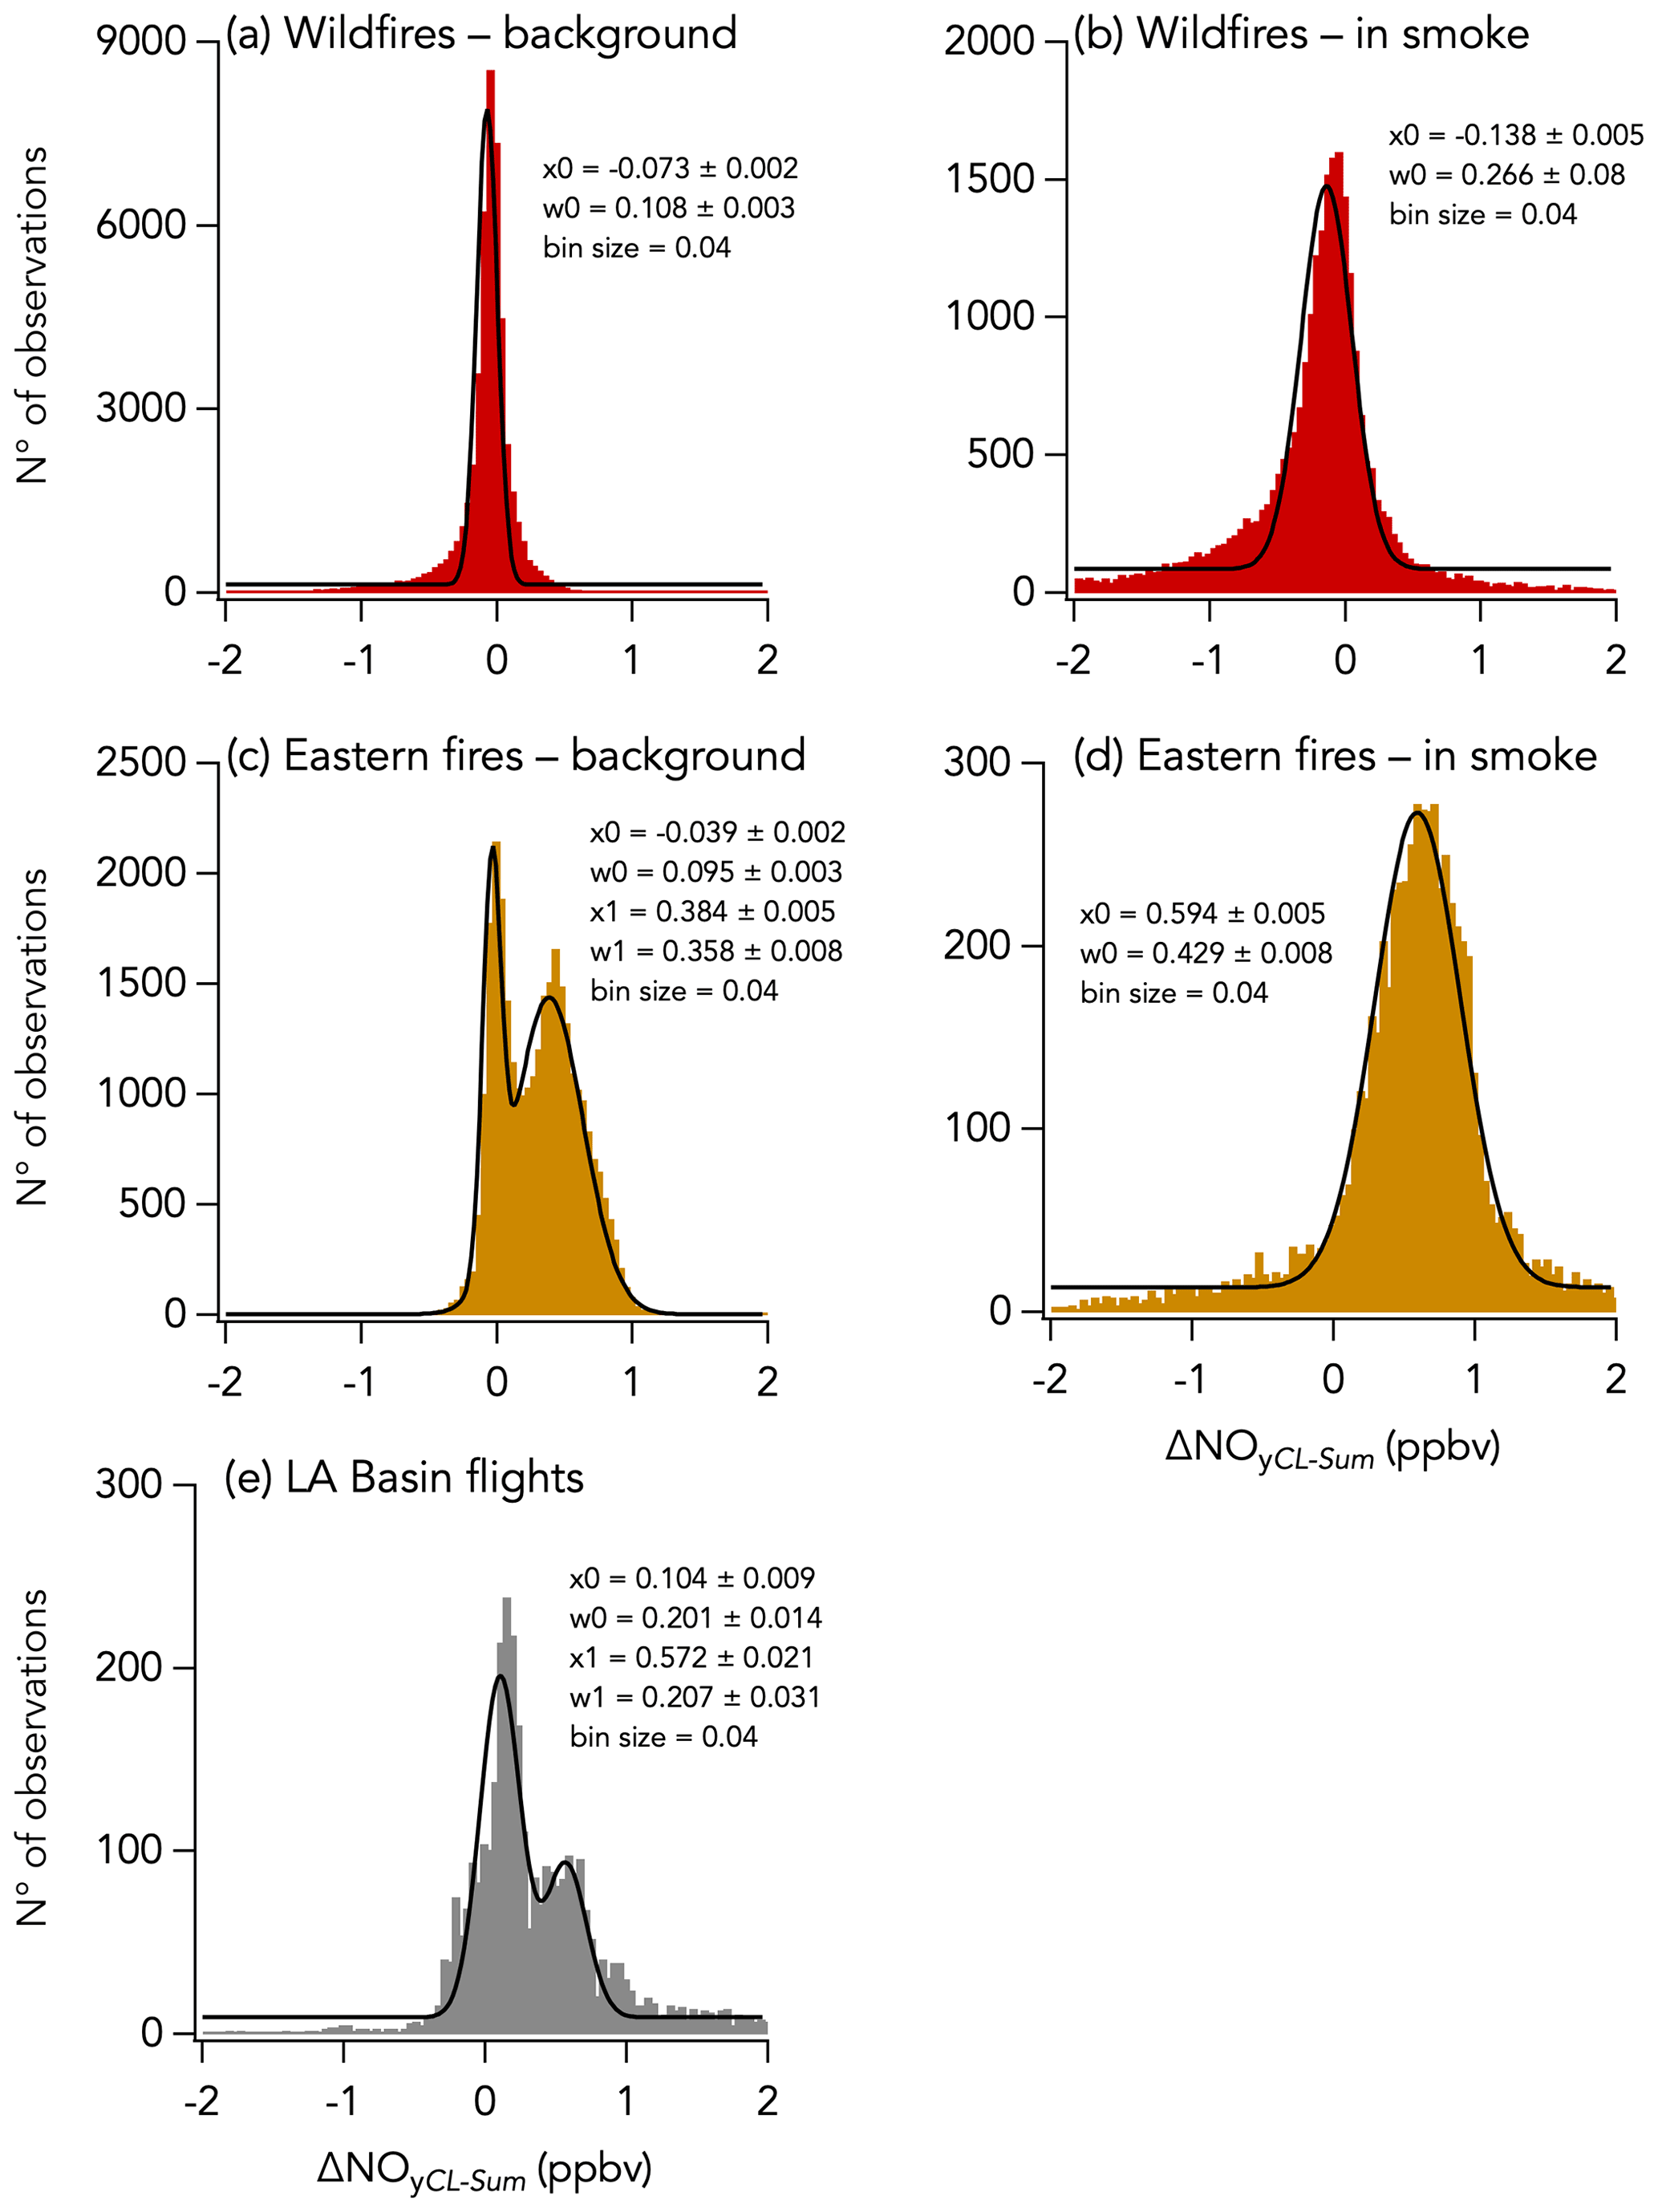
Figure 11Histograms of ΔNOyCL-Sum for three sampling periods during FIREX-AQ with the wildfires sampling period in red, the eastern fires sampling period in yellow, and the Los Angeles (LA) Basin flights in grey. Further separation was made between in-smoke measurements (b, d) and background air measurements (a, c, e). Parameters of the Gaussian fit to the histogram are indicated in each panel, with x0 and w0 being the central value and the width of the fit, respectively. Note that in panels (c) and (e) a double Gaussian was fitted to the histogram and that the parameters for the second mode are given by x1 and w1.
Higher ΣNOy compared to NOy (first mode) could be explained by (i) a lower conversion efficiency of one or more NOy species in the CL instrument than estimated in the laboratory, (ii) sampling loss of pNO3 through the NOy inlet, and (iii) inaccuracy in one or more of the individual NOy species measurement techniques. Here, we further investigated the sampling loss of pNO3 through the CL instrument NOy inlet using a multistage flow model following the template of the Particle Loss Calculator (von der Weiden et al., 2009). The model calculates aerodynamic losses at each stage of the NOy inlet and provides the resulting total pNO3 sampling efficiency (See Sect. S1 and Fig. S1). We find that the main aerosol sampling loss occurs at the NOy inlet tip orifice (1.0 mm in diameter) due to the inlet orientation (perpendicular to the aircraft flight direction). Additional loss was calculated to be negligible once pNO3 penetrated the NOy inlet, meaning that pNO3 is fully volatilized into NO inside the heated gold catalyst (Miyazaki et al., 2005; see Sect. S1 and Fig. S1). Particle sampling through the NOy inlet is highly dependent on altitude, air speed (see Sect. S1 and Fig. S2), and pNO3 mass size distribution (Fig. 12a). Figure 12b shows the average modeled particle sampling fraction through the NOy inlet, given as a ratio where a value of 1 means the total pNO3 is sampled, for each flight during FIREX-AQ. Particle sampling fraction was calculated for three different air speeds for each flight: 40 %, 65 %, and 100 % of the aircraft speed. An assumed sampled air speed of 65 % that of the aircraft improved the correlation between ΔNOyCL-Sum and the modeled pNO3 loss in the inlet (see Sect. S1 and Fig. S2). At that speed, the calculated average particle sampling fraction varied between 0.36 and 0.99 for each flight (Fig. 12b). The variability in the ΣNOy to NOy correlation slope between aged and fresh smoke (Fig. S16a) likely illustrates the non-quantitative sampling of pNO3 in the NOy instrument. Indeed, higher ΣNOy than measured NOy in aged smoke (slope of 1.05), where pNO3 is one of the main components of ΣNOy (Fig. S16b), may be explained by the non-quantitative sampling of pNO3 in the NOy instrument. In fresh smoke, pNO3 is a smaller component of NOy, and non-quantitative sampling of pNO3 in the CL instrument may have less impact on the comparison (slope of 0.98).
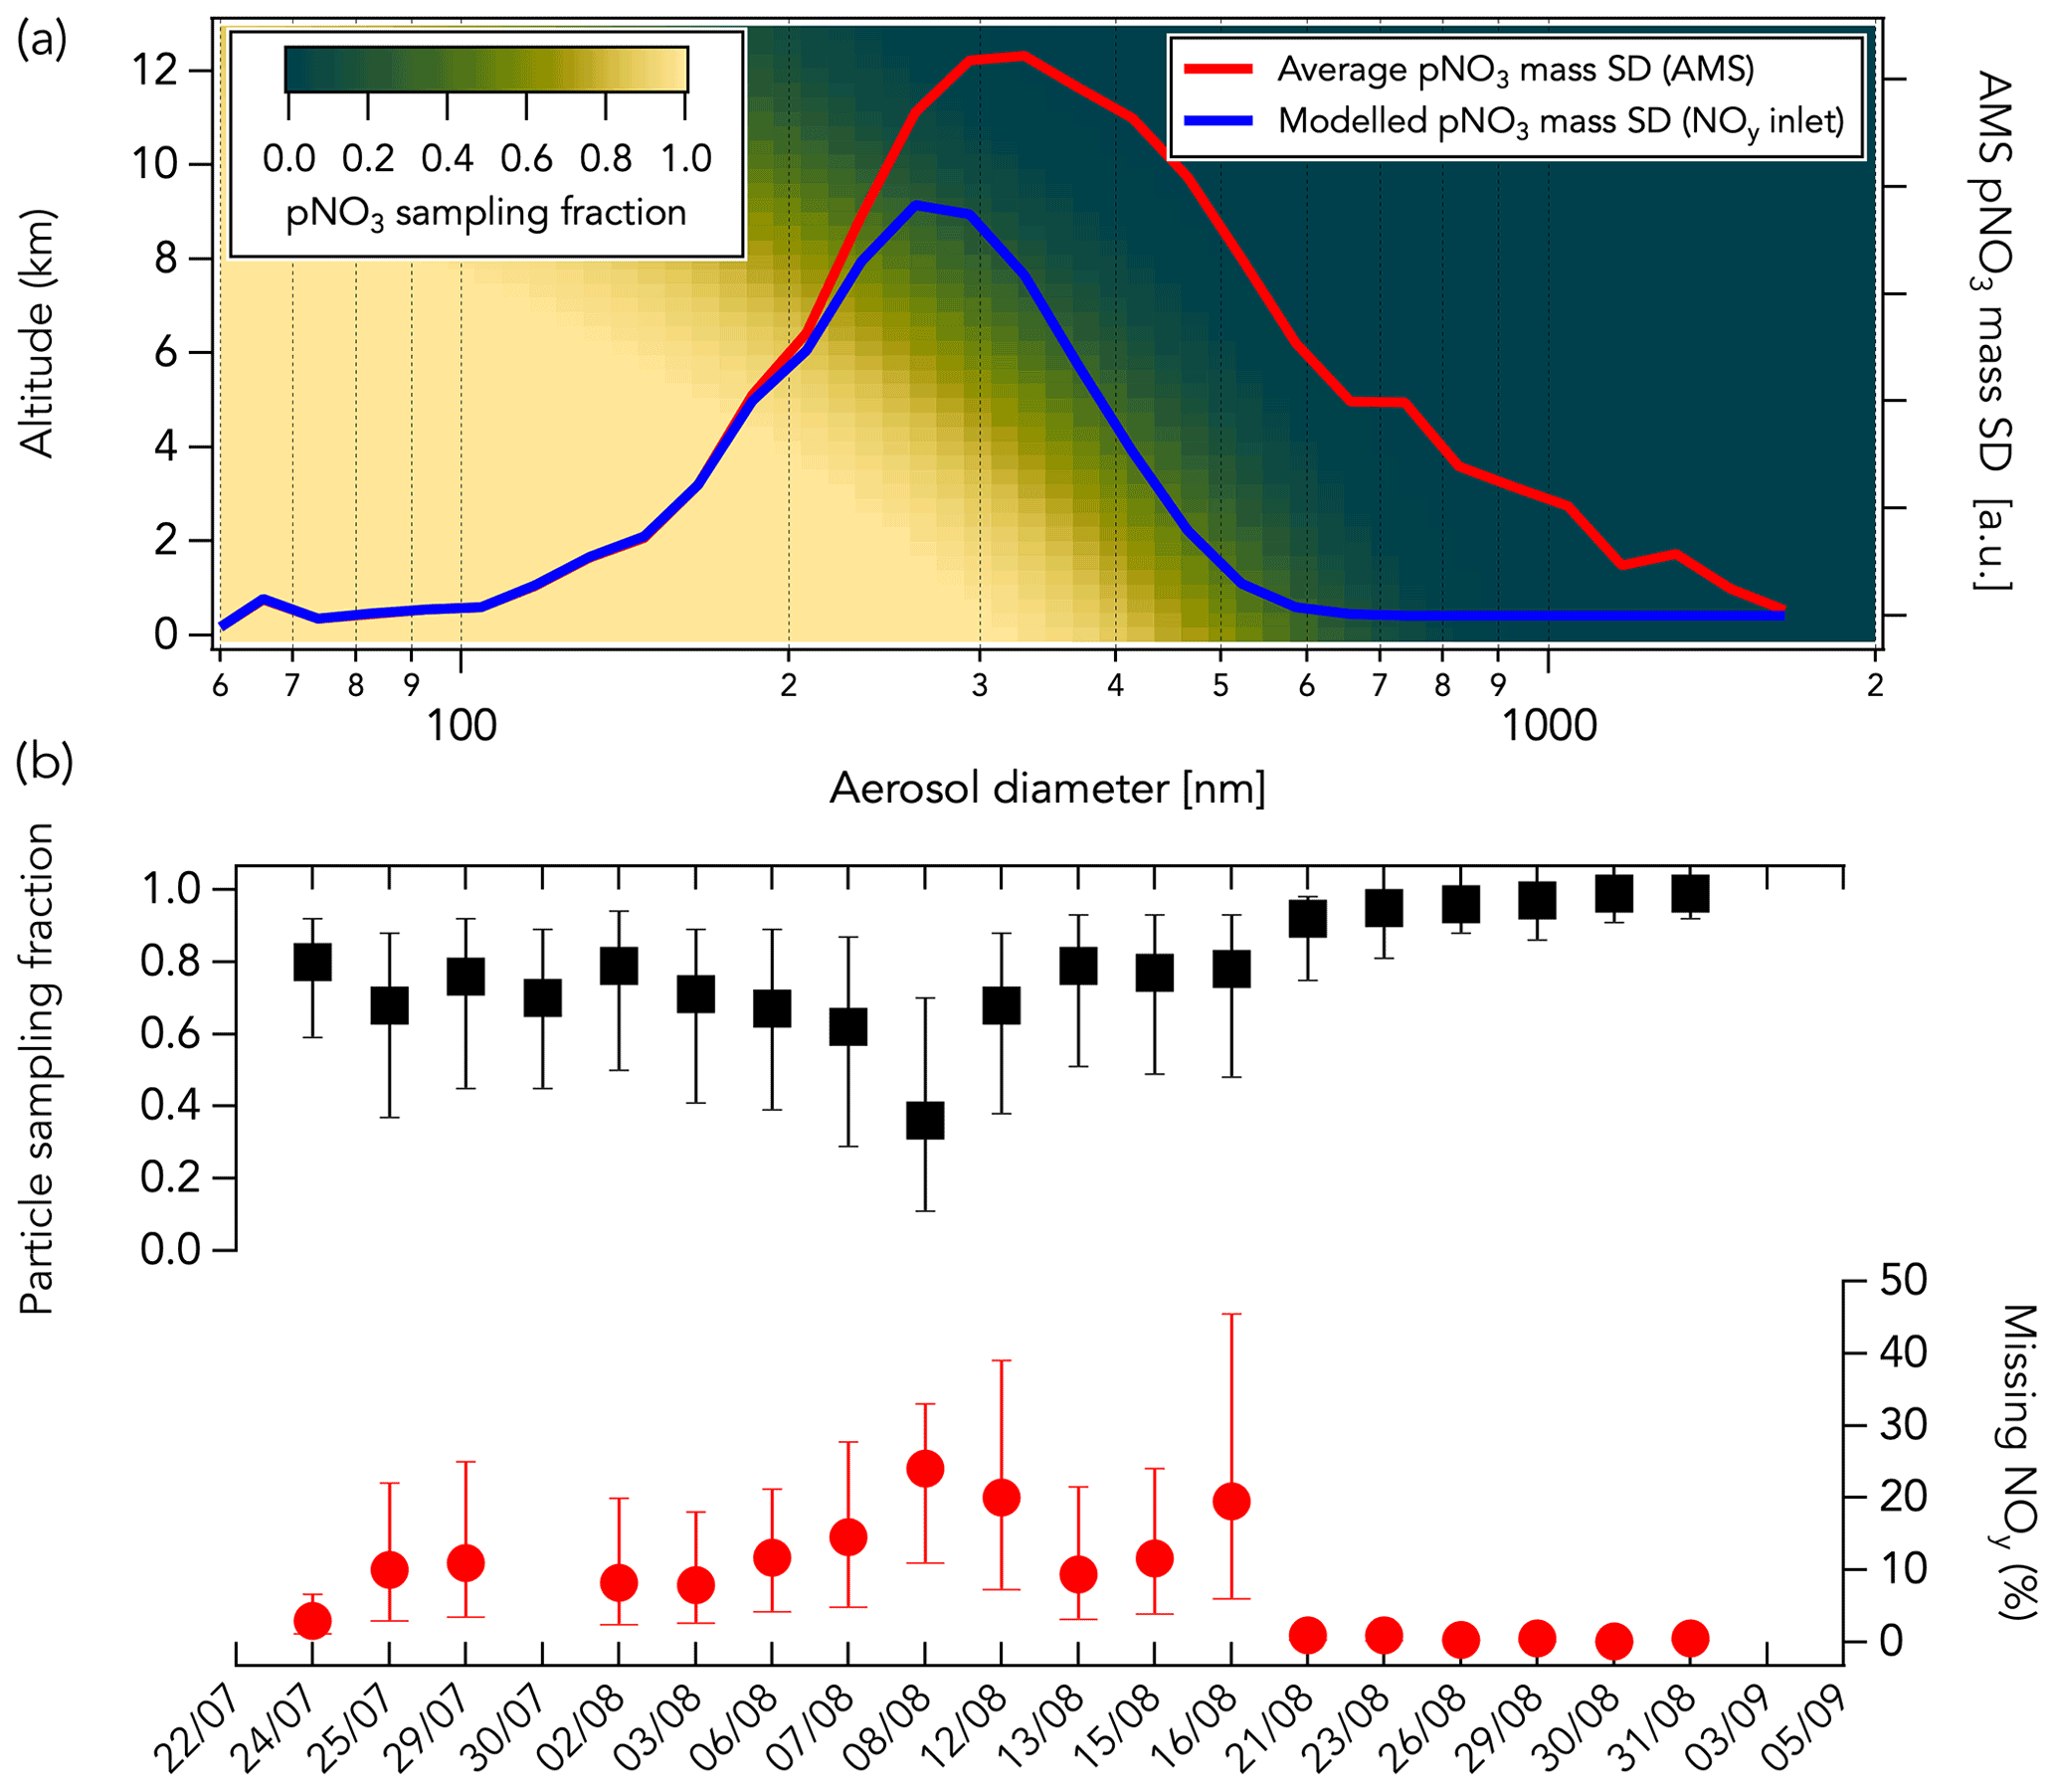
Figure 12(a) The modeled pNO3 sampling fraction through the NOy inlet as a function of altitude and pNO3 mass size distribution (SD) is shown with a gradient of color from green (low sampling fraction) to yellow (high sampling fraction). The average pNO3 mass size distribution measured in the Williams Flat fire smoke on 7 August 2019 by HR-AMS is shown in red. The modeled pNO3 size distribution sampled in the NOy inlet assuming an altitude of 5 km and a sampled air speed 65 % that of the aircraft is shown in blue. In this example case, the sampled pNO3 mass fraction is ∼ 50 %. (b) The average modeled particle sampling fraction in the NOy inlet (in black) and the corresponding percentage of measured NOy that may be unaccounted for (in red) are shown for each flight assuming a sampled air speed of 40 % (bottom bars), 65 % (markers), and 100 % (top bars) that of the aircraft speed. The sampling fractions were calculated using bulk aerosol volume distributions measured by a laser aerosol spectrometer (see Sect. S1 and Fig. S3). The missing NOy corresponds here to the percentage of measured NOy that pNO3 not sampled through the NOy inlet represents. Data shown in panel (b) are from air in smoke only.
We calculated the fraction of measured NOy in smoke initially attributed to pNO3 that may result from other reactive nitrogen species than those included in the ΣNOy according to Eq. (3):
where particle sampling fraction corresponds to the modeled pNO3 sampling fraction in the NOy inlet. We found that missing NOy accounted for 0 %–24 % of the measured NOy in smoke (assuming a sampled air speed 65 % that of the aircraft; Fig. 12b). This additional contribution has a large uncertainty because the model may underestimate pNO3 sampling through the NOy inlet due to the large uncertainty when the losses are calculated at high air speed (see Sect. S1). Further, we used bulk aerosol volume size distributions measured with a laser aerosol spectrometer (LAS; Moore et al., 2021) to derive pNO3 sampling fractions in Fig. 12b as pNO3 mass size distribution measurements were not available for all flights during FIREX-AQ. At a typical FIREX-AQ sampling altitude of 5 km, the LAS and HR-AMS size distributions can differ by about 10 % (see Sect. S1 and Fig. S3), which adds to the uncertainty of the pNO3 sampling fraction through the NOy inlet. Correcting for particle sampling through the NOy inlet still yields an agreement between measured NOy and ΣNOy that is within the combined instrument uncertainties of 25 %.
On the other hand, the positive ΔNOyCL-Sum mode (second mode) may indicate either an inaccuracy in one of the individual NOy species measurement techniques or an NOy species that has not been measured. Further, we find that positive ΔNOyCL-Sum occurred both in smoke (Fig. 11d) and in background air (Fig. 11c) when sampling the eastern fires and that ΔNOyCL-Sum exponentially decreased with altitude, a pattern also observed during the LA Basin flights but not during the wildfires sampling period (Fig. 13b). Note that flight altitude when sampling the wildfires was 4.6 km on average, higher than the altitude average of 0.6 and 1.1 km during the eastern fires and the LA Basin flights, respectively. Both water vapor and C1–C5 alkyl nitrates (not included in ΣNOy thus far) were enhanced at lower altitude and may be possible causes for the positive ΔNOyCL-Sum mode. Alkyl nitrates have been shown to account for a significant fraction of the NOy budget in past studies (e.g., Fisher et al., 2016; Hayden et al., 2003; Horii et al., 2006). However, we find only a weak correlation between ΔNOyCL-Sum and C1–C5 alkyl nitrates during both the wildfires (R2 = 0.07) and eastern fires (R2 = 0.08) sampling periods (Fig. 13c). The correlation is stronger (R2 = 0.44) during the LA Basin flights (Fig. 13c). Further, we find that C1–C5 alkyl nitrates contributed similarly to the NOy budget when smoke from the wildfires (1.1 % on average) and the eastern fires (0.8 % on average) was sampled (Fig. 10a), while the positive mode in the ΔNOyCL-Sum distribution is present in the latter period only. H2O is a known source of interference in most instruments, and its impact on measurements is minimized when an accurate correction can be applied. Increasing ΔNOyCL-Sum is associated with increasing H2O mixing ratios in the eastern fires, although the correlation is weak (R2 = 0.05) due to the elevated scatter of the data (Fig. 13a). Similar slopes and intercepts were obtained when separately comparing NOy measurements in smoke from the wildfires and eastern fires (Figs. 9b and S13). The slope of 0.81 during the LA Basin flights may be caused by the lower precision of ΣNOy than that of the CL NOy (Fig. 9b).
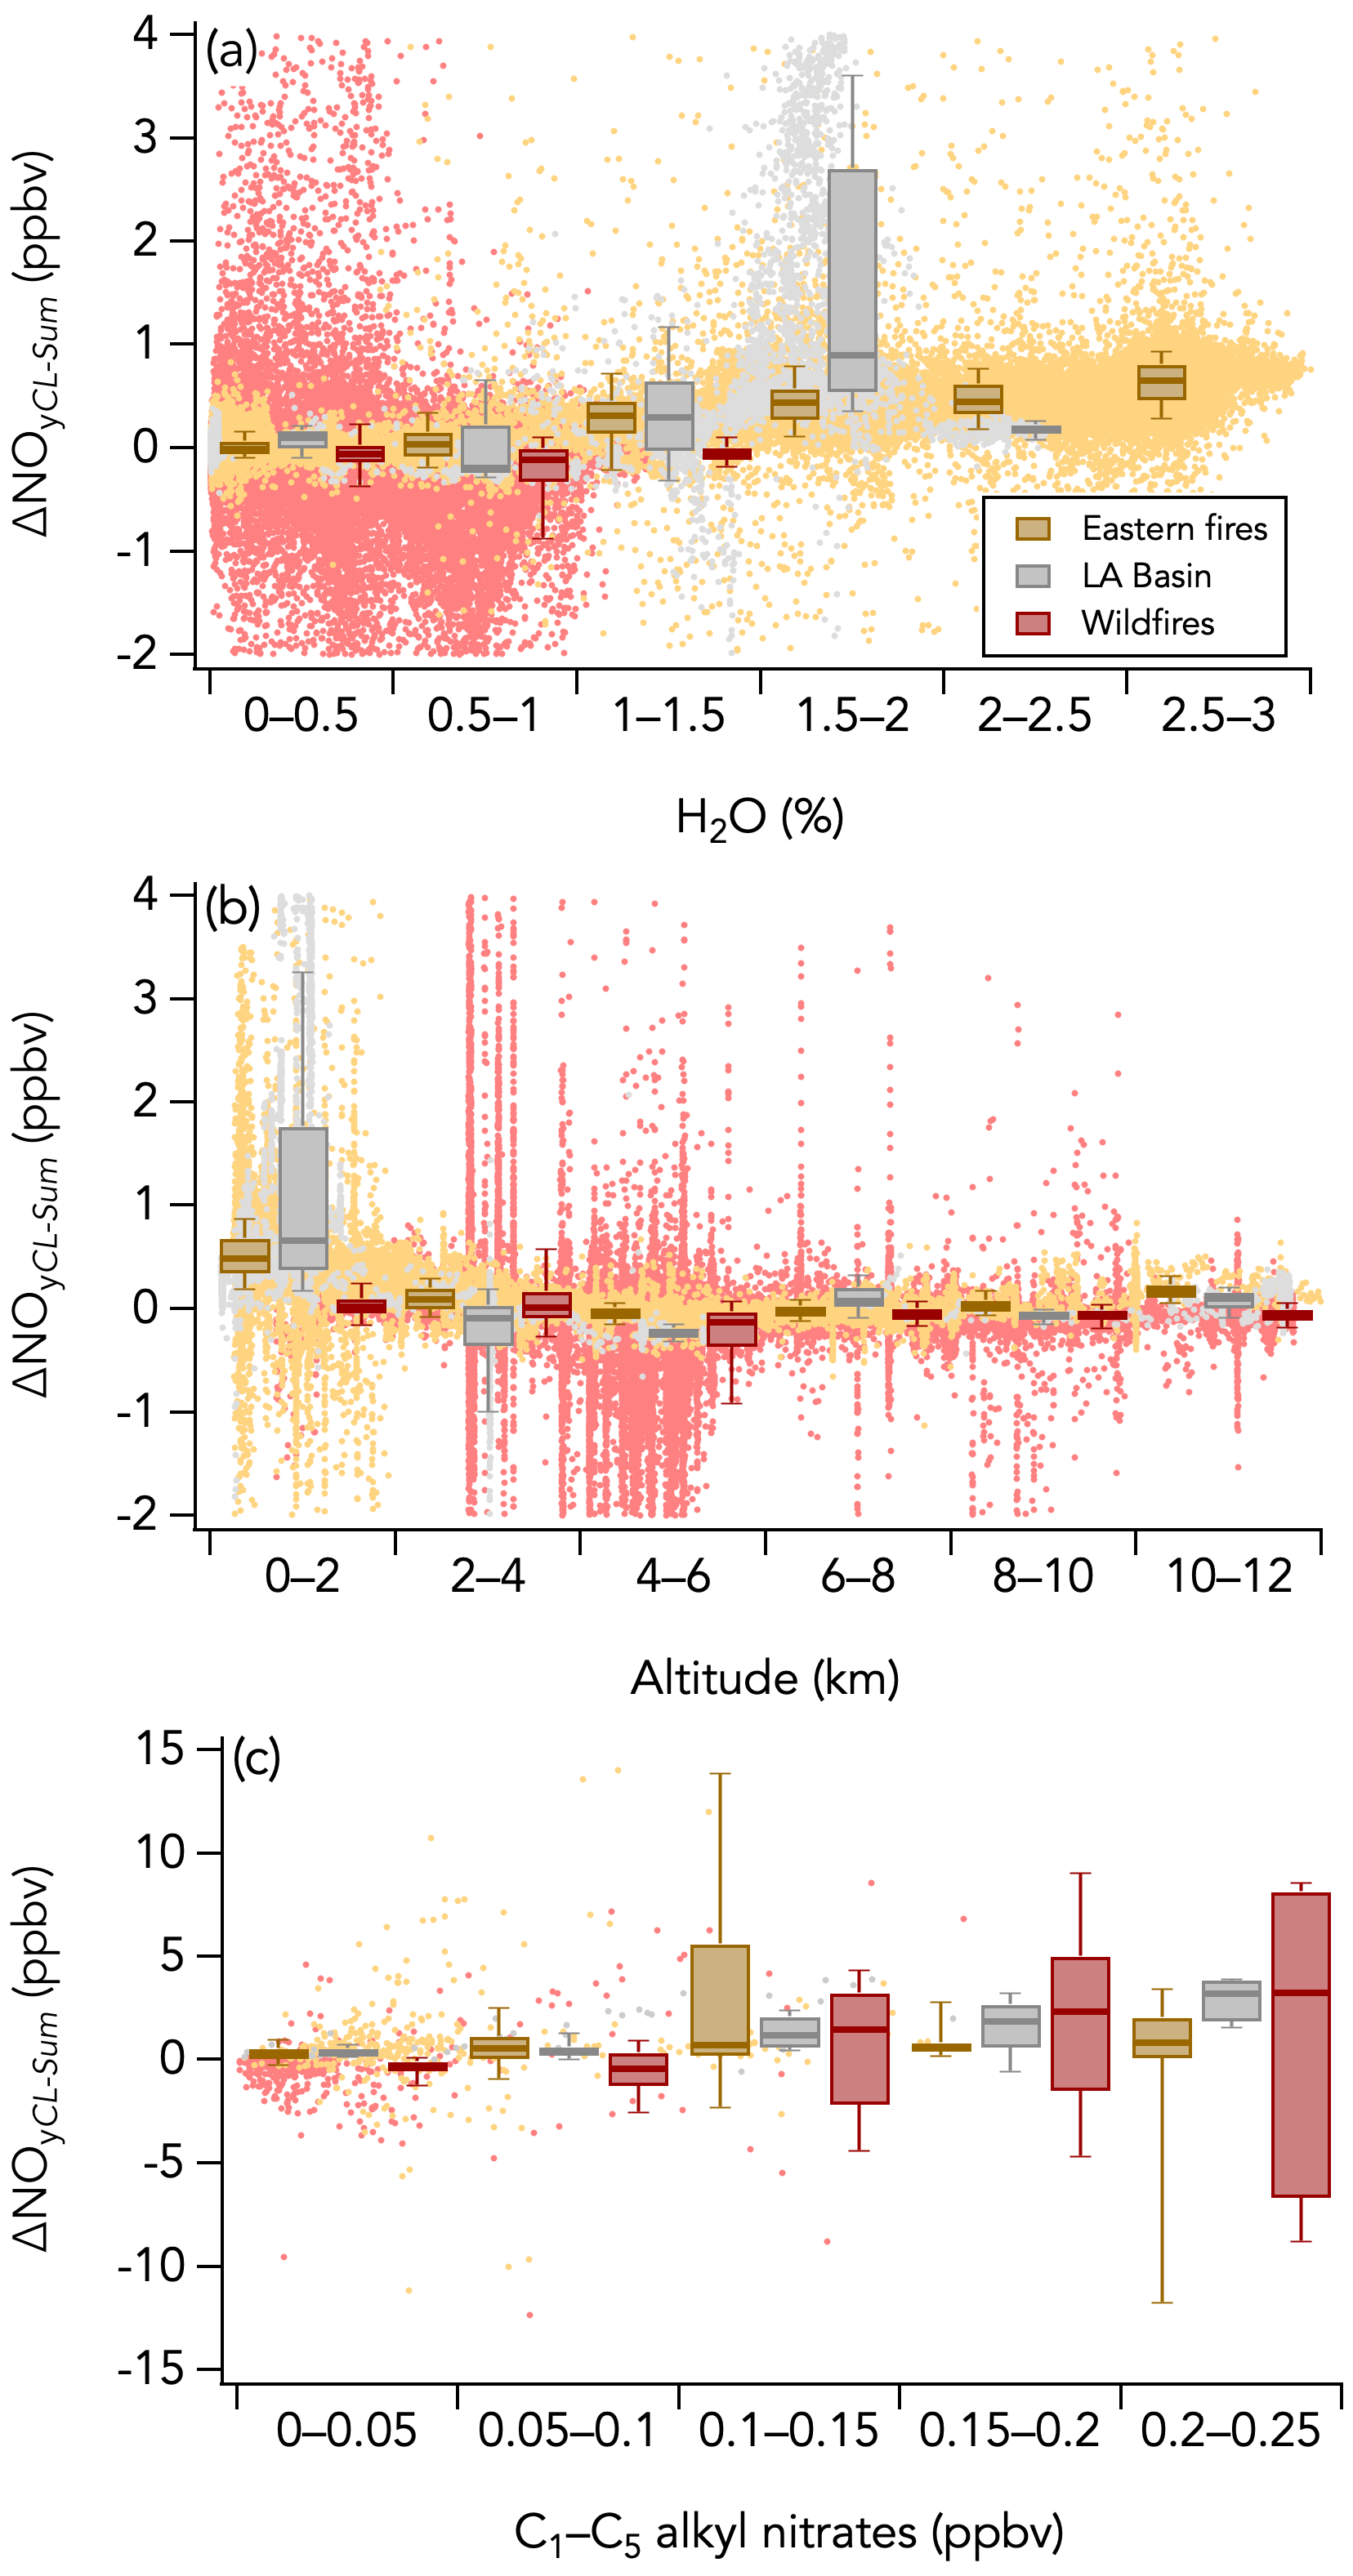
Figure 13Scatterplots of (a) ΔNOyCL-Sum vs. H2O, (b) ΔNOyCL-Sum vs. altitude, and (c) ΔNOyCL-Sum vs. C1–C5 alkyl nitrates measured by the iWAS instrument for three sampling periods during FIREX-AQ (wildfires sampling period in red, eastern fires sampling period in yellow, and Los Angeles (LA) Basin flights in grey). The box and whisker plots show the 10th, 25th, 50th, 75th, and 90th percentiles of ΔNOyCL-Sum distributions in each bin. The dots are the 1 Hz data in panels (a) and (b) and 1 Hz data averaged to match the iWAS sampling time in panel (c).
3.4.2 Discussion and other NOy measurement comparisons
Overall, the agreement between the total NOy measured by the CL instrument and the ΣNOy is within instrument uncertainties. Budget closure implies that the historical definition of NOy (i.e., NOx and its oxidation products, excluding reduced nitrogen species such as NH3 and HCN) is adequate even in extremely reactive conditions that foster rapid changes in NOy speciation. Reduced nitrogen species such as hydrogen cyanide (HCN) or ammonia (NH3) represent a large fraction of the total nitrogen emission from biomass burning (Roberts et al., 2020) and have been shown to cause a small interference in CL instruments in dry air (Fahey et al., 1985, 1986). This interference is often neglected because of either the low atmospheric abundance of these species or sampling in humid air where such interference is thought to be negligible. Here, we find no evidence for a potential interference of HCN or NH3, despite their high abundance (tens of parts per billion by volume) in smoke plumes (Fig. S19). The NOy to CO ratio was approximately conserved with smoke age but showed both increasing and decreasing trends with different fires, likely as a result of variability in the NOx to CO emission ratio during the course of a day with changing fire conditions. Altogether, our findings show that the NOy instrument provides an accurate and conservative measurement of total reactive nitrogen species, although further work is needed to empirically characterize pNO3 sampling through the NOy inlet. There are a few studies that recently examined the NOy budget closure from aircraft measurements. Juncosa Calahorrano et al. (2021) presented reactive odd nitrogen partitioning during the Western wildfire Experiment for Cloud chemistry, Aerosol absorption and Nitrogen (WE-CAN) that sampled western American wildfires during the summer 2018. The authors found significant (15 %–26 %) contribution of organic N species other than APNs and alkyl nitrates to ΣNOy. However, there was no total NOy measurement during WE-CAN, and the conclusion is based on summed individual reactive nitrogen species. The FIREX-AQ comparison of ΣNOy to total NOy finds 2 %–13 % of the total NOy unaccounted for, smaller than the estimate of a 15 %–26 % contribution from multifunctional organic nitrates from WE-CAN. While the FIREX-AQ NOy difference suggests a smaller contribution from organic nitrates, the WE-CAN estimate is within the uncertainty of the FIREX-AQ analysis. During the WINTER campaign, budget closure of NOz (= NOy − NOx) was demonstrated to occur within 20 % for all flights following the comparison of ΣNOz with total NOz from three different measurement techniques, including a CL instrument (Sparks et al., 2019). A recent ground-based study in the State of New York in the US found that the sum of the individual reactive odd nitrogen species accounted for 95 % of the total NOy, well within measurement uncertainties (Ninneman et al., 2021). These recent studies contrast with somewhat older literature that often reported a significant shortfall in the NOy balance, where measured NOy was higher than ΣNOy (Hayden et al., 2003; Horii et al., 2006; Williams et al., 1997; Zhang et al., 2008). This shortfall has often been attributed to unmeasured organic N species and more specifically alkyl nitrates (Day et al., 2003; Horii et al., 2006). During FIREX-AQ, C1–C5 alkyl nitrates accounted for less than 7 % of the NOy budget on average (Fig. 10), consistent with findings from other regions in the US (Benedict et al., 2018; Russo et al., 2010). However, FIREX-AQ did not include a measurement of total alkyl nitrates. A recent analysis of the California Rim Fire during the 2013 NASA Studies of Emissions, Atmospheric Composition, Clouds and Climate Coupling by Regional Surveys (SEAC4RS) mission report that total alkyl nitrates measured by thermal-dissociation laser-induced fluorescence (TD-LIF) accounted for ∼ 10 % of the NOy budget (Wolfe et al., 2022).
3.5 CO
3.5.1 Campaign-wide comparison
The 1 Hz data comparison between the ICOS and the TDLAS instruments is shown in Fig. 14. The overall comparison yielded a slope (± combined instrument uncertainties) of 0.98 ± 0.03 (R2 = 0.99) and an intercept of −1.06 ± 0.01 ppbv (Fig. 14a). The regression analysis of smoke plume-integrated CO mixing ratios yields a slope of 0.99 (R2 = 1) for the whole dataset (Fig. 14c). A histogram of the absolute difference between CO measurements (ΔCOICOS-TDLAS) is shown in Fig. 5g. 90 % of the values were between −6.05 and 2.35 ppbv, and the whole dataset is normally distributed around the central value of the Gaussian fit of −2.87 ± 0.02 ppbv. This is indicative of an offset between the two CO instruments, with the TDLAS systematically higher than the ICOS instrument. This average 2.87 ppbv offset was consistent throughout the campaign regardless of the type of fires that were sampled. Therefore, it cannot explain the significantly lower agreement of the instruments during the eastern fires compared to the wildfires sampling period (Figs. 14b and S12). During the first period, the overall slope was 0.99 and ranged from 0.97 to 1.02 (average of 0.99) for individual flights, well within the combined instrument uncertainties of 3 % (Figs. 14b and S12). However, all individual flight measurements during the eastern fires sampling period exhibit slopes reduced by about 10 % (range = 0.86–0.91 with an average of 0.89) and largely positive intercepts (range 6.75–19.04 with an average of 11.51) (Fig. S20). As observed for other species, the second period proved to be a more challenging environment for CO measurements. This may be attributed to a spectral issue with one or the other of these two instruments, although we could not identify the source of the discrepancy. ΔCOICOS-TDLAS exhibit no significant slope with CO (Fig. S9g) and H2O (Fig. 6g) mixing ratios.

3.5.2 Literature aircraft CO measurement comparisons
Overall, the comparison between the two CO instruments shows an agreement well within stated uncertainties. We find that the agreement between the two CO instruments used during FIREX-AQ is well in line with past intercomparisons. During the GTE-CITE experiment, the comparison of a TDLAS technique with two grab sample and gas chromatograph methods for detection of CO showed agreement across the instruments – within the combined instrument uncertainties and strong correlations (R2 = 0.85–0.98) for CO ranging from 60 to 140 ppbv (Hoell et al., 1987a). During the North Atlantic Regional Experiment (NARE 97) CO was measured by TDLAS and vacuum ultra-violet fluorescence with agreement to within 11 % and systematic offsets of less than 1 ppbv (Holloway et al., 2000). CO was also more recently measured by TDLAS and vacuum ultra-violet fluorescence during the side-by-side comparison of instruments aboard two aircraft during the DC3 experiment. There, CO measurements agreed within 5 % during flight periods typically ranging from 20 to 30 min (Pollack et al., 2016).
In this study, we compare airborne measurements of NO, NO2, HONO, NOy, and CO conducted during the FIREX-AQ campaign in summer 2019. This dataset offers the opportunity to assess the accuracy of a large suite of detection techniques in a challenging environment where species mixing ratios increased by tens of parts per billion by volume in seconds between background air and fire smoke. For NO, NO2 (CES and LIF), NOy, and CO, correlations agree better than the combined instrument uncertainties, indicating that the stated individual uncertainties are conservative estimates. For NO2 (CL) and HONO, the percent difference between measurements is higher than the combined instrument uncertainties, indicating potential interferences or calibration inaccuracies that are not identified at this time. Based on the analysis above, we make the following recommendations, which are specific to the FIREX-AQ campaign.
-
Comparison of NO measurements by LIF and CL showed an overall agreement well within instrument uncertainties. Flight-to-flight agreement was generally more variable during the eastern fires sampling period than during the wildfires sampling period, which was attributed to the heterogeneous nature of smoke plumes combined with the physical separation of inlets. Both measurements are considered reliable for FIREX-AQ, although the LIF instrument has better 1 Hz precision (1 pptv) than the CL instrument (6 pptv), and the CL instrument exhibited slower time response.
-
Comparison of NO2 measurements by LIF and CES showed an overall agreement well within the stated instrument uncertainties. However, NO2 measured by CL is on average 10 % higher than that measured by the other two techniques. The agreement worsens for all instruments when comparing NO2 measured during the eastern fires sampling period, likely for similar reasons as those indicated for the NO measurements.
-
The CES and CIMS HONO measurements were highly correlated in each fire plume transect, but the correlation slope of CES vs. CIMS for all 1 Hz data from the entire campaign was 1.80. The HONO measured by CIMS was on average 74 % of that measured by CES during the wildfires sampling period, and on average 40 % of CES during the eastern fires sampling period. The higher precision data from the CIMS are most useful for analysis of HONO when mixing ratios are lower. The redundancy of HONO measurements during FIREX-AQ led to the discovery that the CIMS sensitivity to HONO was reduced in a high-temperature environment. This intercomparison has initiated further studies of the CIMS sensitivity to HONO and other compounds.
-
Closure of the NOy budget between the total NOy measurement by CL and ΣNOy was achieved for all flights and correlation slopes were usually much better than the combined instrument uncertainties of 25 %. NOx, HNO3, HONO, APNs, and pNO3 are the main contributors to the NOy budget, with the other reactive N species contributing less than 10 % on average. We find that the modeled pNO3 sampling fraction through the NOy inlet is highly dependent on altitude, air speed, and pNO3 mass size distribution and varied on average between 0.36 and 0.99 during FIREX-AQ. Therefore, on average approximately 0 %–24 % of the total measured NOy by CL may be unaccounted for and possibly explained by other species such as multifunctional organic nitrates. The reason for the secondary positive mode of 0.4 ppbv in the ΔNOyCL-Sum distribution in the eastern fires and LA Basin flights could not be clearly identified. Potential explanations include the contribution of gas-phase organic nitrates, not included in the ΣNOy, and/or a water vapor interference in one or more instruments. Regardless, we conclude that the total NOy measurement by CL provides a robust quantification of the reactive nitrogen species in background air and in smoke plumes and that the total NOy measurement is not sensitive to interference from reduced nitrogen species in fire plumes. Further laboratory and field work will be needed to fully characterize pNO3 sampling through the NOy inlet.
-
Comparison of CO measurements by TDLAS and ICOS showed an agreement well within the combined instrument uncertainties. An offset of ∼ 2 ppbv between the two instruments was identified but has little impact on the correlation. There was a clear difference in the agreement between the wildfires sampling period and the eastern fires sampling period, where the correlation slopes were about 10 % lower.
-
Integrating data across smoke plume transects generally improved the correlation between independent measurements and may be necessary for fire-science-related analyses, especially for smaller plumes with greater spatial heterogeneity compared to the distance between the sampling locations on a large aircraft.
All data used in this paper are archived online and available at https://www-air.larc.nasa.gov/missions/firex-aq/index.html (NASA, 2022).
The supplement related to this article is available online at: https://doi.org/10.5194/amt-15-4901-2022-supplement.
IB and TBR designed the research. All authors performed FIREX-AQ measurements. PCJ, HG, and JLJ performed the flow modeling analysis. All authors analyzed the data. IB, JP, JAN, and SSB wrote the original draft and all authors edited and revised the paper.
The contact author has declared that none of the authors has any competing interests.
Publisher's note: Copernicus Publications remains neutral with regard to jurisdictional claims in published maps and institutional affiliations.
We would like to thank the NOAA/NASA FIREX-AQ science and aircraft operation teams. We acknowledge Armin Whistaler, Felix Piel, and Laura Tomsche for providing the NH3 measurements from FIREX-AQ. We thank Ann Middlebrook for helpful discussion regarding pNO3 sampling in the NOy inlet and AMS performance.
This research has been supported by the National Oceanic and Atmospheric Administration (grant nos. NA17OAR4320101, NA16OAR4310100, and NA17OAR4310004) and the National Aeronautics and Space Administration (grant nos. 80NSSC18K0660 and 80NSSC18K0630).
This paper was edited by Hang Su and reviewed by three anonymous referees.
Andreae, M. O.: Emission of trace gases and aerosols from biomass burning – an updated assessment, Atmos. Chem. Phys., 19, 8523–8546, https://doi.org/10.5194/acp-19-8523-2019, 2019.
Arévalo-Martínez, D. L., Beyer, M., Krumbholz, M., Piller, I., Kock, A., Steinhoff, T., Körtzinger, A., and Bange, H. W.: A new method for continuous measurements of oceanic and atmospheric N2O, CO and CO2: performance of off-axis integrated cavity output spectroscopy (OA-ICOS) coupled to non-dispersive infrared detection (NDIR), Ocean Sci., 9, 1071–1087, https://doi.org/10.5194/os-9-1071-2013, 2013.
Baer, D. S., Paul, J. B., Gupta, M., and O'Keefe, A.: Sensitive absorption measurements in the near-infrared region using off-axis integrated-cavity-output spectroscopy, Appl. Phys. B, 75, 261–265, https://doi.org/10.1007/s00340-002-0971-z, 2002.
Balch, J. K., Bradley, B. A., Abatzoglou, J. T., Nagy, R. C., Fusco, E. J., and Mahood, A. L.: Human-started wildfires expand the fire niche across the United States, P. Natl. Acad. Sci. USA, 114, 2946–2951, https://doi.org/10.1073/pnas.1617394114, 2017.
Benedict, K. B., Prenni, A. J., Sullivan, A. P., Evanoski-Cole, A. R., Fischer, E. V., Callahan, S., Sive, B. C., Zhou, Y., Schichtel, B. A., and Jr, J. L. C.: Impact of Front Range sources on reactive nitrogen concentrations and deposition in Rocky Mountain National Park, PeerJ, 6, e4759, https://doi.org/10.7717/peerj.4759, 2018.
Bernard, F., Cazaunau, M., Grosselin, B., Zhou, B., Zheng, J., Liang, P., Zhang, Y., Ye, X., Daële, V., Mu, Y., Zhang, R., Chen, J., and Mellouki, A.: Measurements of nitrous acid (HONO) in urban area of Shanghai, China, Environ. Sci. Pollut. Res., 23, 5818–5829, https://doi.org/10.1007/s11356-015-5797-4, 2016.
Bertram, T. H., Thornton, J. A., and Riedel, T. P.: An experimental technique for the direct measurement of N2O5 reactivity on ambient particles, Atmos. Meas. Tech., 2, 231–242, https://doi.org/10.5194/amt-2-231-2009, 2009.
Boggs, P. T., Byrd, R. H., and Schnabel, R. B.: A Stable and Efficient Algorithm for Nonlinear Orthogonal Distance Regression, SIAM J. Sci. Stat. Comput., 8, 1052–1078, https://doi.org/10.1137/0908085, 1987.
Bollinger, M. J., Sievers, R. E., Fahey, D. W., and Fehsenfeld, F. C.: Conversion of nitrogen dioxide, nitric acid, and n-propyl nitrate to nitric oxide by a gold-catalyzed reduction with carbon monoxide, Anal. Chem., 55, 1980–1986, https://doi.org/10.1021/ac00262a034, 1983.
Bourgeois, I., Peischl, J., Neuman, J. A., Brown, S. S., Thompson, C. R., Aikin, K. C., Allen, H. M., Angot, H., Apel, E. C., Baublitz, C. B., Brewer, J. F., Campuzano-Jost, P., Commane, R., Crounse, J. D., Daube, B. C., DiGangi, J. P., Diskin, G. S., Emmons, L. K., Fiore, A. M., Gkatzelis, G. I., Hills, A., Hornbrook, R. S., Huey, L. G., Jimenez, J. L., Kim, M., Lacey, F., McKain, K., Murray, L. T., Nault, B. A., Parrish, D. D., Ray, E., Sweeney, C., Tanner, D., Wofsy, S. C., and Ryerson, T. B.: Large contribution of biomass burning emissions to ozone throughout the global remote troposphere, P. Natl. Acad. Sci. USA, 118, e2109628118, https://doi.org/10.1073/pnas.2109628118, 2021.
Bowman, D. M. J. S., Balch, J. K., Artaxo, P., Bond, W. J., Carlson, J. M., Cochrane, M. A., D'Antonio, C. M., DeFries, R. S., Doyle, J. C., Harrison, S. P., Johnston, F. H., Keeley, J. E., Krawchuk, M. A., Kull, C. A., Marston, J. B., Moritz, M. A., Prentice, I. C., Roos, C. I., Scott, A. C., Swetnam, T. W., van der Werf, G. R., and Pyne, S. J.: Fire in the Earth System, Science, 324, 481–484, https://doi.org/10.1126/science.1163886, 2009.
Brock, C. A., Williamson, C., Kupc, A., Froyd, K. D., Erdesz, F., Wagner, N., Richardson, M., Schwarz, J. P., Gao, R.-S., Katich, J. M., Campuzano-Jost, P., Nault, B. A., Schroder, J. C., Jimenez, J. L., Weinzierl, B., Dollner, M., Bui, T., and Murphy, D. M.: Aerosol size distributions during the Atmospheric Tomography Mission (ATom): methods, uncertainties, and data products, Atmos. Meas. Tech., 12, 3081–3099, https://doi.org/10.5194/amt-12-3081-2019, 2019.
Browne, E. C., Perring, A. E., Wooldridge, P. J., Apel, E., Hall, S. R., Huey, L. G., Mao, J., Spencer, K. M., Clair, J. M. St., Weinheimer, A. J., Wisthaler, A., and Cohen, R. C.: Global and regional effects of the photochemistry of CH3O2NO2: evidence from ARCTAS, Atmos. Chem. Phys., 11, 4209–4219, https://doi.org/10.5194/acp-11-4209-2011, 2011.
Burke, M., Driscoll, A., Heft-Neal, S., Xue, J., Burney, J., and Wara, M.: The changing risk and burden of wildfire in the United States, P. Natl. Acad. Sci. USA, 118, e2011048118, https://doi.org/10.1073/pnas.2011048118, 2021.
Canagaratna, M. R., Jayne, J. T., Jimenez, J. L., Allan, J. D., Alfarra, M. R., Zhang, Q., Onasch, T. B., Drewnick, F., Coe, H., Middlebrook, A., Delia, A., Williams, L. R., Trimborn, A. M., Northway, M. J., DeCarlo, P. F., Kolb, C. E., Davidovits, P., and Worsnop, D. R.: Chemical and microphysical characterization of ambient aerosols with the aerodyne aerosol mass spectrometer, Mass Spectrom. Rev., 26, 185–222, https://doi.org/10.1002/mas.20115, 2007.
Cazorla, M., Wolfe, G. M., Bailey, S. A., Swanson, A. K., Arkinson, H. L., and Hanisco, T. F.: A new airborne laser-induced fluorescence instrument for in situ detection of formaldehyde throughout the troposphere and lower stratosphere, Atmos. Meas. Tech., 8, 541–552, https://doi.org/10.5194/amt-8-541-2015, 2015.
Chen, J., Wenger, J. C., and Venables, D. S.: Near-Ultraviolet Absorption Cross Sections of Nitrophenols and Their Potential Influence on Tropospheric Oxidation Capacity, J. Phys. Chem. A, 115, 12235–12242, https://doi.org/10.1021/jp206929r, 2011.
Collier, S., Zhou, S., Onasch, T. B., Jaffe, D. A., Kleinman, L., Sedlacek, A. J., Briggs, N. L., Hee, J., Fortner, E., Shilling, J. E., Worsnop, D., Yokelson, R. J., Parworth, C., Ge, X., Xu, J., Butterfield, Z., Chand, D., Dubey, M. K., Pekour, M. S., Springston, S., and Zhang, Q.: Regional Influence of Aerosol Emissions from Wildfires Driven by Combustion Efficiency: Insights from the BBOP Campaign, Environ. Sci. Technol., 50, 8613–8622, https://doi.org/10.1021/acs.est.6b01617, 2016.
Crilley, L. R., Kramer, L. J., Ouyang, B., Duan, J., Zhang, W., Tong, S., Ge, M., Tang, K., Qin, M., Xie, P., Shaw, M. D., Lewis, A. C., Mehra, A., Bannan, T. J., Worrall, S. D., Priestley, M., Bacak, A., Coe, H., Allan, J., Percival, C. J., Popoola, O. A. M., Jones, R. L., and Bloss, W. J.: Intercomparison of nitrous acid (HONO) measurement techniques in a megacity (Beijing), Atmos. Meas. Tech., 12, 6449–6463, https://doi.org/10.5194/amt-12-6449-2019, 2019.
Crounse, J. D., McKinney, K. A., Kwan, A. J., and Wennberg, P. O.: Measurement of Gas-Phase Hydroperoxides by Chemical Ionization Mass Spectrometry, Anal. Chem., 78, 6726–6732, https://doi.org/10.1021/ac0604235, 2006.
Crutzen, P. J. and Andreae, M. O.: Biomass Burning in the Tropics: Impact on Atmospheric Chemistry and Biogeochemical Cycles, in: A Pioneer on Atmospheric Chemistry and Climate Change in the Anthropocene, edited by: Crutzen, P. J. and Brauch, H. G., Springer International Publishing, Cham, 165–188, https://doi.org/10.1007/978-3-319-27460-7_7, 2016.
Day, D. A., Dillon, M. B., Wooldridge, P. J., Thornton, J. A., Rosen, R. S., Wood, E. C., and Cohen, R. C.: On alkyl nitrates, O3, and the “missing NOy”, J. Geophys. Res.-Atmos., 108, 4501, https://doi.org/10.1029/2003JD003685, 2003.
Day, D. A., Campuzano-Jost, P., Nault, B. A., Palm, B. B., Hu, W., Guo, H., Wooldridge, P. J., Cohen, R. C., Docherty, K. S., Huffman, J. A., de Sá, S. S., Martin, S. T., and Jimenez, J. L.: A systematic re-evaluation of methods for quantification of bulk particle-phase organic nitrates using real-time aerosol mass spectrometry, Atmos. Meas. Tech., 15, 459–483, https://doi.org/10.5194/amt-15-459-2022, 2022.
DeCarlo, P. F., Kimmel, J. R., Trimborn, A., Northway, M. J., Jayne, J. T., Aiken, A. C., Gonin, M., Fuhrer, K., Horvath, T., Docherty, K. S., Worsnop, D. R., and Jimenez, J. L.: Field-Deployable, High-Resolution, Time-of-Flight Aerosol Mass Spectrometer, Anal. Chem., 78, 8281–8289, https://doi.org/10.1021/ac061249n, 2006.
Decker, Z. C. J., Robinson, M. A., Barsanti, K. C., Bourgeois, I., Coggon, M. M., DiGangi, J. P., Diskin, G. S., Flocke, F. M., Franchin, A., Fredrickson, C. D., Gkatzelis, G. I., Hall, S. R., Halliday, H., Holmes, C. D., Huey, L. G., Lee, Y. R., Lindaas, J., Middlebrook, A. M., Montzka, D. D., Moore, R., Neuman, J. A., Nowak, J. B., Palm, B. B., Peischl, J., Piel, F., Rickly, P. S., Rollins, A. W., Ryerson, T. B., Schwantes, R. H., Sekimoto, K., Thornhill, L., Thornton, J. A., Tyndall, G. S., Ullmann, K., Van Rooy, P., Veres, P. R., Warneke, C., Washenfelder, R. A., Weinheimer, A. J., Wiggins, E., Winstead, E., Wisthaler, A., Womack, C., and Brown, S. S.: Nighttime and daytime dark oxidation chemistry in wildfire plumes: an observation and model analysis of FIREX-AQ aircraft data, Atmos. Chem. Phys., 21, 16293–16317, https://doi.org/10.5194/acp-21-16293-2021, 2021.
Dennis, A., Fraser, M., Anderson, S., and Allen, D.: Air pollutant emissions associated with forest, grassland, and agricultural burning in Texas, Atmos. Environ., 36, 3779–3792, https://doi.org/10.1016/S1352-2310(02)00219-4, 2002.
Dibb, J. E., Talbot, R. W., Seid, G., Jordan, C., Scheuer, E., Atlas, E., Blake, N. J., and Blake, D. R.: Airborne sampling of aerosol particles: Comparison between surface sampling at Christmas Island and P-3 sampling during PEM-Tropics B, J. Geophys. Res.-Atmos., 107, PEM 2-1–PEM 2-17, https://doi.org/10.1029/2001JD000408, 2002.
Diskin, G. S., Podolske, J. R., Sachse, G. W., and Slate, T. A.: Open-path airborne tunable diode laser hygrometer, in: Diode Lasers and Applications in Atmospheric Sensing, edited by: Fried, A., SPIE Proceedings vol. 4817, 196–204, https://doi.org/10.1117/12.453736, 2002.
Eisele, F. L., Mauldin, L., Cantrell, C., Zondlo, M., Apel, E., Fried, A., Walega, J., Shetter, R., Lefer, B., Flocke, F., Weinheimer, A., Avery, M., Vay, S., Sachse, G., Podolske, J., Diskin, G., Barrick, J. D., Singh, H. B., Brune, W., Harder, H., Martinez, M., Bandy, A., Thornton, D., Heikes, B., Kondo, Y., Riemer, D., Sandholm, S., Tan, D., Talbot, R., and Dibb, J.: Summary of measurement intercomparisons during TRACE-P, J. Geophys. Res.-Atmos., 108, 8791, https://doi.org/10.1029/2002JD003167, 2003.
Fahey, D. W., Eubank, C. S., Hübler, G., and Fehsenfeld, F. C.: Evaluation of a catalytic reduction technique for the measurement of total reactive odd-nitrogen NOy in the atmosphere, J. Atmos. Chem., 3, 435–468, 1985.
Fahey, D. W., Hübler, G., Parrish, D. D., Williams, E. J., Norton, R. B., Ridley, B. A., Singh, H. B., Liu, S. C., and Fehsenfeld, F. C.: Reactive nitrogen species in the troposphere: Measurements of NO, NO2, HNO3, particulate nitrate, peroxyacetyl nitrate (PAN), O3, and total reactive odd nitrogen (NOy) at Niwot Ridge, Colorado, J. Geophys. Res., 91, 9781–9793, https://doi.org/10.1029/JD091iD09p09781, 1986.
Farmer, D. K., Matsunaga, A., Docherty, K. S., Surratt, J. D., Seinfeld, J. H., Ziemann, P. J., and Jimenez, J. L.: Response of an aerosol mass spectrometer to organonitrates and organosulfates and implications for atmospheric chemistry, P. Natl. Acad. Sci. USA, 107, 6670–6675, https://doi.org/10.1073/pnas.0912340107, 2010.
Fiedler, S. E., Hese, A., and Ruth, A. A.: Incoherent broad-band cavity-enhanced absorption spectroscopy, Chem. Phys. Lett., 371, 284–294, https://doi.org/10.1016/S0009-2614(03)00263-X, 2003.
Fisher, J. A., Jacob, D. J., Travis, K. R., Kim, P. S., Marais, E. A., Chan Miller, C., Yu, K., Zhu, L., Yantosca, R. M., Sulprizio, M. P., Mao, J., Wennberg, P. O., Crounse, J. D., Teng, A. P., Nguyen, T. B., St. Clair, J. M., Cohen, R. C., Romer, P., Nault, B. A., Wooldridge, P. J., Jimenez, J. L., Campuzano-Jost, P., Day, D. A., Hu, W., Shepson, P. B., Xiong, F., Blake, D. R., Goldstein, A. H., Misztal, P. K., Hanisco, T. F., Wolfe, G. M., Ryerson, T. B., Wisthaler, A., and Mikoviny, T.: Organic nitrate chemistry and its implications for nitrogen budgets in an isoprene- and monoterpene-rich atmosphere: constraints from aircraft (SEAC4RS) and ground-based (SOAS) observations in the Southeast US, Atmos. Chem. Phys., 16, 5969–5991, https://doi.org/10.5194/acp-16-5969-2016, 2016.
Fontijn, Arthur., Sabadell, A. J., and Ronco, R. J.: Homogeneous chemiluminescent measurement of nitric oxide with ozone. Implications for continuous selective monitoring of gaseous air pollutants, Anal. Chem., 42, 575–579, https://doi.org/10.1021/ac60288a034, 1970.
Fry, J. L., Draper, D. C., Zarzana, K. J., Campuzano-Jost, P., Day, D. A., Jimenez, J. L., Brown, S. S., Cohen, R. C., Kaser, L., Hansel, A., Cappellin, L., Karl, T., Hodzic Roux, A., Turnipseed, A., Cantrell, C., Lefer, B. L., and Grossberg, N.: Observations of gas- and aerosol-phase organic nitrates at BEACHON-RoMBAS 2011, Atmos. Chem. Phys., 13, 8585–8605, https://doi.org/10.5194/acp-13-8585-2013, 2013.
Galloway, J. N., Aber, J. D., Erisman, J. W., Seitzinger, S. P., Howarth, R. W., Cowling, E. B., and Cosby, B. J.: The Nitrogen Cascade, BioScience, 53, 341–356, https://doi.org/10.1641/0006-3568(2003)053[0341:TNC]2.0.CO;2, 2003.
Gao, R. S., McLaughlin, R. J., Schein, M. E., Neuman, J. A., Ciciora, S. J., Holecek, J. C., and Fahey, D. W.: Computer-controlled Teflon flow control valve, Rev. Sci. Instrum., 70, 4732–4733, https://doi.org/10.1063/1.1150137, 1999.
Gkatzelis, G. I., Coggon, M. M., Stockwell, C. E., Hornbrook, R. S., Allen, H. M., Apel, E., Bela, M. M., Blake, D. R., Bourgeois, I., Brown, S. S., Campuzano-Jost, P., St Clair, J. M., Crawford, J. H., Crounse, J. D., Day, D. A., DiGangi, J. P., Diskin, G. S., Fried, A., Gilman, J. B., Guo, H., Hair, J. W., Halliday, H. S., Hanisco, T. F., Hannun, R., Hills, A., Huey, L. G., Jimenez, J. L., Katich, J. M., Lamplugh, A., Lee, Y. R., Liao, J., Lindaas, J., McKeen, S. A., Mikoviny, T., Nault, B. A., Neuman, J. A., Nowak, J. B., Pagonis, D., Peischl, J., Perring, A. E., Piel, F., Rickly, P. S., Robinson, M. A., Rollins, A. W., Ryerson, T. B., Shueneman, M. K., Schwantes, R. H., Schwarz, J. P., Sekimoto, K., Selimovic, V., Shingler, T., Tanner, D. J., Tomsche, L., Vasquez, K. T., Veres, P. V., Washenfelder, R., Weibring, P., Wennberg, P. O., Wisthaler, A., Wolfe, G. M., Womack C. C., Xu, L., Yokelson, R. J., and Warneke, C.: Parametrization of US wildfire and prescribed fire emission ratios and emission factors based on FIREX-AQ aircraft measurements, in preparation, 2022.
Gregory, G. L., Hoell, J. M., Torres, A. L., Carroll, M. A., Ridley, B. A., Rodgers, M. O., Bradshaw, J., Sandholm, S., and Davis, D. D.: An intercomparison of airborne nitric oxide measurements: A second opportunity, J. Geophys. Res.-Atmos., 95, 10129–10138, https://doi.org/10.1029/JD095iD07p10129, 1990a.
Gregory, G. L., Hoell, J. M., Carroll, M. A., Ridley, B. A., Davis, D. D., Bradshaw, J., Rodgers, M. O., Sandholm, S. T., Schiff, H. I., Hastie, D. R., Karecki, D. R., Mackay, G. I., Harris, G. W., Torres, A. L., and Fried, A.: An intercomparison of airborne nitrogen dioxide instruments, J. Geophys. Res.-Atmos., 95, 10103–10127, https://doi.org/10.1029/JD095iD07p10103, 1990b.
Guo, H., Campuzano-Jost, P., Pagonis, D., Schueneman, M., Day, D. A., Nault, B. A., Kim, D., Brown, W., Siemens, K. S. A., Dibb, J. E., Scheuer, E. M., Tomsche, L., Piel, F., Nowak, J. B., Wisthaler, A., Xu, L., Vasquez, K., Crounse, J. D., Wennberg, P. O., Rickly, P., Rollins, A. W., Womack, C., Katich, J. M., Perring, A. E., Halliday, H. S., Soja, A. J., Gargulinski, E. M., Wiggins, E. B., McCarty, J. L., Diskin, G. S., Hanisco, T. F., Laskin, A., and Jimenez, J. L.: Submicron Particle Composition and Acidity in Fire Plumes during FIREX-AQ aircraft study, 2020, American Geophysical Union, Fall Meeting 2020, online, 1–17 December 2020, abstract no. A232-10, 2020.
Guo, H., Campuzano-Jost, P., Nault, B. A., Day, D. A., Schroder, J. C., Kim, D., Dibb, J. E., Dollner, M., Weinzierl, B., and Jimenez, J. L.: The importance of size ranges in aerosol instrument intercomparisons: a case study for the Atmospheric Tomography Mission, Atmos. Meas. Tech., 14, 3631–3655, https://doi.org/10.5194/amt-14-3631-2021, 2021.
Hall, B. D., Dutton, G. S., and Elkins, J. W.: The NOAA nitrous oxide standard scale for atmospheric observations, J. Geophys. Res.-Atmos., 112, D09305, https://doi.org/10.1029/2006JD007954, 2007.
Harder, J. W. and Brault, J. W.: Atmospheric measurements of water vapor in the 442-nm region, J. Geophys. Res.-Atmos., 102, 6245–6252, https://doi.org/10.1029/96JD01730, 1997.
Hayden, K. L., Anlauf, K. G., Hastie, D. R., and Bottenheim, J. W.: Partitioning of reactive atmospheric nitrogen oxides at an elevated site in southern Quebec, Canada, J. Geophys. Res.-Atmos., 108, 4603, https://doi.org/10.1029/2002JD003188, 2003.
Hoell, J. M., Gregory, G. L., McDougal, D. S., Sachse, G. W., Hill, G. F., Condon, E. P., and Rasmussen, R. A.: Airborne intercomparison of carbon monoxide measurement techniques, J. Geophys. Res.-Atmos., 92, 2009–2019, https://doi.org/10.1029/JD092iD02p02009, 1987a.
Hoell, J. M., Gregory, G. L., McDougal, D. S., Torres, A. L., Davis, D. D., Bradshaw, J., Rodgers, M. O., Ridley, B. A., and Carroll, M. A.: Airborne intercomparison of nitric oxide measurement techniques, J. Geophys. Res.-Atmos., 92, 1995–2008, https://doi.org/10.1029/JD092iD02p01995, 1987b.
Holloway, J. S., Jakoubek, R. O., Parrish, D. D., Gerbig, C., Volz-Thomas, A., Schmitgen, S., Fried, A., Wert, B., Henry, B., and Drummond, J. R.: Airborne intercomparison of vacuum ultraviolet fluorescence and tunable diode laser absorption measurements of tropospheric carbon monoxide, J. Geophys. Res.-Atmos., 105, 24251–24261, https://doi.org/10.1029/2000JD900237, 2000.
Holmes, C. D., Fite, C., Agastra, A., Schwarz, J. P., Yokelson, R. J., Bui, T. V., and Peterson, D. A.: Critical evaluation of smoke age inferred from different methods during FIREX-AQ, 2020, American Geophysical Union, Fall Meeting 2020, online, 1–17 December 2020, abstract no. A225-0010, 2020.
Horii, C. V., William Munger, J., Wofsy, S. C., Zahniser, M., Nelson, D., and Barry McManus, J.: Atmospheric reactive nitrogen concentration and flux budgets at a Northeastern U.S. forest site, Agr. Forest Meteorol., 136, 159–174, https://doi.org/10.1016/j.agrformet.2006.03.005, 2006.
Jaffe, D. A., O'Neill, S. M., Larkin, N. K., Holder, A. L., Peterson, D. L., Halofsky, J. E., and Rappold, A. G.: Wildfire and prescribed burning impacts on air quality in the United States, J. Air Waste Manage., 70, 583–615, https://doi.org/10.1080/10962247.2020.1749731, 2020.
Johnston, F. H., Henderson, S. B., Chen, Y., Randerson, J. T., Marlier, M., DeFries, R. S., Kinney, P., Bowman, D. M. J. S., and Brauer, M.: Estimated Global Mortality Attributable to Smoke from Landscape Fires, Environ. Health Persp., 120, 695–701, https://doi.org/10.1289/ehp.1104422, 2012.
Johnston, F. H., Borchers-Arriagada, N., Morgan, G. G., Jalaludin, B., Palmer, A. J., Williamson, G. J., and Bowman, D. M. J. S.: Unprecedented health costs of smoke-related PM2.5 from the 2019–20 Australian megafires, Nat. Sustain., 4, 42–47, https://doi.org/10.1038/s41893-020-00610-5, 2021.
Juncosa Calahorrano, J. F., Lindaas, J., O'Dell, K., Palm, B. B., Peng, Q., Flocke, F., Pollack, I. B., Garofalo, L. A., Farmer, D. K., Pierce, J. R., Collett, J. L., Weinheimer, A., Campos, T., Hornbrook, R. S., Hall, S. R., Ullmann, K., Pothier, M. A., Apel, E. C., Permar, W., Hu, L., Hills, A. J., Montzka, D., Tyndall, G., Thornton, J. A., and Fischer, E. V.: Daytime Oxidized Reactive Nitrogen Partitioning in Western U.S. Wildfire Smoke Plumes, J. Geophys. Res.-Atmos., 126, e2020JD033484, https://doi.org/10.1029/2020JD033484, 2021.
Keller-Rudek, H., Moortgat, G. K., Sander, R., and Sörensen, R.: The MPI-Mainz UV/VIS Spectral Atlas of Gaseous Molecules of Atmospheric Interest, Earth Syst. Sci. Data, 5, 365–373, https://doi.org/10.5194/essd-5-365-2013, 2013.
Kenagy, H. S., Sparks, T. L., Ebben, C. J., Wooldrige, P. J., Lopez-Hilfiker, F. D., Lee, B. H., Thornton, J. A., McDuffie, E. E., Fibiger, D. L., Brown, S. S., Montzka, D. D., Weinheimer, A. J., Schroder, J. C., Campuzano-Jost, P., Day, D. A., Jimenez, J. L., Dibb, J. E., Campos, T., Shah, V., Jaeglé, L., and Cohen, R. C.: NOx Lifetime and NOy Partitioning During WINTER, J. Geophys. Res.-Atmos., 123, 9813–9827, https://doi.org/10.1029/2018JD028736, 2018.
Kleffmann, J., Lörzer, J. C., Wiesen, P., Kern, C., Trick, S., Volkamer, R., Rodenas, M., and Wirtz, K.: Intercomparison of the DOAS and LOPAP techniques for the detection of nitrous acid (HONO), Atmos. Environ., 40, 3640–3652, https://doi.org/10.1016/j.atmosenv.2006.03.027, 2006.
Kroll, J. H. and Seinfeld, J. H.: Chemistry of secondary organic aerosol: Formation and evolution of low-volatility organics in the atmosphere, Atmos. Environ., 42, 3593–3624, https://doi.org/10.1016/j.atmosenv.2008.01.003, 2008.
Lao, M., Crilley, L. R., Salehpoor, L., Furlani, T. C., Bourgeois, I., Neuman, J. A., Rollins, A. W., Veres, P. R., Washenfelder, R. A., Womack, C. C., Young, C. J., and VandenBoer, T. C.: A portable, robust, stable, and tunable calibration source for gas-phase nitrous acid (HONO), Atmos. Meas. Tech., 13, 5873–5890, https://doi.org/10.5194/amt-13-5873-2020, 2020.
Lareau, N. P., Nauslar, N. J., and Abatzoglou, J. T.: The Carr Fire Vortex: A Case of Pyrotornadogenesis?, Geophys. Res. Lett., 45, 13107–13115, https://doi.org/10.1029/2018GL080667, 2018.
Lee, B. H., Lopez-Hilfiker, F. D., Mohr, C., Kurtén, T., Worsnop, D. R., and Thornton, J. A.: An Iodide-Adduct High-Resolution Time-of-Flight Chemical-Ionization Mass Spectrometer: Application to Atmospheric Inorganic and Organic Compounds, Environ. Sci. Technol., 48, 6309–6317, https://doi.org/10.1021/es500362a, 2014.
Lee, Y. R., Ji, Y., Tanner, D. J., and Huey, L. G.: A low-activity ion source for measurement of atmospheric gases by chemical ionization mass spectrometry, Atmos. Meas. Tech., 13, 2473–2480, https://doi.org/10.5194/amt-13-2473-2020, 2020.
Lerner, B. M., Gilman, J. B., Aikin, K. C., Atlas, E. L., Goldan, P. D., Graus, M., Hendershot, R., Isaacman-VanWertz, G. A., Koss, A., Kuster, W. C., Lueb, R. A., McLaughlin, R. J., Peischl, J., Sueper, D., Ryerson, T. B., Tokarek, T. W., Warneke, C., Yuan, B., and de Gouw, J. A.: An improved, automated whole air sampler and gas chromatography mass spectrometry analysis system for volatile organic compounds in the atmosphere, Atmos. Meas. Tech., 10, 291–313, https://doi.org/10.5194/amt-10-291-2017, 2017.
Liousse, C., Guillaume, B., Grégoire, J. M., Mallet, M., Galy, C., Pont, V., Akpo, A., Bedou, M., Castéra, P., Dungall, L., Gardrat, E., Granier, C., Konaré, A., Malavelle, F., Mariscal, A., Mieville, A., Rosset, R., Serça, D., Solmon, F., Tummon, F., Assamoi, E., Yoboué, V., and Van Velthoven, P.: Updated African biomass burning emission inventories in the framework of the AMMA-IDAF program, with an evaluation of combustion aerosols, Atmos. Chem. Phys., 10, 9631–9646, https://doi.org/10.5194/acp-10-9631-2010, 2010.
McCarty, J. L.: Remote Sensing-Based Estimates of Annual and Seasonal Emissions from Crop Residue Burning in the Contiguous United States, J. Air Waste Manage., 61, 22–34, https://doi.org/10.3155/1047-3289.61.1.22, 2011.
Meller, R., Raber, W., Crowley, J. N., Jenkin, M. E., and Moortgat, G. K.: The UV-visible absorption spectrum of methylglyoxal, J. Photoch. Photobio. A, 62, 163–171, https://doi.org/10.1016/1010-6030(91)87017-P, 1991.
Melvin, M. A.: 2020 National Precribed Fire Use Report, National Association of State Foresters, 2020.
Min, K.-E., Washenfelder, R. A., Dubé, W. P., Langford, A. O., Edwards, P. M., Zarzana, K. J., Stutz, J., Lu, K., Rohrer, F., Zhang, Y., and Brown, S. S.: A broadband cavity enhanced absorption spectrometer for aircraft measurements of glyoxal, methylglyoxal, nitrous acid, nitrogen dioxide, and water vapor, Atmos. Meas. Tech., 9, 423–440, https://doi.org/10.5194/amt-9-423-2016, 2016.
Miyazaki, Y., Kondo, Y., Takegawa, N., Weber, R. J., Koike, M., Kita, K., Fukuda, M., Ma, Y., Clarke, A. D., Kapustin, V. N., Flocke, F., Weinheimer, A. J., Zondlo, M., Eisele, F. L., Blake, D. R., and Liley, B.: Contribution of particulate nitrate to airborne measurements of total reactive nitrogen, J. Geophys. Res.-Atmos., 110, D15304, https://doi.org/10.1029/2004JD005502, 2005.
Moore, R. H., Wiggins, E. B., Ahern, A. T., Zimmerman, S., Montgomery, L., Campuzano Jost, P., Robinson, C. E., Ziemba, L. D., Winstead, E. L., Anderson, B. E., Brock, C. A., Brown, M. D., Chen, G., Crosbie, E. C., Guo, H., Jimenez, J. L., Jordan, C. E., Lyu, M., Nault, B. A., Rothfuss, N. E., Sanchez, K. J., Schueneman, M., Shingler, T. J., Shook, M. A., Thornhill, K. L., Wagner, N. L., and Wang, J.: Sizing response of the Ultra-High Sensitivity Aerosol Spectrometer (UHSAS) and Laser Aerosol Spectrometer (LAS) to changes in submicron aerosol composition and refractive index, Atmos. Meas. Tech., 14, 4517–4542, https://doi.org/10.5194/amt-14-4517-2021, 2021.
Murphy, J. G., Thornton, J. A., Wooldridge, P. J., Day, D. A., Rosen, R. S., Cantrell, C., Shetter, R. E., Lefer, B., and Cohen, R. C.: Measurements of the sum of HO2NO2 and CH3O2NO2 in the remote troposphere, Atmos. Chem. Phys., 4, 377–384, https://doi.org/10.5194/acp-4-377-2004, 2004.
NASA: FIREX-AQ, NASA [data set], https://www-air.larc.nasa.gov/missions/firex-aq/index.html, last access: 15 February 2022.
Nault, B. A., Garland, C., Pusede, S. E., Wooldridge, P. J., Ullmann, K., Hall, S. R., and Cohen, R. C.: Measurements of CH3O2NO2 in the upper troposphere, Atmos. Meas. Tech., 8, 987–997, https://doi.org/10.5194/amt-8-987-2015, 2015.
Neuman, J. A., Trainer, M., Brown, S. S., Min, K.-E., Nowak, J. B., Parrish, D. D., Peischl, J., Pollack, I. B., Roberts, J. M., Ryerson, T. B., and Veres, P. R.: HONO emission and production determined from airborne measurements over the Southeast U.S., J. Geophys. Res. Atmos., 121, 2016JD025197, https://doi.org/10.1002/2016JD025197, 2016.
Ninneman, M., Marto, J., Shaw, S., Edgerton, E., Blanchard, C., and Schwab, J.: Reactive oxidized nitrogen speciation and partitioning in urban and rural New York State, J. Air Waste Manage., 71, 348–365, https://doi.org/10.1080/10962247.2020.1837289, 2021.
Novelli, P. C., Elkins, J. W., and Steele, L. P.: The development and evaluation of a gravimetric reference scale for measurements of atmospheric carbon monoxide, J. Geophys. Res.-Atmos., 96, 13109–13121, https://doi.org/10.1029/91JD01108, 1991.
O'Dell, K., Ford, B., Fischer, E. V., and Pierce, J. R.: Contribution of Wildland-Fire Smoke to US PM2.5 and Its Influence on Recent Trends, Environ. Sci. Technol., 53, 1797–1804, https://doi.org/10.1021/acs.est.8b05430, 2019.
Pagonis, D., Campuzano-Jost, P., Guo, H., Day, D. A., Schueneman, M. K., Brown, W. L., Nault, B. A., Stark, H., Siemens, K., Laskin, A., Piel, F., Tomsche, L., Wisthaler, A., Coggon, M. M., Gkatzelis, G. I., Halliday, H. S., Krechmer, J. E., Moore, R. H., Thomson, D. S., Warneke, C., Wiggins, E. B., and Jimenez, J. L.: Airborne extractive electrospray mass spectrometry measurements of the chemical composition of organic aerosol, Atmos. Meas. Tech., 14, 1545–1559, https://doi.org/10.5194/amt-14-1545-2021, 2021.
Peischl, J., Ryerson, T. B., Holloway, J. S., Parrish, D. D., Trainer, M., Frost, G. J., Aikin, K. C., Brown, S. S., Dubé, W. P., Stark, H., and Fehsenfeld, F. C.: A top-down analysis of emissions from selected Texas power plants during TexAQS 2000 and 2006, J. Geophys. Res.-Atmos., 115, D16303, https://doi.org/10.1029/2009JD013527, 2010.
Peng, Q., Palm, B. B., Melander, K. E., Lee, B. H., Hall, S. R., Ullmann, K., Campos, T., Weinheimer, A. J., Apel, E. C., Hornbrook, R. S., Hills, A. J., Montzka, D. D., Flocke, F., Hu, L., Permar, W., Wielgasz, C., Lindaas, J., Pollack, I. B., Fischer, E. V., Bertram, T. H., and Thornton, J. A.: HONO Emissions from Western U.S. Wildfires Provide Dominant Radical Source in Fresh Wildfire Smoke, Environ. Sci. Technol., 54, 5954–5963, https://doi.org/10.1021/acs.est.0c00126, 2020.
Pinto, J. P., Dibb, J., Lee, B. H., Rappenglück, B., Wood, E. C., Levy, M., Zhang, R.-Y., Lefer, B., Ren, X.-R., Stutz, J., Tsai, C., Ackermann, L., Golovko, J., Herndon, S. C., Oakes, M., Meng, Q.-Y., Munger, J. W., Zahniser, M., and Zheng, J.: Intercomparison of field measurements of nitrous acid (HONO) during the SHARP campaign, J. Geophys. Res.-Atmos., 119, 5583–5601, https://doi.org/10.1002/2013JD020287, 2014.
Podolske, J. R., Sachse, G. W., and Diskin, G. S.: Calibration and data retrieval algorithms for the NASA Langley/Ames Diode Laser Hygrometer for the NASA Transport and Chemical Evolution Over the Pacific (TRACE-P) mission, J. Geophys. Res.-Atmos., 108, 8792, https://doi.org/10.1029/2002JD003156, 2003.
Pollack, I. B., Lerner, B. M., and Ryerson, T. B.: Evaluation of ultraviolet light-emitting diodes for detection of atmospheric NO2 by photolysis - chemiluminescence, J. Atmos. Chem., 65, 111–125, https://doi.org/10.1007/s10874-011-9184-3, 2010.
Pollack, I. B., Homeyer, C. R., Ryerson, T. B., Aikin, K. C., Peischl, J., Apel, E. C., Campos, T., Flocke, F., Hornbrook, R. S., Knapp, D. J., Montzka, D. D., Weinheimer, A. J., Riemer, D., Diskin, G., Sachse, G., Mikoviny, T., Wisthaler, A., Bruning, E., MacGorman, D., Cummings, K. A., Pickering, K. E., Huntrieser, H., Lichtenstern, M., Schlager, H., and Barth, M. C.: Airborne quantification of upper tropospheric NOx production from lightning in deep convective storms over the United States Great Plains, J. Geophys. Res.-Atmos., 121, 2002–2028, https://doi.org/10.1002/2015JD023941, 2016.
Ridley, B. A. and Grahek, F. E.: A Small, Low Flow, High Sensitivity Reaction Vessel for NO Chemiluminescence Detectors, J. Atmos. Ocean. Technol., 7, 307–311, https://doi.org/10.1175/1520-0426(1990)007<0307:ASLFHS>2.0.CO;2, 1990.
Ridley, B. A. and Howlett, L. C.: An instrument for nitric oxide measurements in the stratosphere, Rev. Sci. Instrum., 45, 742–746, https://doi.org/10.1063/1.1686726, 1974.
Ridley, B. A., Grahek, F. E., and Walega, J. G.: A Small High-Sensitivity, Medium-Response Ozone Detector Suitable for Measurements from Light Aircraft, J. Atmos. Ocean. Technol., 9, 142–148, https://doi.org/10.1175/1520-0426(1992)009<0142:ASHSMR>2.0.CO;2, 1992.
Roberts, J. M., Stockwell, C. E., Yokelson, R. J., de Gouw, J., Liu, Y., Selimovic, V., Koss, A. R., Sekimoto, K., Coggon, M. M., Yuan, B., Zarzana, K. J., Brown, S. S., Santin, C., Doerr, S. H., and Warneke, C.: The nitrogen budget of laboratory-simulated western US wildfires during the FIREX 2016 Fire Lab study, Atmos. Chem. Phys., 20, 8807–8826, https://doi.org/10.5194/acp-20-8807-2020, 2020.
Robinson, M. A., Decker, Z. C. J., Barsanti, K. C., Coggon, M. M., Flocke, F. M., Franchin, A., Fredrickson, C. D., Gilman, J. B., Gkatzelis, G. I., Holmes, C. D., Lamplugh, A., Lavi, A., Middlebrook, A. M., Montzka, D. M., Palm, B. B., Peischl, J., Pierce, B., Schwantes, R. H., Sekimoto, K., Selimovic, V., Tyndall, G. S., Thornton, J. A., Van Rooy, P., Warneke, C., Weinheimer, A. J., and Brown, S. S.: Variability and Time of Day Dependence of Ozone Photochemistry in Western Wildfire Plumes, Environ. Sci. Technol., 55, 10280–10290, https://doi.org/10.1021/acs.est.1c01963, 2021.
Robinson, M. A., Neuman, J. A., Huey, L. G., Roberts, J. M., Brown, S. S., and Veres, P. R.: Temperature-dependent sensitivity of iodide chemical ionization mass spectrometers, Atmos. Meas. Tech., 15, 4295–4305, https://doi.org/10.5194/amt-15-4295-2022, 2022.
Rollins, A. W., Rickly, P. S., Gao, R.-S., Ryerson, T. B., Brown, S. S., Peischl, J., and Bourgeois, I.: Single-photon laser-induced fluorescence detection of nitric oxide at sub-parts-per-trillion mixing ratios, Atmos. Meas. Tech., 13, 2425–2439, https://doi.org/10.5194/amt-13-2425-2020, 2020.
Russo, R. S., Zhou, Y., Haase, K. B., Wingenter, O. W., Frinak, E. K., Mao, H., Talbot, R. W., and Sive, B. C.: Temporal variability, sources, and sinks of C1–C5 alkyl nitrates in coastal New England, Atmos. Chem. Phys., 10, 1865–1883, https://doi.org/10.5194/acp-10-1865-2010, 2010.
Ryerson, T. B., Huey, L. G., Knapp, K., Neuman, J. A., Parrish, D. D., Sueper, D. T., and Fehsenfeld, F. C.: Design and initial characterization of an inlet for gas-phase NOy measurements from aircraft, J. Geophys. Res., 104, 5483–5492, https://doi.org/10.1029/1998JD100087, 1999.
Ryerson, T. B., Williams, E. J., and Fehsenfeld, F. C.: An efficient photolysis system for fast-response NO2 measurements, J. Geophys. Res., 105, 26447–26461, https://doi.org/10.1029/2000JD900389, 2000.
Sachse, G. W., Hill, G. F., Wade, L. O., and Perry, M. G.: Fast-response, high-precision carbon monoxide sensor using a tunable diode laser absorption technique, J. Geophys. Res.-Atmos., 92, 2071–2081, https://doi.org/10.1029/JD092iD02p02071, 1987.
Selimovic, V., Yokelson, R. J., Warneke, C., Roberts, J. M., de Gouw, J., Reardon, J., and Griffith, D. W. T.: Aerosol optical properties and trace gas emissions by PAX and OP-FTIR for laboratory-simulated western US wildfires during FIREX, Atmos. Chem. Phys., 18, 2929–2948, https://doi.org/10.5194/acp-18-2929-2018, 2018.
Slusher, D. L., Huey, L. G., Tanner, D. J., Flocke, F. M., and Roberts, J. M.: A thermal dissociation–chemical ionization mass spectrometry (TD-CIMS) technique for the simultaneous measurement of peroxyacyl nitrates and dinitrogen pentoxide, J. Geophys. Res.-Atmos., 109, D19315, https://doi.org/10.1029/2004JD004670, 2004.
Sparks, T. L., Ebben, C. J., Wooldridge, P. J., Lopez-Hilfiker, F. D., Lee, B. H., Thornton, J. A., McDuffie, E. E., Fibiger, D. L., Brown, S. S., Montzka, D. D., Weinheimer, A. J., Schroder, J. C., Campuzano-Jost, P., Jimenez, J. L., and Cohen, R. C.: Comparison of Airborne Reactive Nitrogen Measurements During WINTER, J. Geophys. Res.-Atmos., 124, 10483–10502, https://doi.org/10.1029/2019JD030700, 2019.
St. Clair, J. M., Swanson, A. K., Bailey, S. A., and Hanisco, T. F.: CAFE: a new, improved nonresonant laser-induced fluorescence instrument for airborne in situ measurement of formaldehyde, Atmos. Meas. Tech., 12, 4581–4590, https://doi.org/10.5194/amt-12-4581-2019, 2019.
Stein, A. F., Draxler, R. R., Rolph, G. D., Stunder, B. J. B., Cohen, M. D., and Ngan, F.: NOAA's HYSPLIT Atmospheric Transport and Dispersion Modeling System, B. Am. Meteorol. Soc., 96, 2059–2077, https://doi.org/10.1175/BAMS-D-14-00110.1, 2015.
Stockwell, C. E., Yokelson, R. J., Kreidenweis, S. M., Robinson, A. L., DeMott, P. J., Sullivan, R. C., Reardon, J., Ryan, K. C., Griffith, D. W. T., and Stevens, L.: Trace gas emissions from combustion of peat, crop residue, domestic biofuels, grasses, and other fuels: configuration and Fourier transform infrared (FTIR) component of the fourth Fire Lab at Missoula Experiment (FLAME-4), Atmos. Chem. Phys., 14, 9727–9754, https://doi.org/10.5194/acp-14-9727-2014, 2014.
Stutz, J., Kim, E. S., Platt, U., Bruno, P., Perrino, C., and Febo, A.: UV-visible absorption cross sections of nitrous acid, J. Geophys. Res.-Atmos., 105, 14585–14592, https://doi.org/10.1029/2000JD900003, 2000.
Theys, N., Volkamer, R., Müller, J.-F., Zarzana, K. J., Kille, N., Clarisse, L., De Smedt, I., Lerot, C., Finkenzeller, H., Hendrick, F., Koenig, T. K., Lee, C. F., Knote, C., Yu, H., and Van Roozendael, M.: Global nitrous acid emissions and levels of regional oxidants enhanced by wildfires, Nat. Geosci., 13, 681–686, https://doi.org/10.1038/s41561-020-0637-7, 2020.
Vandaele, A. C., Hermans, C., Simon, P. C., Carleer, M., Colin, R., Fally, S., Mérienne, M. F., Jenouvrier, A., and Coquart, B.: Measurements of the NO2 absorption cross-section from 42 000 cm−1 to 10 000 cm−1 (238–1000 nm) at 220 K and 294 K, J. Quant. Spectrosc. Ra., 59, 171–184, https://doi.org/10.1016/S0022-4073(97)00168-4, 1998.
van der Werf, G. R., Randerson, J. T., Giglio, L., Collatz, G. J., Mu, M., Kasibhatla, P. S., Morton, D. C., DeFries, R. S., Jin, Y., and van Leeuwen, T. T.: Global fire emissions and the contribution of deforestation, savanna, forest, agricultural, and peat fires (1997–2009), Atmos. Chem. Phys., 10, 11707–11735, https://doi.org/10.5194/acp-10-11707-2010, 2010.
van der Werf, G. R., Randerson, J. T., Giglio, L., van Leeuwen, T. T., Chen, Y., Rogers, B. M., Mu, M., van Marle, M. J. E., Morton, D. C., Collatz, G. J., Yokelson, R. J., and Kasibhatla, P. S.: Global fire emissions estimates during 1997–2016, Earth Syst. Sci. Data, 9, 697–720, https://doi.org/10.5194/essd-9-697-2017, 2017.
Veres, P. R., Neuman, J. A., Bertram, T. H., Assaf, E., Wolfe, G. M., Williamson, C. J., Weinzierl, B., Tilmes, S., Thompson, C. R., Thames, A. B., Schroder, J. C., Saiz-Lopez, A., Rollins, A. W., Roberts, J. M., Price, D., Peischl, J., Nault, B. A., Møller, K. H., Miller, D. O., Meinardi, S., Li, Q., Lamarque, J.-F., Kupc, A., Kjaergaard, H. G., Kinnison, D., Jimenez, J. L., Jernigan, C. M., Hornbrook, R. S., Hills, A., Dollner, M., Day, D. A., Cuevas, C. A., Campuzano-Jost, P., Burkholder, J., Bui, T. P., Brune, W. H., Brown, S. S., Brock, C. A., Bourgeois, I., Blake, D. R., Apel, E. C., and Ryerson, T. B.: Global airborne sampling reveals a previously unobserved dimethyl sulfide oxidation mechanism in the marine atmosphere, P. Natl. Acad. Sci. USA, 117, 4505–4510, https://doi.org/10.1073/pnas.1919344117, 2020.
Volkamer, R., Molina, L. T., Molina, M. J., Shirley, T., and Brune, W. H.: DOAS measurement of glyoxal as an indicator for fast VOC chemistry in urban air, Geophys. Res. Lett., 32, L08806, https://doi.org/10.1029/2005GL022616, 2005.
von der Weiden, S.-L., Drewnick, F., and Borrmann, S.: Particle Loss Calculator – a new software tool for the assessment of the performance of aerosol inlet systems, Atmos. Meas. Tech., 2, 479–494, https://doi.org/10.5194/amt-2-479-2009, 2009.
Warneke, C., Trainer, M., de Gouw, J. A., Parrish, D. D., Fahey, D. W., Ravishankara, A. R., Middlebrook, A. M., Brock, C. A., Roberts, J. M., Brown, S. S., Neuman, J. A., Lerner, B. M., Lack, D., Law, D., Hübler, G., Pollack, I., Sjostedt, S., Ryerson, T. B., Gilman, J. B., Liao, J., Holloway, J., Peischl, J., Nowak, J. B., Aikin, K. C., Min, K.-E., Washenfelder, R. A., Graus, M. G., Richardson, M., Markovic, M. Z., Wagner, N. L., Welti, A., Veres, P. R., Edwards, P., Schwarz, J. P., Gordon, T., Dube, W. P., McKeen, S. A., Brioude, J., Ahmadov, R., Bougiatioti, A., Lin, J. J., Nenes, A., Wolfe, G. M., Hanisco, T. F., Lee, B. H., Lopez-Hilfiker, F. D., Thornton, J. A., Keutsch, F. N., Kaiser, J., Mao, J., and Hatch, C. D.: Instrumentation and measurement strategy for the NOAA SENEX aircraft campaign as part of the Southeast Atmosphere Study 2013, Atmos. Meas. Tech., 9, 3063–3093, https://doi.org/10.5194/amt-9-3063-2016, 2016.
Warneke, C., Schwarz, J. P., Dibb, J., Kalashnikova, O., Frost, G., Seidel, F., Al-Saadi, J., Brown, S. S., Washenfelder, R., Brewer, A., Moore, R. H., Anderson, B. E., Yacovitch, T., Herndon, S., Liu, S., Jaffe, D., Johnston, N., Selimovic, V., Yokelson, B., Giles, D., Holben, B., Goloub, P., Popovici, I., Trainer, M., Pierce, B., Fahey, D., Roberts, J., Soja, A., Peterson, D., Saide, P. E., Holmes, C., Wang, S., Coggon, M. M., Decker, Z. C. J., Ye, X., Stockwell, C., Xu, L., Gkatzelis, G., Lefer, B., and Crawford, J.: Fire Influence on Regional to Global Environments and Air Quality (FIREX-AQ), in preparation, 2022.
Washenfelder, R. A., Langford, A. O., Fuchs, H., and Brown, S. S.: Measurement of glyoxal using an incoherent broadband cavity enhanced absorption spectrometer, Atmos. Chem. Phys., 8, 7779–7793, https://doi.org/10.5194/acp-8-7779-2008, 2008.
Westerling, A. L.: Increasing western US forest wildfire activity: sensitivity to changes in the timing of spring, Philos. T. Roy. Soc. B, 371, 20150178, https://doi.org/10.1098/rstb.2015.0178, 2016.
Williams, E. J., Roberts, J. M., Baumann, K., Bertman, S. B., Buhr, S., Norton, R. B., and Fehsenfeld, F. C.: Variations in NOy composition at Idaho Hill, Colorado, J. Geophys. Res.-Atmos., 102, 6297–6314, https://doi.org/10.1029/96JD03252, 1997.
Wolfe, G. M., Hanisco, T. F., Arkinson, H. L., Blake, D. R., Wisthaler, A., Mikoviny, T., Ryerson, T. B., Pollack, I., Peischl, J., Wennberg, P. O., Crounse, J. D., St. Clair, J. M., Teng, A., Huey, L. G., Liu, X., Fried, A., Weibring, P., Richter, D., Walega, J., Hall, S. R., Ullmann, K., Jimenez, J. L., Campuzano-Jost, P., Bui, T. P., Diskin, G., Podolske, J. R., Sachse, G., and Cohen, R. C.: Photochemical evolution of the 2013 California Rim Fire: synergistic impacts of reactive hydrocarbons and enhanced oxidants, Atmos. Chem. Phys., 22, 4253–4275, https://doi.org/10.5194/acp-22-4253-2022, 2022.
Womack, C. C., Neuman, J. A., Veres, P. R., Eilerman, S. J., Brock, C. A., Decker, Z. C. J., Zarzana, K. J., Dube, W. P., Wild, R. J., Wooldridge, P. J., Cohen, R. C., and Brown, S. S.: Evaluation of the accuracy of thermal dissociation CRDS and LIF techniques for atmospheric measurement of reactive nitrogen species, Atmos. Meas. Tech., 10, 1911–1926, https://doi.org/10.5194/amt-10-1911-2017, 2017.
Wotawa, G.: The Influence of Canadian Forest Fires on Pollutant Concentrations in the United States, Science, 288, 324–328, https://doi.org/10.1126/science.288.5464.324, 2000.
Xu, L., Crounse, J. D., Vasquez, K. T., Allen, H., Wennberg, P. O., Bourgeois, I., Brown, S. S., Campuzano-Jost, P., Coggon, M. M., Crawford, J. H., DiGangi, J. P., Diskin, G. S., Fried, A., Gargulinski, E. M., Gilman, J. B., Gkatzelis, G. I., Guo, H., Hair, J. W., Hall, S. R., Halliday, H. A., Hanisco, T. F., Hannun, R. A., Holmes, C. D., Huey, L. G., Jimenez, J. L., Lamplugh, A., Lee, Y. R., Liao, J., Lindaas, J., Neuman, J. A., Nowak, J. B., Peischl, J., Peterson, D. A., Piel, F., Richter, D., Rickly, P. S., Robinson, M. A., Rollins, A. W., Ryerson, T. B., Sekimoto, K., Selimovic, V., Shingler, T., Soja, A. J., Clair, J. M. S., Tanner, D. J., Ullmann, K., Veres, P. R., Walega, J., Warneke, C., Washenfelder, R. A., Weibring, P., Wisthaler, A., Wolfe, G. M., Womack, C. C., and Yokelson, R. J.: Ozone chemistry in western U.S. wildfire plumes, Science Advances, 7, eabl3648, https://doi.org/10.1126/sciadv.abl3648, 2021.
Xu, Z., Liu, Y., Nie, W., Sun, P., Chi, X., and Ding, A.: Evaluating the measurement interference of wet rotating-denuder–ion chromatography in measuring atmospheric HONO in a highly polluted area, Atmos. Meas. Tech., 12, 6737–6748, https://doi.org/10.5194/amt-12-6737-2019, 2019.
Yokelson, R. J., Griffith, D. W. T., and Ward, D. E.: Open-path Fourier transform infrared studies of large-scale laboratory biomass fires, J. Geophys. Res.-Atmos., 101, 21067–21080, https://doi.org/10.1029/96JD01800, 1996.
Zhang, L., Wiebe, A., Vet, R., Mihele, C., O'Brien, J. M., Iqbal, S., and Liang, Z.: Measurements of reactive oxidized nitrogen at eight Canadian rural sites, Atmos. Environ., 42, 8065–8078, https://doi.org/10.1016/j.atmosenv.2008.06.034, 2008.
Ziemann, P. J. and Atkinson, R.: Kinetics, products, and mechanisms of secondary organic aerosol formation, Chem. Soc. Rev., 41, 6582–6605, https://doi.org/10.1039/C2CS35122F, 2012.