the Creative Commons Attribution 4.0 License.
the Creative Commons Attribution 4.0 License.
 | 22 Sep 2022
TROPESS/CrIS carbon monoxide profile validation with NOAA GML and ATom in situ aircraft observations
Gene L. Francis
Susan S. Kulawik
Kevin W. Bowman
Karen Cady-Pereira
Dejian Fu
Jennifer D. Hegarty
Valentin Kantchev
Ming Luo
Vivienne H. Payne
John R. Worden
Róisín Commane
Kathryn McKain
The new single-pixel TROPESS (TRopospheric Ozone and its Precursors from Earth System Sounding) profile retrievals of carbon monoxide (CO) from the Cross-track Infrared Sounder (CrIS) are evaluated using vertical profiles of in situ observations from the National Oceanic and Atmospheric Administration (NOAA) Global Monitoring Laboratory (GML) aircraft program and from the Atmospheric Tomography Mission (ATom) campaigns. The TROPESS optimal estimation retrievals are produced using the MUSES (MUlti-SpEctra, MUlti-SpEcies, MUlti-Sensors) algorithm, which has heritage from retrieval algorithms developed for the EOS/Aura Tropospheric Emission Spectrometer (TES). TROPESS products provide retrieval diagnostics and error covariance matrices that propagate instrument noise as well as the uncertainties from sequential retrievals of parameters such as temperature and water vapor that are required to estimate the carbon monoxide profiles. The validation approach used here evaluates biases in column and profile values as well as the validity of the retrieval error estimates using the mean and variance of the compared satellite and aircraft observations. CrIS–NOAA GML comparisons had biases of 0.6 % for partial column average volume mixing ratios (VMRs) and (2.3, 0.9, −4.5) % for VMRs at (750, 511, 287) hPa vertical levels, respectively, with standard deviations from 9 % to 14 %. CrIS–ATom comparisons had biases of −0.04 % for partial column and (2.2, 0.5, −3.0) % for (750, 511, 287) hPa vertical levels, respectively, with standard deviations from 6 % to 10 %. The reported observational errors for TROPESS/CrIS CO profiles have the expected behavior with respect to the vertical pattern in standard deviation of the comparisons. These comparison results give us confidence in the use of TROPESS/CrIS CO profiles and error characterization for continuing the multi-decadal record of satellite CO observations.
- Article
(11063 KB) - Full-text XML
-
Supplement
(1432 KB) - BibTeX
- EndNote


Carbon monoxide (CO) is a useful tracer of atmospheric pollution, with direct emissions from incomplete combustion such as biomass and fossil fuel burning as well as secondary production from the oxidation of methane (CH4) and volatile organic compounds (VOCs). Atmospheric CO distributions have a seasonal cycle that is mainly driven by photochemical destruction, which allows CO to build up over winter and early spring in higher latitudes. The lifetime of CO of weeks to months (e.g., Holloway et al., 2000) is long enough to allow observations of pollution plumes and their subsequent long-range transport, but short enough to distinguish the plumes against background seasonal distributions (e.g., Edwards et al., 2004, 2006; Hegarty et al., 2009, 2010). As a dominant sink for the hydroxyl radical (OH), CO plays a critical role in atmospheric reactivity (e.g., Lelieveld et al., 2016) and is considered a short-lived climate pollutant (SLCP) because of its impacts on methane lifetime as well as carbon dioxide and ozone formation (e.g., Myhre et al., 2014; Gaubert et al., 2017).
Global observations of tropospheric CO from satellites started in 2000 with the NASA Earth Observing System (EOS) Measurement of Pollution in the Troposphere (MOPITT) instrument on Terra (Drummond et al., 2010), followed by the EOS Atmospheric Infrared Spectrometer (AIRS, McMillan et al., 2005) on Aqua launched in 2002, the Scanning Imaging Absorption Spectrometer for Atmospheric Chartography (SCIAMACHY, de Laat et al., 2006) on Envisat launched in 2002, the EOS Tropospheric Emission Spectrometer (TES, Beer et al., 2006) on Aura launched in 2004, the Infrared Atmospheric Sounding Interferometer (IASI, Clerbaux et al., 2009) on the MetOp series beginning in 2006, the Cross-track Infrared Sounder (CrIS, Gambacorta et al., 2014) on the Suomi National Polar-orbiting Partnership (SNPP) satellite launched in 2011, and most recently the Joint Polar Satellite System (JPSS) series, TROPOMI on the Sentinel-5 precursor in 2017 (Borsdorff et al., 2018), and the Fourier transform spectrometer (FTS-2) on the Greenhouse gases Observing SATellite-2 (GOSAT-2, Suto et al., 2021) launched in 2018. Satellite CO observations are assimilated for reanalyses and operational air quality forecasting (e.g., Gaubert et al., 2016; Inness et al., 2019; Miyazaki et al., 2020) and have been used in inverse modeling analyses to estimate emissions and attribute sources for co-emitted species such as CO2 (e.g., Kopacz et al., 2010; Jiang et al., 2017; Liu et al., 2017; Zheng et al., 2019; Gaubert et al., 2020; Byrne et al., 2021; Qu et al., 2022). Trend analyses of satellite CO observations (e.g., Worden et al., 2013; Buchholz et al., 2021) show a general decline of atmospheric CO over the satellite record globally and in most regions, but with a slowing of this decrease in recent years that emphasizes the need for continued satellite CO observations that are validated and have reliable error characterization.
In this study, we evaluate the biases and reported uncertainties of single-field-of-view (FOV) CO retrievals from the Cross-track Infrared Sounder (CrIS) on board the SNPP satellite launched in October 2011. CrIS is a Fourier transform spectrometer (FTS) that has continuation instruments on the current and planned JPSS series with JPSS1/NOAA-20 launched in 2017 and planned launches in 2022, 2028, and 2032 (https://www.nesdis.noaa.gov/about/our-offices/joint-polar-satellite-system-jpss-program-office, last access: 14 September 2022). The CrIS CO retrievals evaluated here use the MUSES (MUlti-SpEctra, MUlti-SpEcies, MUlti-Sensors) algorithm (Fu et al., 2016, 2018, 2019) and are processed with the TROPESS (TRopospheric Ozone and its Precursors from Earth System Sounding) Science Data Processing System (Bowman, 2021). TROPESS is a NASA project that provides a framework for consistent data processing of ozone and ozone precursors across different satellite instruments. TROPESS retrievals use single-FOV radiances in sequential optimal estimation retrievals (Rodgers, 2000) of temperature, water vapor, effective cloud parameters, ozone, CO, and other trace gases, allowing for full characterization of the vertical retrieval sensitivity with an averaging kernel and error covariance (Bowman et al., 2006). TROPESS/CrIS CO products differ from other available CrIS CO data products that combine nine FOVs to obtain a single cloud-cleared radiance and corresponding retrieval of atmospheric parameters such as the NOAA Unique Combined Atmospheric Processing System (NUCAPS) (Gambacorta et al., 2014, 2017; Nalli et al., 2020) and the Community Long-term Infrared Microwave Combined Atmospheric Product System (CLIMCAPS) (Smith and Barnet, 2020).
TROPESS data products report a separate matrix for the observational error terms along with the total retrieval error covariance that includes the contribution of smoothing error. This is important for evaluation of retrieval errors using in situ profiles since the validation comparison removes the effect of smoothing in the retrieval by applying the retrieval averaging kernel and a priori to the in situ profile before differencing (Rodgers and Connor, 2003). Similar comparisons were performed in the recent validation study for the MUSES single-FOV CO retrievals from the Aura Atmospheric Infrared Sounder (AIRS) of Hegarty et al. (2022).
Section 2 describes the TROPESS retrievals and CO data products in more detail, and Sect. 3 describes the validation in situ data from the National Oceanic and Atmospheric Administration (NOAA) Global Monitoring Laboratory (GML) aircraft network and the Atmospheric Tomography Mission (ATom) campaigns. The validation methods are presented in Sect. 4, and results are shown in Sect. 5 with a summary and conclusions in Sect. 6.
The first Cross-track Infrared Sounder (CrIS) was launched 28 October 2011 on the SNPP satellite into a sun-synchronous polar orbit with an altitude near 830 km and an Equator-crossing time (ascending node) near 13:30 LT. CrIS is a Fourier transform spectrometer (FTS) operating in three spectral bands between 648 and 2555 cm−1. This includes the R-branch of the thermal infrared (TIR) CO (0–1) fundamental band above 2155 cm−1. After launch, spectral radiance data that included the CO band were collected using a spectral resolution of 2.5 cm−1. This resolution was relatively coarse and significantly limited the vertical sensitivity of CO retrievals (Gambacorta et al., 2014). Following the decision to collect data at full spectral resolution (δ=0.625 cm−1), these finer-resolution spectral radiances have been available since 4 December 2014. Here we only utilize the full-spectral-resolution CrIS data.
2.1 TROPESS retrieval approach
TROPESS data processing (Bowman, 2021) produces retrievals of temperature, water vapor, and trace gases such as ozone (O3), methane (CH4), carbon monoxide (CO), ammonia (NH3), and peroxyacetyl nitrate (PAN) from single and multiple instruments including AIRS and OMI as well as CrIS and TROPOMI. The MUSES retrieval algorithm used in TROPESS was developed with heritage from Aura/TES retrieval processing. Bowman et al. (2021) describe the sequential MUSES retrievals of temperature, water vapor, and effective cloud properties for each FOV that are necessary for the retrieval of CO. Each step in the sequence includes an iterative retrieval with a forward model and updated estimate of the state vector of atmospheric parameters following the maximum a posteriori (MAP) method. The forward model for radiative transfer at CrIS TIR wavelengths uses optimal spectral sampling (OSS, Moncet et al., 2015), which includes effective cloud optical depth and height parameters (Eldering et al., 2008; Kulawik et al., 2006).
Here we analyze TROPESS/CrIS TIR-only CO retrievals that use the 2181–2200 cm−1 spectral range. A priori profiles for TROPESS CO retrievals are taken from the model climatology used in Aura/TES processing (MOZART, Brasseur et al., 1998), with monthly variation over a 30∘ latitude and 60∘ longitude grid. The a priori uncertainty covariance matrix used to constrain the retrieval is the same as used for MOPITT profiles (Deeter et al., 2010) with 30 % uncertainty for vertical CO parameters at all levels and correlation lengths corresponding to 100 hPa between them in the troposphere.
The TROPESS CO products have quality flags for screening cases that did not converge or that have unphysical results. This screening checks the magnitude and spectral structure of radiance residuals, cloud retrieval characteristics, and deviation of surface emissivity from a priori values. Specifically, retrievals with good data quality of 1 have radiance residual standard deviation less than 12 times the radiance error, an absolute value of the radiance residual mean less than 0.7 times the radiance error, KdotDL (the normalized dot product of the Jacobians and the radiance residual) less than 0.8, LdotDL (the normalized dot product of the radiance and the residual) less than 0.6, cloud-top pressures below 90 hPa, mean cloud optical depths less than 50, cloud variability (variation with respect to wavenumber) less than 3, and mean surface emissivity that did not change by more than 0.06. These threshold values are based on comparisons with in situ data and other satellite data to determine when retrievals are valid.
2.2 TROPESS/CrIS CO data examples
Figure 1 shows an example of TROPESS/CrIS CO data for 12 September 2020 when there were significant fires in the western US. These retrievals are from a special data collection that processed scenes selected from latitude–longitude subsampling to enable throughput with the available computing capacity (Bowman et al., 2021). The data in this collection are pre-filtered for quality (see Sect. 2.1), and Fig. 1a shows all available day and night retrievals. Figure 1b shows the data after higher cloudy scenes are removed (i.e., cloud tops with pressure <700 hPa and cloud effective optical depth >0.1). For reference, Fig. 1c shows the mid-tropospheric average CO volume mixing ratio (VMR) for the a priori profiles used in the retrievals, and Fig. 1d shows a NASA Worldview (https://worldview.earthdata.nasa.gov/, last access: 14 September 2022) image from SNPP/VIIRS (Visible Infrared Imaging Radiometer Suite) with clouds and smoke shown in true color and red areas indicating fire and thermal anomalies. Since vertical profile retrievals using TIR radiances have sensitivity to CO mainly in the free troposphere, Fig. 1 shows individual retrievals with average VMR from vertical layers between 700 and 350 hPa. When all scenes are included, the average number of degrees of freedom for signal (DFS) is 0.99 for the CrIS CO observations in Fig. 1a, and when cloudy scenes are removed (Fig. 1b) the average DFS is 1.14 for the remaining CrIS observations.
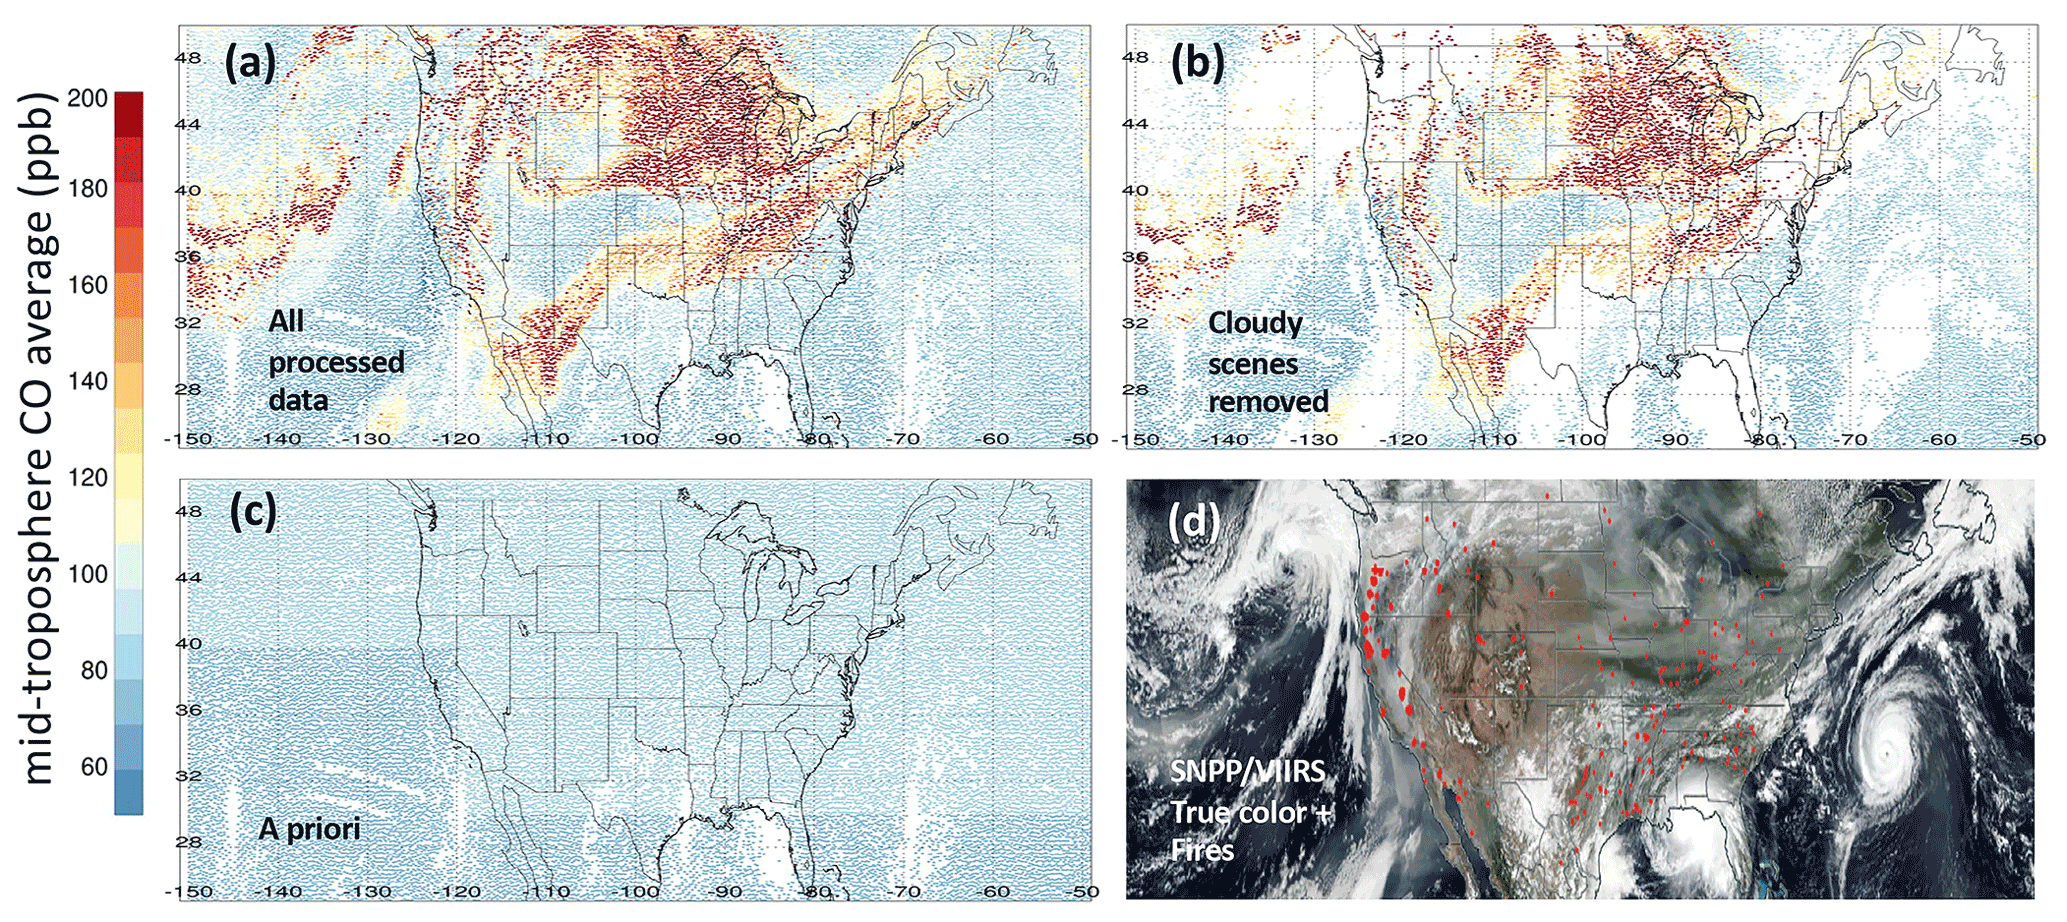
Figure 1SNPP TROPESS/CrIS and SNPP/VIIRS observations for 14 September 2020. Panel (a) shows the average CO VMR for 700 to 350 hPa for all processed TROPESS CO retrievals with good data quality (see text). Panel (b) shows the same free troposphere CO averages as (a) but with cloudy scenes removed (see text). Panel (c) shows the average TROPESS a priori CO VMR for 700 to 350 hPa. Panel (d) shows the NASA Worldview SNPP/VIIRS image for 14 September 2020 with clouds and smoke (true color) as well as fire thermal anomalies (red).
As stated in the Introduction, the TROPESS single-FOV products are different from the NUCAPS and CLIMCAPS products that combine nine FOVs in a retrieval from a single cloud-cleared radiance (Susskind et al., 2003). These multiple-FOV products have the advantage of increased global coverage in the presence of partially cloudy scenes but with coarser spatial resolution. Figure 2 shows an example of SNPP CLIMCAPS (Barnet, 2019) compared to SNPP TROPESS/CrIS CO products (daytime only) on 13 September 2018 over the Pole Creek fire in Utah. For CLIMCAPS, trace gas products with less than 1 DFS report mass mixing ratio (MMR) on a single level at the retrieval pressure with peak sensitivity, which is 500 hPa for CO. We converted MMR to VMR for Fig. 2. This is compared to the tropospheric column average VMR from TROPESS, so the background VMR values are close but do not represent the same retrieved quantities. CrIS retrieval center locations are shown by the circles in Fig. 2a and b, which are not intended to represent the spatial extent of the observations. The CLIMCAPS retrievals show elevated CO from the fire, but these combined FOV retrievals would give an overestimate of the plume width and do not distinguish the larger plume from the smaller fires to the east in Colorado.

Figure 2SNPP observations of the Pole Creek fire in Utah, USA, on 13 September 2018. The Great Salt Lake is in the upper left of each panel, and state borders with Idaho, Wyoming, and Colorado are indicated by solid straight lines. Dotted lines indicate a 1∘ latitude by 1∘ longitude grid, with the top left corner at 42∘ N, −113∘ E. Panel (a) shows CLIMCAPS/CrIS CO at 500 hPa (MMR converted to VMR). Panel (b) shows the TROPESS/CrIS tropospheric CO column average VMR, and panel (c) shows the corresponding NASA Worldview SNPP/VIIRS image with clouds and smoke (true color) as well as fire thermal anomalies (red).
We note that retrievals of CO in the presence of smoke are not significantly affected by scattering for infrared observations at wavelengths λ ∼4.6 µm, such as in the CrIS CO band. This is because Rayleigh scattering, which decreases by , is completely negligible and Mie scattering would be significant only for particles larger than µm, (e.g., Seinfeld and Pandis, 1998), while the size distribution for biomass burning smoke particles peaks around 0.3 µm (e.g., Reid et al., 2005). For the same Pole Creek fire in Fig. 2, Juncosa Calahorrano et al. (2021) showed how SNPP/CrIS single-pixel MUSES retrievals of acyl peroxy nitrates, also known as PAN, along with CO, can be used to follow fire plume chemical evolution. After subtracting background amounts, the normalized excess mixing ratios (NEMRs) of PAN with respect to CO, computed from the CrIS observations for this plume, were consistent with in situ aircraft observations of smoke plumes from the summer 2018 WE-CAN (Western Wildfire Experiment for Cloud Chemistry, Aerosol Absorption, and Nitrogen) campaign.
Table 1Aircraft in situ validation observations used in this study.
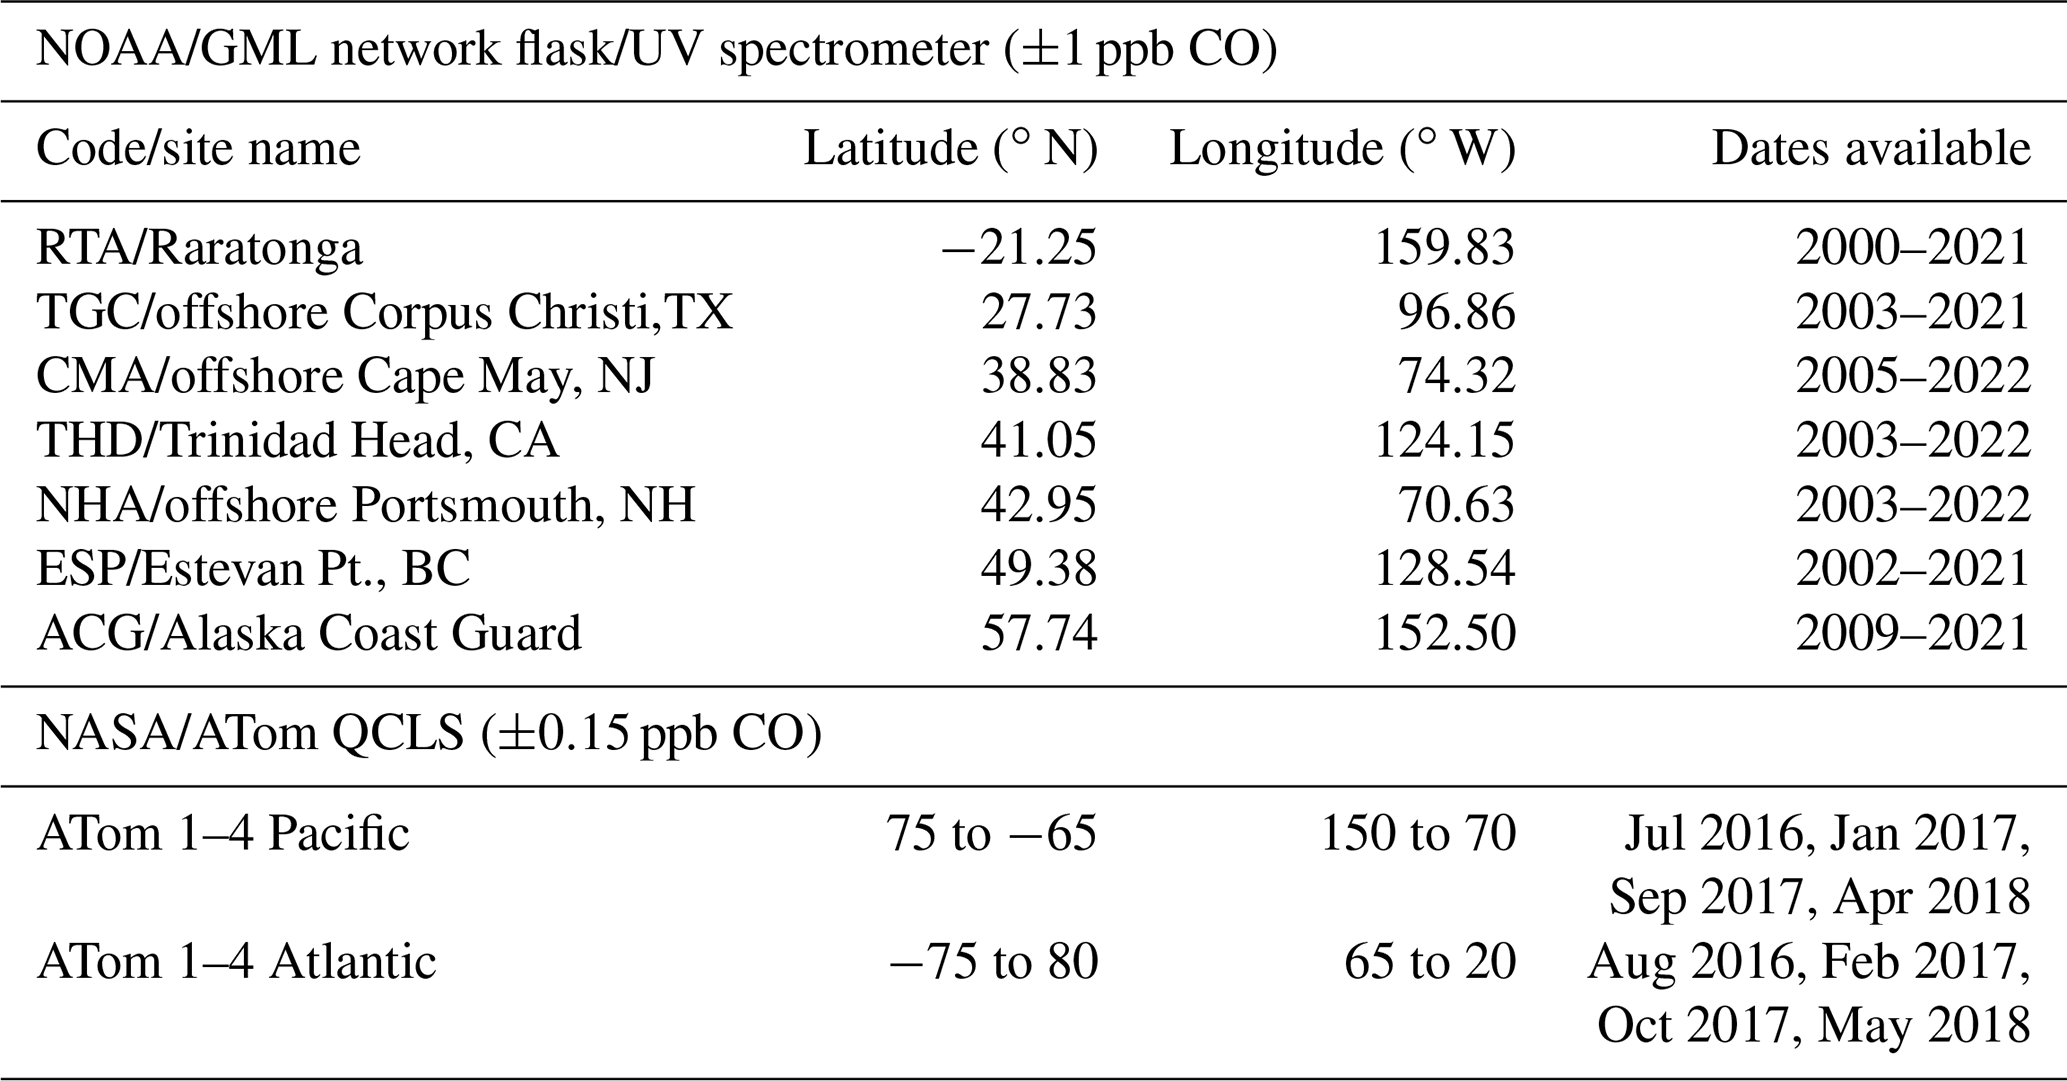
https://gml.noaa.gov/ccgg/aircraft/ (last access: 14 September 2022); https://espo.nasa.gov/atom/content/ATom (last access: 14 September 2022).
3.1 NOAA GML aircraft network
Spanning 3 decades, NOAA GML aircraft network vertical profile observations are taken on semi-regular flights (approximately one per month) at fixed sites mostly in North America except for one site in Rarotonga, Cook Islands (Sweeney et al., 2015). These flights collect air samples using an automated flask system to obtain vertical profiles for each trace gas measured from near the surface to around 400 hPa, depending on aircraft limitations at each site. Flask samples are then sent for laboratory analysis of a multitude of trace gases including CO, which was measured with vacuum UV–fluorescence spectroscopy during the time period of this analysis. CO mixing ratios are reported relative to the WMO X2014A scale (https://gml.noaa.gov/ccl/co_scale.html, last access: 14 September 2022) and have reproducibility ∼1 ppb (Sweeney et al., 2015). NOAA GML aircraft profiles of CO have been used for the long-term validation of the MOPITT CO record, with updated validation for each new data version (Deeter et al., 2019, and references therein). For the current analysis, we use NOAA GML aircraft network observations of CO collected during 2016 and 2017 from seven locations (Table 1).
3.2 ATom aircraft campaigns
The Atmospheric Tomography Mission (ATom) was designed to study air masses in the most remote regions of the Pacific and Atlantic Ocean in each season (Thompson et al., 2022), which also makes the data valuable for validating satellite CO observations over a range of latitudes, with mostly background CO concentrations, except for where transported pollution plumes were encountered (Deeter et al., 2019, 2022; Martínez-Alonso et al., 2020; Hegarty et al., 2022). We use CO profiles from the quantum cascade laser spectrometer (QCLS) on ATom campaigns 1–4 (see Table 1). These NASA DC-8 flights obtained vertical profiles from 0.2 to 12 km altitude (∼290 hPa) by ascending or descending approximately every 220 km. CO was measured at 1 Hz with QCLS reproducibility around 0.15 ppbv (McManus et al., 2010; Santoni et al., 2014). The QCLS data were calibrated to the X2014A CO WMO scale maintained by the NOAA GML.
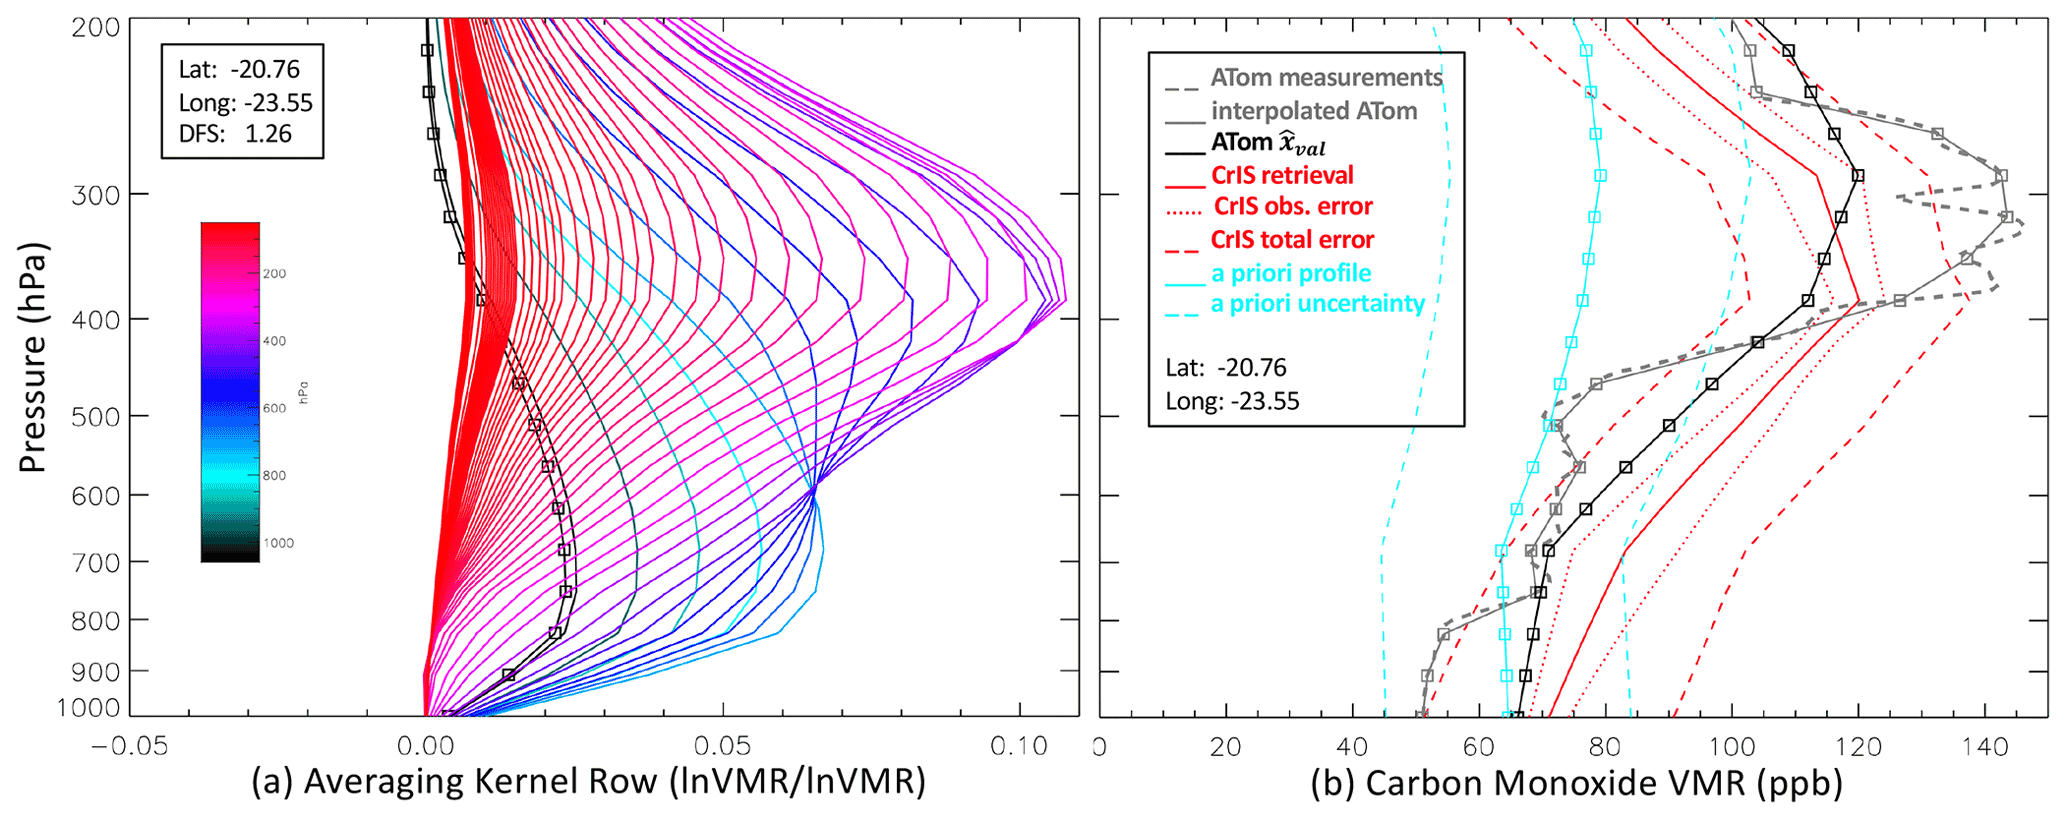
Figure 3Examples of TROPESS/CrIS CO averaging kernel (A) (a) and the validation process (b). The colors of the averaging kernel indicate the pressure level (66 levels from 1017.45 to 0.1 hPa) corresponding to each row, with the surface-level row also indicated by the squares. The number of degrees of freedom for signal (DFS), given by the sum of the diagonal (i.e., trace) of this averaging kernel, is 1.26. The right panel shows the CrIS CO profile retrieval (solid red line) with total error (dashed red lines), observation error (dotted red lines), a priori profile (solid cyan line with squares), and diagonal uncertainty (dashed cyan lines). The closest ATom aircraft profile had 10.4 km–3.5 h coincidence. The original ATom profile (dashed grey line) is interpolated to the CrIS vertical grid (solid grey with squares) and transformed by the instrument operator to give ATom (Eq. 1) (solid black line with squares).
4.1 Data selection, coincidence criteria, and vertical extension of aircraft profiles
TROPESS/CrIS CO profiles are selected for comparison if they have retrieval quality of 1 and effective cloud optical depth less than 0.1 to ensure non-cloudy CrIS observations. We then find all eligible CrIS and aircraft profile pairs within 9 h and 50 km distance. This has been a standard coincidence distance criterion for several validation studies (e.g., Deeter et al., 2019, 2022; Hegarty et al., 2022). Tang et al. (2020) found very little sensitivity in MOPITT CO validation results for 25, 50, 100, and 200 km coincidence except for the cases with a 25 km radius that resulted in an insufficient number of matches for meaningful statistics. The Tang et al. (2020) study also tested the time coincidence criterion (12, 6, 2, and 1 h) with similar conclusions. Application of the 9 h–50 km coincidence criteria yielded 2092 CrIS–aircraft profile pairs for NOAA GML flights from 2016 and 2017 and 1052 profile pairs for the ATom 1–4 campaigns. Since the aircraft profiles used for validation do not span the full vertical range of satellite-retrieved profiles, we must extend these with a reasonable approximation of atmospheric CO to facilitate the comparison as described below in Sect. 4.2. Here we use the TROPESS a priori profiles (from model climatology, described above) to extend the in situ profiles above the highest altitude sampled. The a priori profile is scaled to match the CO abundance of the aircraft measurement at the highest altitude. The choices of model and approach for extending the aircraft profiles are examined more in Tang et al. (2020) and Hegarty et al. (2022), with similar conclusions that the impacts apply mostly to bias estimates in the middle to upper troposphere. Martìnez-Alonso et al. (2022) compute the uncertainty introduced by this extension explicitly using NOAA AirCore in situ balloon profiles that sample into the stratosphere (Karion et al., 2010). This uncertainty is computed for validation using aircraft profiles (with top samples around 400 hPa for NOAA/GML) by comparing MOPITT profiles to truncated and extended AirCore profiles vs. the true full AirCore profiles. The comparison error introduced by the extension was at most 3 % around 300 hPa and much less than the standard deviation of MOPITT and full AirCore profile differences (∼7 %–10 %) in the upper troposphere. We also note that for ATom profiles, the highest-altitude samples are normally taken around 12 km (∼200 hPa), and the profile extension therefore has a minimal impact on tropospheric validation results.
4.2 Comparison of TROPESS satellite and aircraft observations
In order to account for the satellite observational and retrieval approach, including prior information, when comparing satellite retrieval products to in situ measurements of CO, we apply the instrument operator to convert the in situ profile into the values that would be retrieved for the same air mass assuming the satellite instrument and retrieval (Jones et al., 2003, Rodgers and Conner, 2003, Worden et al., 2007):
where xval is the aircraft or sonde in situ profile being used for validation (following extension, described above, and linear interpolation to the satellite vertical grid), xa is the a priori profile used in the TROPESS retrieval, A is the averaging kernel matrix that describes the observation and retrieval vertical sensitivity to the true state, and is the in situ validation profile transformed by the satellite instrument operator. This operation accounts for both the broad vertical resolution (or “smoothing”) of remotely sensed measurements and the influence of the a priori, which is especially important in the vertical ranges where satellite observations have low sensitivity to CO abundance. Figure 3 shows an example of the averaging kernel A and a validation comparison with Eq. (1) applied to an ATom in situ profile.
4.3 Evaluating TROPESS CO reported observational errors
Following Bowman et al. (2006, 2021), for retrieved parameter (e.g., CO abundance) with a priori covariance Sa, radiance measurement covariance Se, Jacobian matrix , radiance L(x), gain matrix , and averaging kernel A=GK, the a posteriori error covariance can be written as the sum of
with and
where Snoise=GSeGT, , and
In this notation, b variables are parameters that are held constant in the CO retrieval (such as temperature and water vapor) but affect the radiance observation and are propagated through Jacobian Kb, while b_ret variables are retrieved along with CO (such as surface emissivity) and have corresponding off-diagonal terms in the full retrieval averaging kernel matrix. When we apply the satellite instrument operator in Eq. (1) to the in situ aircraft profile, we are accounting for the smoothing error term. Thus, we expect differences between and our retrieved to be due to observational error terms (Eq. 3) and to geophysical differences from the sampling of different air masses and surface locations because of imperfect coincidence.
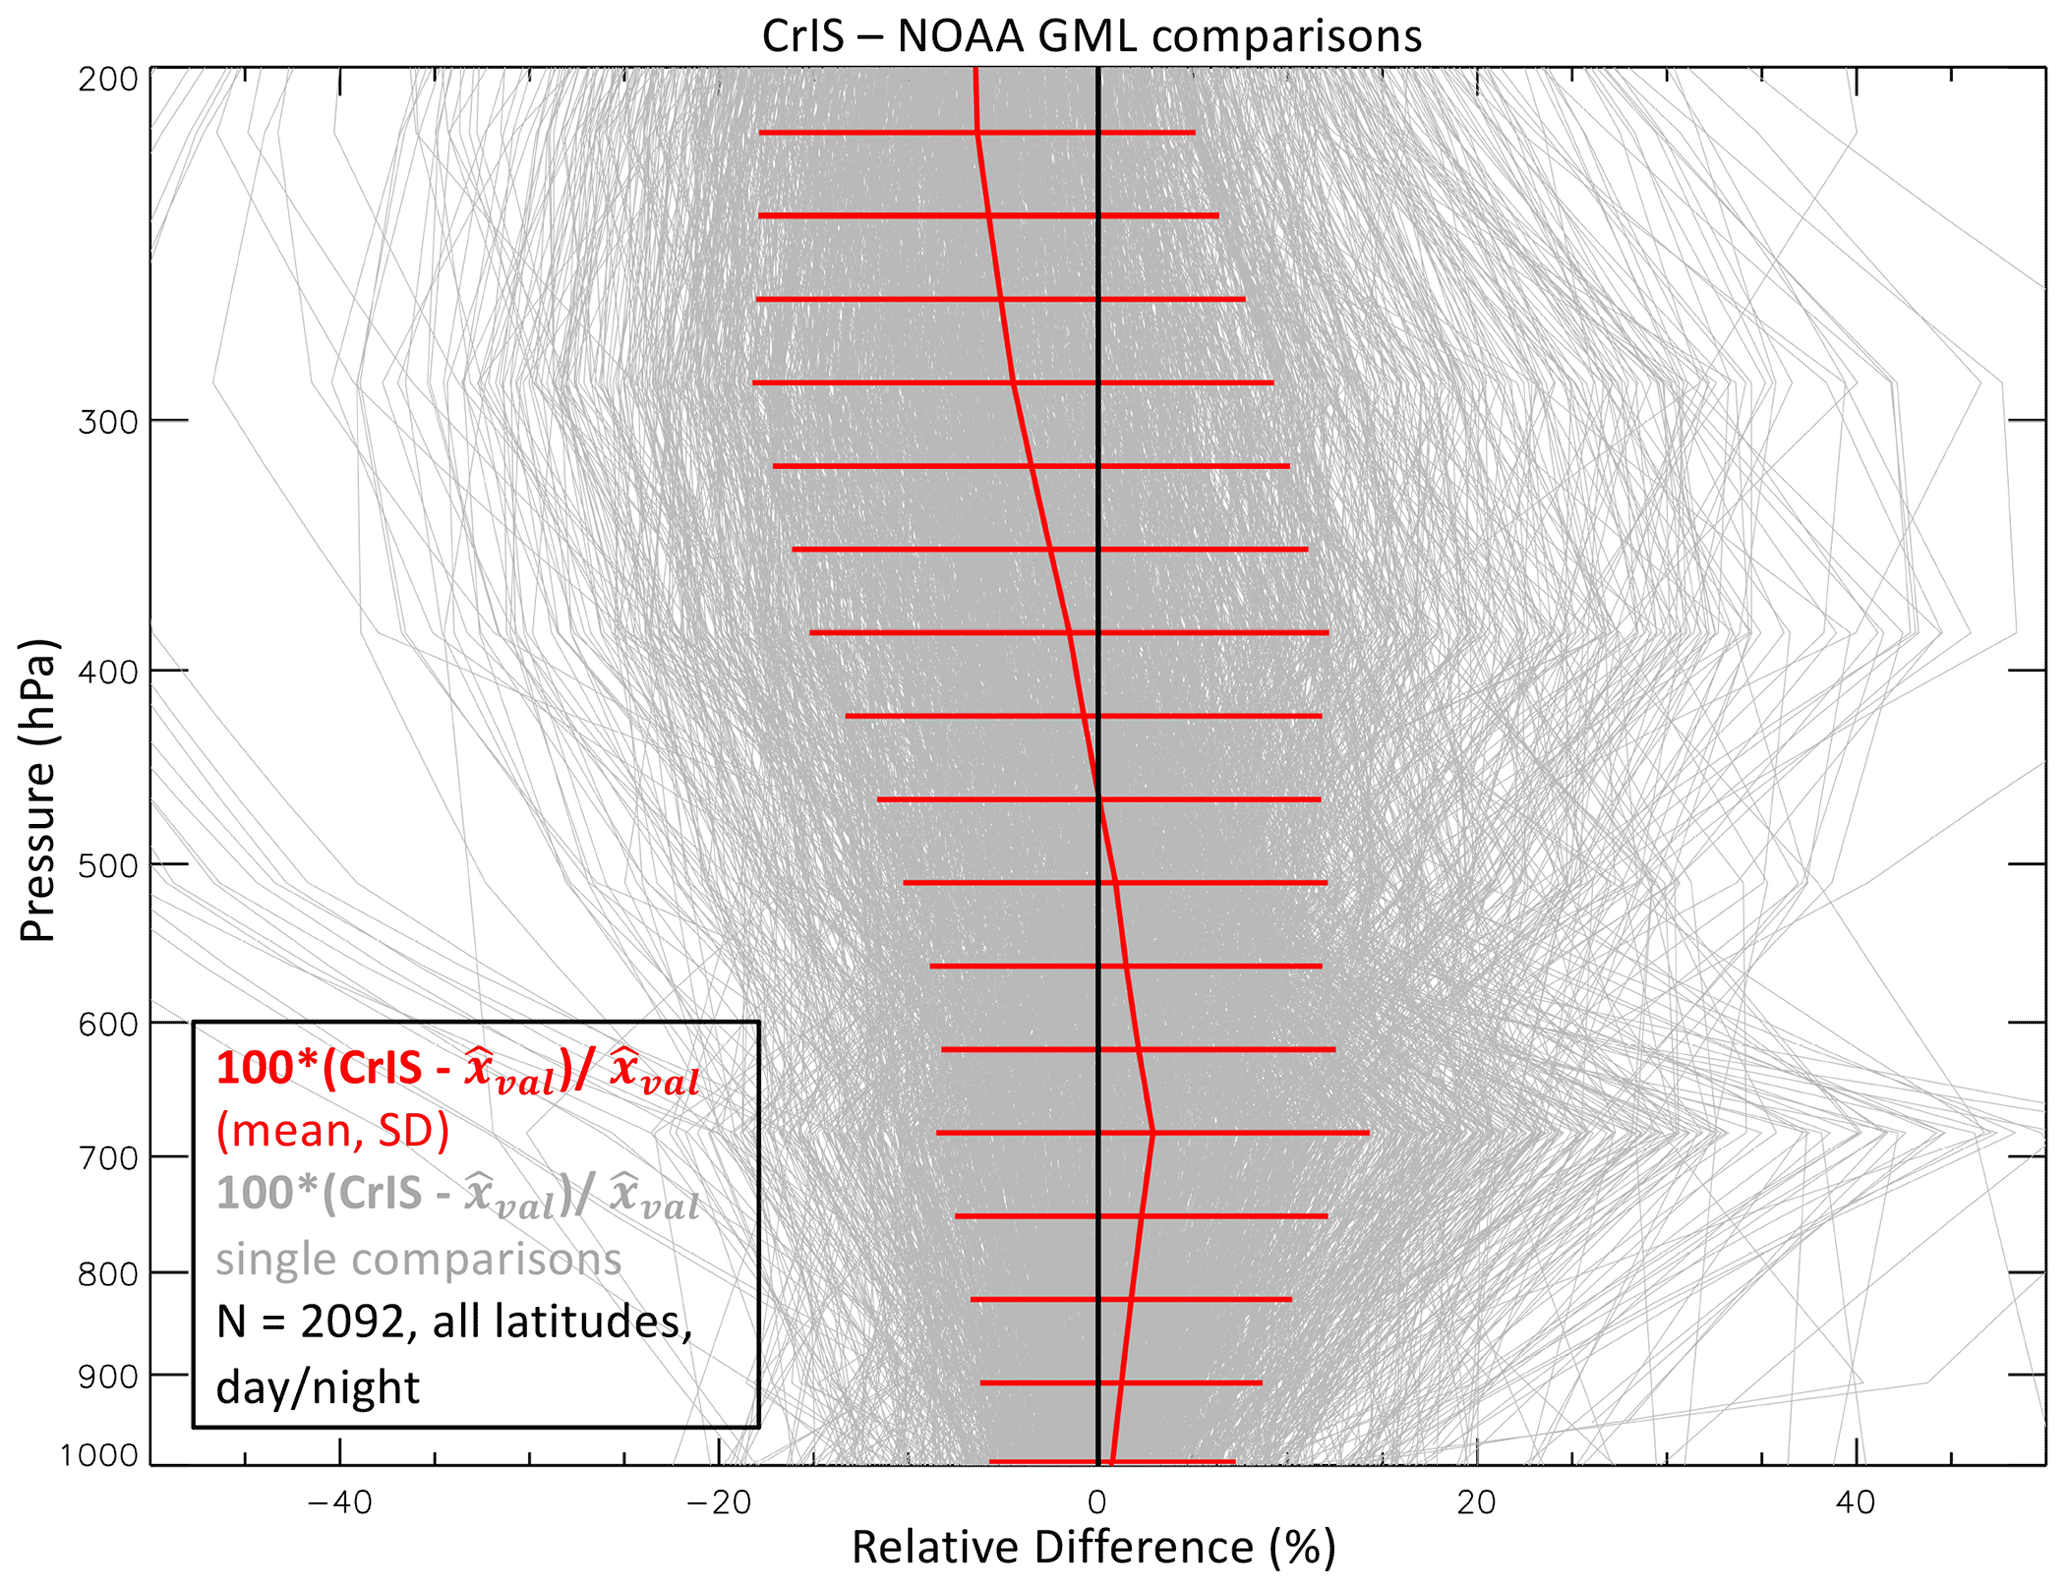
Figure 4Relative differences (%) in single CrIS retrievals with coincident NOAA GML profiles (grey) and the average percent difference with 1σ horizontal bars (red). Both day and night CrIS observations are included for coincidence search, with 1866 day and 266 night comparison pairs found.
5.1 TROPESS/CrIS CO comparisons with NOAA GML aircraft data
After extending the in situ profiles vertically (described in Sect. 4.1) and applying Eq. (1), we compute the differences between satellite retrievals and transformed aircraft profiles. Figure 4 shows the bias (% relative difference) of the CrIS CO retrieved profiles with respect to NOAA GML aircraft profiles (. A similar pattern of positive bias in the lower to middle troposphere and negative bias in the upper troposphere is observed for MUSES/AIRS profiles compared to NOAA GML flights (Hegarty et al., 2022). However, MOPITT (version 9, TIR-only data) comparisons to NOAA GML (Deeter et al., 2022) have almost the opposite vertical bias pattern with a negative bias (−1.6 %) in the lower to middle troposphere and a positive bias (0.6 %) in the upper troposphere. Since TROPESS and MOPITT retrievals both use optimal estimation algorithms and a similar prior CO error covariance, this different vertical bias pattern is most likely due to instrument differences. MOPITT uses gas filter correlation radiometry instead of spectroscopy to detect CO absorption in the atmosphere with corresponding differences in vertical sensitivity that are determined from gas cell pressure rather than spectral resolution. After accounting for retrieval differences in a priori profiles and covariances between MOPITT and IASI (another FTS instrument), George et al. (2015) find a similar positive bias for MOPITT in the upper troposphere.
Table 2 gives the mean bias and standard deviations for selected pressures and partial column average VMRs over different observing conditions (land, ocean, day, and night). The partial column refers to the CO column between the minimum and maximum flight altitudes of each aircraft profile. The average VMR over this range is computed by interpolating both the CrIS retrieval and the aircraft profile to these end points. Since aircraft flights normally occur during daytime, there are fewer coincident pairs for CrIS night retrievals. Tang et al. (2020) find larger bias and variance for nighttime MOPITT data in comparisons with in situ aircraft data, especially for flights over urban regions, suggesting that more night validation flights are needed to properly evaluate night satellite retrievals.
Table 2Bias and standard deviation (SD) for comparisons of SNPP TROPESS/CrIS CO retrievals and in situ CO profiles from NOAA GML fights.
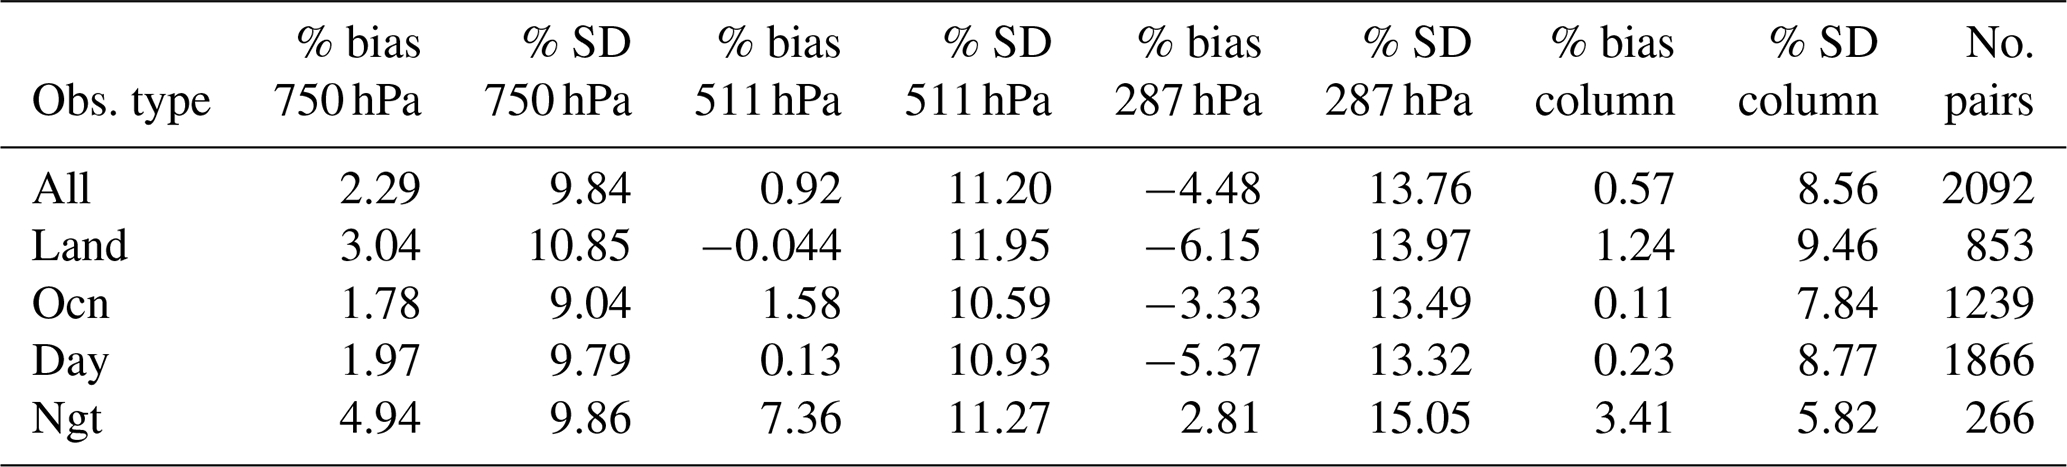
Figure 5 shows how the observed partial column average VMRs and CrIS retrieval bias with respect to NOAA GML profiles vary with latitude, and Fig. 6 shows how these vary with time. No significant bias dependence on latitude is observed for the NOAA GML flight sites. Although a bias drift of % d−1 is detected, we recognize that our comparison time range is not sufficient for a reliable estimate of bias drift, and more years of comparisons would be required.
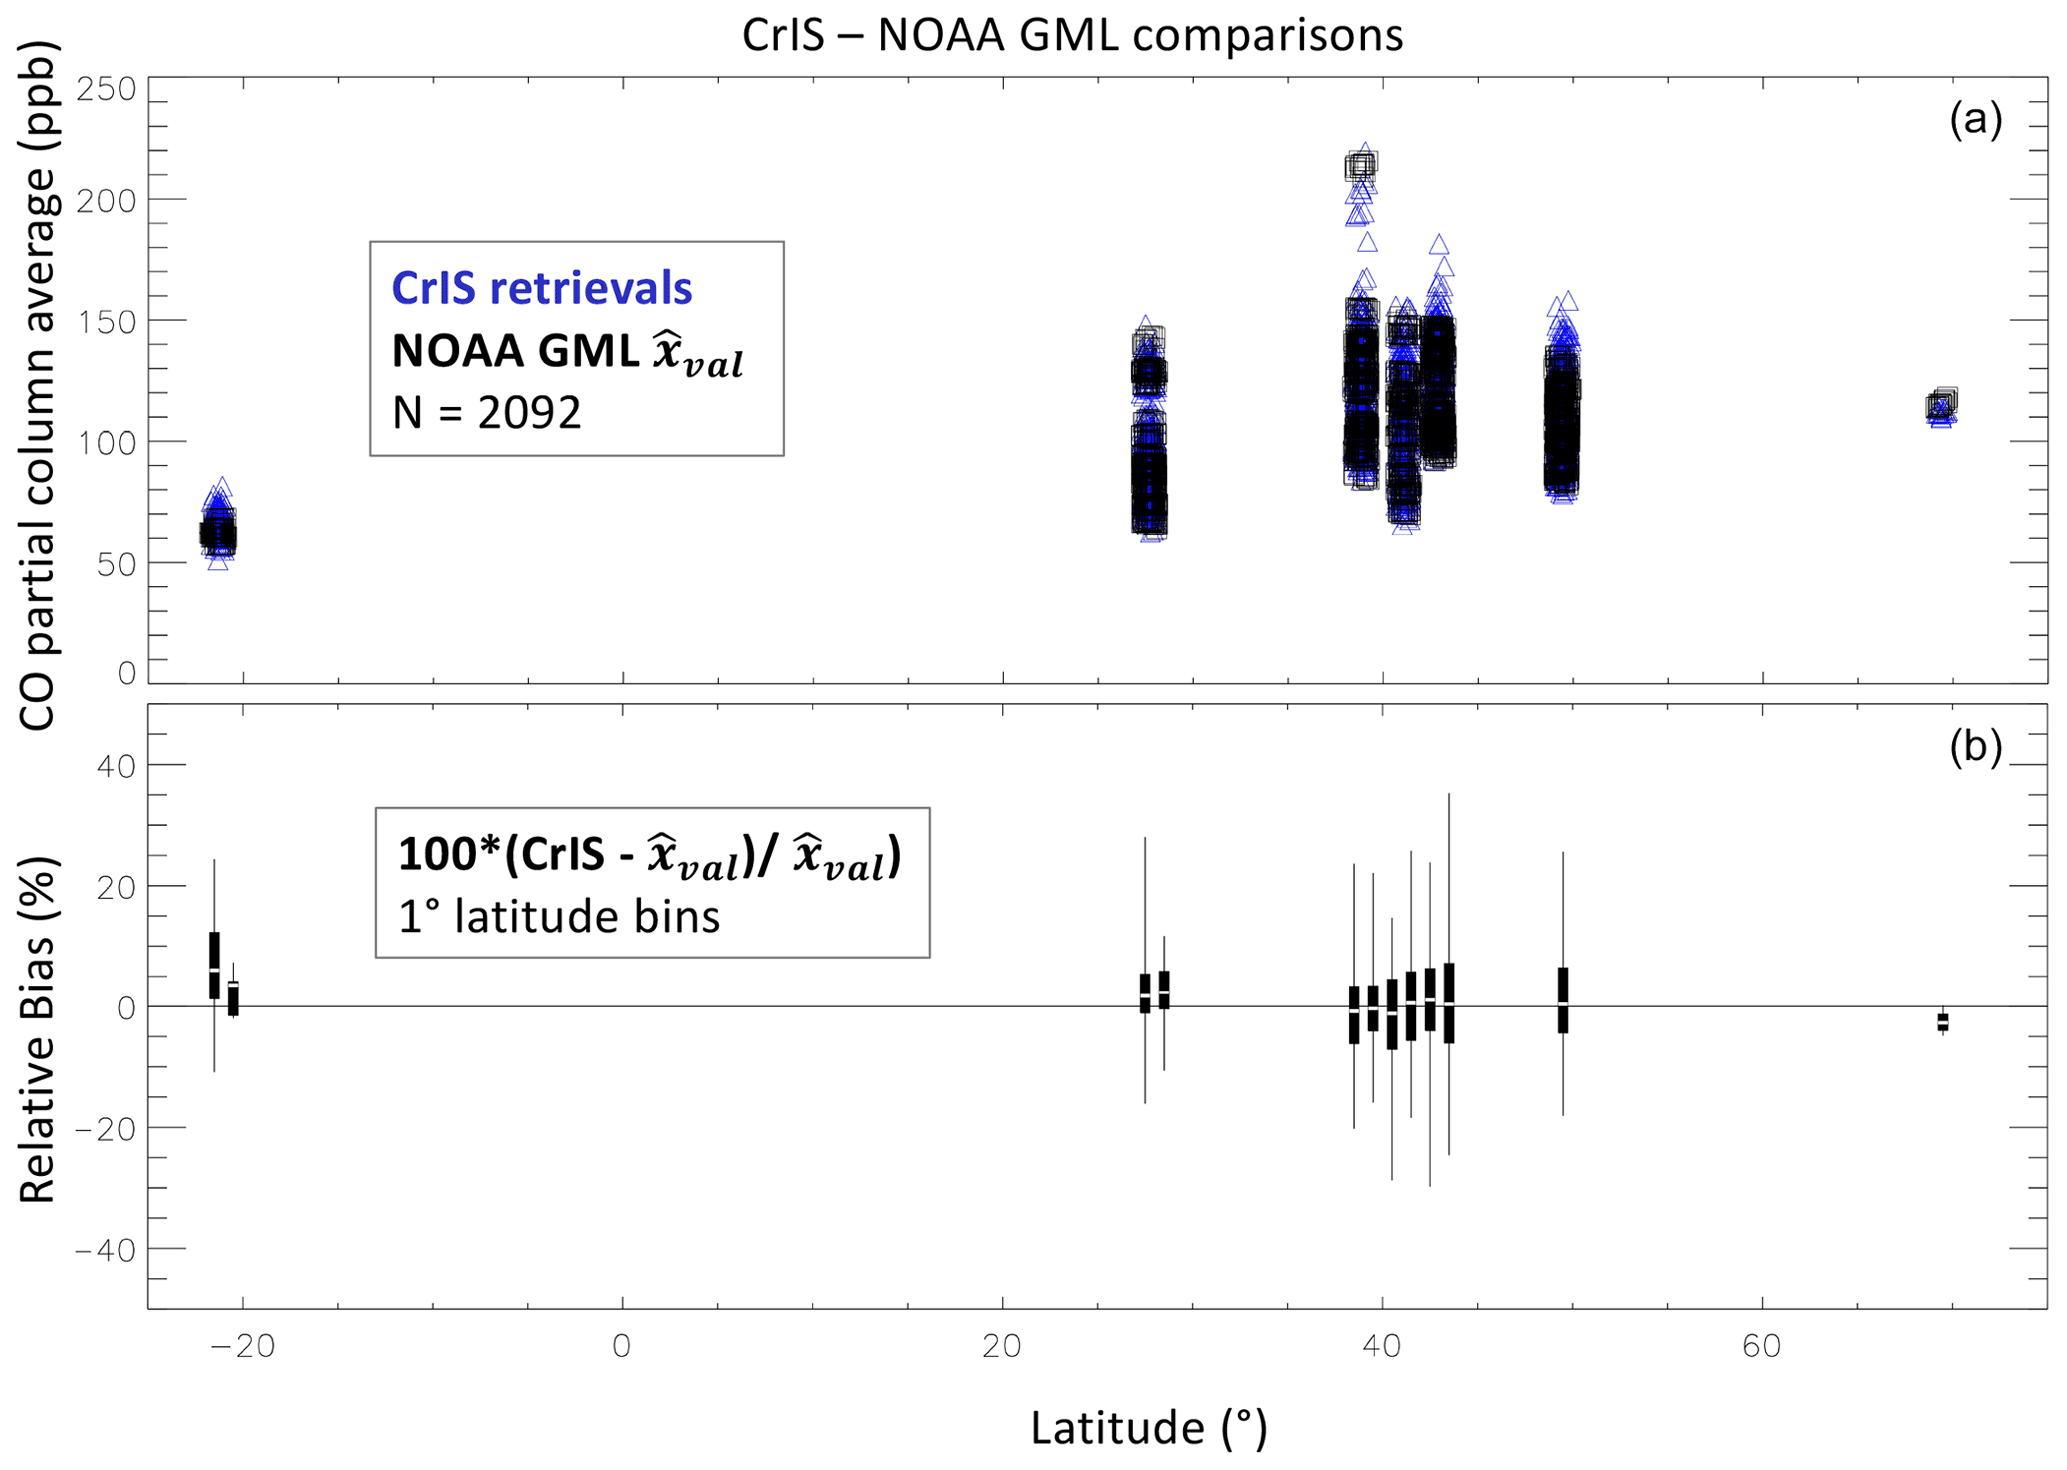
Figure 5Latitude dependence of CO partial column average VMR (ppb) for TROPESS/CrIS retrievals and NOAA GML (a) as well as bias difference statistics (b) shown by box–whisker symbols representing minimum and maximum values (whisker), lower quartile (box bottom), median (white stripe), and upper quartile (box top). A minimum of five comparisons per bin was required.
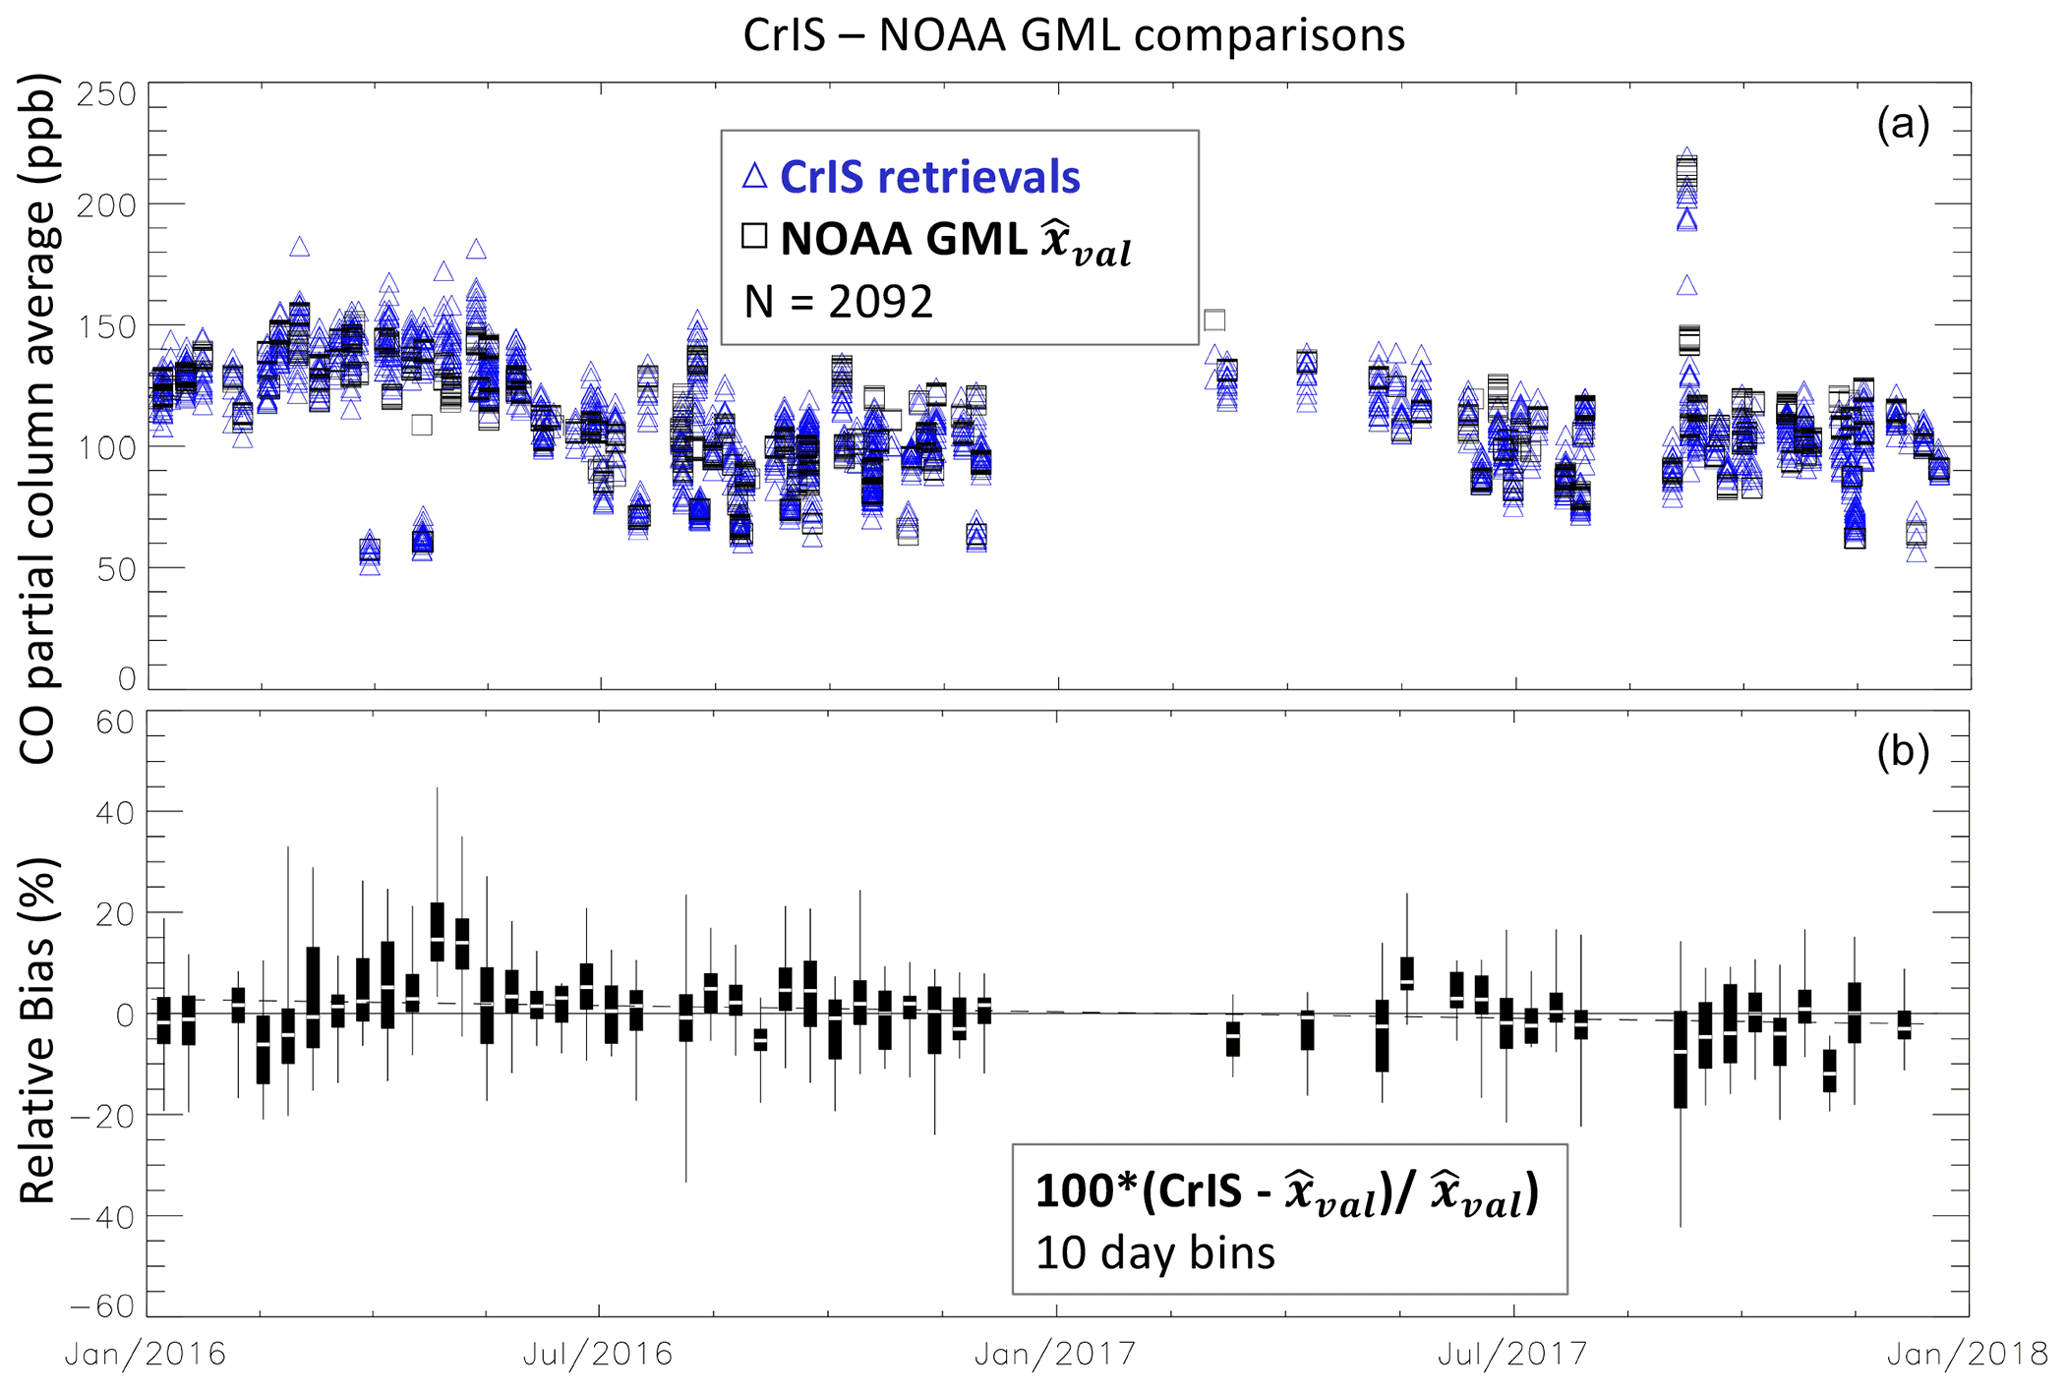
Figure 6Time dependence of CO partial column average VMR (ppb) for TROPESS/CrIS retrievals and NOAA GML (a) as well as bias difference statistics (b) shown by box–whisker symbols representing minimum and maximum values (whisker), lower quartile (box bottom), median (white stripe), and upper quartile (box top). A minimum of five comparisons per bin was required. The dashed line indicates a fit for bias drift (see text).
5.2 TROPESS/CrIS CO validation with ATom
Figure 7 shows the bias (% relative difference) of the CrIS CO retrieved profiles with respect to ATom in situ profiles for all latitudes and three latitude ranges: 30∘ S to 30∘ N, 90 to 30∘ S, and 30 to 90∘ N. The vertical behavior of the bias is similar to the above CrIS comparisons with NOAA GML flights, with a positive bias in the lower troposphere and a negative bias in the upper troposphere, and is also similar to the MUSES/AIRS CO profiles compared to ATom flights (Hegarty et al., 2022). However, for MOPITT V9T comparisons to ATom flights (Deeter et al., 2022), the vertical bias pattern is again mostly opposite, with a negative bias (∼4 %) in the lower to middle troposphere and a positive bias (∼2 %) in the upper troposphere. This TROPESS/CrIS CO bias also differs from Nalli et al. (2020), who examined the bias of NUCAPS profiles (including CO) with respect to ATom in situ profiles. That study, using the multiple-FOV NUCAPS retrievals, found a small positive bias (∼2 %) for SNPP/CrIS CO with respect to ATom CO at all tropospheric vertical levels after applying their averaging kernels.
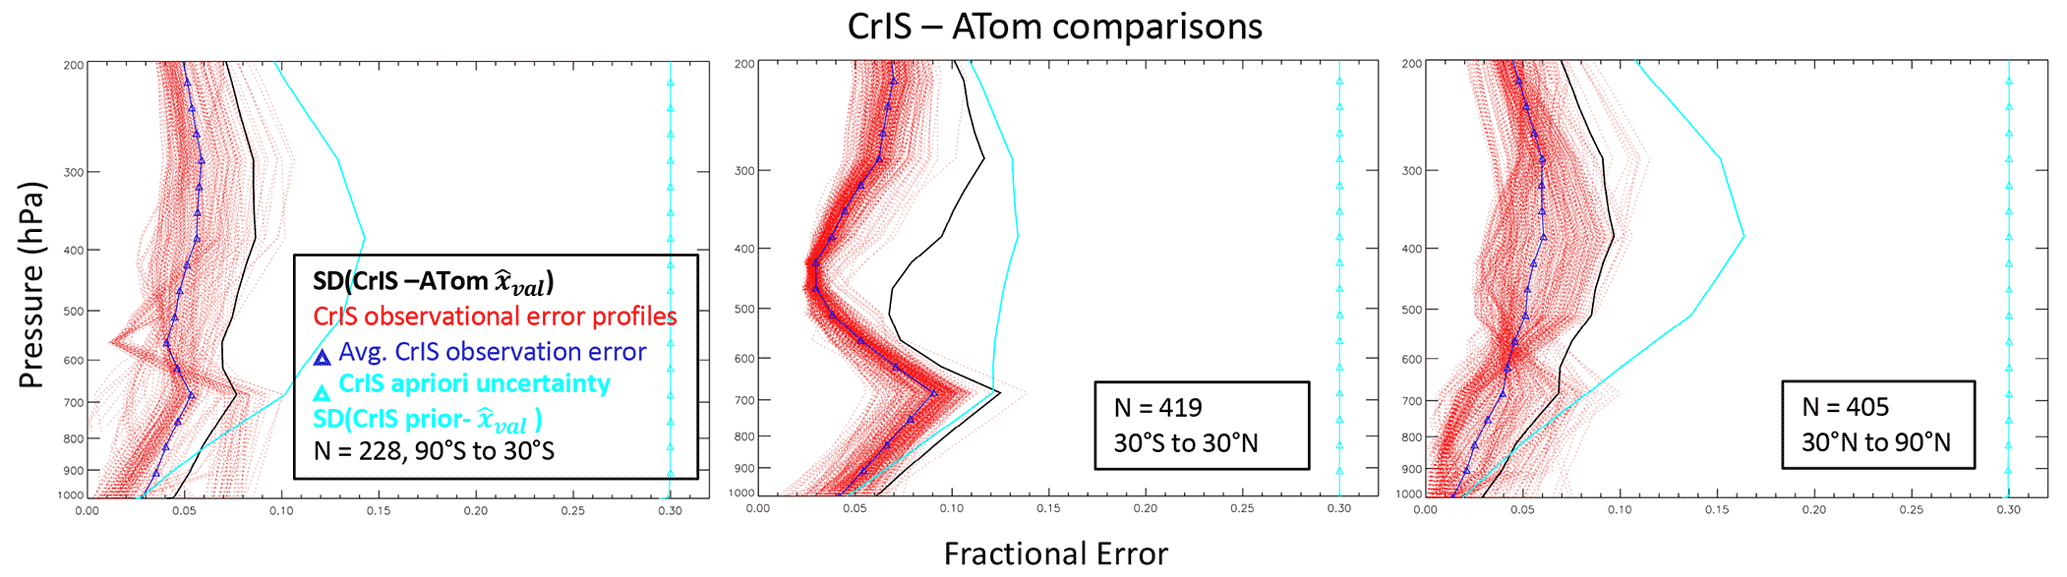
CrIS CO comparisons with ATom have less variance than comparisons with NOAA GML, especially for 90 to 30∘ S. Table 3 gives the mean bias and standard deviations for selected pressures and partial column average VMRs over different observing conditions (land, ocean, day, and night) and latitude ranges. As described above, the partial column average VMR is computed over the altitude ranges of each aircraft profile. Due to the nature of the ATom campaign, there are fewer observations over land.
Figure 7Relative differences (%) in single CrIS retrievals with coincident ATom profiles (grey) and the average percent difference with 1σ horizontal bars (red). Latitude ranges are indicated in each panel along with the number of comparison pairs. Both day and night CrIS observations are included.
Figure 8 shows how the observed partial column average VMRs and CrIS retrieval bias with respect to ATom profiles vary with latitude. It appears that tropical and Northern Hemisphere subtropical latitude ranges have a slightly higher positive bias than what is observed for higher latitudes, potentially indicating a TROPESS/CrIS retrieval issue with water vapor or some other interferent that is not fully characterized and requires further investigation. For example, Deeter et al. (2018) found that an empirical correction to MOPITT radiances resulting from a linear dependence on water vapor removed most of the latitude-dependent bias in MOPITT CO profiles. Another gas interferent in the TIR CO band is N2O, and we will also need to consider the latitude-dependent N2O anomalies observed by ATom (Gonzalez et al., 2021) when assessing the contributions to this latitude dependence in TROPESS/CrIS CO bias.
Table 3Bias and standard deviation (SD) for comparisons of SNPP TROPESS/CrIS CO retrievals and in situ CO profiles from ATom flight campaigns 1–4.
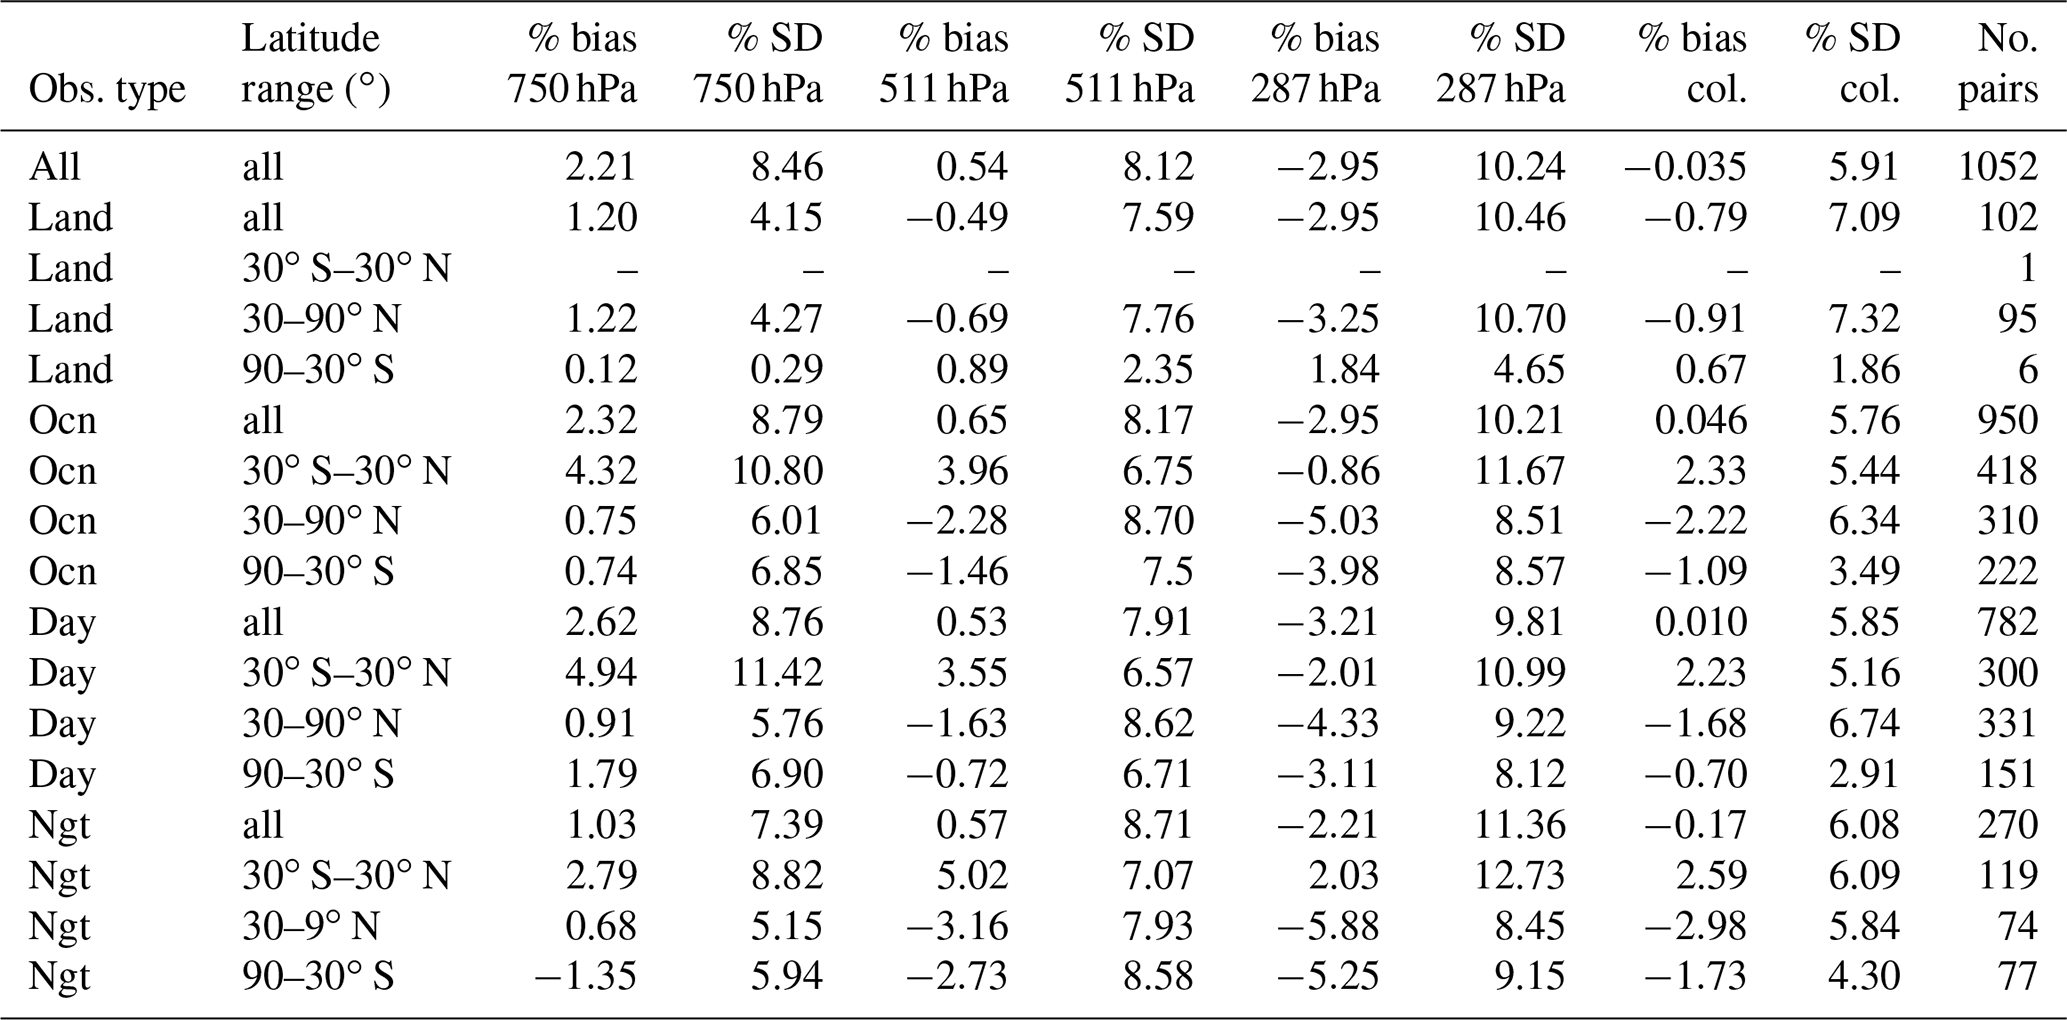

Figure 8Latitude dependence of CO partial column average VMR (ppb) for TROPESS/CrIS retrievals and ATom (a) and bias difference statistics (b) shown by box–whisker symbols representing minimum and maximum values (whisker), lower quartile (box bottom), median (white stripe), and upper quartile (box top). A minimum of five comparisons per bin was required.
In Fig. 9, we examine the seasonal behavior of CO sampled by ATom and CrIS in mostly remote ocean regions. In the high-latitude Southern Hemisphere (SH), we see the lowest values in summer and fall (Jan–Feb and Apr–May) as expected due to the chemical destruction of CO in a region with few local combustion sources. In the tropics, we find high values corresponding to African and South American biomass burning plumes over the Atlantic in all seasons except Northern Hemisphere (NH) spring. Lower values of CO in the tropics for NH summer and winter correspond to profiles over the Pacific Ocean (e.g., Strode et al., 2018; Bourgeois et al., 2020). The close alignment of the CrIS and ATom partial column average values in Fig. 9 indicates that CrIS is able to capture the seasonal, latitudinal, and hemispherical variations observed by ATom.
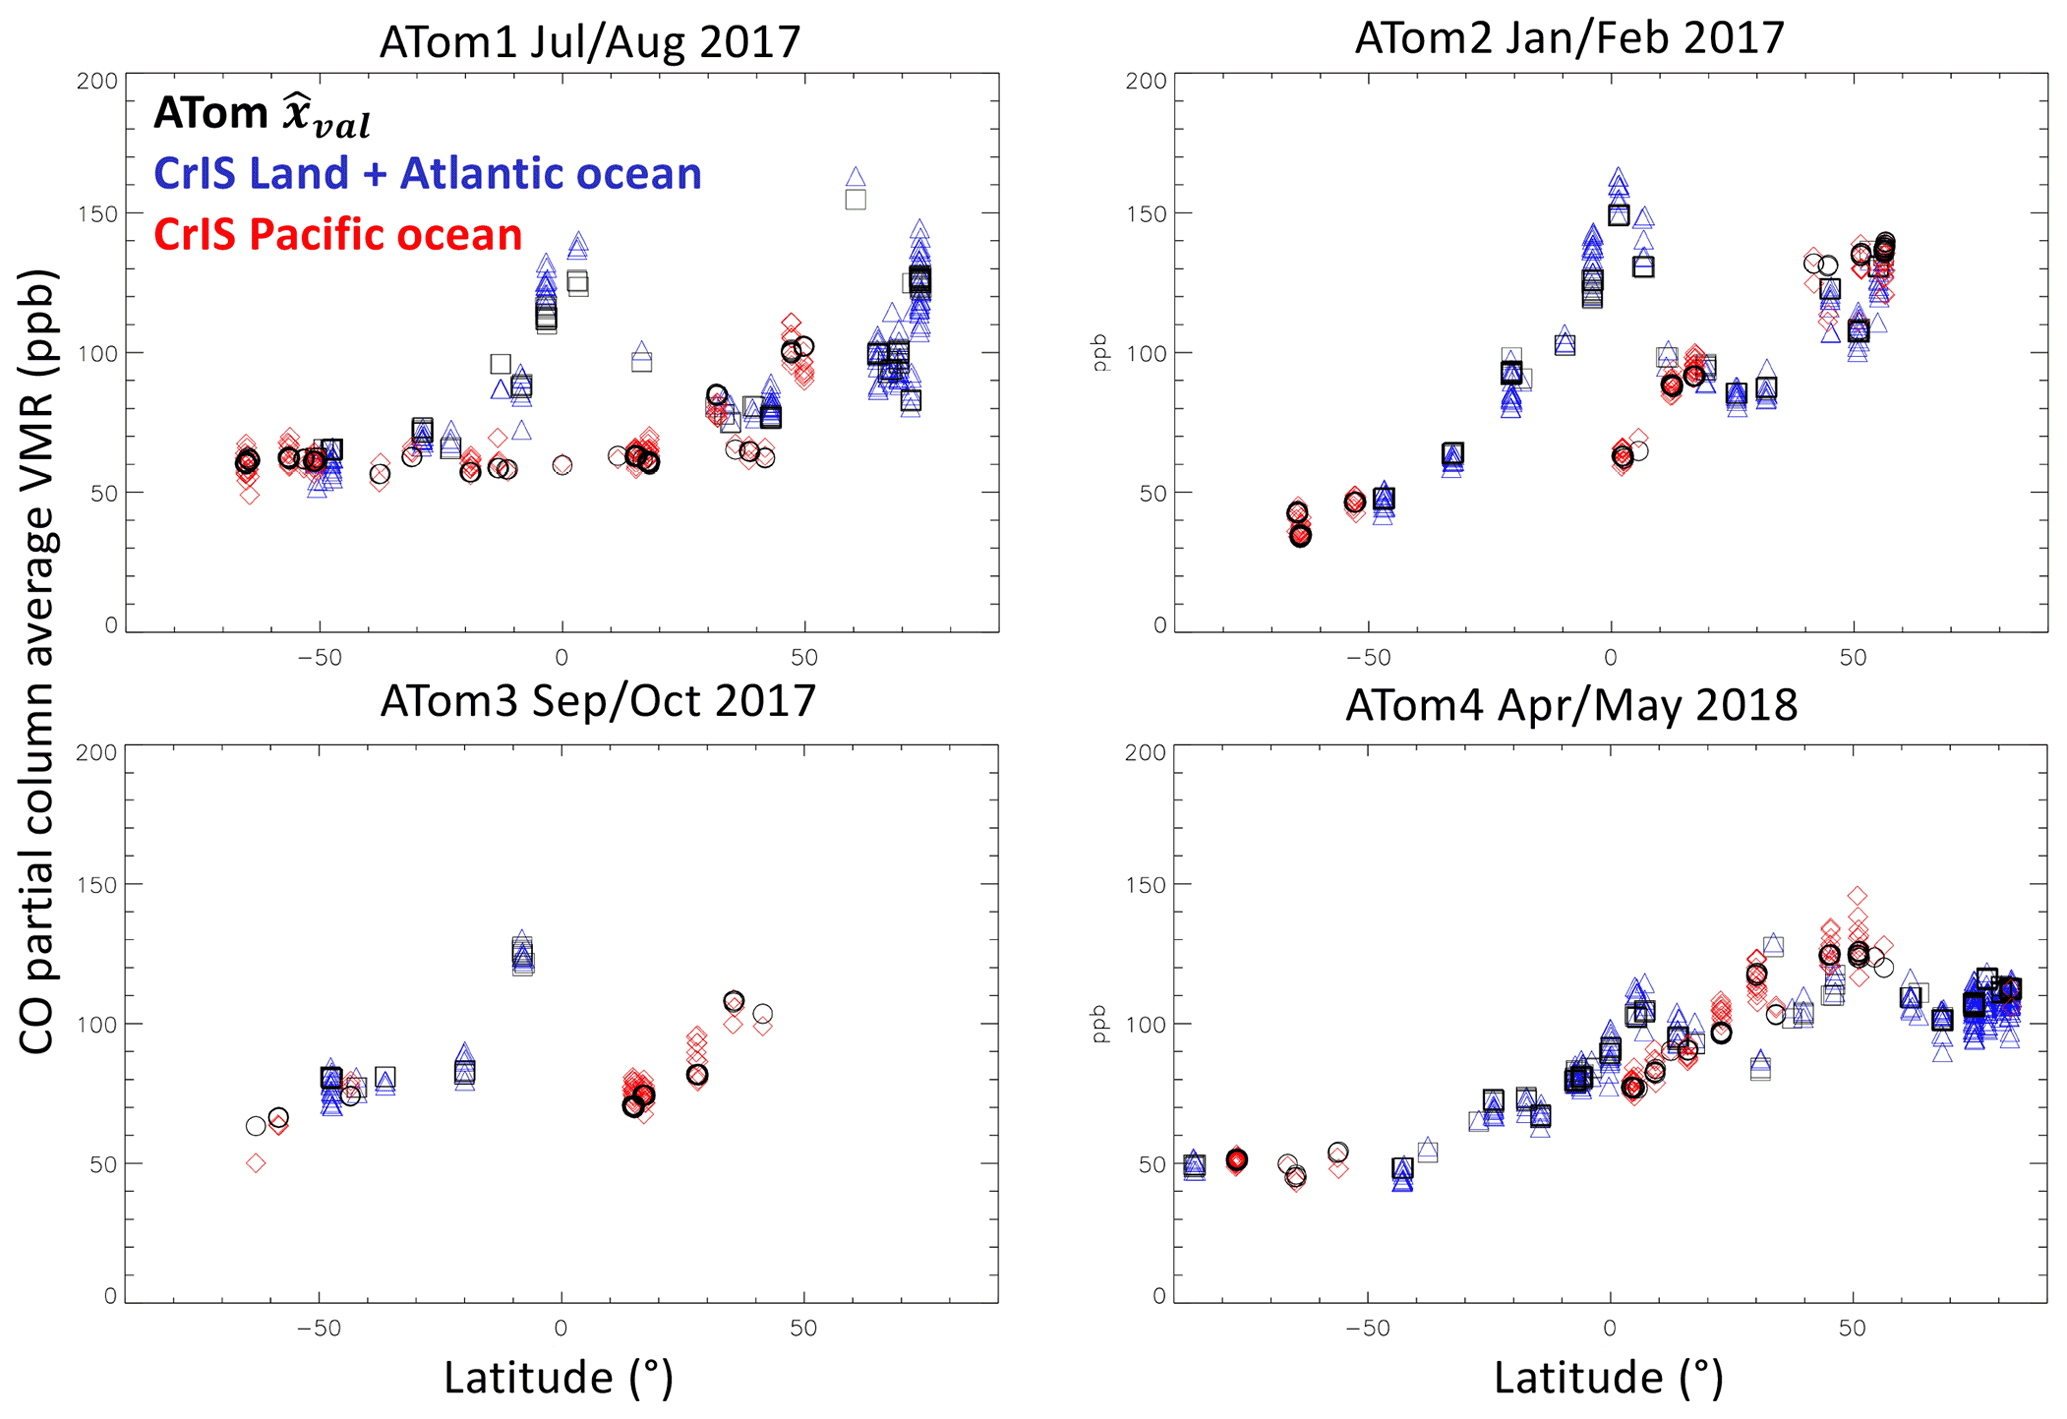
Figure 9Latitude dependence of partial column average CO for each ATom campaign. Black squares show ATom partial column average values over Atlantic Ocean scenes; black circles indicate ATom values over Pacific Ocean scenes. Blue triangles indicate CrIS CO partial column average values over land and Atlantic Ocean scenes; red diamonds indicate CrIS values over Pacific Ocean scenes.
5.3 Dependence on CO amount
For both the NOAA GML and ATom flights we find a small negative dependence of TROPESS/CrIS retrieval bias with respect to CO amount, with magnitude less than 0.1 % ppb−1. Figure 10 shows how the partial column average VMR bias varies with CO VMR for the two validation data sources, and we can also see how ATom flights sampled air with lower CO concentrations. Figure 10 indicates that TROPESS/CrIS CO average column VMRs have very little dependence on CO amount, and we find similar results for CrIS-retrieved CO at vertical levels 511 and 750 hPa (shown in the Supplement).
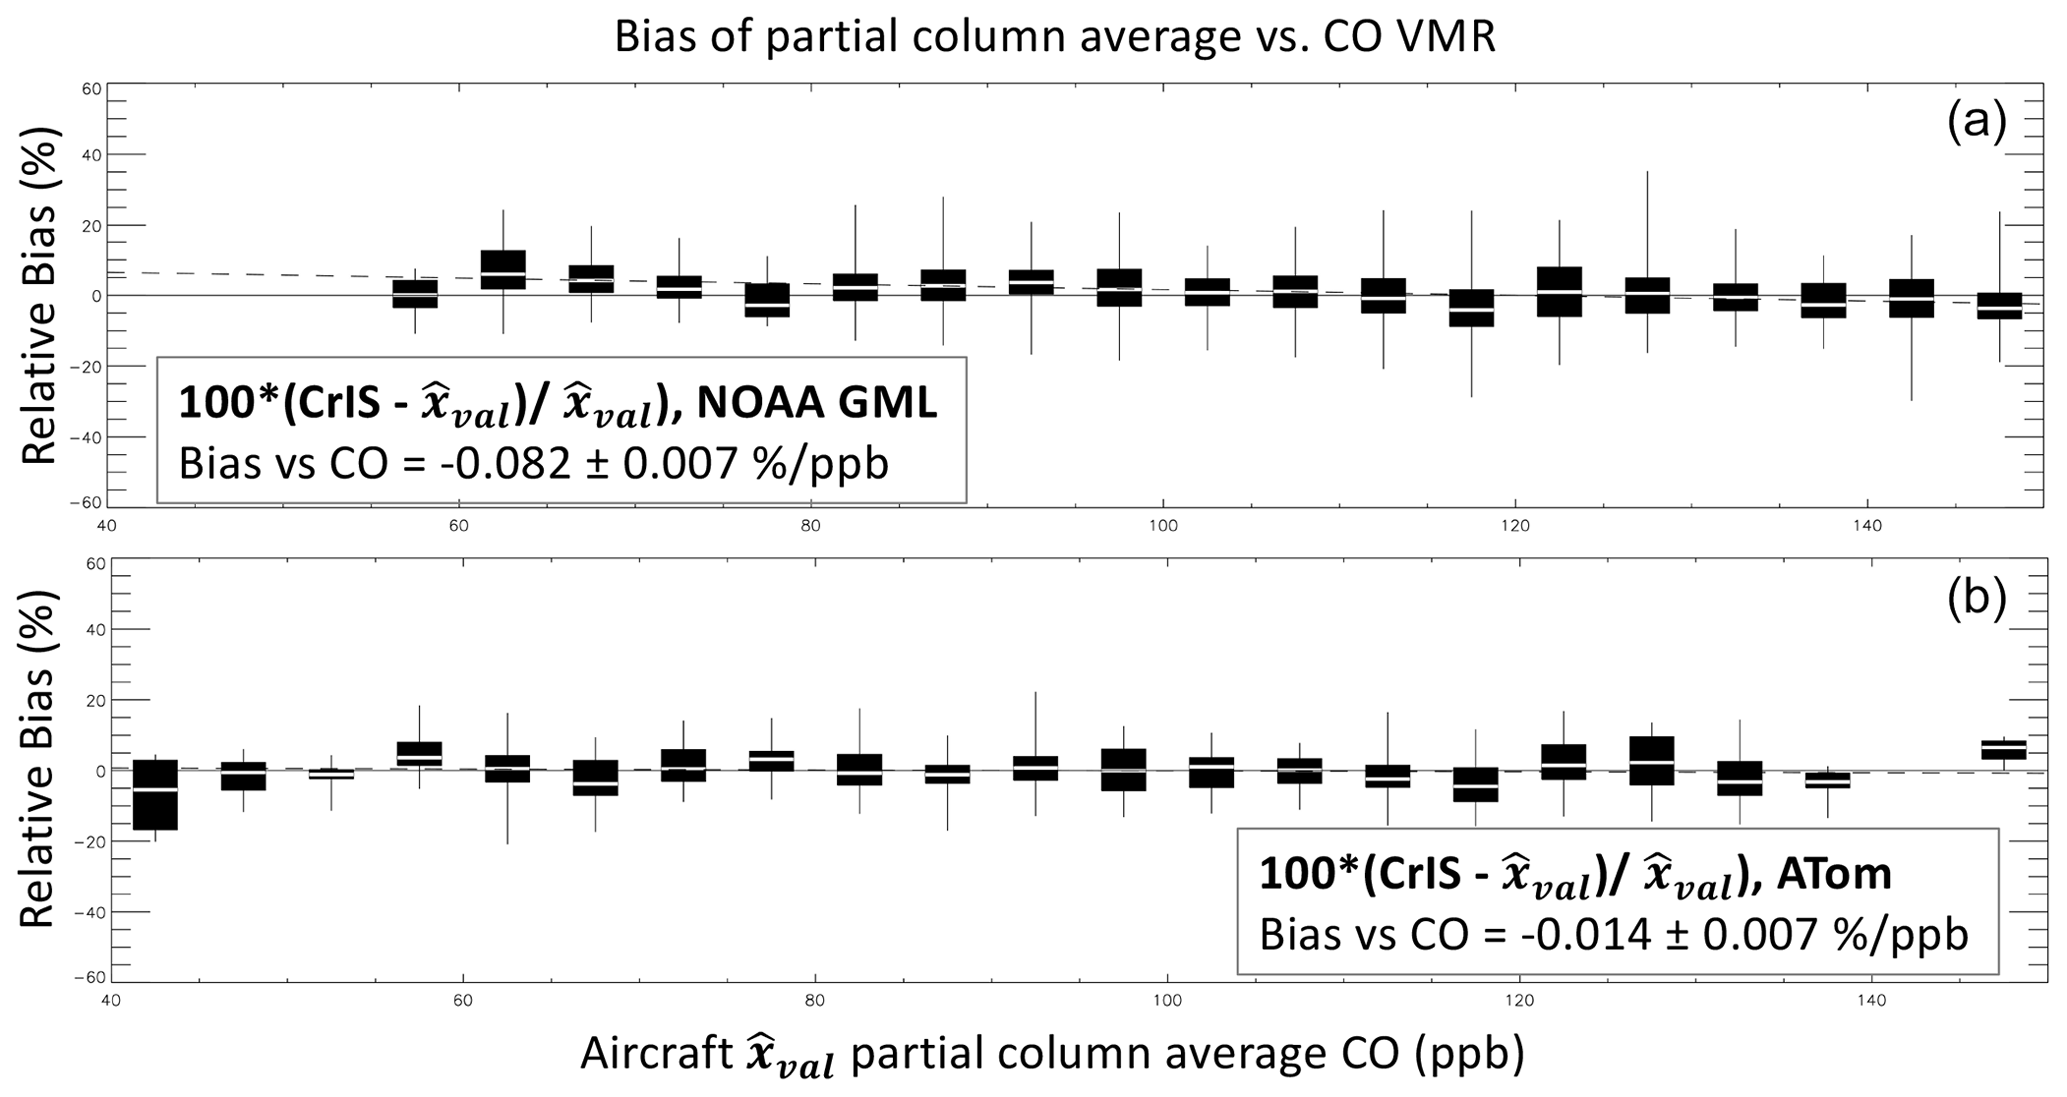
Figure 10Bias of CrIS partial column average CO vs. CO amount for NOAA GML flights in the top panel and ATom flights in the bottom panel with box–whisker symbols in 5 ppb bins. Linear regression results are shown in the legend boxes.
5.4 Evaluation of TROPESS/CrIS CO retrieval observational errors
Here we compare the observed variance of differences between retrieved CrIS CO profiles and in situ aircraft profiles, after applying Eq. (1), with the TROPESS reported observational errors defined in Eqs. (3) and (4). As described in Sect. 4.3, we expect the differences between retrieved CrIS and aircraft CO profiles to have a variance due to the combination of observational errors and geophysical variation from imperfect coincidence. Figure 11 shows comparisons of individual and average computed observational fractional errors to the standard deviation (SD) of CrIS– profile differences as well as the diagonal for the a priori covariance and the SD of prior– profile differences. As expected, the average observational errors are less than SD(CrIS–, but in some vertical ranges, they are much less and could be underestimated via instrument and systematic error assumptions in the TROPESS retrieval as Hegarty et al. (2022) suggest. Additional studies to test the sensitivity of the comparison variance to a range of coincidence criteria are needed to confirm a retrieval underestimate, but these would require several repeated validation measurements for the same observing conditions.
Despite the potential for underestimated observational errors, the general behavior of the error comparison is what we expect from Eq. (1), and we can see the retrieval influence on the shape of SD(CrIS–. Near the surface, where there is less retrieval sensitivity as indicated by the averaging kernel, we see that SD(prior– becomes smaller than SD(CrIS–. This is expected for vertical ranges with less retrieval sensitivity since the priori contribution becomes more dominant in . In contrast, for the middle troposphere where we have the most sensitivity for TIR remote sensing, it is clear that SD (CrIS – represents an improvement over SD (prior–. In Fig. 12, the error comparison is shown separately for three ATom latitude ranges, and we can see that the agreement between observational errors and SD (CrIS– is closest for ATom flights in the mostly clean middle- to high-latitude Southern Hemisphere, where it is most likely that the aircraft and satellite are observing similar air masses with background CO concentrations. These results give confidence that TROPESS single-retrieval error characterization can be used to weight data for averaging and inverse analysis applications.
Figure 11Error comparison of CrIS observational error estimates and the standard deviation (SD) of CrIS (in black) for NOAA GML flights (a) and ATom flights (b). Single-profile CrIS observational error estimates are plotted in red, with the average in dark blue with triangles. For reference, and the standard deviation of CrIS prior with aircraft is in cyan, and the a priori fractional uncertainty (0.3) is shown in cyan with triangles.
This study used in situ observations from routine NOAA GML flights and the four ATom campaigns to evaluate TROPESS single-pixel CO retrievals from the SNPP/CrIS FTS instrument. We find the following.
-
The single-FOV CrIS product provides improved representation of CO in smoke plumes compared to retrievals that combine multiple FOVs.
-
Comparisons with aircraft in situ profiles (after extension, interpolation, and application of Eq. 1) show that biases have a vertical dependence in the troposphere that is consistent for both sets of in situ data with average biases that are positive (∼2.3 %) in the lower troposphere and negative ( %) in the upper troposphere.
-
Small biases (0.6 % and −0.04 % for NOAA GML and ATom, respectively) are observed for the CrIS CO partial column average VMR corresponding to the aircraft profile vertical ranges.
-
No significant latitude dependence of CrIS CO column bias is found for the NOAA GML comparisons, but comparisons with ATom, which better covered a range of latitudes, have a slightly more positive bias for tropical scenes that could indicate a small, uncharacterized retrieval dependence on water vapor or another interferent species.
-
CrIS CO retrievals capture the seasonal and spatial variations observed by ATom.
-
There is a small negative dependence (magnitude <0.1 % ppb−1) of CrIS bias on CO amount.
-
Comparisons of computed observational errors and standard deviations of retrieval–aircraft comparison differences show expected vertical behavior and demonstrate significant improvement over the standard deviation of prior–aircraft differences in vertical ranges with higher retrieval sensitivity.
TROPESS/CrIS CO biases detected in this study are in general much smaller than comparison standard deviations. We therefore make no recommendations for automated bias corrections in data processing, similar to other validation studies for satellite CO retrievals (e.g., Deeter et al., 2019, 2022). This is unlike other TROPESS products such as CH4 (Kulawik et al., 2021) for which a bias correction is more appropriate given the size of bias detected as well as the atmospheric lifetime (∼10 years for methane) and reduced atmospheric variability compared to CO. Each analysis using TROPESS/CrIS CO data must consider the variability of CO over the domain of interest and ascertain whether the biases observed here could affect numerical conclusions. The biases reported from this study will need to be included when long-term records of satellite CO observations are harmonized and used together for computing trends, data assimilation, or other analyses. For example, with the 22-year record of MOPITT CO profiles, this is especially important when combining datasets since the vertical bias pattern for MOPITT data with respect to in situ observations has a positive bias in the upper troposphere and negative bias in the lower to middle troposphere with the opposite behavior compared to the TROPESS/CrIS vertical bias pattern.
Future validation of the TROPESS/CrIS CO products will include a longer time record of comparisons and quantification of bias drift for CrIS on SNPP and on the JPSS satellite series. The validation results presented here demonstrate that these products are suitable for tropospheric CO data analyses. The bias at all vertical levels is <10 %, and error characterization for single retrievals can be used to weight data for averaging and applications such as data assimilation and inverse modeling.
The NOAA GML data were obtained from https://doi.org/10.7289/V5N58JMF (Sweeney et al., 2021). The ATom aircraft data were obtained from https://doi.org/10.3334/ORNLDAAC/1581 (Wofsy et al., 2018). TROPESS/CrIS CO products are available via the GES DISC from the NASA TRopospheric Ozone and its Precursors from Earth System Sounding (TROPESS) project at https://doi.org/10.5067/I1NONOEPXLHS (Bowman, 2021).
The supplement related to this article is available online at: https://doi.org/10.5194/amt-15-5383-2022-supplement.
HMW, GLF, SSK, JDH, KCP, ML, and VHP designed the study, and HMW prepared the paper. GLF analyzed the satellite–aircraft comparisons and prepared the figures. SSK, KB, DF, VK, ML, KCP, VHP, and JRW developed the MUSES algorithm and provided the CrIS CO retrievals. RC and KM participated in the ATom campaign and provided guidance in the use of the measurements. KM provided the NOAA GML aircraft data. All authors reviewed and edited the paper.
At least one of the (co-)authors is a member of the editorial board of Atmospheric Measurement Techniques. The peer-review process was guided by an independent editor, and the authors also have no other competing interests to declare.
Publisher's note: Copernicus Publications remains neutral with regard to jurisdictional claims in published maps and institutional affiliations.
This research was conducted at the National Center for Atmospheric Research (NCAR), which is sponsored by the National Science Foundation. Part of this research was carried out at the Jet Propulsion Laboratory (JPL), California Institute of Technology, under a contract with the National Aeronautics and Space Administration. The NOAA GML aircraft observations are supported by NOAA and CIRES. The ATom aircraft data were supported by the NASA Airborne Science Program and Earth Science Project Office. We acknowledge the use of imagery from the NASA Worldview application (https://worldview.earthdata.nasa.gov/, last access: 17 September 2022), part of the NASA Earth Observing System Data and Information System (EOSDIS). We thank Benjamin Gaubert for his NCAR internal review of the paper.
The Jet Propulsion Laboratory (JPL), California Institute of Technology, is under a contract with the National Aeronautics and Space Administration (grant no. 80NM0018D0004). This research has also been supported by NASA via the TRopospheric Ozone and its Precursors from Earth System Sounding (TROPESS) project at JPL and a NASA ROSES award (grant no. 80NSSC18K0687). The NOAA Cooperative Agreement with CIRES (grant no. NA17OAR4320101). The NCAR facility is sponsored by the National Science Foundation (grant no. 1852977).
This paper was edited by Gabriele Stiller and reviewed by two anonymous referees.
Barnet, C.: Sounder SIPS: Suomi NPP CrIMSS Level 2 CLIMCAPS Full Spectral Resolution: Atmosphere cloud and surface geophysical state V2, Greenbelt, MD, USA, Goddard Earth Sciences Data and Information Services Center (GES DISC), https://doi.org/10.5067/62SPJFQW5Q9B, 2019.
Beer, R.: TES on the Aura mission: Scientific objectives, measurements, and analysis overview, IEEE Trans. Geosci. Remote Sens., 44, 1102–1105, https://doi.org/10.1109/TGRS.2005.863716, 2006.
Borsdorff, T., Aan de Brugh, J., Hu, H., Aben, I., Hasekamp, O., and Landgraf, J.: Measuring Carbon Monoxide With TROPOMI: First Results and a Comparison With ECMWF-IFS Analysis Data, Geophys. Res. Lett., 45, 28262832, https://doi.org/10.1002/2018GL077045, 2018.
Bourgeois, I., Peischl, J., Thompson, C. R., Aikin, K. C., Campos, T., Clark, H., Commane, R., Daube, B., Diskin, G. W., Elkins, J. W., Gao, R.-S., Gaudel, A., Hintsa, E. J., Johnson, B. J., Kivi, R., McKain, K., Moore, F. L., Parrish, D. D., Querel, R., Ray, E., Sánchez, R., Sweeney, C., Tarasick, D. W., Thompson, A. M., Thouret, V., Witte, J. C., Wofsy, S. C., and Ryerson, T. B.: Global-scale distribution of ozone in the remote troposphere from the ATom and HIPPO airborne field missions, Atmos. Chem. Phys., 20, 10611–10635, https://doi.org/10.5194/acp-20-10611-2020, 2020.
Bowman, K. W.: TROPESS CrIS-SNPP L2 Carbon Monoxide for West Coast Fires HiRes, Standard Product V1, Greenbelt, MD, USA, Goddard Earth Sciences Data and Information Services Center (GES DISC), NASA [data set], https://doi.org/10.5067/Y3MAIEUNDTBX, 2021.
Bowman, K. W., Rodgers, C. D., Kulawik, S. S., Worden, J., Sarkissian, E., Osterman, G., Steck, T., Lou, M., Eldering, A., and Shephard, M.: Tropospheric emission spectrometer: retrieval method and error analysis, IEEE Trans. Geosci. Remote Sens., 44, 1297–1307, https://doi.org/10.1109/TGRS.2006.871234, 2006.
Bowman, K. W., Worden, J. R., Herman, R., Cady-Pereira, K., Natraj, V., Payne, V. H., Worden, H. M., and Kulawik, S. S.: TROPESS Level 2 Algorithm Theoretical Basis Document (ATBD) V1, 2021 at: https://docserver.gesdisc.eosdis.nasa.gov/public/project/TROPESS/TROPESS_ATBDv1.1.pdf, last access: 12 April 2022.
Brasseur, G. P., Hauglustaine, D. A., Walters, S., Rasch, P. J., Muller, J. F., Granier, C., and Tie, X. X.: MOZART, a global chemical transport model for ozone and related chemical trac- ers 1. Model description, J. Geophys. Res., 103, 28265–28289, 1998.
Buchholz, R. R., Worden, H. M., Park, M., Francis, G. Deeter, M. N., Edwards, D. P., Emmons, L. K., Gaubert, B., Gille, J., Martinez-Alonso, S., Tang, W., Kumar, R., Drummond, J. R., Clerbaux, C., George, M., Coheur, P.-F., Hurtmans, D., Bowman, K. W., Luo, M., Payne, V. H., Worden, J. R., Chin, M., Levy, R. C., Warner, J., Wei, Z., and Kulawik, S. S.: Air pollution trends measured from Terra: CO and AOD over industrial, fire-prone and background regions, Remote Sens. Environ., 256, 112275, https://doi.org/10.1016/j.rse.2020.112275, 2021.
Byrne, B., Liu, J., Lee, M., Yin, Y., Bowman, K. W., Miyazaki, K., Norton, A. J., Joiner, J., Pollard, D. F., Griffith, D. W. T., Velazco, V. A., Deutscher, N. M., Jones, N. B., and Paton-Walsh, C.: The Carbon Cycle of Southeast Australia During 2019–2020: Drought, Fires, and Subsequent Recovery, AGU Advances, 2, e2021AV000469, https://doi.org/10.1029/2021av000469, 2021.
Clerbaux, C., Boynard, A., Clarisse, L., George, M., Hadji-Lazaro, J., Herbin, H., Hurtmans, D., Pommier, M., Razavi, A., Turquety, S., Wespes, C., and Coheur, P.-F.: Monitoring of atmospheric composition using the thermal infrared IASI/MetOp sounder, Atmos. Chem. Phys., 9, 6041–6054, https://doi.org/10.5194/acp-9-6041-2009, 2009.
Deeter, M. N., Edwards, D. P., Gille, J. C., Emmons, L. K., Francis, G., Ho, S.-P., Mao, D., Masters, D., Worden, H., Drummond, J. R., and Novelli, P. C.: The MOPITT version 4 CO product: Algorithm enhancements, validation, and long-term stability, J. Geophys. Res.-Atmos., 115, D07306, https://doi.org/10.1029/2009JD013005, 2010.
Deeter, M. N., Edwards, D. P., Francis, G. L., Gille, J. C., Mao, D., Martínez-Alonso, S., Worden, H. M., Ziskin, D., and Andreae, M. O.: Radiance-based retrieval bias mitigation for the MOPITT instrument: the version 8 product, Atmos. Meas. Tech., 12, 4561–4580, https://doi.org/10.5194/amt-12-4561-2019, 2019.
Deeter, M., Francis, G., Gille, J., Mao, D., Martínez-Alonso, S., Worden, H., Ziskin, D., Drummond, J., Commane, R., Diskin, G., and McKain, K.: The MOPITT Version 9 CO product: sampling enhancements and validation, Atmos. Meas. Tech., 15, 2325–2344, https://doi.org/10.5194/amt-15-2325-2022, 2022.
de Laat, A. T. J., Gloudemans, A. M. S., Schrijver, H., van den Broek, M. M. P., Meirink, J. F., Aben, I., and Krol, M.: Quantitative analysis of SCIAMACHY carbon monoxide total column measurements, Geophys. Res. Lett., 33, L07807, https://doi.org/10.1029/2005GL025530, 2006.
Drummond, J. R., Zou, J., Nichitiu, F., Kar, J., Deschambaut, R., and Hackett, J.: A review of 9-year performance and operation of the MOPITT instrument, J. Adv. Space Res., 45, 760–774, https://doi.org/10.1029/2004JD004727, 2010.
Edwards, D. P., Emmons, L. K., Hauglustaine, D. A., Chu, A., Gille, J. C., Kaufman, Y. J., Pétron, G., Yurganov, L. N., Giglio, L., Deeter, M. N., Yudin, V., Ziskin, D. C.,Warner, J., Lamarque, J.-F., Francis, G. L., Ho, S. P., Mao, D., Chan, J., and Drummond, J. R.: Observations of Carbon Monoxide and Aerosol From the Terra Satellite: Northern Hemisphere Variability, J. Geophys. Res., 109, D24202, https://doi.org/10.1029/2005JD006733, 2004.
Edwards, D. P., Emmons, L. K., Gille, J. C., Chu, A., Attié, J.-L., Giglio, L., Wood, S. W., Haywood, J., Deeter, M. N., Massie, S. T., Ziskin, D. C., and Drummond, J. R.: Satellite observed pollution from Southern Hemisphere biomass burning, J. Geophys. Res., 111, 14312, https://doi.org/10.1029/2005JD006655, 2006.
Eldering, A., Kulawik, S. S., Worden, J., Bowman, K., and Osterman, G.: Implementation of cloud retrievals for TES atmospheric retrievals: 2. Characterization of cloud top pressure and effective optical depth retrievals, J. Geophys. Res., 113, D16S37, https://doi.org/10.1029/2007JD008858, 2008.
Fu, D., Bowman, K. W., Worden, H. M., Natraj, V., Worden, J. R., Yu, S., Veefkind, P., Aben, I., Landgraf, J., Strow, L., and Han, Y.: High-resolution tropospheric carbon monoxide profiles retrieved from CrIS and TROPOMI, Atmos. Meas. Tech., 9, 2567–2579, https://doi.org/10.5194/amt-9-2567-2016, 2016.
Fu, D., Kulawik, S. S., Miyazaki, K., Bowman, K. W., Worden, J. R., Eldering, A., Livesey, N. J., Teixeira, J., Irion, F. W., Herman, R. L., Osterman, G. B., Liu, X., Levelt, P. F., Thompson, A. M., and Luo, M.: Retrievals of tropospheric ozone profiles from the synergism of AIRS and OMI: methodology and validation, Atmos. Meas. Tech., 11, 5587–5605, https://doi.org/10.5194/amt-11-5587-2018, 2018.
Fu, D., Millet, D. B., Wells, K. C., Payne, V. H., Yu, S., Guenther, A., and Eldering, A.: Direct retrieval of isoprene from satellite based infrared measurements, Nat. Commun., 10, 3811, https://doi.org/10.1038/s41467-019-11835-0, 2019.
Gambacorta, A., Barnet, C., Wolf, W., King, T., Maddy, E., Strow, L., Xiong, X., Nalli, N., and Goldberg, M.: An Experiment Using High Spectral Resolution CrIS Measurements for Atmospheric Trace Gases: Carbon Monoxide Retrieval Impact Study, IEEE Geosci. Remote Sens. Lett., 11, 16391643, https://doi.org/10.1109/LGRS.2014.2303641, 2014.
Gambacorta, A., Nalli, N. R., Barnet, C. D., Tan, C., Iturbide-Sanchez, F., and Zhang, K.: The NOAA Unique Combined Atmospheric Processing System (NUCAPS): Algorithm Theoretical Basis Document (ATBD); ATBD v2.0; NOAA/NESDIS/STAR Joint Polar Satellite System: College Park, MD, USA, 2017.
Gaubert, B., Arellano, A. F., Barré, J., Worden, H. M., Emmons, L. K., Tilmes, S., Buchholz, R. R., Vitt, F., Raeder, K., Collins, N., Anderson, J. L., Wiedinmyer, C., Martinez Alonso, S., Edwards, D. P., Andreae, M. O., Hannigan, J. W., Petri, C., Strong, K., and Jones, N.: Toward a chemical reanalysis in a coupled chemistry-climate model: An evaluation of MOPITT CO assimilation and its impact on tropospheric composition, J. Geophys. Res.-Atmos., 121, 2016JD024863, https://doi.org/10.1002/2016JD024863, 2016.
Gaubert, B., Worden, H. M., Arellano, A. F. J., Emmons, L. K., Tilmes, S., Barre, J., Alonso, S. M., Vitt, F., Anderson, J. L., Alkemade, F., Houweling, S., and Edwards, D. P.: Chemical Feedback From Decreasing Carbon Monoxide Emissions, Geophys. Res. Lett., 44, 99859995, https://doi.org/10.1002/2017GL074987, 2017.
Gaubert, B., Emmons, L. K., Raeder, K., Tilmes, S., Miyazaki, K., Arellano Jr., A. F., Elguindi, N., Granier, C., Tang, W., Barré, J., Worden, H. M., Buchholz, R. R., Edwards, D. P., Franke, P., Anderson, J. L., Saunois, M., Schroeder, J., Woo, J.-H., Simpson, I. J., Blake, D. R., Meinardi, S., Wennberg, P. O., Crounse, J., Teng, A., Kim, M., Dickerson, R. R., He, H., Ren, X., Pusede, S. E., and Diskin, G. S.: Correcting model biases of CO in East Asia: impact on oxidant distributions during KORUS-AQ, Atmos. Chem. Phys., 20, 14617–14647, https://doi.org/10.5194/acp-20-14617-2020, 2020.
George, M., Clerbaux, C., Bouarar, I., Coheur, P.-F., Deeter, M. N., Edwards, D. P., Francis, G., Gille, J. C., Hadji-Lazaro, J., Hurtmans, D., Inness, A., Mao, D., and Worden, H. M.: An examination of the long-term CO records from MOPITT and IASI: comparison of retrieval methodology, Atmos. Meas. Tech., 8, 4313–4328, https://doi.org/10.5194/amt-8-4313-2015, 2015.
Gonzalez, Y., Commane, R., Manninen, E., Daube, B. C., Schiferl, L. D., McManus, J. B., McKain, K., Hintsa, E. J., Elkins, J. W., Montzka, S. A., Sweeney, C., Moore, F., Jimenez, J. L., Campuzano Jost, P., Ryerson, T. B., Bourgeois, I., Peischl, J., Thompson, C. R., Ray, E., Wennberg, P. O., Crounse, J., Kim, M., Allen, H. M., Newman, P. A., Stephens, B. B., Apel, E. C., Hornbrook, R. S., Nault, B. A., Morgan, E., and Wofsy, S. C.: Impact of stratospheric air and surface emissions on tropospheric nitrous oxide during ATom, Atmos. Chem. Phys., 21, 11113–11132, https://doi.org/10.5194/acp-21-11113-2021, 2021.
Hegarty, J., Mao, H., and Talbot, R.: Synoptic influences on springtime tropospheric O3 and CO over the North American export region observed by TES, Atmos. Chem. Phys., 9, 3755–3776, https://doi.org/10.5194/acp-9-3755-2009, 2009.
Hegarty, J., Mao, H., and Talbot, R.: Winter- and summertime continental influences on tropospheric O3 and CO observed by TES over the western North Atlantic Ocean, Atmos. Chem. Phys., 10, 3723–3741, https://doi.org/10.5194/acp-10-3723-2010, 2010.
Hegarty, J. D., Cady-Pereira, K. E., Payne, V. H., Kulawik, S. S., Worden, J. R., Kantchev, V., Worden, H. M., McKain, K., Pittman, J. V., Commane, R., Daube Jr., B. C., and Kort, E. A.: Validation and error estimation of AIRS MUSES CO profiles with HIPPO, ATom, and NOAA GML aircraft observations, Atmos. Meas. Tech., 15, 205–223, https://doi.org/10.5194/amt-15-205-2022, 2022.
Holloway, T., Levy II, H., and Kasibhatla, P.: Global distribution of carbon monoxide, J. Geophys. Res. 105, 12123–12147. https://doi.org/10.1029/1999JD901173, 2000.
Inness, A., Ades, M., Agustí-Panareda, A., Barré, J., Benedictow, A., Blechschmidt, A.-M., Dominguez, J. J., Engelen, R., Eskes, H., Flemming, J., Huijnen, V., Jones, L., Kipling, Z., Massart, S., Parrington, M., Peuch, V.-H., Razinger, M., Remy, S., Schulz, M., and Suttie, M.: The CAMS reanalysis of atmospheric composition, Atmos. Chem. Phys., 19, 3515–3556, https://doi.org/10.5194/acp-19-3515-2019, 2019.
Jiang, Z., Worden, J. R., Worden, H., Deeter, M., Jones, D. B. A., Arellano, A. F., and Henze, D. K.: A 15-year record of CO emissions constrained by MOPITT CO observations, Atmos. Chem. Phys., 17, 4565–4583, https://doi.org/10.5194/acp-17-4565-2017, 2017.
Jones, D. B. A., Bowman, K. W., Palmer, P. I., Worden, J. R., Jacob, D. J., Hoffman, R. N., Bey, I., and Yantosca, R. M.: Potential of Observations from the Tropospheric Emission Spectrometer to Constrain Continental Sources of Carbon Monoxide, J. Geophys. Res.-Atmos., 108, 4789 https://doi.org/10.1029/2003JD003702, 2003.
Juncosa Calahorrano, J. F., Payne, V. H., Kulawik, S., Ford, B., Flocke, F., Campos, T., and Fischer, E. V.: Evolution of acyl peroxynitrates (PANs) in wildfire smoke plumes detected by the Cross-Track Infrared Sounder (CrIS) over the western U.S. during summer 2018, Geophys. Res. Lett., 48, e2021GL093405, https://doi.org/10.1029/2021GL093405, 2021.
Karion, A., Sweeney, C., Tans, P., and Newberger, T.: AirCore: An Innovative Atmospheric Sampling System, J. Atmos. Ocean. Technol., 27, 1839–1853, https://doi.org/10.1175/2010JTECHA1448.1, 2010.
Kopacz, M., Jacob, D. J., Fisher, J. A., Logan, J. A., Zhang, L., Megretskaia, I. A., Yantosca, R. M., Singh, K., Henze, D. K., Burrows, J. P., Buchwitz, M., Khlystova, I., McMillan, W. W., Gille, J. C., Edwards, D. P., Eldering, A., Thouret, V., and Nedelec, P.: Global estimates of CO sources with high resolution by adjoint inversion of multiple satellite datasets (MOPITT, AIRS, SCIAMACHY, TES), Atmos. Chem. Phys., 10, 855–876, https://doi.org/10.5194/acp-10-855-2010, 2010.
Kulawik, S. S., Worden, J., Eldering, A., Bowman, K., Gunson, M., Osterman, G. B., Zhang, L., Clough, S. A., Shephard, M. W., and Beer, R.: Implementation of cloud 18 retrievals for Tropospheric Emission Spectrometer (TES) atmospheric retrievals: Part 1. Description and characterization of errors on trace gas retrievals, J. Geophys. Res., 111, D24204, https://doi.org/10.1029/2005JD006733, 2006.
Lelieveld, J., Gromov, S., Pozzer, A., and Taraborrelli, D.: Global tropospheric hydroxyl distribution, budget and reactivity, Atmos. Chem. Phys., 16, 12477–12493, https://doi.org/10.5194/acp-16-12477-2016, 2016.
Liu, J., Bowman, K. W., Schimel, D. S., Parazoo, N. C., Jiang, Z., Lee, M., Bloom, A. A., Wunch, D., Frankenberg, C., Sun, Y., O'Dell, C. W., Gurney, K. R., Menemenlis, D., Gierach, M., Crisp, D., and Eldering, A.: Contrasting carbon cycle responses of the tropical continents to the 20152016 El Niño, Science, 358, eaam5690, https://doi.org/10.1126/science.aam5690, 2017.
Martínez-Alonso, S., Deeter, M., Worden, H., Borsdorff, T., Aben, I., Commane, R., Daube, B., Francis, G., George, M., Landgraf, J., Mao, D., McKain, K., and Wofsy, S.: 1.5 years of TROPOMI CO measurements: comparisons to MOPITT and ATom, Atmos. Meas. Tech., 13, 4841–4864, https://doi.org/10.5194/amt-13-4841-2020, 2020.
Martínez-Alonso, S., Deeter, M. N., Baier, B. C., McKain, K., Worden, H., Borsdorff, T., Sweeney, C., and Aben, I.: Evaluation of MOPITT and TROPOMI carbon monoxide retrievals using AirCore in situ vertical profiles, Atmos. Meas. Tech., 15, 4751–4765, https://doi.org/10.5194/amt-15-4751-2022, 2022.
McManus, J. B., Zahniser, M. S., Nelson, D. D., Shorter, J. H., Herndon, S., Wood E., and Wehr, R.: Application of quantum cascade lasers to high-precision atmospheric trace gas measurements, Opt. Eng., 49, 111124, https://doi.org/10.1117/1.3498782, 2010.
McMillan, W., Barnet, C., Strow, L., Chahine, M. T., McCourt, M. L., Warner, J. X., Novelli, P. C., Korontzi, S., Maddy, E. S., and Datta, S: Daily global maps of carbon monoxide from NASA's Atmospheric Infrared Sounder.” Geophys. Res. Lett., 32, L11801, https://doi.org/10.1029/2004GL021821, 2005.
Miyazaki, K., Bowman, K., Sekiya, T., Eskes, H., Boersma, F., Worden, H., Livesey, N., Payne, V. H., Sudo, K., Kanaya, Y., Takigawa, M., and Ogochi, K.: Updated tropospheric chemistry reanalysis and emission estimates, TCR-2, for 2005–2018, Earth Syst. Sci. Data, 12, 2223–2259, https://doi.org/10.5194/essd-12-2223-2020, 2020.
Moncet, J.-L., Uymin, G., Liang, P., and Lipton, A. E.: Fast and accurate radiative transfer in the thermal regime by simultaneous optimal spectral sampling over all channels, J. Atmos. Sci., 72, 2622–2641, https://doi.org/10.1175/JAS-D-14-0190.1, 2015.
Myhre, G., Shindell, D., Breon, F.-M., Collins, W., Fuglestvedt, J., Huang, J., Koch, D., Lamarque, J.-F., Lee, D., Mendoza, B., Nakajima, T., Robock, A., Stephens, G., Takemura, T., and Zhang, H.: Climate Change 2013: The Physical Science Basis, in: Contribution of Working Group I to the Fifth Assessment Report of the Intergovernmental Panel on Climate Change, chapter Anthropogenic and Natural Radiative Forcing, Cambridge University Press, 659–740, 2014.
Nalli, N. R., Tan, C., Warner, J., Divakarla, M., Gambacorta, A., Wilson, M., Zhu, T., Wang, T., Wei, Z., Pryor, K., Kalluri, S., Zhou, L., Sweeney, C., Baier, B. C., McKain, K., Wunch, D., Deutscher, N.M., Hase, F., Iraci, L.T., Kivi, R., Morino, I., Notholt, J., Ohyama, H., Pollard, D. F., Té, Y., Velazco, V. A., Warneke, T., Sussmann, R., and Rettinger, M.: Validation of Carbon Trace Gas Profile Retrievals from the NOAA-Unique Combined Atmospheric Processing System for the Cross-Track Infrared Sounder, Remote Sens., 12, 3245, https://doi.org/10.3390/rs12193245, 2020.
Qu, Z., Henze, D. K., Worden, H. M., Jiang, Z., Gaubert, B., Theys, N., and Wang, W.: Sector-based top-down estimates of NOx, SO2, and CO emissions in East Asia, Geophys. Res. Lett., 49, e2021GL096009, https://doi.org/10.1029/2021GL096009, 2022.
Reid, J. S., Koppmann, R., Eck, T. F., and Eleuterio, D. P.: A review of biomass burning emissions part II: intensive physical properties of biomass burning particles, Atmos. Chem. Phys., 5, 799–825, https://doi.org/10.5194/acp-5-799-2005, 2005.
Rodgers, C. D.: Inverse Methods for Atmospheric Sounding, Theory and Practice, World Scientific Publishing, London, 256 pp., https://doi.org/10.1142/3171, 2000.
Rodgers, C. D. and Connor, B. J.: Intercomparison of remote sounding instruments, J. Geophys. Res., 108, 4116, https://doi.org/10.1029/2002jd002299, 2003.
Santoni, G. W., Daube, B. C., Kort, E. A., Jiménez, R., Park, S., Pittman, J. V., Gottlieb, E., Xiang, B., Zahniser, M. S., Nelson, D. D., McManus, J. B., Peischl, J., Ryerson, T. B., Holloway, J. S., Andrews, A. E., Sweeney, C., Hall, B., Hintsa, E. J., Moore, F. L., Elkins, J. W., Hurst, D. F., Stephens, B. B., Bent, J., and Wofsy, S. C.: Evaluation of the airborne quantum cascade laser spectrometer (QCLS) measurements of the carbon and greenhouse gas suite – CO2, CH4, N2O, and CO – during the CalNex and HIPPO campaigns, Atmos. Meas. Tech., 7, 1509–1526, https://doi.org/10.5194/amt-7-1509-2014, 2014.
Seinfeld, J. H. and Pandis, S. N.: Atmospheric Chemistry and Physics,. John Wiley and Sons, New York, https://doi.org/10.1142/3171, 256 pp., 1998.
Smith, N. and Barnet, C. D.: CLIMCAPS observing capability for temperature, moisture, and trace gases from AIRS/AMSU and CrIS/ATMS, Atmos. Meas. Tech., 13, 4437–4459, https://doi.org/10.5194/amt-13-4437-2020, 2020.
Strode, S. A., Liu, J., Lait, L., Commane, R., Daube, B., Wofsy, S., Conaty, A., Newman, P., and Prather, M.: Forecasting carbon monoxide on a global scale for the ATom-1 aircraft mission: insights from airborne and satellite observations and modeling, Atmos. Chem. Phys., 18, 10955–10971, https://doi.org/10.5194/acp-18-10955-2018, 2018.
Susskind, J., Barnet, C. D., and Blaisdell, J. M.: Retrieval of atmospheric and surface parameters from AIRS/AMSU/HSB data in the presence of clouds, IEEE Trans. Geosci. Remote Sens., 41, 390–409, 2003.
Suto, H., Kataoka, F., Kikuchi, N., Knuteson, R. O., Butz, A., Haun, M., Buijs, H., Shiomi, K., Imai, H., and Kuze, A.: Thermal and near-infrared sensor for carbon observation Fourier transform spectrometer-2 (TANSO-FTS-2) on the Greenhouse gases Observing SATellite-2 (GOSAT-2) during its first year in orbit, Atmos. Meas. Tech., 14, 2013–2039, https://doi.org/10.5194/amt-14-2013-2021, 2021.
Sweeney, C., Karion, A., Wolter, S., Newberger, T., Guenther, D., Higgs, J. A., Andrews, A. A., Lang, P. M., Neff, D., Dlugokencky, E., Miller, J. B., Montzka, S. A., Miller, B. R., Masarie, K. A., Biraud, S. C.,Novelli, P. C., Crotwell, M., Crotwell, A. M., Thoning, K., and Tans, P. P.: Seasonal climatology of CO2 across North America from aircraft measurements in the NOAA/GML Global Greenhouse Gas Reference Network, J. Geophys. Res.-Atmos., 120, 5155–5190, https://doi.org/10.1002/2014JD022591, 2015.
Sweeney, C., McKain, K., Higgs, J., Wolter, S., Crotwell, A., Neff, D., Dlugokencky, E., Petron, G., Madronich, M., Moglia, E., Crotwell, M., and Mund, J.: NOAA Earth System Research Laboratories, Global Monitoring Laboratory. NOAA Carbon Cycle and Greenhouse Gases Group aircraft-based measurements of CO2, CH4, CO, N2O, H2 & SF6 in flask-air samples taken since 1992, NOAA [data set], https://doi.org/10.7289/V5N58JMF, 2021.
Tang, W., Worden, H. M., Deeter, M. N., Edwards, D. P., Emmons, L. K., Martínez-Alonso, S., Gaubert, B., Buchholz, R. R., Diskin, G. S., Dickerson, R. R., Ren, X., He, H., and Kondo, Y.: Assessing Measurements of Pollution in the Troposphere (MOPITT) carbon monoxide retrievals over urban versus non-urban regions, Atmos. Meas. Tech., 13, 1337–1356, https://doi.org/10.5194/amt-13-1337-2020, 2020.
Thompson, C. R., Wofsy, S. C., Prather, M. J., Newman, P. A., Hanisco, T. F., Ryerson, T. B., Fahey, D. W., Apel, E. C., Brock, C. A., Brune, W. H., Froyd, K., Katich, J. M., Nicely, J. M., Peischl, J., Ray, E., Veres, P. R., Wang, S., Allen, H. M., Asher, E., Bian, H., Blake, D., Bourgeois, I., Budney, J., Bui, T. P., Butler, A., Campuzano-Jost, P., Chang, C., Chin, M., Commane, R., Correa, G., Crounse, J. D., Daube, B., Dibb, J. E., DiGangi, J. P., Diskin, G. S., Dollner, M., Elkins, J. W., Fiore, A. M., Flynn, C. M., Guo, H., Hall, S. R., Hannun, R. A., Hills, A., Hintsa, E. J., Hodzic, A., Hornbrook, R. S., Huey, L. G., Jimenez, J. L., Keeling, R. F., Kim, M. J., Kupc, A., Lacey, F., Lait, L. R., Lamarque, J., Liu, J., McKain, K., Meinardi, S., Miller, D. O., Montzka, S. A., Moore, F. L., Morgan, E. J., Murphy, D. M., Murray, L. T., Nault, B. A., Neuman, J. A., Nguyen, L., Gonzalez, Y., Rollins, A., Rosenlof, K., Sargent, M., Schill, G., Schwarz, J. P., Clair, J. M. S., Steenrod, S. D., Stephens, B. B., Strahan, S. E., Strode, S. A., Sweeney, C., Thames, A. B., Ullmann, K., Wagner, N., Weber, R., Weinzierl, B., Wennberg, P. O., Williamson, C. J., Wolfe, G. M., and Zeng, L.: The NASA Atmospheric Tomography (ATom) Mission: Imaging the Chemistry of the Global Atmosphere, B. Am. Meteorol. Soc., 103, E761–E790, 2022.
Wofsy, S. C., Afshar, S., Allen, H. M., Apel, E. C., Asher, E. C., Barletta, B., Bent, J., Bian, H., Biggs, B. C., Blake, D. R., Blake, N., Bourgeois, I., Brock, C. A., Brune, W. H., Budney, J. W., Bui, T. P., Butler, A., Campuzano-Jost, P., Chang, C. S., Chin, M., Commane, R., Correa, G., Crounse, J. D., Cullis, P. D., Daube, B. C., Day, D. A., Dean-Day, J. M., Dibb, J. E., DiGangi, J. P., Diskin, G. S., Dollner, M., Elkins, J. W., Erdesz, F., Fiore, A. M., Flynn, C. M., Froyd, K. D., Gesler, D. W., Hall, S. R., Hanisco, T. F., Hannun, R. A., Hills, A. J., Hintsa, E. J., Hoffman, A., Hornbrook, R. S., Huey, L. G., Hughes, S., Jimenez, J. L., Johnson, B. J., Katich, J. M., Keeling, R. F., Kim, M. J., Kupc, A., Lait, L. R., Lamarque, J.-F., Liu, J., McKain, K., Mclaughlin, R. J., Meinardi, S., Miller, D. O., Montzka, S. A., Moore, F. L., Morgan, E. J., Murphy, D. M., Murray, L. T., Nault, B. A., Neu- man, J. A., Newman, P. A., Nicely, J. M., Pan, X., Paplawsky, W., Peischl, J., Prather, M. J., Price, D. J., Ray, E., Reeves, J. M., Richardson, M., Rollins, A. W., Rosenlof, K. H., Ryerson, T. B., Scheuer, E., Schill, G. P., Schroder, J. C., Schwarz, J. P., St. Clair, J. M., Steenrod, S. D., Stephens, B. B., Strode, S. A., Sweeney, C., Tanner, D., Teng, A. P., Thames, A. B., Thompson, C. R., Ullmann, K., Veres, P. R., Vieznor, N., Wagner, N. L., Watt, A., Weber, R., Weinzierl, B., Wennberg, P. O., Williamson, C. J., Wilson, J. C., Wolfe, G. M., Woods, C. T., and Zeng, L. H.: ATom: Merged Atmospheric Chemistry, Trace Gases, and Aerosols, ORNL DAAC [data set], Oak Ridge, TN, USA, https://doi.org/10.3334/ORNLDAAC/1581, 2018.
Worden, H. M., Logan, J., Worden, J. R., Beer, R., Bowman, K., Clough, S. A., Eldering, A., Fisher, B., Gunson, M. R., Herman, R. L., Kulawik, S. S., Lampel, M. C., Luo, M., Megretskaia, I. A., Osterman, G. B., and Shephard, M. W.: Comparisons of Tropospheric Emission Spectrometer (TES) ozone profiles to ozonesodes: methods and initial results, J. Geophys. Res., 112, D03309, https://doi.org/10.1029/2006JD007258, 2007.
Worden, H. M., Deeter, M. N., Frankenberg, C., George, M., Nichitiu, F., Worden, J., Aben, I., Bowman, K. W., Clerbaux, C., Coheur, P. F., de Laat, A. T. J., Detweiler, R., Drummond, J. R., Edwards, D. P., Gille, J. C., Hurtmans, D., Luo, M., Martínez-Alonso, S., Massie, S., Pfister, G., and Warner, J. X.: Decadal record of satellite carbon monoxide observations, Atmos. Chem. Phys., 13, 837–850, https://doi.org/10.5194/acp-13-837-2013, 2013.
Zheng, B., Chevallier, F., Yin, Y., Ciais, P., Fortems-Cheiney, A., Deeter, M. N., Parker, R. J., Wang, Y., Worden, H. M., and Zhao, Y.: Global atmospheric carbon monoxide budget 2000–2017 inferred from multi-species atmospheric inversions, Earth Syst. Sci. Data, 11, 1411–1436, https://doi.org/10.5194/essd-11-1411-2019, 2019.
- Abstract
- Introduction
- TROPESS/CrIS single-field-of-view CO profile retrievals
- Aircraft data
- Validation methodology
- Validation Results
- Summary and conclusions
- Data availability
- Author contributions
- Competing interests
- Disclaimer
- Acknowledgements
- Financial support
- Review statement
- References
- Supplement