the Creative Commons Attribution 4.0 License.
the Creative Commons Attribution 4.0 License.
 | 31 Jan 2022
Characterisation of the Manchester Aerosol Chamber facility
Yunqi Shao
Aristeidis Voliotis
M. Rami Alfarra
Simon P. O'Meara
S. Fiona Turner
Gordon McFiggans
This study describes the design of the Manchester Aerosol Chamber (MAC), initially developed in 2005 and presents for the first time its comprehensive characterisation. The MAC is designed to investigate multi-phase chemistry and the evolution of aerosol physico-chemical properties from the real-world emissions (e.g. diesel engine, plants) or of secondary organic aerosol (SOA) produced from pure volatile organic compounds (VOCs). Additionally, the generated aerosol particles in the MAC can be transferred to the Manchester Ice Cloud Chamber (MICC), which enables investigation of cloud formation in warm, mixed-phase, and fully glaciated conditions (with temperature, T, as low as −55 ∘C). The MAC is an 18 m3 fluorinated ethylene propylene (FEP) Teflon chamber with the potential to conduct experiments at controlled temperature (15–35 ∘C) and relative humidity (RH; 25 %–80 %) under simulated solar radiation or dark conditions. Detailed characterisations were conducted at common experimental conditions (25 ∘C, 50 % RH) for actinometry and determination of background contamination, wall losses of gases (NO2, O3, and selected VOCs), aerosol particles at different sizes, chamber wall reactivity, and aerosol formation. In addition, the influences of chamber contamination on the wall loss rate of gases and particles and the photolysis of NO2 were estimated.
- Article
(4370 KB) - Full-text XML
-
Supplement
(235 KB) - BibTeX
- EndNote


Atmospheric aerosols have significant effects on air quality, regional to global climate, and human health (Lohmann and Feichter, 2005; Pope et al., 2002; Katsouyanni et al., 1997). Aerosol particles range from a few nanometres to several tens of micrometres in diameter. Their composition is complex, comprising inorganic and organic compounds, dependent on their sources, which may be either primary (e.g. sea salt, dust, wildfires) or secondary, from the oxidation of gaseous precursors (Seinfeld and Pandis, 2016). Organic compounds contribute 20 % to 90 % of the mass of submicron aerosols in the Northern Hemisphere (Jimenez et al., 2009; Zhang et al., 2007), and of an estimated 10 000 to 100 000 atmospheric organic compounds (Goldstein and Galbally, 2007), only around 10 % have been identified, such as alkanes, carbonyls, alcohols, esters, and acids (Hallquist et al., 2009; Goldstein and Galbally, 2007). Owing to this complexity, their chemical reaction pathways and properties lead to substantial outstanding challenges to the understanding of organic aerosol (OA) formation, transformation, fate, and impacts (Hallquist et al., 2009). Such an inadequate understanding of aerosol particles and particularly the organic fraction leads to large uncertainties in understanding their role in air quality and global climate (Mcfiggans et al., 2006). Processes relating to organic-containing particles have consequently been a primary focus of studies in our chamber.
Over the last several decades, numerous field measurements have been conducted globally to characterise OA in the atmosphere (Gray et al., 1986; Hoffman and Duce, 1977; Turpin and Huntzicker, 1991, 1995; Hallquist et al., 2009; Jimenez et al., 2009; Zhang et al., 2007). However, isolation of chemical and microphysical processes from meteorology and other atmospheric processes can be challenging in ambient measurements (Becker, 2006). To better understand the sources, physico-chemical properties, and ageing processes influencing atmospheric aerosols, simulation chamber facilities have been developed across the globe since the 1960s (Karl et al., 2004; Cocker et al., 2001a; Carter et al., 2005; Paulsen et al., 2005; Saathoff et al., 2009; Wang et al., 2011, 2014; Platt et al., 2013; Schnitzhofer et al., 2014; Leskinen et al., 2015; Babar et al., 2016; Gallimore et al., 2017; Leone et al., 1985). In principle, a simulation chamber is a controlled system to elucidate processes that occur in the real atmosphere (Barnes and Rudzinski, 2006), gas-phase reactions and chemical pathways (Carter and Lurmann, 1991; Seakins, 2010; Atkinson et al., 1992; Paulot et al., 2009; Surratt et al., 2010; Ehn et al., 2012; Bianchi et al., 2019, Thornton et al., 2020), secondary organic aerosol (SOA) production (Hallquist et al., 2009; Carlton et al., 2009; Mcfiggans et al., 2019), new particle formation (Smith, 2016; Wang et al., 2020; Wagner et al., 2017; Dunne et al., 2016), cloud processes (Wang et al., 2011; Frey et al., 2018; Wagner et al., 2006), transformations and properties of real-world emissions (from vehicles; e.g. Liu et al., 2017, biomass burning; e.g. Hennigan et al., 2011, plants; e.g. Hohaus et al., 2016), and health effects (Tong et al., 2018; Taylor et al., 2000).
The design of simulation chambers varies widely with respect to the light sources, chamber sizes, materials, and operation conditions to address varied lines of research (Barnes and Rudzinski, 2006). The size of chamber facilities ranges from ∼1 to ∼300 m3 and are variously constructed from pyrex or quartz, aluminium, stainless steel, and fluorinated ethylene propylene (FEP) Teflon. The light sources of chambers include artificial and natural solar radiation, leading to a convenient classification into indoor and outdoor chambers (Barnes and Rudzinski, 2006). Pyrex or quartz is widely used for chambers with a volume of less than 1 m3, with a few that are larger, such as the JPAC (Jülich Plant Atmosphere Chamber; 1.45 m3) (Ehn et al., 2014), Bayreuth chambers (2.4 m3) (Behnke et al., 1988), and the quartz-glass reaction chamber (>1 m3) (Barnes et al., 1994). Owing to its reasonably inert nature and transparency towards short-wavelength lights, pyrex and quartz chambers enable ready access to radical generation studies. Also, pyrex and quartz chambers can enable temperature-dependent studies with the use of a cooling or heating bath. Metal chambers are usually built with a volume of 1 to 6 m3, with exceptions such as the AIDA (Aerosol Interactions and Dynamics in the Atmosphere) chamber (85 m3) (Wagner et al., 2006), the MICC (Manchester Ice Cloud Chamber; 10 m3) (Connolly et al., 2012), and the CERN (European Organization for Nuclear Research) cloud chamber (26 m3) (Schnitzhofer et al., 2014). The largest advantage of the rigid metal chambers is the ability to conduct experiments under varying temperatures, enabling simulation of free-tropospheric conditions (Wagner et al., 2006; Schnitzhofer et al., 2014) and warm, mixed-phase, and fully glaciated clouds. FEP Teflon is widely used in medium to large chambers, such as FORTH-ASC (Foundation for Research and Technology Hellas Atmospheric Simulation Chamber; 10 m3) (Kostenidou et al., 2013), the Manchester Aerosol Chamber (MAC) (18 m3), LEAK-LACIS (Leipziger Aerosolkammer Leipziger Aerosol and Cloud Interaction Simulator; 19 m3) (Mutzel et al., 2015; Niedermeier et al., 2020), IASC (Irish Atmospheric Simulation Chamber; 27 m3), Caltech dual chambers (both 28 m3; Cocker et al., 2001b), the University of California at Riverside dual chambers (both 90 m3) (Carter et al., 2005), PSI (Paul Scherrer Institute) chamber (27 m3) (Paulsen et al., 2005), ILMARI (Aerosol Physics, Chemistry and Toxicology Research Unit; 29 m3) (Leskinen et al., 2015), HELIOS (Outdoor Atmospheric Simulation Chamber of Orleans; 90 m3) (Ren et al., 2017), SAPHIR (Simulation of Atmospheric Photochemistry In a Large Reaction Chamber; 270 m3) (Karl et al., 2004), and EUPHORE (European PhotoReactor; 2×200 m3) (Bloss et al., 2005; Dunne et al., 2016). The transparency of Teflon enables its widespread use in both indoor and outdoor chambers, enabling transmission across the solar spectrum.
All chambers have limitations. A universal challenge is the presence of chamber walls that can act as a sink of the reacting gases and aerosol particles (Mcmurry and Grosjean, 1985) and as a surface on which they can react. Consequently, experimental results relating to gas–particle partitioning, aerosol formation rate, and yield, for example, require careful interpretation (Mcmurry and Grosjean, 1985; Matsunaga and Ziemann, 2010; Zhang et al., 2014; Ye et al., 2016; Wang et al., 2018). Similarly, photochemistry experiments in indoor chambers using artificial lights require consideration of the wavelength dependence of the irradiance (Barnes and Rudzinski, 2006). Outdoor chambers, particularly the larger ones, are challenged by control of relative humidity (RH) and temperature (T) due to the ambient diurnal variation, which may introduce some uncertainty (Barnes and Rudzinski, 2006). In addition, gases and particles as well as the intermediate reactants can interact with and partition into chamber walls (so-called memory effect), which can affect repeatability and reliability of the results (Carter and Lurmann, 1991; Wang et al., 2011, 2014; Schnitzhofer et al., 2014). This artefact due to the memory effect necessitates a clear and detailed characterisation of chamber behaviour and history.
This paper provides a description and characterisation of a novel indoor simulation chamber, the Manchester Aerosol Chamber (MAC), located at the University of Manchester. The MAC has been well developed and predominantly used since 2005 to understand the chemical and physical properties of aerosols from different sources (e.g. engines, real-plant emissions, biogenic or anthropogenic volatile organic compounds (VOCs)). But all these studies have not required the quantification of aerosol amount; therefore the mixing or wall effect had not been characterised at the time of many previous experiments. Recently, in order to understand the SOA formation (e.g. yield) from mixed precursors (e.g. Voliotis et al., 2021; Wang et al., 2021), a full characterisation of the chamber was implemented to ensure the reliability of the studies. Equipped with state-of-the-science instruments, the MAC has been used to explore the aerosol formation and ageing (Hamilton et al., 2011; Alfarra et al., 2012), physico-chemical properties of multi-component aerosol particles (Alfarra et al., 2013; Wang et al., 2021; Voliotis et al., 2021), gas–particle partitioning (Voliotis et al., 2021), aerosol formation, and properties and transformations from plant emissions (Wyche et al., 2014) and from engine emissions (Pereira et al., 2018; Liu et al., 2017). Additionally, the entire contents of the MAC can be transferred directly to the MICC (Manchester Ice Cloud Chamber) to investigate the warm, mixed-phase, and fully glaciated cloud formation on the aerosol particles that will act as cloud condensation nuclei (CCN) and ice nuclei (IN). A detailed description of the coupling between the facilities and its use can be found in Connolly et al. (2012) and Frey et al. (2018) and is not discussed here.
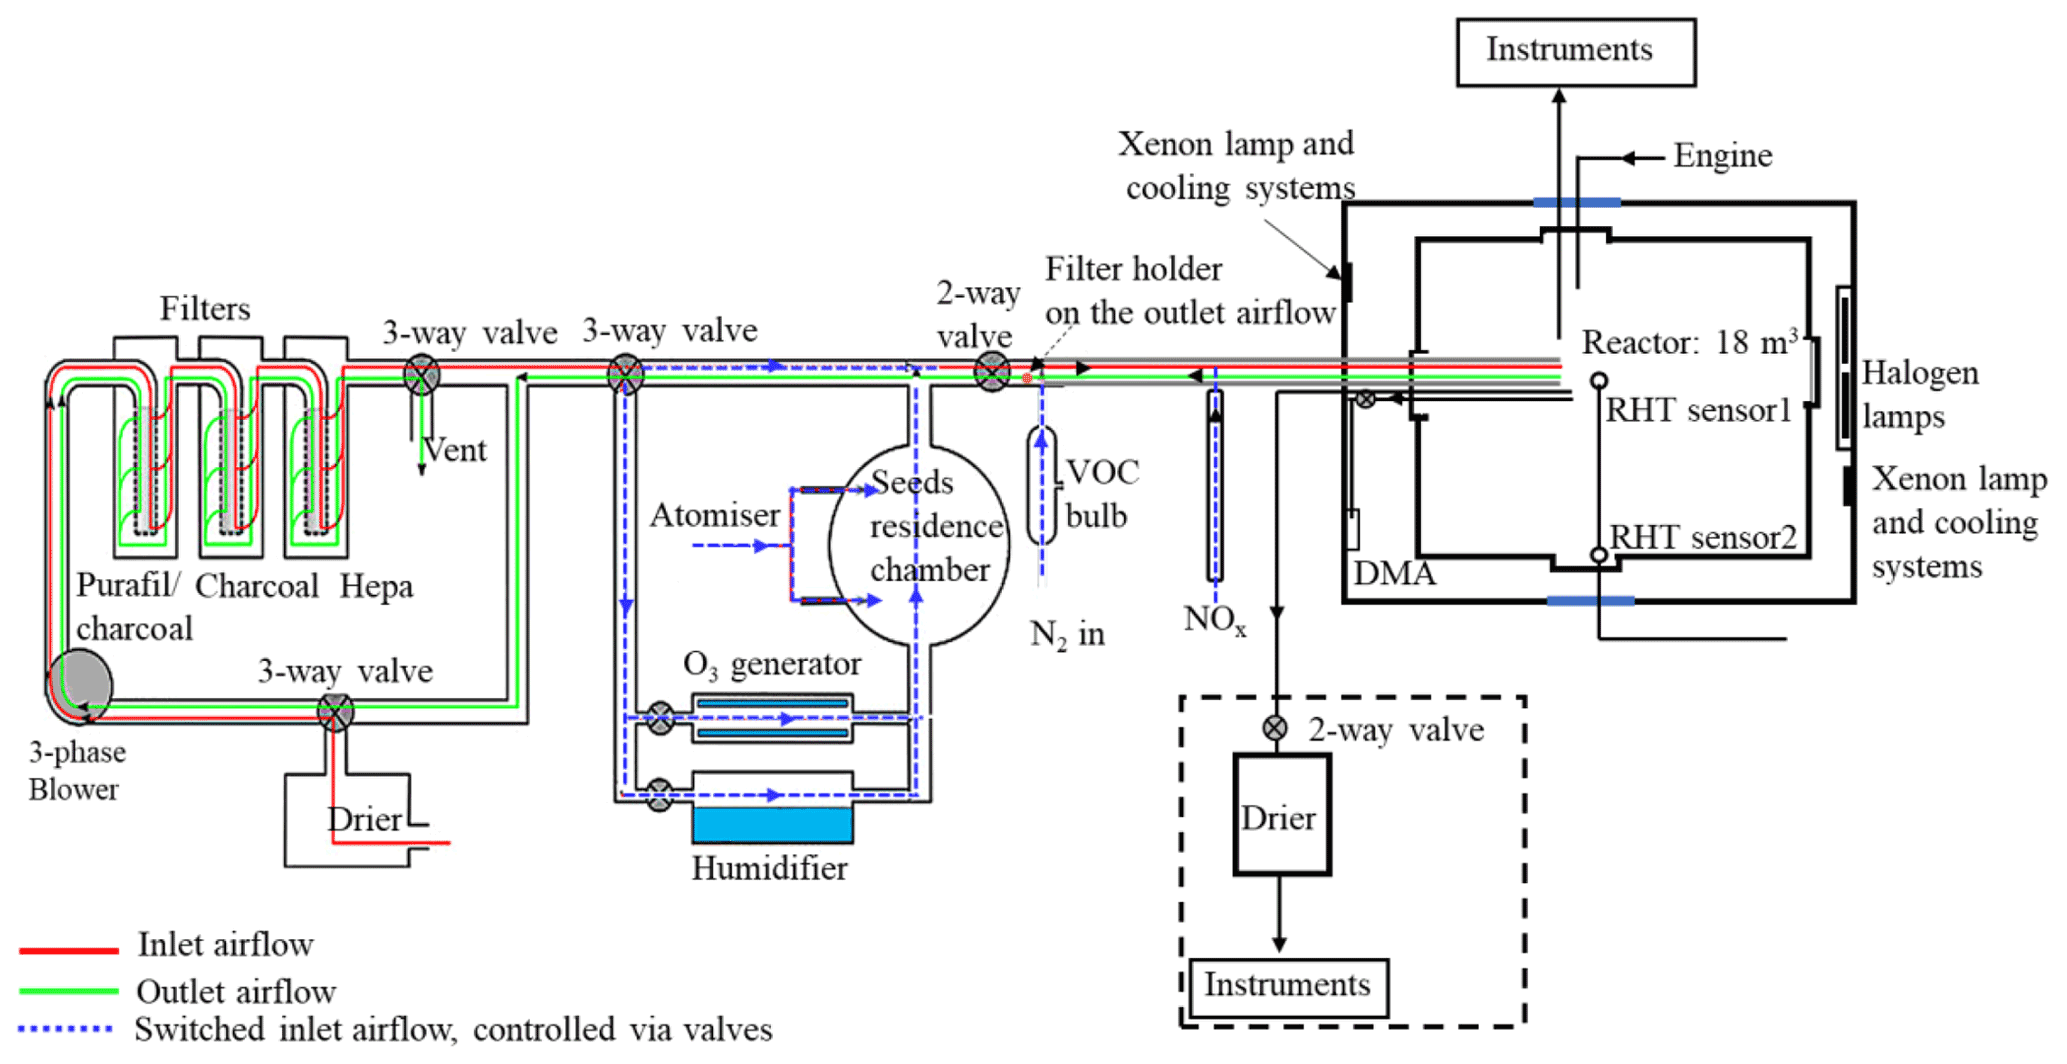
The MAC is operated as a batch reactor where the composition of the gaseous precursors, pre-existing seed, oxidising environment, relative humidity, and temperature are controlled throughout a typical experimental duration of several hours. It is equipped with a variable combination of gas-phase and particle-phase analytical instruments as listed in Table 1. The MAC consists of an 18 m3 FEP Teflon bag suspended from a frame comprising a central fixed-frame member and two moving members, all contained within an RH- and temperature-controlled enclosure. Along with the light sources, cooling systems, and air purification system, the MAC is shown in the schematic in Fig. 1.
Table 1List of the available instrumentation at the MAC.
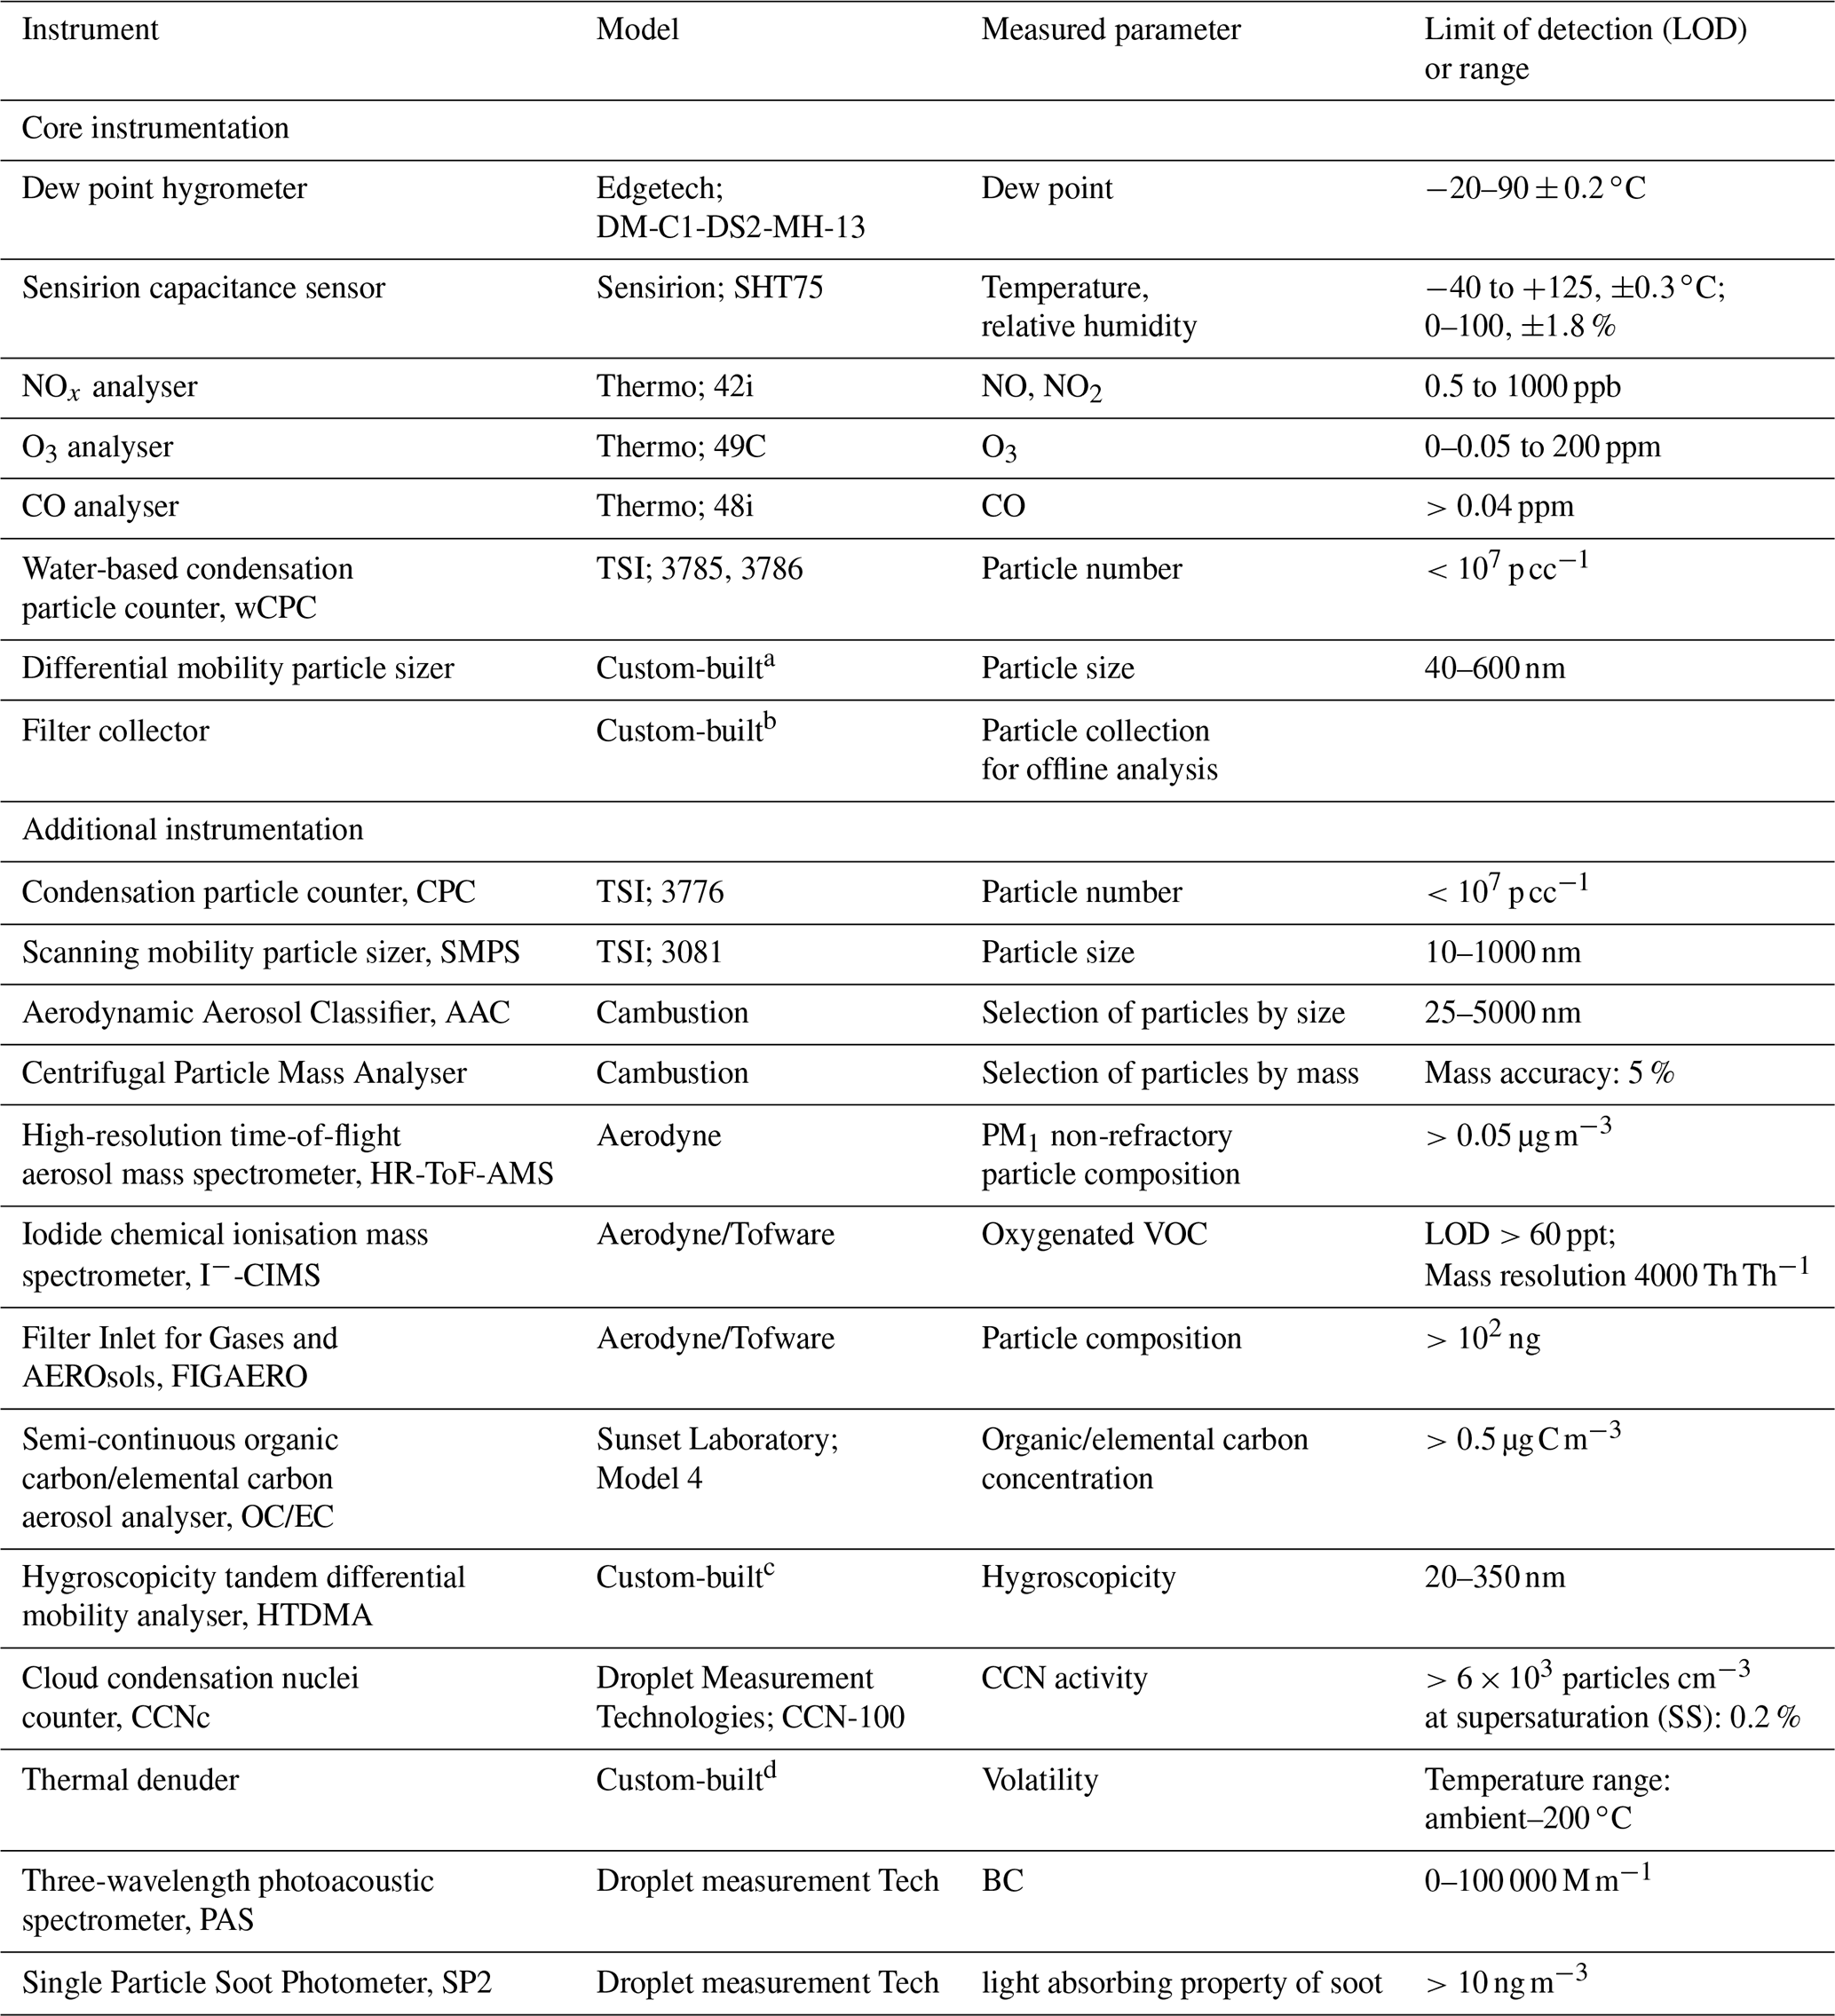
a Alfarra et al. (2012). b Hamilton et al. (2011). c Good et al. (2010). d Voliotis et al. (2021).
2.1 Enclosure and environmental control
The rectangular enclosure comprises an extruded aluminium framework supporting two access sides, each with two bi-fold doors, and two fixed sides, within which the lamp enclosures and air conditioning (AC) ducts are situated. The inner walls and the ceiling of the enclosure and the floor are fully coated with a reflective space blanket to approximate an integrating sphere to maximise the chamber irradiance and provide even light intensity. The temperature and relative humidity between the chamber and the enclosure walls are controlled by the AC, allowing a temperature within the range of 15–35 ∘C and RH between 25 % and 80 %. The inlet duct is positioned aloft at one end of the chamber, and the outlet duct is at the bottom of the other such that conditioned air at 3 m3 s−1 continually passes through the 50 cm space between the bag and enclosure, agitating and mixing the air in the bag as it does so. The RH set points are chosen to match the dew point of the chamber air at the desired temperature. Temperature and dew point are measured at two points in the chamber (at the middle and on the side) using a dew point hygrometer and two thermocouples to choose the set point.
2.2 Teflon reactor
The reactor comprises four sections of FEP Teflon film (50 µm, AdTech Polymer Engineering Ltd.). FEP Teflon film is chosen since it is chemically inert and more transparent than polyvinyl fluoride (PVF) and polytetrafluoroethylene (PTFE), having better light transmission between 290 and 800 nm, and it has lower rates of hydrocarbon off-gassing (Finlayson-Pitts and Pitts, 2000). A weakness of the FEP film is the accumulation of electrostatic charge, which can significantly increase the wall loss rates for particles with a diameter smaller than 500 nm (Mcmurry and Rader, 1985; Charan et al., 2018). The chamber is suspended in the enclosure, and joints between three pairs of edges of the Teflon film are made by compression-sealing between the three pairs of rectangular extruded aluminium frames. The edges of the top and bottom Teflon webs are clamped by stainless steel clips installed on the aluminium frames with expanded foam strips relieving between the frame and Teflon to ensure even compression between the Teflon sheets. This approach avoids additional contamination from glue or tapes. The central rigid frame is fixed, with the upper and lower frames free to move vertically. They are counter-weighted to enable the bag to expand and collapse when sample air is introduced and extracted in the process of fill–flush cycles and sampling. This reduces the possibility of the chamber operating under negative pressure, minimising instrumental sampling problems and contamination from laboratory air. In normal practice, around 80 % of the chamber air can be extracted from the chamber within ∼5 min at a flow rate of 3 m3 min−1 in each flush cycle; after that the purified air can be filled into the chamber at the same flow rate. A low background condition is achieved in around 2 h of continuous automated fill–flush cycles. This relatively rapid cleaning improves the duty cycle and efficiency of the chamber preparation process. The central fixed-frame pair supports three inlet and sampling manifolds constructed of solid Teflon, one in each of the two long sides and one in the short side of the bag, as well as mirrors and optical fibre mounting for a two-pass broadband differential optical absorption spectroscopy (DOAS) system for retrieval of aerosol optical properties along the long axis of the chamber. One manifold is connected to the air purification system (described in Sect. 2.4) for injection of purified air, VOC precursor, NOx, O3, and seed aerosols and transfer of sample to selected instrumentation in the upper-floor laboratory. A second manifold is used for sampling gas and particulate material from the chamber to online instrumentation next to the chamber throughout each experiment. A second port in this manifold can be used to couple the chamber to emission sources, such as engines or plant chambers, and has been discussed elsewhere (Wyche et al., 2014; Pereira et al., 2018). The third manifold houses sensors to monitor the RH and T inside the chamber and at the chamber walls.
2.3 Chamber illumination
The irradiation source, consisting of two xenon arc lamps and a bank of halogen bulbs, is mounted inside the enclosure and is used to approximate the atmospheric actinic spectrum. Two 6 kW arc xenon lamps (XBO 6000 W/HSLA OFR, Osram) are installed on the bottom left and the top right of the chamber housing, respectively. Quartz plates with optical polish (PI-KEM Ltd) of 4 mm thickness in front of each arc lamp filter out unwanted UV light. The bank of 112 halogen lights, 7 rows of 16 bulbs each (Solux 50 W, 4700 K, Solux MR16, USA), is mounted on the same enclosure wall as the bottom xenon arc lamp, facing the inlet.
The unwanted heat generated from the irradiation source is removed by the cooling system, which includes the air conditioning (AC) unit and a water tank in front of each arc lamp, with a circulating water system. The chiller water circulates through aluminium bars, cooling the halogen bulb holders, and through tanks in front of each arc lamp faced by the quartz filter plates in order to dissipate heat produced by absorption of unwanted infrared (IR) light by water vapour.
2.4 Chamber air purification, conditioning, and injection system
Purified dry air is supplied by passing laboratory air at up to 3 m3 min−1 using a three-phase blower (Nash Elmo, model G200) through a drier (ML180, Munters) and three filters (the first canister containing Purafil and charcoal, the second containing activated charcoal and the third with a HEPA filter to remove the NOx, volatile organic compounds, and particles). This typically results in particle concentrations <15 particles cm−3, particle mass concentration ∼0 µg m−3, O3 concentrations ∼0 ppb, and NOx concentration <10 ppb (NO<8 ppb and NO2<2 ppb).
The clean air can be conditioned by passing through the humidifier, ozoniser, and aerosol mixing tank before entering the chamber. The ozoniser (OZV30, Waterth) generates ozone using two mercury lamps. The custom-built humidifier comprises a 50 L tank fed with ultra-pure water (resistivity≥18.2 MΩ cm), producing water vapour using an immersion heater that heats the water to ∼80 ∘C. VOCs are added to the chamber by injecting the desired liquid amount into a gently heated glass bulb (to ∼80 ∘C) and transferred using the electron capture device (ECD)-grade nitrogen (N4.8, purity 99.998 %, N2) as the carrier gas. NOx (NO and NO2) is added to the chamber using custom-made cylinders at 10 % and a mass flow controller and transferred with ECD-grade N2 as the carrier gas. Seed particles are generated by an atomiser (Topaz model ATM 230) and pass through a 0.12 m3 stainless steel aerosol residence chamber before being flushed into the chamber. All components are connected with large-bore (50 mm) stainless steel pipes apart from the diversion lines for the seed, humidifier, and ozoniser, which have a 25 mm bore. The flow path is controlled by several two- and three-way electro-pneumatic valves along the inlet system. As shown in Fig. 1, the purified lab air that is used to fill the chamber can be directed through the humidifier, the ozoniser, and aerosol residence chamber and carry any of their components to the chamber while filling at a high flow rate (3 m3 min−1), ensuring rapid mixing (see Sect. 3.2).
2.5 Control system
To regulate the chamber operational procedures and devices (fill–flush cycles, injection procedure, humidification, VOC bulb heating, ozoniser operation) conveniently, repeatedly, and precisely, a bespoke automated control system is used. All component switches are controlled from a home-built PLC (programmable logic controller) board, with all control signals processed using ladder logic and communicating with a graphical front end in Visual Basic. All components (including the two- and three-way valves) shown in Fig. 1 are controlled by the PLC. Selection of the valve position controls whether clean air is injected into the chamber or the chamber contents are flushed to exhaust. Cycles of filling and flushing are programmed to enable unsupervised operation during cleaning cycles. The humidifier and ozoniser can be bypassed by controlling the diversion line valves during the fill part of the cycle. Relative humidity and temperature of the chamber were continuously measured via the EdgeTech and Sensirion sensors that are also PLC-controlled. All control data are saved automatically. Three pre-programmed operations (pre-experiment, post-experiment, and fill–flush cycle) are provided in the control system to enable manual or automated operation. More details about these operational procedures are provided in Sect. 2.7.
2.6 Modes of operation
The MAC generally operates as a batch reactor that provides a closed system without the continuous flow of reactants or dilution flow of clean air. There have been several modes of operation used. The most straightforward mode is the heated-bulb injection of commercial pure-VOC precursors to investigate
The most straightforward mode is using the heated bulb injection of commercial pure VOC precursors to investigate the SOA formation and transformation in either sole- or mixed-VOC systems (Hamilton et al., 2011; Jenkin et al., 2012). The MAC has additionally been coupled to whole combustion process and biogenic emission sources. A dynamometer, diesel engine, and oxidising catalyst unit can be connected to the chamber directly, allowing controlled exhaust dilutions by controlled injection timing of exhaust fumes into the chamber under selected loads and speeds. For example, Pereira et al. (2018) reported the effect of different engine conditions and emission control devices on unregulated diesel exhaust gas emissions. The MAC has been coupled with a custom-built plant chamber to investigate the SOA formation from the real plants under controlled conditions. Wyche et al. (2014) deployed the chamber to investigate SOA formation from biogenic VOC precursors emitted from the silver birch and three Southeast Asian tropical plant species. Also, the MAC infrastructure was recently successfully extended to continuously generate NO3 radicals using synthesised N2O5 to enable studies of SOA formation and transformation under nighttime conditions.
2.7 Experimental procedures
To ensure reliable and reproducible control of experimental conditions, three specific experimental procedures have been programmed to be sequenced and implemented automatically or manually to ensure a lower chamber background. The first, designated the pre-experiment procedure, includes several fill–flush cycles of the chamber with clean air at a high flow rate of 3 m3 min−1 for ∼1.5 h. The VOC glass bulb is also cleaned in the course of the pre-experiment procedure using ECD-grade N2.
The second, conducted at the end of each experiment, is the post-experiment procedure. Again, this consists of several fill–flush cycles of the chamber with clean air at a high flow rate of 3 m3 min−1 for ∼1.5 h, followed by a fill with a high concentration of O3 (∼1 ppm) to soak the chamber overnight to oxidise the residual O3-reacting volatile species. The third, a more aggressive “harsh cleaning” procedure, is carried out weekly during experimental campaigns. In this procedure a high concentration of O3 (∼1 ppm) is filled into the chamber with illumination, undergoing several hours of photo-oxidation at high relative humidity (∼80 %).
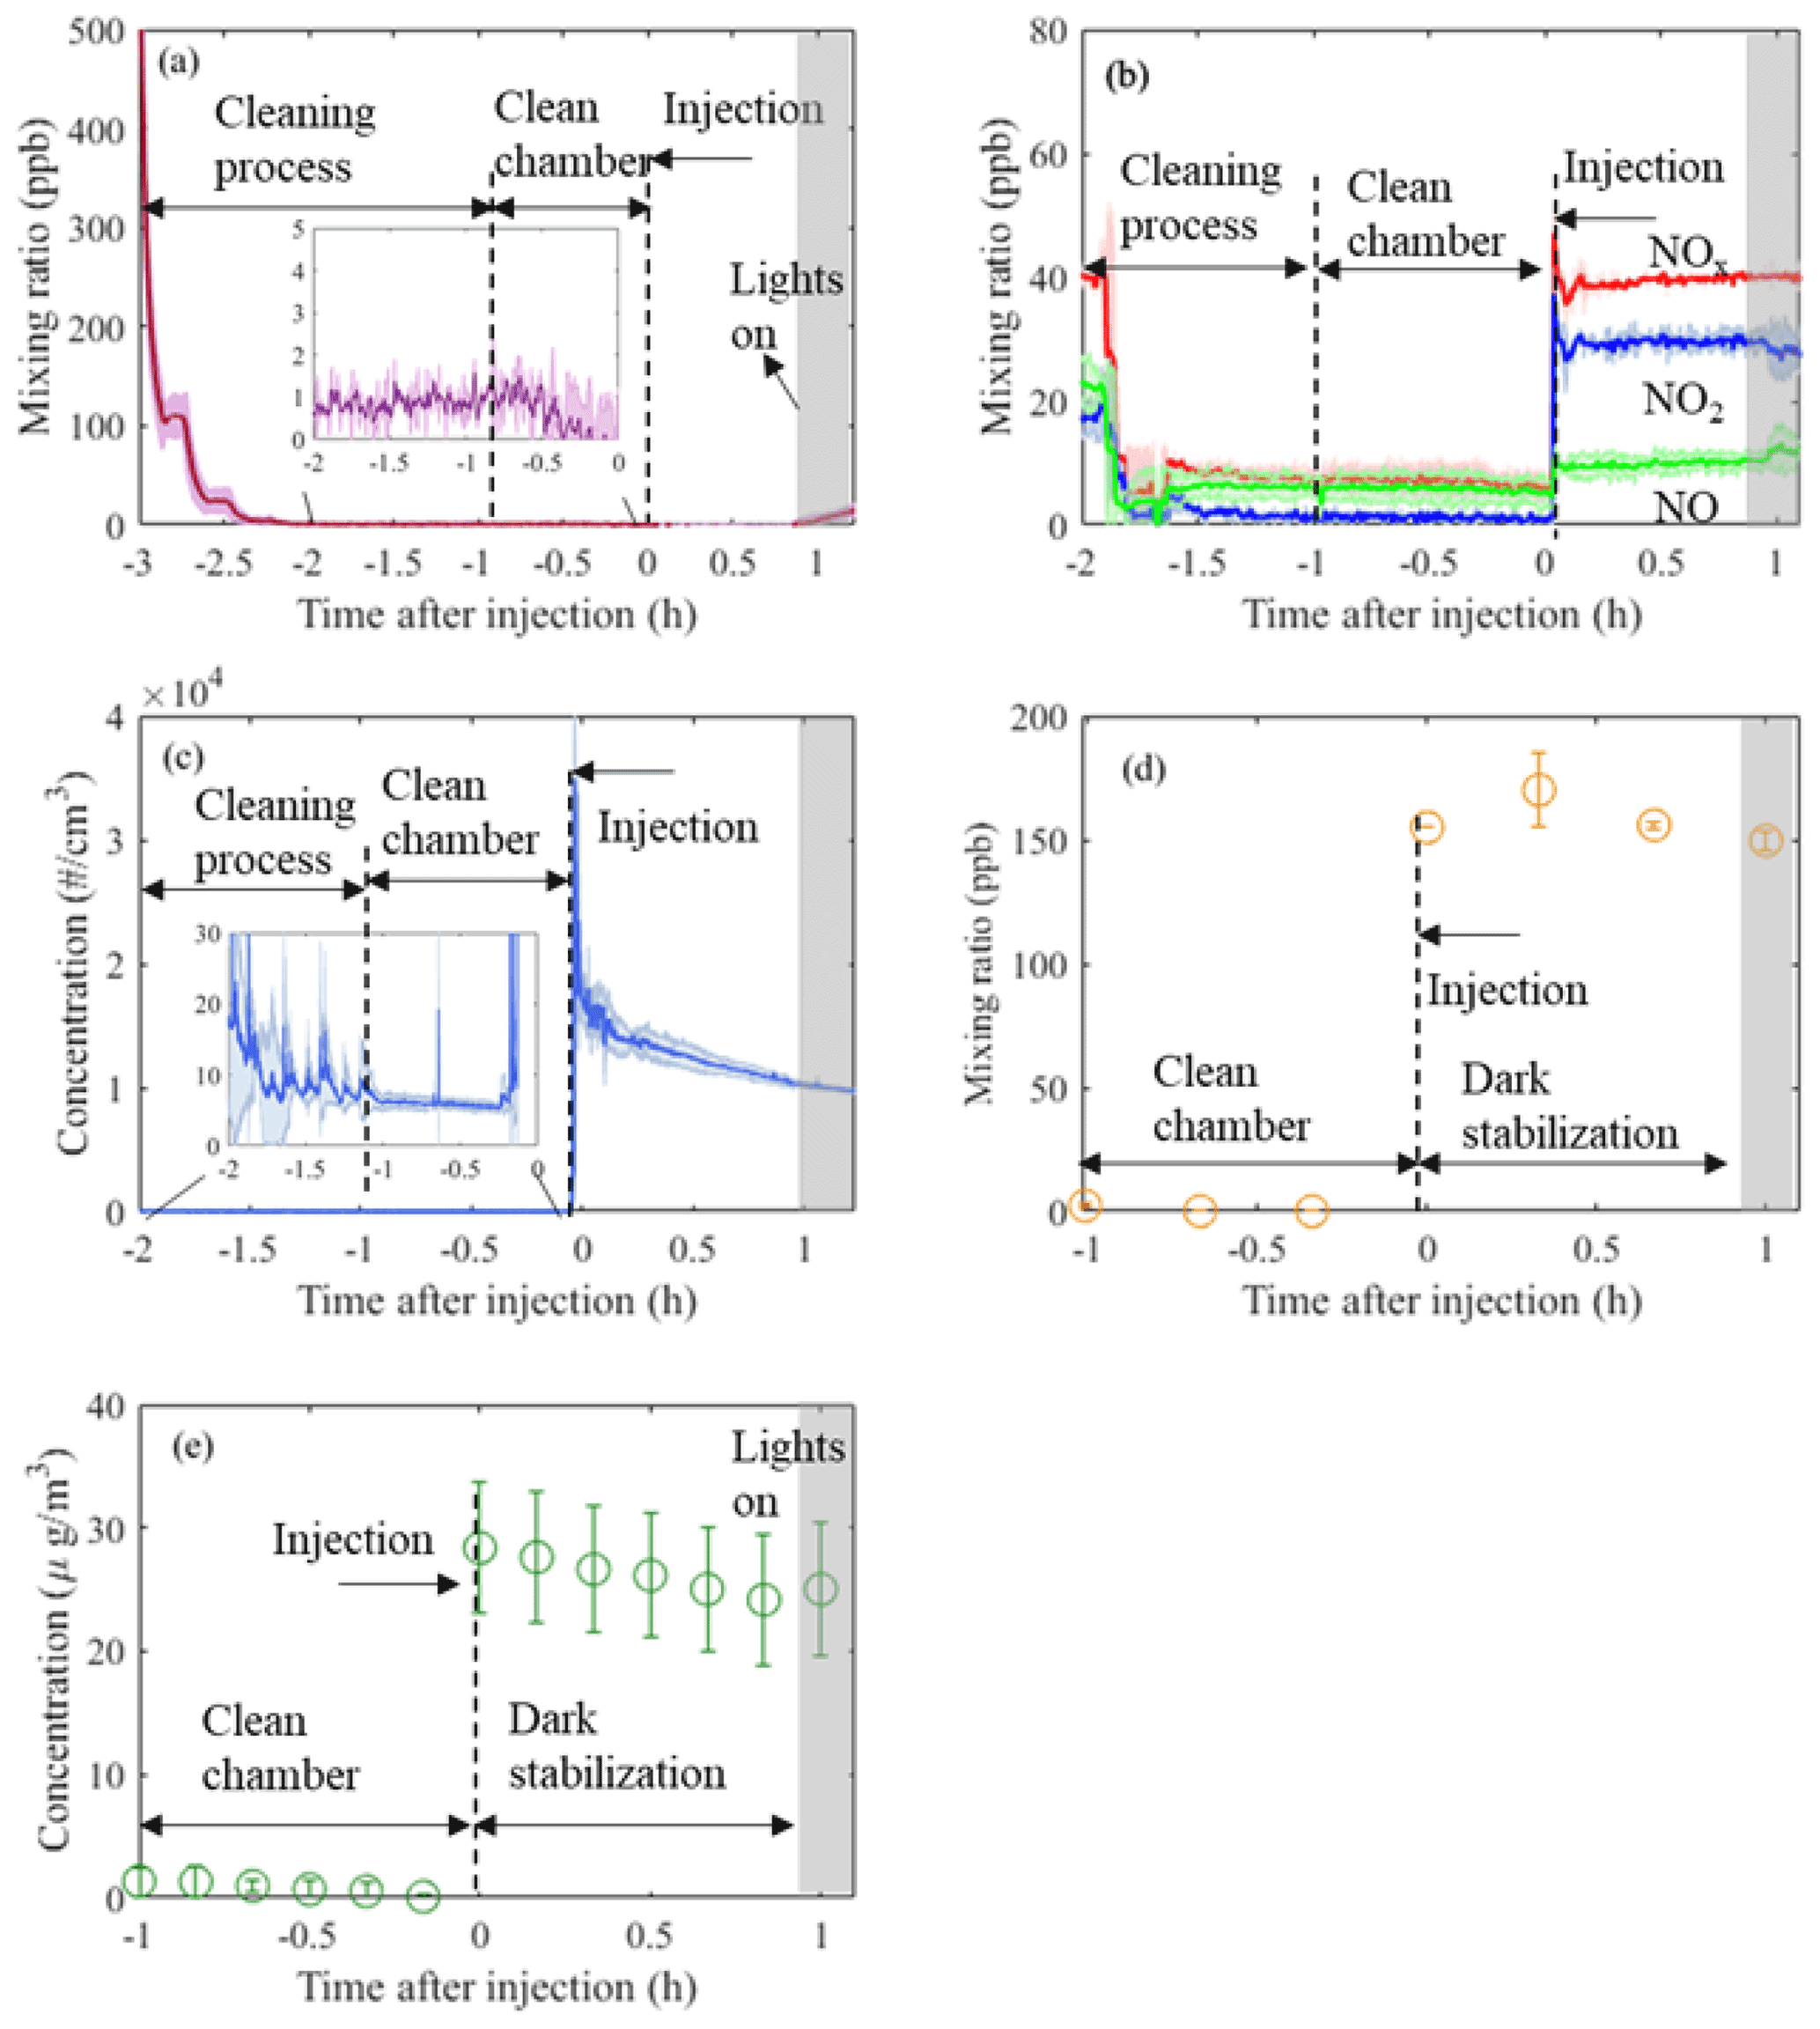
Figure 2Time series (mean±1σ, n=3) of O3 (a), NOx (b), particle number (c), VOC (α-pinene; d), and particle mass (e) from three identical experiments conducted in the MAC. Annotations provide information of the related process occurring in the chamber at each time point, normalised to the injection time of the reactants. Cleaning process duration is ∼2 h, while subsequently the chamber is left with clean air for about 1 h prior to the addition of the reactants (“clean chamber”). After the addition of the reactants, the chamber is stabilised in the dark for another hour (“dark stabilisation”) before the lights are turned on.
These procedures ensure a clean environment is provided in the MAC prior to SOA experiments. Gaseous and particle time series before and after injection of reactants in three α-pinene photo-oxidation experiments in the presence of ammonium sulfate (AS) seeds are shown in Fig. 2. As can be observed from Fig. 2a and b, during the cleaning cycle the mixing ratios of NOx and O3 are sharply decreasing from ∼40 and ∼500 ppb, respectively, down to <10 and <1 ppb, respectively, during our automated filling cycle in less than an hour. Similarly, the particle number and mass concentration decreases down to <10 particles cm−3 and 0 µg m−3, respectively, prior to the injection of the reactants to chamber (Fig. 2c and e); the mixing ratio of a selected VOC (α-pinene) also decreases to 0 ppb (Fig. 2d). Furthermore, after ∼3 h of illumination in our cleaned bag (i.e. clean air plus light experiments) the particle number and mass concentrations remain at the background levels (see Fig. S1 in the Supplement). This shows that our overall chamber gas-phase background is sufficiently low to prevent the formation of particles in the presence of light and in the absence of reactants. Overall, before the addition of the reactants to the MAC, our automated cleaning procedure ensures rapid cleaning that results in repeatedly low background concentrations.
2.8 Instrumentation
A range of instruments can be used to measure the physical and chemical properties of the chamber air, as shown in Table 1. The table is separated into two parts, displaying the core instrumentation, which is permanently fixed at the chamber, as well as the additional instrumentation, which can be coupled to the chamber and used on demand. All the instruments sample from a number of ports in the manifolds, equipped with stainless steel or PTFE tubing extending to the middle of the chamber.
NO and NO2 are measured using a NOx Thermo 42i chemiluminescence analyser. O3 is measured by an Thermo 49C analyser. Both NOx and O3 analysers are regularly calibrated using certified cylinders and an ozone calibrator, respectively. Water-based condensation particle counters (wCPCs; model 3785 and 3786) have been selected as core instrumentation operating in the chamber room to avoid the interference of the volatile working fluid (e.g. butanol), usually found on other CPC units, diffusing into the chamber. A wCPC is being used to measure the total particle number concentration in the chamber, and the other is coupled to a differential mobility analyser (DMA; Brechtel Inc) as part of a custom-built differential mobility particle sizer (DMPS) system to measure particle size distributions in the 40–600 nm range. The DMA uses filtered chamber air as sheath flow to maintain the gas–particle equilibrium during the measurements.
The chamber is equipped with a removable 47 mm filter holder, which is located at the flushing line of the chamber (see Fig. 1) and can be loaded with the desired substrate and enable the sampling of the entire contents of the chamber at the end of each experiment at a high flow rate (3 m3 min−1). In such a way, adequate amounts of particulate mass can be collected for subsequent off-line analysis.
A selection of additional instrumentation that is shared within the Centre for Atmospheric Sciences (CAS) group at the University of Manchester is potentially available to be used on demand. Briefly, oxygenated VOCs are measured using a high-resolution time-of-flight chemical ionisation mass spectrometer (CIMS; Aerodyne/Tofware) using iodide as a reagent ion. Non-refractory PM1 composition is measured using a high-resolution time-of-flight aerosol mass spectrometer (HR-ToF-AMS; Aerodyne), while oxygenated particulate organic composition is measured using the filter inlet for gases and aerosols (FIGAERO) when coupled to a CIMS. Total organic and elemental carbon concentrations are measured using a semi-continuous carbon aerosol analyser (OC/EC, Sunset Laboratory, Model 4). Selection of particles based on their mass or their aerodynamic size can be achieved using a centrifugal particle mass analyser (Cambustion) and an aerodynamic aerosol classifier (Cambustion), respectively. Particle hygroscopicity and volatility are measured by a custom-built hygroscopicity tandem differential mobility analyser (HTDMA) and thermal denuder (TD), respectively, while cloud condensation nuclei (CCN) activity is measured by a CCN counter (Droplet measurement Technologies). Black carbon concentration and properties can be measured by a three-wavelength photoacoustic spectrometer and single-particle soot photometer (Droplet measurement Tech).
Routinely, additional instruments, such as a gas chromatograph coupled to a mass spectrometer (GC–MS), and a proton transfer reaction (PTR) ionisation scheme were added to the MAC as part of collaborative work to measure VOC concentrations (Alfarra et al., 2013; Wyche et al., 2014, 2015). Similarly, offline particle analysis using liquid chromatography tandem mass spectrometry (LC–MS/MS) and two-dimensional GC–MS (2D-GC–MS) have also been employed occasionally to probe the chemical characteristics of the SOA particles (Hamilton et al., 2011; Wyche et al., 2015).
This section describes the characterisation of each element of the chamber with relevance to the operation and influence on and interpretation of the experimental results.
3.1 Temperature and relative humidity
The temperature in the MAC is controlled by the AC system, which compensates the releasing heat from illumination system. The calibrated dew point hygrometer (EdgeTech sensor) is used as a reference for Sensirion capacitance sensors during dark conditions (no irradiation of the chamber), where there is no influence of temperature gradient caused by the light sources. The dark experiment at a set temperature of 16 ∘C and two photo-oxidation experiments at different set points of relative humidity (40 % and 70 %) and a set temperature of 25 ∘C were conducted to examine the temperature and relative humidity homogeneity of the chamber.
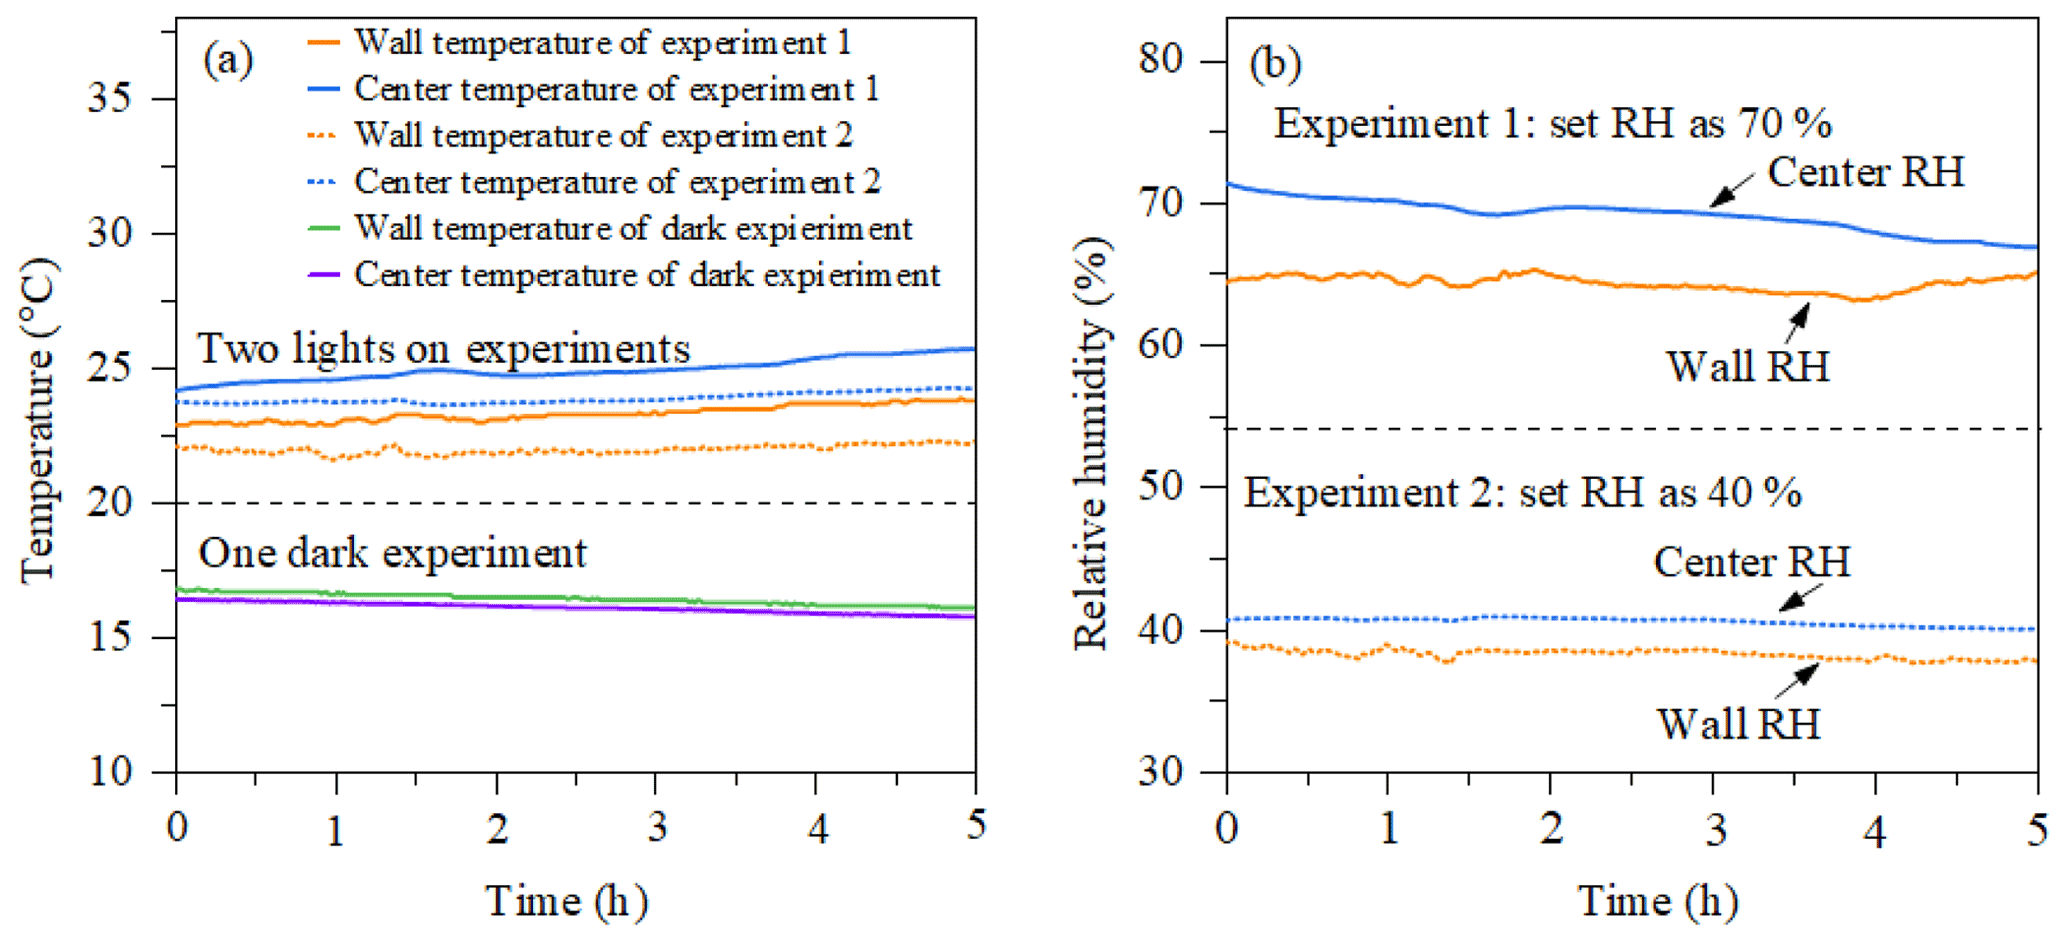
Figure 3(a) Temperature as a function of time measured by the EdgeTech (wall temperature) and Sensirion (centre temperature) in a dark experiment and a photo-oxidation experiment. (b) RH as a function of time in the two photo-oxidation experiments.
Figure 3a shows the evolution of temperature at the chamber wall and at the centre of the chamber measured by the EdgeTech and one Sensirion sensor, respectively, during dark and photo-oxidation experiments. The temperature accuracy of sensors is ±0.3 and ±0.2 ∘C for the Sensirion sensor and EdgeTech sensor at 25 ∘C, respectively. In photo-oxidation experiments, the temperature in the chamber centre (24±1 ∘C) is stable and slightly higher than that in the chamber wall (23±1 ∘C). Such a gradient might be caused by the cooler air between the chamber wall and enclosure and incomplete mixing. The temperature in dark conditions shows good agreement with the two sensors, around 16 ∘C. Figure 3b shows the relative humidity results of the two photo-oxidation experiments measured by the Sensirion and EdgeTech sensors. In the light experiment, the RH in the centre of the chamber measured by the Sensirion capacitance sensor (40±1 % and 70±1 %) was slightly higher than the RH at the wall of the chamber measured by the EdgeTech hygrometer (39±1 % and 65±1 %). In the light experiments, it appears that both the temperature and humidity were higher in the centre of the MAC than at the wall, while in the dark experiments these differences were negligible as they were within the uncertainty in our measurement. A likely explanation for this unexpected behaviour in the light experiments can be possibly due to the radiative heating of the sensors in these experiments, which could result in an overestimation of the RH.
3.2 Mixing
NO, NO2, and NOx are selected as gas tracers to test the gas-phase mixing time inside the reactor. There are no fans or other equipment inside the chamber; however, NOx is injected as NO2 into the 3 m3 min−1 (=50 L s−1) flow through the 50 mm diameter inlet at a velocity of approximately 25 m s−1, inducing near-instantaneous mixing throughout the chamber. Throughout an experiment, the forceful agitation of the Teflon walls by the AC flow between the enclosure and chamber continuously maintains mixing inside the reactor. As shown in Fig. 2b (for clarity see Fig. S2a in the Supplement), the mixing time for NO, NO2, and NOx gases is on the order of a few minutes. Typically, the mixing time in atmospheric-simulation chambers falls within the range of minutes, for example, 1 min in the CESAM (Multiphase Atmospheric Experimental Simulation) chamber with 4.2 m3 (Wang et al., 2011) and 2 min in the GIG-CAS chamber 30 m3 (Wang et al., 2014)
Non-acidic seed particles (ammonium sulfate, AS) were chosen to examine the mixing time of particles in the chamber. Briefly, seed particles were injected into the seed aerosol residence chamber (Fig. 1) and mixed for 1 min and subsequently introduced into the chamber at the flow rate of 3 m3 min−1. Figure 2c (for clarity see Fig. S2b) shows the number concentration of particles measured by the wCPC as a function of time, which shows that the mixing time for seed particles in the chamber is around 2.5 min. This time is comparable with the gases' mixing time in the chamber. Furthermore, as can be seen, after the addition of NOx and seed aerosol to the chamber and the air condition is turned on, the mixing ratios of NOx remain constant within a few minutes after their injection. Similarly, the number concentration of the seed aerosol shows some fluctuations over the first ∼10 min, and they appear to stabilise and be subjected to the expected losses to the chamber walls. The stability in the measured concentrations of those tracers provides evidence for the effectiveness of the mixing of the components of the MAC, while the low standard deviations between the experiments (shown as shaded areas) further demonstrate the repeatability that can be achieved in our system.
3.3 Light intensity
The artificial radiation in the MAC has a broad radiation distribution owing to the chosen combination of illumination sources, producing irradiation over the wavelength range 290–800 nm to capture all wavelengths of the atmospheric actinic spectrum. Figure 4 shows the total actinic flux measured in the MAC (red line) multiplied by 3.5 compared with the Manchester midday clear-sky measurements on a June day. The total actinic flux in the MAC was measured the centre position of chamber bag (150 cm apart from the arc lamps on both vertical and horizontal axes).

Figure 4Total actinic flux spectrum in the MAC compared to the ambient light spectrum obtained in the city of Manchester (UK) midday with a clear sky in June 2015.
The photolysis rate of NO2 (jNO2) estimated in steady-state actinometry can be used as a confirmation of the light intensity in the chamber (Hu et al., 2014) measured by direct spectral radiometry. Such actinometric measurements were carried out by injecting NO2 into the chamber and irradiating for several hours, measuring the concentration of NO, NO2, and O3 continuously. A series of NO2 actinometry experiments were conducted with ∼70 ppb NO2 injected into the chamber and irradiated for more than 3 h, with the temperature and humidity maintained at around 25 ∘C and 50 %, respectively. The photolysis frequency of NO2 is calculated from
where is the rate constant of the reaction of O3 and NO ( at 298 K) (Atkinson et al., 2004).
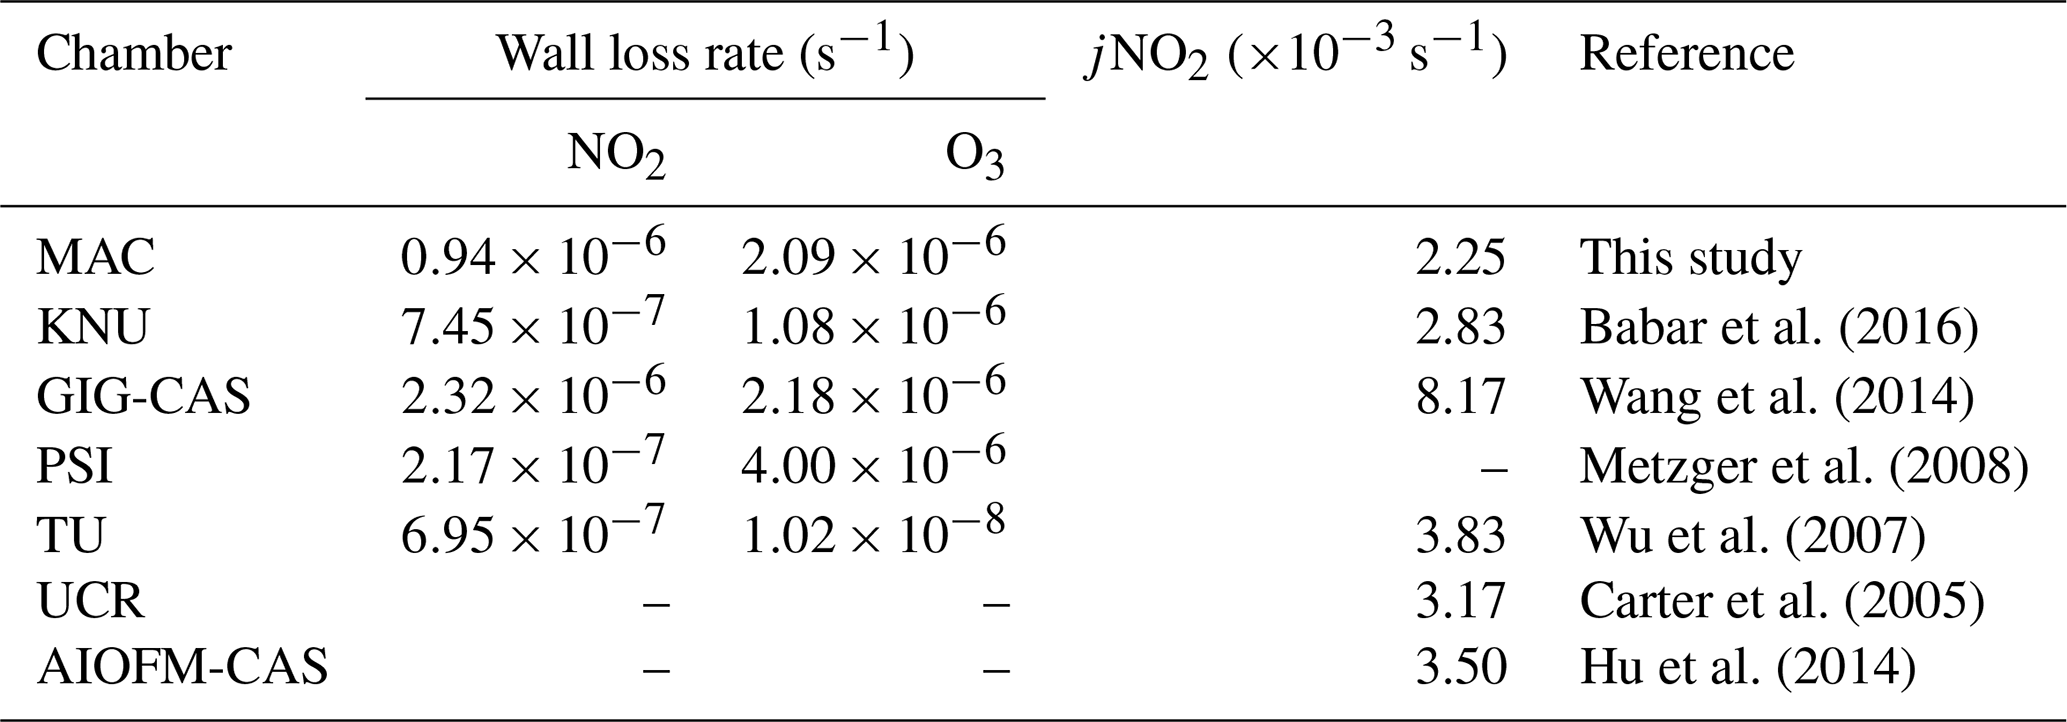
In the MAC, the photolysis rate of NO2 (jNO2) as derived from our steady-state actinometry experiments was comparable, within our measured variability, with that directly measured from the integrated absorption across the measured wavelengths (2.25±0.4 vs. s−1, respectively). Given that the jNO2 obtained by the actinometry experiments is an average and is estimated based on the assumption of photostationary state for trace gases in the bag, while the spectral radiometry is a point measurement in an imperfect integrating sphere, which could not be representative of the whole chamber, these results are in reasonable agreement. The integrated jNO2 measured by spectral radiometry in the ambient Manchester on clear sky over the summer was s−1 but had a comparable light spectrum to that measured in the MAC. The values obtained in the MAC are more similar to those reported previously over the wintertime at Finokalia station, Greece (Gerasopoulos et al., 2012), and are generally comparable with those obtained across the broader simulation chamber community, as shown in Table 2.
Table 2NO2 and O3 wall loss rates as well as jNO2 obtained in this study and the literature.
3.4 Wall loss of gaseous compounds
Chamber wall adsorption had been shown to be a substantial source of gas losses inside Teflon bags (Wang et al., 2011) and will influence the gas-phase reactivity and SOA formation. In the MAC, the wall loss rates of NO2, O3, and several volatile organic compounds (α-pinene, toluene, 1.3.5-TMB, and limonene) were investigated by injecting known concentrations into the chamber and measuring their concentration decay for an extended period under dark conditions. An approximate 50 ppb concentration of NO2 and O3 at concentrations ranging from 120 to 350 ppb were injected into the chamber and monitored for 4 h, allowing sufficient time for a measurable decay. Selecting different concentration of O3 could assist in investigating the impact of their initial concentration on the wall loss rate in the MAC. For the wall loss experiments of volatile organic species, 50 ppb of each compound was injected into the chamber, with the decay monitored for ∼4 h. All the wall loss experiments of gaseous species were conducted under a T and RH of ∼25 ∘C and ∼50 %, respectively.
Measured first-order wall loss rates of selected gaseous species were calculated by considering their decay as a first-order process. The wall loss rates of NO2 and O3 were and s−1, respectively. Table 2 compares the wall loss rates of NO2 and O3 between the MAC and other chambers. The NO2 decay rate at the MAC was slightly higher than all the other chambers listed, except GIG-CAS, while the O3 decay rate of the MAC was higher than the TU and KNU chamber but lower than the GIG-CAS and PSI chamber.
The first-order wall loss rates of the selected anthropogenic and biogenic VOCs were s−1 for α-pinene, s−1 for limonene, s−1 for toluene, and s−1 for 1.3.5 TMB.
3.5 Wall losses of particles
Particles are deposited to chamber walls mainly due to natural convection, diffusion, gravitational settling, and electrostatic forces in addition to physical mixing (Crump et al., 1983; Pierce et al., 2008; Mcmurry and Rader, 1985). Several different approaches have been proposed to determine and account for these losses to the chamber walls that are largely size-dependent (Charan et al., 2019). Most commonly, the particle wall losses are determined by injecting particles with measurable sizes into the chambers and subsequently measuring their size-resolved loss rates by treating the decay as a first-order process (Murphy et al., 2006; Zhang et al., 2007) A series of experiments were conducted to investigate the size-resolved particle lifetimes under various humidity and mixing conditions using AS seed, which was introduced to the chamber and left in the dark at the desired RH and temperature conditions for ≥4 h. An initial seed concentration of 50–100 µg m−3 was used with a modal diameter of ∼100 nm. The size-resolved concentration of the AS seed was monitored using a DMPS at 40–600 nm range, with a 10 min scanning time. Here, in line with the literature (Cocker et al., 2001b; Donahue et al., 2012; Gallimore et al., 2017; Smith et al., 2019), the particle wall loss rate was retrieved by fitting an exponential function to the decay of the particle number in each size bin of the DMPS to obtain a size-resolved decay rate coefficient. A comparison between the application of different particle wall loss correction methods is shown in Sect. 3.5.1.
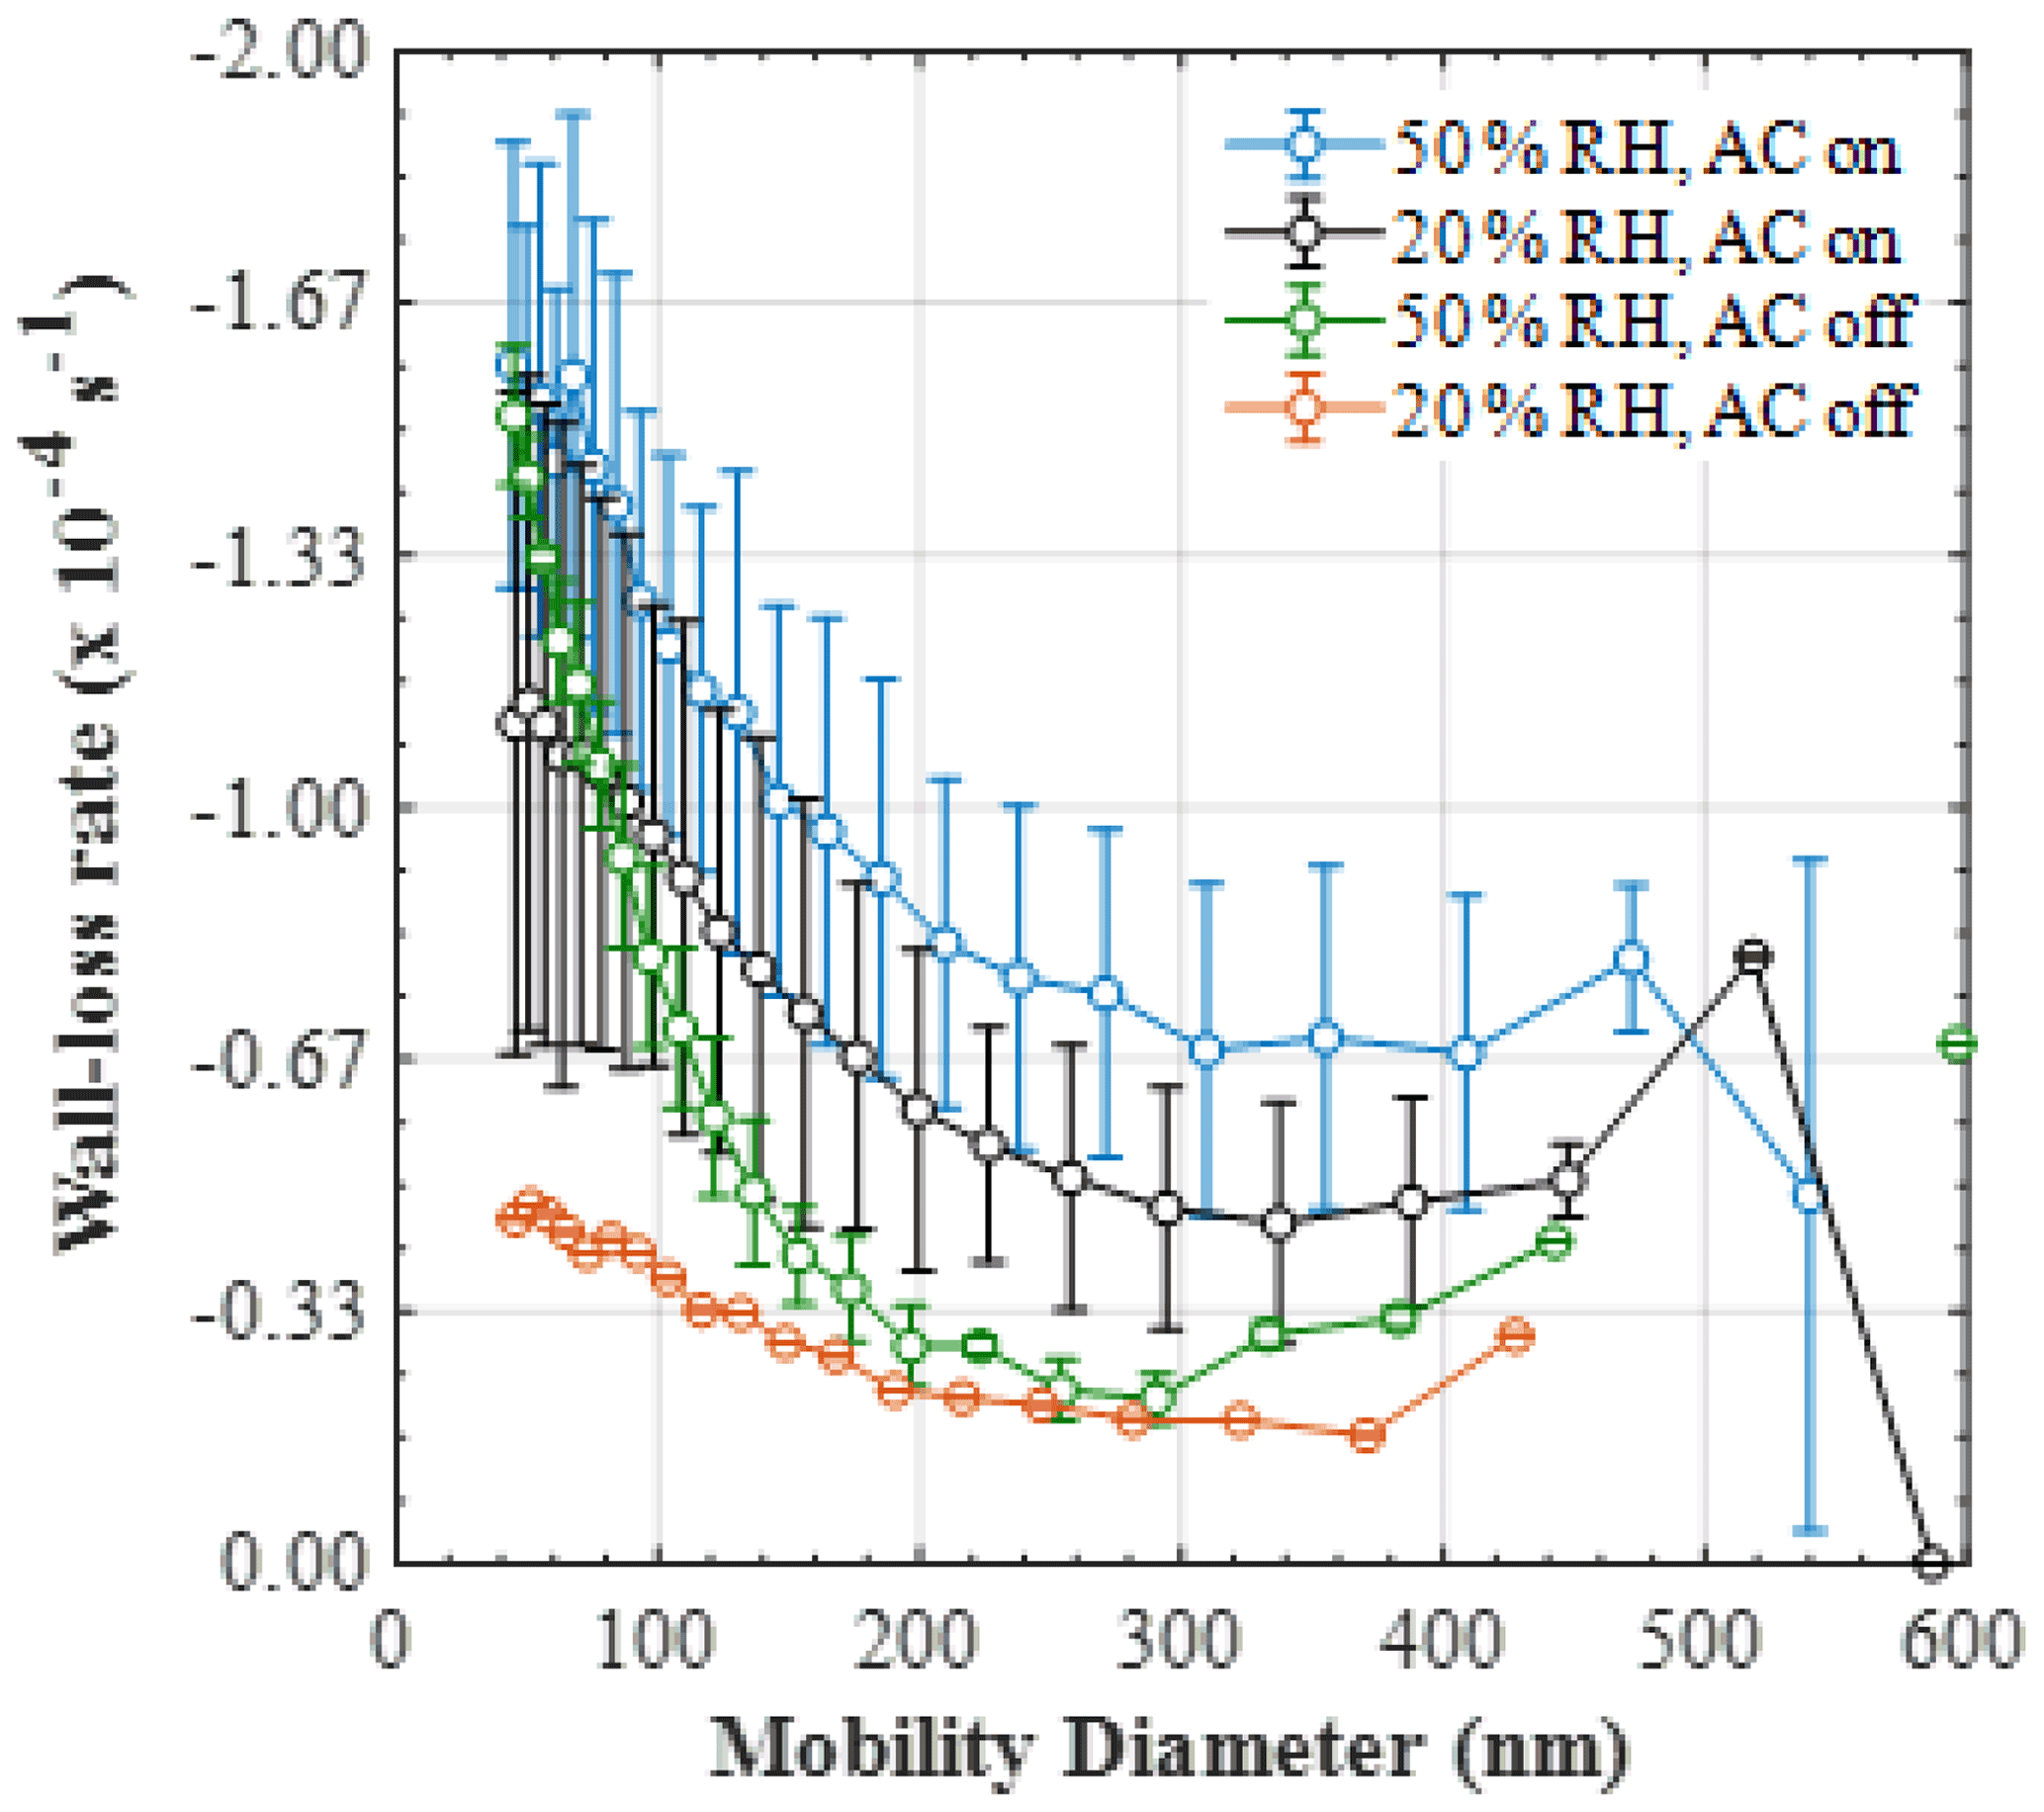
Figure 5Mean (±1σ) size-resolved wall loss rate (s−1) of particles in the MAC at various relative humidities and mixing conditions (50 % RH and mixing, n=9; 20 % RH and mixing, n=5; 50 % RH and no mixing, n=3; 20 % RH and no mixing, n=1).
The mean (±1σ) size-resolved wall loss rates (s−1) of particles in the MAC at various relative humidity and mixing conditions are shown in Fig. 5. The size-resolved particle wall loss rate in all experimental types showed a decreasing trend with particle size. In the size range measured here, such behaviour has been observed previously in chambers with varying volumes (Wang et al., 2018) and was attributed to the high diffusivity of the particles in the range below 100 nm, in addition to the possible contribution of coagulation when particle number concentrations of the small-sized particles are high. Moreover, a considerable scatter in the data obtained under our typical experimental conditions was observed (i.e. at 50 % RH and with the AC on). The large deviations in the size-resolved particle wall loss rates can be possibly attributed to the changes in the chamber behaviour, considering that the experiments averaged here were conducted sporadically over a large time period (2017–2019) and under different conditions of the bag. The latter is investigated further in Sect. 5. Alternatively, such deviations could be also attributed to particle and/or chamber charging effects (Charan et al., 2019). More specifically, considering that the AS particles generated in all of our experiments were not neutralised prior to entering the chamber, the potential charge distribution of the particles could have been varying, with consequent implications to the particle losses. Similarly, Teflon chambers are known to acquire charge when in contact with non-conductive surfaces, in turn affecting the particle losses to the walls. In spite of the MAC being suspended and its operators having minimal to no contact with the bag, it is challenging to experimentally assess the potential effects of the chamber charging on the particle wall losses over such a large time period.
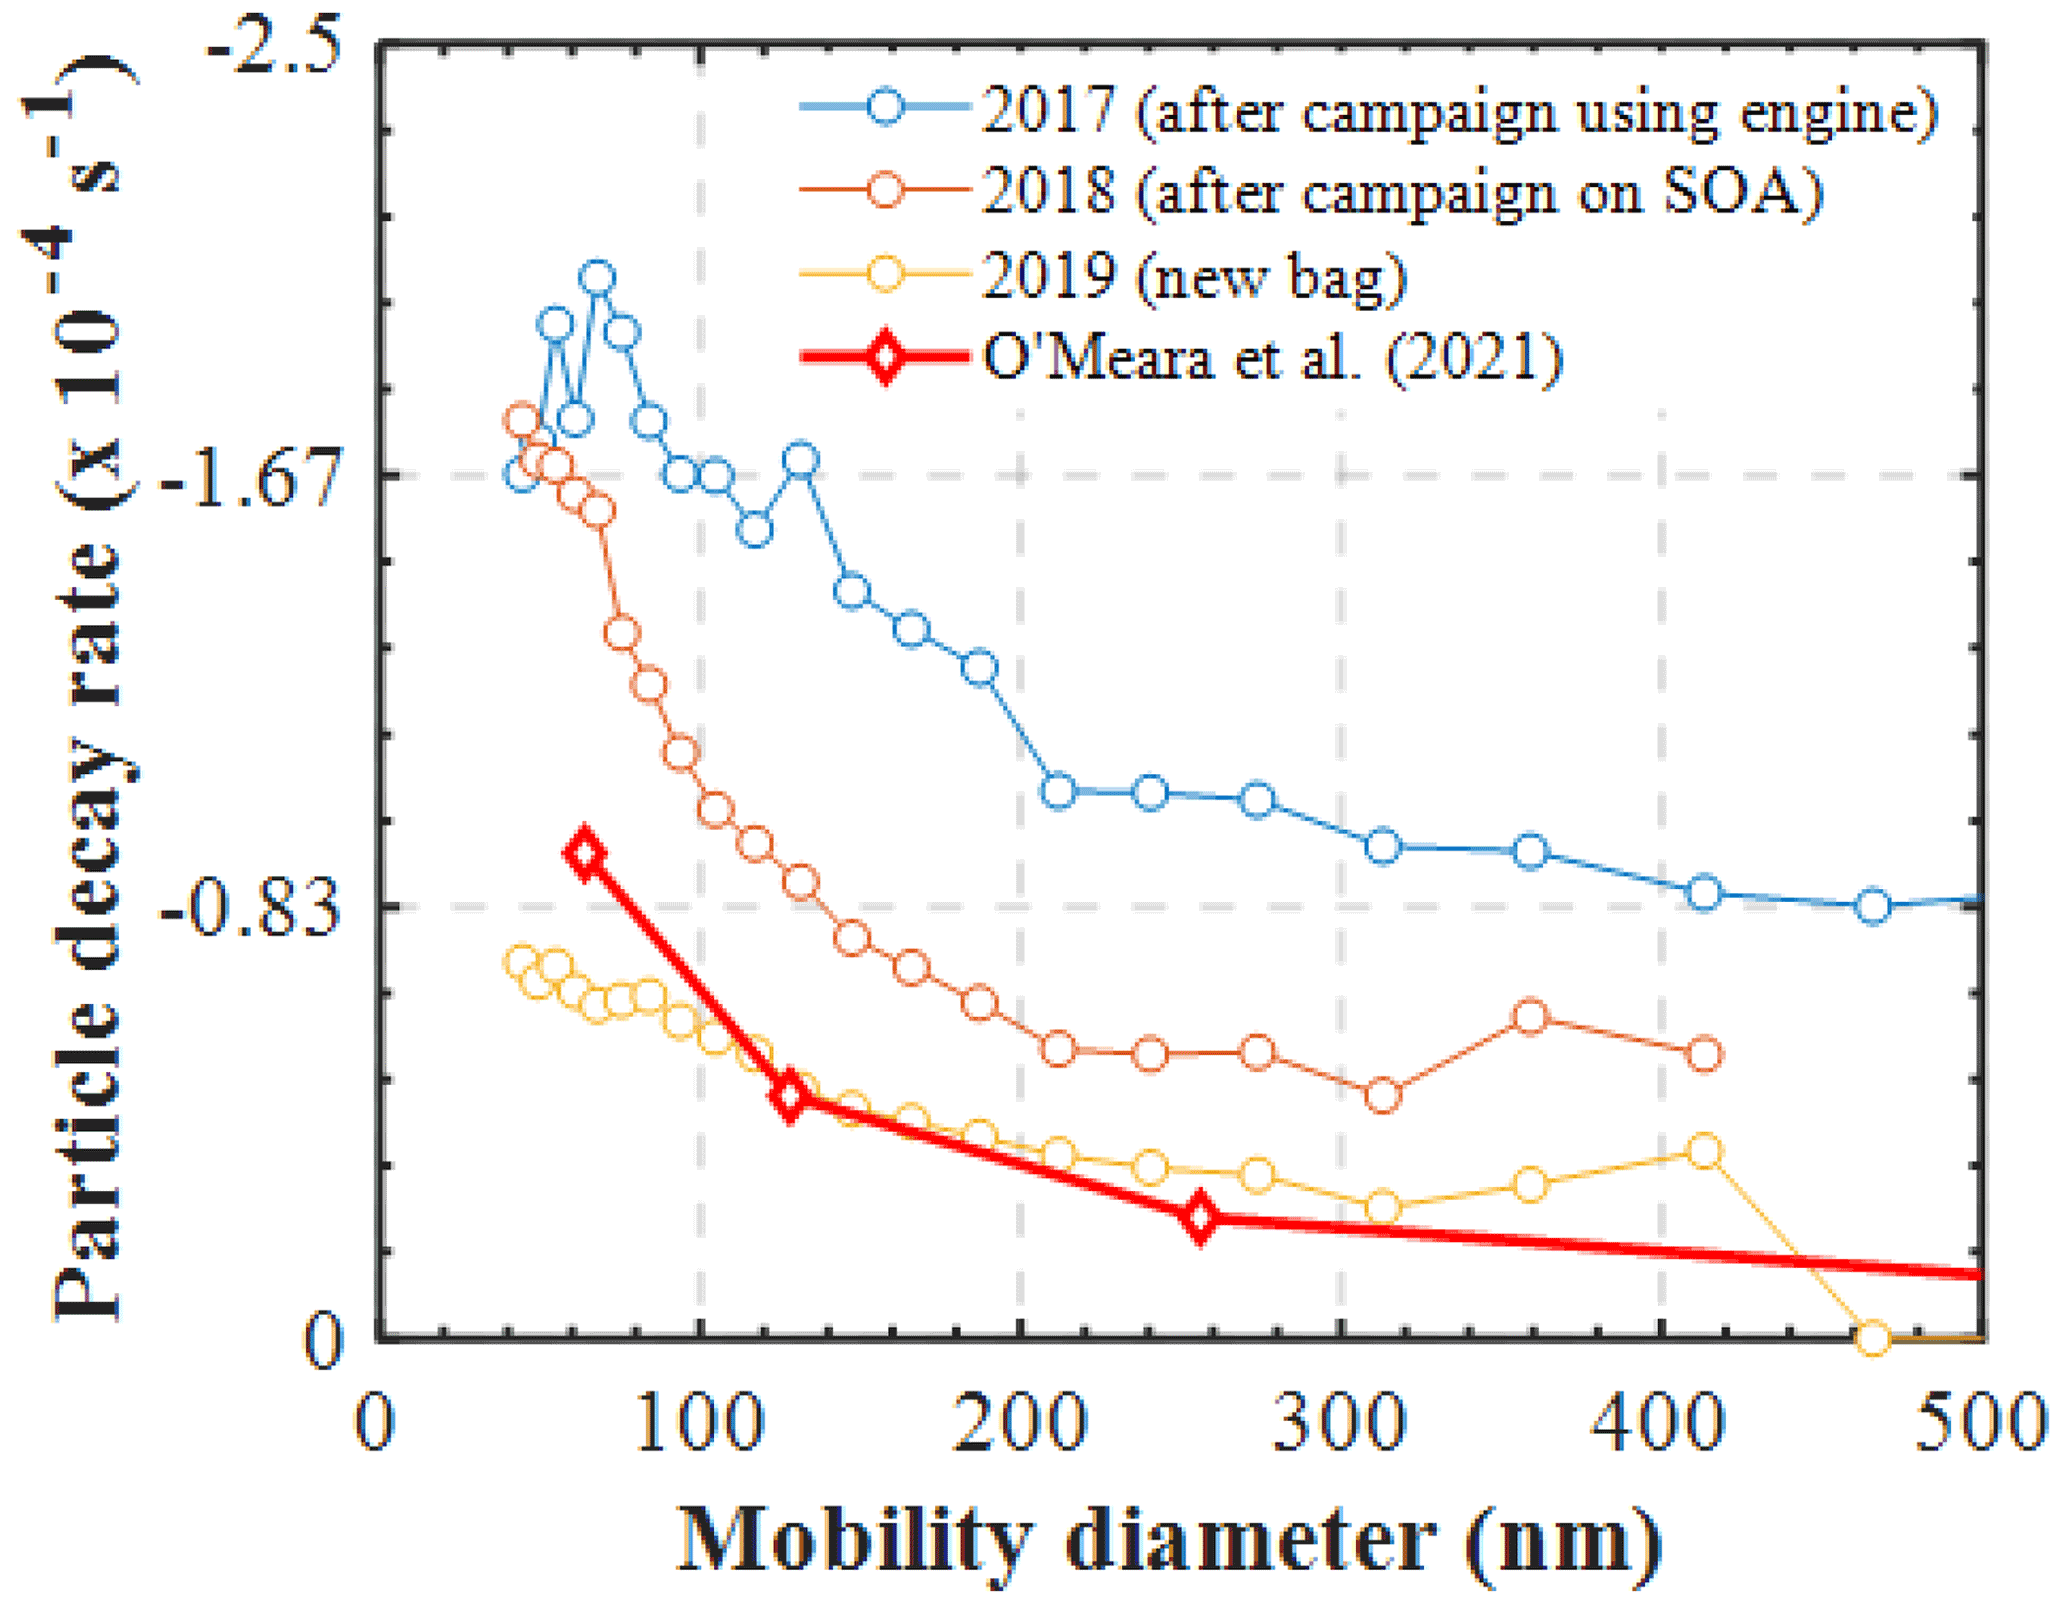
Figure 6Measured size-dependent particle decay rates (s−1) in characterisation experiments (RH=50 %) conducted under different conditions of the bag. The modelled particle losses in a nucleation experiment are shown for comparison (O' Meara et al., 2021).
However, the combination of our experimental results presented in this study with those presented earlier using our newly developed PyCHAM model (O'Meara et al., 2021) can provide some further insights on the latter matter. Figure 6 shows the measured size-resolved particle decay from several identical wall loss characterisation experiments (i.e. ammonium sulfate seed in the dark), conducted over a span of 3 years and under various conditions of the MAC. Additionally, the size-resolved wall loss rates that were required to reproduce the SOA formation in the limonene nucleation experiment presented in the O'Meara et al. (2021) study are also shown. Evidently, the variation in the measured loss rates of the particles nebulised in a similar manner in the MAC as a function of the chamber bag history can be substantial. Interestingly, the modelled particle losses that required a nucleation experiment to be reproduced, where no induced charge of the particles is expected, are comparable with those measured in a new bag. What is more, the model of Mcmurry and Rader (1985) suggests that the differences in the wall loss rates of the particles having 0 and +1 charge can be as high as 2 orders of magnitude (or more) for particles of 100 nm in diameter (see Fig. 9 on O'Meara et al., 2021). Here, the observed differences between the potentially charged AS particles in the characterisation experiments were within the same order of magnitude as those modelled for a nucleation experiment, where no particle charge is expected. Therefore, this analysis suggests that neutralising the seed aerosols prior to injection into the MAC would have less of an effect than the usage history of the bag.
In either of the relative humidity conditions (e.g. 20 % and 50 %), the continuous agitation of the chamber walls due to the air circulation around the chamber from the AC affected the particle wall losses, showing higher wall loss rates compared to those where the AC was disabled. The enhanced particle wall losses when the AC was enabled can be possibly attributed to the turbulence caused by AC as the chamber walls agitate, causing the particles to deposit at higher rates (Trump et al., 2016).
The amount of the water vapour also affects the particle wall loss rate, with the experiments conducted under drier conditions having lower loss rates compared to those at moderate RH conditions; however the variability was quite high to unambiguously differentiate the results from both conditions. These results suggest that the experimental conditions can have a significant impact on the particle wall loss rates. Therefore, care should be taken when using the retrieved wall loss rates from such experiments to correct the SOA particle mass in experiments conducted under different environmental conditions.
3.5.1 Investigation of various particle wall loss correction methods to the SOA formation
As mentioned above, the retrieved size-resolved ammonium sulfate particle loss rates from characterisation experiments are commonly used to correct the SOA particle mass from VOC oxidation experiments (Ng et al., 2007; Fry et al., 2014; Nah et al., 2017). Several alternative numerical approaches have also been proposed (Wang et al., 2018; Pierce et al., 2008). Here, we compare two different approaches to correct the SOA particle mass from a β-caryophyllene photo-oxidation and a limonene ozonolysis experiment. More specifically, we use the size-resolved mass loss rates retrieved from the characterisation experiments (described in Sect. 3.5.) as well as the modelling approach proposed by Verheggen and Mozurkewich (2006). The results are summarised in Fig. 7. It should be noted that our aim here is not to investigate the characteristics of each method but rather to demonstrate their effect when correcting for particle wall losses in atmospheric-simulation chambers.

Figure 7Measured and wall-loss-corrected SOA particle mass using two different wall loss correction approaches for a β-caryophyllene photo-oxidation (a) and a limonene ozonolysis (b) experiment.
The different approaches clearly result in substantially different wall-loss-corrected SOA masses (Fig. 7). In all cases, the correction using the ammonium sulfate size-resolved wall loss rates resulted in greater differences compared to the Verheggen and Mozurkewich (2006) model. These differences can be, at least partly, attributed to the parameters accounted for in each method. The size-resolved particle correction applies the measured particle decay rates from the characterisation experiments to the decay of the particles in the SOA experiments. Effectively, in this method it is assumed that the losses of the AS particles in the characterisation experiments (from any loss process) are the same as those formed in the SOA experiments. On the other hand, the Verheggen and Mozurkewich (2006) model employs inverse modelling to simulate the particle wall losses based on diffusion and gravitational settling, while the losses due to coagulation are indirectly inferred, and the eddy diffusion and the turbulent kinetic energy are treated as empirical parameters based on the Crump et al. (1983) model. Therefore, the differences between the two approaches could be partly attributed to the particle losses due to coagulation, which is indirectly accounted for in the Verheggen and Mozurkewich (2006) model, as opposed to the size-resolved correction. Alternatively, considering that the seed aerosol generated in our experiments was not neutralised, the particle decay rates measured in the characterisation experiments account for any potential influences of the particle charge on the decay rates of the particles, as opposed to the Verheggen and Mozurkewich (2006) model, thereby possibly further contributing to observed discrepancies. Clearly, treating the particle losses to atmospheric-simulation chambers is not a trivial task, and this could have substantial impacts for the reported SOA yields.
3.6 Chamber wall reactivity
The chamber wall reactivity aims to describe the chamber wall activity such that it can be directly used as a data set in future computer modelling to simulate the chamber experiments. A set of experiments were conducted, including simulating clean air and dark decay of NO2 and O3. Four non-elementary hypothetical reactions and relevant parameters used in the model are listed in Table 3. The parameters for the NO2 and O3 formation rate from the Teflon walls were calculated based on the off-gassing experiments under light irradiation conditions for at least 3 h of reaction. The initial concentrations of NO2 and O3 in the chamber were varied from 0 to 8 ppb. The light-induced formation of NO2 and O3 from the chamber walls was and s−1, respectively.
Table 3Chamber wall activity and rates for chamber-dependent reactions.

a Production rate of gaseous species from wall under light conditions (P w, l). b Loss rate of gaseous species to wall under dark conditions (L w, d).
The decrease in NO2 and O3 in the gaseous phase under dark conditions for the new chamber bag is mentioned in Sect. 3.4. Gas-phase molecules can be lost to the boundary layer of the surface chamber wall by molecular diffusion and macroscopic mixing, while their reactive uptake by the Teflon film and any deposited material is also possible. Teflon film can act as a reservoir for organic vapour deposition during chamber experiments, which may contribute to O3 loss by oxidation. Furthermore, the organic compounds deposited can act as absorptive mass, in turn influencing the mass transfer from the gas phase to the walls (Charan et al., 2019).
To evaluate the chamber facility for the purposes of studying SOA production and transformation, α-pinene photochemistry experiments were conducted in the MAC. The initial experimental conditions are shown in Table 4. During the experiments, chemical composition (NH4, SO4, NO3, OA) in the particle phase and α-pinene in the gas phase were monitored by the HR-ToF-AMS and semi-continuous GC–MS, respectively. The measured SOA mass by the HR-ToF-AMS was corrected due to the non-unit collection efficiency of the instrument following standard procedures in previous studies (Jimenez, 2003; Jayne et al., 2000; Allan et al., 2003, 2004) and chamber wall loss effects (Wang et al., 2018).
Table 4Summary of initial conditions for α-pinene photochemistry experiments.
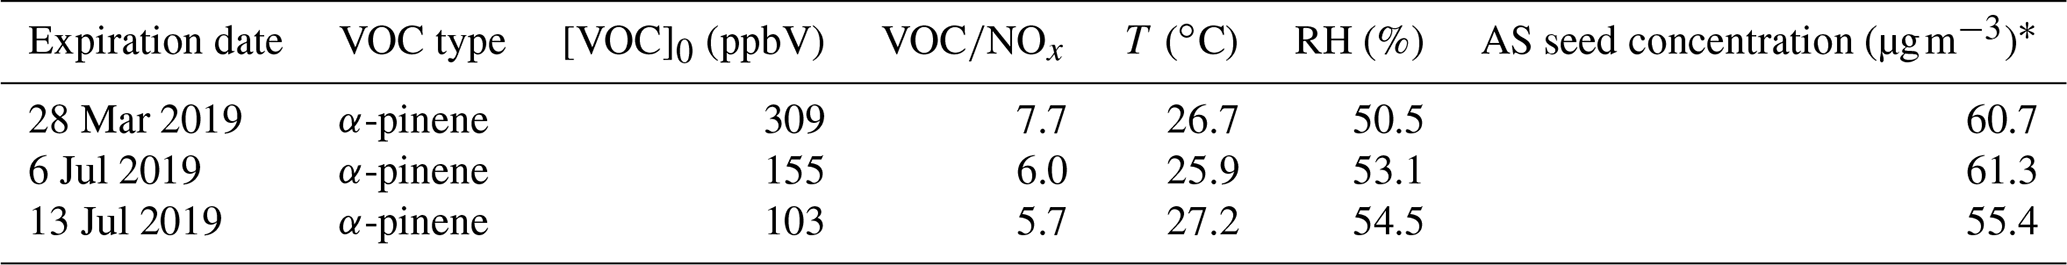
* Measured NR-PM (non-refractory particulate matter) mass concentration by HR-ToF-AMS with corrected collection efficiency (30 min average before lights on).
To compare with literature data, SOA yield (Y) was used as a proxy to evaluate SOA production (Grosjean and Seinfeld, 1989), defined as the SOA mass formation (ΔM0) from the reactive organic gas (ΔVOC) consumption as shown in Eq. (2).
Here, the SOA mass is wall-loss-corrected using the size-resolved wall loss rate of ammonium sulfate particles from the nearest characterisation experiment as described in Sect. 3.5.1. Odum et al. (1996) incorporated gas–particle partitioning theory (Pankow, 1994a, b) into SOA formation and calculated SOA yield from individual compounds, shown in Eq. (3).
Here, Yi represents the yield of compound i; αi is a stoichiometric factor representing the ratio of the molecular weight of product i to the parent VOC. Kp,i and COA are the partitioning coefficient of product i and the total absorbing organic mass (the same as ΔMo herein). Furthermore, Odum et al. (1996) successfully used a two-product model parameterising SOA yield and ΔMo as shown in Eq. (4). The α1, α1, Kp,1, and Kp,2 can be fitted upon yield curves.
The yield curves as a function of ΔMo for the three α-pinene experiments in this study and the comparison with literature data (Saathoff et al., 2009; Cocker et al., 2001a; Eddingsaas et al., 2012; Stirnweis et al., 2017) are shown in Fig. 8 (all yield curves are wall-loss-corrected). As expected from the absorptive partitioning, it can be seen that the SOA yield increased consistently with an increase in absorptive organic mass for the three α-pinene experiments in this study. Our results are qualitatively and quantitatively comparable with α-pinene photochemistry experiments conducted under different oxidant conditions (e.g. use of HONO and H2O2) and seed initialisations (no/acidic/neutral) in other chambers. They are also comparable with experiments conducted at different VOCNOx ratios in the range of 0.2 to 25 and AS and ammonium bisulfate (ABS) seed conditions (Stirnweis et al., 2017). Additionally, we use the two-product model to fit the yield curve of the three α-pinene experiments in this study, and the fitted α1, α1, Kp,1, and Kp,2 are 0.03, 0.34, 3.14×10⁶, and 0.02, respectively, as shown in Fig. 8 (solid black line). The fitted yield curve for α-pinene photochemistry with the aqueous AS seed in this study is comparable to the α-pinene ozonolysis without a seed (Stirnweis et al., 2017; Cocker et al., 2001a) but much higher than the ozonolysis with an aqueous seed (Cocker et al., 2001a).
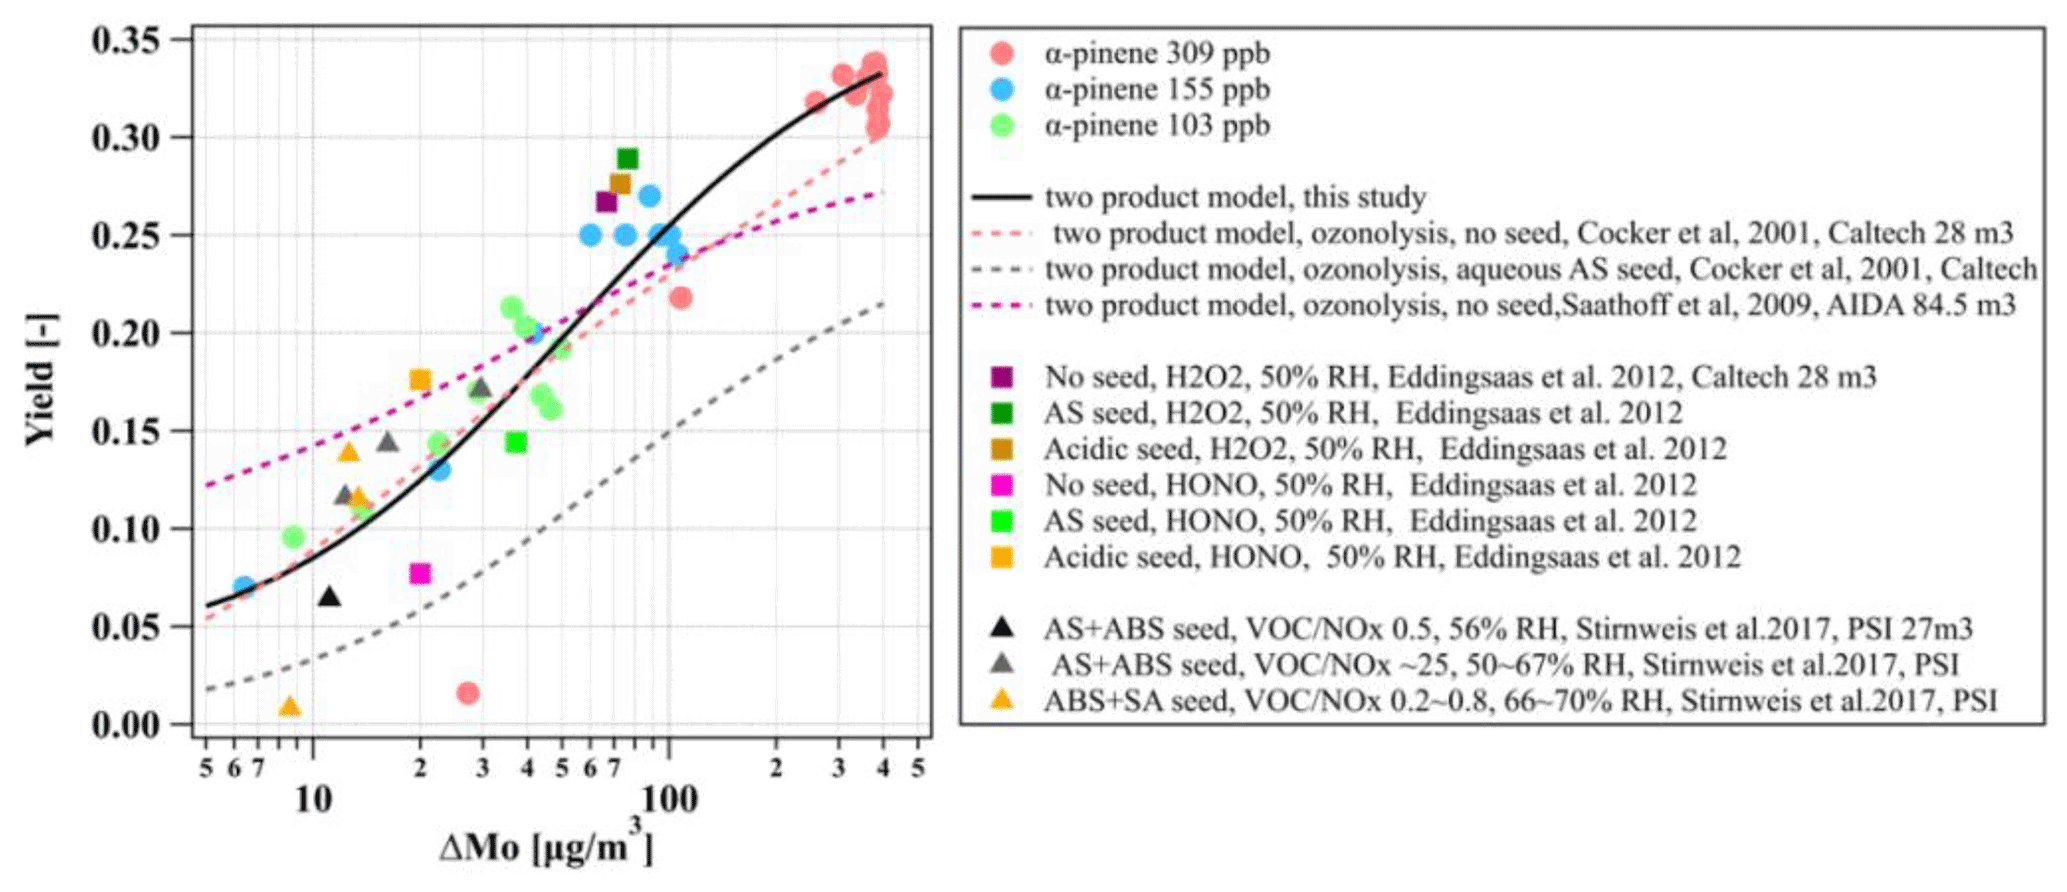
Figure 8Yield curves derived from the photo-oxidation of α-pinene on aqueous AS seed conducted in this study and from literature data (Cocker et al., 2001a; Saathoff et al., 2009; Eddingsaas et al., 2012; Stirnweis et al., 2017). All experiments are carried out under humid conditions. Lines represent the two-product model fit for yield curves.
It has been shown that organic vapours can condense on the Teflon chamber walls in a similar manner to the losses of particles (Matsunaga and Ziemann, 2010; Zhang et al., 2014; Krechmer et al., 2020). The deposition of those compounds on the chamber walls can be reversible (Matsunaga and Ziemann, 2010) or quasi-irreversible (Ye et al., 2016) and is proportional to each compound's volatility and chemical characteristics. Similarly, other atmospheric gases, such as HONO, have also been found to condense on chamber walls (Rohrer et al., 2005). The uptake of semi-volatile vapours from the chamber walls has been proven to substantially affect the oxidative chemistry and thereby the reported SOA formation potential (Zhang et al., 2014; Rohrer et al., 2005). It is therefore likely that both gaseous and particle deposition can lead to a build-up of contamination on chamber walls with time (Huang et al., 2018). It is not guaranteed that any cleaning procedures are completely effective, and it is important to consider the experimental history of a chamber when interpreting experimental behaviour (and particularly when comparing experiments conducted in different periods). To assess the effect of contamination from such sources on the chamber performance, we conducted the same characterisation experiments as those described in Sects. 3.3–3.5 in an extensively used Teflon bag after a series of experiments with high concentrations of particles and gases derived from diesel engines.
The photolysis rate of NO2 (i.e. jNO2) derived from photostationary-state calculations was found to be lower in the extensively used bag compared to a newly installed bag ( vs. s−1, respectively). This coincided with a substantial increase in the wall loss rate of NO2 and O3 that was observed in the extensively used compared to the newly installed bag ( vs. s−1 for the NO2 and vs. s−1 for the O3, respectively). At the same time, the wall production (i.e. off-gassing) of the same gases was decreased (0.12 vs. s−1 for the NO2 and 0.20 vs. s−1 for the O3). Unfortunately, spectral radiometry data are not available for the extensively used bag, which could help to identify whether the reduction in the jNO2 is attributed to the transparency of the walls over usage of the bag or the changes in the production and loss of gases from and to the chamber walls. In the absence of such information, we can only speculate that the changes in the jNO2 over the bag history could be attributable to the differences in the wall loss rates of these gases.
In addition to the changes in the decay rates of gases, similar changes were observed in the wall losses of particles. Figure 6 shows the measured size-dependent particle decay rates (s−1) in characterisation experiments conducted under different conditions of the bag. More specifically, characterisation experiments conducted in an extensively used bag after a campaign using diesel engine fumes, in a used bag after a campaign of SOA formation, and in a new bag are shown. Clearly, the size-dependent losses of the particles can be substantially affected by the condition and the usage of the bag. Wang et al. (2018) reported significant changes in the wall loss rates of particles after major maintenance activities in the area where the chamber was suspended and attributed those differences to the electrostatic forces caused by friction. In our set-up, the chamber is enclosed in a housing, and the operators have little to no contact with its walls, so it may be unlikely that this is the main cause for the changes in the particle wall losses over the bag usage history. Considering that the correction of the SOA mass and particle yield calculations are strongly dependent on the measured particle loss rates in characterisation experiments, at least for the MAC, it is recommended that more frequent particle and gas loss characterisation experiments be conducted to enable more reliable corrections.
In this work, the MAC facility was comprehensively described and characterised for the first time. The MAC is a batch reactor and showed good temperature and relative homogeneity, parameters that can influence the SOA formation and partitioning (Cocker et al., 2001a; Saathoff et al., 2009; Stirnweis et al., 2017). Although our reported experiments in this study were performed only under certain conditions, the results shown demonstrate that the MAC can provide controlled temperature and relative humidity conditions, which are important for any systematic chamber study. The MAC is, however, limited to an RH range of 25 %–80 % and temperature of 15–35∘C, owing to the heat generated by the lamps and the capacity of the AC unit.
Due to its explicit set-up, the generated light spectrum mimics the ambient solar radiation spectrum well, comparable to that in Manchester, yet having lower total actinic flux by a factor of ∼3.5. Furthermore, fast mixing times are effected by the injection of the reactants at high flow rates, while the air circulation around the chamber housing continuously agitates the chamber walls, resulting in sufficient mixing of its components during the experiments, but enhances wall losses.
The bespoke control system of the MAC allows the generation of automated procedures that can improve the duty cycle and enhance the comparability across experiments. Moreover, due to its design, gases and particles generated via a number of sources can be introduced to the chamber and studied in detail. In addition, its unique capability of transferring the whole contents of the MAC to the MICC provides the grounds for aerosol–cloud interaction studies (e.g. Frey et al., 2018).
Different wall loss rates of NO2 were observed between the MAC and other chambers, as shown in Sect. 3.4. Possibly, the wall loss rates of gaseous compounds are affected by experimental conditions (such as temperature and RH), mixing, and chamber sizes (Metzger et al., 2008; Wang et al., 2011). Importantly, we showed that the usage history can influence the wall loss of gases, with a higher wall loss rate of NO2 and O3, which may result in the lower jNO2 in an extensively used bag, as shown in Sect. 5. Higher particle decay rates were also observed in an extensively used bag after “dirty” experiments compared to a newly installed bag. It is more likely that the contaminated chamber walls may provide additional sinks to absorb more particles and gases irreversibly. Additionally, the various methods for the particle wall loss correction led to different wall-loss-corrected SOA masses, which in turn can have substantial implications for the derived SOA yields (Odum et al., 1996; Wang et al., 2018; Hoffmann et al., 1997), as shown in Sect. 3.5.1. This illustrates that using different approaches or experimental data sets to conduct such corrections may result in bias in the SOA yields (Cocker et al., 2001a; Saathoff et al., 2009; Stirnweis et al., 2017).
Our measured SOA yield curve from the photo-oxidation of α-pinene in the presence of seed particles appeared to be comparable with other studies that conducted ozonolysis experiments in the absence of seed particles (Cocker et al., 2001b; Stirnweis et al., 2017) but much higher than the ozonolysis with an aqueous seed (Cocker et al., 2001a), as shown in Fig. 8. However, it should be considered that the comparison of yield curves between different laboratories and facilities is quite complicated as there are many factors (seed or no seed, oxidants, relative humidity, VOCNOx ratios, wall loss correction methods, etc.) that will affect the yields curves. Also, the characterisation parameters of a chamber (e.g. gases and particle wall loss rates) may also play an important role in the SOA formation, as shown in Sect. 3.5.1. and discussed further above. Furthermore, the loss of condensable vapours to the chamber walls can result in a lower SOA formation even for high-seed-concentration conditions (Zhang et al., 2014).
Based on our results, regular characterisation experiments are recommended in order to track the chamber's performance while accounting for any potential changes to the interpretation of the results. Considering that the atmospheric-simulation chambers are composed of various materials, and they come in different designs, sizes, and shapes, in turn affecting their performance and behaviour, the comparability of their results should be a crucial priority of the scientific community. The results presented here highlight the need to develop a set of simple, standardised experiments and/or procedures that can be used for chambers across the globe in an effort to elucidate the characteristics of each facility and the interpretation of their results.
All the data used in this study are available upon request from the corresponding authors.
The supplement related to this article is available online at: https://doi.org/10.5194/amt-15-539-2022-supplement.
GM, MRA, AV, YW, MD and YS conceived the study. GM, MRA and SFT designed the MAC. SPO provided the modelling results. AV, YW, YS and MD conducted the experiments, the data analysis and wrote the manuscript with inputs from all authors.
The contact author has declared that neither they nor their co-authors have any competing interests.
Publisher's note: Copernicus Publications remains neutral with regard to jurisdictional claims in published maps and institutional affiliations.
This article is part of the special issue “Simulation chambers as tools in atmospheric research (AMT/ACP/GMD inter-journal SI)”. It is not associated with a conference.
The Manchester Aerosol Chamber was supported by the EUROCHAMP2020 research programme funded by the European Union's Horizon 2020 research and innovation programme under grant agreement no. 730997. Aristeidis Voliotis and Mao Du acknowledge the financial support from the Presidents Doctoral Scholarship from the University of Manchester. Aristeidis Voliotis acknowledges the support by the Natural Environment Research Council (NERC) EAO Doctoral Training Partnership. Yu Wang acknowledges CSC scholarship support. M. Rami Alfarra acknowledges funding support from the Natural Environment Research Council (NERC) through the UK National Centre for Atmospheric Science (NCAS). Instrumentation support was funded through the NERC Atmospheric Measurement and Observational Facility (AMOF).
This research has been supported by the Natural Environment Research Council through the Doctoral Training Partnership (grant no. NE/L002469/1).
This paper was edited by Jean-Francois Doussin and reviewed by two anonymous referees.
Alfarra, M. R., Hamilton, J. F., Wyche, K. P., Good, N., Ward, M. W., Carr, T., Barley, M. H., Monks, P. S., Jenkin, M. E., Lewis, A. C., and McFiggans, G. B.: The effect of photochemical ageing and initial precursor concentration on the composition and hygroscopic properties of β-caryophyllene secondary organic aerosol, Atmos. Chem. Phys., 12, 6417–6436, https://doi.org/10.5194/acp-12-6417-2012, 2012.
Alfarra, M. R., Good, N., Wyche, K. P., Hamilton, J. F., Monks, P. S., Lewis, A. C., and McFiggans, G.: Water uptake is independent of the inferred composition of secondary aerosols derived from multiple biogenic VOCs, Atmos. Chem. Phys., 13, 11769–11789, https://doi.org/10.5194/acp-13-11769-2013, 2013.
Allan, J. D., Jimenez, J. L., Williams, P. I., Alfarra, M. R., Bower, K. N., Jayne, J. T., Coe, H., and Worsnop, D. R.: Quantitative sampling using an Aerodyne aerosol mass spectrometer 1. Techniques of data interpretation and error analysis, J. Geophys. Res.-Atmos., 108, 4090, https://doi.org/10.1029/2002jd002358, 2003.
Allan, J. D., Delia, A. E., Coe, H., Bower, K. N., Alfarra, M. R., Jimenez, J. L., Middlebrook, A. M., Drewnick, F., Onasch, T. B., Canagaratna, M. R., Jayne, J. T., and Worsnop, D. R.: A generalised method for the extraction of chemically resolved mass spectra from Aerodyne aerosol mass spectrometer data, J. Aerosol Sci., 35, 909–922, https://doi.org/10.1016/j.jaerosci.2004.02.007, 2004.
Atkinson, R., Aschmann, S. M., and Arey, J.: Reactions of hydroxyl and nitrogen trioxide radicals with phenol, cresols, and 2-nitrophenol at 296±2 K, Environ. Sci. Technol., 26, 1397–1403, https://doi.org/10.1021/es00031a018, 1992.
Atkinson, R., Baulch, D. L., Cox, R. A., Crowley, J. N., Hampson, R. F., Hynes, R. G., Jenkin, M. E., Rossi, M. J., and Troe, J.: Evaluated kinetic and photochemical data for atmospheric chemistry: Volume I - gas phase reactions of Ox, HOx, NOx and SOx species, Atmos. Chem. Phys., 4, 1461–1738, https://doi.org/10.5194/acp-4-1461-2004, 2004.
Babar, Z. B., Park, J.-H., Kang, J., and Lim, H.-J.: Characterization of a Smog Chamber for Studying Formation and Physicochemical Properties of Secondary Organic Aerosol, Aerosol Air Qual. Res., 16, 3102–3113, https://doi.org/10.4209/aaqr.2015.10.0580, 2016.
Barnes, I. and Rudzinski, K. J.: Environmental simulation chambers: Application to atmospheric chemical processes, Springer Science & Business Media, Zakopane, Poland, 2006.
Barnes, I., Becker, K. H., and Mihalopoulos, N.: An FTIR product study of the photooxidation of dimethyl disulfide, J. Atmos. Chem., 18, 267–289, https://doi.org/10.1007/BF00696783, 1994.
Becker, K. H.: Overview on the Development of Chambers for the Study of Atmospheric Chemical Processes, Environmental Simulation Chambers: Application to Atmospheric Chemical Processes, 1–26, Springer, Dordrecht, 2006.
Behnke, W., Holländer, W., Koch, W., Nolting, F., and Zetzsch, C.: A smog chamber for studies of the photochemical degradation of chemicals in the presence of aerosols, Atmos. Environ., 22, 1113–1120, https://doi.org/10.1016/0004-6981(88)90341-1, 1988.
Bianchi, F., Kurtén, T., Riva, M., Mohr, C., Rissanen, M. P., Roldin, P., Berndt, T., Crounse, J. D., Wennberg, P. O., Mentel, T. F., Wildt, J., Junninen, H., Jokinen, T., Kulmala, M., Worsnop, D. R., Thornton, J. A., Donahue, N., Kjaergaard, H. G., and Ehn, M.: Highly Oxygenated Organic Molecules (HOM) from Gas-Phase Autoxidation Involving Peroxy Radicals: A Key Contributor to Atmospheric Aerosol, Chem. Rev., 119, 3472–3509, https://doi.org/10.1021/acs.chemrev.8b00395, 2019.
Bloss, C., Wagner, V., Bonzanini, A., Jenkin, M. E., Wirtz, K., Martin-Reviejo, M., and Pilling, M. J.: Evaluation of detailed aromatic mechanisms (MCMv3 and MCMv3.1) against environmental chamber data, Atmos. Chem. Phys., 5, 623–639, https://doi.org/10.5194/acp-5-623-2005, 2005.
Carlton, A. G., Wiedinmyer, C., and Kroll, J. H.: A review of Secondary Organic Aerosol (SOA) formation from isoprene, Atmos. Chem. Phys., 9, 4987–5005, https://doi.org/10.5194/acp-9-4987-2009, 2009.
Carter, W., Cockeriii, D., Fitz, D., Malkina, I., Bumiller, K., Sauer, C., Pisano, J., Bufalino, C., and Song, C.: A new environmental chamber for evaluation of gas-phase chemical mechanisms and secondary aerosol formation, Atmos. Environ., 39, 7768–7788, https://doi.org/10.1016/j.atmosenv.2005.08.040, 2005.
Carter, W. P. L. and Lurmann, F. W.: Evaluation of a detailed gas-phase atmospheric reaction mechanism using environmental chamber data, Atmos. Environ. A-Gen., 25, 2771–2806, https://doi.org/10.1016/0960-1686(91)90206-m, 1991.
Charan, S. M., Kong, W., Flagan, R. C., and Seinfeld, J. H.: Effect of particle charge on aerosol dynamics in Teflon environmental chambers, Aerosol Sci. Tech., 52, 854–871, https://doi.org/10.1080/02786826.2018.1474167, 2018.
Charan, S. M., Huang, Y., and Seinfeld, J. H.: Computational Simulation of Secondary Organic Aerosol Formation in Laboratory Chambers, Chem. Rev., 119, 11912–11944, https://doi.org/10.1021/acs.chemrev.9b00358, 2019.
Cocker, D. R., Clegg, S. L., Flagan, R. C., and Seinfeld, J. H.: The effect of water on gas–particle partitioning of secondary organic aerosol. Part I: α-pinene/ozone system, Atmos. Environ., 35, 6049–6072, https://doi.org/10.1016/S1352-2310(01)00404-6, 2001a.
Cocker, D. R., Flagan, R. C., and Seinfeld, J. H.: State-of-the-Art Chamber Facility for Studying Atmospheric Aerosol Chemistry, Environ. Sci. Technol., 35, 2594–2601, https://doi.org/10.1021/es0019169, 2001b.
Connolly, P. J., Emersic, C., and Field, P. R.: A laboratory investigation into the aggregation efficiency of small ice crystals, Atmos. Chem. Phys., 12, 2055–2076, https://doi.org/10.5194/acp-12-2055-2012, 2012.
Crump, J. G., Flagan, R. C., and Seinfeld, J. H.: Particle Wall Loss Rates in Vessels, Aerosol Sci. Tech., 2, 303–309, https://doi.org/10.1080/02786828308958636, 1983.
Donahue, N. M., Kroll, J. H., Pandis, S. N., and Robinson, A. L.: A two-dimensional volatility basis set – Part 2: Diagnostics of organic-aerosol evolution, Atmos. Chem. Phys., 12, 615–634, https://doi.org/10.5194/acp-12-615-2012, 2012.
Dunne, E. M., Gordon, H., Kurten, A., Almeida, J., Duplissy, J., Williamson, C., Ortega, I. K., Pringle, K. J., Adamov, A., Baltensperger, U., Barmet, P., Benduhn, F., Bianchi, F., Breitenlechner, M., Clarke, A., Curtius, J., Dommen, J., Donahue, N. M., Ehrhart, S., Flagan, R. C., Franchin, A., Guida, R., Hakala, J., Hansel, A., Heinritzi, M., Jokinen, T., Kangasluoma, J., Kirkby, J., Kulmala, M., Kupc, A., Lawler, M. J., Lehtipalo, K., Makhmutov, V., Mann, G., Mathot, S., Merikanto, J., Miettinen, P., Nenes, A., Onnela, A., Rap, A., Reddington, C. L., Riccobono, F., Richards, N. A., Rissanen, M. P., Rondo, L., Sarnela, N., Schobesberger, S., Sengupta, K., Simon, M., Sipila, M., Smith, J. N., Stozkhov, Y., Tome, A., Trostl, J., Wagner, P. E., Wimmer, D., Winkler, P. M., Worsnop, D. R., and Carslaw, K. S.: Global atmospheric particle formation from CERN CLOUD measurements, Science, 354, 1119–1124, https://doi.org/10.1126/science.aaf2649, 2016.
Eddingsaas, N. C., Loza, C. L., Yee, L. D., Chan, M., Schilling, K. A., Chhabra, P. S., Seinfeld, J. H., and Wennberg, P. O.: α-pinene photooxidation under controlled chemical conditions – Part 2: SOA yield and composition in low- and high-NOx environments, Atmos. Chem. Phys., 12, 7413–7427, https://doi.org/10.5194/acp-12-7413-2012, 2012.
Ehn, M., Kleist, E., Junninen, H., Petäjä, T., Lönn, G., Schobesberger, S., Dal Maso, M., Trimborn, A., Kulmala, M., Worsnop, D. R., Wahner, A., Wildt, J., and Mentel, Th. F.: Gas phase formation of extremely oxidized pinene reaction products in chamber and ambient air, Atmos. Chem. Phys., 12, 5113–5127, https://doi.org/10.5194/acp-12-5113-2012, 2012.
Ehn, M., Thornton, J. A., Kleist, E., Sipilä, M., Junninen, H., Pullinen, I., Springer, M., Rubach, F., Tillmann, R., Lee, B., Lopez-Hilfiker, F., Andres, S., Acir, I.-H., Rissanen, M., Jokinen, T., Schobesberger, S., Kangasluoma, J., Kontkanen, J., Nieminen, T., Kurtén, T., Nielsen, L. B., Jørgensen, S., Kjaergaard, H. G., Canagaratna, M., Maso, M. D., Berndt, T., Petäjä, T., Wahner, A., Kerminen, V.-M., Kulmala, M., Worsnop, D. R., Wildt, J., and Mentel, T. F.: A large source of low-volatility secondary organic aerosol, Nature, 506, 476–479, https://doi.org/10.1038/nature13032, 2014.
Finlayson-Pitts, B. J. and Pitts, J. N.: Chemistry of the Upper and Lower Atmosphere, Academic Press, San Franciso, USA, 871–942, https://doi.org/10.1016/B978-012257060-5/50018-6, 2000.
Frey, W., Hu, D., Dorsey, J., Alfarra, M. R., Pajunoja, A., Virtanen, A., Connolly, P., and McFiggans, G.: The efficiency of secondary organic aerosol particles acting as ice-nucleating particles under mixed-phase cloud conditions, Atmos. Chem. Phys., 18, 9393–9409, https://doi.org/10.5194/acp-18-9393-2018, 2018.
Fry, J. L., Draper, D. C., Barsanti, K. C., Smith, J. N., Ortega, J., Winkler, P. M., Lawler, M. J., Brown, S. S., Edwards, P. M., Cohen, R. C., and Lee, L.: Secondary organic aerosol formation and organic nitrate yield from NO3 oxidation of biogenic hydrocarbons, Environ. Sci. Technol., 48, 11944–11953, https://doi.org/10.1021/es502204x, 2014.
Gallimore, P. J., Mahon, B. M., Wragg, F. P. H., Fuller, S. J., Giorio, C., Kourtchev, I., and Kalberer, M.: Multiphase composition changes and reactive oxygen species formation during limonene oxidation in the new Cambridge Atmospheric Simulation Chamber (CASC), Atmos. Chem. Phys., 17, 9853–9868, https://doi.org/10.5194/acp-17-9853-2017, 2017.
Gerasopoulos, E., Kazadzis, S., Vrekoussis, M., Kouvarakis, G., Liakakou, E., Kouremeti, N., Giannadaki, D., Kanakidou, M., Bohn, B., and Mihalopoulos, N.: Factors affecting O3 and NO2photolysis frequencies measured in the eastern Mediterranean during the five-year period 2002–2006, J. Geophys. Res., 117, D22305, https://doi.org/10.1029/2012JD017622, 2012.
Goldstein, A. H. and Galbally, I. E.: Known and Unexplored Organic Constituents in the Earth's Atmosphere, Environ. Sci. Technol., 41, 1514–1521, 2007.
Good, N., Coe, H., and McFiggans, G.: Instrumentational operation and analytical methodology for the reconciliation of aerosol water uptake under sub- and supersaturated conditions, Atmos. Meas. Tech., 3, 1241–1254, https://doi.org/10.5194/amt-3-1241-2010, 2010.
Gray, H. A., Cass, G. R., Huntzicker, J. J., Heyerdahl, E. K., and Rau, J. A.: Characteristics of atmospheric organic and elemental carbon particle concentrations in Los Angeles, Environ. Sci. Technol., 20, 580–589, https://doi.org/10.1021/es00148a006, 1986.
Grosjean, D. and Seinfeld, J. H.: Parameterization of the formation potential of secondary organic aerosols, Atmos. Environ., 23, 1733–1747, https://doi.org/10.1016/0004-6981(89)90058-9, 1989.
Hallquist, M., Wenger, J. C., Baltensperger, U., Rudich, Y., Simpson, D., Claeys, M., Dommen, J., Donahue, N. M., George, C., Goldstein, A. H., Hamilton, J. F., Herrmann, H., Hoffmann, T., Iinuma, Y., Jang, M., Jenkin, M. E., Jimenez, J. L., Kiendler-Scharr, A., Maenhaut, W., McFiggans, G., Mentel, Th. F., Monod, A., Prévôt, A. S. H., Seinfeld, J. H., Surratt, J. D., Szmigielski, R., and Wildt, J.: The formation, properties and impact of secondary organic aerosol: current and emerging issues, Atmos. Chem. Phys., 9, 5155–5236, https://doi.org/10.5194/acp-9-5155-2009, 2009.
Hamilton, J. F., Rami Alfarra, M., Wyche, K. P., Ward, M. W., Lewis, A. C., McFiggans, G. B., Good, N., Monks, P. S., Carr, T., White, I. R., and Purvis, R. M.: Investigating the use of secondary organic aerosol as seed particles in simulation chamber experiments, Atmos. Chem. Phys., 11, 5917–5929, https://doi.org/10.5194/acp-11-5917-2011, 2011.
Hennigan, C. J., Miracolo, M. A., Engelhart, G. J., May, A. A., Presto, A. A., Lee, T., Sullivan, A. P., McMeeking, G. R., Coe, H., Wold, C. E., Hao, W.-M., Gilman, J. B., Kuster, W. C., de Gouw, J., Schichtel, B. A., Collett Jr., J. L., Kreidenweis, S. M., and Robinson, A. L.: Chemical and physical transformations of organic aerosol from the photo-oxidation of open biomass burning emissions in an environmental chamber, Atmos. Chem. Phys., 11, 7669–7686, https://doi.org/10.5194/acp-11-7669-2011, 2011.
Hoffman, E. J. and Duce, R. A.: Organic carbon in marine atmospheric particulate matter: Concentration and particle size distribution, Geophys. Res. Lett., 4, 449–452, https://doi.org/10.1029/GL004i010p00449, 1977.
Hoffmann, T., Odum, J. R., Bowman, F., Collins, D., Klockow, D., Flagan, R. C., and Seinfeld, J. H.: Formation of Organic Aerosols from the Oxidation of Biogenic Hydrocarbons, J. Atmos. Chem., 26, 189–222, https://doi.org/10.1023/a:1005734301837, 1997.
Hohaus, T., Kuhn, U., Andres, S., Kaminski, M., Rohrer, F., Tillmann, R., Wahner, A., Wegener, R., Yu, Z., and Kiendler-Scharr, A.: A new plant chamber facility, PLUS, coupled to the atmosphere simulation chamber SAPHIR, Atmos. Meas. Tech., 9, 1247–1259, https://doi.org/10.5194/amt-9-1247-2016, 2016.
Hu, C.-j., Cheng, Y., Pan, G., Gai, Y.-b., Gu, X.-j., Zhao, W.-x., Wang, Z.-y., Zhang, W.-j., Chen, J., Liu, F.-y., Shan, X.-b., and Sheng, L.-s.: A Smog Chamber Facility for Qualitative and Quantitative Study on Atmospheric Chemistry and Secondary Organic Aerosol, Chin. J. Chem. Phys., 27, 631–639, https://doi.org/10.1063/1674-0068/27/06/631-639, 2014.
Huang, Y., Zhao, R., Charan, S. M., Kenseth, C. M., Zhang, X., and Seinfeld, J. H.: Unified Theory of Vapor–Wall Mass Transport in Teflon-Walled Environmental Chambers, Environ. Sci. Technol., 52, 2134–2142, https://doi.org/10.1021/acs.est.7b05575, 2018.
Jayne, J. T., Leard, D. C., Zhang, X., Davidovits, P., Smith, K. A., Kolb, C. E., and Worsnop, D. R.: Development of an Aerosol Mass Spectrometer for Size and Composition Analysis of Submicron Particles, Aerosol Sci. Tech., 33, 49–70, https://doi.org/10.1080/027868200410840, 2000.
Jenkin, M. E., Wyche, K. P., Evans, C. J., Carr, T., Monks, P. S., Alfarra, M. R., Barley, M. H., McFiggans, G. B., Young, J. C., and Rickard, A. R.: Development and chamber evaluation of the MCM v3.2 degradation scheme for β-caryophyllene, Atmos. Chem. Phys., 12, 5275–5308, https://doi.org/10.5194/acp-12-5275-2012, 2012.
Jimenez, J. L.: Ambient aerosol sampling using the Aerodyne Aerosol Mass Spectrometer, J. Geophys. Res., 108, 8425, https://doi.org/10.1029/2001jd001213, 2003.
Jimenez, J. L., Canagaratna, M. R., Donahue, N. M., Prevot, A. S., Zhang, Q., Kroll, J. H., DeCarlo, P. F., Allan, J. D., Coe, H., Ng, N. L., Aiken, A. C., Docherty, K. S., Ulbrich, I. M., Grieshop, A. P., Robinson, A. L., Duplissy, J., Smith, J. D., Wilson, K. R., Lanz, V. A., Hueglin, C., Sun, Y. L., Tian, J., Laaksonen, A., Raatikainen, T., Rautiainen, J., Vaattovaara, P., Ehn, M., Kulmala, M., Tomlinson, J. M., Collins, D. R., Cubison, M. J., Dunlea, E. J., Huffman, J. A., Onasch, T. B., Alfarra, M. R., Williams, P. I., Bower, K., Kondo, Y., Schneider, J., Drewnick, F., Borrmann, S., Weimer, S., Demerjian, K., Salcedo, D., Cottrell, L., Griffin, R., Takami, A., Miyoshi, T., Hatakeyama, S., Shimono, A., Sun, J. Y., Zhang, Y. M., Dzepina, K., Kimmel, J. R., Sueper, D., Jayne, J. T., Herndon, S. C., Trimborn, A. M., Williams, L. R., Wood, E. C., Middlebrook, A. M., Kolb, C. E., Baltensperger, U., and Worsnop, D. R.: Evolution of organic aerosols in the atmosphere, Science, 326, 1525–1529, https://doi.org/10.1126/science.1180353, 2009.
Karl, M., Brauers, T., Dorn, H. P., Holland, F., Komenda, M., Poppe, D., Rohrer, F., Rupp, L., Schaub, A., and Wahner, A.: Kinetic Study of the OH-isoprene and O3-isoprene reaction in the atmosphere simulation chamber, SAPHIR, Geophys. Res. Lett., 31, L05117, https://doi.org/10.1029/2003gl019189, 2004.
Katsouyanni, K., Touloumi, G., Spix, C., Schwartz, J., Balducci, F., Medina, S., Rossi, G., Wojtyniak, B., Sunyer, J., Bacharova, L., Schouten, J. P., Ponka, A., and Anderson, H. R.: Short-term effects of ambient sulphur dioxide and particulate matter on mortality in 12 European cities: results from time series data from the APHEA project. Air Pollution and Health: a European Approach, BMJ, 314, 1658–1663, https://doi.org/10.1136/bmj.314.7095.1658, 1997.
Kostenidou, E., Kaltsonoudis, C., Tsiflikiotou, M., Louvaris, E., Russell, L. M., and Pandis, S. N.: Burning of olive tree branches: a major organic aerosol source in the Mediterranean, Atmos. Chem. Phys., 13, 8797–8811, https://doi.org/10.5194/acp-13-8797-2013, 2013.
Krechmer, J. E., Day, D. A., and Jimenez, J. L.: Always Lost but Never Forgotten: Gas-Phase Wall Losses Are Important in All Teflon Environmental Chambers, Environ. Sci. Technol., 54, 12890–12897, https://doi.org/10.1021/acs.est.0c03381, 2020.
Leone, J. A., Flagan, R. C., Grosjean, D., and Seinfeld, J. H.: An outdoor smog chamber and modeling study of toluene–NOx photooxidation, Int. J. Chem. Kinet., 17, 177–216, https://doi.org/10.1002/kin.550170206, 1985.
Leskinen, A., Yli-Pirilä, P., Kuuspalo, K., Sippula, O., Jalava, P., Hirvonen, M.-R., Jokiniemi, J., Virtanen, A., Komppula, M., and Lehtinen, K. E. J.: Characterization and testing of a new environmental chamber, Atmos. Meas. Tech., 8, 2267–2278, https://doi.org/10.5194/amt-8-2267-2015, 2015.
Liu, D., Whitehead, J., Alfarra, M. R., Reyes-Villegas, E., Spracklen, Dominick V., Reddington, Carly L., Kong, S., Williams, Paul I., Ting, Y.-C., Haslett, S., Taylor, Jonathan W., Flynn, Michael J., Morgan, William T., McFiggans, G., Coe, H., and Allan, James D.: Black-carbon absorption enhancement in the atmosphere determined by particle mixing state, Nat. Geosci., 10, 184–188, https://doi.org/10.1038/ngeo2901, 2017.
Lohmann, U. and Feichter, J.: Global indirect aerosol effects: a review, Atmos. Chem. Phys., 5, 715–737, https://doi.org/10.5194/acp-5-715-2005, 2005.
Matsunaga, A. and Ziemann, P. J.: Gas-Wall Partitioning of Organic Compounds in a Teflon Film Chamber and Potential Effects on Reaction Product and Aerosol Yield Measurements, Aerosol Sci. Tech., 44, 881–892, https://doi.org/10.1080/02786826.2010.501044, 2010.
McFiggans, G., Artaxo, P., Baltensperger, U., Coe, H., Facchini, M. C., Feingold, G., Fuzzi, S., Gysel, M., Laaksonen, A., Lohmann, U., Mentel, T. F., Murphy, D. M., O'Dowd, C. D., Snider, J. R., and Weingartner, E.: The effect of physical and chemical aerosol properties on warm cloud droplet activation, Atmos. Chem. Phys., 6, 2593–2649, https://doi.org/10.5194/acp-6-2593-2006, 2006.
McFiggans, G., Mentel, T. F., Wildt, J., Pullinen, I., Kang, S., Kleist, E., Schmitt, S., Springer, M., Tillmann, R., Wu, C., Zhao, D., Hallquist, M., Faxon, C., Le Breton, M., Hallquist, A. M., Simpson, D., Bergstrom, R., Jenkin, M. E., Ehn, M., Thornton, J. A., Alfarra, M. R., Bannan, T. J., Percival, C. J., Priestley, M., Topping, D., and Kiendler-Scharr, A.: Secondary organic aerosol reduced by mixture of atmospheric vapours, Nature, 565, 587–593, https://doi.org/10.1038/s41586-018-0871-y, 2019.
McMurry, P. H. and Grosjean, D.: Gas and aerosol wall losses in Teflon film smog chambers, Environ. Sci. Technol., 19, 1176–1182, https://doi.org/10.1021/es00142a006, 1985.
McMurry, P. H. and Rader, D. J.: Aerosol Wall Losses in Electrically Charged Chambers, Aerosol Sci. Tech., 4, 249–268, https://doi.org/10.1080/02786828508959054, 1985.
Metzger, A., Dommen, J., Gaeggeler, K., Duplissy, J., Prevot, A. S. H., Kleffmann, J., Elshorbany, Y., Wisthaler, A., and Baltensperger, U.: Evaluation of 1,3,5 trimethylbenzene degradation in the detailed tropospheric chemistry mechanism, MCMv3.1, using environmental chamber data, Atmos. Chem. Phys., 8, 6453–6468, https://doi.org/10.5194/acp-8-6453-2008, 2008.
Murphy, D. M., Cziczo, D. J., Froyd, K. D., Hudson, P. K., Matthew, B. M., Middlebrook, A. M., Peltier, R. E., Sullivan, A., Thomson, D. S., and Weber, R. J.: Single-particle mass spectrometry of tropospheric aerosol particles, J. Geophys. Res., 111, D23S32, https://doi.org/10.1029/2006JD007340, 2006.
Mutzel, A., Poulain, L., Berndt, T., Iinuma, Y., Rodigast, M., Böge, O., Richters, S., Spindler, G., Sipilä, M., Jokinen, T., Kulmala, M., and Herrmann, H.: Highly Oxidized Multifunctional Organic Compounds Observed in Tropospheric Particles: A Field and Laboratory Study, Environ. Sci. Technol., 49, 7754–7761, https://doi.org/10.1021/acs.est.5b00885, 2015.
Nah, T., McVay, R. C., Pierce, J. R., Seinfeld, J. H., and Ng, N. L.: Constraining uncertainties in particle-wall deposition correction during SOA formation in chamber experiments, Atmos. Chem. Phys., 17, 2297–2310, https://doi.org/10.5194/acp-17-2297-2017, 2017.
Ng, N. L., Kroll, J. H., Chan, A. W. H., Chhabra, P. S., Flagan, R. C., and Seinfeld, J. H.: Secondary organic aerosol formation from m-xylene, toluene, and benzene, Atmos. Chem. Phys., 7, 3909–3922, https://doi.org/10.5194/acp-7-3909-2007, 2007.
Niedermeier, D., Voigtländer, J., Schmalfuß, S., Busch, D., Schumacher, J., Shaw, R. A., and Stratmann, F.: Characterization and first results from LACIS-T: a moist-air wind tunnel to study aerosol–cloud–turbulence interactions, Atmos. Meas. Tech., 13, 2015–2033, https://doi.org/10.5194/amt-13-2015-2020, 2020.
Odum, J. R., Hoffmann, T., Bowman, F., Collins, D., Flagan, R. C., and Seinfeld, J. H.: Gas/Particle Partitioning and Secondary Organic Aerosol Yields, Environ. Sci. Technol., 30, 2580–2585, https://doi.org/10.1021/es950943, 1996.
O'Meara, S. P., Xu, S., Topping, D., Alfarra, M. R., Capes, G., Lowe, D., Shao, Y., and McFiggans, G.: PyCHAM (v2.1.1): a Python box model for simulating aerosol chambers, Geosci. Model Dev., 14, 675–702, https://doi.org/10.5194/gmd-14-675-2021, 2021.
Pankow, J. F.: An absorption model of gas/particle partitioning of organic compounds in the atmosphere, Atmos. Environ., 28, 185–188, https://doi.org/10.1016/1352-2310(94)90093-0, 1994a.
Pankow, J. F.: An absorption model of the gas/aerosol partitioning involved in the formation of secondary organic aerosol, Atmos. Environ., 28, 189–193, 1994b.
Paulot, F., Crounse John, D., Kjaergaard Henrik, G., Kürten, A., St. Clair Jason, M., Seinfeld John, H., and Wennberg Paul, O.: Unexpected Epoxide Formation in the Gas-Phase Photooxidation of Isoprene, Science, 325, 730–733, https://doi.org/10.1126/science.1172910, 2009.
Paulsen, D., Dommen, J., Kalberer, M., Prevot, A. S., Richter, R., Sax, M., Steinbacher, M., Weingartner, E., and Baltensperger, U.: Secondary organic aerosol formation by irradiation of 1,3,5-trimethylbenzene-NOx-H2O in a new reaction chamber for atmospheric chemistry and physics, Environ. Sci. Technol., 39, 2668–2678, https://doi.org/10.1021/es0489137, 2005.
Pereira, K. L., Dunmore, R., Whitehead, J., Alfarra, M. R., Allan, J. D., Alam, M. S., Harrison, R. M., McFiggans, G., and Hamilton, J. F.: Technical note: Use of an atmospheric simulation chamber to investigate the effect of different engine conditions on unregulated VOC-IVOC diesel exhaust emissions, Atmos. Chem. Phys., 18, 11073–11096, https://doi.org/10.5194/acp-18-11073-2018, 2018.
Pierce, J. R., Engelhart, G. J., Hildebrandt, L., Weitkamp, E. A., Pathak, R. K., Donahue, N. M., Robinson, A. L., Adams, P. J., and Pandis, S. N.: Constraining Particle Evolution from Wall Losses, Coagulation, and Condensation-Evaporation in Smog-Chamber Experiments: Optimal Estimation Based on Size Distribution Measurements, Aerosol Sci. Tech., 42, 1001–1015, https://doi.org/10.1080/02786820802389251, 2008.
Platt, S. M., El Haddad, I., Zardini, A. A., Clairotte, M., Astorga, C., Wolf, R., Slowik, J. G., Temime-Roussel, B., Marchand, N., Ježek, I., Drinovec, L., Močnik, G., Möhler, O., Richter, R., Barmet, P., Bianchi, F., Baltensperger, U., and Prévôt, A. S. H.: Secondary organic aerosol formation from gasoline vehicle emissions in a new mobile environmental reaction chamber, Atmos. Chem. Phys., 13, 9141–9158, https://doi.org/10.5194/acp-13-9141-2013, 2013.
Pope, C. A., 3rd, Burnett, R. T., Thun, M. J., Calle, E. E., Krewski, D., Ito, K., and Thurston, G. D.: Lung cancer, cardiopulmonary mortality, and long-term exposure to fine particulate air pollution, JAMA, 287, 1132–1141, https://doi.org/10.1001/jama.287.9.1132, 2002.
Ren, Y., Grosselin, B., Daële, V., and Mellouki, A.: Investigation of the reaction of ozone with isoprene, methacrolein and methyl vinyl ketone using the HELIOS chamber, Faraday Discuss., 200, 289–311, https://doi.org/10.1039/C7FD00014F, 2017.
Rohrer, F., Bohn, B., Brauers, T., Brüning, D., Johnen, F.-J., Wahner, A., and Kleffmann, J.: Characterisation of the photolytic HONO-source in the atmosphere simulation chamber SAPHIR, Atmos. Chem. Phys., 5, 2189–2201, https://doi.org/10.5194/acp-5-2189-2005, 2005.
Saathoff, H., Naumann, K.-H., Möhler, O., Jonsson, Å. M., Hallquist, M., Kiendler-Scharr, A., Mentel, Th. F., Tillmann, R., and Schurath, U.: Temperature dependence of yields of secondary organic aerosols from the ozonolysis of α-pinene and limonene, Atmos. Chem. Phys., 9, 1551–1577, https://doi.org/10.5194/acp-9-1551-2009, 2009.
Schnitzhofer, R., Metzger, A., Breitenlechner, M., Jud, W., Heinritzi, M., De Menezes, L.-P., Duplissy, J., Guida, R., Haider, S., Kirkby, J., Mathot, S., Minginette, P., Onnela, A., Walther, H., Wasem, A., Hansel, A., and the CLOUD Team: Characterisation of organic contaminants in the CLOUD chamber at CERN, Atmos. Meas. Tech., 7, 2159–2168, https://doi.org/10.5194/amt-7-2159-2014, 2014.
Seakins, P. W.: A brief review of the use of environmental chambers for gas phase studies of kinetics, chemical mechanisms and characterisation of field instruments, EPJ Web Conf., 9, 143–163, https://doi.org/10.1051/epjconf/201009012, 2010.
Seinfeld, J. H. and Pandis, S. N.: Atmospheric Chemistry and Physics: From Air Pollution to Climate Change, John Wiley & Sons, Inc., Hoboken, 2016.
Smith, D. M., Fiddler, M. N., Sexton, K. G., and Bililign, S.: Construction and Characterization of an Indoor Smog Chamber for Measuring the Optical and Physicochemical Properties of Aging Biomass Burning Aerosols, Aerosol Air Qual. Res., 19, 467–483, https://doi.org/10.4209/aaqr.2018.06.0243, 2019.
Smith, H. J.: Nanoparticle growth in the CLOUD chamber, Science, 352, 1422–1422, https://doi.org/10.1126/science.2016.352.6292.twil, 2016.
Stirnweis, L., Marcolli, C., Dommen, J., Barmet, P., Frege, C., Platt, S. M., Bruns, E. A., Krapf, M., Slowik, J. G., Wolf, R., Prévôt, A. S. H., Baltensperger, U., and El-Haddad, I.: Assessing the influence of NOx concentrations and relative humidity on secondary organic aerosol yields from α-pinene photo-oxidation through smog chamber experiments and modelling calculations, Atmos. Chem. Phys., 17, 5035–5061, https://doi.org/10.5194/acp-17-5035-2017, 2017.
Surratt, J. D., Chan, A. W. H., Eddingsaas, N. C., Chan, M., Loza, C. L., Kwan, A. J., Hersey, S. P., Flagan, R. C., Wennberg, P. O., and Seinfeld, J. H.: Reactive intermediates revealed in secondary organic aerosol formation from isoprene, P. Natl. Acad. Sci. USA, 107, 6640, https://doi.org/10.1073/pnas.0911114107, 2010.
Taylor, L., Reist, P. C., Boehlecke, B. A., and Jacobs, R. R.: Characterization of an aerosol chamber for human exposures to endotoxin, Applied Occupational and Environmental Hygiene, 15, 303–312, https://doi.org/10.1080/104732200301629, 2000.
Thornton, J. A., Shilling, J. E., Shrivastava, M., D'Ambro, E. L., Zawadowicz, M. A., and Liu, J.: A Near-Explicit Mechanistic Evaluation of Isoprene Photochemical Secondary Organic Aerosol Formation and Evolution: Simulations of Multiple Chamber Experiments with and without Added NOx, ACS Earth and Space Chemistry, 4, 1161–1181, https://doi.org/10.1021/acsearthspacechem.0c00118, 2020.
Tong, H., Lakey, P. S. J., Arangio, A. M., Socorro, J., Shen, F., Lucas, K., Brune, W. H., Poschl, U., and Shiraiwa, M.: Reactive Oxygen Species Formed by Secondary Organic Aerosols in Water and Surrogate Lung Fluid, Environ. Sci. Technol., 52, 11642–11651, https://doi.org/10.1021/acs.est.8b03695, 2018.
Trump, E. R., Epstein, S. A., Riipinen, I., and Donahue, N. M.: Wall effects in smog chamber experiments: A model study, Aerosol Sci. Tech., 50, 1180–1200, https://doi.org/10.1080/02786826.2016.1232858, 2016.
Turpin, B. J. and Huntzicker, J. J.: Secondary formation of organic aerosol in the Los Angeles basin: A descriptive analysis of organic and elemental carbon concentrations, Atmos. Environ. A-Gen., 25, 207–215, https://doi.org/10.1016/0960-1686(91)90291-e, 1991.
Turpin, B. J. and Huntzicker, J. J.: Identification of secondary organic aerosol episodes and quantitation of primary and secondary organic aerosol concentrations during SCAQS, Atmos. Environ., 29, 3527–3544, https://doi.org/10.1016/1352-2310(94)00276-q, 1995.
Verheggen, B. and Mozurkewich, M.: An inverse modeling procedure to determine particle growth and nucleation rates from measured aerosol size distributions, Atmos. Chem. Phys., 6, 2927–2942, https://doi.org/10.5194/acp-6-2927-2006, 2006.
Voliotis, A., Wang, Y., Shao, Y., Du, M., Bannan, T. J., Percival, C. J., Pandis, S. N., Alfarra, M. R., and McFiggans, G.: Exploring the composition and volatility of secondary organic aerosols in mixed anthropogenic and biogenic precursor systems, Atmos. Chem. Phys., 21, 14251–14273, https://doi.org/10.5194/acp-21-14251-2021, 2021.
Wagner, R., Bunz, H., Linke, C., Möhler, O., Naumann, K.-H., Saathoff, H., Schnaiter, M., and Schurath, U.: Chamber Simulations of Cloud Chemistry: The AIDA Chamber, Dordrecht, 67–82, https://doi.org/10.1007/1-4020-4232-9_5, 2006
Wagner, R., Yan, C., Lehtipalo, K., Duplissy, J., Nieminen, T., Kangasluoma, J., Ahonen, L. R., Dada, L., Kontkanen, J., Manninen, H. E., Dias, A., Amorim, A., Bauer, P. S., Bergen, A., Bernhammer, A.-K., Bianchi, F., Brilke, S., Mazon, S. B., Chen, X., Draper, D. C., Fischer, L., Frege, C., Fuchs, C., Garmash, O., Gordon, H., Hakala, J., Heikkinen, L., Heinritzi, M., Hofbauer, V., Hoyle, C. R., Kirkby, J., Kürten, A., Kvashnin, A. N., Laurila, T., Lawler, M. J., Mai, H., Makhmutov, V., Mauldin III, R. L., Molteni, U., Nichman, L., Nie, W., Ojdanic, A., Onnela, A., Piel, F., Quéléver, L. L. J., Rissanen, M. P., Sarnela, N., Schallhart, S., Sengupta, K., Simon, M., Stolzenburg, D., Stozhkov, Y., Tröstl, J., Viisanen, Y., Vogel, A. L., Wagner, A. C., Xiao, M., Ye, P., Baltensperger, U., Curtius, J., Donahue, N. M., Flagan, R. C., Gallagher, M., Hansel, A., Smith, J. N., Tomé, A., Winkler, P. M., Worsnop, D., Ehn, M., Sipilä, M., Kerminen, V.-M., Petäjä, T., and Kulmala, M.: The role of ions in new particle formation in the CLOUD chamber, Atmos. Chem. Phys., 17, 15181–15197, https://doi.org/10.5194/acp-17-15181-2017, 2017.
Wang, J., Doussin, J. F., Perrier, S., Perraudin, E., Katrib, Y., Pangui, E., and Picquet-Varrault, B.: Design of a new multi-phase experimental simulation chamber for atmospheric photosmog, aerosol and cloud chemistry research, Atmos. Meas. Tech., 4, 2465–2494, https://doi.org/10.5194/amt-4-2465-2011, 2011.
Wang, M., Kong, W., Marten, R., He, X. C., Chen, D., Pfeifer, J., Heitto, A., Kontkanen, J., Dada, L., Kurten, A., Yli-Juuti, T., Manninen, H. E., Amanatidis, S., Amorim, A., Baalbaki, R., Baccarini, A., Bell, D. M., Bertozzi, B., Brakling, S., Brilke, S., Murillo, L. C., Chiu, R., Chu, B., De Menezes, L. P., Duplissy, J., Finkenzeller, H., Carracedo, L. G., Granzin, M., Guida, R., Hansel, A., Hofbauer, V., Krechmer, J., Lehtipalo, K., Lamkaddam, H., Lampimaki, M., Lee, C. P., Makhmutov, V., Marie, G., Mathot, S., Mauldin, R. L., Mentler, B., Muller, T., Onnela, A., Partoll, E., Petaja, T., Philippov, M., Pospisilova, V., Ranjithkumar, A., Rissanen, M., Rorup, B., Scholz, W., Shen, J., Simon, M., Sipila, M., Steiner, G., Stolzenburg, D., Tham, Y. J., Tome, A., Wagner, A. C., Wang, D. S., Wang, Y., Weber, S. K., Winkler, P. M., Wlasits, P. J., Wu, Y., Xiao, M., Ye, Q., Zauner-Wieczorek, M., Zhou, X., Volkamer, R., Riipinen, I., Dommen, J., Curtius, J., Baltensperger, U., Kulmala, M., Worsnop, D. R., Kirkby, J., Seinfeld, J. H., El-Haddad, I., Flagan, R. C., and Donahue, N. M.: Rapid growth of new atmospheric particles by nitric acid and ammonia condensation, Nature, 581, 184–189, https://doi.org/10.1038/s41586-020-2270-4, 2020.
Wang, N., Jorga, S. D., Pierce, J. R., Donahue, N. M., and Pandis, S. N.: Particle wall-loss correction methods in smog chamber experiments, Atmos. Meas. Tech., 11, 6577–6588, https://doi.org/10.5194/amt-11-6577-2018, 2018.
Wang, X., Liu, T., Bernard, F., Ding, X., Wen, S., Zhang, Y., Zhang, Z., He, Q., Lü, S., Chen, J., Saunders, S., and Yu, J.: Design and characterization of a smog chamber for studying gas-phase chemical mechanisms and aerosol formation, Atmos. Meas. Tech., 7, 301–313, https://doi.org/10.5194/amt-7-301-2014, 2014.
Wang, Y., Voliotis, A., Shao, Y., Zong, T., Meng, X., Du, M., Hu, D., Chen, Y., Wu, Z., Alfarra, M. R., and McFiggans, G.: Phase state of secondary organic aerosol in chamber photo-oxidation of mixed precursors, Atmos. Chem. Phys., 21, 11303–11316, https://doi.org/10.5194/acp-21-11303-2021, 2021.
Wu, S., Lü, Z., Hao, J., Zhao, Z., Li, J., Takekawa, H., Minoura, H., and Yasuda, A.: Construction and characterization of an atmospheric simulation smog chamber, Adv. Atmos. Sci., 24, 250–258, https://doi.org/10.1007/s00376-007-0250-3, 2007.
Wyche, K. P., Ryan, A. C., Hewitt, C. N., Alfarra, M. R., McFiggans, G., Carr, T., Monks, P. S., Smallbone, K. L., Capes, G., Hamilton, J. F., Pugh, T. A. M., and MacKenzie, A. R.: Emissions of biogenic volatile organic compounds and subsequent photochemical production of secondary organic aerosol in mesocosm studies of temperate and tropical plant species, Atmos. Chem. Phys., 14, 12781–12801, https://doi.org/10.5194/acp-14-12781-2014, 2014.
Wyche, K. P., Monks, P. S., Smallbone, K. L., Hamilton, J. F., Alfarra, M. R., Rickard, A. R., McFiggans, G. B., Jenkin, M. E., Bloss, W. J., Ryan, A. C., Hewitt, C. N., and MacKenzie, A. R.: Mapping gas-phase organic reactivity and concomitant secondary organic aerosol formation: chemometric dimension reduction techniques for the deconvolution of complex atmospheric data sets, Atmos. Chem. Phys., 15, 8077–8100, https://doi.org/10.5194/acp-15-8077-2015, 2015.
Ye, P., Ding, X., Hakala, J., Hofbauer, V., Robinson, E. S., and Donahue, N. M.: Vapor wall loss of semi-volatile organic compounds in a Teflon chamber, Aerosol Sci. Tech., 50, 822–834, https://doi.org/10.1080/02786826.2016.1195905, 2016.
Zhang, Q., Jimenez, J. L., Canagaratna, M. R., Allan, J. D., Coe, H., Ulbrich, I., Alfarra, M. R., Takami, A., Middlebrook, A. M., Sun, Y. L., Dzepina, K., Dunlea, E., Docherty, K., DeCarlo, P. F., Salcedo, D., Onasch, T., Jayne, J. T., Miyoshi, T., Shimono, A., Hatakeyama, S., Takegawa, N., Kondo, Y., Schneider, J., Drewnick, F., Borrmann, S., Weimer, S., Demerjian, K., Williams, P., Bower, K., Bahreini, R., Cottrell, L., Griffin, R. J., Rautiainen, J., Sun, J. Y., Zhang, Y. M., and Worsnop, D. R.: Ubiquity and dominance of oxygenated species in organic aerosols in anthropogenically-influenced Northern Hemisphere midlatitudes, Geophys. Res. Lett., 34, L13801, https://doi.org/10.1029/2007GL029979, 2007.
Zhang, X., Cappa, C. D., Jathar, S. H., McVay, R. C., Ensberg, J. J., Kleeman, M. J., and Seinfeld, J. H.: Influence of vapor wall loss in laboratory chambers on yields of secondary organic aerosol, P. Natl. Acad. Sci. USA, 111, 5802–5807, https://doi.org/10.1073/pnas.1404727111, 2014.
- Abstract
- Introduction
- Description of the MAC
- MAC characterisation
- Experiment of α-pinene photo-oxidation
- Effects of contamination on chamber performance
- Discussion and conclusions
- Data availability
- Author contributions
- Competing interests
- Disclaimer
- Special issue statement
- Acknowledgements
- Financial support
- Review statement
- References
- Supplement