the Creative Commons Attribution 4.0 License.
the Creative Commons Attribution 4.0 License.
 | 22 Sep 2022
Updated spectral radiance calibration on TIR bands for TANSO-FTS-2 onboard GOSAT-2
Hiroshi Suto
Fumie Kataoka
Robert O. Knuteson
Kei Shiomi
Nobuhiro Kikuchi
Akihiko Kuze
The Thermal and Near-Infrared Sensor for Carbon Observation Fourier-Transform Spectrometer-2 (TANSO-FTS-2) onboard the Japanese Greenhouse Gases Observing SATellite-2 (GOSAT-2) observes a wide spectral region of the atmosphere, from the ShortWave-InfraRed (SWIR) to the longwave Thermal InfraRed radiation (TIR) with 0.2 cm−1 spectral sampling, and the corresponding spectral resolution (full width at half maximum, FWHM) of TIR region is less than 0.27 cm−1. TANSO-FTS-2 has operated nominally since February 2019, and the atmospheric radiance spectra it has acquired have been released to the public. This paper describes an updated model for spectral radiance calibration and its validation. The model applies to the version v210210 TIR products of TANSO-FTS-2 and integrates polarization sensitivity correction for the internal optics and the pointing mirror thermal emission. These correction parameters are characterized by an optimization that depends on the difference between the spectral radiance of TANSO-FTS-2 and coincident nadir observation data from the Infrared Atmospheric Sounding Interferometer (IASI) on METOP-B. To validate the updated spectral radiance product against other satellite products, temporally and spatially coincident observation points were considered for the simultaneous nadir overpass (SNO) from February 2019 to March 2021 from the Atmospheric Infrared Sounder (AIRS) on Aqua, IASI on METOP-B, and TANSO-FTS on GOSAT. The agreement of brightness temperatures between TANSO-FTS-2 and AIRS and IASI was better than 0.3 K (1σ) from 180 to 330 K for the 680 cm−1 CO2 spectral range. The brightness temperatures between TANSO-FTS-2 and TANSO-FTS of version v230231, which implemented a new polarization reflectivity of the pointing mirror and was released in June 2021, generally agree from 220 to 320 K. However, there is a discrepancy at lower brightness temperatures, pronounced for CO2 spectral ranges at high latitudes. To characterize the spectral radiance bias for along-track and cross-track angles, a 2-orthogonal simultaneous off-nadir overpass (2O-SONO) is now done for TANSO-FTS-2 and IASI, TANSO-FTS-2 and AIRS, and TANSO-FTS-2 and TANSO-FTS. The 2O-SONO comparison results indicate that the TIR product for TANSO-FTS-2 has a bias that exceeds 0.5 K in the CO2 spectral range for scenes with forward and backward viewing angles greater than 20∘. These multi-satellite sensor and multi-angle comparison results suggest that the calibration of spectral radiance for TANSO-FTS-2 TIR, version v210210, is superior to that of the previous version in its consistency of multi-satellite sensor data. In addition, the paper identifies the remaining challenging issues in current TIR products.
- Article
(6874 KB) - Full-text XML
- BibTeX
- EndNote


The Greenhouse Gases Observing SATellite-2 (GOSAT-2) was launched on 29 October 2018 to extend the success of the Greenhouse Gases Observing SATellite (GOSAT) (Kuze et al., 2009, 2012, 2016) mission. It carried the Thermal And Near infrared Sensor for carbon Observation Fourier-Transform Spectrometer-2 (TANSO-FTS-2) (Suto et al., 2021). To provide continuous monitoring of the global distribution of and , GOSAT-2 measures both the ShortWave InfraRed (SWIR) solar radiation reflected from the Earth's surface and the Thermal InfraRed (TIR) radiation from the ground and the atmosphere. GOSAT-2 has extended SWIR spectral coverage beyond GOSAT capabilities. One extension is toward the shortwave for solar-induced fluorescence; another is toward the longwave for carbon monoxide (CO) in the 2.3 µm region. Also, TIR spectral coverage is divided into two regions, band 4 (5.5–8.6 µm) and band 5 (8.6–14.3 µm). Simultaneous spectral radiance observation for SWIR and TIR supports retrieving new partial column concentration of CO2 and CH4 as well as the total column concentration, which are conventional products. The partial column concentration has sensitivities for the near surface (ground to around 4 km altitude) and upper troposphere (between 4 and around 12 km altitude) of CO2 and CH4 concentrations. These products lead to new applications for local emission estimation (Kuze et al., 2020, 2022).
The calibrated spectral radiance has been essential to provide consistent products for greenhouse-gas-observing satellites such as GOSAT, the Orbiting Carbon Observatory-2 (OCO-2) in orbit since July 2014 (Crisp et al., 2004, 2008, 2017), Orbiting Carbon Observatory-3 (OCO-3) in orbit since May 2019 (Eldering et al., 2019), the Sentinel-5 Precursor/TROPOspheric Monitoring Instrument (TROPOMI) in orbit since October 2017 (S5P) (Hu et al., 2018), and also the TIR sounders such as Infrared Atmospheric Sounding Interferometer (IASI) on METOP-B (Clerbaux et al., 2009) and Atmospheric Infrared Sounder (AIRS) on Aqua (Aumann et al., 2003). During GOSAT-2's first year of operation, several calibration processes for characterizing TANSO-FTS-2 were carried out with onboard calibrators, as reported by Suto et al. (2021). In the early stages of TANSO-FTS-2 calibration, we found a challenging issue with the TIR products, a brightness temperature bias for lower scene temperatures.
To reduce this bias, we reassessed the calibration model for the TIR bands of TANSO-FTS-2. The new calibration model and optimized calibration coefficients were derived by comparing well-characterized sensor data from other satellites. To provide the radiometric and spectral consistency among the TIR sounders as well as accurate partial column concentration, the angle-dependent or scene radiance-dependent bias in the radiance spectral domain is undesirable. Then, we showed that the spectral radiance for TANSO-FTS-2 TIR bands is consistent with the intercalibration data of the other TIR sounders mentioned above, with time-series, wavenumber, and the incident angle dependencies.
This paper first introduces an updated instrument calibration model for TANSO-FTS-2 TIR bands. A description of the optimization procedure follows for calibration coefficients, such as non-linear response, polarization sensitivity, pointing mirror reflection, and the pointing mirror's thermal emission. Next is a validation of updated radiance data with the first 2 years of in-orbit performance compared to temporally and spatially coincident data for simultaneous nadir overpasses (SNOs) from other satellites. Furthermore, these data were acquired for cross-track, along-track 2-orthogonal simultaneous off-nadir overpass (2O-SONO) data from other TIR sounders to validate multi-angle consistency.
All the processing from interferogram to atmospheric radiance spectra for TANSO-FTS-2 was performed on the ground. The basic procedure is described in the GOSAT-2 Level-1 Algorithm Theoretical Basis Document (JAXA, 2020) and Suto et al. (2021). As described in the previous paper, version v102102 of the TIR product has applied an empirical bias correction coefficient to reduce the brightness temperature bias for TANSO-FTS-2 product. However, that product still has a low brightness temperature bias for cold scenes against the other coincident satellite data comparisons. To update the physical model for correcting the low brightness temperature bias, the non-linear response of the infrared detectors, polarization sensitivity of internal optics, and thermal emission from pointing mirror are reassessed in this paper.
2.1 Non-linear correction
In level 1 processing, the raw digital signals are converted into physical units. For TANSO-FTS-2, an interferogram was constructed with a DC offset and gain correction. The simplified equation for conversion from raw digital units to physical units is described by Eq. (1).
where b stands for Bands (bands 4, 5), I_ampb for interferogram with DC offset and gain correction applied, ADC_scaleb the analog-to-digital conversion scale, DNb the digital count for each interferogram, PGA_gainb the gain factor for each band, DAC_scaleb the digital-to-analog conversion factor for each band, DC_offsetb the DC offset clamped at the start of observation, and V_offsetb the Offset signal.
If the detector's electronic chains have a non-linear response, the non-linear correction is applied in the interferogram domain as conventional signal processing. Equation (2) expresses the non-linear signal correction with quadratic and cubic terms. Here, a_nlcb, b_nlcb, and c_nlcb are non-linear coefficients for the quadratic factor, cubic factor, and offset, respectively.
A photoconductive–mercury cadmium telluride (PC-MCT) detector has a non-linear response with a quadratic term. The following model considers only the linear and quadratic terms (neglecting the cubic one).
Nominally, interferogram signals have both AC and DC components. Then, the interferogram signals for each band (b) can be described with ACb and DCb components, as shown by Eq. (3).
In this case, Eq. (2) with a quadratic term only is rewritten as Eq. (4)
During fast-Fourier transform numerical processing, the terms of are suppressed. As a result of the fast-Fourier transform, Eq. (4) is converted to Eq. (5)
where Sb=fft(ACb), fft the Fast-Fourier transform operator, and ⊗ the convolution operator.
In the spectral domain, the Sb component contains the in-band signal, whereas the Sb⊗Sb component is the second harmonic, which is mainly outside the in-band region but in principle could overlap the edges of the in-band signal. Figure 1 shows the Sb and Sb⊗Sb signals in the spectral domain for both TANSO-FTS and TANSO-FTS-2. Both TANSO-FTS and TANSO-FTS-2 have a wideband TIR channel; however, the TIR channel of TANSO-FTS-2 is separated into two band regions. As shown in Fig. 1, Sb⊗Sb components (blue lines in Fig. 1) overlap in the in-band signal (black lines) region for TANSO-FTS band 4, and it is prohibitively difficult to remove these components. In contrast, the Sb⊗Sb component is fully separated in TANSO-FTS-2 bands 4 and 5, and these components are negligible in the spectral domain. The signal in the spectral domain is expressed as Eq. (6).
This equation suggests that a non-linear correction can be applied in the spectral domain with only the non-linear coefficient a_nlcb, the DCb component, and the in-band spectrum Sb.

Figure 1Non-linear signals on the spectral domain for TANSO-FTS (a) and TANSO-FTS-2 (b, c). Black lines present the original spectra. Blue lines show Sb⊗Sb components as the non-linear quadratic term after removing the original spectra. The gray line shows the in-band spectral range for each band.
2.2 Polarization correction model
In a previous paper (Suto et al., 2021), we reported the low brightness temperature bias in TIR bands 4 and 5 for the version v102102 product. To correct this bias, we implemented a polarization sensitivity correction for TANSO-FTS-2 because the internal optical components are based on the high-polarization sensitivity materials, such as ZnSe. To account for the polarization sensitivity correction for the version v210210 level 1 algorithm, the calibration equations are modified from those of version v102102.
The detailed polarization sensitivity of TANSO-FTS-2 optics is modeled by Stokes vectors and Müller matrices, as expressed in the optical efficiency of the FTS mechanism and aft-optics, phase difference due to the pointing mirror reflectivity, and CT rotation angle (called θCT in the following), respectively (Mopt, Mr, Mε, and Mmirror are Müller matrices of 2-orthogonal polarization beam splitters). ST_output is output signal for Stokes vector. ST_input, ST_mirror, SBackgroud are expressed as the thermal radiation signals from observation scene, the pointing mirror, and background, respectively. In this case, the ST_output is expressed as Eq. (7).
where , are the pointing mirror reflectance for p- and s- polarizations (wavenumber dependence), , the transmittance for p- and s-polarization signals for internal optics (wavenumber dependence), the radiance for scene temperature Tscene (wavenumber dependence), : the radiance for the pointing mirror temperature Tmirror (wavenumber dependence), the radiance when viewing the calibration black body (bb) at temperature Tbb (wavenumber dependence), E the identity matrix, the atmospheric signal (wavenumber dependence), the signal when viewing the calibration black body at temperature Tbb (wavenumber dependence), the deep space (ds) signal (wavenumber dependence),
Then,
To derive the , finally, Eq. (10) is obtained,
The multiplicative factor of the first term in Eq. (10) is called Calb in the following Eq. (11) and included the non-linearity correction.
So, if we consider the non-linear effect based on Eq. (6), Eq. (11) can be recast as Eq. (12).
where pg is the polarization sensitivity gain between different pointing mirror angles towards the black body (bb in the various symbols) or deep space (ds in the various symbols) and nadir observation. DCb is independently observed and related to the cross-track angle. During both black body and deep space calibration, the pointing mirror is rotated along its axis by ±90∘ (from θCT=0, exact nadir observation) to view the deep space or the black body calibration target. The polarization sensitivities between calibration and nadir observation show gains due to the difference in incidence angle on the pointing mirror.
Finally,
The spectral radiance seen by the TANSO-FTS-2 instrument when viewing the black body is a combination of a direct emission from the black body (at the temperature: Tbb) and reflected radiance originating from various external surfaces that the black body views. The view factor (Abb_baffle, APMA_str, AIOA, ABS) for the black body bottom surface to all the external environmental surfaces that the black body can see is expressed as follows:
where is the radiance for the black body at a temperature Tbb (from housekeeping telemetry), the radiance for black body baffle at a temperature TPMA+Y (from housekeeping telemetry), the radiance for the pointing mirror assembly (PMA) structure panel at a temperature TPMA−Y(from housekeeping telemetry), the radiance for the integrated optics assembly (IOA) structure panel at a temperature TIOA+Z (from housekeeping telemetry), the radiance for beam splitter (BS) at a temperature TBS(from housekeeping telemetry), the black body baffle surface emissivity in band b, Abb_baffle, the black body view of the black body baffle, the pointing mechanism assembly (PMA) structure surface emissivity in band b, APMA_str the black body view of PMA structure, the integrated optics assembly (IOA) structure surface emissivity in band b, AIOA the black body view of the IOA structure, ABS the black body view of the beam splitter, and the pointing mirror surface emissivity in band b.
2.3 Mirror reflectance model
Due to the large mirror size, it is difficult to measure the mirror reflectance onboard the TANSO-FTS-2 instrument directly. During prelaunch calibration, the complex index of refraction of the mirror material (with coating) was characterized simultaneously with that of the actual flight mirror. Consequently, the pointing mirror reflectance is expressed as the following equations with the complex spectral index of refraction of the mirror coating m.
A star as a superscript is used for the complex conjugate in Eqs. (25) and (26). The emissivity of the pointing mirror is expressed in Eq. (27).
The calibration equation and related models were described in the previous section. The calibration procedure must be optimized for maximum spectral radiance accuracy. In this section, the optimization procedure for the above models is discussed.
Usually, the non-linear effect of a low-temperature scene is smaller than that of a high-temperature scene. We obtained the non-linear quadratic coefficient with a high-temperature target in the interferogram domain during the prelaunch calibration test. A non-linear coefficient is determined, which minimizes the out-of-band signal intensity of low-frequency components.
The first term of Eq. (10) is the main part of the polarization effect. We assume that the difference in spectral radiance in selected spectral regions between TANSO-FTS-2 and the coincident dataset, especially at low temperatures, is directly related to the polarization correction terms. We derive the ratio of p and s transmission against the wavenumber based on the IASI matchup dataset. This step makes use of the value of the mirror reflectance obtained during the prelaunch test where the initial parameters for polarization sensitivities are determined.
In the next step, the polarization sensitivity is further optimized with a non-linearity correction based on Eq. (13). In this optimization, we changed the domain from interferogram to spectra to reduce the unknown parameters with the spectra domain. As expressed in Eqs. (1) and (2), a total of five parameters (ADC conversion scale, gain factor, DAC conversion scale, offset signal, and non-linearity correction coefficients) have to be considered to derive a precise interferogram. In contrast, in the spectral domain, the parameters are non-linear correction coefficients and DC offset as expressed in Eq. (12), except for the polarization sensitivity gain. Then, the polarization sensitivity, non-linear correction coefficients, DC offset, and polarization sensitivity gain are optimized with Eq. (13) to minimize the difference of spectral radiance between TANSO-FTS-2 and IASI in the SNO condition. The range of brightness temperature for the comparison between TANSO-FTS-2 and IASI is wider than that of AIRS, so the SNO condition for IASI also apply for AIRS.
The optimized results of polarization sensitivity are presented in Fig. 2. This value is applied in version v210210 products with prelaunch pointing mirror reflectance.

Figure 2Polarization sensitivity model for bands 4 and 5. The blue line shows the polarization sensitivity as the ratio of p- and s-polarization transmission () against wavenumber. The gray line shows the observed spectral radiance in the TIR band for TANSO-FTS-2.
The comparison of TANSO-FTS-2 TIR band nadir and off-nadir comparisons provide a quantitative spectral assessment of the radiometric bias relative to the AIRS on AQUA, IASI on METOP-B, and TANSO-FTS on GOSAT.
In the following section, two types of coincident criteria are applied: SNO and cross-track, along-track 2O-SONO. Conventional weather satellites sensors, such as AIRS and IASI, have only observation capability in cross-track motion because the scanning motion is only performed in cross-track. In contrast, TANSO-FTS-2 and TANSO-FTS accommodate a two-axis agile pointing system to target the interesting observation location. Then, TANSO-FTS-2 can coordinate the cross-track of TANSO-FTS-2 and the cross-track of other satellites, and the along-track of TANSO-FTS-2 and cross-track of other satellites. The schematic diagrams of 2O-SONO coincident observation images are illustrated in Fig. 3. The coincidence criteria for SNO and 2O-SONO with satellite sensors are listed in Table 1. The coincident latitudes between AIRS and TANSO-FTS-2, between IASI and TANSO-FTS-2, and between TANSO-FTS and TANSO-FTS-2 are illustrated in both SNO (a) and 2O-SONO (b) in Fig. 4. The coincident points between the AIRS and TANSO-FTS-2 are in the mid-latitudes, and those of IASI and TANSO-FTS-2 are located at high latitudes. In contrast, the coincident points between TANSO-FTS and TASNO-FTS-2 cover the complete range of latitudes pole-to-pole. These lead to a comparison with different brightness temperature ranges for each matching dataset. We focused on the comparison in the following spectral ranges: CO2 spectral range (681.99–691.66 cm−1), atmospheric window channel (900.3–903.78 cm−1), O3 spectral range (1030.08–1039.69 cm−1), and CH4 spectral range (1304.36–1306.68 cm−1) the same as our previous estimation (Suto et al., 2021; Kataoka et al., 2019). Since the spectral resolution of AIRS and IASI is different from that of TANSO-FTS-2, we convolve the TANSO-FTS-2 spectra with AIRS spectral response function to comparing these data. After that, the average brightness temperature for four spectral regions is computed for both sounders. The same convolution and averaging processes are also applied to IASI data.
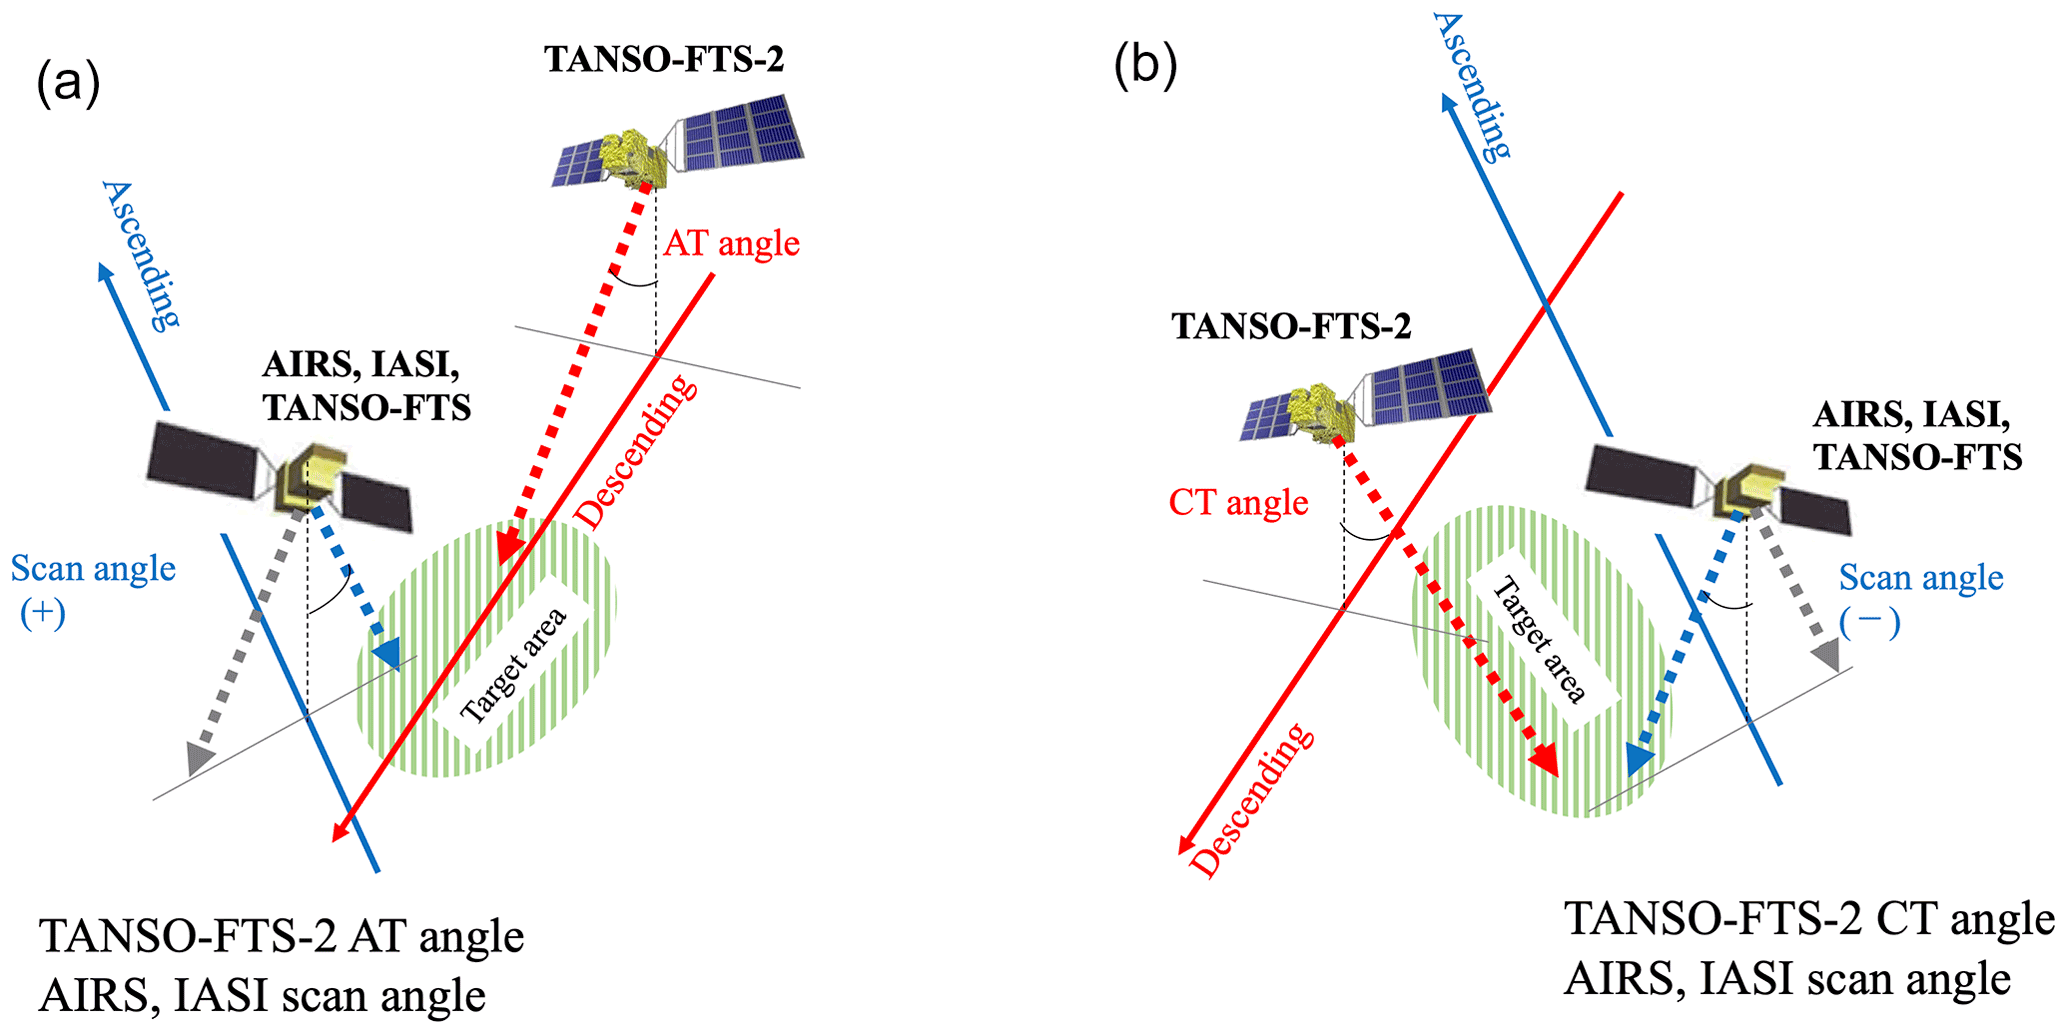
Figure 3Schematic diagram for coincident observation between TANSO-FTS-2 and other satellites. (a) Comparison between along-track observation by TANSO-FTS-2 and cross-track observation by other satellites (new method), (b) comparison between cross-track observation by TANSO-FTS-2 and cross-track observation by other satellite (conventional methods).
Table 1Temporal and spatial coincidence conditions for comparing SNO and 2O-SONO.
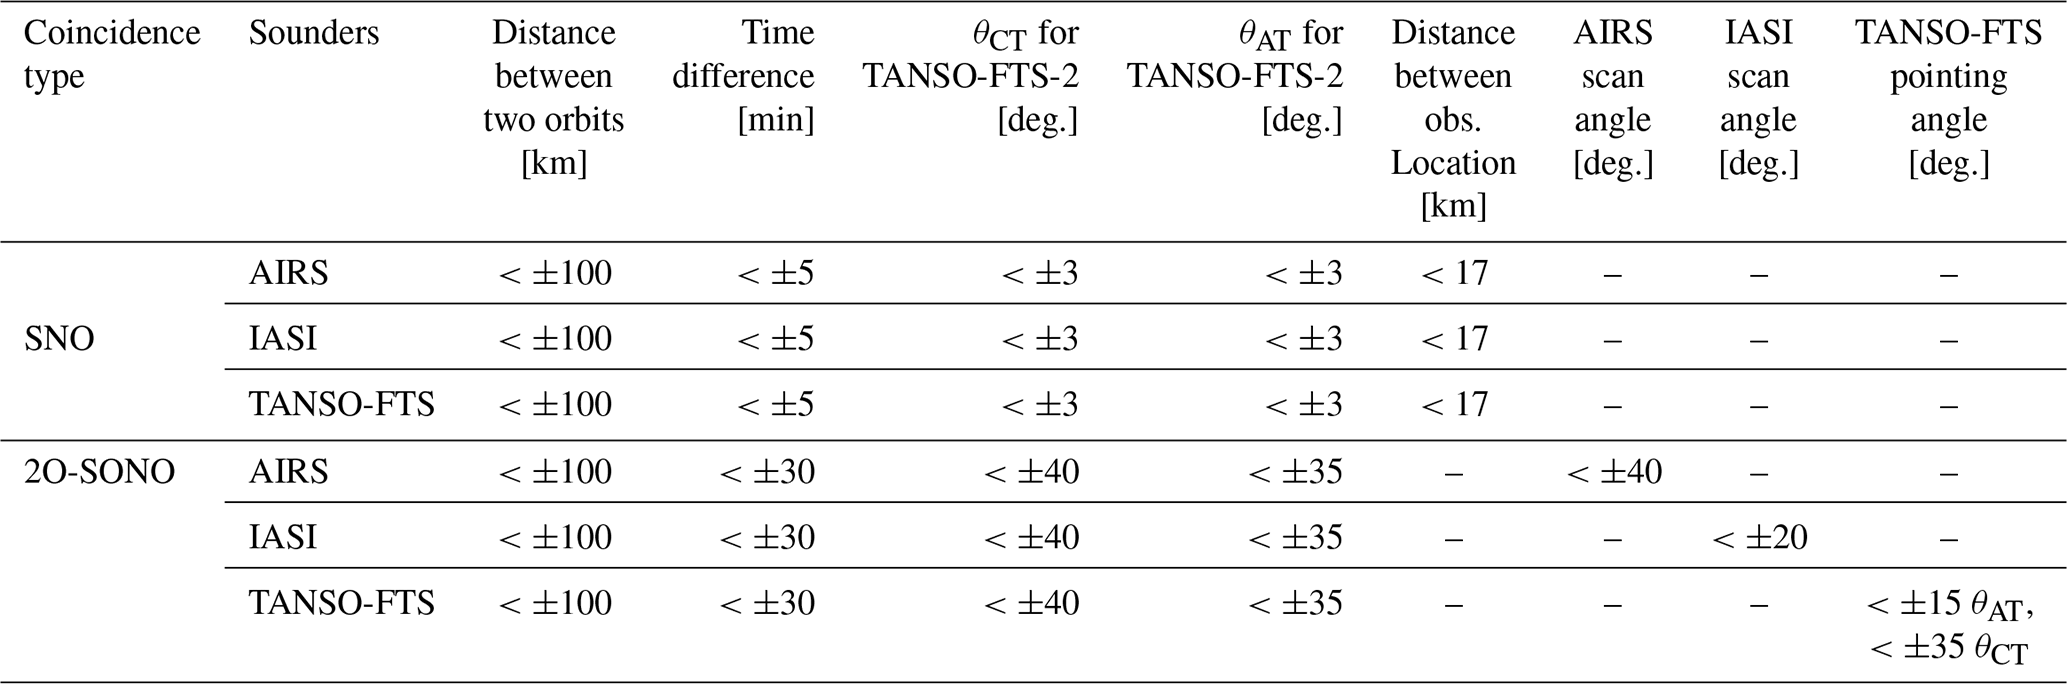
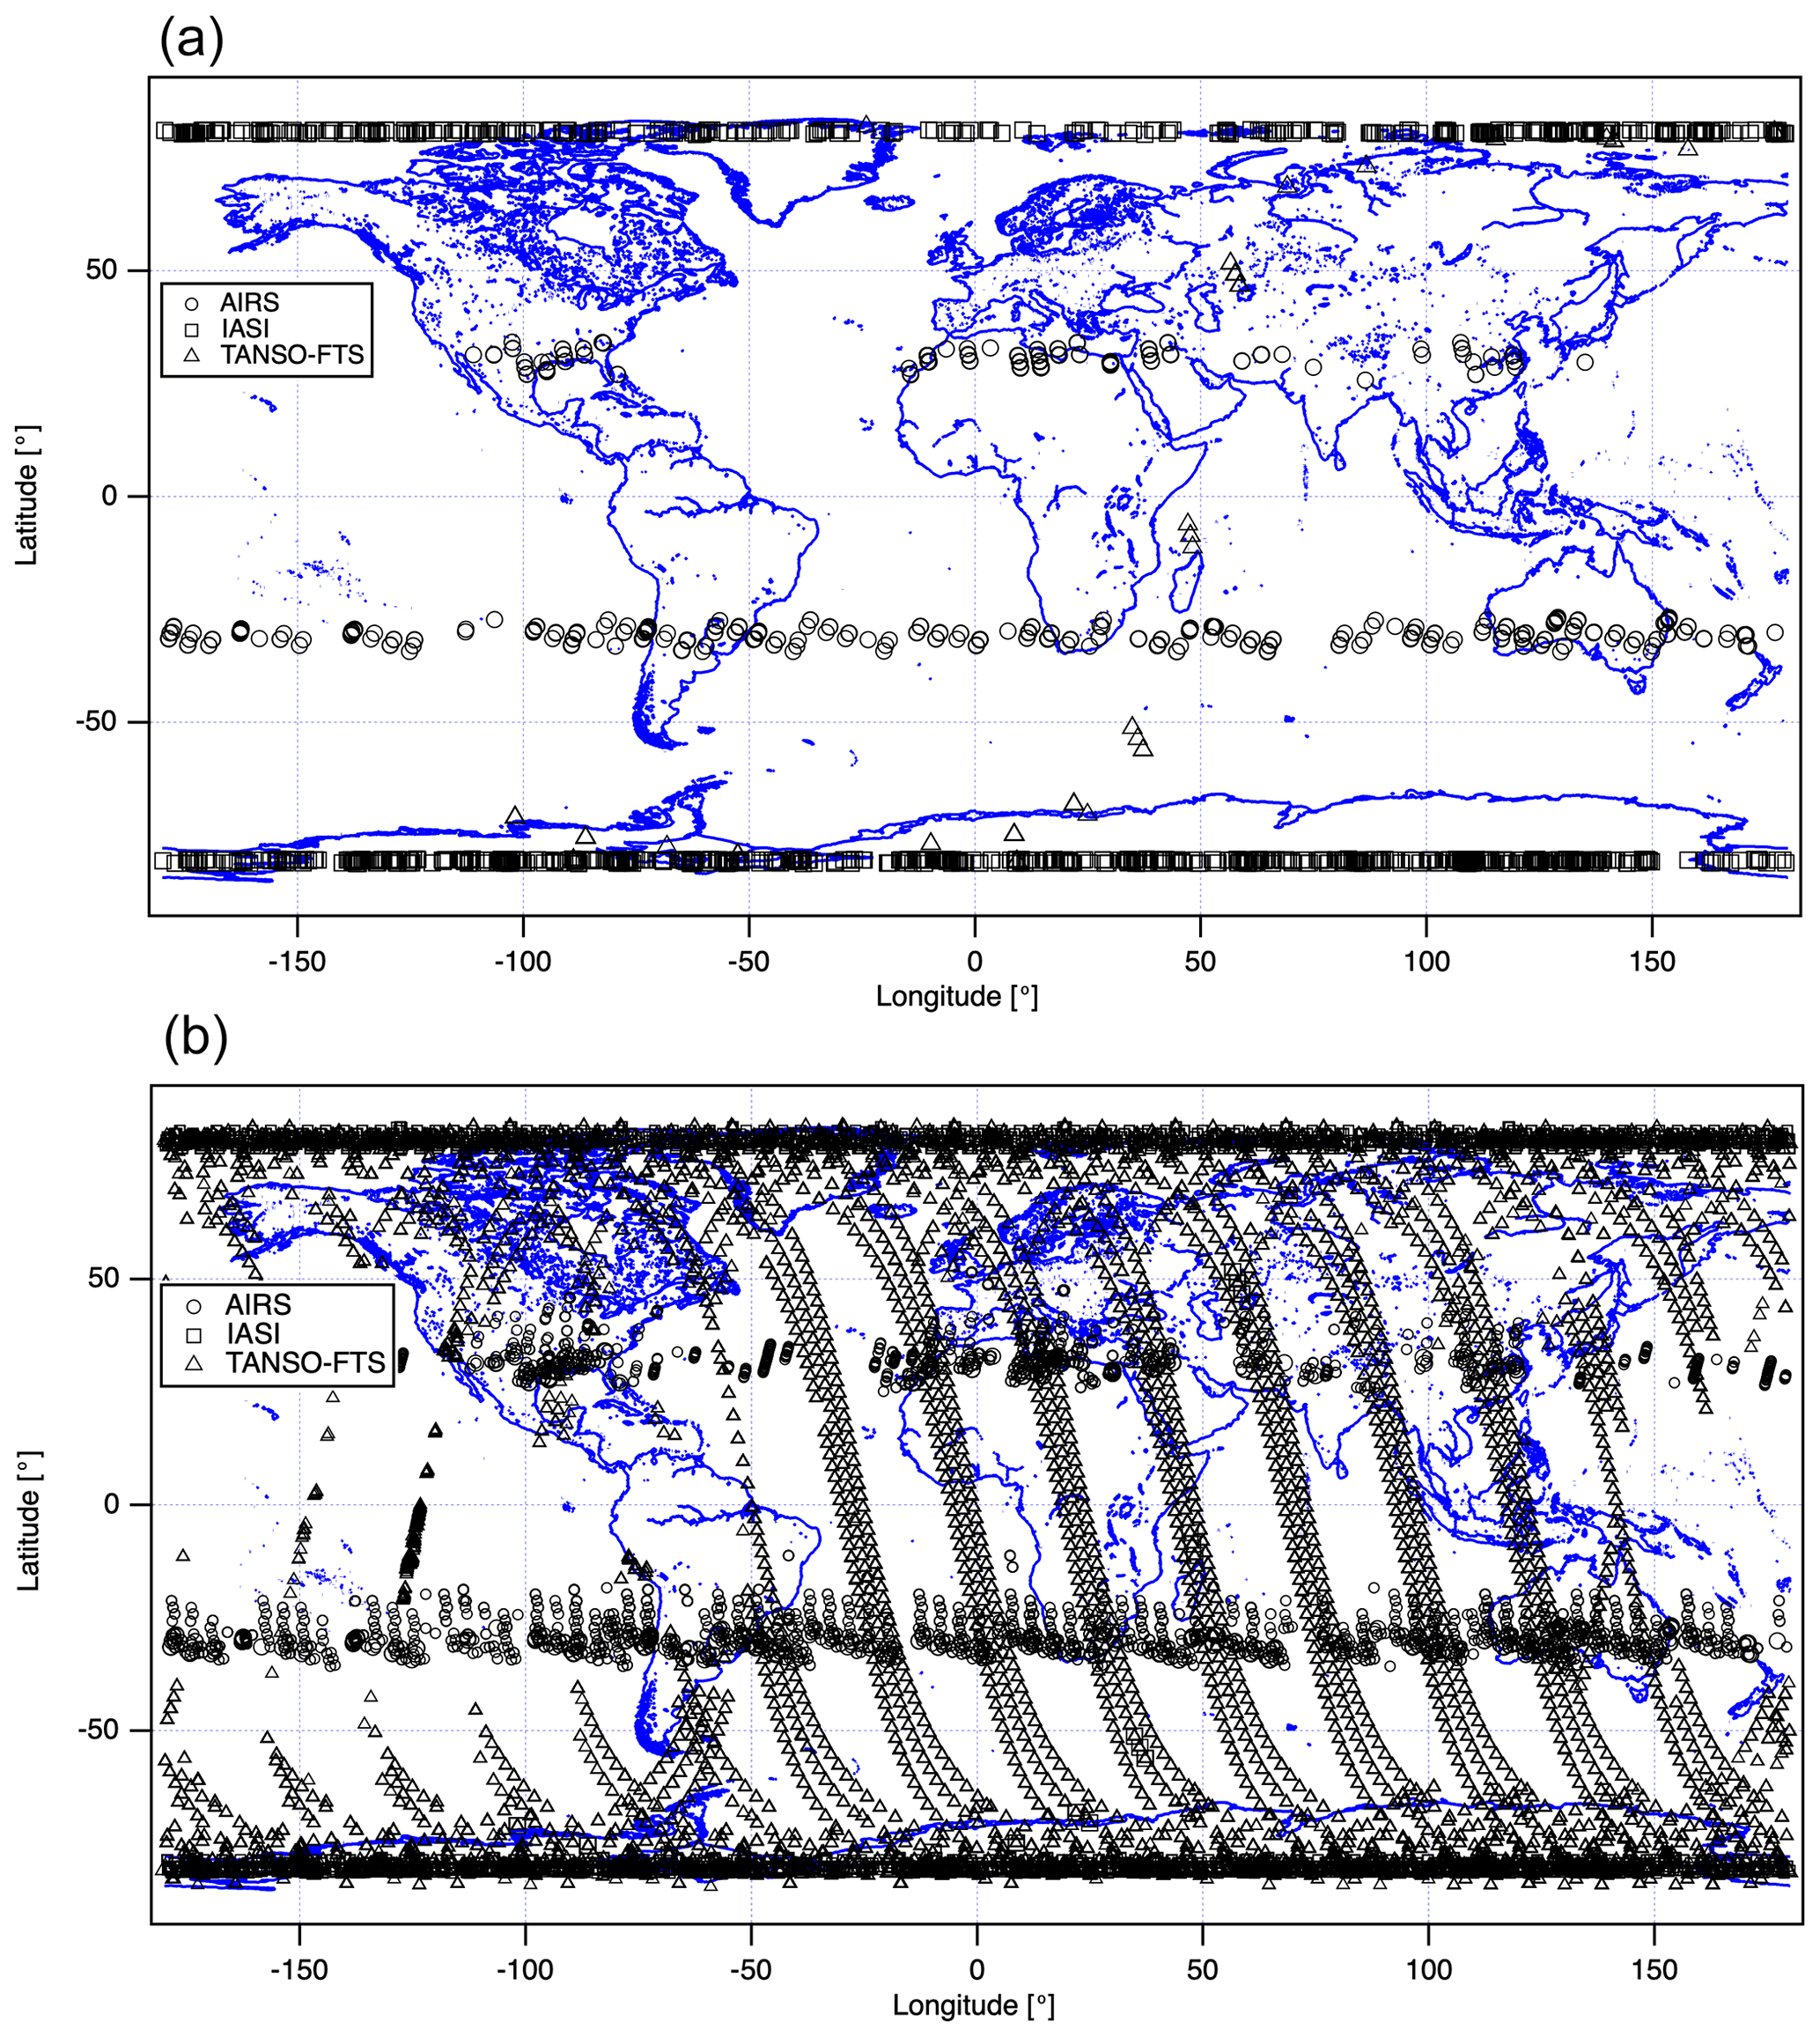
Figure 4Comparing TANSO-FTS-2 with other sounders: coincident latitude and longitude map between TANSO-FTS-2 and AIRS/IASI/TANSO-FTS for SNO (a) and 2O-SONO (b).
As for AIRS data, AIRS L1C data were applied (AIRS Science Team/Larrabee Strow, 2019). For the IASI, IASI-B data were selected from the NOAA CLASS archive. Aumann et al. (2019) studied the long-term stability of AIRS spectra as compared with calculated spectra over tropical oceans at night and found that the trend of all AIRS longwave channels in the surface sensitive channels was quite small (2 mK yr−1). In addition, AIRS and IASI are well characterized, and the bias of these sensors was reported to be less than 0.2 K (Jouglet et al., 2014). Then, our calibration target is to provide the consistent spectral radiance among the TIR sounder for full coverage of TANSO-FTS-2 observation angles.
To compare TANSO-FTS and TANSO-FTS-2, version v230231 of TANOS-FTS, released on June 2021, was selected. This version has improved the consistency between AIRS and IASI for a better polarization coefficient of the pointing mirror.
4.1 Comparison between AIRS and TANSO-FTS-2, IASI and TANSO-FTS-2, and TANSO-FTS and TANSO-FTS-2 with the SNO condition
Figure 5 shows the brightness temperature differences (TANSO-FTS-2 values minus other satellite values) in 1 K gridded bin average (mean) at four focused ranges against the atmospheric window temperature between TANSO-FTS-2 of version v210210, AIRS, IASI, and TANSO-FTS for SNO. The brightness temperature differences between TANSO-FTS-2 of version v102102 and AIRS, IASI, and TANSO-FTS are also plotted in Fig. 5 for reference. The data periods for each comparison are listed in Table 2. Figure 5 suggests that version v210210 products are more consistent with AIRS and IASI data than version v102102 in all ranges, especially in the low-temperature atmospheric window. In addition, the low-temperature biases and significant deviations were removed in version v210210 products in the region around 7.6 µm covering the strong CH4 signature. Comparing version v210210 and version v102102, 0.5 to 1 K low-temperature biases are removed. The statistical analysis results are also summarized in Table 2. As suggested in Table 2, the standard deviation (SD) between TANSO-FTS-2 and AIRS, IASI is reduced with version v210210, especially in spectral ranges for CO2 and CH4. In comparing TANSO-FTS-2 and TANSO-FTS, the deviation is increased with version v210210. As shown in Fig. 5, in the temperature range from 180 to 240 K, the TANSO-FTS product presents large positive values against TANSO-FTS-2 for CO2 and CH4 spectral ranges. This means that the TANSO-FTS has inconsistent values at lower temperatures, especially for CO2 and CH4. In addition, the negative values are detected from 240 to 260 K in the CH4 spectral range. The previous version of TANSO-FTS-2 has negative biases at low temperatures. The consistency between TANSO-FTS-2 and TANSO-FTS agrees in these regions. In other words, version v210210 of TANSO-FTS-2 products removes the low-temperature biases, even though TANSO-FTS version v230231 still has lower temperature biases.
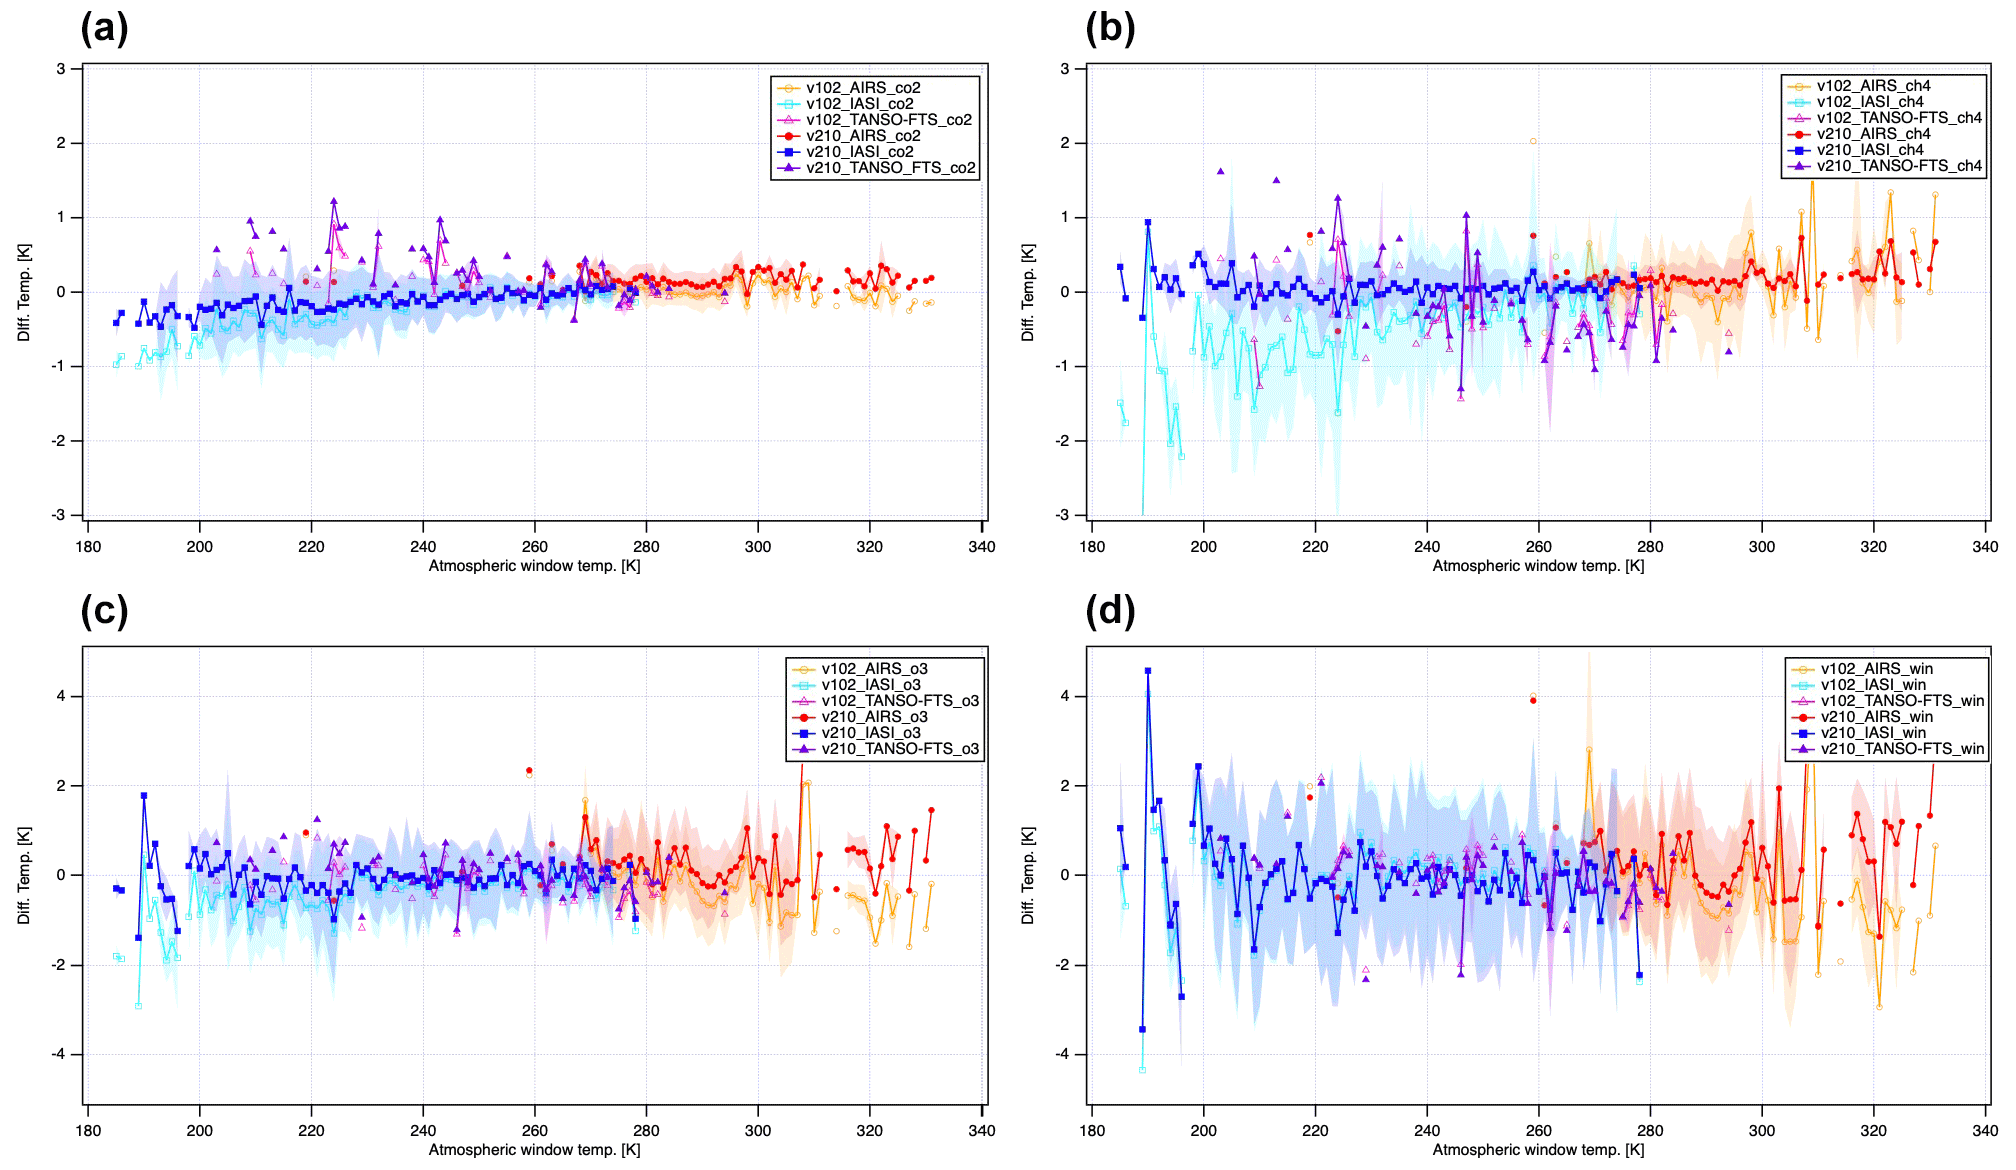
Figure 5The channel-dependent brightness temperature difference in 1 K bins against atmospheric window temperature for the SNO condition between TANSO-FTS-2 and AIRS/IASI/TANSO-FTS. (a) CO2 spectral range, (b) CH4 spectral range, (c) O3 spectral range, and (d) atmospheric window channel. The filled dots are the data points, and each shade presents a standard deviation (1σ) for each 1 K bin.
Table 2Averaged brightness temperature difference (mean) and standard deviation (SD) between TANSO-FTS-2 and three other infrared sounders in the SNO configuration.
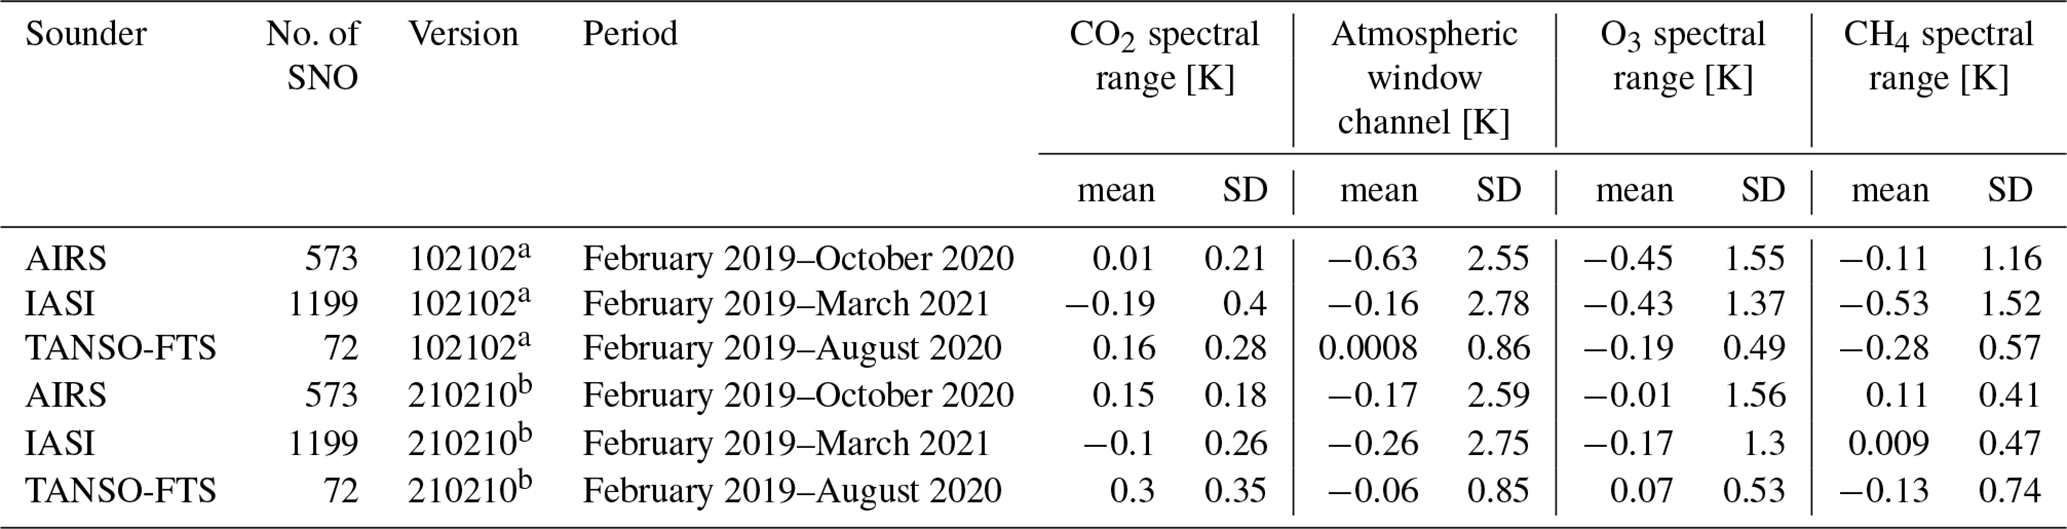
a Previous version. b New version.
Figure 6 presents the time series of the brightness temperature difference between TANSO-FTS-2 and IASI, between TANSO-FTS-2 and AIRS, and between TANSO-FTS-2 and TANSO-FTS for four spectral ranges, both versions v210210 and v102102. During winter in the Southern Hemisphere, the version v102102 products present negative values and large deviations due to seasonal variation, especially in the CO2 and CH4 spectral ranges. Cold temperature scenes over Antarctica were selected as coincident observation locations. In contrast, version v210210 products suggest no seasonal variation except for a comparison with the first TANSO-FTS instrument. These plots also indicate that version v230231 of TANSO-FTS products has a negative bias against cold scenes, observed over high-latitude coincident points.
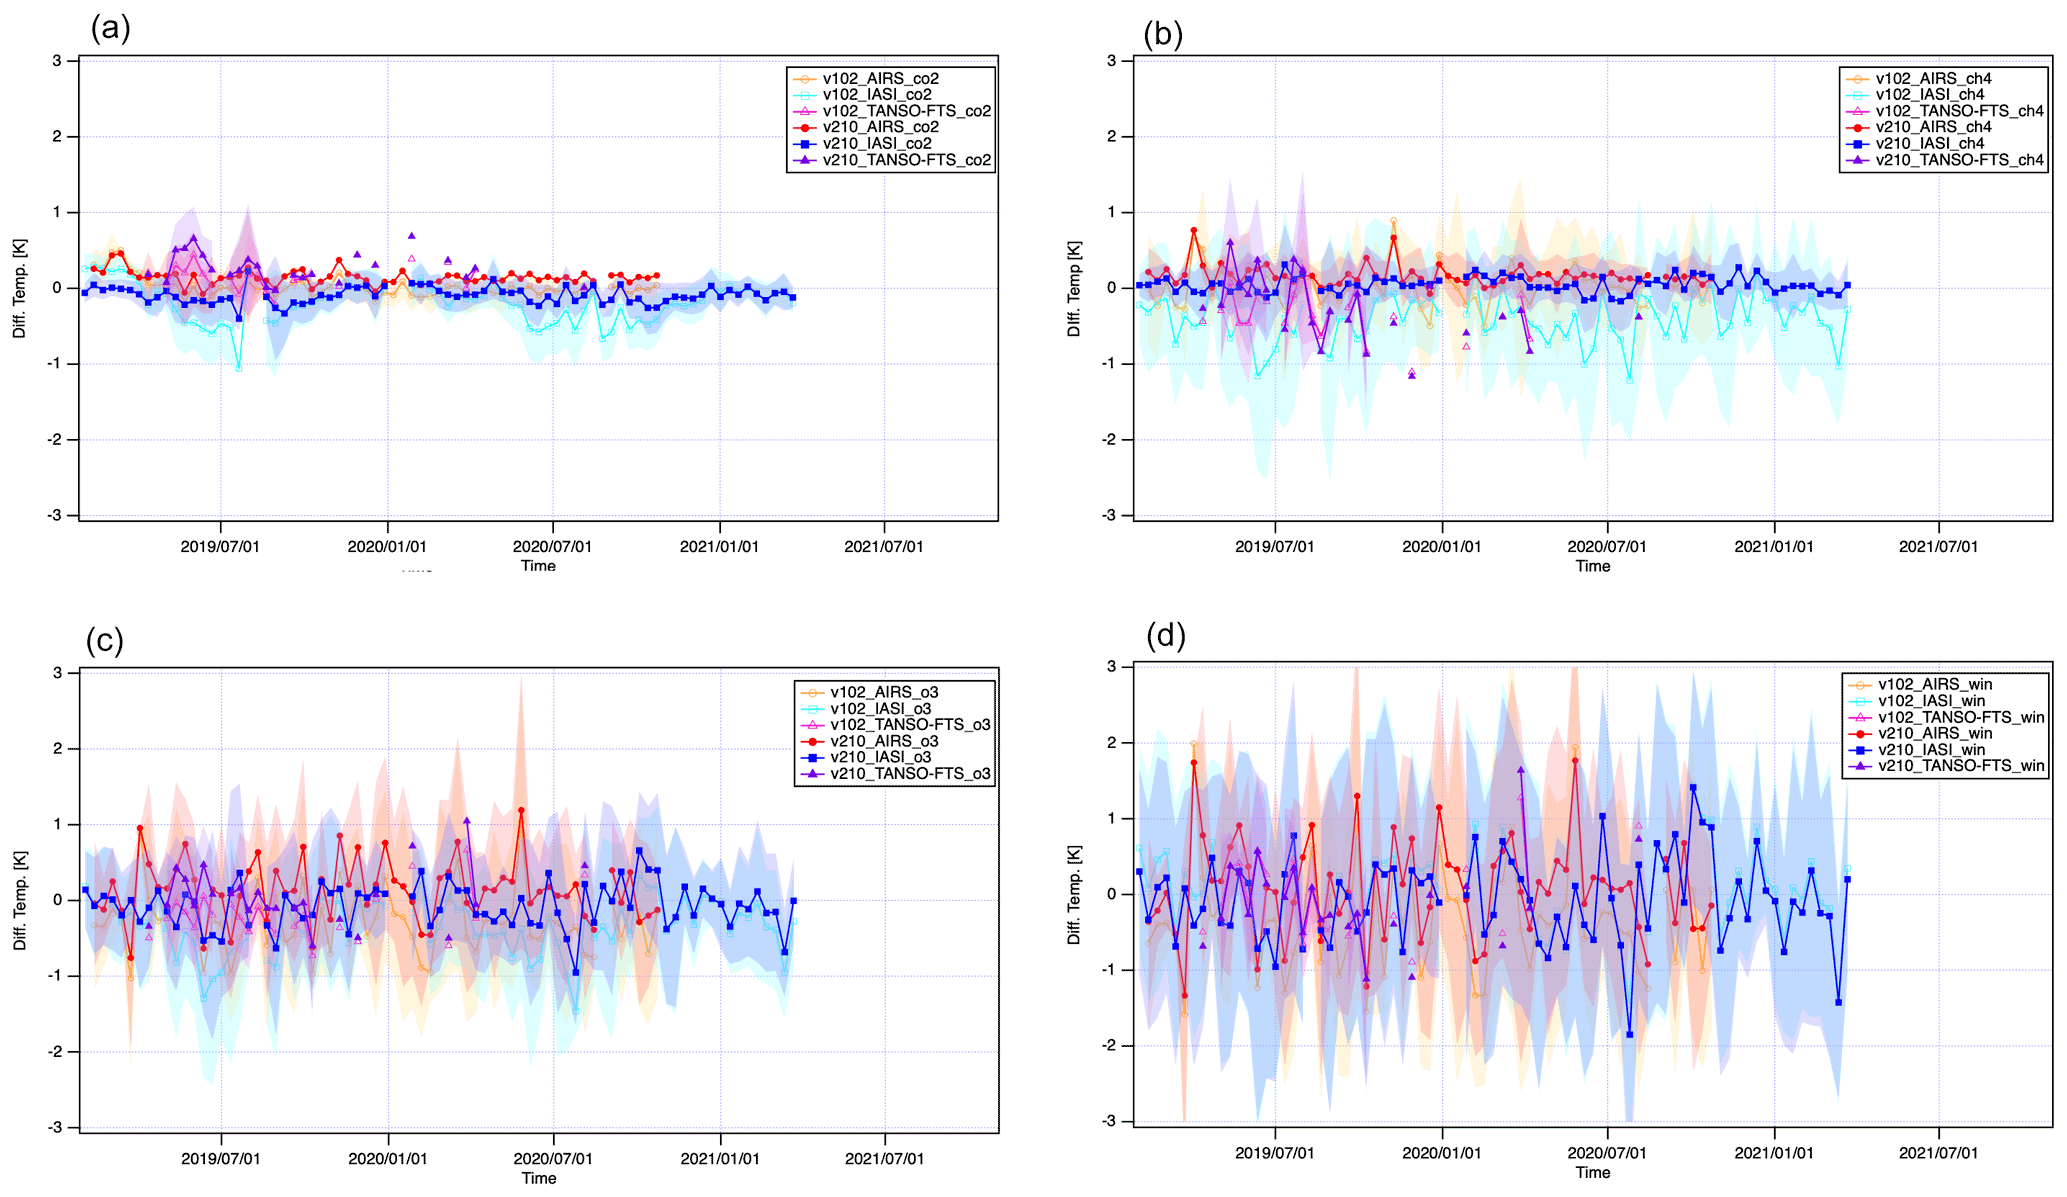
Figure 6Channel-dependent brightness temperature difference for a 10 d average against atmospheric window temperature for the SNO condition between TANSO-FTS-2 and AIRS/IASI/TANSO-FTS. (a) CO2 spectral range, (b) CH4 spectral range, (c) O3 spectral range, and (d) atmospheric window channels.
As a result of SNO, version v210210 of TANSO-FTS-2 products shows that the averaged bias is less than ±0.3 K for all four ranges. In addition, the deviations against IASI and AIRS for the CO2 and CH4 spectral ranges are less than 0.3 and 0.5 K, respectively. These results suggest that the consistency for the CO2 and CH4 spectral ranges between TANSO-FTS-2 and AIRS, between TANSO-FTS-2 and IASI, is much improved. The comparison between TANSO-FTS-2 and TANSO-FTS shows a significant difference for low-temperature scenes, but we have to conclude that version v230231 of the TANSO-FTS product has a challenging issue at low temperatures, especially at high latitudes, for both CO2 and CH4 spectral ranges. Therefore, the calibration of the TIR band for TANSO-FTS will be updated in the next version of the level 1 product to improve the consistency of brightness temperature, especially in low-temperature, high-latitude regions.
4.2 Comparison between AIRS and TANSO-FTS-2, IASI and TANSO-FTS-2, and TANSO-FTS and TANSO-FTS-2 with the 2O-SONO condition
As described in the previous section, version v210210 of the TANSO-FTS-2 product agrees with AIRS and IASI products in nadir coincident observations. In the next step, the comparison on 2O-SONO was made to confirm the incident angle dependency of the TANSO-FTS-2 observations. The coincident conditions for 2O-SONO are listed in Table 1.
Figure 7 presents the brightness temperatures differences between TANSO-FTS-2 and AIRS, TANSO-FTS-2 and IASI, TANSO-FTS-2 and TANSO-FTS with TANSO-FTS-2 in 1∘ bins of the pointing mirror angles along and cross-track angles. The deviation of each bin is plotted with a shaded area. The coincident observations between TANSO-FTS-2 and AIRS in the 2O-SONO configuration presented in Fig. 7 were selected with θCT (AIRS) angles in the range +40 and −40∘ and θCT (TANSO-FTS-2) angles in the range +40 and −40∘, whereas the related θCT (IASI) angles are in the range +20 and −20∘ as listed in Table 1.
Figure 7a shows that the brightness temperature difference between TANSO-FTS-2 and AIRS is almost stable with θAT (TANSO-FTS-2) angles in the range ±10∘. As shown in Fig. 7a, the brightness temperature difference between TANSO-FTS-2 and AIRS increased for larger θAT (TANSO-FTS-2) angles. In contrast, the dependence of the cross-track angle plotted in Fig. 7b is not clear, except for the CH4 range for θCT (TANSO-FTS-2) in the range 5 to 10∘.
Figure 7c and e also present the brightness temperature difference between TANSO-FTS-2 and IASI and between TANSO-FTS-2 and TANSO-FTS against θAT (TANSO-FTS-2) angles, respectively. These plots also suggest that the brightness temperature difference depends on θAT (TANSO-FTS-2) angles. The dependence is almost flat between −10 to +10∘ of θAT (TANSO-FTS-2) angles. This is a similar feature to the results of the AIRS comparison. Figure 7d and f show the brightness temperature difference between TANSO-FTS-2 and IASI and between TANSO-FTS-2 and TANSO-FTS against a θCT (TANSO-FTS-2), respectively. Figure 7d suggests that the brightness temperature difference does not depend on θCT (TANSO-FTS-2) angles in the ranges of CO2, CH4, O3, and in the atmospheric window region. In contrast, a cross-track dependency is observed for the CH4 and O3 ranges in Fig. 7f, which compares TANSO-FTS-2 and TANSO-FTS.
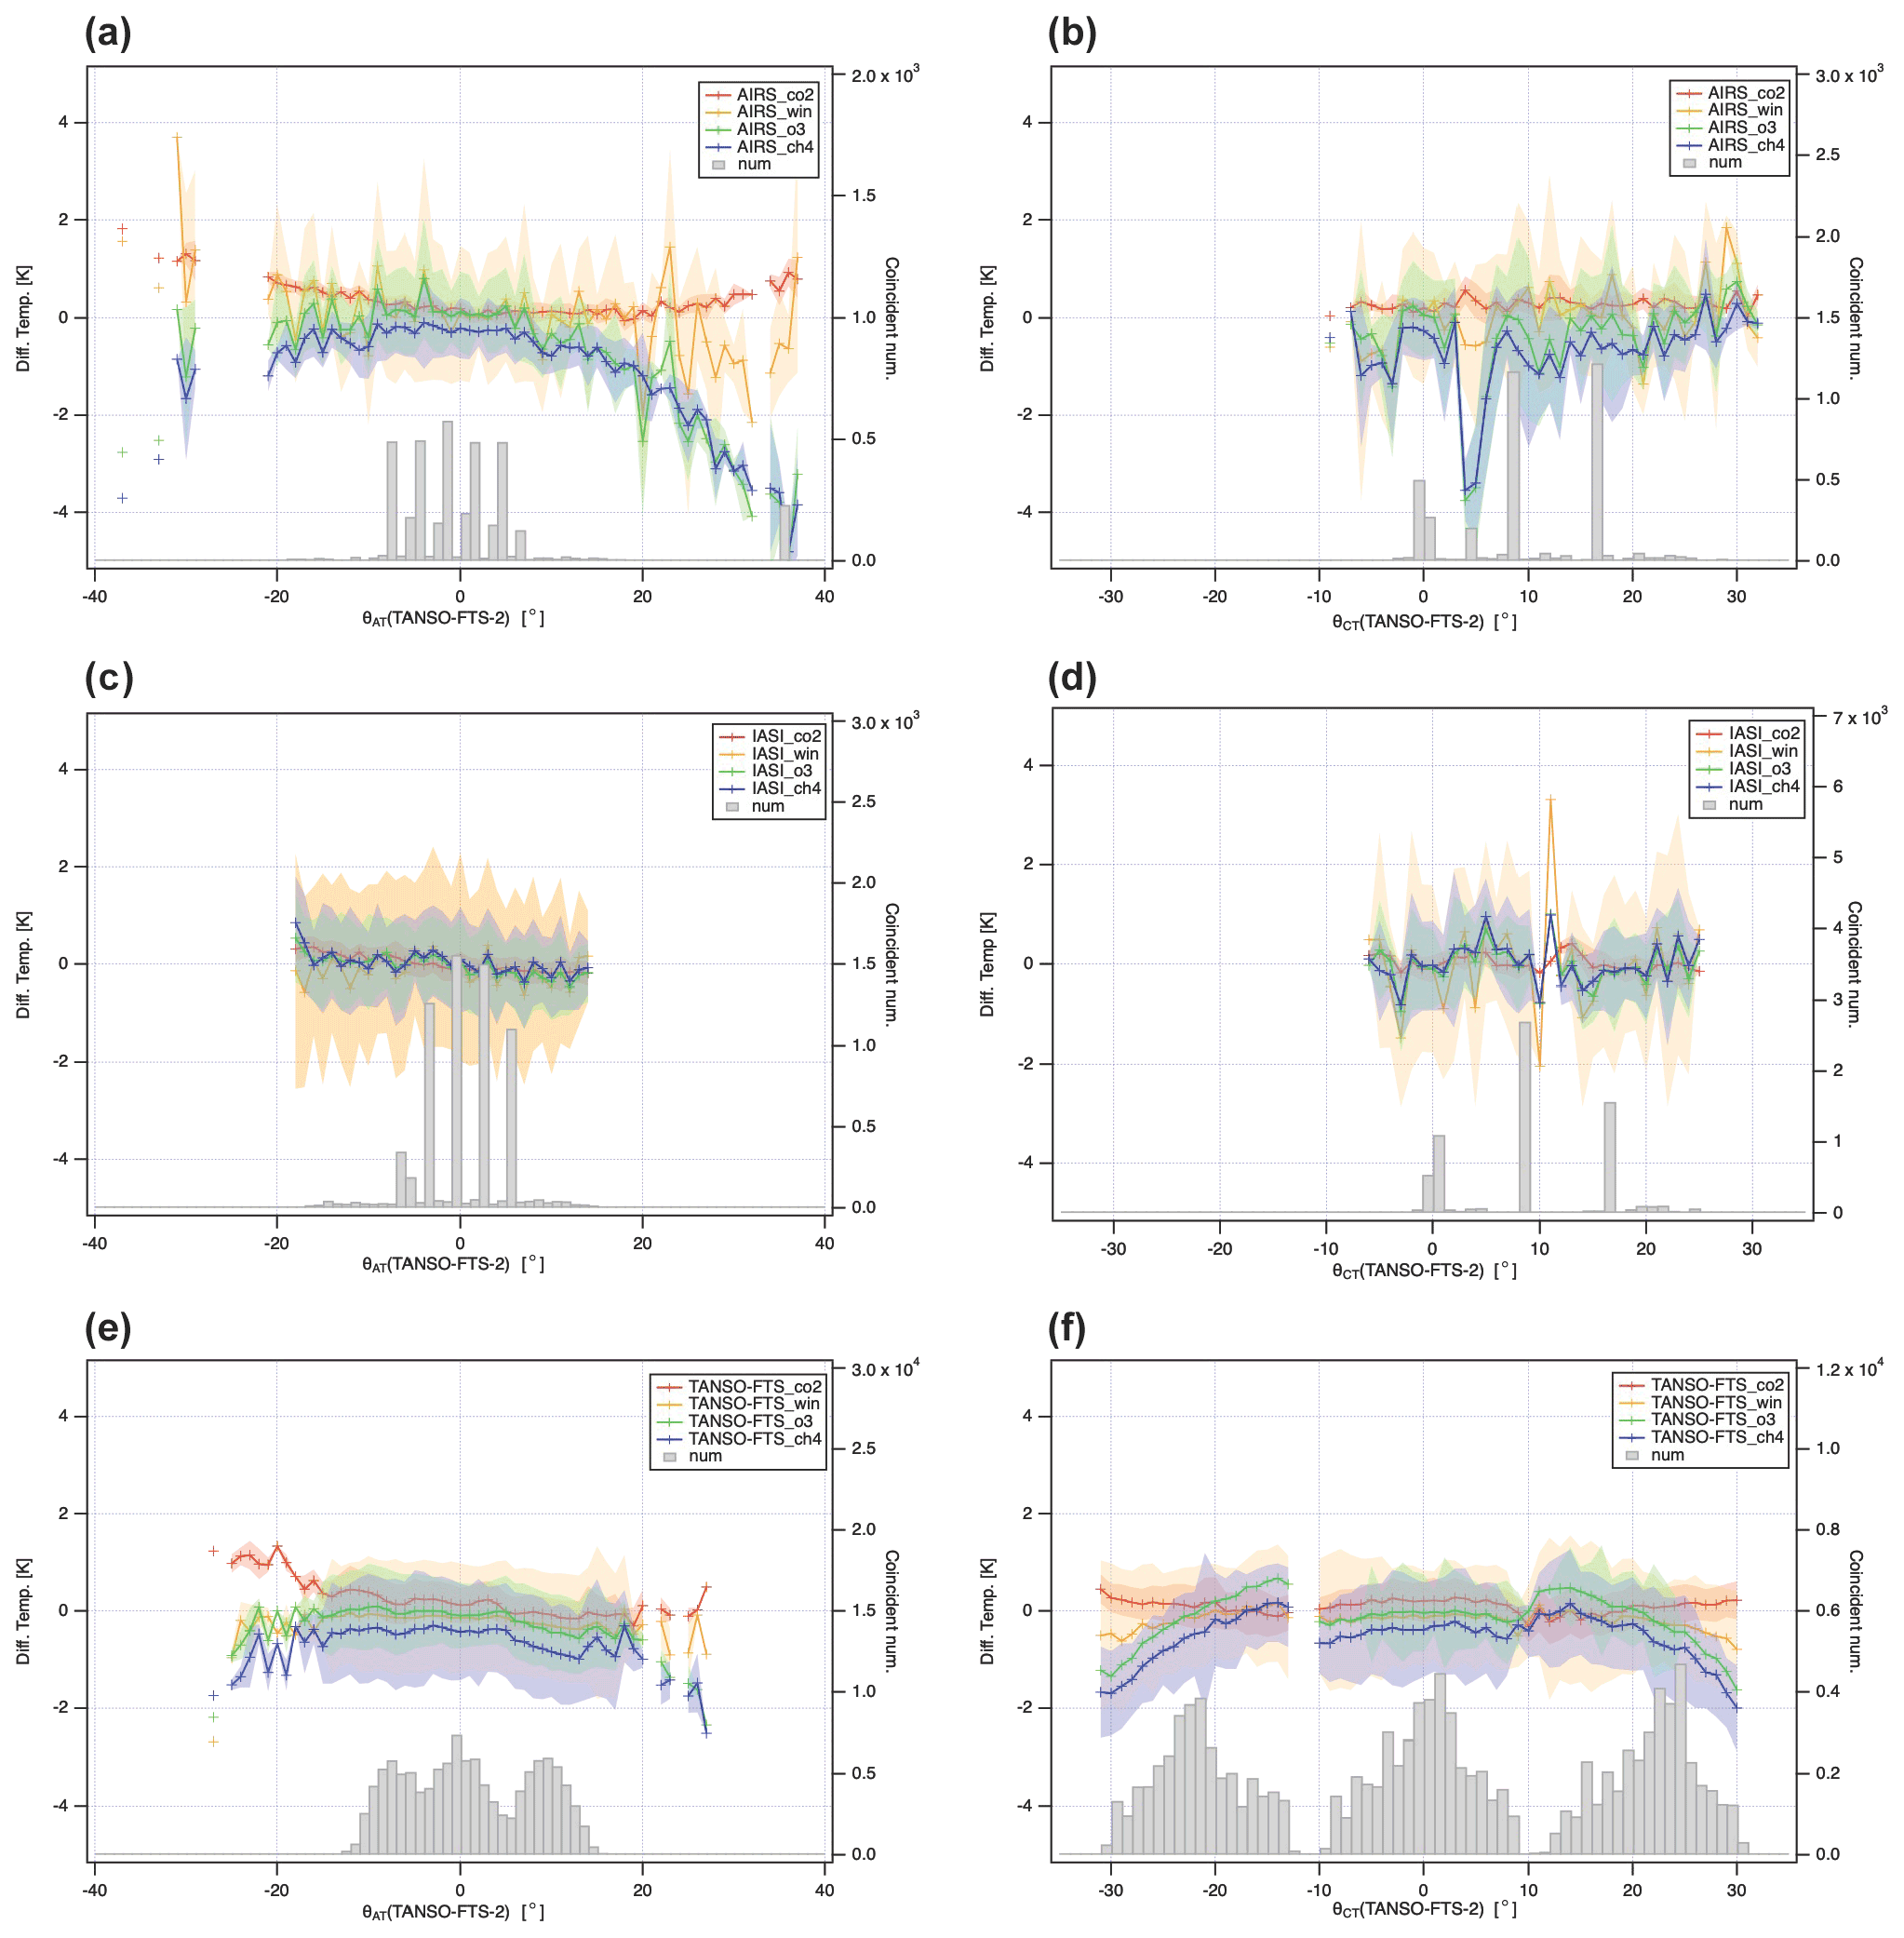
Figure 7Channel-dependent brightness temperature difference in 1∘ the angular bin average against TANSO-FTS-2 θAT (a, c, e) and θCT (b, d, f) for 2O-SONO for AIRS, IASI, and TANSO-FTS. The shaded areas represent the deviation (1σ) for each grid. The gray bars indicate the number of averaged data in each bin.
Figure 8 shows a 1∘ along-track (AT) by 1∘ cross-track (CT) grid average brightness temperature difference between TANSO-FTS-2 and AIRS, between TANSO-FTS-2 and IASI, and between TANSO-FTS-2 and TANSO-FTS. These figures also clearly present the dependence on the along-track angle, especially in the CO2 spectral range. For the TANSO-FTS comparison, a cross-track angle dependence is also observed, even though the comparison between TANFO-FTS-2 and AIRS and that between TANSO-FTS-2 and IASI do not indicate a cross-track angle dependence. Comparing Figs. 7f and 8f, we found that the brightness temperature difference with the significant cross-track angle condition shows large biases.
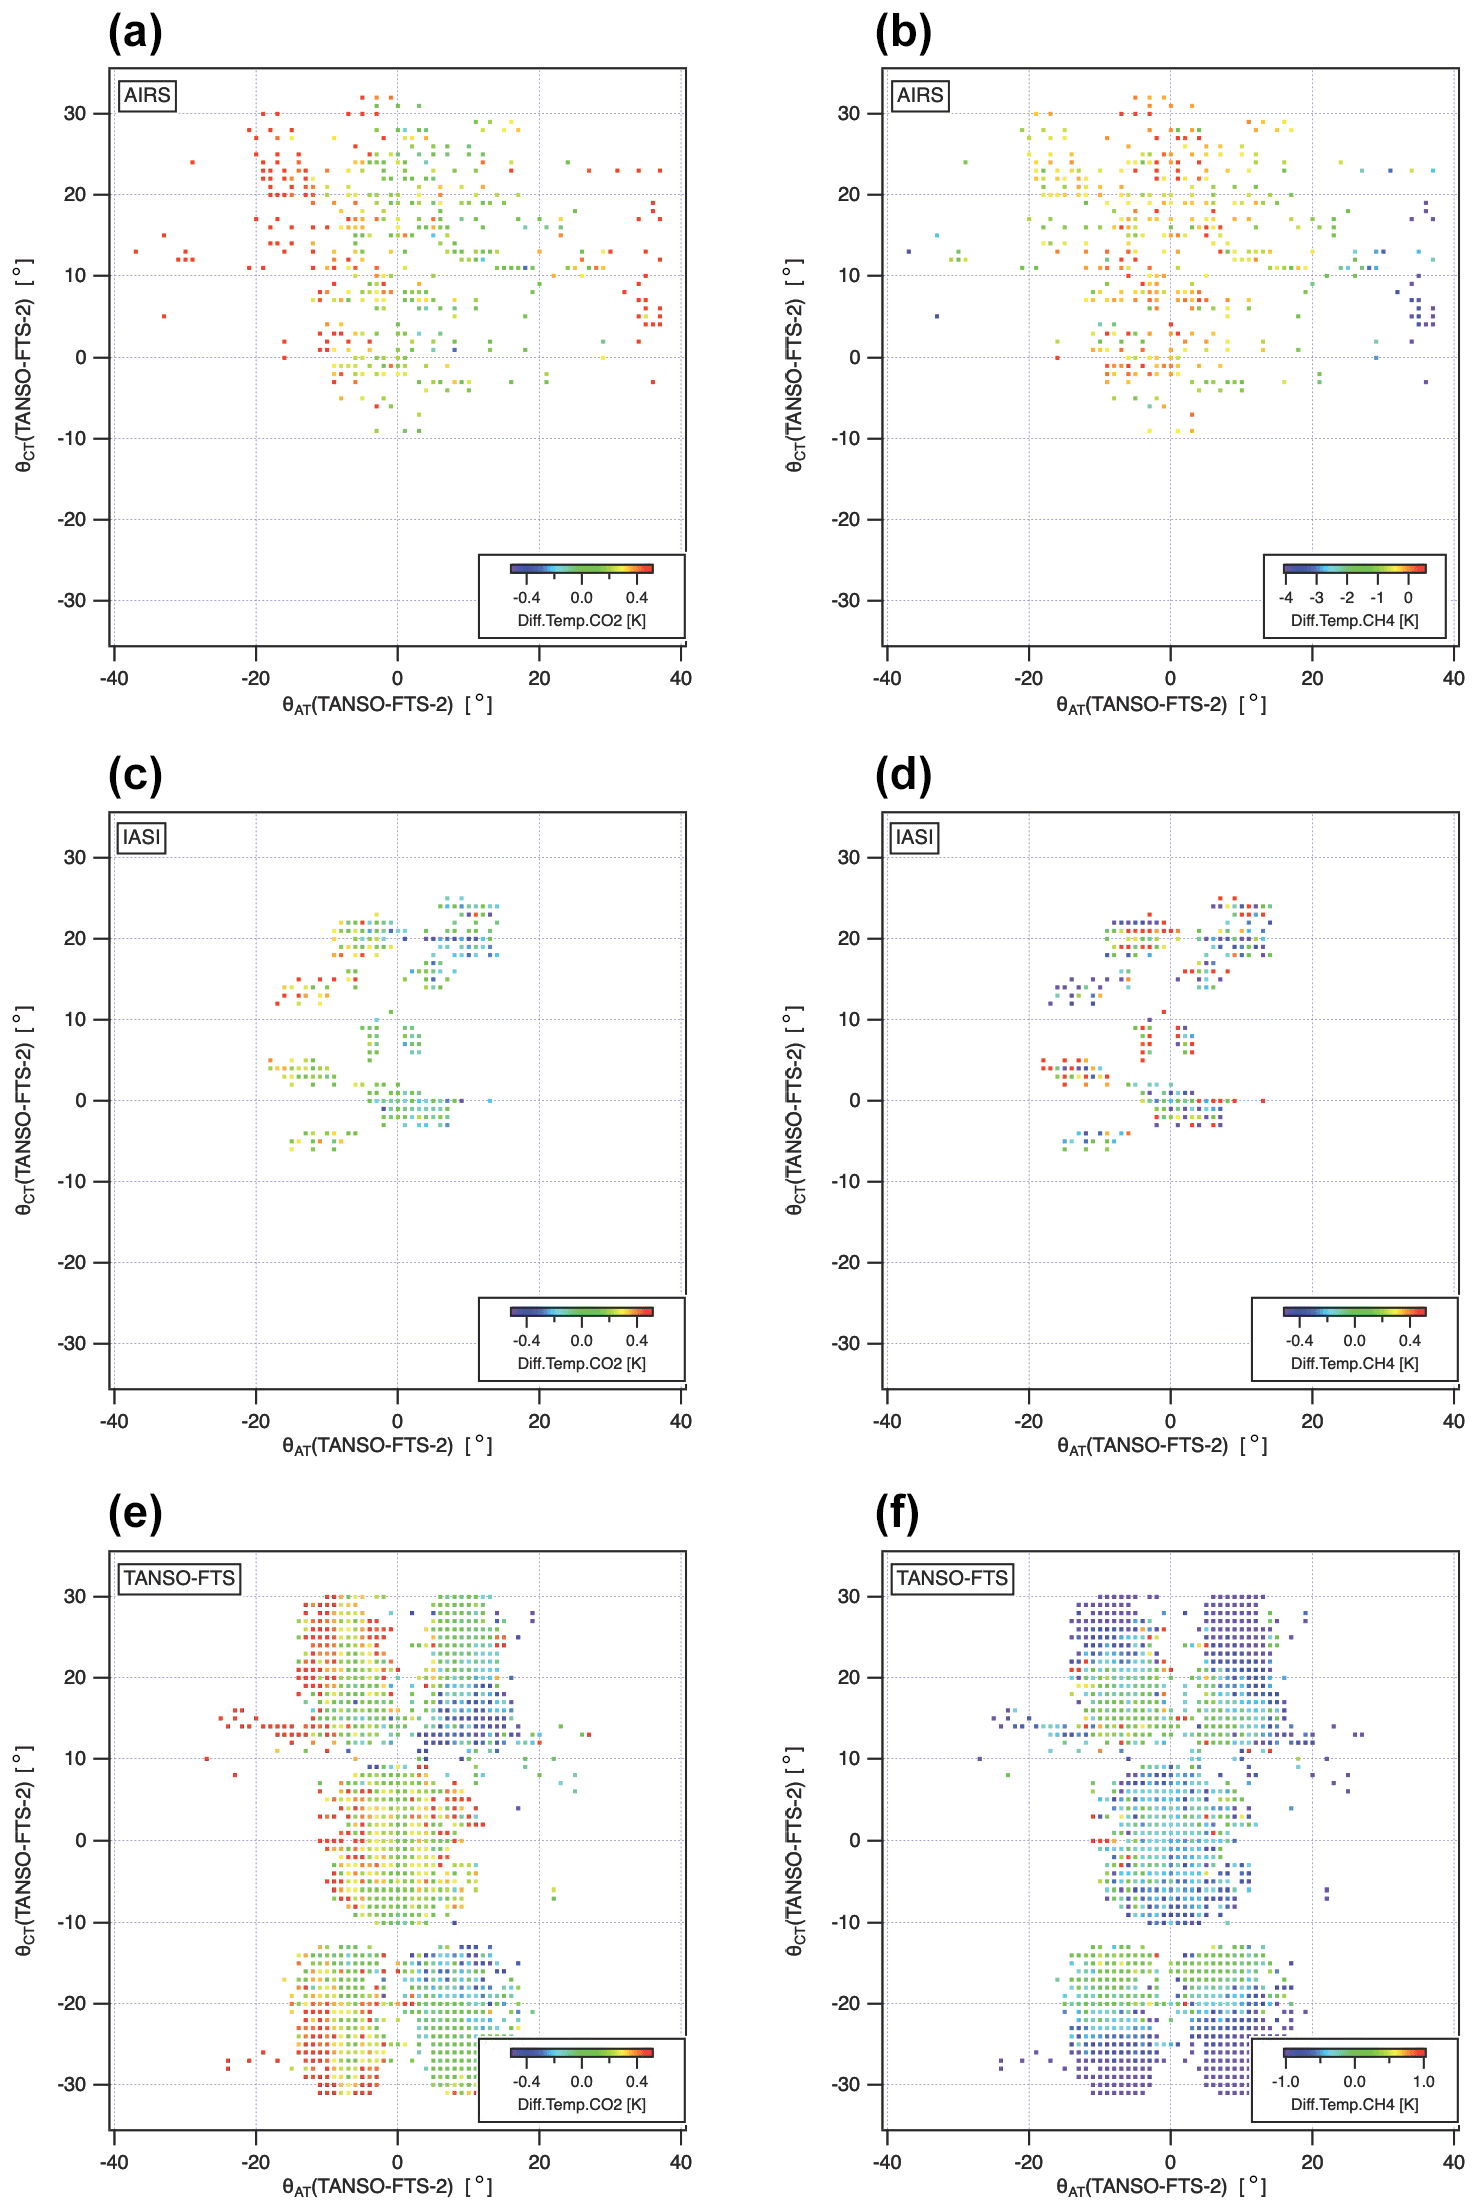
Figure 8The (θCT) gridded brightness temperature difference between TANSO-FTS-2 and AIRS/IASI/TANSO-FTS for the CO2 and CH4 spectral ranges.
As presented in Fig. 5, TANSO-FTS has a lower temperature bias in the CO2 and CH4 spectral ranges in SNO. Therefore, the brightness temperature differences at four spectral ranges in the 1 K gridded average against the atmospheric window temperature are plotted in Fig. 9 for 2O-SONOs. As shown in Fig. 9, the lower temperature bias in TANSO-FTS is the same as SNO. In addition, a high-temperature bias in the CH4 spectral range is the same as the TANSO-FTS. Therefore, we conclude that TANSO-FTS-2 does not have a cross-track dependence on TANSO-FTS. The feature is related to the brightness temperature bias in TANSO-FTS version v230231 products.
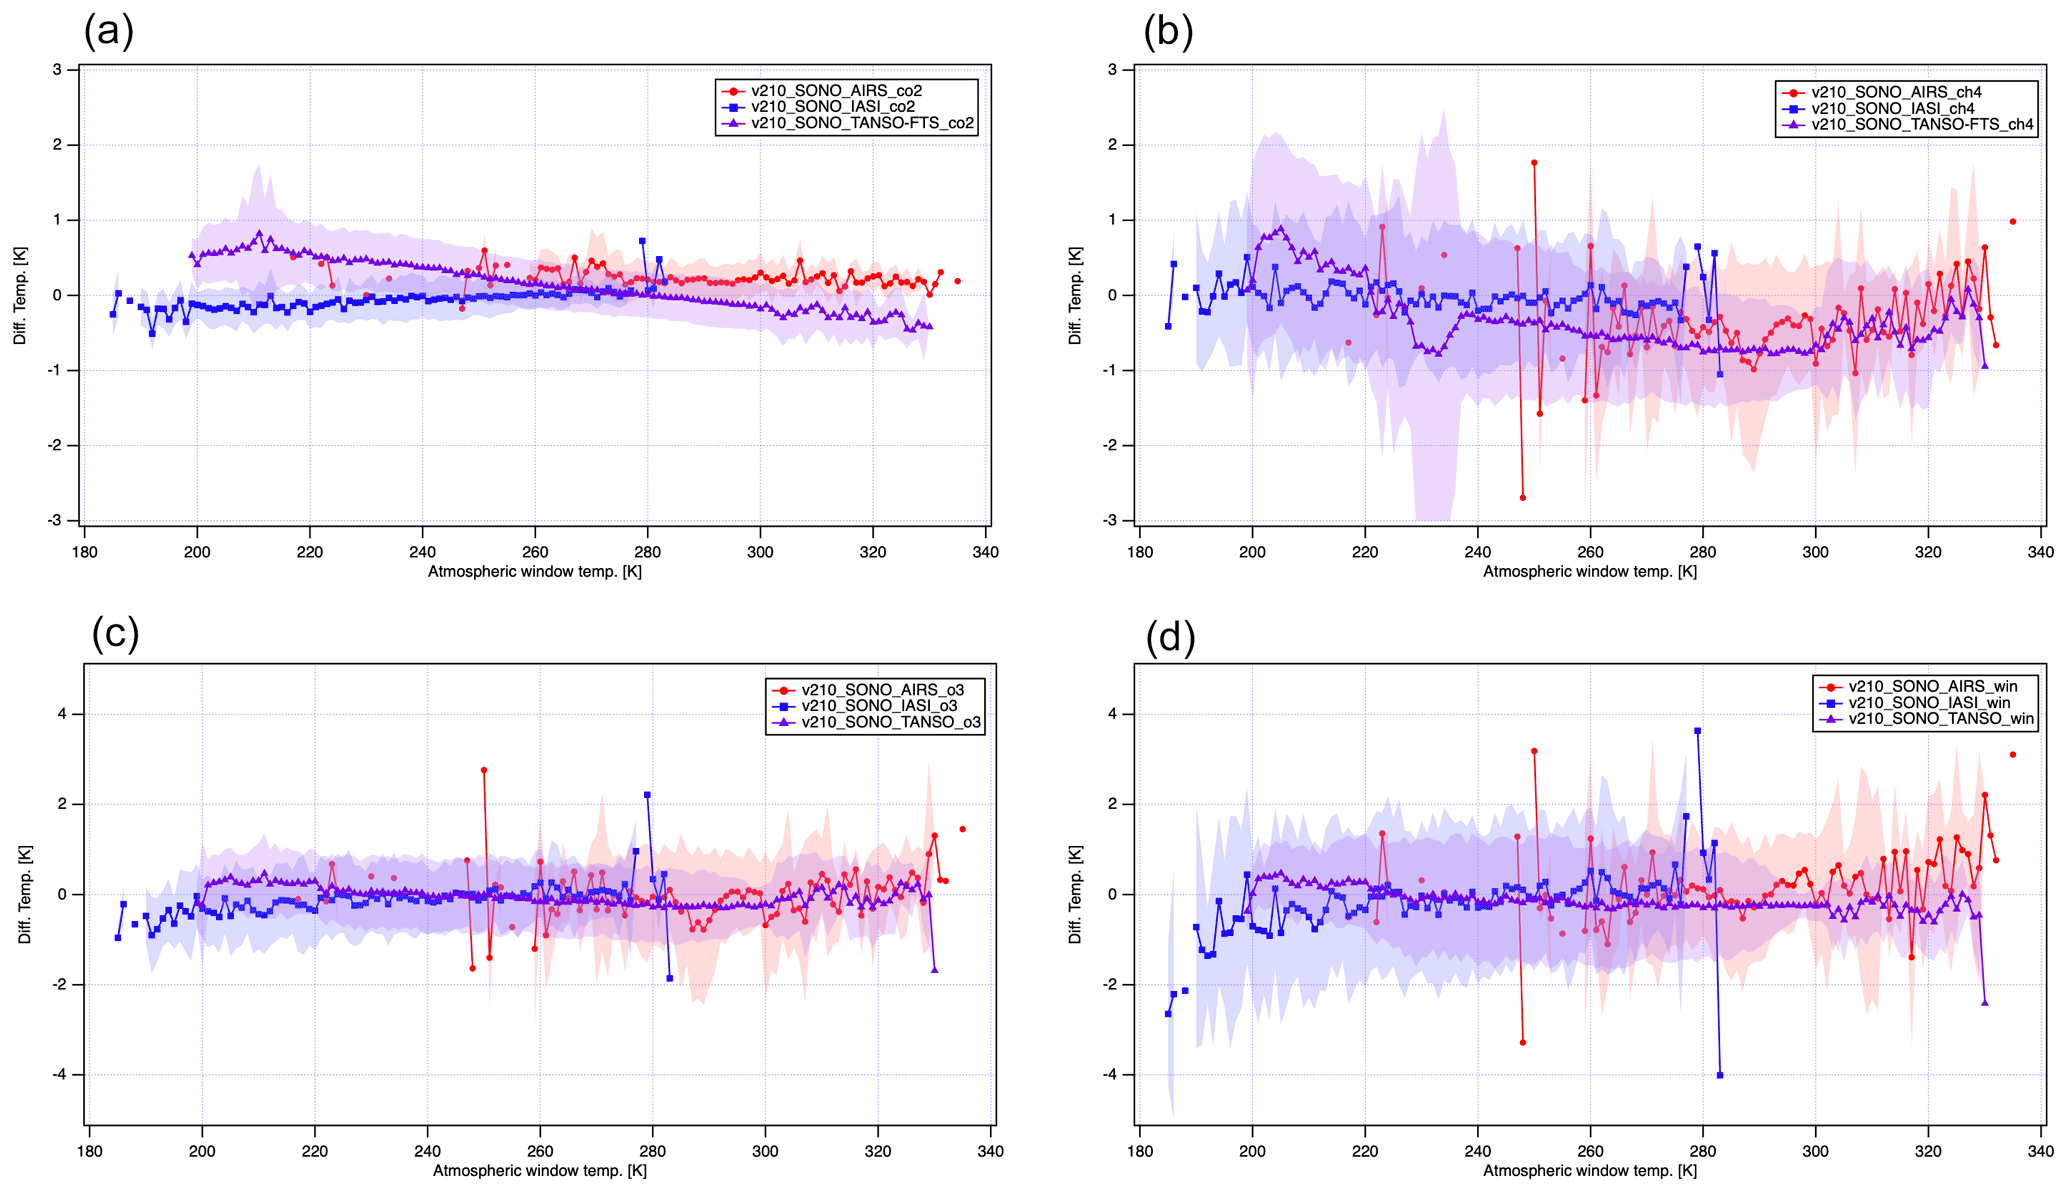
Figure 9The channel-dependent brightness temperature difference in 1 K bins against window temperature for 2O-SONO between TANSO-FTS-2 and AIRS/IASI/TANSO-FTS with the corresponding standard deviation (shaded area). (a) CO2 spectral range, (b) CH4 spectral range, (c) O3 spectral range, and (d) atmospheric window channel.
Compared with TANSO-FTS, this difference may indicate a pointing angle dependence of the pointing mirror, which is not entirely removed by the polarization correction performed in processing v230231. The available θAT (TANSO-FTS-2) angle is ±20∘. In contrast, TANSO-FTS-2 can be set between ±40∘. In this comparison, the matchups are selected between −10 and +10∘ of θAT (TANSO-FTS-2) angles.
Table 3Averaged brightness temperature difference (mean) and standard deviation (SD) between TANSO-FTS-2 and three other infrared sounders in the 2O-SONO configuration.
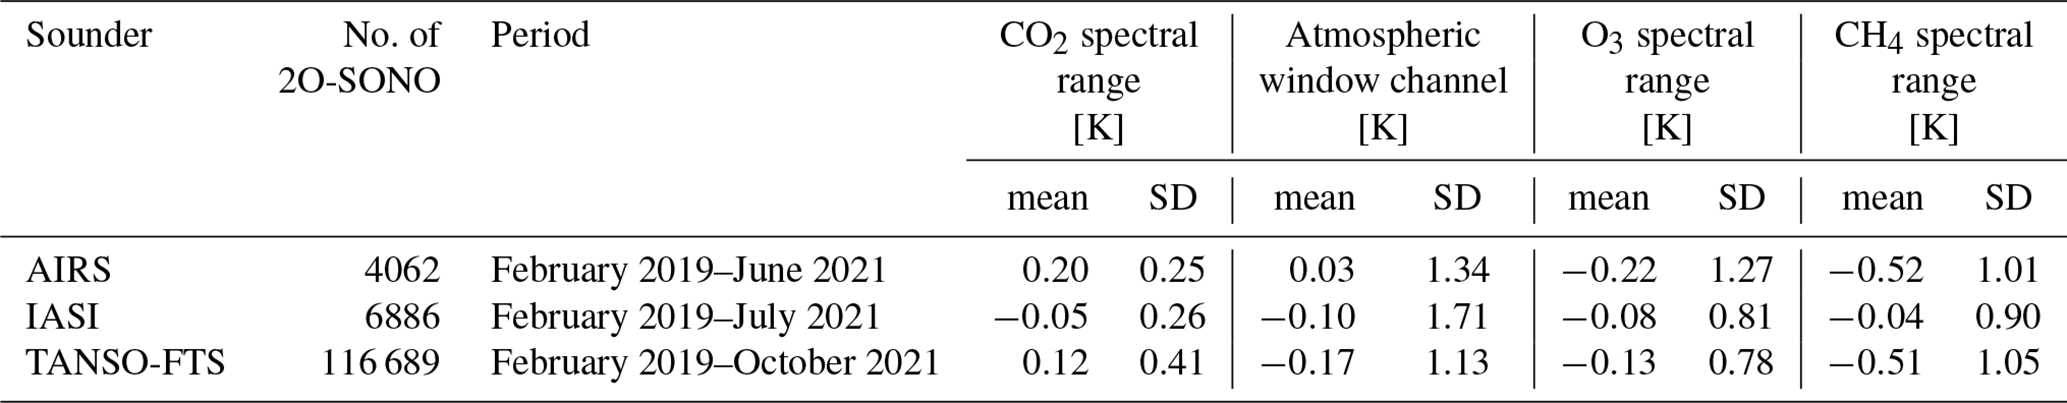
As presented in Fig. 9, the agreement between TANSO-FTS-2, AIRS, and IASI is quite satisfactory. However, the agreement between TANSO-FTS-2 and TANSO-FTS is worse than in the comparison against AIRS and IASI. This suggests that the calibrated radiance of TANSO-FTS, especially in low-brightness temperature regions, still has a small bias. A summary of the inter-comparisons between TANSO-FTS-2 and multi-satellite sensors with SONO is listed in Table 3.
This paper reports the performance of TANSO-FTS-2 bands 4 and 5 with the new radiance calibration method. The method is based on a non-linear response, a polarization sensitivity correction in internal optics, and pointing mirror thermal emission in the spectral domain. To evaluate its performance, the spectral radiances (level 1 processor version v210210) collected by TANSO-FTS-2 between February 2019 and October 2021 are compared to both the simultaneous nadir and to orthogonal off-nadir observations of AIRS on AQUA, IASI on METOP-B, and TANSO-FTS on GOSAT for the TIR bands. We conclude that the agreement between TANSO-FTS-2, AIRS and IASI is better than 0.3 K for scenes with brightness temperatures of more than 220 K in the CO2 and CH4 spectral ranges. Compared with AIRS and IASI, TANSO-FTS has a small bias on the brightness temperature for low temperatures. In the latest version of v230231 for TANSO-FTS, the polarization correction parameter for the pointing mirror has been improved and officially released. For scenes with brightness temperatures around 280 K, the agreement between TANSO-FTS-2 and TANSO-FTS is quite satisfactory. However, comparisons of the three other infrared sensors with TANSO-FTS suggest a cold brightness temperature bias for cold scenes in high-latitude regions, and this is an indication that the current products of this latter instrument have to be improved in these observation conditions. In addition, the result of 2O-SONO indicates that TANSO-FTS-2 has an along-track angle depending on bias over a ±10∘ along-track angle. The agreement between TANSO-FTS-2 and AIRS/IASI is good for the nominal pointing angle. However, for forward or backward viewing with a pointing angle greater than 20∘, the estimated bias exceeds 0.5 K in the CO2 spectral range for TANSO-FTS-2 version v210210.
All datasets used here are publicly available and can be accessed through the links and references provided (https://prdct.gosat-2.nies.go.jp/index.html.en, last access: 15 September 2022; NIES, 2022).
HS wrote the manuscript and analyzed data with support from FK, ROK, and KS. ROK, FK, KS, NK, and AK contributed to interpreting the results. FK, ROK, and KS supported to the satellite inter-comparison data preparation or expertise on data sets. All authors discussed the results and contributed to the manuscript.
The contact author has declared that none of the authors has any competing interests.
Publisher’s note: Copernicus Publications remains neutral with regard to jurisdictional claims in published maps and institutional affiliations.
The authors would like to thank Yugi Yata and Hiroaki Ochi of the Mitsubishi Space Software Corporation and the members of the Japanese Ministry of the Environment, the National Institute for Environmental Studies, L3 Harris, and ABB Inc. for their cooperation.
This research has been supported by the JAXA (Japan Aerospace Exploration Agency).
This paper was edited by Helen Worden and reviewed by Claude Camy-Peyret and one anonymous referee.
AIRS Science Team/Larrabee Strow: AIRS/Aqua L1C Infrared (IR) resampled and corrected radiances V6.7, Greenbelt, MD, USA, Goddard Earth Sciences Data and Information Services Center (GES DISC) [data set], https://doi.org/10.5067/VWD3DRC07UEN, 2019.
Aumann, H. H., Broberg, S., Manning, E., and Pagano, T.: Radiometric Stability Validation of 17 Years of AIRS Data Using Sea Surface Temperatures, Geophys. Res. Lett., 46, 12504–12510, https://doi.org/10.1029/2019GL085098, 2019.
Aumann, H. H., Chahine, M. T., Gautier, C., Goldberg, M. D., Kalnay, E., McMillin, L. M., Revercomb, H., Rosenkranz, P. W., Smith, W. L., Staelin, D. H., Strow, L. L., and Susskind, J.: AIRS/AMSU/HSB on the Aqua Mission: Design, Science Objectives, Data Products, and Processing Systems, IEEE T. Geosci. Remote, 41, 253–264, https://doi.org/10.1109/TGRS.2002.808356, 2003.
Clerbaux, C., Boynard, A., Clarisse, L., George, M., Hadji-Lazaro, J., Herbin, H., Hurtmans, D., Pommier, M., Razavi, A., Turquety, S., Wespes, C., and Coheur, P.-F.: Monitoring of atmospheric composition using the thermal infrared IASI/MetOp sounder, Atmos. Chem. Phys., 9, 6041–6054, https://doi.org/10.5194/acp-9-6041-2009, 2009.
Crisp, D., Atlas, R. M., Breon, F.-M., Brown, L. R., Burrows, J. P., Ciais, P., Connor, B. J., Doney, S. C., Fung, I. Y., Jacob, D. J., Miller, C. E., O'Brien, D., Pawson, S., Randerson, J. T., Rayner, P., Salawitch, R. J., Sander, S. P., Sen, B., Stephens, G. L., Tans, P. P., Toon G. C., Wennberg, P. O., Wofsy, S. C., Yung, Y. L., Kuang, Z. M., Chudasama, B., Sprague, G., Weiss, B., Pollock, R., Kenyon, D., and Schroll, S.: The Orbiting Carbon Observatory (OCO) Mission, Adv. Space. Res., 34, 700–709, https://doi.org/10.1016/j.asr.2003.08.062, 2004.
Crisp, D., Miller, C. E., and DeCola, P. L.: NASA Orbiting Carbon Observatory: measuring the column averaged carbon dioxide mole fraction from space, J. Appl. Remote Sens., 2, 023508, https://doi.org/10.1117/1.2898457, 2008.
Crisp, D., Pollock, H. R., Rosenberg, R., Chapsky, L., Lee, R. A. M., Oyafuso, F. A., Frankenberg, C., O'Dell, C. W., Bruegge, C. J., Doran, G. B., Eldering, A., Fisher, B. M., Fu, D., Gunson, M. R., Mandrake, L., Osterman, G. B., Schwandner, F. M., Sun, K., Taylor, T. E., Wennberg, P. O., and Wunch, D.: The on-orbit performance of the Orbiting Carbon Observatory-2 (OCO-2) instrument and its radiometrically calibrated products, Atmos. Meas. Tech., 10, 59–81, https://doi.org/10.5194/amt-10-59-2017, 2017.
Eldering, A., Taylor, T. E., O'Dell, C. W., and Pavlick, R.: The OCO-3 mission: measurement objectives and expected performance based on 1 year of simulated data, Atmos. Meas. Tech., 12, 2341–2370, https://doi.org/10.5194/amt-12-2341-2019, 2019.
Hu, H., Landgraf, J., Detmers, R., Borsdorff, T., Aan de Brugh, J., Aben, I., Butz, A., and Hasekamp, O.: Toward Global Mapping of Methane with TROPOMI: First Results and Intersatellite Comparison to GOSAT, Geophys. Res. Lett, 45, 3682–3689, https://doi.org/10.1002/2018GL077259, 2018.
JAXA (Japan Aerospace Exploration Agency): GOSAT-2, Level-1 Data Description Document for TANSO-FTS-2, JAXA, https://prdct.gosat-2.nies.go.jp/documents/documents.html.en (last access: 30 March 2022), 2020.
Jouglet, D., Chinaud, J., Maraldi, C., Jacquette, E., Lonjou, V., Blumstein, D., Vandermarcq, O., and Lenot, X.: Radiometric and spectral inter-comparison of IASI: IASI-A/IASI-B, IASI/AIRS, IASI/CrIS, in: CALCON 2014 meeting, 12 August 2014, Salt Lake City, USA, 2014.
Kataoka, F., Knuteson, R. O., Kuze, A., Shiomi, K., Suto, H., Yoshida, J., Kondo, S., and Saitoh, N.: Calibration, Level 1 Processing and Radiometric Validation for TANSO-FTS TIR on GOSAT, IEEE T. Geosci. Remote, 57, 3490–3500, https://doi.org/10.1109/TGRS.2018.2885162, 2019.
Kuze, A., Suto, H., Nakajima, M., and Hamazaki, T.: Thermal and near infrared sensor for carbon observation Fourier-transform spectrometer on the Greenhouse Gases Observing Satellite for greenhouse gases monitoring, Appl. Optics, 48, 6716–6733, https://doi.org/10.1364/AO.48.006716, 2009.
Kuze, A., Suto, H., Shiomi, K., Urabe, T., Nakajima, M., Yoshida, J., Kawashima, T., Yamamoto, Y., Kataoka, F., and Buijs, H.: Level 1 algorithms for TANSO on GOSAT: processing and on-orbit calibrations, Atmos. Meas. Tech., 5, 2447–2467, https://doi.org/10.5194/amt-5-2447-2012, 2012.
Kuze, A., Suto, H., Shiomi, K., Kawakami, S., Tanaka, M., Ueda, Y., Deguchi, A., Yoshida, J., Yamamoto, Y., Kataoka, F., Taylor, T. E., and Buijs, H. L.: Update on GOSAT TANSO-FTS performance, operations, and data products after more than 6 years in space, Atmos. Meas. Tech., 9, 2445–2461, https://doi.org/10.5194/amt-9-2445-2016, 2016.
Kuze, A., Kikuchi, N., Kataoka, F., Suto, H., Shiomi, K., and Kondo, Y.: Detection of methane emission from a local source using GOSAT target observations, Remote Sens., 12, 267, https://doi.org/10.3390/rs12020267, 2020.
Kuze, A., Nakamura, Y., Oda, T., Yoshida, Y., Kikuchi, N., Kataoka, F., Suto, H., and Shiomi, K.: Examining partial-column density retrieval of lower-tropospheric CO2 from GOSAT target observations over global megacities, Remote Sens. Environ., 273, 112966, https://doi.org/10.1016/j.rse.2022.112966, 2022.
NIES (National Institute for Environmental Studies): GOSAT-2 Product Archive, NIES, https://prdct.gosat-2.nies.go.jp/index.html.en, last access: 15 September 2022.
Suto, H., Kataoka, F., Kikuchi, N., Knuteson, R. O., Butz, A., Haun, M., Buijs, H., Shiomi, K., Imai, H., and Kuze, A.: Thermal and near-infrared sensor for carbon observation Fourier transform spectrometer-2 (TANSO-FTS-2) on the Greenhouse gases Observing SATellite-2 (GOSAT-2) during its first year in orbit, Atmos. Meas. Tech., 14, 2013–2039, https://doi.org/10.5194/amt-14-2013-2021, 2021.