the Creative Commons Attribution 4.0 License.
the Creative Commons Attribution 4.0 License.
 | 26 Sep 2022
Comparison of two photolytic calibration methods for nitrous acid
Andrew J. Lindsay
Nitrous acid (HONO) plays an important role in tropospheric oxidation chemistry as it is a precursor to the hydroxyl radical (OH). Measurements of HONO have been difficult historically due to instrument interferences and difficulties in sampling and calibration. The traditional calibration method involves generation of HONO by reacting hydrogen chloride vapor with sodium nitrite followed by quantification by various methods (e.g., conversion of HONO to nitric oxide (NO) followed by chemiluminescence detection). Alternatively, HONO can be generated photolytically in the gas phase by reacting NO with OH radicals generated by H2O photolysis. In this work, we describe and compare two photolytic HONO calibration methods that were used to calibrate an iodide adduct chemical ionization mass spectrometer (CIMS). Both methods are based on the water vapor photolysis method commonly used for OH and HO2 (known collectively as HOx) calibrations. The first method is an adaptation of the common chemical actinometry HOx calibration method, in which HONO is calculated based on quantified values for [O3], [H2O], and [O2] and the absorption cross sections for H2O and O2 at 184.9 nm. In the second, novel method HONO is prepared in mostly N2 ([O2]=0.040 %) and is simply quantified by measuring the NO2 formed by the reaction of NO with HO2 generated by H2O photolysis. Both calibration methods were used to prepare a wide range of HONO mixing ratios between ∼400 and 8000 pptv. The uncertainty of the chemical actinometric calibration is 27 % (2σ) and independent of HONO concentration. The uncertainty of the NO2 proxy calibration is concentration-dependent, limited by the uncertainty of the NO2 measurements. The NO2 proxy calibration uncertainties (2σ) presented here range from 4.5 % to 24.4 % (at [HONO] =8000 pptv and [HONO] =630 pptv, respectively) with a 10 % uncertainty associated with a mixing ratio of ∼1600 pptv, typical of values observed in urban areas at night. We also describe the potential application of the NO2 proxy method to calibrating HOx instruments (e.g., LIF, CIMS) at uncertainties below 15 % (2σ).
- Article
(1047 KB) - Full-text XML
-
Supplement
(535 KB) - BibTeX
- EndNote


Nitrous acid (HONO) is a source of the most important atmospheric oxidant – the hydroxyl radical (OH) – and can therefore play an important role in tropospheric oxidation chemistry. The hydroxyl radical initiates the removal of most trace gases from the atmosphere, leading to the formation of secondary pollutants such as ozone (O3) and secondary aerosols. Photolysis of HONO yields OH and nitric oxide (NO):
This reaction is the primary sink of HONO during the daytime, leading to a typical chemical lifetime at mid-day of between 10–20 min at mid-latitudes. Sources of HONO include homogeneous formation (Reaction R2), direct emissions from combustion (vehicles, biomass burning, etc.) and soils, and numerous heterogenous processes including heterogeneous reaction of NO2 with moist terrestrial surfaces, photolysis of particulate nitrate (Ye et al., 2016, 2017), and photolysis of nitric acid (Ye et al., 2016).
The relative importance of these sources varies with environment (Jiang et al., 2022).
HONO photolysis has been reported as a major source of HOx (HO throughout the day in a variety of environments, including urban and highly polluted areas (Whalley et al., 2018; Slater et al., 2020; Ren et al., 2013; Lu et al., 2019) as well as more pristine environments (Villena et al., 2011; Jiang et al., 2020; Bloss et al., 2007). Vertical distributions of HONO, however, indicate that its significance as a HOx precursor may be limited to near ground level (Li et al., 2014; Young et al., 2012; Villena et al., 2011; Wong et al., 2012; Tuite et al., 2021; Jaeglé et al., 2018). HONO can also serve as an important source of HOx in indoor environments since sufficient UV light can penetrate windows, and substantial HONO concentrations can result from various activities (e.g., cooking) (Gomez Alvarez et al., 2013; Wang et al., 2020).
HONO is notoriously difficult to measure. It can be formed via heterogeneous chemistry within sampling lines or an instrument's inlet. The resulting interferences may pose additional challenges in applying an instrument's zero or in calibration processes that alter the interfering species. Some intercomparison studies have shown substantial differences between HONO measurement techniques. A comparison of several HONO measurements in Beijing showed an overall mixed agreement with a few instruments disagreeing by more than a factor of 2 (Crilley et al., 2019). Measurements in Houston, Texas, showed overall good agreement (within 20 %) between most instruments, with larger differences of over 100 % observed for one of the instruments for some time periods (Pinto et al., 2014). Bourgeois et al. (2022) recently reported an 80 % difference between HONO measurements made by cavity-enhanced spectroscopy and iodide-adduct chemical ionization mass spectrometry (CIMS). Closer agreement for two instrument comparisons has been reported by Stutz et al. (2010; comparing differential optical absorption spectroscopy (DOAS) and mist-chamber ion chromatography (IC)), Cheng et al. (2013; comparing long-path absorption photometry (LOPAP) and stripping coil IC), and Dixneuf et al. (2022; comparing LOPAP and cavity-enhanced absorption spectroscopy), though many of these studies report considerable deviations when HONO mixing ratios were less than ∼100 pptv.
Calibrations for HONO are challenging as this compound is not commercially available and rather must be prepared in situ. Most commonly, HONO is prepared by reacting hydrogen chloride vapor with sodium nitrite (Febo et al., 1995):
This method presents several challenges. A stable source of HCl is required, usually from a heated aqueous solution, a gas cylinder, or a permeation tube. Consistent mixing between the HCl and the NaNO2 powder is required. These calibrations also require substantial warmup times (often hours) to ensure source stability, though some recent versions report faster warmup periods (e.g., <10 min reported by Villena and Kleffmann, 2022). High HONO concentrations (above 1 ppmv) are often produced, requiring dilution, though the temporary unrealistic HONO concentrations can lead to significant HONO loss by its self-reaction and inaccurate HONO quantification. A recent, noteworthy version of this calibration improves upon this concentration issue and has the ability to produce [HONO] on the order of tens of parts per trillion by volume (Lao et al., 2020). The generated HONO can be quantified by various methods including theoretical calculation (Villena and Kleffmann, 2022), conversion to NO followed by chemiluminescence detection (Lee et al., 2012; Lao et al., 2020; Villena and Kleffmann, 2022), thermal conversion to NO2 followed by NO2 quantification (Gingerysty and Osthoff, 2020), and conversion to aqueous nitrite followed by derivatization and detection by UV–vis (Peng et al., 2020). The calibration uncertainty depends on the output stability of the HONO source and the quantification technique used. Villena and Kleffmann (2022) demonstrate using two separate techniques that overall calibration uncertainties can be well below 10 % (2σ).
More recently, photolytic HONO sources have been utilized. Humidified air is exposed to ultraviolet (UV) light to photolyze H2O to produce an equal mixture of OH and HO2, which in the presence of excess NO then converts to HONO. This HONO output is stable within seconds (i.e., the initial UV lamp warmup time) and is tunable by altering humidity, UV flux, or UV exposure time. The HONO formed has been quantified based on the water vapor mixing ratio, water vapor absorption cross section, UV flux, and UV exposure time. This quantification approach thus far has been used to calibrate photo-fragmentation LIF instruments (Dyson et al., 2021; Bottorff et al., 2021). The HONO formed from a photolytic source has also been quantified by thermal dissociation followed by measurement of the NO2 produced (Veres et al., 2015). These methods have an uncertainty of 30 % to 36 % (2σ), similar to the uncertainty for HOx calibrations based on water vapor photolysis (Dusanter et al., 2008). In this paper, we present an alternative photolytic HONO calibration that we refer to as the “NO2 proxy” method. This method requires a direct NO2 measurement that is used as a “proxy” to quantify HONO concentrations. We compare this new proxy calibration to the more standard photolytic calibration method as performed by Bottorff et al. (2021) and Dyson et al. (2021). This method has a lower uncertainty (typically ∼10 %, 2σ) and unlike the actinometric method does not require characterization of the mercury lamp emission spectrum.
2.1 Instrumentation
A cavity attenuated phase shift (CAPS) spectrometer (Aerodyne Research, Inc.) was used to detect NO2 (Kebabian et al., 2008). The CAPS also indirectly measured O3 as it was converted to NO2 by reaction with excess NO. The CAPS instrument was calibrated using a 2B Technologies model 306 O3 calibration source. Ozone outputs were varied between 10 and 300 ppbv with greater than 99.99 % conversion efficiency to NO2 by reaction with excess NO ([NO] =1.82 ppmv) within approximately 15 m of FEP tubing (i.d. =0.476 cm; residence time =17.1 s, pseudo-first order rate constant of 0.8 s−1). The manufacturer-stated accuracy of this O3 calibrator is 2 % (2σ), though no recent factory calibrations have been conducted. Therefore, a second calibration was conducted with a Thermo Environmental Instruments 49C O3 calibrator, which agreed to within 2.5 %. We assign an uncertainty of 4 % (2σ) to the NO2 measurements to account for possible drift in accuracy. Temperature and relative humidity (RH) measurements were made using two Vaisala HMP60 probes and used, along with pressure measurements, to calculate H2O(g) mixing ratios. Both probes agreed with a new RH–T replacement sensor (manufacturer-stated uncertainty: 3 %) to within 3 %. We assign an uncertainty of 5 % (2σ) to our determined H2O mixing ratios.
A high-resolution chemical ionization time-of-flight mass spectrometer (HR-ToF-CIMS, Tofwerks/Aerodyne Research, Inc.) was used to detect HONO (Bertram et al., 2011; Lee et al., 2014). HONO and concomitant gases are ionized within a laboratory-built ion-molecule reactor (IMR) using reagent iodide (I−) ions. Our lab-built IMR is internally coated with PTFE and sampled the calibration gas at a flow rate of 2.10 slpm through a stainless-steel critical orifice (nominal diameter of 0.48 mm). Iodide (I−) reagent ions in N2 (Airgas, industrial grade) were sampled at 2.20 slpm through a similar critical orifice perpendicular to the main sample flow. The I− was prepared by exposing dilute methyl iodide (CH3I) from a permeation tube (VICI Metronics) to a 210Po radioactive source. Humidified N2 was also added to the IMR perpendicular to the main sample flow at a flow rate of 0.365 slpm. The pressure in the IMR was held at 80 mbar, controlled by adjusting a valve to a scroll pump (Agilent Technologies IDP-7).
Ions are separated by mass-to-charge ratio () at a mass resolving power of near 5000 m Δm−1. We monitor the HONO iodide adduct I(HONO)− at 173.90575 . The peak-fitting software (TofWare) accounts for the overlapping contribution from the 13C formic acid I(13CH2O2)− peak at 173.91342 . We account for the humidity dependence of the instrumental response by determining the mole fraction of H2O(g) ( in the IMR by measuring the RH and temperature of the IMR in the exhaust of the scroll pump. See the Supplement for more information regarding humidity effects for the HONO ionization chemistry (see Sect. S1.2). Analytical parameters including the limit of detection, precision, and linear range of these HONO measurements are also detailed within the supplement (see Sect. S1.1).
2.2 Calibration methods
We calibrate HONO using two variations of the water vapor HOx calibration method: one is a modification of the standard actinometric HOx photolytic calibration, and the other we refer to as the “NO2 proxy” calibration. These calibration methods mainly differ in how HONO is quantified. In both methods, HONO was produced nearly identically. Air (Airgas, Ultra Zero grade; [O %) for the actinometric method or N2 (Airgas, industrial grade) for the NO2 proxy calibration is humidified with HPLC (high-performance liquid chromatography) grade water (Fisher Chemical), mixed with NO (Airgas, 41.02±2.05 ppmv in N2), and then exposed to 184.9 nm ultraviolet radiation from a low-pressure mercury lamp (Jelight 78-2046-1). While in the experiments presented in this paper we used industrial grade N2 for the humidified CIMS IMR inflow (mentioned in Sect. 2.1) and as the NO2 proxy calibration carrier gas, we have used ultra-high-purity N2 (Airgas) in previous experiments. We find no differences between the calibration results acquired using different grades of N2. The resulting OH and HO2 from water photolysis form HONO by reaction with excess NO (Reactions R4–R6a and R2).
The HO2-to-HONO pathway is limited by the small fraction of Reaction (R6) that forms HNO3 rather than OH and NO2:
A schematic of the setup used for both calibrations is shown in Fig. 1. The mercury lamp is housed within a 10.8 cm ×26.7 cm ×10.2 cm photolysis chamber (Fig. 1b), and the volume surrounding the lamp is purged with dry N2 (purge not shown). The humidified air–NO mixture is transported past the mercury lamp within a partially exposed quartz tube (I.D. =1.04 cm, total length =26.7 cm; exposed length cm). HONO sample concentrations are controlled by adjusting the lamp flux with a Variac variable transformer, adjusting the relative flow rates of the dry and humidified zero air–N2, or adjusting the absolute flow rates to alter the lamp exposure time. For our example calibrations discussed in this paper, we typically used a main N2 or air flow rate of 5 slpm with an addition of 200 sccm of 41.02 ppmv NO in N2 for a total flow rate of 5.20 slpm and a diluted NO mixing ratio of 1.58 ppmv. Pseudo-first-order rate constants calculated using this [NO] for Reactions (R6a) and (R2) are 322 and 295 s−1, respectively. Under these conditions, HOx is converted to HONO within 0.02 s inside the remaining 11.4 cm of the quartz tube. The [NO] chosen must be high enough to minimize OH and HO2 wall losses. We have ensured that this NO mixing ratio is sufficient in separate experiments by confirming that no additional HONO signal results at increased [NO] values. Possible HONO formation by additional photolytic processes (specifically involving the surfaces of the quartz photolysis tube) was tested by monitoring CIMS I(HONO)− signals during additional experiments. These experiments include exposing dry carrier gas ([NO] =1.58 ppmv) to 184.9 nm radiation (i.e., exposure to UV without H2O photolysis), exposing humidified carrier gas ([NO] =0 ppmv) to 184.9 nm radiation (i.e., to investigate if HONO is formed by heterogenous reactions involving H2O or HOx with NO, NO2, or HNO3 adsorbed on the quartz tube), and exposing humidified carrier gas ([NO] =1.58 ppmv) to the 254 nm radiation from a separate mercury lamp (Jelight 81-3306-2) in which the 184.9 nm emission is blocked (i.e., the carrier gas matches calibration conditions and is exposed to UV radiation but without H2O photolysis). These tests indicate no appreciable HONO formation by other photolytic processes.
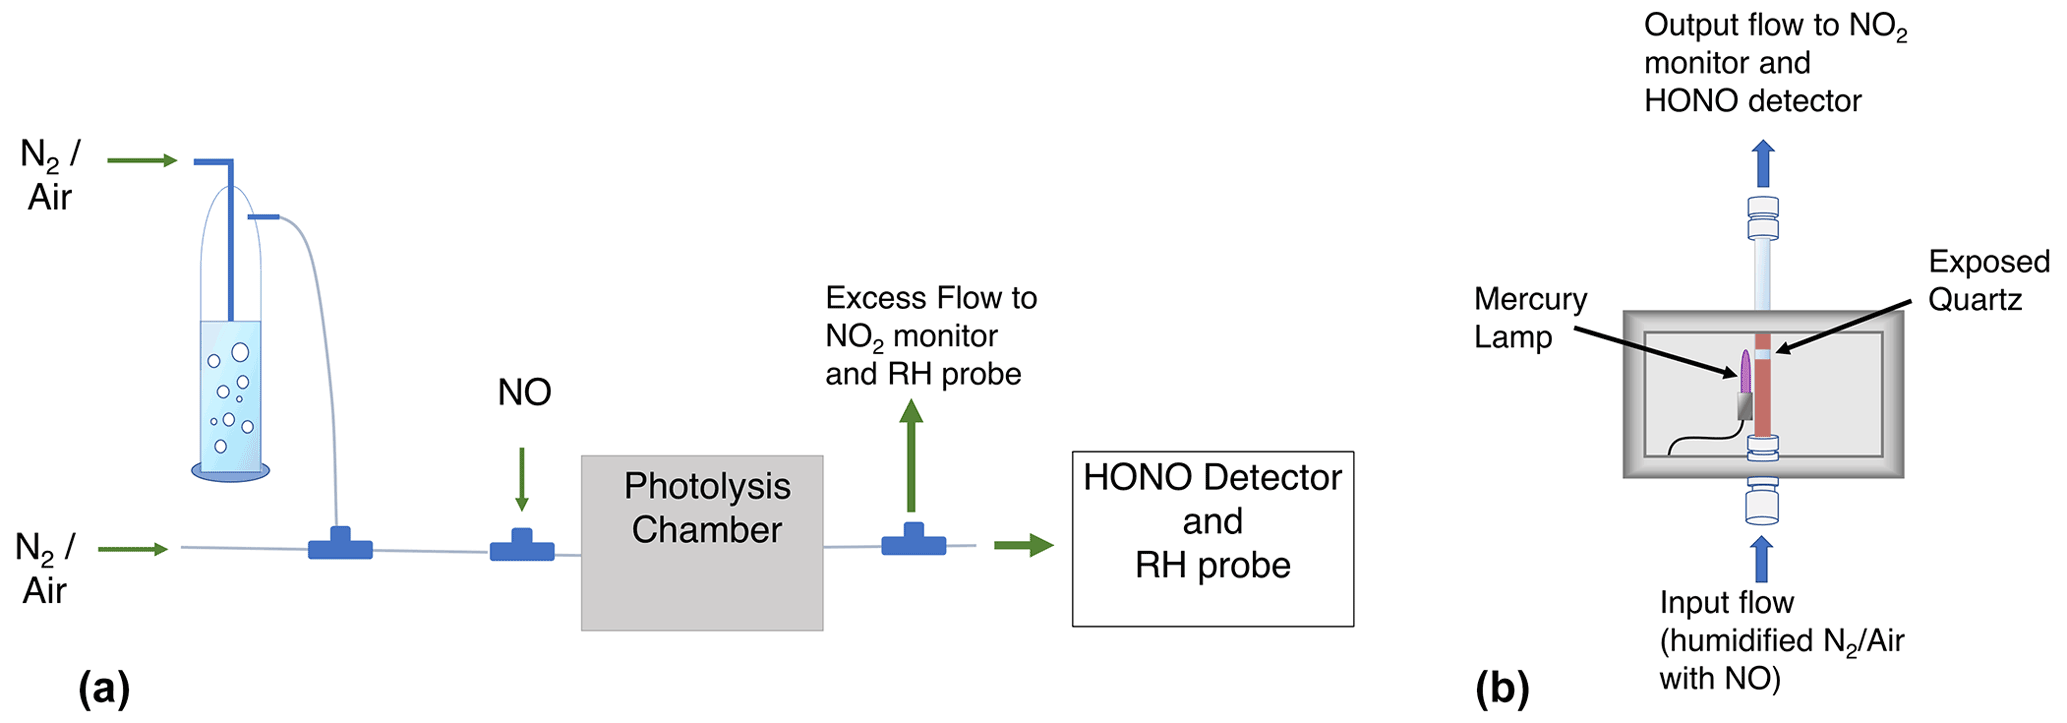
Figure 1Schematic of the experimental setup (a) and the photolysis chamber (b). Not shown: small flow of air when using N2 as the carrier gas (a) and the purge flow of N2 (b).
The resulting calibration gas enters a PFA tee and is arranged so that the air travels straight to the CIMS (2.1 slpm) while the remaining flow (∼3.1 slpm) makes a 90∘ turn for the CAPS line, which includes a vent. The gas flow is initially laminar within the quartz photolysis tube (Reynolds number ≈600). This results in an initial [HO2] (and therefore [HONO]) radial gradient in which the greatest concentrations exist near the flow tube walls (i.e., where the flow rates are lower and the UV exposure times longer). Turbulence is induced by the sudden changes in tube inner diameter at the quartz tube exit (reducing union) and upon entering the PFA tee. The air is therefore most likely well mixed prior to being split within the PFA tee. The excess flow within the CAPS line (∼2 slpm) was vented past an RH–T probe to determine the water mixing ratio in the photolysis cell. A second RH–T probe quantified the water mixing ratio in the CIMS IMR as previously mentioned in Sect. 2.1. Details of the two calibration methods are described in the following sections.
2.2.1 Actinometric calibration
The water vapor photolysis calibration method has been used for several decades to calibrate OH and HO2 measurements (Stevens et al., 1994; Lanzendorf et al., 1997; Dusanter et al., 2008). The concentration of HOx, and therefore HONO, is calculated from the time-integrated photolysis of water vapor:
where F is the photon flux at 184.9 nm, t is the UV irradiation time, is the absorption cross section of water at 184.9 nm, and is the quantum yield of HOx from water photolysis and equal to 2. F can be quantified using direct actinometric measurements (e.g., using a calibrated phototube), and t can be quantified via characterization of the flow rates and photolysis cell geometry (Faloona et al., 2004). Alternatively, and more commonly among HOx measurement groups, the product F⋅t can be determined via “chemical actinometry” (Schultz et al., 1995). In the O2–O3 chemical actinometry method, the concentration of O3 produced by photodissociation of O2 at 184.9 is used to determine F⋅t:
The product of the lamp flux and the exposure time, i.e., the (F⋅t) term, is given by Eq. (2), in which is the absorption cross section of O2 at 184.9 nm and is quantum yield of O3 from O2 photolysis ():
Substituting this expression for F⋅t into Eq. (1) gives Eq. (3):
The effective value for must be experimentally determined for the individual mercury lamp at the experimental O2 optical depth. This is required because the emission profile near 184.9 nm, which comprises two peaks due to self-reversal, can vary from lamp to lamp and with operating conditions, and the O2 absorption spectrum steeply decreases near the mercury lamp emission maximum (Lanzendorf et al., 1997). We use an experimentally determined value of cm2 molec.−1 for the mercury lamp used for these experiments. The JPL-recommended value of cm2 molec.−1 was used for (Burkholder et al., 2020). The value of [O2] is based on the flows mentioned in Sect. 2.2 and is equal to 20.1±1.0 %. The O2 optical depth is 0.033, and the O2 column density (within the photolysis tube center) is 2.4×10¹⁸ molec. cm−2. For typical operating conditions, the value of F⋅t and an estimated photon flux F (calculated using an approximate gas exposure time) are 3.48×10¹² photons cm−2 and 7.1×10¹⁴ photons cm−2 s−1, respectively. The value of [O3] here was near 20 ppbv and determined with the CAPS NO2 monitor after its reaction with NO, forming NO2. This is measured with dry air flowing in the photolysis chamber so that the NO2 measured is solely from the reaction of NO with O3 and not HO2. These F⋅t and [O3] values are high compared to those used for most O3 actinometry HOx calibrations, in which [O3] is often less than 1 ppbv (e.g., Faloona et al., 2004), but are comparable to those used by Dusanter et al. (2008). High F⋅t values were used so that typical ambient HONO concentrations (ranging up to several parts per billion by volume) could be prepared. [H2O] is determined using the measured RH, temperature, and pressure. The uncertainties of the variables in Eq. (3) are discussed in Sect. S3. The combined uncertainty (2σ) for [HOx] (and therefore [HONO]) calculated using this equation is 27 % (see Supplement for details).
We apply a small correction to the value for [HOx] calculated in Eq. (3) in order to obtain [HONO]. This correction accounts for the incomplete conversion of HO2 to HONO due to Reaction (R6b).
Equation (4) includes the variable β, which is the relative rate or product ratio of Reaction (R6b) to (R6a) (i.e., ]) and depends on temperature, pressure, and humidity (Butkovskaya et al., 2007, 2009). The term in Eq. (4) represents a traditional branching ratio (i.e., ])). For the experiments conducted, the value of β is at most 0.04, leading to a 2 % correction to Eq. (1). See Sect. S2 for information regarding the formulation of Eq. (4) and the calculation of β.
The CIMS response to HONO is determined by acquiring a background by briefly toggling off the mercury lamp. This background CIMS signal is humidity dependent, so a background is taken at each humidity setting. Background CIMS I(HONO)− signals are elevated during calibrations due to impurities in the NO flow.
2.2.2 Proxy calibration
For the NO2 proxy calibration method, we determine [HONO] from the measured value of [NO2] formed from Reaction (R6a) during HONO production. For each H2O molecule photolyzed (Reaction R4), nearly one NO2 and two HONO molecules are produced. Therefore, [HONO] is simply given by the measured [NO2] (Eq. 5):
where β is added to account for the minor HNO3 product of the HO2+ NO reaction (Reaction R6b).
For the proxy calibration we use humidified N2 rather than air and include a small addition of 10 sccm of zero air prior to lamp exposure (not shown in the Fig. 1 schematic). The resulting low O2 concentration ([O %) is sufficient for the full conversion of H to HO2 (Reaction R5) but results in a negligible amount of O3 formed by O2 photolysis (Reactions R7–R8), confirmed by toggling the UV source on and off with dry carrier gas flowing. The pseudo-first-order rate constant for the H to HO2 conversion (Reaction R5) is 1.1×10⁴ s−1 for this [O2] value. HONO concentrations are quantified using background subtracted [NO2] values in Eq. (5), which are typically acquired by toggling the mercury lamp off and on. The CIMS signal response is determined simultaneously. A “direct” NO2 detection method is highly recommended over indirect methods that rely on NO detection as the high NO mixing ratios would result in degraded precision. For this study we used a CAPS instrument, but other methods like cavity ring-down spectroscopy (CRDS), laser-induced fluorescence (LIF), or oxygen anion CIMS (e.g., Novak et al., 2020) would be acceptable.
Time series data for the proxy calibration method are shown in Fig. 2. The CAPS NO2 measurement and the CIMS HONO signal normalized to 1 million counts per second of reagent ion (“ncps”) are shown at a constant humidity (RH =29 %, , T=19.3 ∘C, P=760 Torr within the photolysis cell and RH =19 %, , T=19.2 ∘C, P=760 Torr within the CIMS IMR exhaust). The NO2 data are shown with an offset so that concentrations are near 0 ppbv while the UV source is off. Background [NO2] values were typically near 15 ppbv due to impurities within the NO cylinder and NO2 production from the termolecular reaction NO + NO + O2→2 NO2. During the first 120 s shown in Fig. 2, HONO is formed by H2O photolysis via the mercury lamp 184.9 nm emission. This leads to the stable I(HONO)− signal in the CIMS along with enhanced [NO2] produced by Reaction (R6a) and measured by the CAPS monitor. Background I(HONO)− and NO2 signals are determined by toggling off the mercury lamp (shown at 121 s). The CIMS sensitivity (ncps ppt−1) is equal to the quotient of the normalized background subtracted CIMS signal and the quantified [HONO] which is calculated by Eq. (5).
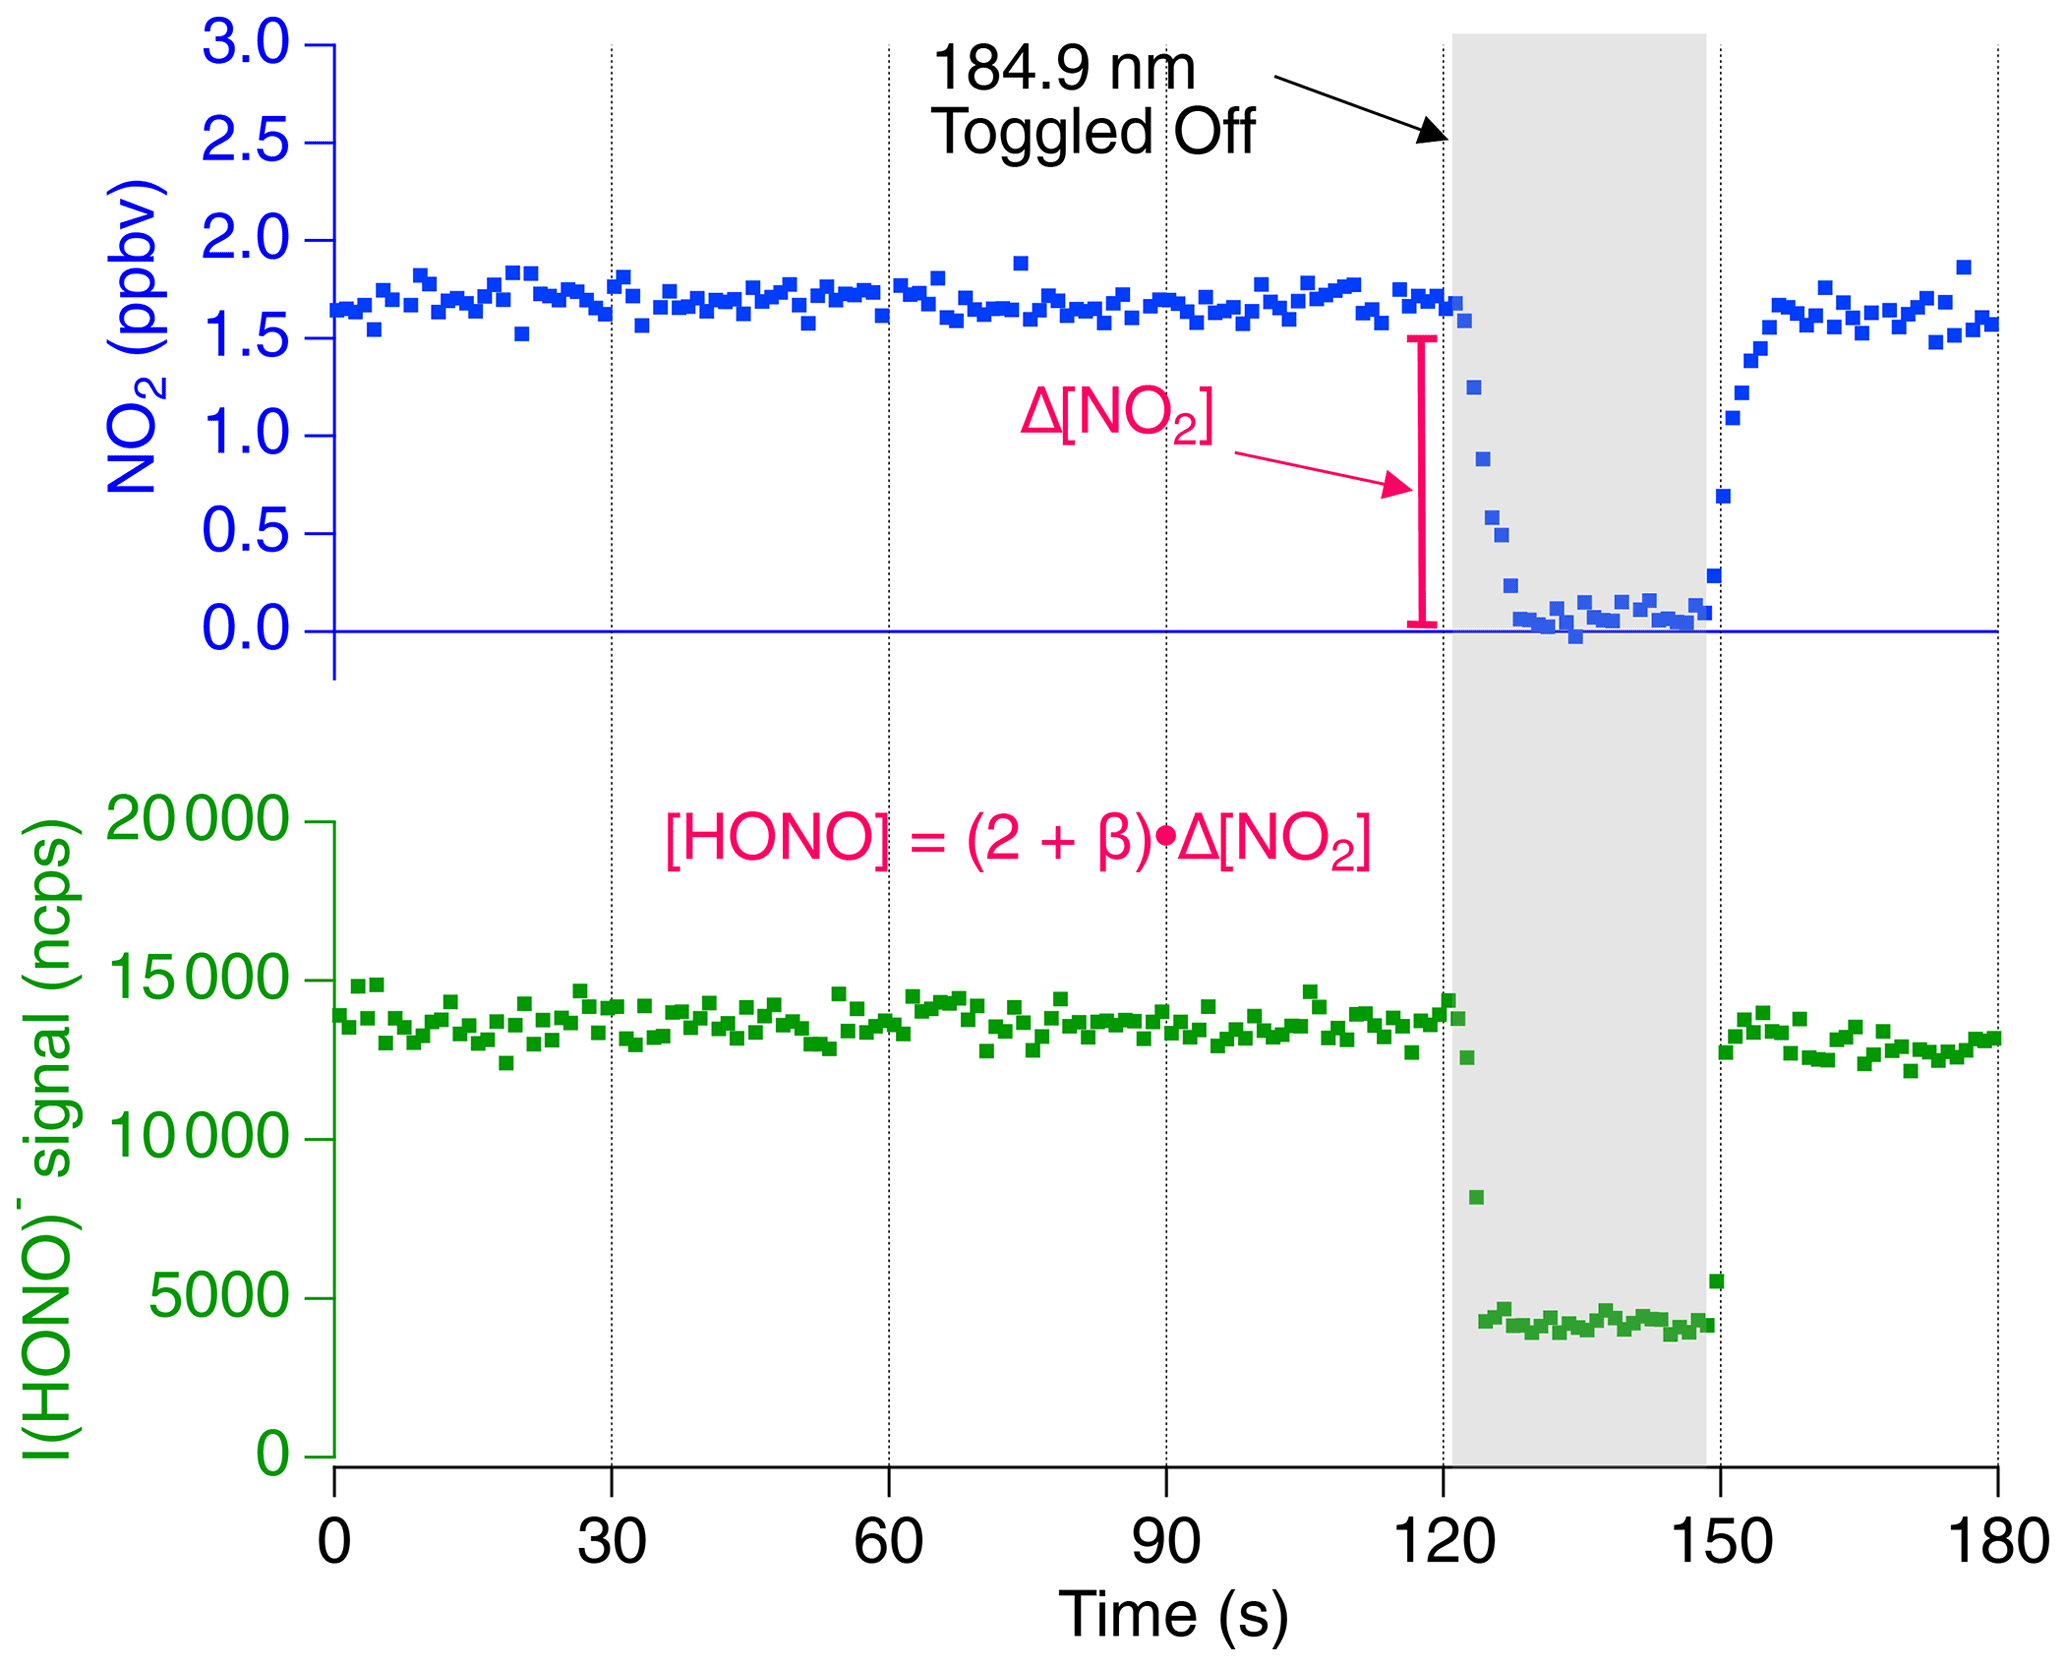
Figure 2The 1 s averaged time series data for a proxy calibration at a constant relative humidity. The iodide HONO adduct signal (cps) is shown normalized per 1 million reagent ions (ncps). The shaded section represents the period in which the 184.9 nm mercury lamp is toggled off to obtain background [NO2] and HONO signal. The NO2 concentration is shown with an offset so that background values are near 0 ppbv. The resulting difference in NO2 indicates that approximately 3000 pptv [HONO] is sampled by the CIMS.
A multipoint NO2 proxy calibration curve (Fig. 3) shows the linear CIMS signal response to [HONO]. This calibration was conducted at a constant relative humidity (RH =28 %, , T=19.3 ∘C, P=760 Torr within the photolysis cell and RH =18 %, , T=19.2 ∘C, P=760 Torr within the CIMS IMR exhaust), and [HONO] was adjusted by altering the mercury lamp flux with a Variac variable transformer. The slope of this curve, 2.89±0.34 ncps ppt−1 (2σ), is the CIMS sensitivity to HONO for this particular water mole fraction within the CIMS IMR (. HONO mixing ratios ranged from approximately 400 to 3500 pptv, thus demonstrating that a wide range in HONO concentrations can easily be prepared. The uncertainties for the quantified [HONO] values from Eq. (5) (i.e., the x-error bars) are obtained by adding in quadrature three terms: (1) the relative uncertainty of the NO2 background subtraction (based on the 5 s average precision of 27 pptv), (2) the NO2 calibration uncertainty (3 %, 2σ), and finally (3) the relative uncertainty associated with the (2+β) expression (typically 0.14 %, 2σ). The uncertainty in the normalized CIMS signal is obtained by adding in quadrature the 15 s precision of the I(HONO)− signal with that of the reagent ion. The 2σ error bars range from 6.1 % to 34.8 % for quantified [HONO] and 1.7 % to 2.9 % in the CIMS HONO signal. The Fig. 3 slope (i.e., the CIMS sensitivity to HONO) and its uncertainty were determined using the York bivariate linear regression method (York et al., 2004). The uncertainty calculations are discussed in greater detail in Sect. S4.1.

Figure 3Calibration curve obtained using the NO2 proxy calibration method at a constant humidity (RH =17.7 %, [H2O] =0.388 % as measured in the CIMS scroll pump exhaust) by varying photon flux F with a Variac variable transformer. Error bars represent ±2σ uncertainty. The data were fitted using the York bivariate regression method (York et al., 2004). The y intercept (3820 ncps) represents the background CIMS I(HONO)− signal during this calibration and is mostly from impurities in the constant NO addition. Without the NO addition (for ambient sampling), the typical background signal is 75 ncps.
A comparison between the more standard O3 actinometry-based calibration and the new proxy calibration method is shown in Fig. 4. CIMS sensitivities as determined by single point calibrations are shown for a variety of values. The two calibration methods were conducted consecutively and agree within their respective 2σ uncertainties. Sensitivities ranged from 1.5 to 5.3 ncps ppt−1 with the greatest values observed at low- settings. The CIMS IMR values ranged from to and corresponded to a photolysis cell RH range of 4.1 % to 71 % and photolysis cell values of to (average T=19.6 ∘C; P=760 Torr). The sensitivity determined by the Fig. 3 multipoint calibration (2.89±0.34 ncps ppt−1 at CIMS IMR is consistent with those shown in Fig. 4 at similar values. These CIMS sensitivities are also in line with literature values (Peng et al., 2020; Bourgeois et al., 2022). Unique to this figure is the use of the CIMS IMR to track humidity dependence rather than the partial pressure of H2O (Lee et al., 2014), the specific humidity (Novak et al., 2020), or the CIMS signal ratio of the iodide water adduct I(H2O)− ( 145) to reagent ion I− ( 127; Lee et al., 2014; Peng et al., 2020; Veres et al., 2015, 2020). The use of allows for a more direct comparison to other CIMS instruments that may use different IMR pressures and quadrupole voltage settings that govern the ratio of I(H2O)− to I−. See the supplement for more information regarding humidity effects on ionization chemistry (Sect. S1.2).

Figure 4Comparison of the two HONO calibration methods for a range of within the CIMS IMR. The sensitivity determined by the multipoint calibration (i.e., the Fig. 3 slope) is plotted as the dark blue circle. Error bars represent ±2σ uncertainties. [HONO] ranged from 470 pptv (at the lowest value) to 7710 pptv (at the greatest value) for the actinometric calibration. [HONO] similarly ranged from 630 to 7820 pptv for the NO2 proxy calibration.
The uncertainty in the CIMS sensitivity for the single-point proxy calibration points in Fig. 4 is determined by combining in quadrature the relative uncertainty of the background subtracted CIMS signal with that of the quantified [HONO] value. The calculation for quantified [HONO] uncertainty and CIMS uncertainty is previously mentioned in the text regarding Fig. 3, though the CIMS uncertainty here slightly differs due to the background subtraction (see Sect. S4.2). As mentioned previously, the total uncertainty depends on the quantified [HONO] value, which ranged from 630 (at the lowest value) to 7800 pptv (at the greatest value) for the proxy calibration results shown in Fig. 4. The uncertainty for the greatest [HONO] values (corresponding to the highest settings) is dominated by the 4 % 2σ accuracy of the NO2 measurement. At the lowest [HONO] values (shown at lowest settings), larger uncertainties occur and are dominated by the precision in NO2 measurements due to the background subtraction. Therefore, the uncertainty can be minimized by using higher HONO concentrations. The presented 2σ uncertainty in sensitivity using the proxy method ranged from 5.1 % to 25.5 % with the [HONO] quantification alone accounting (from Eq. 4) for 4.5 % to 24.4 %. These proxy calibration uncertainties for [HONO] fall well below the 27 % 2σ uncertainty associated with the standard O3 actinometry calibration. The 2σ uncertainty in sensitivities determined by our actinometry calibrations (i.e., the 27 % method uncertainty combined with precision of the CIMS measurement) varies from 27.1 % to 28.8 %. The proxy calibration therefore allows for lower uncertainties compared to the standard actinometry calibration, especially at high [HONO] values.
In addition to its use described herein for HONO calibrations, the NO2 proxy method can also be used to determine the prepared HOx concentration (i.e., prior to its reaction with NO), which differs from [HONO] by only a few percent depending on the value of β.
Directly using this method to calibrate a HOx instrument (e.g., LIF, HOx-CIMS, or perCIMS) is likely not feasible as the described calibration is performed in N2 rather than air (i.e., the composition of the calibration carrier gas should be identical to that for ambient air) and requires high NO mixing ratios that could complicate the operation of a HOx instrument more than it does for our iodide CIMS.
The application of an NO2 proxy calibration for a HOx instrument would likely require two consecutive steps. First an NO2 proxy calibration would be performed as described in this paper (with high [N2], high [NO], and only the NO2 instrument sampling). Second, the N2 and NO flows would be replaced with zero air, and the resulting calibration mixture, which would have the same HOx concentration as determined by the NO2 proxy calibration, would then be sampled by a HOx instrument. Additional concentrations of HOx could be prepared by altering and tracking [H2O]:
where the “proxy” designation refers to the corresponding values of [HOx] (quantified via Eq. 6) and [H2O] during the proxy calibration step (i.e., high [NO] and N2 as the carrier gas). The quotient of [HOx] and [H2O] is equal to the product of the constants that appear in Eq. (1).
The uncertainty in [HOx] will likely range 5 % to 15 % (2σ), similar to that for [HONO] quantified via proxy calibration, mainly dependent on the [NO2] measurement uncertainty. While the accuracy in H2O measurements should not contribute to the Eq. (7) [HOx] uncertainty as it effectively cancels out, the precision in the [H2O] measurements would have to be accounted for. The uncertainty for this proposed method is exceptional compared to typical HOx calibrations in which total uncertainties are often above 25 % (2σ) based on the combination of Eq. (1) parameters of F⋅t, , and [H2O].
Two photolytic HONO calibration methods based on reacting NO with the HOx generated by H2O photolysis at 184.9 nm were presented. This includes a novel approach in which HONO is quantified using the NO2 formed by the HO2+ NO reaction as a proxy. The proxy method compares well with the O3 actinometry-based calibration while also having the benefit of a simpler calculation that avoids the need to characterize the emission spectrum of the mercury lamp used. In addition, this proxy method has improved uncertainties, typically between 4.5 % and 10 % (2σ) – lower than the 27 % 2σ uncertainty associated with the actinometric calibration method. We also detail the potential application of a NO2 proxy calibration for HOx calibrations, in which we anticipate exceptional 2σ uncertainties of below 15 %. These photolytic calibrations require a direct NO2 measurement, a 184.9 nm light source, and a simple quartz tube photolysis chamber. In conclusion, these photolytic calibration techniques offer a valuable alternative to the more conventional HONO calibration that is based on reacting hydrogen chloride vapor with sodium nitrite.
The data used in this paper are available upon request.
The supplement related to this article is available online at: https://doi.org/10.5194/amt-15-5455-2022-supplement.
AJL and ECW designed the experiments. AJL carried them out and performed the data analysis. AJL prepared the manuscript with contributions from ECW.
The contact author has declared that none of the authors has any competing interests.
Publisher’s note: Copernicus Publications remains neutral with regard to jurisdictional claims in published maps and institutional affiliations.
We are grateful to Phil Stevens (Indiana University) for characterizing the mercury lamp used for these calibrations.
This research has been supported by the Directorate for Geosciences (grant no. AGS-2002928).
This paper was edited by Lisa Whalley and reviewed by three anonymous referees.
Bertram, T. H., Kimmel, J. R., Crisp, T. A., Ryder, O. S., Yatavelli, R. L. N., Thornton, J. A., Cubison, M. J., Gonin, M., and Worsnop, D. R.: A field-deployable, chemical ionization time-of-flight mass spectrometer, Atmos. Meas. Tech., 4, 1471–1479, https://doi.org/10.5194/amt-4-1471-2011, 2011.
Bloss, W. J., Lee, J. D., Heard, D. E., Salmon, R. A., Bauguitte, S. J.-B., Roscoe, H. K., and Jones, A. E.: Observations of OH and HO2 radicals in coastal Antarctica, Atmos. Chem. Phys., 7, 4171–4185, https://doi.org/10.5194/acp-7-4171-2007, 2007.
Bottorff, B., Reidy, E., Mielke, L., Dusanter, S., and Stevens, P. S.: Development of a laser-photofragmentation laser-induced fluorescence instrument for the detection of nitrous acid and hydroxyl radicals in the atmosphere, Atmos. Meas. Tech., 14, 6039–6056, https://doi.org/10.5194/amt-14-6039-2021, 2021.
Bourgeois, I., Peischl, J., Neuman, J. A., Brown, S. S., Allen, H. M., Campuzano-Jost, P., Coggon, M. M., DiGangi, J. P., Diskin, G. S., Gilman, J. B., Gkatzelis, G. I., Guo, H., Halliday, H. A., Hanisco, T. F., Holmes, C. D., Huey, L. G., Jimenez, J. L., Lamplugh, A. D., Lee, Y. R., Lindaas, J., Moore, R. H., Nault, B. A., Nowak, J. B., Pagonis, D., Rickly, P. S., Robinson, M. A., Rollins, A. W., Selimovic, V., St. Clair, J. M., Tanner, D., Vasquez, K. T., Veres, P. R., Warneke, C., Wennberg, P. O., Washenfelder, R. A., Wiggins, E. B., Womack, C. C., Xu, L., Zarzana, K. J., and Ryerson, T. B.: Comparison of airborne measurements of NO, NO2, HONO, NOy, and CO during FIREX-AQ, Atmos. Meas. Tech., 15, 4901–4930, https://doi.org/10.5194/amt-15-4901-2022, 2022.
Burkholder, J., Sander, S., Abbatt, J., Barker, J., Cappa, C., Crounse, J., Dibble, T., Huie, R., Kolb, C., and Kurylo, M.: Chemical kinetics and photochemical data for use in atmospheric studies, Evaluation No. 19, JPL Publication 19–5, 583–586, Jet Propulsion Laboratory, Pasadena, http://jpldataeval.jpl.nasa.gov (last access: 19 September 2022), 2020.
Butkovskaya, N., Kukui, A., and Le Bras, G.: HNO3 Forming Channel of the HO2+ NO Reaction as a Function of Pressure and Temperature in the Ranges of 72–600 Torr and 223–323 K, J. Phys. Chem. A, 111, 9047–9053, https://doi.org/10.1021/jp074117m, 2007.
Butkovskaya, N., Rayez, M.-T., Rayez, J.-C., Kukui, A., and Le Bras, G.: Water vapor effect on the HNO3 yield in the HO2+ NO reaction: experimental and theoretical evidence, J. Phys. Chem. A, 113, 11327–11342, https://doi.org/10.1021/jp811428p, 2009.
Cheng, P., Cheng, Y., Lu, K., Su, H., Yang, Q., Zou, Y., Zhao, Y., Dong, H., Zeng, L., and Zhang, Y.: An online monitoring system for atmospheric nitrous acid (HONO) based on stripping coil and ion chromatography, J. Environ. Sci., 25, 895907, https://doi.org/10.1016/s1001-0742(12)60251-4, 2013.
Crilley, L. R., Kramer, L. J., Ouyang, B., Duan, J., Zhang, W., Tong, S., Ge, M., Tang, K., Qin, M., Xie, P., Shaw, M. D., Lewis, A. C., Mehra, A., Bannan, T. J., Worrall, S. D., Priestley, M., Bacak, A., Coe, H., Allan, J., Percival, C. J., Popoola, O. A. M., Jones, R. L., and Bloss, W. J.: Intercomparison of nitrous acid (HONO) measurement techniques in a megacity (Beijing), Atmos. Meas. Tech., 12, 6449–6463, https://doi.org/10.5194/amt-12-6449-2019, 2019.
Dixneuf, S., Ruth, A. A., Häseler, R., Brauers, T., Rohrer, F., and Dorn, H.-P.: Detection of nitrous acid in the atmospheric simulation chamber SAPHIR using open-path incoherent broadband cavity-enhanced absorption spectroscopy and extractive long-path absorption photometry, Atmos. Meas. Tech., 15, 945–964, https://doi.org/10.5194/amt-15-945-2022, 2022.
Dusanter, S., Vimal, D., and Stevens, P.: Measuring tropospheric OH and HO2 by laser-induced fluorescence at low pressure. A comparison of calibration techniques, Atmos. Chem. Phys., 8, 321–340, https://doi.org/10.5194/acp-8-321-2008, 2008.
Dyson, J. E., Boustead, G. A., Fleming, L. T., Blitz, M., Stone, D., Arnold, S. R., Whalley, L. K., and Heard, D. E.: Production of HONO from NO2 uptake on illuminated TiO2 aerosol particles and following the illumination of mixed TiOammonium nitrate particles, Atmos. Chem. Phys., 21, 5755–5775, https://doi.org/10.5194/acp-21-5755-2021, 2021.
Faloona, I. C., Tan, D., Lesher, R. L., Hazen, N. L., Frame, C. L., Simpas, J. B., Harder, H., Martinez, M., Di Carlo, P., and Ren, X.: A laser-induced fluorescence instrument for detecting tropospheric OH and HO2: Characteristics and calibration, J. Atmos. Chem., 47, 139–167, https://doi.org/10.1023/B:JOCH.0000021036.53185.0e, 2004.
Febo, A., Perrino, C., Gherardi, M., and Sparapani, R.: Evaluation of a high-purity and high-stability continuous generation system for nitrous acid, Environ. Sci. Technol., 29, 2390–2395, https://doi.org/10.1021/es00009a035, 1995.
Gingerysty, N. J. and Osthoff, H. D.: A compact, high-purity source of HONO validated by Fourier transform infrared and thermal-dissociation cavity ring-down spectroscopy, Atmos. Meas. Tech., 13, 4159–4167, https://doi.org/10.5194/amt-13-4159-2020, 2020.
Gomez Alvarez, E., Amedro, D., Afif, C., Gligorovski, S., Schoemaecker, C., Fittschen, C., Doussin, J.-F., and Wortham, H.: Unexpectedly high indoor hydroxyl radical concentrations associated with nitrous acid, P. Natl. Acad. Sci. USA, 110, 13294–13299, https://doi.org/10.1073/pnas.1308310110, 2013.
Jaeglé, L., Shah, V., Thornton, J., Lopez-Hilfiker, F., Lee, B., McDuffie, E., Fibiger, D., Brown, S., Veres, P., and Sparks, T.: Nitrogen oxides emissions, chemistry, deposition, and export over the Northeast United States during the WINTER aircraft campaign, J. Geohys. Res.-Atmos., 123, 12368–312393, https://doi.org/10.1029/2018JD029133, 2018.
Jiang, Y., Xue, L., Gu, R., Jia, M., Zhang, Y., Wen, L., Zheng, P., Chen, T., Li, H., Shan, Y., Zhao, Y., Guo, Z., Bi, Y., Liu, H., Ding, A., Zhang, Q., and Wang, W.: Sources of nitrous acid (HONO) in the upper boundary layer and lower free troposphere of the North China Plain: insights from the Mount Tai Observatory, Atmos. Chem. Phys., 20, 12115–12131, https://doi.org/10.5194/acp-20-12115-2020, 2020.
Jiang, Y., Xue, L., Shen, H., Dong, C., Xiao, Z., and Wang, W.: Dominant Processes of HONO Derived from Multiple Field Observations in Contrasting Environments, Environ. Sci. Tech. Let., 9, 258–264, https://doi.org/10.1021/acs.estlett.2c00004, 2022.
Kebabian, P. L., Wood, E. C., Herndon, S. C., and Freedman, A.: A practical alternative to chemiluminescence-based detection of nitrogen dioxide: Cavity attenuated phase shift spectroscopy, Environ. Sci. Technol., 42, 6040–6045, https://doi.org/10.1021/es703204j, 2008.
Lanzendorf, E., Hanisco, T., Donahue, N., and Wennberg, P.: Comment on: “The measurement of tropospheric OH radicals by laser-induced fluorescence spectroscopy during the POPCORN Field Campaign” by Hofzumahaus et al. and “Intercomparison of tropospheric OH radical measurements by multiple folded long-path laser absorption and laser induced fluorescence” by Brauers et al., Geophys. Res. Lett., 24, 3037–3038, https://doi.org/10.1029/97GL02899, 1997.
Lao, M., Crilley, L. R., Salehpoor, L., Furlani, T. C., Bourgeois, I., Neuman, J. A., Rollins, A. W., Veres, P. R., Washenfelder, R. A., Womack, C. C., Young, C. J., and VandenBoer, T. C.: A portable, robust, stable, and tunable calibration source for gas-phase nitrous acid (HONO), Atmos. Meas. Tech., 13, 5873–5890, https://doi.org/10.5194/amt-13-5873-2020, 2020.
Lee, B., Wood, E., Wormhoudt, J., Shorter, J., Herndon, S., Zahniser, M., and Munger, J.: Effective line strengths of trans-nitrous acid near 1275 cm−1 and cis-nitrous acid at 1660 cm−1, J. Quant. Spectrosc. Ra., 113, 1905–1912, https://doi.org/10.1016/j.jqsrt.2012.06.004, 2012.
Lee, B. H., Lopez-Hilfiker, F. D., Mohr, C., Kurtén, T., Worsnop, D. R., and Thornton, J. A.: An iodide-adduct high-resolution time-of-flight chemical-ionization mass spectrometer: Application to atmospheric inorganic and organic compounds, Environ. Sci. Technol., 48, 6309–6317, https://doi.org/10.1021/es500362a, 2014.
Li, X., Rohrer, F., Hofzumahaus, A., Brauers, T., Häseler, R., Bohn, B., Broch, S., Fuchs, H., Gomm, S., and Holland, F.: Missing gas-phase source of HONO inferred from Zeppelin measurements in the troposphere, Science, 344, 292–296, https://doi.org/10.1126/science.1248999, 2014.
Lu, K., Fuchs, H., Hofzumahaus, A., Tan, Z., Wang, H., Zhang, L., Schmitt, S. H., Rohrer, F., Bohn, B., and Broch, S.: Fast photochemistry in wintertime haze: consequences for pollution mitigation strategies, Environ. Sci. Technol., 53, 10676–10684, https://doi.org/10.1021/acs.est.9b02422, 2019.
Novak, G. A., Vermeuel, M. P., and Bertram, T. H.: Simultaneous detection of ozone and nitrogen dioxide by oxygen anion chemical ionization mass spectrometry: a fast-time-response sensor suitable for eddy covariance measurements, Atmos. Meas. Tech., 13, 1887–1907, https://doi.org/10.5194/amt-13-1887-2020, 2020.
Peng, Q., Palm, B. B., Melander, K. E., Lee, B. H., Hall, S. R., Ullmann, K., Campos, T., Weinheimer, A. J., Apel, E. C., and Hornbrook, R. S.: HONO emissions from western US wildfires provide dominant radical source in fresh wildfire smoke, Environ. Sci. Technol., 54, 5954–5963, https://doi.org/10.1021/acs.est.0c00126, 2020.
Pinto, J. P., Dibb, J., Lee, B. H., Rappenglück, B., Wood, E. C., Levy, M., Zhang, R. Y., Lefer, B., Ren, X. R., Stutz, J., Tsai, C., Ackermann, L., Golovko, J., Herndon, S. C., Oakes, M., Meng, Q. Y., Munger, J. W., Zahniser, M., and Zheng, J.: Intercomparison of field measurements of nitrous acid (HONO) during the SHARP campaign, J. Geophys. Res.-Atmos., 119, 5583–5601, https://doi.org/10.1002/2013jd020287, 2014.
Ren, X., Van Duin, D., Cazorla, M., Chen, S., Mao, J., Zhang, L., Brune, W. H., Flynn, J. H., Grossberg, N., and Lefer, B. L.: Atmospheric oxidation chemistry and ozone production: Results from SHARP 2009 in Houston, Texas, J. Geophys. Res.-Atmos., 118, 5770–5780, https://doi.org/10.1002/jgrd.50342, 2013.
Schultz, M., Heitlinger, M., Mihelcic, D., and Volz-Thomas, A.: Calibration source for peroxy radicals with built-in actinometry using H2O and O2 photolysis at 185 nm, J. Geophys. Res.-Atmos., 100, 18811–18816, https://doi.org/10.1029/95JD01642, 1995.
Slater, E. J., Whalley, L. K., Woodward-Massey, R., Ye, C., Lee, J. D., Squires, F., Hopkins, J. R., Dunmore, R. E., Shaw, M., Hamilton, J. F., Lewis, A. C., Crilley, L. R., Kramer, L., Bloss, W., Vu, T., Sun, Y., Xu, W., Yue, S., Ren, L., Acton, W. J. F., Hewitt, C. N., Wang, X., Fu, P., and Heard, D. E.: Elevated levels of OH observed in haze events during wintertime in central Beijing, Atmos. Chem. Phys., 20, 14847–14871, https://doi.org/10.5194/acp-20-14847-2020, 2020.
Stevens, P., Mather, J., and Brune, W.: Measurement of tropospheric OH and HO2 by laser-induced fluorescence at low pressure, J. Geophys. Res.-Atmos., 99, 3543–3557, https://doi.org/10.1029/93JD03342, 1994.
Stutz, J., Oh, H.-J., Whitlow, S. I., Anderson, C., Dibb, J. E., Flynn, J. H., Rappenglück, B., and Lefer, B.: Simultaneous DOAS and mist-chamber IC measurements of HONO in Houston, TX, Atmos. Environ., 44, 4090–4098, https://doi.org/10.1016/j.atmosenv.2009.02.003, 2010.
Tuite, K., Thomas, J. L., Veres, P. R., Roberts, J. M., Stevens, P. S., Griffith, S. M., Dusanter, S., Flynn, J. H., Ahmed, S., and Emmons, L.: Quantifying nitrous acid formation mechanisms using measured vertical profiles during the CalNex 2010 campaign and 1D column modeling, J. Geophys. Res.-Atmos., 126, e2021JD034689, https://doi.org/10.1029/2021JD034689, 2021.
Veres, P. R., Roberts, J. M., Wild, R. J., Edwards, P. M., Brown, S. S., Bates, T. S., Quinn, P. K., Johnson, J. E., Zamora, R. J., and de Gouw, J.: Peroxynitric acid (HO2NO2) measurements during the UBWOS 2013 and 2014 studies using iodide ion chemical ionization mass spectrometry, Atmos. Chem. Phys., 15, 8101–8114, https://doi.org/10.5194/acp-15-8101-2015, 2015.
Veres, P. R., Neuman, J. A., Bertram, T. H., Assaf, E., Wolfe, G. M., Williamson, C. J., Weinzierl, B., Tilmes, S., Thompson, C. R., and Thames, A. B.: Global airborne sampling reveals a previously unobserved dimethyl sulfide oxidation mechanism in the marine atmosphere, P. Natl. Acad. Sci. USA, 117, 4505–4510, https://doi.org/10.1073/pnas.1919344117, 2020.
Villena, G. and Kleffmann, J.: A source for the continuous generation of pure and quantifiable HONO mixtures, Atmos. Meas. Tech., 15, 627–637, https://doi.org/10.5194/amt-15-627-2022, 2022.
Villena, G., Kleffmann, J., Kurtenbach, R., Wiesen, P., Lissi, E., Rubio, M. A., Croxatto, G., and Rappenglück, B.: Vertical gradients of HONO, NOx and O3 in Santiago de Chile, Atmos. Environ., 45, 3867–3873, https://doi.org/10.1016/j.atmosenv.2011.01.073, 2011.
Wang, C., Bottorff, B., Reidy, E., Rosales, C. M. F., Collins, D. B., Novoselac, A., Farmer, D. K., Vance, M. E., Stevens, P. S., and Abbatt, J. P.: Cooking, bleach cleaning, and air conditioning strongly impact levels of HONO in a house, Environ. Sci. Technol., 54, 13488–13497, https://doi.org/10.1021/acs.est.0c05356, 2020.
Whalley, L. K., Stone, D., Dunmore, R., Hamilton, J., Hopkins, J. R., Lee, J. D., Lewis, A. C., Williams, P., Kleffmann, J., Laufs, S., Woodward-Massey, R., and Heard, D. E.: Understanding in situ ozone production in the summertime through radical observations and modelling studies during the Clean air for London project (ClearfLo), Atmos. Chem. Phys., 18, 2547–2571, https://doi.org/10.5194/acp-18-2547-2018, 2018.
Wong, K. W., Tsai, C., Lefer, B., Haman, C., Grossberg, N., Brune, W. H., Ren, X., Luke, W., and Stutz, J.: Daytime HONO vertical gradients during SHARP 2009 in Houston, TX, Atmos. Chem. Phys., 12, 635–652, https://doi.org/10.5194/acp-12-635-2012, 2012.
Ye, C., Gao, H., Zhang, N., and Zhou, X.: Photolysis of Nitric Acid and Nitrate on Natural and Artificial Surfaces, Environ. Sci. Technol., 50, 3530–3536, https://doi.org/10.1021/acs.est.5b05032, 2016.
Ye, C., Zhang, N., Gao, H., and Zhou, X.: Photolysis of Particulate Nitrate as a Source of HONO and NOx, Environ. Sci. Technol., 51, 6849–6856, https://doi.org/10.1021/acs.est.7b00387, 2017.
York, D., Evensen, N. M., Martınez, M. L., and De Basabe Delgado, J.: Unified equations for the slope, intercept, and standard errors of the best straight line, Am. J. Phys., 72, 367–375, https://doi.org/10.1119/1.1632486, 2004.
Young, C. J., Washenfelder, R. A., Roberts, J. M., Mielke, L. H., Osthoff, H. D., Tsai, C., Pikelnaya, O., Stutz, J., Veres, P. R., Cochran, A. K., VandenBoer, T. C., Flynn, J., Grossberg, N., Haman, C. L., Lefer, B., Stark, H., Graus, M., de Gouw, J., Gilman, J. B., Kuster, W. C., and Brown, S. S.: Vertically resolved measurements of nighttime radical reservoirs in Los Angeles and their contribution to the urban radical budget, Environ. Sci. Technol., 46, 10965–10973, https://doi.org/10.1021/es302206a, 2012.