the Creative Commons Attribution 4.0 License.
the Creative Commons Attribution 4.0 License.
 | 11 Oct 2022
Sensitivity of aerosol optical depth trends using long-term measurements of different sun photometers
Angelos Karanikolas
Natalia Kouremeti
Julian Gröbner
Luca Egli
Stelios Kazadzis
This work aims to assess differences in the aerosol optical depth (AOD) trend estimations when using high-quality AOD measurements from two different instruments with different technical characteristics and operational (e.g. measurement frequency), calibration and processing protocols. The different types of sun photometers are the CIMEL that is part of AERONET (AErosol RObotic NETwork) and a precision filter radiometer (PFR) that is part of the Global Atmosphere Watch Precision Filter Radiometer network. The analysis operated for two wavelengths (500 and 501 and 870 and 862 nm for CIMEL–PFR) in Davos, Switzerland, for the period 2007–2019.
For the synchronous AOD measurements, more than 95 % of the CIMEL–PFR AOD differences are within the WMO-accepted limits, showing very good measurement agreement and homogeneity in calibration and post-correction procedures. AOD trends per decade in AOD for Davos for the 13-year period of analysis were approximately −0.017 and −0.007 per decade for 501 and 862 nm (PFR), while the CIMEL–PFR trend differences have been found 0.0005 and 0.0003, respectively. The linear trend difference for 870 and 862 nm is larger than the linear fit standard error. When calculating monthly AODs using all PFR data (higher instrument frequency) and comparing them with the PFR measurements that are synchronous with CIMEL, the trend differences are smaller than the standard error. Linear trend differences of the CIMEL and PFR time series presented here are not within the calculated trend uncertainties (based on measurement uncertainty) for 870 and 862 nm. On the contrary, PFR trends, when comparing high- and low-measurement-frequency datasets are within such an uncertainty estimation for both wavelengths. Finally, for time-varying trends all trend differences are well within the calculated trend uncertainties.
- Article
(3967 KB) - Full-text XML
- BibTeX
- EndNote


Aerosols from both anthropogenic and natural sources are an important component regarding the study of atmospheric processes (Ginoux et al., 2012). They affect the Earth's energy budget and distribution by scattering and absorbing solar and terrestrial radiation. They also act as cloud condensation nuclei, thus playing a crucial role in cloud formation and properties (Fan et al., 2016). Their effect on surface solar radiation is found to be a significant forcing of the climate (IPCC, 2021) and dominant in surface solar radiation variations for several decades (Wild, 2012; Wild et al., 2021). Surface solar radiation is important for its biological effects (mainly in the UV region) (Horneck, 1995; Bais et al., 2018) and for solar energy applications (Hou et al., 2021; Fountoulakis et al., 2021; Myers, 2005). Their interactions with clouds are also important for radiative forcing attribution, climate modelling and weather forecasts (Rosenfeld et al., 2014; Glotfelty et al., 2019; Huang and Ding, 2021; Benedetti et al., 2018).
Aerosol concentration in the atmosphere is variable and changes according to the variability of sources and removal mechanisms. Part of the aerosol load variability is due to changes in anthropogenic emissions (e.g. Lei et al., 2011; Zhao et al., 2017), but it can be influenced by natural factors such as volcanic activity (e.g. Vernier et al., 2011) and dust transport (e.g. Gkikas et al., 2022). For example, an increasing load of Sahara dust is evident in the central Sahara region, and a decreasing in load is evident in the Mediterranean and eastern parts of North Africa region (Logothetis et al., 2021). Therefore, their long-term trend study is important information for studying the climate variability and the solar radiation effects on ecosystems (Wetzel, 2003; Paul and Gwynn-Jones, 2003; Edreira et al., 2020).
One of the most important parameters regarding aerosols is the aerosol optical depth (AOD). It is the parameter that describes the aerosol column direct effect on solar radiation and the most important aerosol-related parameter for Earth energy budget related studies (WMO, 2003). AOD is calculated through measuring the direct sun irradiance. There are various instrument networks like AERONET (AErosol RObotic NETwork; Holben et al., 1998), the Global Atmospheric Watch Precision Filter Radiometer (GAW-PFR) network (Kazadzis et al., 2018b) and the sky radiometer network (SKYNET) (Nakajima et al., 2020). AERONET is the largest network, with around 400 stations in 50 countries all over the world, and the instrument used is the CIMEL sun photometer (Holben et al., 1998). SKYNET covers approximately 100 stations, and its instrument is the PREDE-POM sun–sky radiometer (Nakajima et al., 2020). Most of the SKYNET sites are in East Asia and Europe. GAW-PFR has 15 stations over all continents, mainly at remote locations, aiming for long-term measurements of background aerosol conditions. Its instrument is the PFR (Wehrli, 2000). Several studies have examined the AOD measurement differences between different networks. The intercomparisons are either for short periods (campaign based) like the filter–radiometer comparison (FRC) (Kazadzis et al., 2018a) or for longer periods (Estellés et al., 2012; Kim et al., 2008; Cuevas et al., 2019).
A key issue about AOD is its long-term variability, as it is important for the study of the changes in aerosol contributions to the Earth–atmosphere energy balance. AOD changes are associated with variability of aerosol sources (Reddington et al., 2016) and atmospheric transport (Kumar et al., 2013). Several studies have investigated long-term trends of AOD from ground-based observation (e.g. Ningombam et al., 2019; Li et al., 2014; Nyeki et al., 2012) and from satellite observations (e.g. Cherian and Quaas, 2020; Guo et al., 2011). The accuracy of trends from ground-based instruments has a particular significance since the AOD ground-based observations are used for satellite validation (Kotrike et al., 2021; Wei et al., 2019; Ogunjobi and Awoleye, 2019; Ma et al., 2016; Xie et al., 2011), climate model validation (Mortier et al., 2020) and modelling assimilation (Benedetti et al., 2018). There is lack of studies comparing the AOD trends derived from different instruments.
Studying the AOD trend analysis limitations is an important step towards a better understanding and quantification of the trend uncertainties and reliability. A standard source of uncertainties is the instrument measurement uncertainty, which can be of the same magnitude as AOD in low-AOD locations. However, when using two different instruments, their calibration and post-correcting differences can lead to large differences in AOD trend calculations from each one. Another source of uncertainty can possibly be the measurement frequency of the instrument. Instruments with lower measurement frequency are likely to miss fluctuations of AOD during the day that might affect the results. As AOD is measured only without the presence of clouds, this can be amplified for days and months with few cloudless sky measurements. For the GAW-PFR network, the measurement frequency is once every minute. AERONET has a default schedule of one measurement every 0.5 air mass intervals for air mass >2 and every 15 min for the rest of the day (Gregory, 2011). In order to deal with the low availability of data, one can induce limits for the number of measurements a month must contain in order the monthly data to be considered valid. In Nyeki et al. (2012), where data of PFRs are analysed, each month must contain at least 100 measurements. Extra limits are induced for daily and hourly values to 50 and 6 observations respectively. In Li et al. (2014), where CIMELs are used, the requirement of a valid monthly value is a minimum of six point measurements per month. Given the limited geographic coverage of instruments that measure every minute and the high coverage of AERONET network, an interesting question is how significant the effect of the measurement frequency is on long-term variability detection of AOD and therefore how reliable trend calculation can be for most parts of the world.
Other source of uncertainty are the cloud-related (cloud flagging) algorithms from different networks and instruments (Kazadzis et al., 2018a). Such differences can lead to a systematic overestimation of the AOD from algorithms that fail to deal with cloudy sky measurements and an underestimation of the AOD from algorithms that are too strict and characterize high and highly variable AOD cases (e.g. biomass burning aerosols, Giles et al., 2019) as “cloudy”.
Finally, AOD averaging in order to calculate long-term trends can be tricky. Due to cloud presence, AOD is not being continuously measured. As a result, the amount of data averaged from an hourly up to a monthly basis can differ spatiotemporally. In addition, since AOD measurements in a number of cases worldwide are not normally distributed, AOD averaging and calculating trends can influence the results of the analysis (O'Neil et al., 2000; Levy et al., 2009; Sayer and Knobelspiesse, 2019).
For this study, we use 13 years of parallel PFR and CIMEL time series at Davos, Switzerland, in order to investigate their AOD differences and all of the related uncertainties (calibration, algorithms, measurement frequency, etc.) affecting their AOD trend calculation differences.
In the following section, we describe the location and the instruments used, followed by the methodology of the AOD intercomparison, and finally the trend analysis methods. In Sect. 3 the results are presented, and in Sect. 4 the conclusions are given.
2.1 Location and instrumentation
The instruments used for this study are operated at PMOD/WRC at Davos. Davos is in a valley of a mountainous region in eastern Switzerland. The altitude of the station is 1590 m a.s.l., and there are no significant pollution sources nearby. However, aerosols can reach the area through long-range transport from the various industrial and urban areas in Switzerland or surrounding countries and from the Sahara Desert in cases of severe European dust episodes (Greilinger and Kasper-Giebl, 2021).
For this study, we use the PFR (N27) sun photometer, which is part of the WMO AOD reference (Kazadzis et al., 2018b). Three CIMEL sun photometers have been operated at Davos (2005–2018, 2018–2019 and 2019–present). The description for each instrument can be found in the following sections.
2.1.1 PFR
The Precision Filter Radiometer (described in Wehrli, 2000) is an automatic sun photometer that measures the direct solar irradiance in four channels. It is mounted on a separate tracking system that continuously follows the motion of the sun. Its channels extend from the near UV to the near IR and are centred on 368, 412, 501 and 862 nm. The radiation passes through interference filters in order to let only a narrow spectral region centred at these wavelengths reach the detector, which is a silicon photodiode. Their full-width-at-half-maximum (FWHM) bandwidth varies from 3 to 5 nm and its field-of-view angle (FOV) is approximately 2∘ in order to provide high confidence for the full solar tracking. It is a weatherproof instrument, highly protected from the outside conditions with its temperature kept constant at approximately 20 ∘C by an active Peltier system. It also has internal constant pressure of ∼2 atm with dry nitrogen. Its filters are exposed to the solar radiation for 10 s every minute in order to measure direct solar irradiance. Each filter is in a constant position behind a different shutter so they can be exposed to the sun the same moment.
Most of the PFRs are calibrated through comparison with the PFR reference triad. The triad is being compared regularly with specific PFRs, which are calibrated with the Langley plot method (LP) (Shaw et al., 1973) at two high-altitude locations (Mauna Loa in Hawaii, USA, and Izaña in Tenerife, Spain) (Kazadzis et al., 2018b).
2.1.2 CIMEL
The CIMEL sun photometer (described in Holben et al., 1998) is an automatic instrument with a two-axis robotic tracking system that measures the direct solar irradiance and diffuse sky radiance in the spectral range of 340 to 1640 nm for up to 10 wavelengths depending on its version. The CIMEL version used in this study has at least eight interference filters centred at 340, 380, 440, 500, 675, 870, 940, and 1020 nm with 10 nm full-width-at-half-maximum (FWHM) bandwidth, except for 340 and 380 nm, which have 2 and 4 nm FWHM, respectively. The irradiance is measured by a silicon detector, which measures each channel for 1 s, and the filter wheel moves to the next channel until all channels are measured. The measurement sequence is repeated three times in a time interval of approximately 30 s. Its field-of-view angle (FOV) is 1.2∘. It has a four-quadrant detector in order to improve the tracking of the sun before the measurements by detecting the point with the maximum radiation intensity. The CIMEL sun photometers are calibrated through LP at Mauna Loa station or with a calibration transfer from an instrument calibrated at Mauna Loa (Toledano et al., 2018), and their AOD retrieval algorithms are presented in Giles et al. (2019). The CIMEL AOD data are publicly available at three levels. Level 1.0 shows near-real-time data without cloud screening, the final calibration and quality assurance. The cloud screening also produces near-real-time data at level 1.5. After the application of the final calibration and quality assurance, the level 2.0 data are produced, which we use in this study.
2.2 Intercomparison methods and trend calculation
2.2.1 Measurement intercomparison
We compared AERONET/CIMEL and GAW/PFR AOD measurements and trends on the two channels that are directly comparable (CIMEL–PFR: 500 and 501 as well as 862 and 870 nm).
As mentioned above, basic AOD differences among two different instruments are related to the existence of different calibration standards, technical and post-correction differences, and different AOD retrieval algorithms. In order to assess such differences, the World Meteorological Organization has defined the WMO criterion of traceability among instruments or networks. It is defined as the number in percent of synchronous measurements that lie within ± (, with m indicating air mass coefficient) (WMO/GAW, 2005). Traceability is established when more than 95 % of such synchronous data are within those limits. Here we use the data of the period 2007–2019 and we consider the measurements with maximum time difference of 30 s as synchronous. The instruments were also compared in terms of the correlation of their monthly median values with the coefficient of determination (R2) as the relevant criterion. Median values were selected instead of mean values because, as previously mentioned, AOD values do not follow a normal distribution, and the data are non-continuous, mainly due to clouds but also due to shipment for calibration or instrument malfunction. We firstly compare the differences between the mean and the median values, and we then use the medians for the rest of the comparisons.
In order to obtain more robust results, a monthly median is considered valid if there are at least 5 valid days of measurements for each month. Days with at least three measurements during the day are considered valid. In this study, a monthly median is the median of all valid daily medians during the month.
From all comparisons only the valid days and months that are common to both instruments and also to synchronous and non-synchronous datasets are used for the trend analysis. The length of the whole period is 156 months, 131 of which include common CIMEL and PFR measurements (mainly due to absence of the CIMEL instruments for their calibration). The months satisfying the selection criteria for all datasets are 114.
Table 1The number of measurements of the datasets (before removing “invalid” months), the time period used and the number of months considered as valid. Keeping only the valid months reduced the overall number of measurements by 3.5 %.
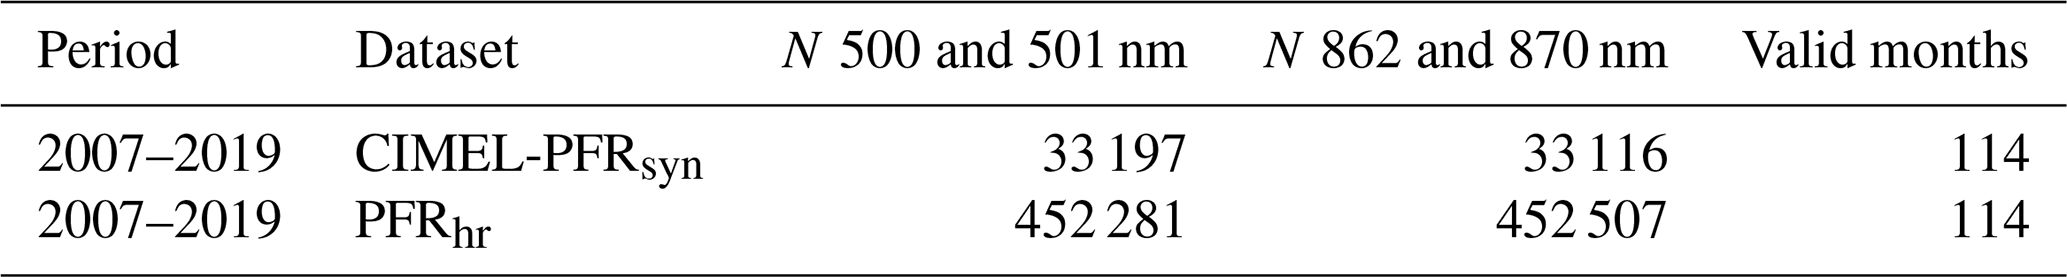
We also aim to assess the AOD differences due to the measurement frequency difference. The PFR is measuring every minute, while CIMEL measures less often. To isolate the effect of the measurement frequency, we compare two different PFR datasets. The first one, PFRsyn, is synchronous with the CIMEL data so it represents the CIMEL measurement frequency. The second one, PFRhf, is a much larger dataset that represents the PFR measurement frequency (1 min), and its comparison with PFRsyn can show the effect of the measurement frequency on AOD differences and trends. The datasets and the corresponding number of measurements are shown in Table 1. The two instruments use different cloud-screening algorithms. The synchronous datasets contain only measurements that are considered cloud-free measurements according to both AERONET and GAW/PFR algorithms, while the PFRsyn dataset is screened with the GAW/PFR algorithm only. The differences between the two algorithms showed no significant effect on the AOD. A total of 93.8 % of CIMEL data that are synchronous with PFR data were identified as cloud-free according to the PFR-related algorithm. Keeping only this 93.8 % of CIMEL and PFR synchronous data reduced the mean AOD of both instruments by less than 0.002 at 500 and 501 nm as well as less than 0.0005 at 870 and 862 nm compared to the mean AOD of 100 % of the data, pointing towards the conclusion that the cloud contamination effects on AOD are minimal.
2.2.2 Linear trends
The linear trends were calculated with the least-squares linear regression (LSLR) method, and their statistical significance has been identified by the non-parametric Mann–Kendall statistical test modified for autocorrelated data (Hamed and Rao, 1998). The time series for the trend calculation and detection were the deseasonalized monthly medians of AOD for the period 2007–2019. To calculate the deseasonalized monthly medians, the intra-annual cycle was calculated separately for each dataset from all medians for each month and subtracted from each monthly median. To assess the trend agreement, we compare the trend differences with the standard error of the fitting method (LSLR).
We also used the Monte Carlo method (Metropolis and Ulam, 1949) to examine whether the measurement uncertainty alone is capable of producing trend differences equal or larger than the observed. The uncertainty of the instruments at the selected channels is approximately 0.01 (Holben et al., 1998; Kazadzis et al., 2020). By applying the Monte Carlo method to the AOD observations we calculate the uncertainty propagation of the measurement uncertainty to monthly AOD. Then we calculate the propagation of the monthly AOD uncertainty to the AOD trends. In both cases, for each AOD measurement or monthly AOD median we generated 10 000 normally distributed random values with the mean of the distribution being the corresponding observed AOD value (measurement or monthly median) and its standard deviation the corresponding uncertainty. The final output is 10 000 AOD random time series for each dataset for which we calculate their trends. The standard deviation of those trends is the trend uncertainty due to the measurement uncertainty.
2.2.3 Time-varying trends
As long-term fluctuations of AOD are not necessarily monotonic or follow a linear trend for any given period (Streets et al., 2009) and static linear trends can also be sensitive to outliers (Bashiri and Moslemi, 2013), we examine how realistic the assumption of the existence of linear trends is for these time series. For this purpose we used the dynamic linear modelling (DLM) method described in Laine et al. (2014) on the monthly median time series. This is a method for calculating trends that vary through time using dynamic linear models (Petris et al., 2009) and Kalman filtering (Andrew, 1990). Any type of known periodicities and external forcings can be used as inputs in the model in order to be removed from the data points. For the DLM trend uncertainty quantification the Markov Chain Monte Carlo (MCMC) method is used (Gamerman and Lopes, 2006). As the seasonal component, we only used the calculated annual cycle, which is removed by the model using a harmonic function. The monthly median uncertainty is also a necessary input to the model for the calculation of the trend and its uncertainty.
The model output is monthly data including AOD change per month and its uncertainty, which here is scaled to AOD change per decade. The procedure was repeated for both synchronous and non-synchronous time series. The final trends are compared in relation to their 1σ uncertainty. They are also compared with LSLR trends.
3.1 AOD data comparison
In this section we assess the AOD differences between monthly AOD calculated from mean AOD with monthly AOD calculated from median AOD and between the synchronous AOD data from CIMEL and PFRN27. Finally, we compare the CIMEL–PFR monthly AOD differences with the differences between the two PFR datasets representing different measurement frequencies (PFRsyn and PFRhf Sect. 2.2.1).
Table 2The difference between the intra-annual cycles calculated from AOD means and those calculated from AOD medians for CIMEL and PFRN27. In both cases, the intra-annual cycle for a month is the mean of all AOD medians and means of the month during 2007–2019 period.
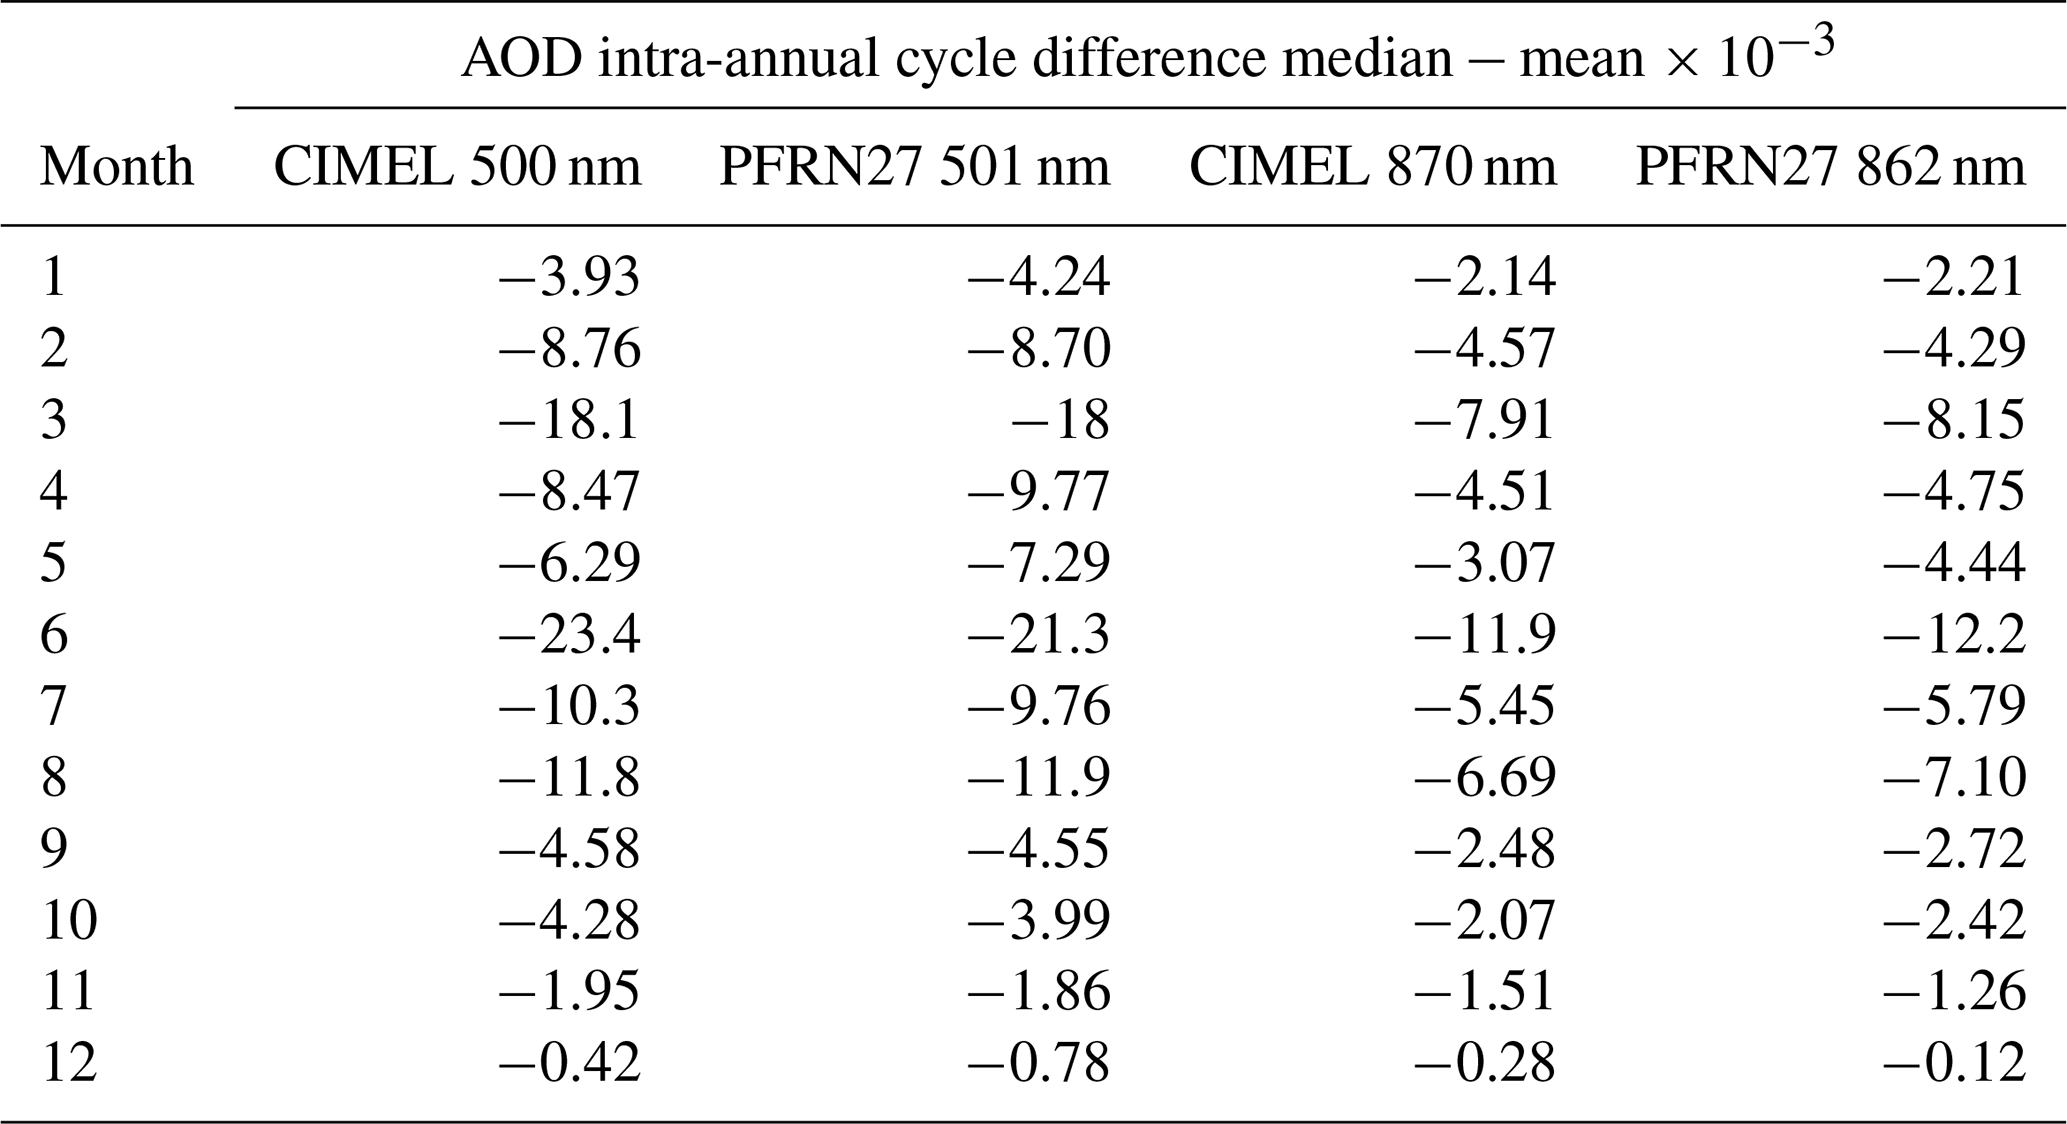
The AOD intra-annual cycles calculated through the mean of AOD measurements differ from those calculated through the median of AOD measurements (Table 2). The differences range between 0.0004 (December) and 0.023 (June) for 500 and 501 nm as well as 0.0001 (December) and 0.012 (June) for 870 and 862 nm. The differences correspond to approximately 1 %–2 % (December) at the minimum and 39 % (June) at the maximum of the 13-year average AOD for each month. Such differences can create trend differences (as discussed in Sect. 3.2).
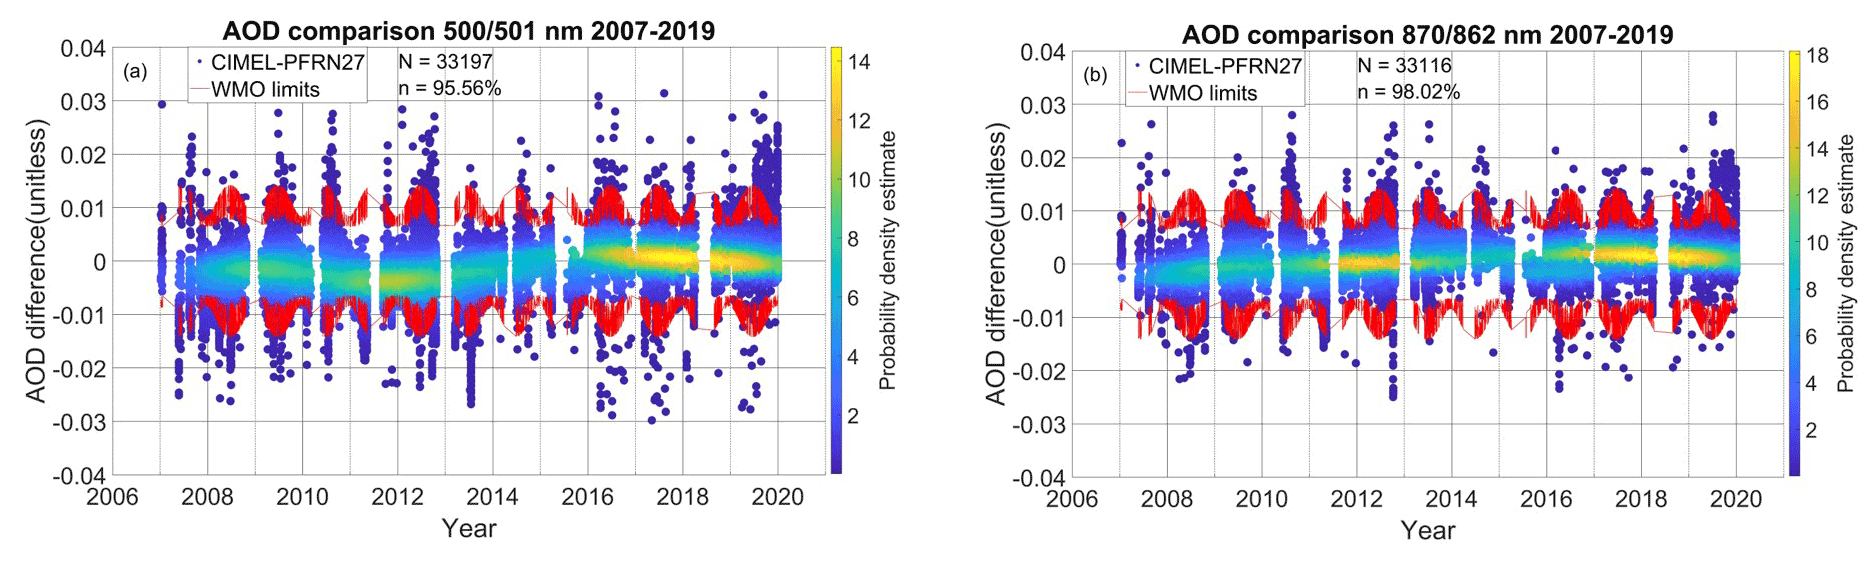
Figure 1CIMEL–PFRN27 differences (blue points and light blue to yellow bands) and WMO limits (red lines) of synchronous AOD measurements with respect to time in years for 500 and 501 (a) and 870 and 862 nm (b) for the PFR/CIMEL. The colour bar corresponds to the density of the AOD difference data points.
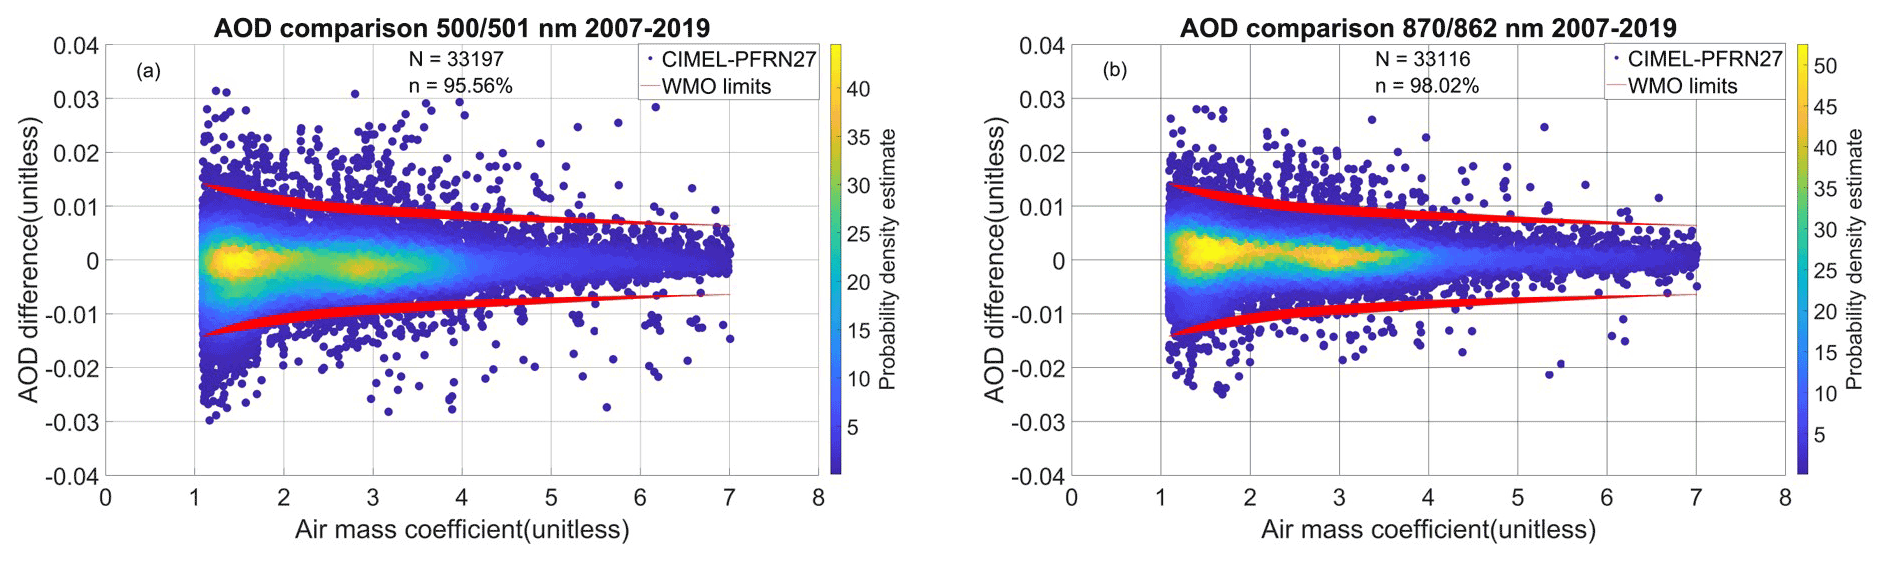
Figure 2CIMEL–PFRN27 differences (blue points and light blue to yellow bands) and WMO limits (red lines) of synchronous AOD measurements with respect to air mass coefficient for 500 and 501 (a) and 870 and 862 nm (b) for the PFR/CIMEL. The colour bar corresponds to the density of the AOD difference data points.
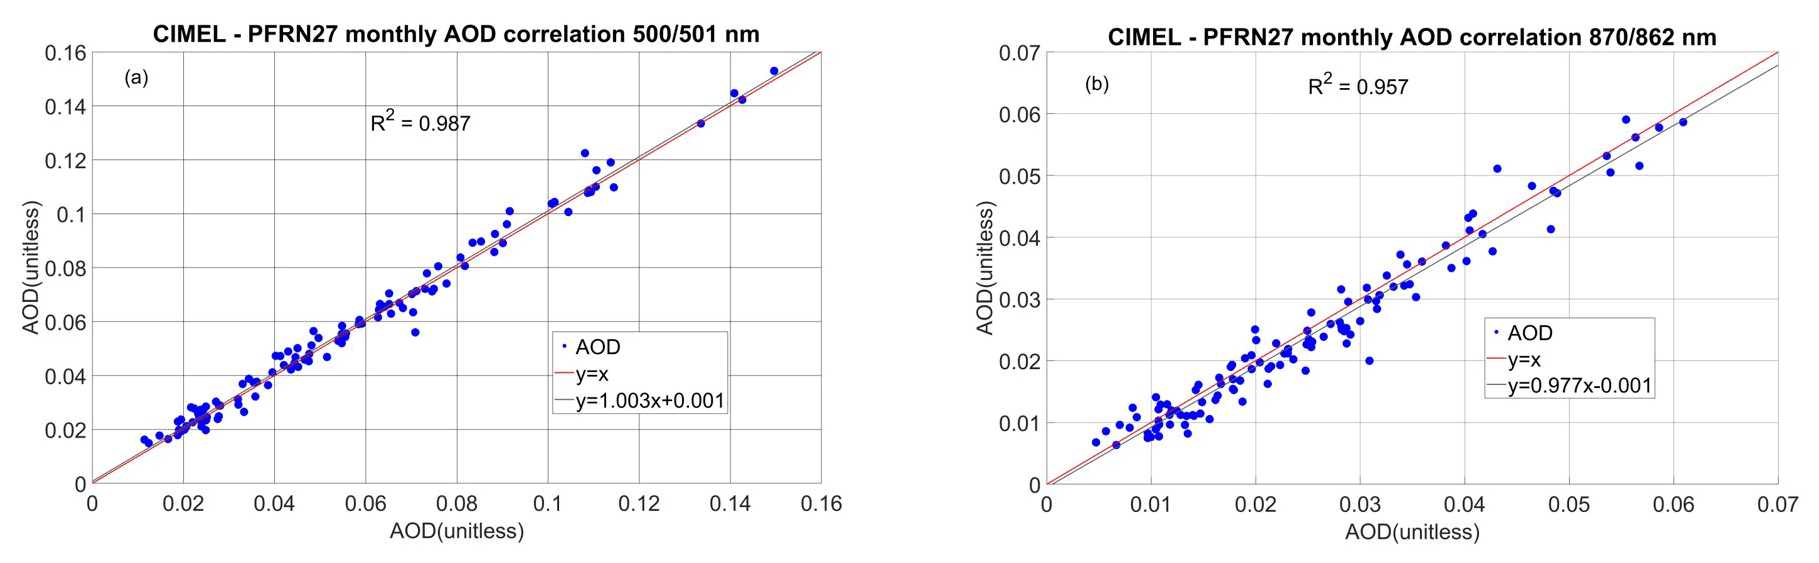
Figure 3Scatter diagram of the monthly median AODs between CIMEL and PFRN27 at 500 and 501 (a) and 870 and 862 nm (b). The coefficient of determination (R2) and the linear fit equation of the plotted data appear in the text box and the legend, respectively.
The instrument comparison showed a very good agreement for this 13-year period as 95.6 % of the AOD differences at 500 and 501 nm as well as 98 % at 870 and 862 nm are within the WMO limits. There is no evident time dependence in the AOD differences, showing good calibration consistency between CIMEL and PFR (Fig. 1). There is also no evident dependence of the AOD differences on the air mass (Fig. 2). The values outside the WMO limits (red lines in Figs. 1 and 2) show the larger deviations at specific periods like the second half of 2019. The monthly AOD of the two instruments shows good correlation (R2>0.95 for both channels) (Fig. 3). In Table 3 these results are summarized.
Table 3WMO criteria compliance and correlation between CIMEL and PFRN27. R2 is the coefficient of determination, and “slope” corresponds to the linear fit of the CIMEL AOD monthly medians in relation to PFRN27 AOD monthly medians.

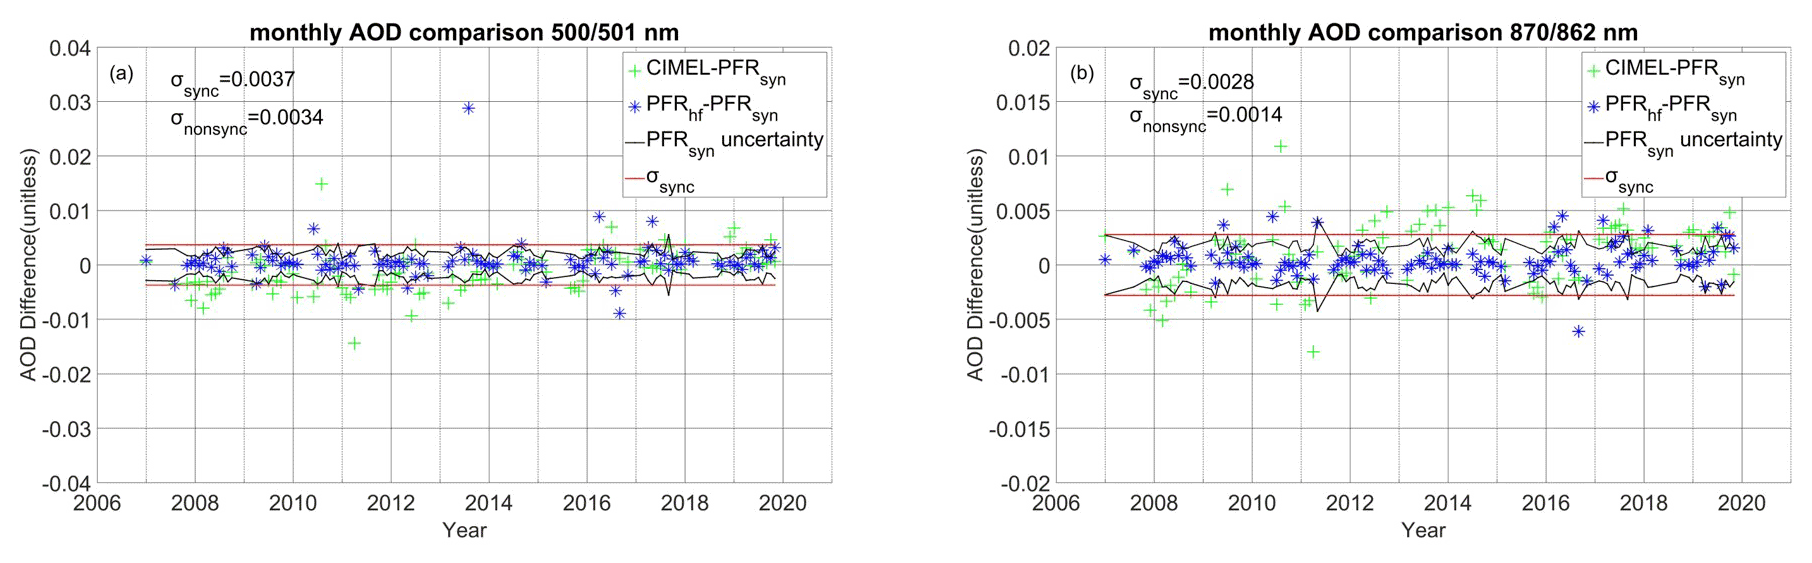
Figure 4The monthly AOD differences for CIMEL–PFRN27 (green crosses) and the two PFRN27 datasets (blue stars) through the years for 500 and 501 (a) and 870 and 862 nm (b) with the uncertainties of the PFRN27 (synchronous with CIMEL) monthly AOD medians (black lines) and the standard deviation of the AOD differences between CIMEL and PFRN27 σsync (red lines). The standard deviation of the PFRhf–PFRsyn differences appears in the upper-left text as σnonsync.
Most monthly AOD differences are within the monthly AOD median uncertainty (1σ) (the calculation procedure was described in Sect. 2.2.2) for all comparisons (Fig. 4). The monthly AOD uncertainties vary for each month and dataset, with their mean values being 0.0021 and 0.0017 at 501 and 862 nm, respectively, for the low-frequency PFR dataset (PFRsyn) and 0.0008 and 0.0007 at 501 and 862 nm, respectively, for the high-frequency dataset (PFRhf). In the CIMEL–PFR comparison the standard deviation of the monthly AOD differences is larger than the mean monthly AOD uncertainties but at the same order of magnitude (0.0037 and 0.0028). The comparison between the two PFR datasets (low- and high-frequency PFRsyn/PFRhf) shows that the measurement frequency differences can produce monthly AOD differences similar to those between CIMEL and PFR for synchronous datasets. The standard deviation of the AOD differences (0.0034 and 0.0014 for 501 and 862 nm, respectively) are larger than the PFRsyn monthly AOD uncertainties at 501 nm (monthly uncertainty 0.0021) and lower than at 862 nm (monthly uncertainty 0.0017) (Fig. 4). In both wavelengths the standard deviation of the differences is larger for the CIMEL–PFR comparison, where more monthly AOD differences exceed the monthly AOD 1σ uncertainty.
The actual AOD uncertainty measured by CIMEL and PFR is a function of optical air mass (m), with the 0.01 value (Sect. 2.2.2) corresponding to m=1 and reducing by a factor as m increases (Eck et al., 1999; Kazadzis et al., 2020). This is evident in Fig. 2, where the AOD differences between CIMEL and PFR are reduced for higher air masses. In order to discuss the effects of the calibration uncertainty on the calculated AODs, in a separate analysis we have only used data for m>3 where the calibration effect on the AOD uncertainty is minimized. The number of measurements is 8304 for 500 and 501 as well as 8282 for 870 and 862 nm. The comparison of these data for coincident CIMEL and PFR showed 96.62 % and 98.5 % of the data to be within the WMO limits, and the standard deviation of the differences was 0.0036 and 0.0026 for 500 and 501 and 870 and 862 nm, respectively.
3.2 Linear trends
3.2.1 Trend comparison on synchronous data
In this section we present the Davos AOD trends and assess the trend differences between the trends of monthly AOD calculated from the mean and the median of the measurements and between CIMEL and PFRN27 for the 2007–2019 period. For this period the AOD in Davos declined regardless of the choice of instrument or averaging method. The CIMEL–PFRN27 trends derived from AOD monthly medians are −0.0129 and −0.0178 per decade for 500 and 501 nm, respectively, and −0.0048 and −0.0074 per decade for 870 and 862 nm, respectively. The magnitude of the trends per decade correspond to 23.45 % and 31.79 % of the mean AOD (0.055/0.056) for 500 and 501 nm, respectively and 19.20 % and 30.83 % (mean AOD 0.024) for 870 and 862 nm, respectively. Figure 5 shows the datasets with the corresponding linear fitting, and Table 5 includes the trends per decade and mean AOD values.
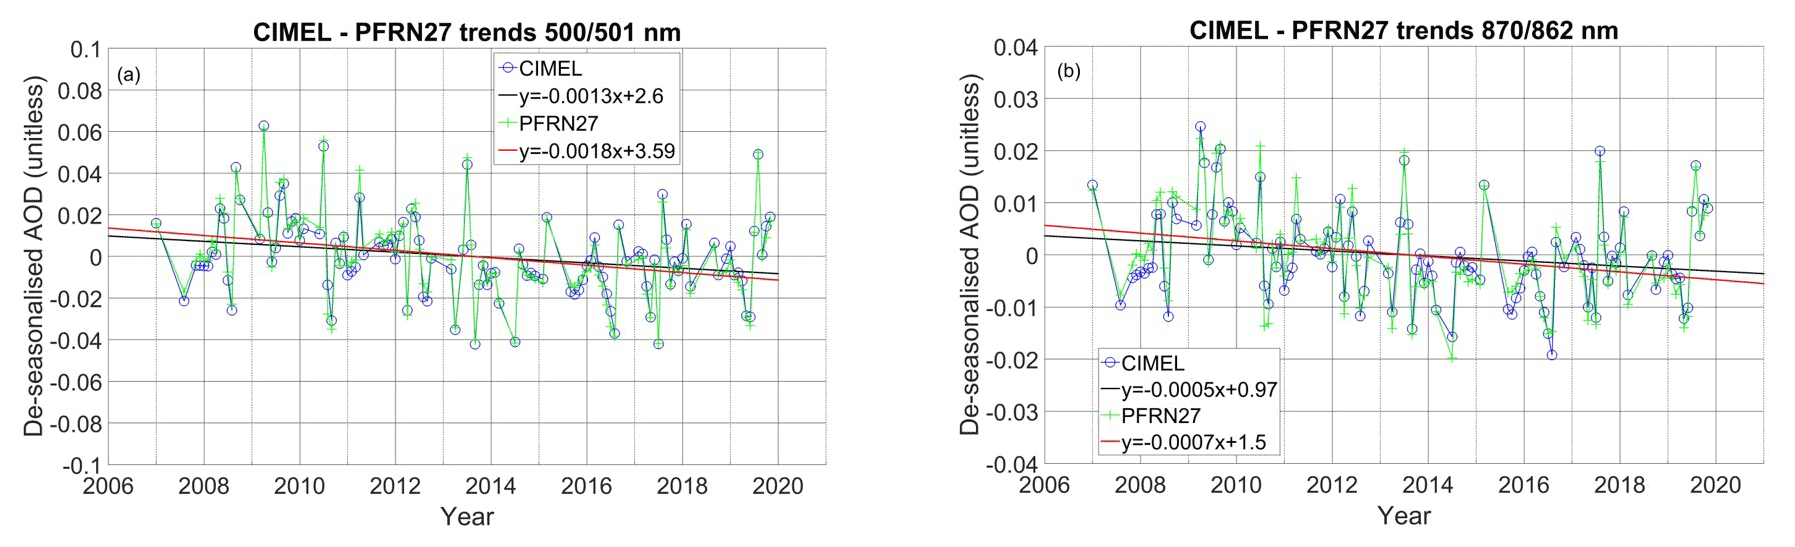
Figure 5Deseasonalized AOD monthly medians (described in Sect. 2.2.2) and linear fits at 500 and 501 (a) and 870 and 862 nm (b). The blue circles correspond to the CIMEL monthly data, and the green crosses correspond to the synchronous PFN27 data. The black line is the linear fit result of CIMEL data, and the red line is the linear fit result for PFRN27. The linear fit equations appear in the legends.
These AOD trends show a faster aerosol decline in comparison with previous studies about earlier periods. Specifically, in Ruckstuhl et al. (2008) there was a trend at 500 nm of −0.006 per decade for the period 1995–2005, but it was statistically insignificant. In Nyeki et al. (2012) the trend at 500 nm was positive (+0.002 per decade) with a mean AOD of 0.068 for the 1995–2010 period, but it was also not statistically significant.
Table 4Trends per decade calculated from monthly AOD means and medians for CIMEL and PFRN27 with their corresponding standard error and the p values from the Mann–Kendall modified test (Sect. 2.2.2).
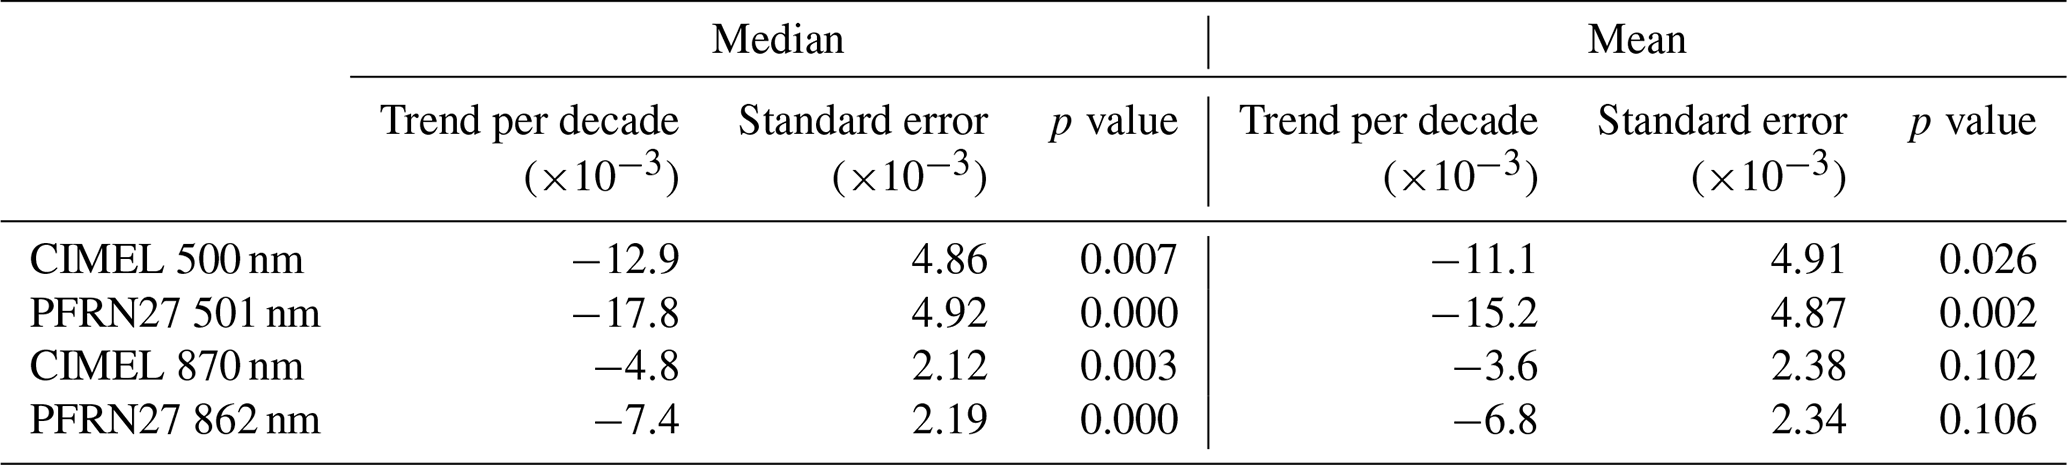
The method of averaging systematically affects the trend per decade value and its statistical significance. In all datasets, using the mean instead of the median results to a weaker trend, which is significant to a lower confidence level with the difference being up to approximately 10 %. However, the effect is limited since all trend differences are smaller than the trend standard error (Table 4).
Table 5CIMEL–PFRN27 trends per decade comparison for synchronous datasets. The Monte Carlo trend standard deviation corresponds to the trend uncertainty attributed to the instrument measurement uncertainty.

Concerning the CIMEL–PFR trend comparison (calculated using the median hereafter), both instruments show a decline in AOD, which is statistically significant at higher than 97 % confidence level. Trends and statistics for each dataset are presented in Table 5.
Despite the instruments' good agreement (Sect. 3.1) and the statistical significance of the individual trends, the linear trend differences are not smaller than the trend standard error on all occasions. Specifically, at 870 and 862 nm the trend difference of per decade is larger than the standard errors of the trends . At 500 and 501 nm the trends differ by per decade, while the standard error for the CIMEL trend is and the PFRN27 trend (Table 5).
Also, the trend differences cannot be explained by the measurement uncertainty. The effect of the measurement uncertainty calculated from the Monte Carlo simulations at 1σ (< ) is smaller than the trend differences (> ) and the trend standard error (> ) for all time series.
Table 6CIMEL–PFRN27 trends per decade comparison for synchronous datasets using only optical air masses above 3 and using all air masses for the common months.
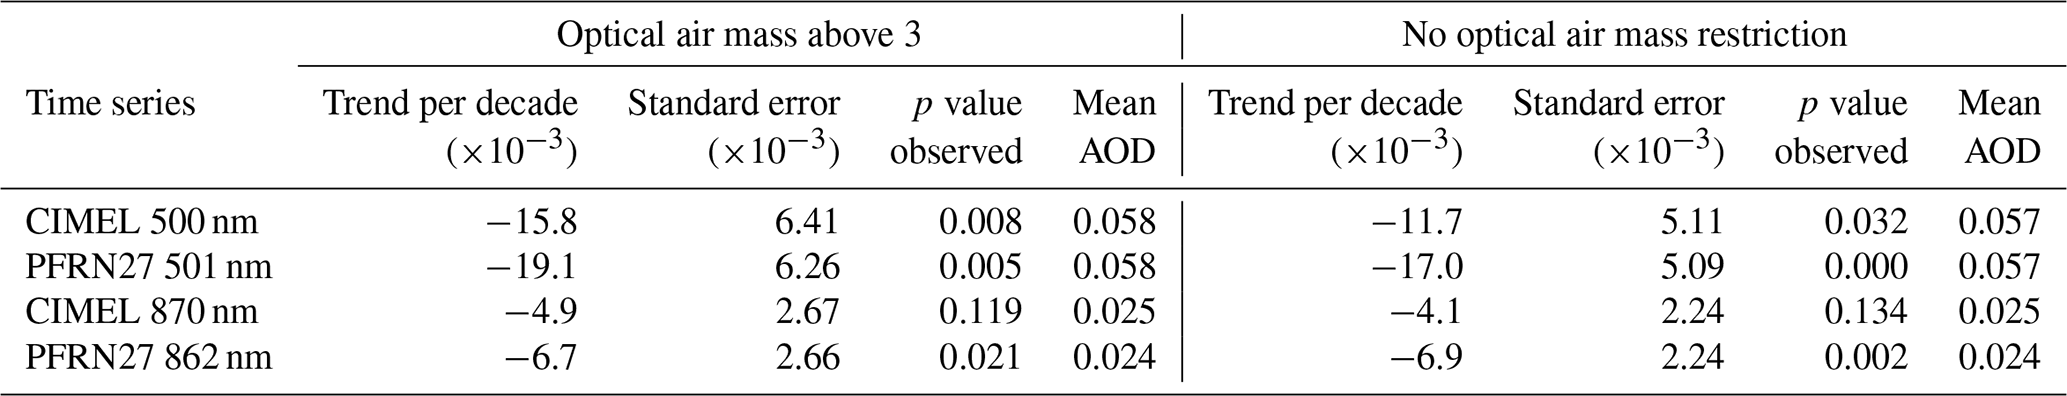
Based on the high air mass analysis (m>3) described in Sect. 3.1 we have calculated the trends for coincident PFR and CIMEL measurements. Because of the data reduction we removed some of the months used in the previous analysis creating additional data gaps. For m>3 the valid months are 98 instead of 114, which affects the trends. Therefore, we also re-calculated the trends shown in Table 5 (using all optical air masses) using only the 98 common months. The results of trend comparisons for all air masses and m>3 are in Table 6.
3.2.2 Measurement frequency impact on AOD linear trends
In this section we compare the trends of the two PFR datasets (synchronous with CIMEL (syn) and high frequency (hf)). All trends are negative and statistically significant at higher than 99.99 % confidence level (Table 7).
Table 7Trend comparison between low- (synchronous with CIMEL) and high-frequency of measurements datasets.
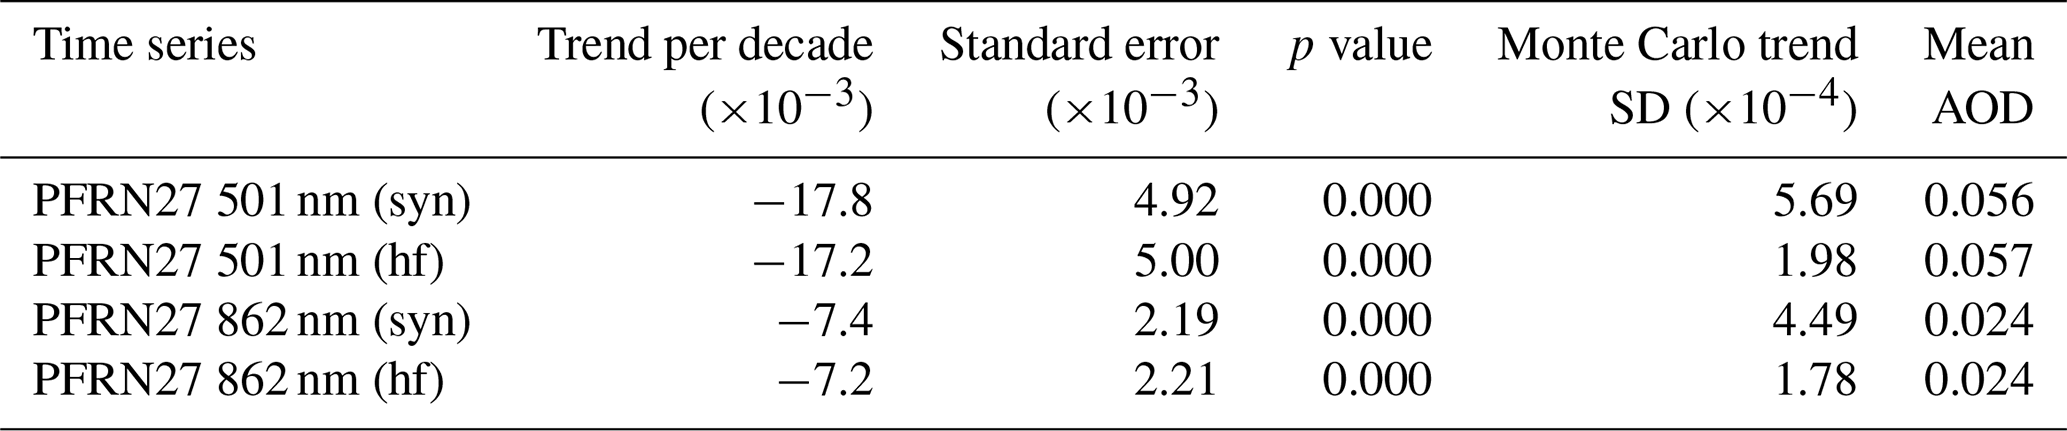
The trends in this case show better agreement than those of the previous section. The AOD trend differences due to different measurement frequencies are smaller than the trend differences between the CIMEL and PFR. In addition, they are approximately an order of magnitude smaller than the trend standard error at both channels (Table 7).
The measurement uncertainty cannot explain these trend differences at 501 nm. At 862 nm it can be explained by the effect of the measurement uncertainty of the temporally low-frequency dataset (PFRsyn). For this dataset the effect of the measurement uncertainty is larger due to the smaller number of measurements for each month.
3.3 Time-varying trends
3.3.1 Synchronous time series
The DLM-related analysis of trends for synchronous measurements appear in Fig. 6. In contrast to the linear trends, for both instruments and wavelengths the trends are neither stable through the years nor monotonic. They are negative for approximately the first 9 years and positive for the rest of the period. The fact that the DLM trends are negative for most of the period is in line with the observed negative trends of the linear fitting method. The DLM trend uncertainties range extent to both negative and positive values for most of the period showing a lack of significance for most months contradicting the very high confidence level of significance of linear trends.
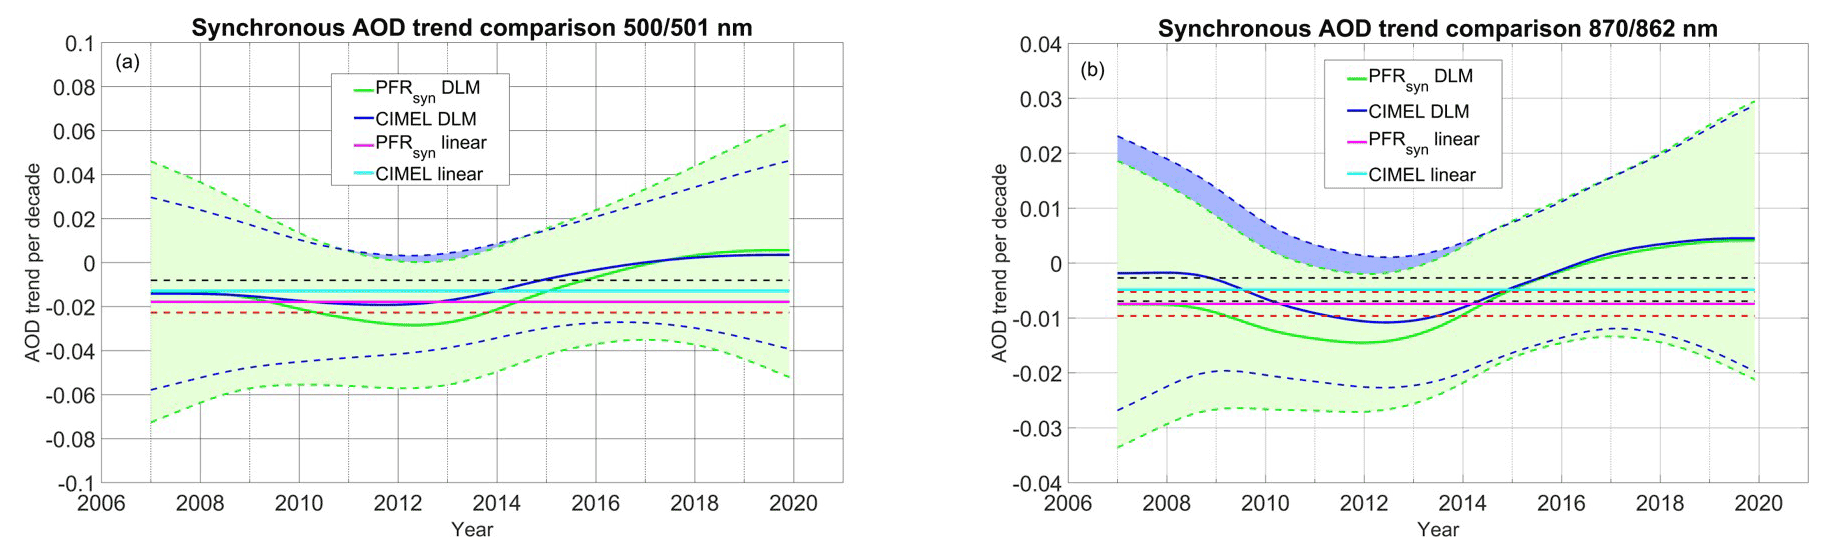
Figure 6CIMEL–PFRN27 DLM and linear trends for 500 and 501 (a) and 870 and 862 nm (b). The green line is the PFRN27 DLM trend and the blue line the CIMEL DLM trend. The shaded areas show their uncertainty. The magenta line shows the linear trend for PFRN27 and the cyan for CIMEL, while the dashed red and black lines are the linear trend standard errors.
The DLM trends show a better agreement between PFR and CIMEL compared to the linear trends, especially for the positive trend period. For both wavelengths the DLM trend differences between the instruments are clearly smaller than the trend uncertainties (1σ). In addition, the DLM trend comparison is consistent with the weaker linear trend of CIMEL compared to the PFR (Sect. 3.2.1). The DLM trends of CIMEL have lower absolute values for most of the years.
The linear trends are not fully consistent with the DLM trends. The DLM–linear trend differences for most years are larger than the linear trend standard error. On the contrary, the larger uncertainties calculated for the DLM trends through the MCMC method can explain all observed trend differences (Fig. 6).
3.3.2 Measurement frequency impact on AOD time-varying trends
The DLM trends for the two PFRN27 datasets (synchronous to CIMEL and high resolution) differ less than the CIMEL–PFRN27 trends, which is consistent with the linear trend comparison. Both trends are again well within the uncertainties, and their differences are even smaller than the CIMEL-PFRN27 DLM differences in both wavelengths (Fig. 7).
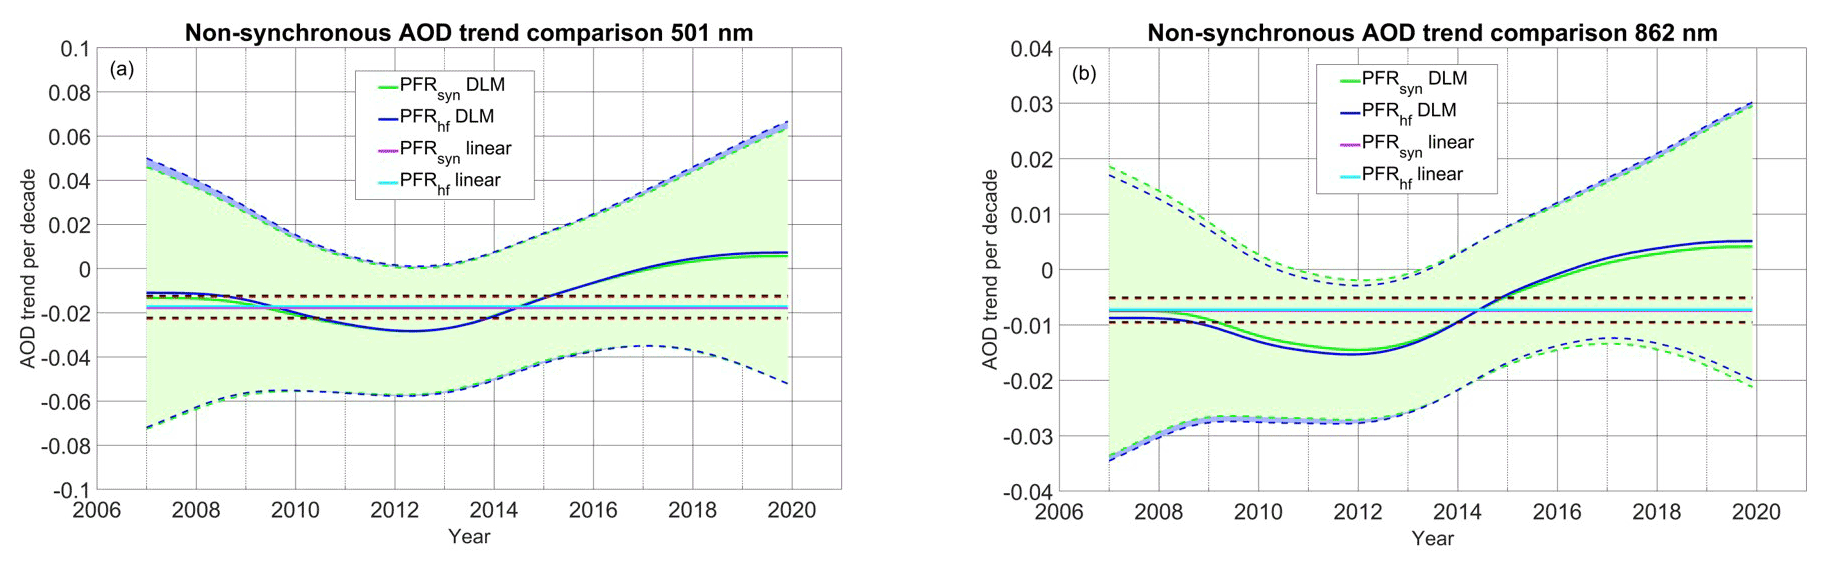
Figure 7PFRhf/PFRsyn DLM and linear trends for 501 (a) and 862 nm (b). The green line is the PFRsyn DLM trend, and the blue line is the PFRhf DLM trend. The shaded areas show their uncertainty. The magenta line shows the linear trend for PFRsyn, and the cyan line shows the linear trend for PFRhf, while the dashed red and black lines are the linear trend standard errors.
As was the case for the synchronous datasets, the linear trends differ with the DLM trends more than the linear trend standard error for most years. The DLM trend uncertainties again are larger than all trend differences.
In this study, we tried to take advantage of the 13-year period of AOD measurements from two different instruments belonging to two different networks at Davos, Switzerland. We compared the time series between two different instruments measuring AOD (CIMEL and PFRN27) for the period 2007–2019 regarding AOD measurement and trend differences in two channels (500 and 501 as well as 870 and 862 nm). The instruments have different technical characteristics, cloud-screening algorithms, and operational, calibration, and processing protocols. The cloud-screening algorithms agree for 93.8 % of the coincident measurements. The two instruments agree well on AOD measurements according to the WMO criteria (>95 % of synchronous AOD differences within the WMO limits) for synchronous measurements.
Because AOD does not follow a normal distribution, we compared the intra-annual cycles calculated by either mean monthly and median monthly values. We decided to use the medians as monthly AOD because the sensitivity of the median to outliers is lower, and we consider it a more representative parameter for our data.
The monthly median AOD values of the two instruments correlate well (R2>0.95), and most of their AOD monthly median values differ less than the monthly AOD uncertainty, showing a very good consistency in calibration and post-processing methods.
We performed a set of different trend analyses corresponding to the study's goals. Firstly, we compared least-squares linear regression (LSLR) trends using deseasonalized monthly means and deseasonalized monthly medians to investigate the sensitivity of trends on the method of averaging. The selection of the averaging method affected the trends to an extent within the limits of the standard error. The selection of medians instead of means increased the trend significance confidence level for up to approximately 10 %. Only the monthly medians were used for the rest of the trend comparisons.
The LSLR trends in this study are higher compared to previous studies regardless of the instrument selection, showing that there was an aerosol load decline in Davos mainly after the mid-2000s. The LSLR trends of CIMEL and PFR instruments under synchronous data are negative and statistically significant at >97 % confidence. However, their trend differences are large enough to equal or exceed the trend standard error. Another source of trend uncertainty is the measurement uncertainty. Using the Monte Carlo method to quantify the trend uncertainties due to a measurement uncertainty of 0.01, it is evident that the differences cannot be explained by this uncertainty despite the small AOD in Davos (mean AOD 0.057 at 501 nm and 0.024 at 862 nm).
In order to minimize the calibration uncertainty effects and reduce the AOD differences of the two different instruments, we also compared their trends produced only from data with an optical air mass above 3. The selection is based on the fact that the AOD uncertainty reduces for higher air masses. The trend agreement was improved as all trend differences are within the trend standard error.
The impact of measurement frequency on trends was explainable by the trend standard error and was found to be smaller than the overall impact of the other instrument differences for the period 2007–2019. Our results suggest that the measurement frequency differences between PFR and CIMEL do not affect the AOD trends significantly. However, different AOD absolute values and variability compared to the ones in Davos could enhance the impact of measurement frequency on AOD trends. The effect can be also dependent on cloud-screening algorithm differences. In our case the lower-frequency dataset was filtered with both GAW-PFR and AERONET cloud algorithms, while the high-frequency dataset only used the GAW-PFR algorithm. However, the two algorithms showed an agreement of 93.8 %, with this difference having very low effect on AOD (less than 0.002 and 0.0005 for 501 and 862 nm). In addition, the mean AOD for the high-frequency PFR dataset is only 0.001 higher than the mean AOD of the low-frequency PFR dataset at 501 nm and 0.000 at 862 nm, pointing to the short-term variability of AOD as a main source of any monthly AOD differences caused by different measurement frequencies.
Finally, we used dynamic linear modelling (DLM) to estimate time-varying trends. In this case, the trend comparison between CIMEL and PFR is improved as all trend differences are smaller than the trend uncertainties. On the other hand, the comparison between linear and DLM trends shows some important differences. The LSLR trends for the period 2007–2019 are not consistent with the DLM trends for the whole time period since the latter are not monotonic. They are negative for the 2007–2016 period, followed by a short positive trend period. The LSLR trend quantification cannot explain this inconsistency, whereas it is explained by the DLM uncertainties. Another inconsistency is the high statistical significance of the LSLR trend that is not shown in the DLM trends.
The results of the paper cannot be used for every location and every instrument comparison but point to the fact that when calculating AOD trends a number of important factors including calibration coherency in time, post-processing and cloud elimination algorithm uncertainties, measurement frequency, and even methods of AOD averaging or trend estimation should be carefully considered.
The dynamic linear model code package is available from https://github.com/mjlaine/dlm.git (Laine, 2022).
The CIMEL AOD data are available from https://aeronet.gsfc.nasa.gov/cgi-bin/webtool_aod_v3?stage=3®ion=Europe&state=Switzerland&site=Davos&place_code=10&if_polarized=0 (Wehrli et al., 2022). The PFR AOD data are available through communication with the authors.
AK analysed the data and wrote the paper with contributions from the co-authors. AK and SK conceptualized the study. NK, SK and JG contributed to the sun photometer data provision. JG proposed and provided assistance with the DLM trend analysis. LE provided assistance with the Monte Carlo simulations. All authors were involved in the interpretation of the results and reviewing and editing the paper.
The contact author has declared that none of the authors has any competing interests.
Publisher's note: Copernicus Publications remains neutral with regard to jurisdictional claims in published maps and institutional affiliations.
This work has been performed under the European Metrology Programme for Innovation and Research (EMPIR) within the joint research project EMPIR MAPP: “Metrology for aerosol optical properties”. The EMPIR is jointly funded by the EMPIR participating countries within EURAMET and the European Union. Stelios Kazadzis acknowledges ACTRIS-CH (Aerosol, Clouds and Trace Gases Research Infrastructure – Swiss contribution) funded by the State Secretariat for Education, Research, and Innovation, Switzerland.
This research has been supported by the European Metrology Programme for Innovation and Research (grant no. 19ENV04 MAPP).
This paper was edited by Piet Stammes and reviewed by two anonymous referees.
Andrew, C.: Forecasting, structural time series models and the Kalman filter, First paperback edition, Cambridge University Press, ISBN 0521405734, 1990.
Bais, A. F., Lucas, R. M., Bornman, J. F., Williamson, C. E., Sulzberger, B., Austin, A. T., Wilson, S. R., Andrady, A. L., Bernhard, G., McKenzie, R. L., Aucamp, P. J., Madronich, S., Neale, R. E., Yazar, S., Young, A. R., de Gruijl, F. R., Norval, M., Takizawa, Y., Barnes, P. W., Robson, T. M., Robinson, S. A., Ballaré, C. L., Flint, S. D., Neale, P. J., Hylander, S., Rose, K. C., Wängberg, S.-Å., Häder, D.-P., Worrest, R. C., Zepp, R. G., Paul, N. D., Cory, R. M., Solomon, K. R., Longstreth, J., Pandey, K. K., Redhwi, H. H., Torikai, A., and Heikkilä, A. M.: Environmental effects of ozone depletion, UV radiation and interactions with climate change: UNEP Environmental Effects Assessment Panel, update 2017, Photochem. Photobio. S., 17, 127–179, https://doi.org/10.1039/c7pp90043k, 2018.
Bashiri, M. and Moslemi, A.: The analysis of residuals variation and outliers to obtain robust response surface, Journal of Industrial Engineering International, 9, 1695–1702, https://doi.org/10.1186/2251-712x-9-2, 2013.
Benedetti, A., Reid, J. S., Knippertz, P., Marsham, J. H., Di Giuseppe, F., Rémy, S., Basart, S., Boucher, O., Brooks, I. M., Menut, L., Mona, L., Laj, P., Pappalardo, G., Wiedensohler, A., Baklanov, A., Brooks, M., Colarco, P. R., Cuevas, E., da Silva, A., Escribano, J., Flemming, J., Huneeus, N., Jorba, O., Kazadzis, S., Kinne, S., Popp, T., Quinn, P. K., Sekiyama, T. T., Tanaka, T., and Terradellas, E.: Status and future of numerical atmospheric aerosol prediction with a focus on data requirements, Atmos. Chem. Phys., 18, 10615–10643, https://doi.org/10.5194/acp-18-10615-2018, 2018.
Cherian, R. and Quaas, J.: Trends in AOD, Clouds, and Cloud Radiative Effects in Satellite Data and CMIP5 and CMIP6 Model Simulations Over Aerosol Source Regions, Geophys. Res. Lett., 47, e2020GL087132, https://doi.org/10.1029/2020gl087132, 2020.
Cuevas, E., Romero-Campos, P. M., Kouremeti, N., Kazadzis, S., Räisänen, P., García, R. D., Barreto, A., Guirado-Fuentes, C., Ramos, R., Toledano, C., Almansa, F., and Gröbner, J.: Aerosol optical depth comparison between GAW-PFR and AERONET-Cimel radiometers from long-term (2005–2015) 1 min synchronous measurements, Atmos. Meas. Tech., 12, 4309–4337, https://doi.org/10.5194/amt-12-4309-2019, 2019.
Eck, T. F., Holben, B. N., Reid, J. S., Dubovik, O., Smirnov, A., O'Neill, N. T., Slutsker, I., and Kinne, S.: Wavelength dependence of the optical depth of biomass burning, urban, and desert dust aerosols, J. Geophys. Res.-Atmos., 104, 31333–31349, https://doi.org/10.1029/1999JD900923, 1999.
Edreira, J. I. R., Mourtzinis, S., Azzari, G., Andrade, J. F., Conley, S. P., Lobell, D., Specht, J. E., and Grassini, P.: From sunlight to seed: Assessing limits to solar radiation capture and conversion in agro-ecosystems, Agr. Forest Meteorol., 280, 107775, https://doi.org/10.1016/j.agrformet.2019.107775, 2020.
Estellés, V., Campanelli, M., Smyth, T. J., Utrillas, M. P., and Martínez-Lozano, J. A.: Evaluation of the new ESR network software for the retrieval of direct sun products from CIMEL CE318 and PREDE POM01 sun-sky radiometers, Atmos. Chem. Phys., 12, 11619–11630, https://doi.org/10.5194/acp-12-11619-2012, 2012.
Fan, J., Wang, Y., Rosenfeld, D., and Liu, X.: Review of Aerosol–Cloud Interactions: Mechanisms, Significance, and Challenges, J. Atmos. Sci., 73, 4221–4252, https://doi.org/10.1175/jas-d-16-0037.1, 2016.
Fountoulakis, I., Kosmopoulos, P., Papachristopoulou, K., Raptis, I.-P., Mamouri, R.-E., Nisantzi, A., Gkikas, A., Witthuhn, J., Bley, S., Moustaka, A., Buehl, J., Seifert, P., Hadjimitsis, D. G., Kontoes, C., and Kazadzis, S.: Effects of Aerosols and Clouds on the Levels of Surface Solar Radiation and Solar Energy in Cyprus, Remote Sens.-Basel, 13, 2319, https://doi.org/10.3390/rs13122319, 2021.
Gamerman, D. and Lopes, H. F.: Markov Chain Monte Carlo: Stochastic Simulation for Bayesian Inference, 2nd edn., Taylor & Francis, https://doi.org/10.1201/9781482296426, 2006.
Giles, D. M., Sinyuk, A., Sorokin, M. G., Schafer, J. S., Smirnov, A., Slutsker, I., Eck, T. F., Holben, B. N., Lewis, J. R., Campbell, J. R., Welton, E. J., Korkin, S. V., and Lyapustin, A. I.: Advancements in the Aerosol Robotic Network (AERONET) Version 3 database – automated near-real-time quality control algorithm with improved cloud screening for Sun photometer aerosol optical depth (AOD) measurements, Atmos. Meas. Tech., 12, 169–209, https://doi.org/10.5194/amt-12-169-2019, 2019.
Ginoux, P., Prospero, J. M., Gill, T. E., Hsu, N. C., and Zhao, M.: Global-scale attribution of anthropogenic and natural dust sources and their emission rates based on MODIS Deep Blue aerosol products, Rev. Geophys., 50, RG3005, https://doi.org/10.1029/2012rg000388, 2012.
Gkikas, A., Proestakis, E., Amiridis, V., Kazadzis, S., Di Tomaso, E., Marinou, E., Hatzianastassiou, N., Kok, J. F., and García-Pando, C. P.: Quantification of the dust optical depth across spatiotemporal scales with the MIDAS global dataset (2003–2017), Atmos. Chem. Phys., 22, 3553–3578, https://doi.org/10.5194/acp-22-3553-2022, 2022.
Glotfelty, T., Alapaty, K., He, J., Hawbecker, P., Song, X., and Zhang, G.: The Weather Research and Forecasting Model with Aerosol-Cloud Interactions (WRF-ACI): Development, Evaluation, and Initial Application, Mon. Weather Rev., 147, 1491–1511, https://doi.org/10.1175/MWR-D-18-0267.1, 2019.
Gregory, L.: Cimel Sunphotometer (CSPHOT) Handbook, Technical Report, Office of Scientific and Technical Information (OSTI), https://doi.org/10.2172/1020262, 2011.
Greilinger, M. and Kasper-Giebl, A.: Saharan Dust Records and Its Impact in the European Alps, in: Oxford Research Encyclopedia of Climate Science, Oxford University Press, https://doi.org/10.1093/acrefore/9780190228620.013.827, 2021.
Guo, J.-P., Zhang, X.-Y., Wu, Y.-R., Zhaxi, Y., Che, H.-Z., La, B., Wang, W., and Li, X.-W.: Spatio-temporal variation trends of satellite-based aerosol optical depth in China during 1980–2008, Atmos. Environ., 45, 6802–6811, https://doi.org/10.1016/j.atmosenv.2011.03.068, 2011.
Hamed, K. H. and Ramachandra Rao, A.: A modified Mann-Kendall trend test for autocorrelated data, J. Hydrol., 204, 182–196, https://doi.org/10.1016/s0022-1694(97)00125-x, 1998.
Holben, B. N., Eck, T. F., Slutsker, I., Tanré, D., Buis, J. P., Setzer, A., Vermote, E., Reagan, J. A., Kaufman, Y. J., Nakajima, T., Lavenu, F., Jankowiak, I., and Smirnov, A.: AERONET – A Federated Instrument Network and Data Archive for Aerosol Characterization, Remote Sens. Environ., 66, 1–16, https://doi.org/10.1016/s0034-4257(98)00031-5, 1998.
Horneck, G.: Quantification of the biological effectiveness of environmental UV radiation, J. Photoch. Photobio. B, 31, 43–49, https://doi.org/10.1016/1011-1344(95)07167-3, 1995.
Hou, X., Wild, M., Folini, D., Kazadzis, S., and Wohland, J.: Climate change impacts on solar power generation and its spatial variability in Europe based on CMIP6, Earth Syst. Dynam., 12, 1099–1113, https://doi.org/10.5194/esd-12-1099-2021, 2021.
Huang, X. and Ding, A.: Aerosol as a critical factor causing forecast biases of air temperature in global numerical weather prediction models, Sci. Bull., 66, 1917–1924, https://doi.org/10.1016/j.scib.2021.05.009, 2021.
IPCC: Climate Change 2021: The Physical Science Basis. Contribution of Working Group I to the Sixth Assessment Report of the Intergovernmental Panel on Climate Change, edited by: Masson-Delmotte, V., Zhai, P., Pirani, A., Connors, S. L., Péan, C., Berger, S., Caud, N., Chen, Y., Goldfarb, L., Gomis, M. I., Huang, M., Leitzell, K., Lonnoy, E., Matthews, J. B. R., Maycock, T. K., Waterfield, T., Yelekçi, O., Yu, R., and Zhou, B., Cambridge University Press, Cambridge, United Kingdom and New York, NY, USA, 2391 pp. https://doi.org/10.1017/9781009157896, 2021.
Kazadzis, S., Kouremeti, N., Diémoz, H., Gröbner, J., Forgan, B. W., Campanelli, M., Estellés, V., Lantz, K., Michalsky, J., Carlund, T., Cuevas, E., Toledano, C., Becker, R., Nyeki, S., Kosmopoulos, P. G., Tatsiankou, V., Vuilleumier, L., Denn, F. M., Ohkawara, N., Ijima, O., Goloub, P., Raptis, P. I., Milner, M., Behrens, K., Barreto, A., Martucci, G., Hall, E., Wendell, J., Fabbri, B. E., and Wehrli, C.: Results from the Fourth WMO Filter Radiometer Comparison for aerosol optical depth measurements, Atmos. Chem. Phys., 18, 3185–3201, https://doi.org/10.5194/acp-18-3185-2018, 2018a.
Kazadzis, S., Kouremeti, N., Nyeki, S., Gröbner, J., and Wehrli, C.: The World Optical Depth Research and Calibration Center (WORCC) quality assurance and quality control of GAW-PFR AOD measurements, Geosci. Instrum. Method. Data Syst., 7, 39–53, https://doi.org/10.5194/gi-7-39-2018, 2018b.
Kazadzis, S., Kouremeti, N., and Gröbner, J.: The Global Atmosphere Watch Precision Filter Radiometer (GAW-PFR) Network for Aerosol Optical Depth long term measurement, Final Report, Bundesamt für Meteorologie und Klimatologie MeteoSchweiz, 2020.
Kim, S.-W., Yoon, S.-C., Dutton, E. G., Kim, J., Wehrli, C., and Holben, B. N.: Global Surface-Based Sun Photometer Network for Long-Term Observations of Column Aerosol Optical Properties: Intercomparison of Aerosol Optical Depth, Aerosol Sci. Tech., 42, 1–9, https://doi.org/10.1080/02786820701699743, 2008.
Kotrike, T., Pratap, D., and Keesara, V. R.: Validation and Trend Analysis of Satellite-Based AOD Data over Southern India, Aerosol Science and Engineering, 5, 32–43, https://doi.org/10.1007/s41810-020-00082-2, 2021.
Kumar, K. R., Sivakumar, V., Reddy, R. R., Gopal, K. R., and Adesina, A. J.: Inferring wavelength dependence of AOD and Ångström exponent over a sub-tropical station in South Africa using AERONET data: Influence of meteorology, long-range transport and curvature effect, Sci. Total Environ., 461–462, 397–408, https://doi.org/10.1016/j.scitotenv.2013.04.095, 2013.
Laine, M.: DLM Matlab Toolbox, GitHub [code], https://github.com/mjlaine/dlm.git, last access: 5 October 2022.
Laine, M., Latva-Pukkila, N., and Kyrölä, E.: Analysing time-varying trends in stratospheric ozone time series using the state space approach, Atmos. Chem. Phys., 14, 9707–9725, https://doi.org/10.5194/acp-14-9707-2014, 2014.
Lei, Y., Zhang, Q., He, K. B., and Streets, D. G.: Primary anthropogenic aerosol emission trends for China, 1990–2005, Atmos. Chem. Phys., 11, 931–954, https://doi.org/10.5194/acp-11-931-2011, 2011.
Levy, R. C., Leptoukh, G. G., Kahn, R., Zubko, V., Gopalan, A., and Remer, L. A.: A Critical Look at Deriving Monthly Aerosol Optical Depth From Satellite Data, IEEE T. Geosci. Remote, 47, 2942–2956, https://doi.org/10.1109/tgrs.2009.2013842, 2009.
Li, J., Carlson, B. E., Dubovik, O., and Lacis, A. A.: Recent trends in aerosol optical properties derived from AERONET measurements, Atmos. Chem. Phys., 14, 12271–12289, https://doi.org/10.5194/acp-14-12271-2014, 2014.
Logothetis, S.-A., Salamalikis, V., Gkikas, A., Kazadzis, S., Amiridis, V., and Kazantzidis, A.: 15 year variability of desert dust optical depth on global and regional scales, Atmos. Chem. Phys., 21, 16499–16529, https://doi.org/10.5194/acp-21-16499-2021, 2021.
Ma, Y., Li, Z., Li, Z., Xie, Y., Fu, Q., Li, D., Zhang, Y., Xu, H., and Li, K.: Validation of MODIS Aerosol Optical Depth Retrieval over Mountains in Central China Based on a Sun-Sky Radiometer Site of SONET, Remote Sens.-Basel, 8, 111, https://doi.org/10.3390/rs8020111, 2016.
Metropolis, N. and Ulam, S.: The Monte Carlo Method, J. Am. Stat. Assoc., 44, 335–341, https://doi.org/10.1080/01621459.1949.10483310, 1949.
Mortier, A., Gliß, J., Schulz, M., Aas, W., Andrews, E., Bian, H., Chin, M., Ginoux, P., Hand, J., Holben, B., Zhang, H., Kipling, Z., Kirkevåg, A., Laj, P., Lurton, T., Myhre, G., Neubauer, D., Olivié, D., von Salzen, K., Skeie, R. B., Takemura, T., and Tilmes, S.: Evaluation of climate model aerosol trends with ground-based observations over the last 2 decades – an AeroCom and CMIP6 analysis, Atmos. Chem. Phys., 20, 13355–13378, https://doi.org/10.5194/acp-20-13355-2020, 2020.
Myers, D. R.: Solar radiation modeling and measurements for renewable energy applications: data and model quality, Energy, 30, 1517–1531, https://doi.org/10.1016/j.energy.2004.04.034, 2005.
Nakajima, T., Campanelli, M., Che, H., Estellés, V., Irie, H., Kim, S.-W., Kim, J., Liu, D., Nishizawa, T., Pandithurai, G., Soni, V. K., Thana, B., Tugjsurn, N.-U., Aoki, K., Go, S., Hashimoto, M., Higurashi, A., Kazadzis, S., Khatri, P., Kouremeti, N., Kudo, R., Marenco, F., Momoi, M., Ningombam, S. S., Ryder, C. L., Uchiyama, A., and Yamazaki, A.: An overview of and issues with sky radiometer technology and SKYNET, Atmos. Meas. Tech., 13, 4195–4218, https://doi.org/10.5194/amt-13-4195-2020, 2020.
Ningombam, S. S., Larson, E. J. L., Dumka, U. C., Estellés, V., Campanelli, M., and Steve, C.: Long-term (1995–2018) aerosol optical depth derived using ground based AERONET and SKYNET measurements from aerosol aged-background sites, Atmos. Pollut. Res., 10, 608–620, https://doi.org/10.1016/j.apr.2018.10.008, 2019.
Nyeki, S., Halios, C. H., Baum, W., Eleftheriadis, K., Flentje, H., Gröbner, J., Vuilleumier, L., and Wehrli, C.: Ground-based aerosol optical depth trends at three high-altitude sites in Switzerland and southern Germany from 1995 to 2010, Geophys. Res.-Atmos., 117, D18202, https://doi.org/10.1029/2012jd017493, 2012.
Ogunjobi, K. O. and Awoleye, P. O.: Intercomparison and Validation of Satellite and Ground-Based Aerosol Optical Depth (AOD) Retrievals over Six AERONET Sites in West Africa, Aerosol Science and Engineering, 3, 32–47, https://doi.org/10.1007/s41810-019-00040-7, 2019.
O'Neil N. T., Ignatov, A., Holben, B. N., and Eck, T. F.: The lognormal distribution as a reference for reporting aerosol optical depth statistics; Empirical tests using multi-year, multi-site AERONET Sunphotometer data, Geophys. Res. Lett., 27, 3333–3336, https://doi.org/10.1029/2000gl011581, 2000.
Paul, N. D. and Gwynn-Jones, D.: Ecological roles of solar UV radiation: towards an integrated approach, Trends Ecol. Evol., 18, 48–55, https://doi.org/10.1016/s0169-5347(02)00014-9, 2003.
Petris, G., Petrone, S., and Campagnoli, P.: Dynamic linear models with R, Springer, 31–84, https://doi.org/10.1007/b135794_2, 2009.
Reddington, C. L., Spracklen, D. V., Artaxo, P., Ridley, D. A., Rizzo, L. V., and Arana, A.: Analysis of particulate emissions from tropical biomass burning using a global aerosol model and long-term surface observations, Atmos. Chem. Phys., 16, 11083–11106, https://doi.org/10.5194/acp-16-11083-2016, 2016.
Rosenfeld, D., Sherwood, S., Wood, R., and Donner, L.: Climate Effects of Aerosol-Cloud Interactions, Science, 343, 379–380, https://doi.org/10.1126/science.1247490, 2014.
Ruckstuhl, C., Philipona, R., Behrens, K., Collaud Coen, M., Dürr, B., Heimo, A., Mätzler, C., Nyeki, S., Ohmura, A., Vuilleumier, L., Weller, M., Wehrli, C., and Zelenka, A.: Aerosol and cloud effects on solar brightening and the recent rapid warming, Geophys. Res. Lett., 35, L12708, https://doi.org/10.1029/2008gl034228, 2008.
Sayer, A. M. and Knobelspiesse, K. D.: How should we aggregate data? Methods accounting for the numerical distributions, with an assessment of aerosol optical depth, Atmos. Chem. Phys., 19, 15023–15048, https://doi.org/10.5194/acp-19-15023-2019, 2019.
Shaw, G. E., Reagan, J. A., and Herman, B. M.: Investigations of Atmospheric Extinction Using Direct Solar Radiation Measurements Made with a Multiple Wavelength Radiometer, J. Appl. Meteorol. Clim., 12, 374–380, https://doi.org/10.1175/1520-0450(1973)012<0374:ioaeud>2.0.co;2, 1973.
Streets, D. G., Yan, F., Chin, M., Diehl, T., Mahowald, N., Schultz, M., Wild, M., Wu, Y., and Yu, C.: Anthropogenic and natural contributions to regional trends in aerosol optical depth, 1980–2006, J. Geophys. Res., 114, D00D18, https://doi.org/10.1029/2008jd011624, 2009.
Toledano, C., González, R., Fuertes, D., Cuevas, E., Eck, T. F., Kazadzis, S., Kouremeti, N., Gröbner, J., Goloub, P., Blarel, L., Román, R., Barreto, Á., Berjón, A., Holben, B. N., and Cachorro, V. E.: Assessment of Sun photometer Langley calibration at the high-elevation sites Mauna Loa and Izaña, Atmos. Chem. Phys., 18, 14555–14567, https://doi.org/10.5194/acp-18-14555-2018, 2018.
Vernier, J.-P., Thomason, L. W., Pommereau, J.-P., Bourassa, A., Pelon, J., Garnier, A., Hauchecorne, A., Blanot, L., Trepte, C., Degenstein, D., and Vargas, F.: Major influence of tropical volcanic eruptions on the stratospheric aerosol layer during the last decade, Geophys. Res. Lett., 38, L12807, https://doi.org/10.1029/2011gl047563, 2011.
Wehrli, C.: Calibrations of filter radiometers for determination of atmospheric optical depth, Metrologia, 37, 419–422, https://doi.org/10.1088/0026-1394/37/5/16, 2000.
Wehrli, C., Kouremeti, N., and International AERONET Federation: Davos Aerosol Optical Depth (AOD) with Precipitable Water and Angstrom Parameter level 2.0 Version 3 Direct Sun Algorithm, Goddard space flight centre, NASA [data set], https://aeronet.gsfc.nasa.gov/cgi-bin/webtool_aod_v3?stage=3®ion=Europe&state=Switzerland&site=Davos&place_code=10&if_polarized=0, last access: 23 September 2022.
Wei, J., Li, Z., Peng, Y., and Sun, L.: MODIS Collection 6.1 aerosol optical depth products over land and ocean: validation and comparison, Atmos. Environ., 201, 428–440, https://doi.org/10.1016/j.atmosenv.2018.12.004, 2019.
Wetzel, R. G.: Solar radiation as an ecosystem modulator, in: UV Effects in Aquatic Organisms and Ecosystems, European Society of Photobiology Cambridge, 3–18, https://doi.org/10.1039/9781847552266-00003, 2003.
Wild, M.: Enlightening Global Dimming and Brightening, B. Am. Meteorol. Soc., 93, 27–37, https://doi.org/10.1175/bams-d-11-00074.1, 2012.
Wild, M., Wacker, S., Yang, S., and Sanchez-Lorenzo, A.: Evidence for Clear-Sky Dimming and Brightening in Central Europe, Geophys. Res. Lett., 48, e2020GL092216, https://doi.org/10.1029/2020gl092216, 2021.
WMO: Aerosol measurement procedures, guidelines and recommendations, GAWReport 153, WMO/TD-No 1178, https://library.wmo.int/opac/index.php?lvl=notice_display&id=11085#.WpqIOOdG1PY (last access: 4 October 2022), 2003.
WMO/GAW: Experts workshop on a global surface-based network for long term observations of column aerosol optical properties, Davos 2004, GAW Report 162, WMO/TD-No 1287, edited by: Baltensperger, U., Barries, L., and Wehrli, C., https://library.wmo.int/opac/index.php?lvl=notice_display&id=11094{#}.WpqIledG1PY (last access: 4 October 2022), 2005.
Xie, Y., Zhang, Y., Xiong, X., Qu, J. J., and Che, H.: Validation of MODIS aerosol optical depth product over China using CARSNET measurements, Atmos. Environ., 45, 5970–5978, https://doi.org/10.1016/j.atmosenv.2011.08.002, 2011.
Zhao, B., Jiang, J. H., Gu, Y., Diner, D., Worden, J., Liou, K.-N., Su, H., Xing, J., Garay, M., and Huang, L.: Decadal-scale trends in regional aerosol particle properties and their linkage to emission changes, Environ. Res. Lett., 12, 054021, https://doi.org/10.1088/1748-9326/aa6cb2, 2017.