the Creative Commons Attribution 4.0 License.
the Creative Commons Attribution 4.0 License.
 | 20 Oct 2022
Evaluation of the New York State Mesonet Profiler Network data
Bhupal Shrestha
Jerald A. Brotzge
Junhong Wang
The New York State Mesonet (NYSM) Profiler Network consists of 17 stations statewide. Each station operates a ground-based Doppler lidar (DL), a microwave radiometer (MWR), and an environmental Sky Imaging Radiometer (eSIR) that collectively provide profiles of wind speed and direction, aerosol, temperature, and humidity along with solar radiance, optical depth parameters, and fisheye sky images. This study presents a multi-year, multi-station evaluation of Profiler Network data to determine the robustness and accuracies of the instruments deployed with respect to well-defined measurements. The wind speed (WS) measured by the DL and temperature (T) and water vapor density (WVD) measured by the MWR at three NYSM Profiler Network sites are compared to nearby National Weather Service radiosonde (RS) data, while the aerosol optical depth (AOD) measured by the eSIR at two Profiler Network sites are compared to nearby in situ measurements from the Aerosol Robotic Network (AERONET). The overall comparison results show agreement between the DL or MWR and RS data with a correlation of R2≥0.89 and a correlation between AERONET and eSIR AOD data of R2 ≥ 0.78. The WS biases are statistically insignificant and equal to 0 (p > 0.05) within 3 km, whereas T and WVD biases are statistically significant and are below 5.5 ∘C and 1.0 g m−3, within 10 km. The AOD biases are also found to be statistically significant and are within 0.02. The performance of the DL, MWR, and eSIR are consistent across sites with similar error statistics. When compared during three different weather conditions, the MWR is found to have varying performance, with T errors higher during clear-sky days, while WVD errors are higher during cloudy and precipitation days. To correct such observed biases, a linear regression method was developed and applied to the MWR data. In addition, wind shear from the DL and 14 common thermodynamic parameters derived from the MWR show an agreement with RS values where correlation is mostly R2 ≥ 0.70 and biases are mostly statistically insignificant. A case study is presented to demonstrate the applicability of DL and MWR for nowcasting a severe weather event. Overall, this study demonstrates the robustness and value of the Profiler Network for real-time weather operations.
- Article
(25470 KB) - Full-text XML
-
Supplement
(1114 KB) - BibTeX
- EndNote


The vertical profiles of wind, aerosol, temperature, and humidity are critical in understanding atmospheric exchange (physical and chemical) processes. Turbulence, friction, dispersion, vertical mixing, and transport lead to the exchange of heat, momentum and mass concentration ultimately affecting weather and air quality. Upper-atmospheric data with high spatial and temporal resolutions are critical for operational meteorologists to assess and predict the atmospheric state. Various studies have shown the value of such data for improving nowcasting, short-range weather forecasting, and aviation services (Strauch et al., 1984; Wilczak et al., 1996; Shun and Chan, 2008; Chan and Hon, 2011; Madhulatha et al., 2013; Oude Nijhuis et al., 2018). Furthermore, the finer the temporal resolution of such data, the better the nowcasting of short-lived convective events (Feltz and Mecikalski, 2002; Hu et al., 2019). As a result, forecasting centers are ingesting high-resolution atmospheric profile data from the lower troposphere in real time to provide more accurate forecasts of hazardous weather and air quality (Illingworth et al., 2019). However, there is a noted gap in observations within the boundary layer at high spatial and temporal resolutions (Wagner et al., 2019; Hu et al., 2019).
Recent advances in ground-based remote sensing profiling technology have spurred a plethora of new, large-scale deployments of lidars, microwave radiometers, sodars, and ceilometers, such as the Sodar Network (Granberg et al., 2009), DWD Ceilometer Network (Thomas, 2017), Helsinki Testbed (Koskinen et al., 2011), E-PROFILE Network (Illingworth et al., 2019), and Unified Ceilometer Network (Delgado et al., 2020). These systems provide a ready means for monitoring atmospheric profiles at high temporal and spatial resolutions and under various weather conditions. Dense ground-based profiling networks have several advantages over the radiosonde (RS) network and satellite observations. Most global RS stations launch RS only twice daily (00:00 and 12:00 UTC) and thus fail to capture atmospheric variability through the entire diurnal cycle (Wang and Zhang, 2008). Satellites provide global coverage, filling gaps between stations where RS measurements are unavailable, but the spatial and temporal resolutions of such measurements are low and are frequently impacted by the presence of clouds. Thus, large-scale ground-based networks of remote sensing profilers can complement RS and satellite systems, filling a critical need for lower tropospheric data sampling at high resolutions. However, as these new profiler networks become increasingly common, it is important to assess the robustness, capability, and accuracy of these remote sensing instruments.
In order to test and evaluate the value of a network of vertical profiling systems for high-impact weather operations, the University at Albany, State University of New York, deployed the New York State Mesonet (NYSM) Profiler Network (Shrestha et al., 2021; http://www.nysmesonet.org/networks/profiler, last access: 13 October 2022). The network consists of 17 ground-based stations deployed across the state between 2016 and 2018 (Fig. 1). Since then, the Profiler Network has been operating autonomously and continuously in real time. Each station is comprised of a colocated scanning Windcube Doppler lidar (DL), a microwave radiometer (MWR), and an environmental sky imager and radiometer (eSIR) that collectively provides continuous real-time profiles of wind, aerosol, temperature, and humidity along with solar radiance, optical depth, and fisheye sky images. All data are collected, quality controlled, and archived in real time every 10 min. A detailed overview of the NYSM Profiler Network is presented in Shrestha et al. (2021). This paper focuses on evaluating the accuracy of the data collected from the NYSM Profiler Network with respect to well-defined reference measurements. The DL and MWR data are compared to National Weather Service (NWS) RS data, while data collected from the eSIR are compared with in situ measurements from the Aerosol Robotic Network (AERONET).
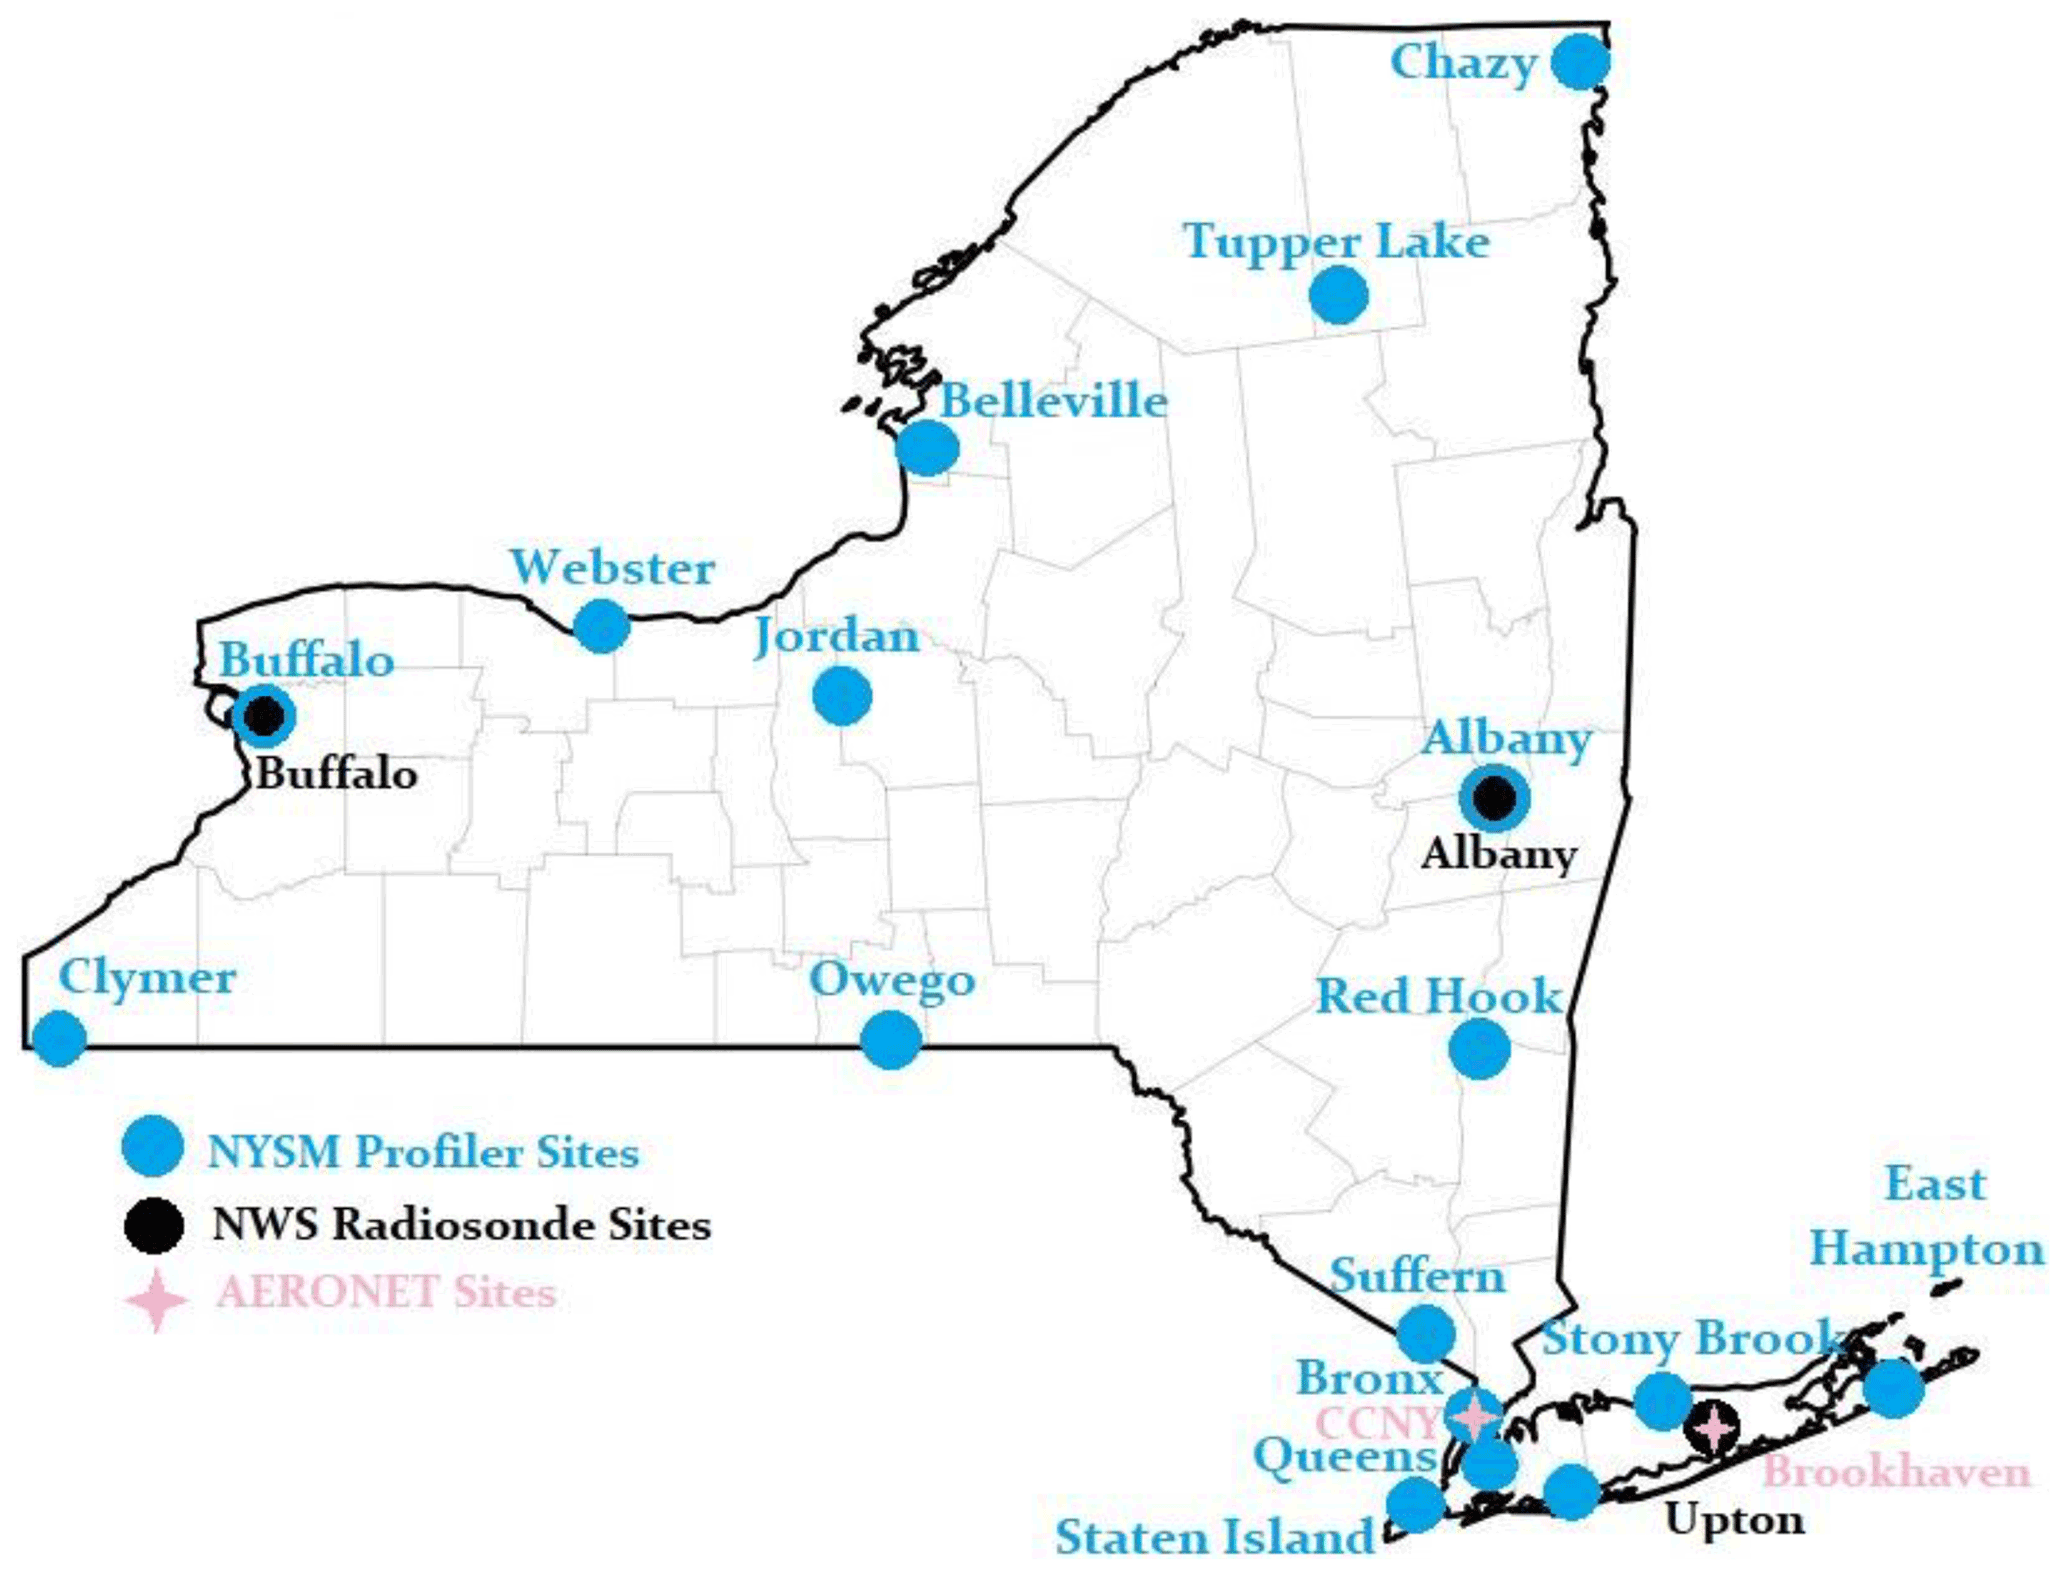
Figure 1A map of New York State Mesonet Profiler Network, NWS radiosonde, and AERONET sites.
Several studies have already assessed and evaluated the accuracies of data collected from DL and MWR that show correlation of R2 ≥ 0.90 and root-mean-squared error (RMSE) ≤ 2.1 m s−1 for the DL wind speed measurements (Vermeesch et al., 2011; Kumer et al., 2014; Päschke et al., 2015; Dai et al., 2020; Mariani et al., 2020) and R2 ≥ 0.98 and RMSE ≤ 7 K and R2 ≥ 0.88 and RMSE ≤ 2 g m−3 for the MWR temperature and water vapor density retrievals, respectively (Ware et al., 2003; Cimini et al., 2011; Madhulatha et al., 2013; Ware et al., 2013; Cimini et al., 2015; Xu et al., 2015; Bianco et al., 2017). The MWR's ability to measure relative humidity appears rather limited, with R2 ≥ 0.48 and RMSE ≤ 25 % (Bianco et al., 2017; Xu et al., 2015), as the MWR fails to capture the high-resolution vertical details of the water vapor due to its coarser resolution.
Though most studies have shown high values for R2 for most variables, a closer inspection of these prior results show marked variations in errors. Furthermore, many prior studies present results from just a few case studies limited to a few days to few months or seasons, generally not exceeding a year and usually from a single site. Thus, those results could be influenced by local topography, seasonal variations, and other local factors, and some results are potentially affected by the varying operational procedures and retrieval methods used. The aim of this study is to build on the results from previous studies but by using a much broader and more extensive dataset. This review evaluates the accuracy of data collected from three different NYSM profiler sites that are located near NWS RS sites, namely Buffalo (urban), Albany (Upper Hudson Valley), and Stony Brook (coastal), representing upstate, central, and downstate regions of the state, respectively, during the period from January 2018 to August 2021. This multi-station, multi-year study provides a comprehensive evaluation of the performance and robustness of the instruments from across different topographical regions and meteorological conditions. Next, this study presents an evaluation of derived parameters such as wind shear from the DL and convective (thermodynamic) parameters from the MWR. The accuracy of these derived parameters demonstrates the suitability of the DL and MWR for use in real-time weather applications, which is severely limited with traditional twice-daily RS data. Lastly, this study evaluates the aerosol optical depth (AOD, a widely used parameter in air quality studies and forecasting) derived from the eSIR at two NYSM profiler sites (Stony Brook and Bronx) where AERONET sites are located nearby. Overall, this paper provides quantification and understanding of observational errors associated with profiler network data based on well-characterized in situ measurements from the NWS RS and AERONET (see Fig. 1 for site location) that are critical for several weather and air quality studies and forecasting.
This paper is structured as follows. Section 2 provides a summary of the instrumentation and siting of the NYSM Profiler Network, NWS RS, and AERONET sites. Section 3 reviews the data and methodology, followed by results and discussions of the evaluation of the data in Sect. 4. A summary and conclusions are presented in Sect. 5.
Each of the 17 NYSM Profiler Network stations is comprised of an active remote sensing Leosphere-Vaisala Scanning Windcube Doppler lidar (DL) 100S, a passive remote sensing Radiometrics MP-3000 series microwave radiometer (MWR) and an in-house-built environmental sky imaging radiometer (eSIR, commonly referred to as a sun photometer) (Shrestha et al., 2021). Most profiler sites (except Albany, East Hampton, and Webster) are located within 0.5 km of a NYSM Standard Network site that provides atmospheric data at or near the surface (Brotzge et al., 2020).
The DL operates at the near infrared (λ = 1540 nm) and provides radial wind speed and carrier-to-noise ratio (CNR, a modulated signal for signal-to-noise ratio, SNR) using a highly sensitive heterodyne detection technique (Boquet et al., 2016). The DL is operated in Doppler Beam Swinging (DBS) mode (Newman et al., 2016); the DBS points in five directions (four cardinal direction scans at an elevation of 75∘ and one vertical 90∘ scan), which are averaged together to yield the 3D (u, v, and w) wind speeds. The measurement is from 100 to 7000 m, with a vertical grid of 25 m below 1000 m and 50 m above 1000 m and with a temporal resolution of ∼ 20 s (1 DBS scan); however, the data availability above 3 km is very limited and rarely available (only occasional data availability during long-range wildfire smoke events; Shrestha et al., 2022) due to the lack of aerosols in the free troposphere above the boundary layer.
The MWR operates in the 21 K band (22–30 GHz) and 14 V band (51–59 GHz) channels to measure brightness temperatures in the water vapor and oxygen bands that are then converted into profiles of temperature, relative humidity, water vapor density, and liquid density using a neural network and radiative transfer algorithm (Solheim et al., 1998; Ware et al., 2003; Knupp et al., 2009). The retrieved profile is from the surface to 10 km, with a vertical grid of 50 m below 500 m, 100 m between 500 and 2000 m ,and 250 m above 2000 m and a temporal resolution of ∼ 2 min.
Table 1Measurement accuracies reported by the manufacturer.
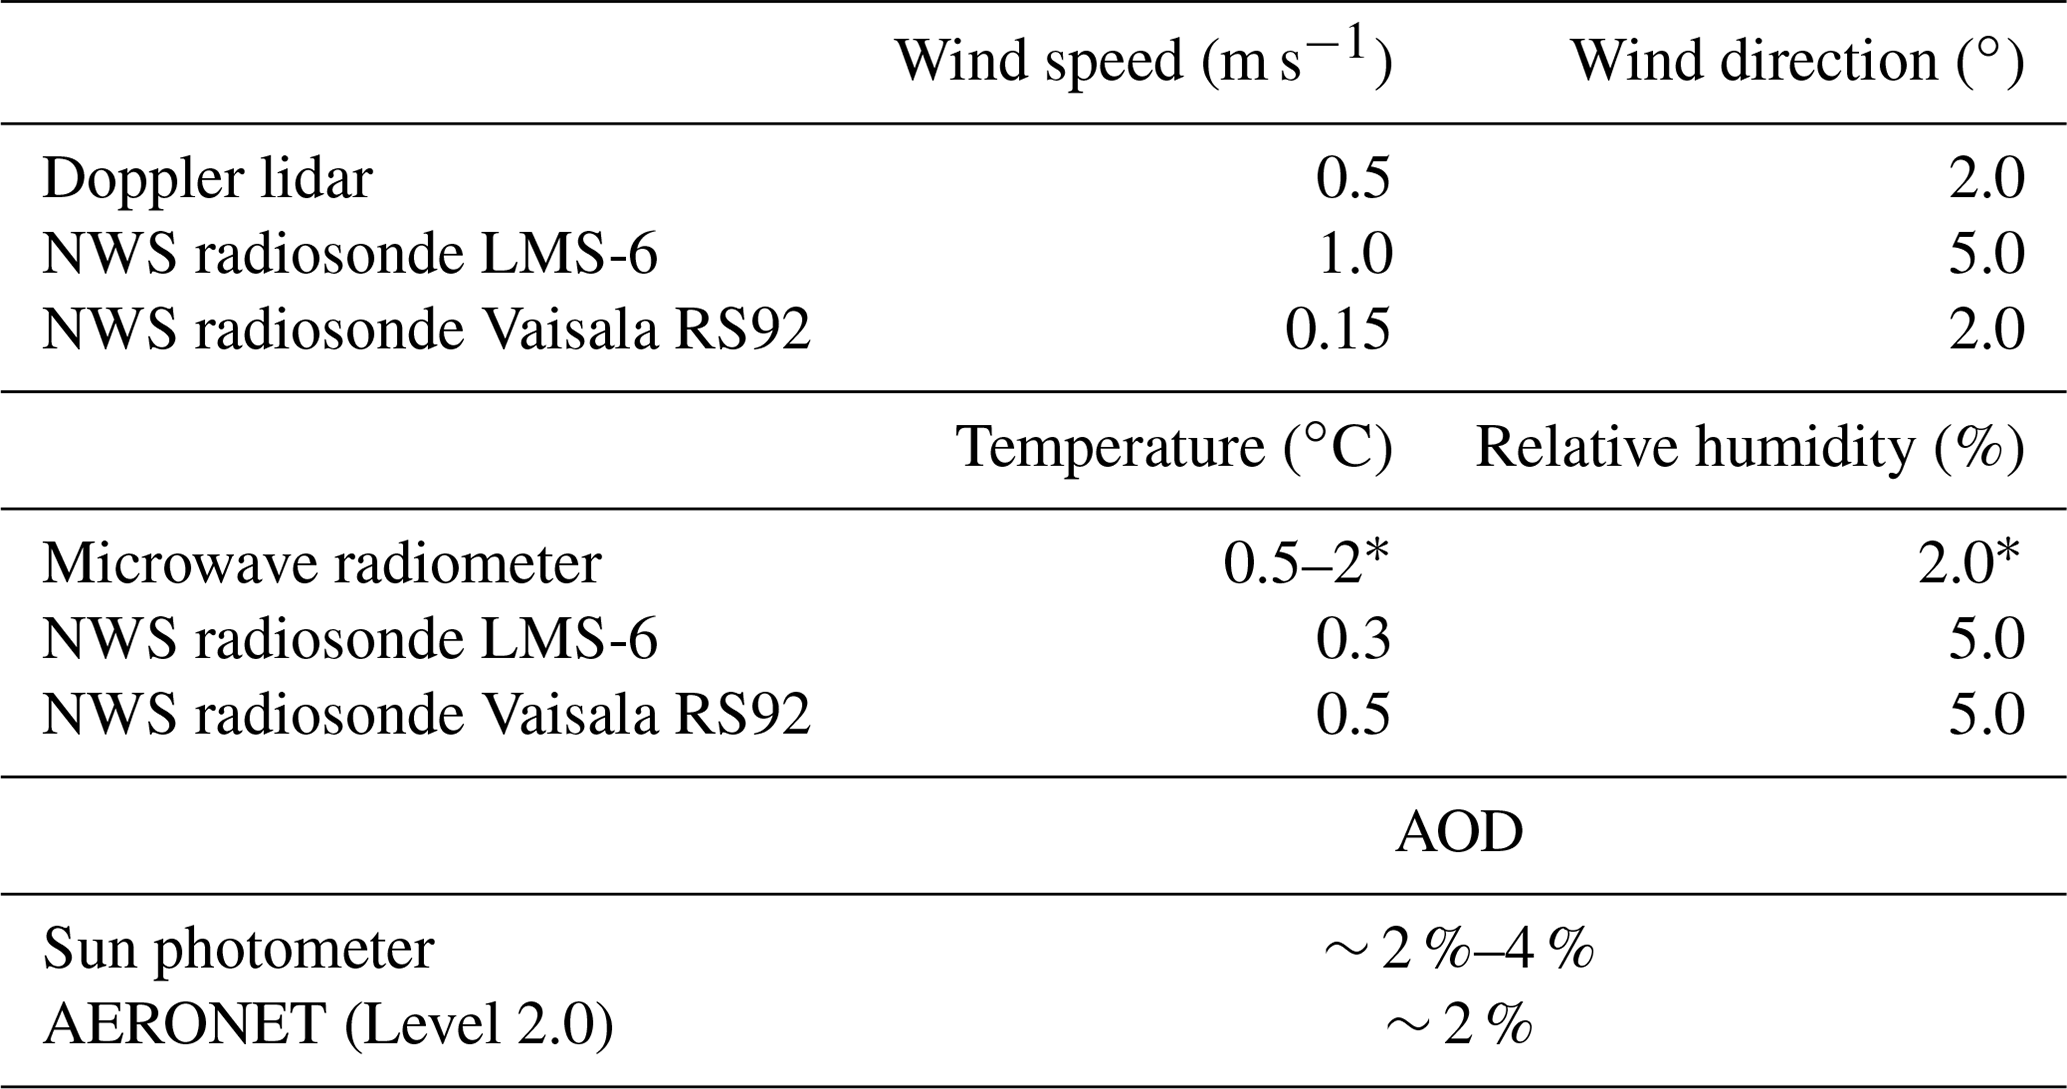
∗ Near-surface accuracy that decreases along the height.
The eSIR operates a shadow band technique (Harrison et al., 1994) and measures spectral direct and diffuse irradiance at seven wavelength channels (415, 500, 610, 670, 870, 940, and 1020 nm) every 5 min during daylight hours. Additionally, it also provides fisheye sky images and has a GPS and temperature, pressure, and humidity sensors. Measurement accuracies provided by the sensor manufacturers and reference measurements are listed in Table 1.

Three NWS RS sites operate across New York State – Buffalo (BUF), Albany (ALB) and Upton (OKX). The RSs are launched twice daily at 00:00 and 12:00 UTC (19:00 and 07:00 EST) and provide vertical profiles of pressure, temperature, relative humidity, dew point temperature, and wind speed and direction from the surface to around 30 km a.g.l. at about 1 s temporal resolution. The NWS launches the Lockheed Martin LMS-6 RS at Buffalo and Albany and Vaisala RS-92 at Upton (measurement accuracies listed in Table 1). These three RS launch sites – Buffalo, Albany, and Upton – are located near the NYSM Profiler Network sites, and hence the RS data are compared against the DL and MWR data at Buffalo, Albany, and Stony Brook, respectively. AERONET has a few sites in New York, with all sites located around the New York City region. Two sites – Brookhaven and CCNY – are in close proximity to the NYSM Profiler Network sites at Stony Brook and Bronx, respectively. The pre- and post-calibrated, cloud-screened, and quality-assured (QA) level 2.0 data from AERONET are used for comparison with the eSIR data. The details about AERONET level 2.0 AOD and data processing can be found in Giles et al. (2019). The location of the selected sites and their average separation distances are listed in Table 2.
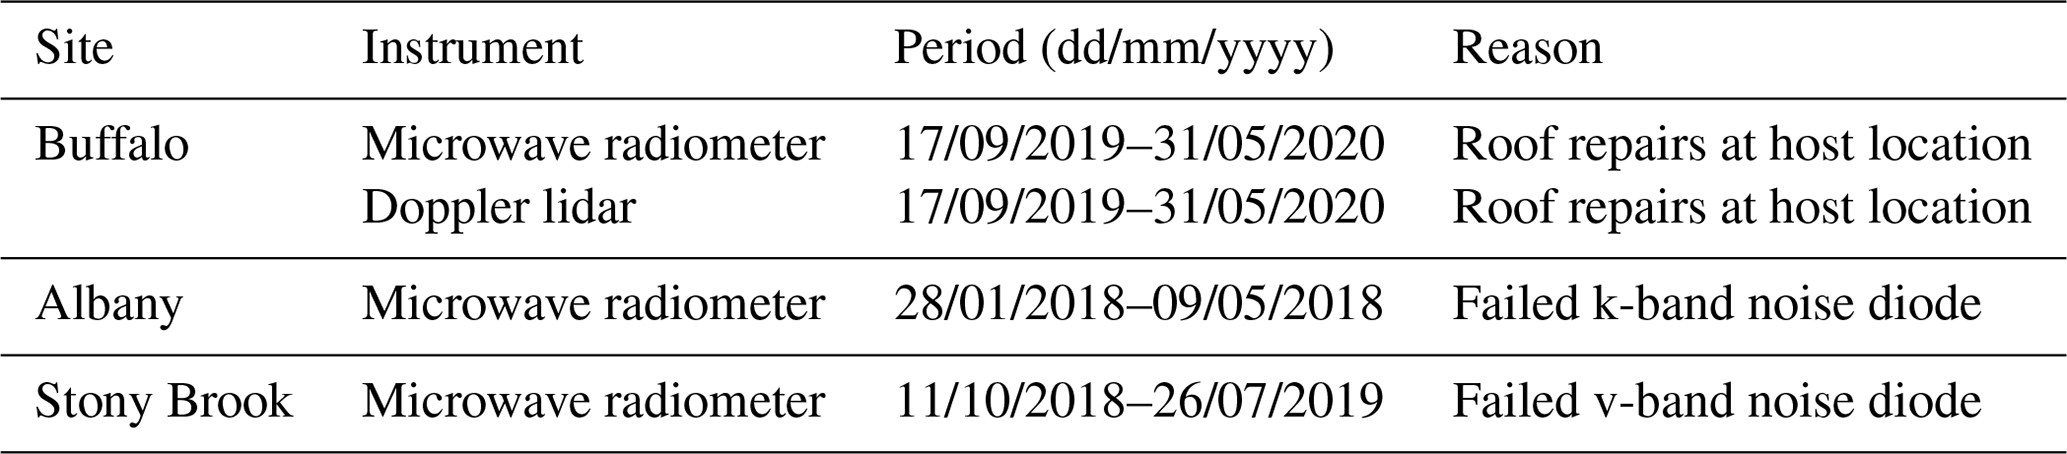
The high-resolution NWS RS data are downloaded from the University of Wyoming archive (http://weather.uwyo.edu/upperair/bufrraob.shtml, last access: 13 October 2022) and have a vertical resolution of 1 s, equivalent to ∼ 5 m. The RS profiles of temperature, water vapor density, and wind speed from January 2018 to August 2021 are considered in this study. A total of 2093, 2457, and 1862 NWS RS profiles were available during the times when the MWRs at Buffalo, Albany, and Stony Brook were operating, but based on the MWR data availability (QA flag), a total of 2010, 2360, and 1755 pairs of profiles have been selected for comparison. On average ∼ 96 % of profiles were available from the MWR for comparison with the RS. Similarly, a total of 2165, 2655, and 2408 RS profiles were available during the times when the DL at Buffalo, Albany, and Stony Brook were operating, but based on the DL data availability, a total of 1752, 1953, and 2109 pairs of profiles have been selected for comparison. Since the aerosol concentration, atmospheric refractive turbulence, humidity, and precipitation have significant impact on the data availability from the DL (Aitken et al., 2012), the total number of profiles selected for RS–DL comparisons are relatively low compared to the RS–MWR comparisons. Since the DL data availability is determined by the CNR threshold (Boquet et al., 2016) and CNR values are dependent on the aerosol concentration, the CNR values typically follow the diurnal cycle, with lower values at night, reaching local minimum in the early morning, and higher values during the day (Aitken et al., 2012). This results in lower data availability at night and in the morning and higher data availability during the day and evening. Thus, the DL data availability, particularly during the morning NWS RS launch time (07:00 LT or 12:00 UTC), is not optimal and is usually lower than at other times (Fig. 2), thereby reducing the number of RS–DL profiles for comparisons. Nevertheless, on average ∼ 80 % profiles were available from the DL for comparison with the RS. The major data gaps for each instrument during the comparison period are listed in Table 3.
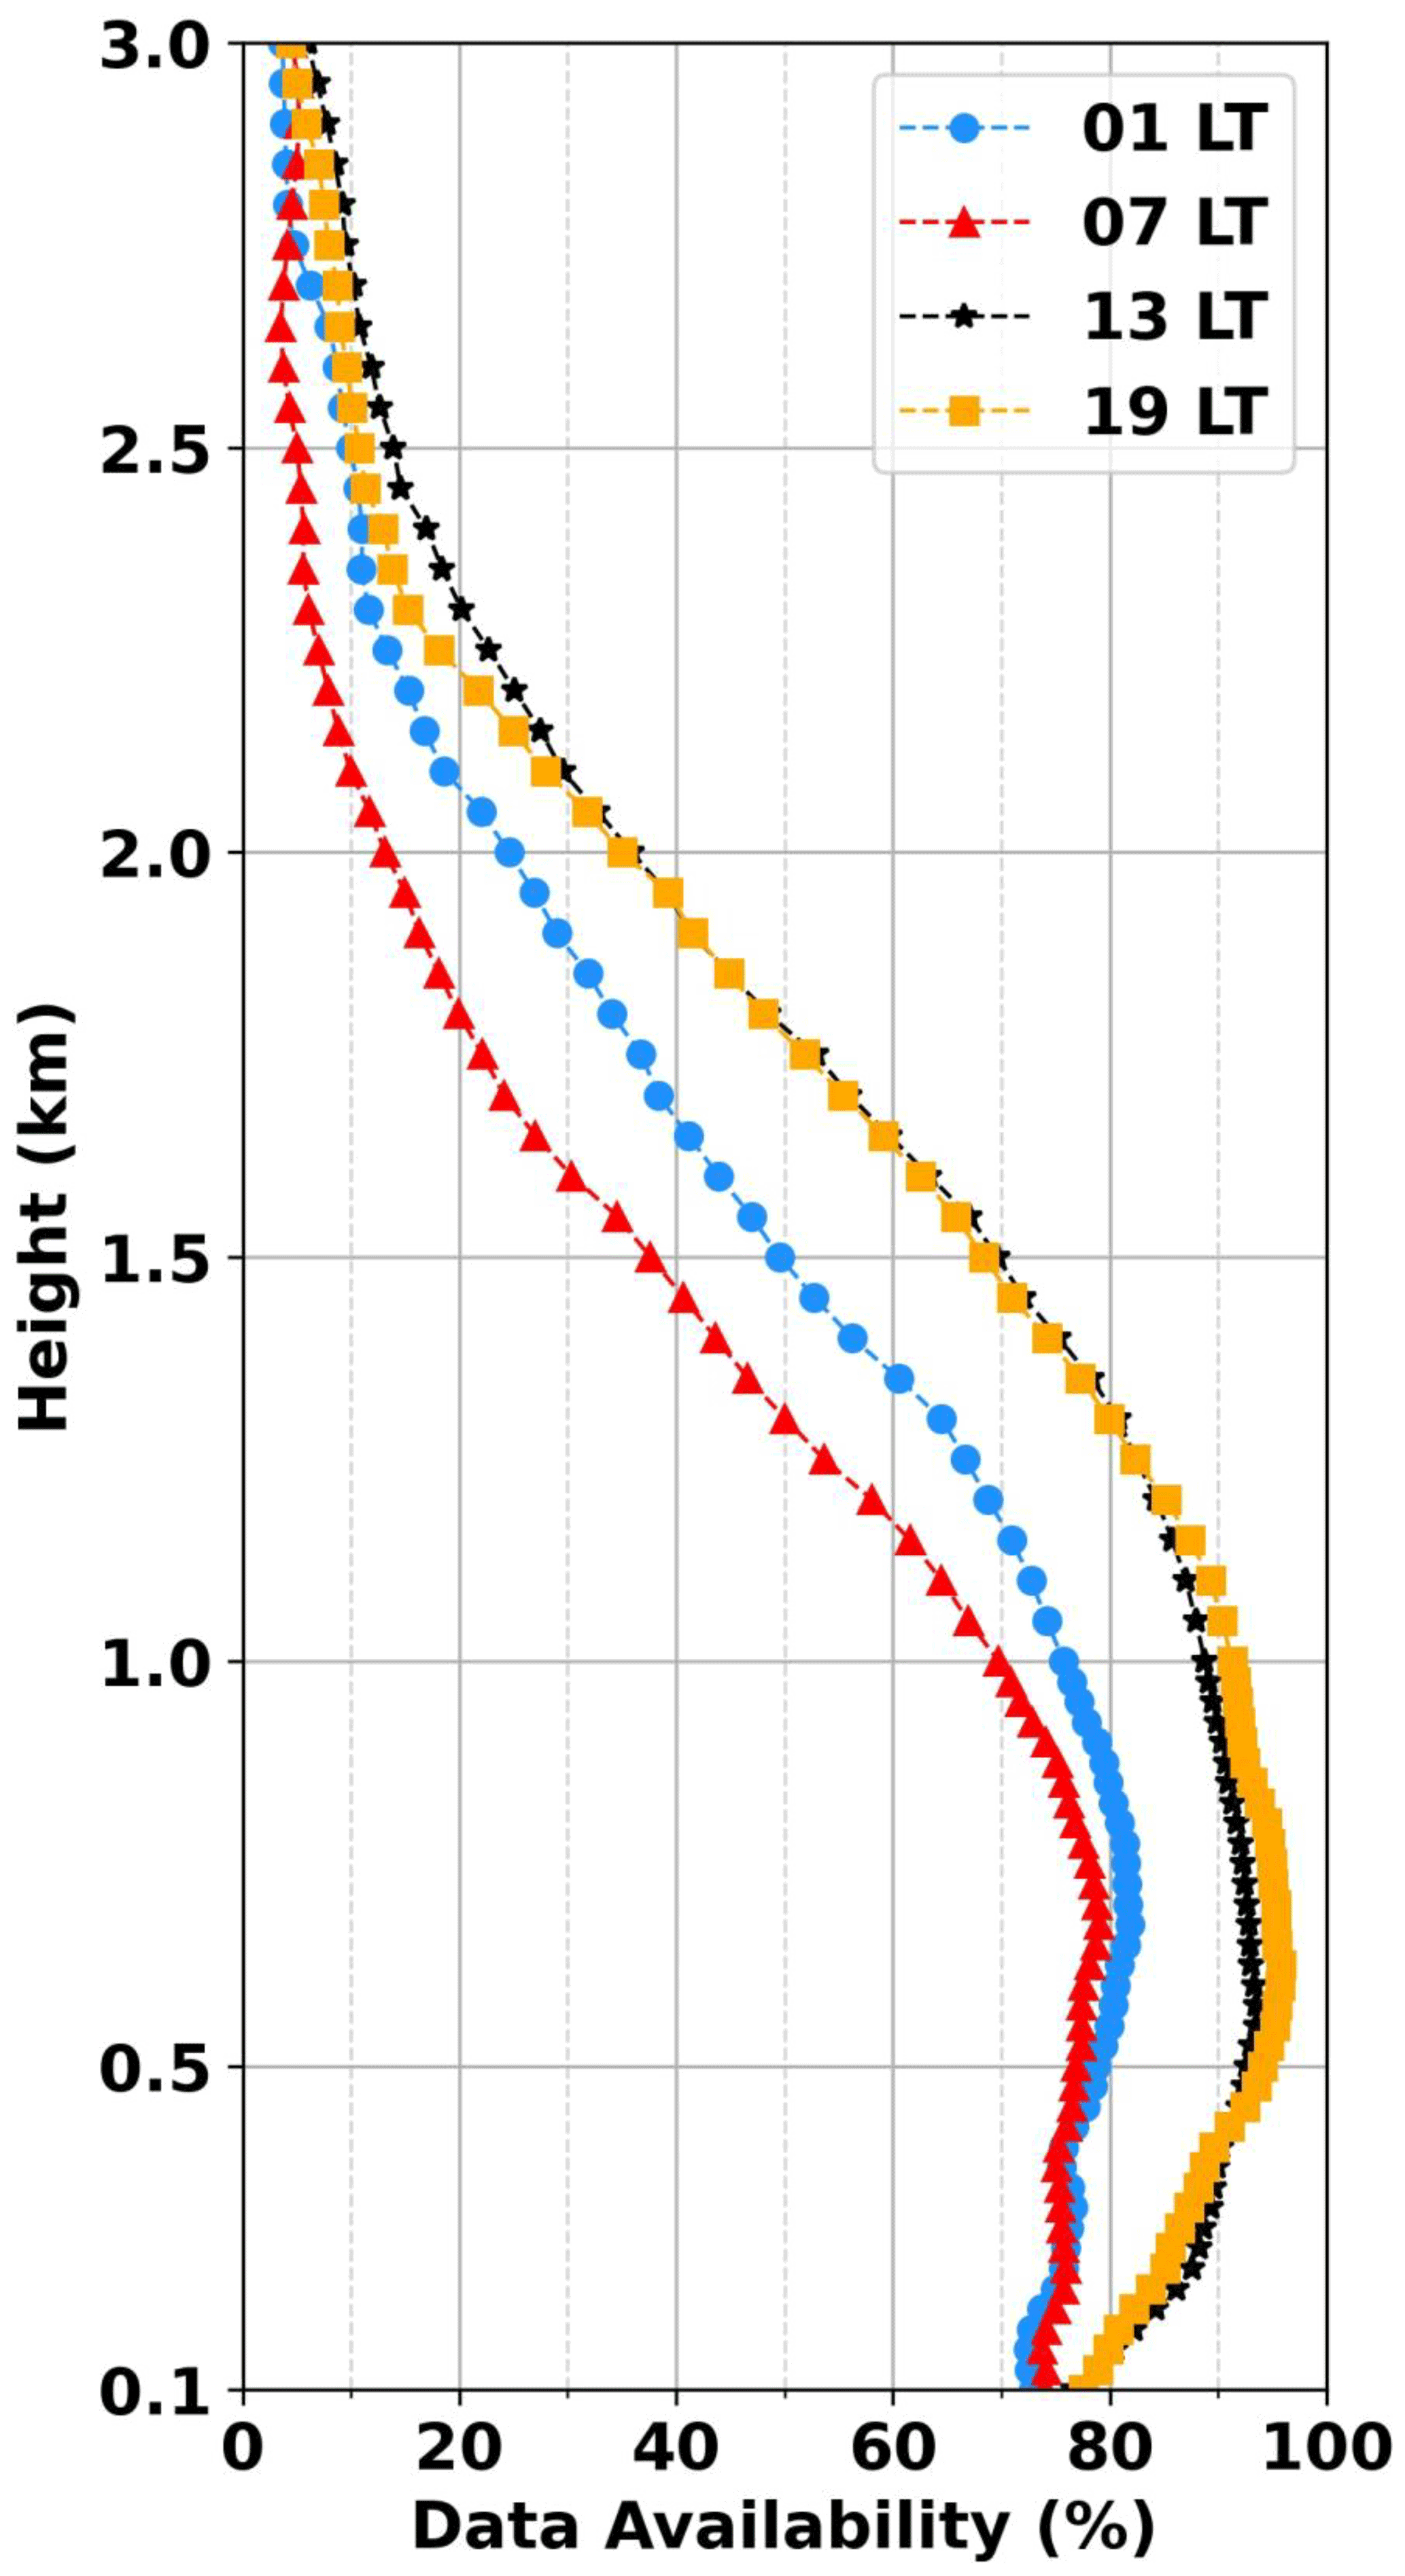
Figure 2The DL data availability during four different hours at the NYSM Profiler Network site at Albany during May–August 2021. The NWS RS launches are at 12:00 UTC (07:00 LT) and at 00:00 UTC (19:00 LT).
Since the RS measurements have a finer vertical resolution (∼ 5 m) than that from the DL and MWR retrievals, it is necessary to define a common height grid to make data comparable. To do so, RS data within ±5 m of the DL and MWR measurement height are first averaged to smooth the RS data. Since the data availability from the DL decreases with height (Fig. 2) due to its dependence on aerosol concentration, comparison data are usually limited to within the boundary layer (BL) as the BL typically has more aerosols than the free troposphere. Therefore, the RS–DL data are only compared from 100 m to 3 km a.g.l. A typical RS has an ascent rate of 5 m s−1, which takes approximately 10 min to reach the height of 3 km. Thus, the horizontal wind speed profiles from the DL are averaged ±10 min centered at the RS launch time and then compared with the corresponding profiles from the RS. Similarly, the temperature and water vapor density profiles up to 10 km from the MWR are first averaged to ±30 min centered at the RS launch time and then compared with the corresponding profiles from the RS. Since overall off-zenith (20∘ elevation) observations from the MWR provide more accurate retrievals than zenith observations (Xu et al., 2014), the average of two off-zenith observations are used for the comparisons; however, it is to be noted that the zenith observations might be comparatively better, particularly during non-precipitation days.
The MWR retrievals have errors due to ill-posed retrieval techniques with inherent biases in the brightness temperatures (Illingworth et al., 2015) that may be associated with the gas absorption model (Hewison, 2007), liquid nitrogen calibration uncertainty (Löhnert and Maier, 2012; Illingworth et al., 2019), and neural network performance (Cimini et al., 2011). The neural network is trained with RS data from a site with a similar altitude and climatology to the MWR site (Knupp et al., 2009). However, only three NWS RS sites are available in New York State (NYS) that are used to train neural networks for all 17 MWRs across the network. The neural network for the MWR at three selected NYSM Profiler sites – Buffalo, Albany and Stony Brook – are trained with data from the NWS RS sites at Buffalo, Albany, and Upton, respectively. The larger distance between the MWR and RS site limit the effectiveness of the neural network method and introduces some inherent error due to local climatology (Cimini et al., 2011). Additional error between the RS and MWR arises due to the large RS drift distance. Xu et al. (2015) has reported that MWR biases are height dependent due to wind speeds and RS drift distances. Since the MWR is a ground-based instrument measuring along the line of sight while the RS measures along the trajectory as it ascends and drifts horizontally with the winds, the two instruments may not sample the same air masses spatially when the RS drift distances are very large. Based on the data from Albany during the period of study, the RS was found to drift significantly with height. As wind speeds increase with height, the drift distances increase to 1.6, 6, and 42 km at a height of 1, 3, and 10 km, respectively. In addition to this spatial mismatch, there is also a temporal mismatch, as the RS typically takes about 30 min to reach a 10 km height; however, the temporal mismatch is somewhat compensated by averaging the MWR data centered at the RS launch time. The spatial and temporal mismatch have less impact on the DL data because a maximum height of only 3 km is considered. In summary, horizontal wind speed profiles up to 3 km from the DL and temperature and water vapor density profiles up to 10 km from the MWR are compared against profiles measured by the RS. Data are further evaluated under three different weather conditions: precipitation, cloudy and clear-sky days.
In addition to the directly retrieved data comparisons, several derived forecasting parameters from the DL and MWR are calculated and compared against those derived from the RS. Wind shear (100 m–1 km and 100 m–3 km) are derived from the DL using the horizontal wind speeds at the two height levels. A total of 14 different thermodynamic parameters are derived using the MWR data. To calculate and compare the thermodynamic parameters, RS and MWR data are subsampled to a common pressure grid at 10 hPa resolution. A cubic spline interpolation is applied at 10 hPa intervals from the surface to the lowest pressure level available. Interpolation is specifically needed to make sure data are available at mandatory pressure levels as defined by the American Meteorological Society (2014). The thermodynamic parameters considered in this study are as follows.
- a.
Moisture parameters, i.e., mean relative humidity (meanRH) and total precipitable water (TPW), where meanRH is calculated from the near-surface pressure level (ps) to 950, 850, and 700 hPa. The TPW (or total water content present in the vertical column of air) is calculated as defined by Solot (1939) from ps to the lowest pressure (pL) available. The lowest pressure is normally equal to or lower than 300 hPa.
- b.
Potential temperature (θ) lapse rate (LR) are calculated as the values between ps and 850 hPa and ps and 700 hPa.
- c.
Stability index is calculated as the difference between the saturated equivalent potential temperature (θes) and equivalent potential temperature (θe) at two levels, i.e., 950 and 850 hPa.
- d.
The thickness layer is calculated between the following two levels: ps and 850 hPa and ps and 500 hPa.
- e.
Single-level indices, such as the K index (KI), lifted index (LI), Showalter index (SI) and total totals index (TT), are also included. Details about these indices, their formulas, and their threshold values for severe convective weather forecasting can be found in Peppier (1988) and Cimini et al. (2015) and at https://www.weather.gov/lmk/indices (last access: 13 October 2022).
Finally, the AERONET level 2.0 AOD data are downloaded from https://aeronet.gsfc.nasa.gov/new_web/aerosols.html (last access: 13 October 2022). The AOD are derived from the eSIR using the Beer–Lambert–Bouguer law and Langley regression (Koontz et al., 2013). Since the eSIR data are available every 5 min, eSIR-derived AOD are compared against 5 min averaged AERONET AOD for the three commonly available wavelengths: 500, 870, and 1020 nm. Since there were only limited time periods when both eSIR and AERONET data were available, the AOD data are compared from April to June of 2018 at Stony Brook and from March 2018 to October 2019 at Bronx.
The comparison statistics calculated between the reference measurements (NWS RS and AERONET) and NYSM Profiler Network measurements include slope (m); coefficient of determination (R2); and three types of errors, i.e., mean bias error (MBE) with 1 standard deviation error bar, mean absolute error (MAE), and root-mean-square error (RMSE).
4.1 Evaluation of DL data
A comparison of horizontal wind speeds (WSs) from RS and DL for the three sites (Buffalo, Albany, and Stony Brook) show high values for m and R2, i.e., m ≥ 0.93 and R2 ≥ 0.89 (Fig. 3a–c), implying good agreement between the two instruments. The DL shows very small to no biases across the sites and is within the expected range based on the accuracies of the DL and RS listed in Table 1. Such observed biases are in statistical agreement (statistically equal to 0, based on a t test, p > 0.05) at Buffalo, while the biases are statistically significant and different from 0 (p ≤ 0.05) at Albany and Stony Brook. Across the three sites, the MAE ranges between 1.0 and 1.4 m s−1, while the RMSE ranges between 1.4 and 1.9 m s−1. Errors are found to be relatively high at Stony Brook compared to the other two sites. Across all three sites, differences are within 0.5 m s−1, showing a consistent performance from the DLs.
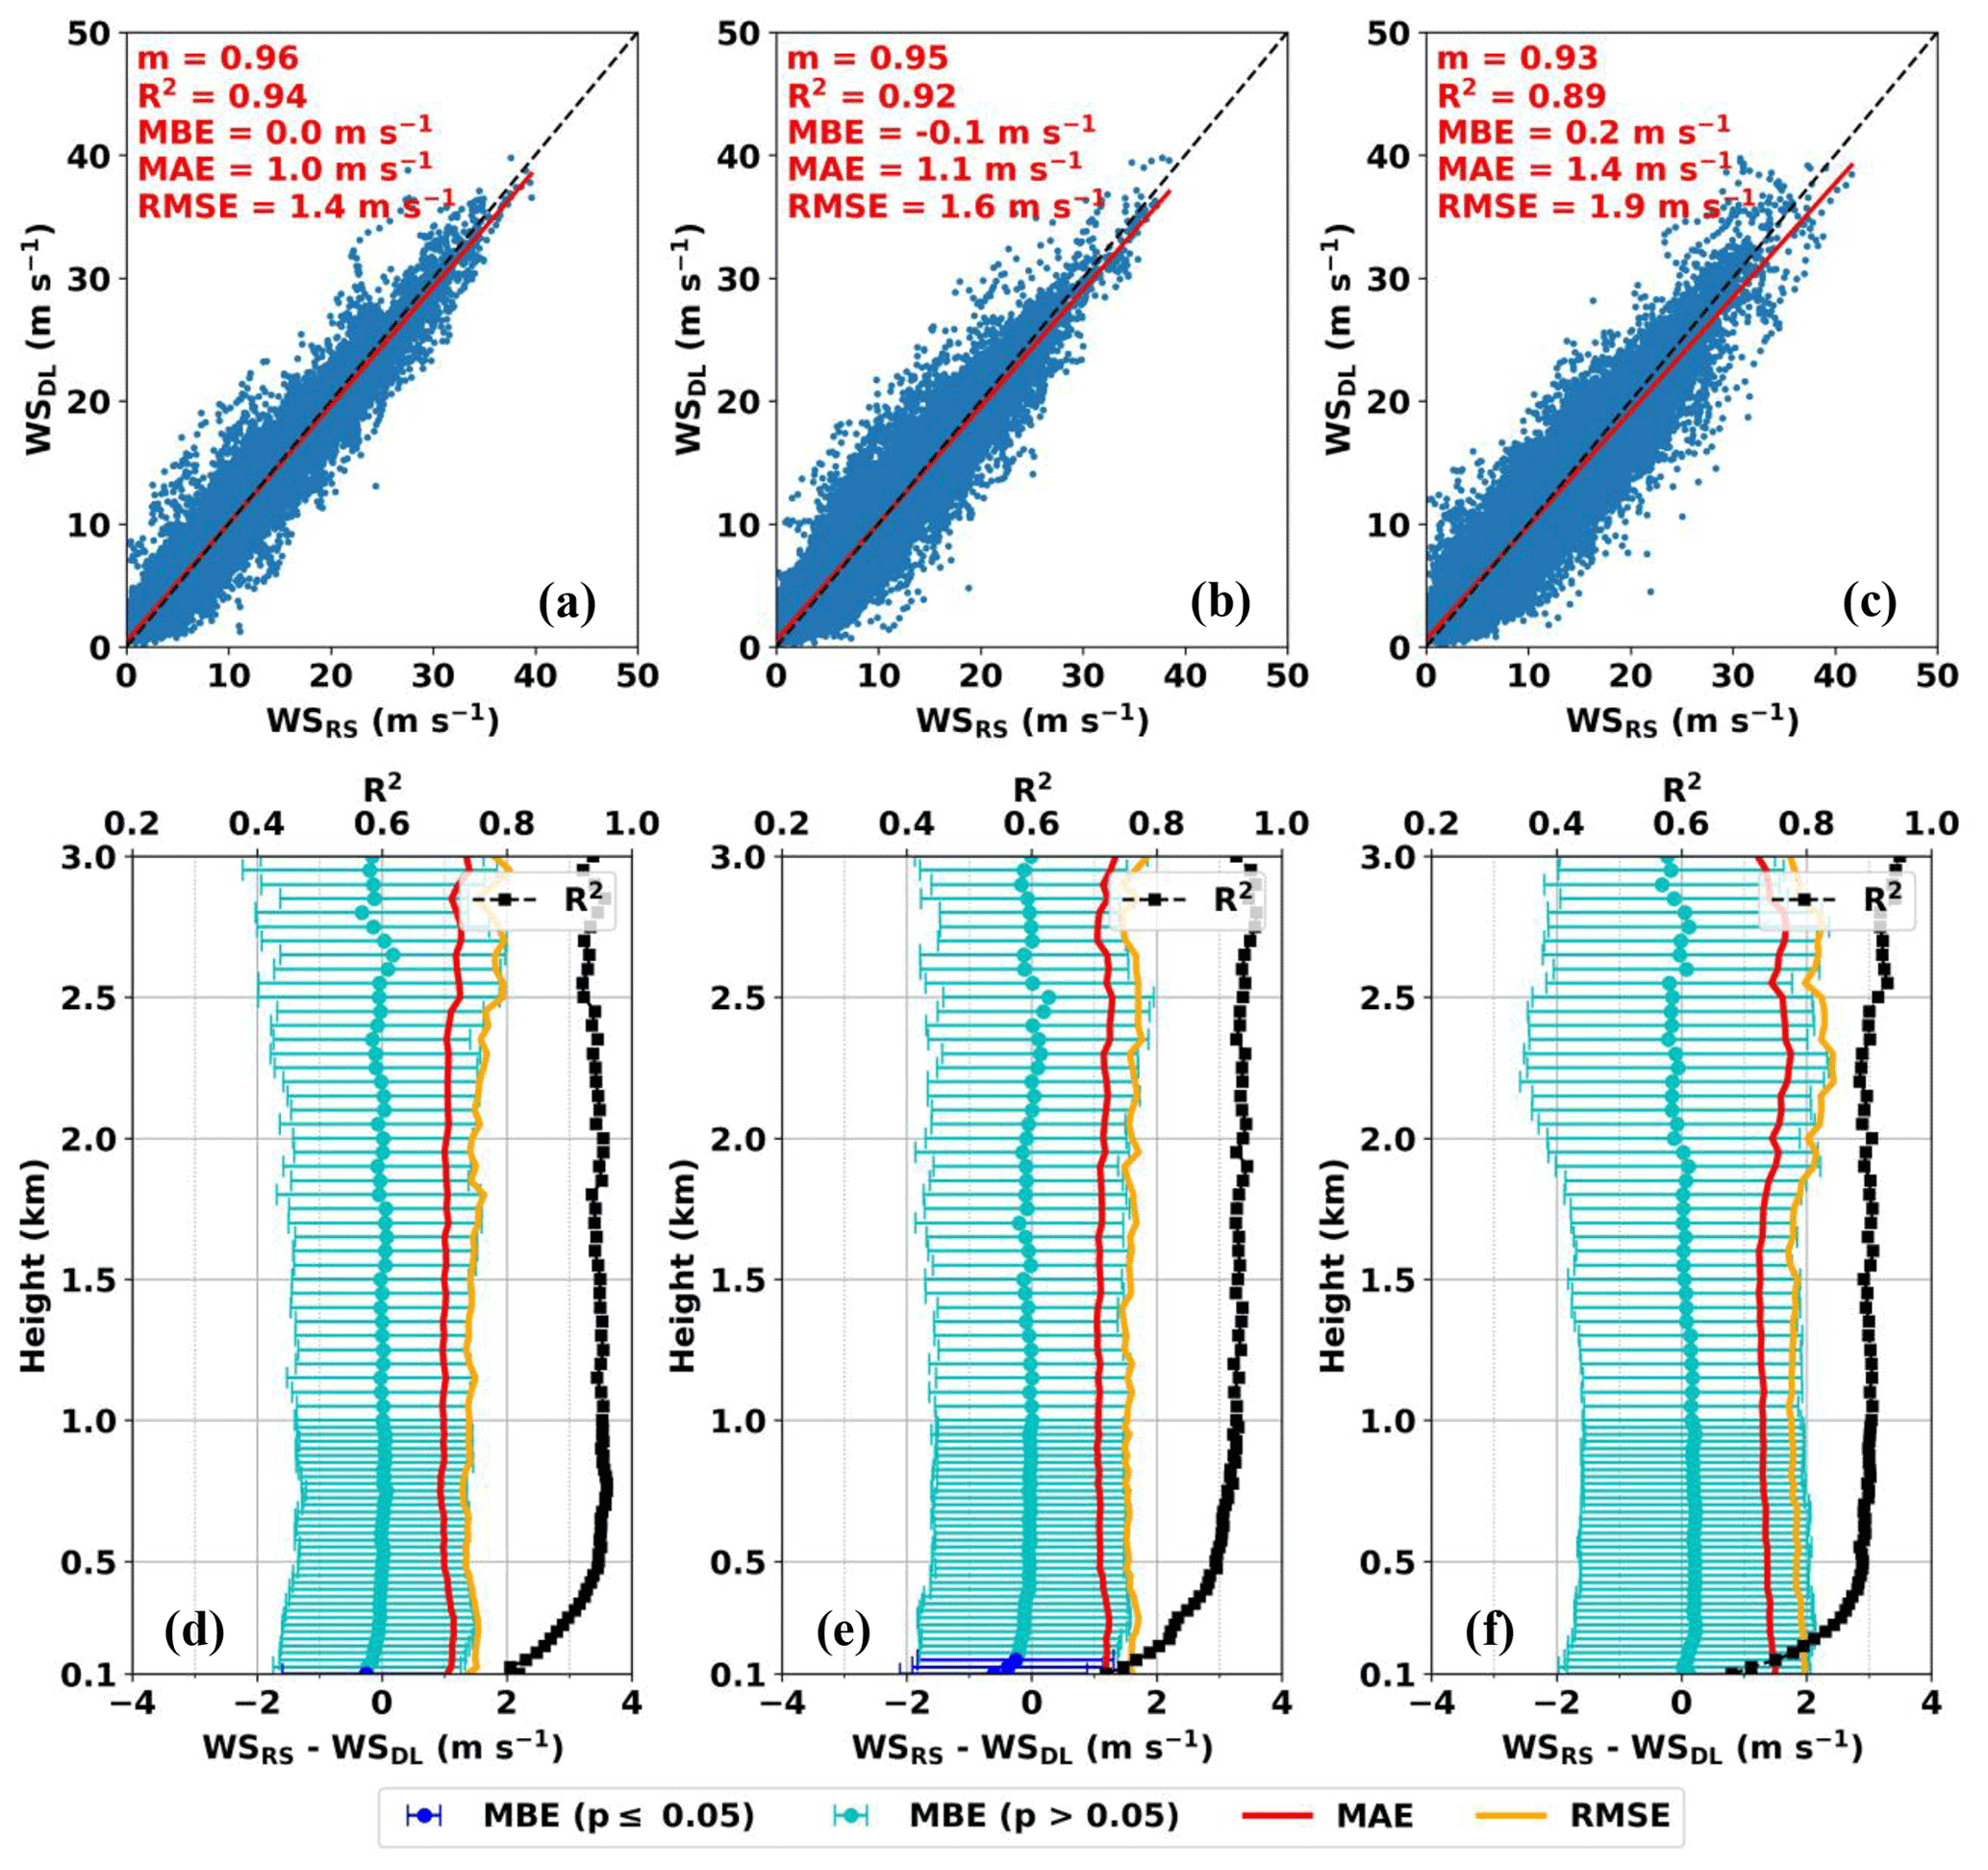
Figure 3Scatterplots for RS- and DL-measured horizontal wind speed (WS) at three NYSM Profiler Network sites at (a) Buffalo, (b) Albany, and (c) Stony Brook. Vertical profiles of R2, MBE with 1 standard deviation error bars, MAE, and RMSE for the same variable are shown for the following sites: (d) Buffalo, (e) Albany, and (f) Stony Brook.
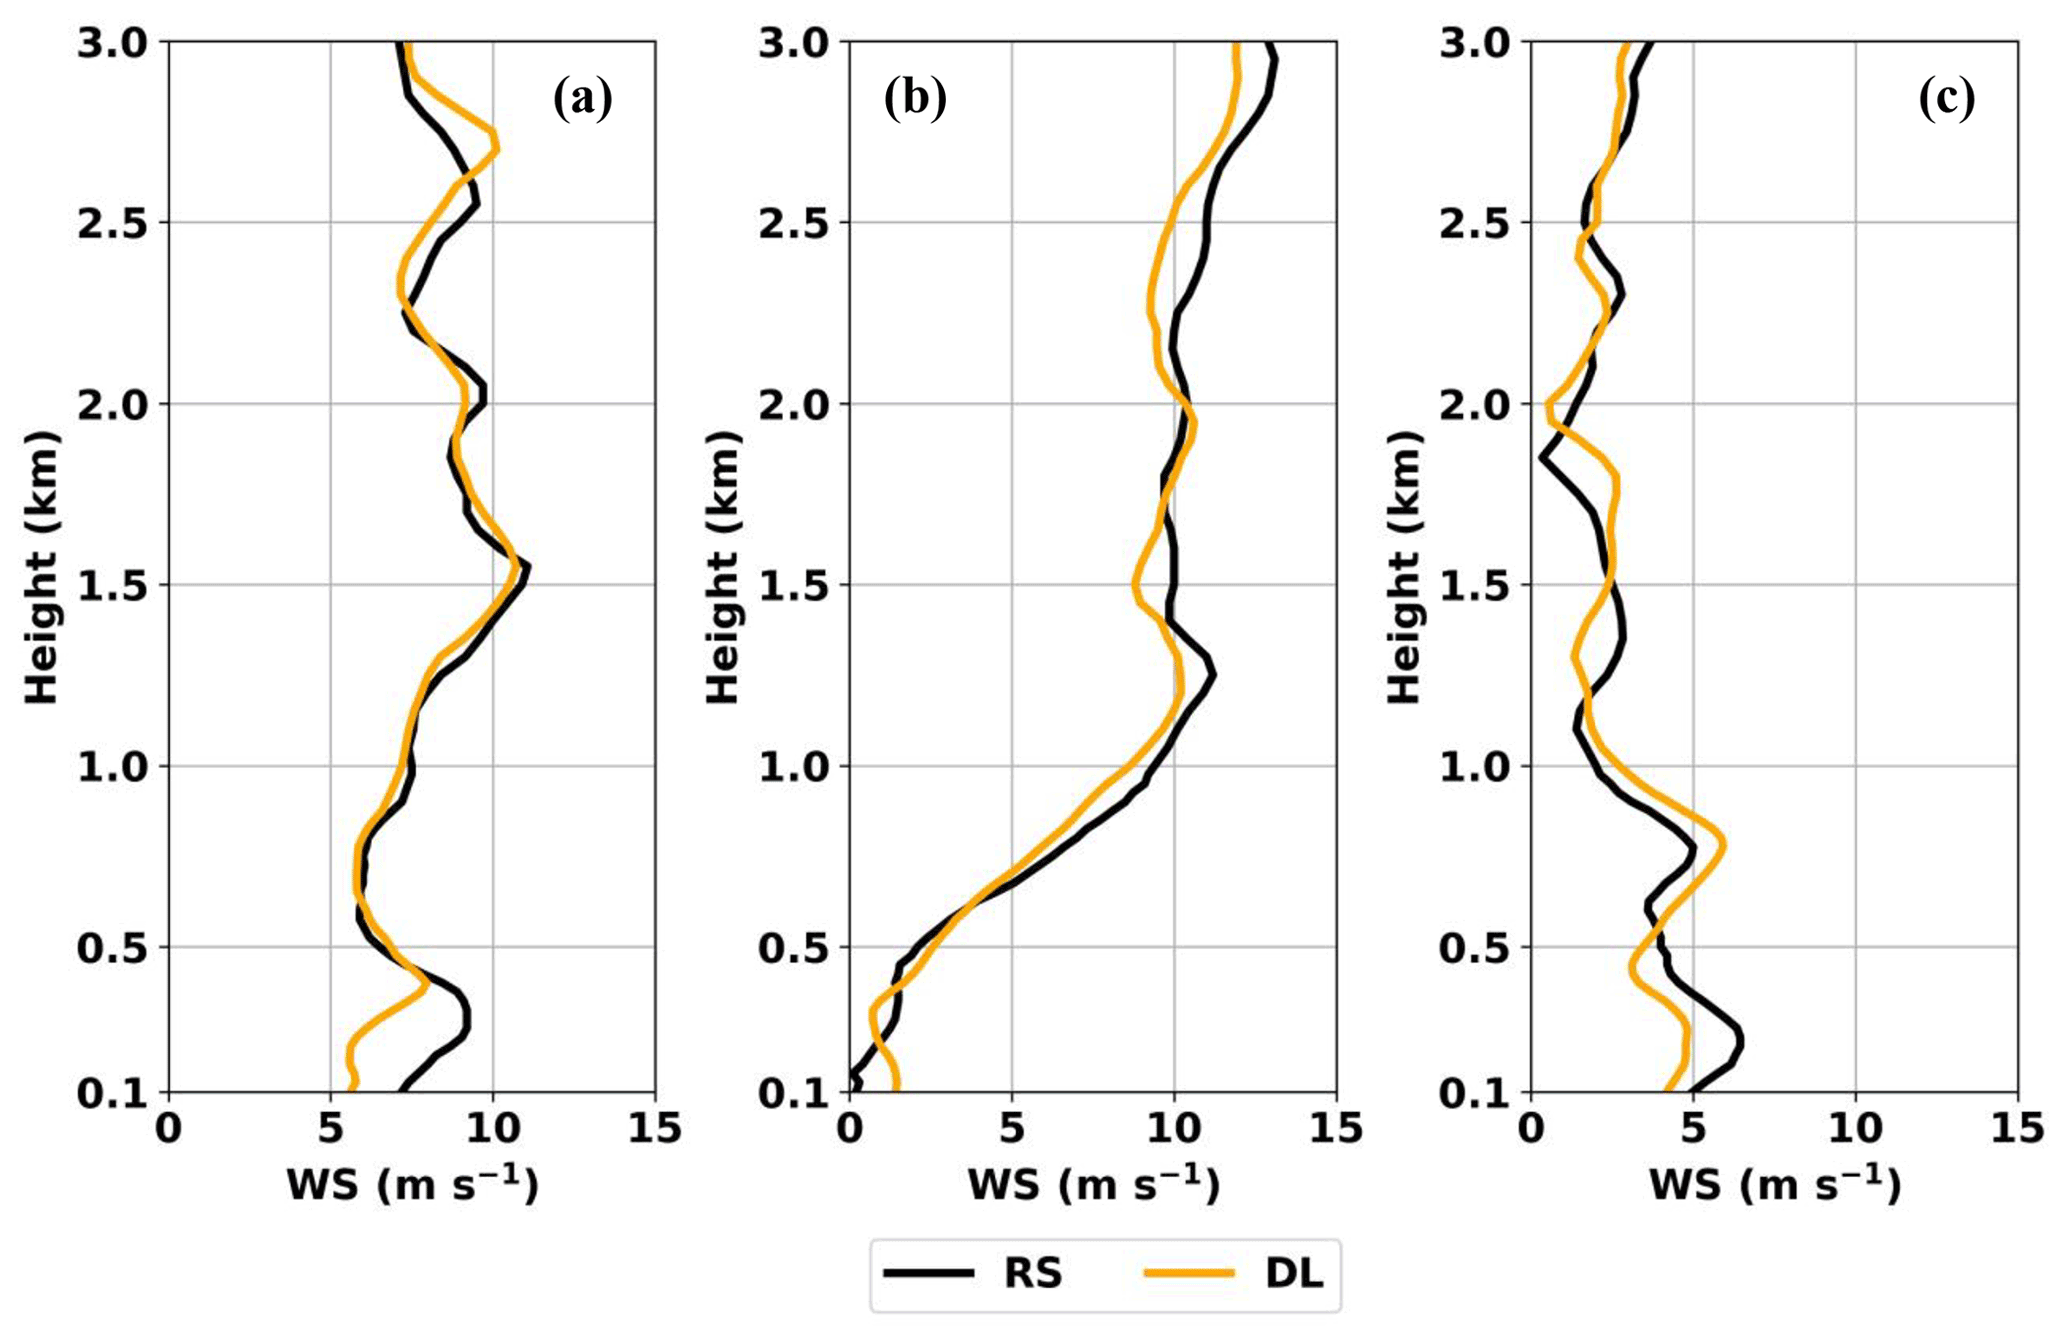
Figure 4Vertical profiles of horizontal wind speed (WS) measured by DL and RS at three NYSM Profiler Network sites at (a) Buffalo and (b) Albany at 19:00 LT (23:00 UTC) on 19 July and (c) Stony Brook at 19:00 LT (23:00 UTC) on 20 July 2021.
The WS error statistics and R2 are plotted as a function of height (Fig. 3d–f, please see Fig. S1 in the Supplement for clarity at lower heights). Along the height, the MBE is very close to 0 and are in statistical agreement (p > 0.05) except for the lowest three heights (100, 125, 150 m) at Albany. Both at Buffalo and Albany, the MAE and RMSE are below 1.4 and 2 m s−1 throughout the profile, while at Stony Brook, the MAE and RMSE are below 1.8 and 2.4 m s−1. The RMSEs are ≥ 2 m s−1 mostly above 2 km at Stony Brook. Overall, WS errors (MBE, MAE and RMSE) are slightly larger at Stony Brook than at Buffalo and Albany, which is consistent with those observed in Fig. 3a–c. Such relatively high errors at Stony Brook could be due to the greater distance between the RS and DL locations, topographical differences, and the potential influence of the marine boundary layer. The NYSM site at Stony Brook is close to the coastal area (∼ 2 km) of the Long Island Sound, while the corresponding NWS site at Upton is situated more inland and midway between the northern and southern coasts (∼ 10 km; see Fig. 1 for approximate location). The R2 profiles show the lowest value at 100 m that rapidly increases up to 0.5 km. Above 0.5 km, the R2 > 0.90 at Buffalo and Albany and near or above 0.90 at Stony Brook. The overall lower values of R2 within 0.5 km are consistent with studies by Mariani et al. (2020) and Kumer et al. (2014), which is due to large uncertainties in RS wind measurements below 0.5 km as a result of larger self-induced irregular balloon motions in the turbulent layer (Wang et al., 2009). Overall, the DL is able to capture the vertical structure of WS consistent with RS measurements as shown in the representative example in Fig. 4.
4.2 Evaluation of DL-derived wind shear
Scatterplot comparisons of the RS- and DL-derived wind shear as calculated from 100 m to 1 km and 100 m to 3 km are shown for all three selected sites (Fig. 5a–f). A total of 712 (41 %), 848 (43 %), and 951 (45 %) profiles were available at Buffalo, Albany, and Stony Brook for the calculation of 100 m–1 km wind shear. The R2 ≥ 0.86 values are observed at Buffalo and Albany, but only R2 = 0.70 is seen at Stony Brook (Fig. 5a–c). The MBE of 0.5 m s−1 at Albany is statistically significant (p ≤ 0.05), while the MBE ≤ 0.2 m s−1 at Buffalo and Stony Brook are in statistical agreement (p > 0.05). The MAE ranges between 1.4 and 1.9 m s−1, and the RMSE ranges between 1.7 and 2.4 m s−1. The slightly larger MAE and RMSE at Stony Brook could be due to the influence of the nearby marine surface layer. Difference errors among sites are within 0.7 m s−1.
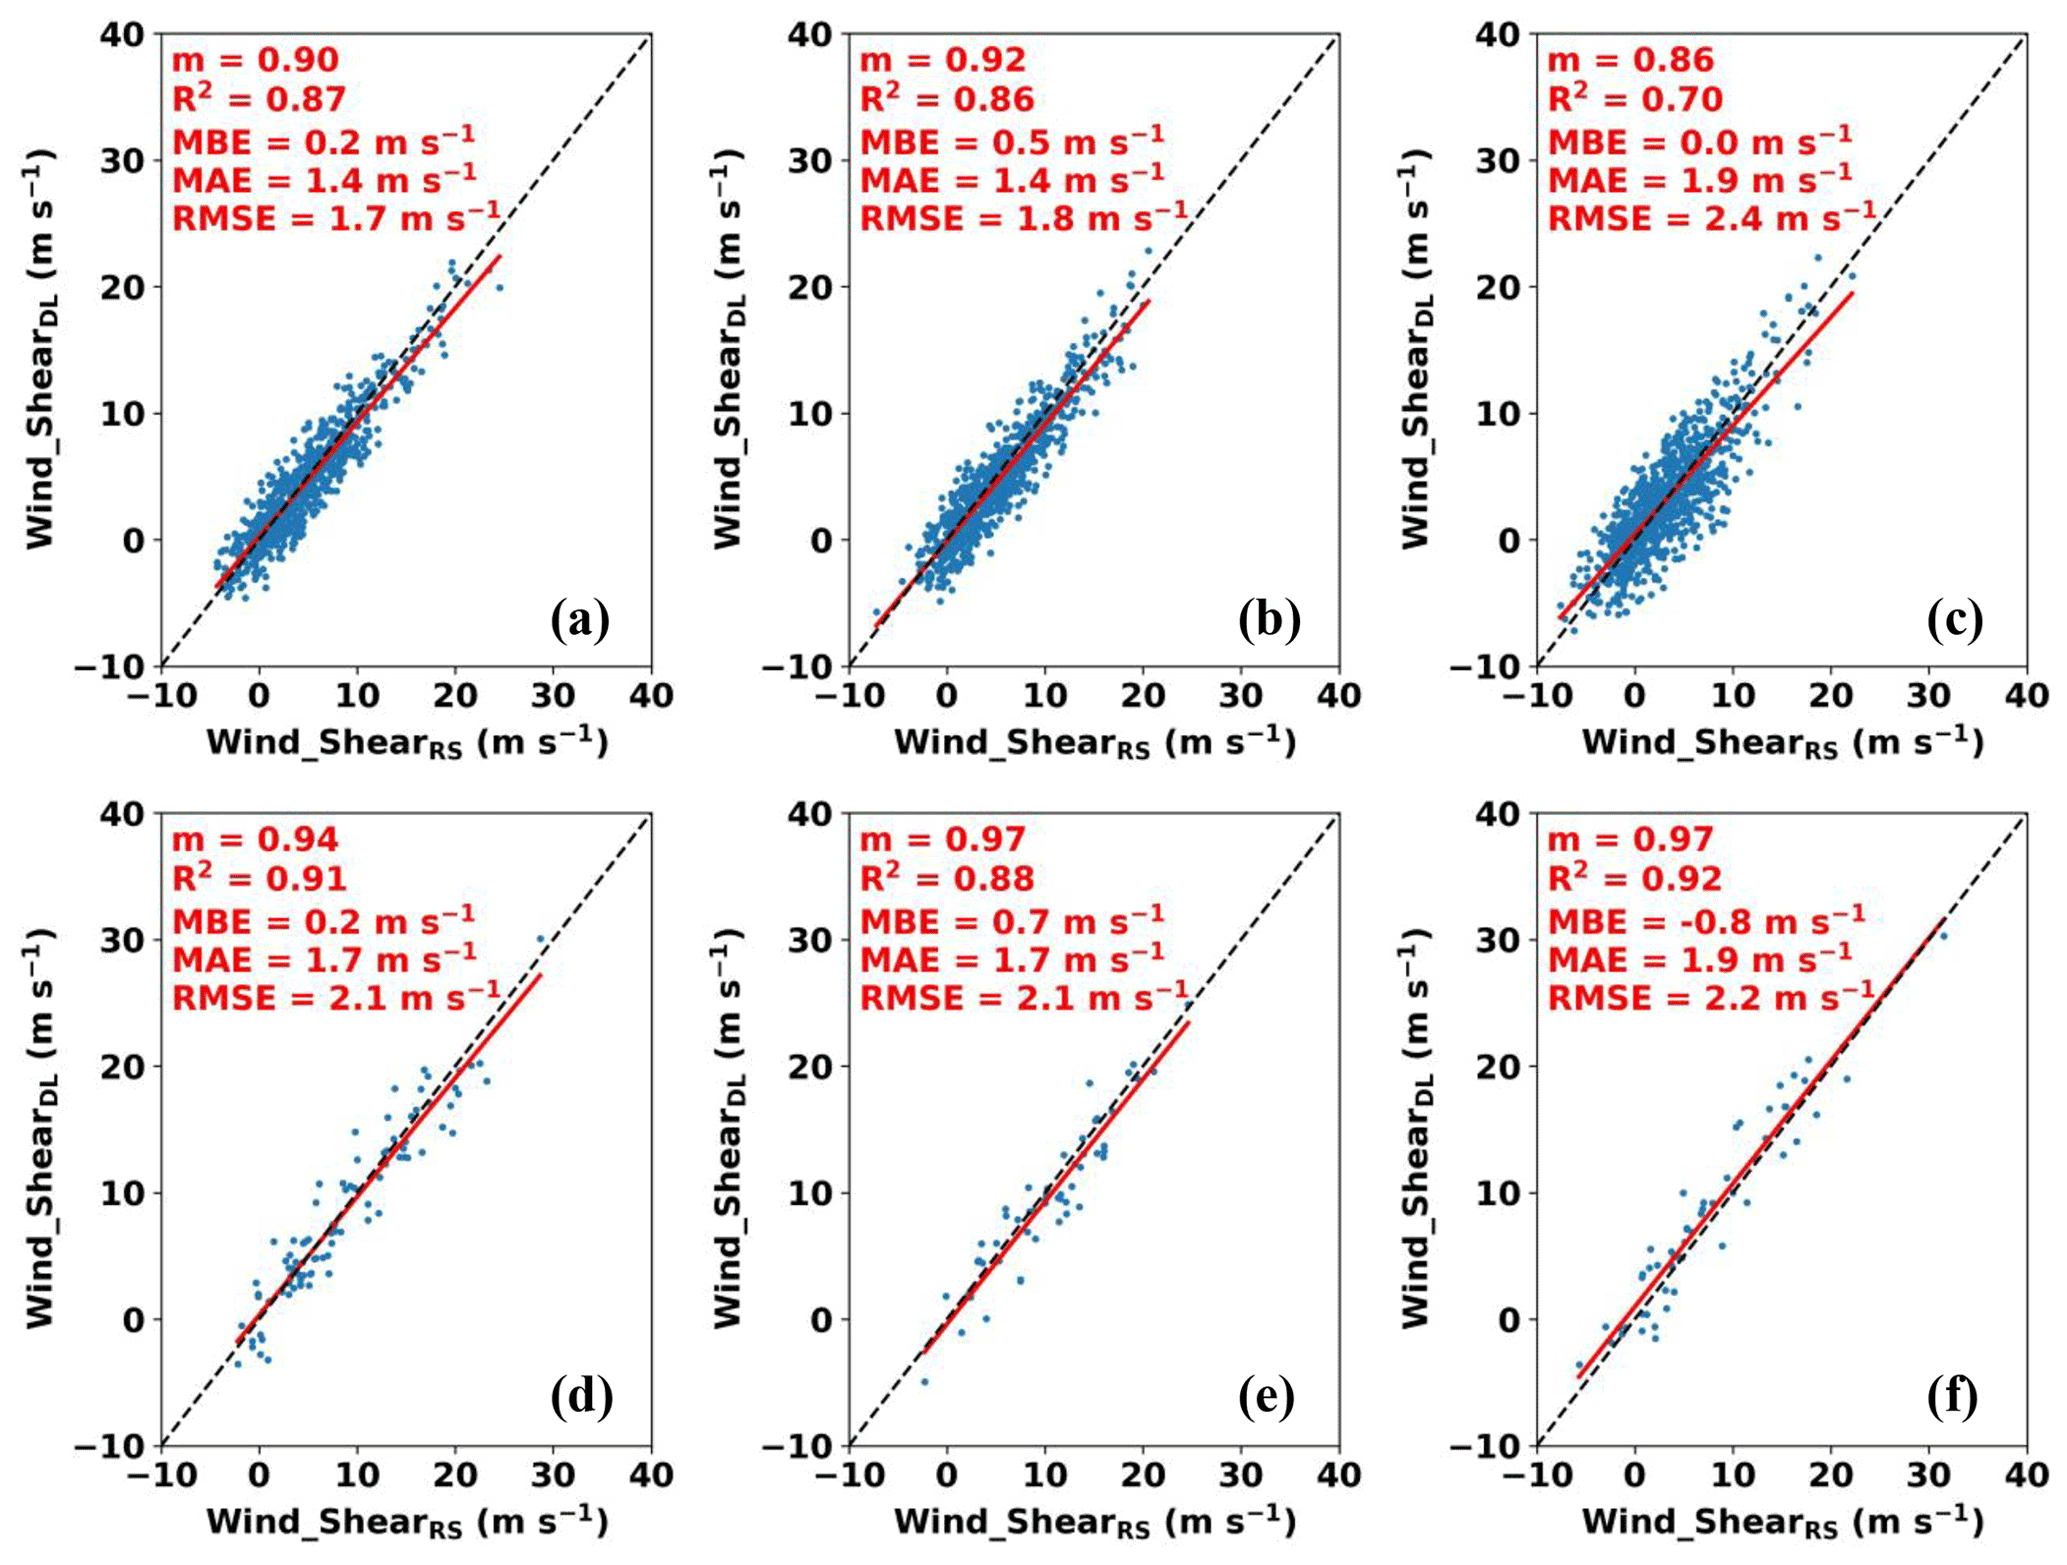
Figure 5Scatterplots for RS- and DL-derived 100 m–1 km wind shear at three NYSM Profiler Network sites at (a) Buffalo, (b) Albany, and (c) Stony Brook and 100 m–3 km wind shear at (d) Buffalo, (e) Albany, and (f) Stony Brook.
A total of 94 (5 %), 54 (3 %), and 57 (3 %) profiles were available at Buffalo, Albany, and Stony Brook for the calculation of 100 m–3 km wind shear. Limited aerosols and attenuation limited the frequency of data availability from the DL at 3 km. The comparison results for the 100 m–3 km wind shear show R2 ≥ 0.88 across all three sites (Fig. 5d–f) with an increase in R2 by 4.6 % (Buffalo), 2.3 % (Albany), and 31.4 % (Stony Brook) when compared to the 100 m–1 km wind shear (Fig. 5a–c). Across three sites, the MBEs are found to be statistically equal to 0 (p > 0.05), and the MAE ranges between 1.7 and 1.9 m s−1, while the RMSE ranges between 2.1 and 2.2 m s−1, with differences among sites limited to within 0.2 m s−1.
For operational use, it is important to note that because of the DL dependency on aerosol concentration and meteorological conditions, the availability of DL data decreases with height, and therefore, the wind measurements at 3km a.g.l. may be relatively limited to obtain. As shown in Fig. 2, the DL data availability at 1 km is above 70 % while at 3 km, is below 10 %.
4.3 Evaluation of MWR data
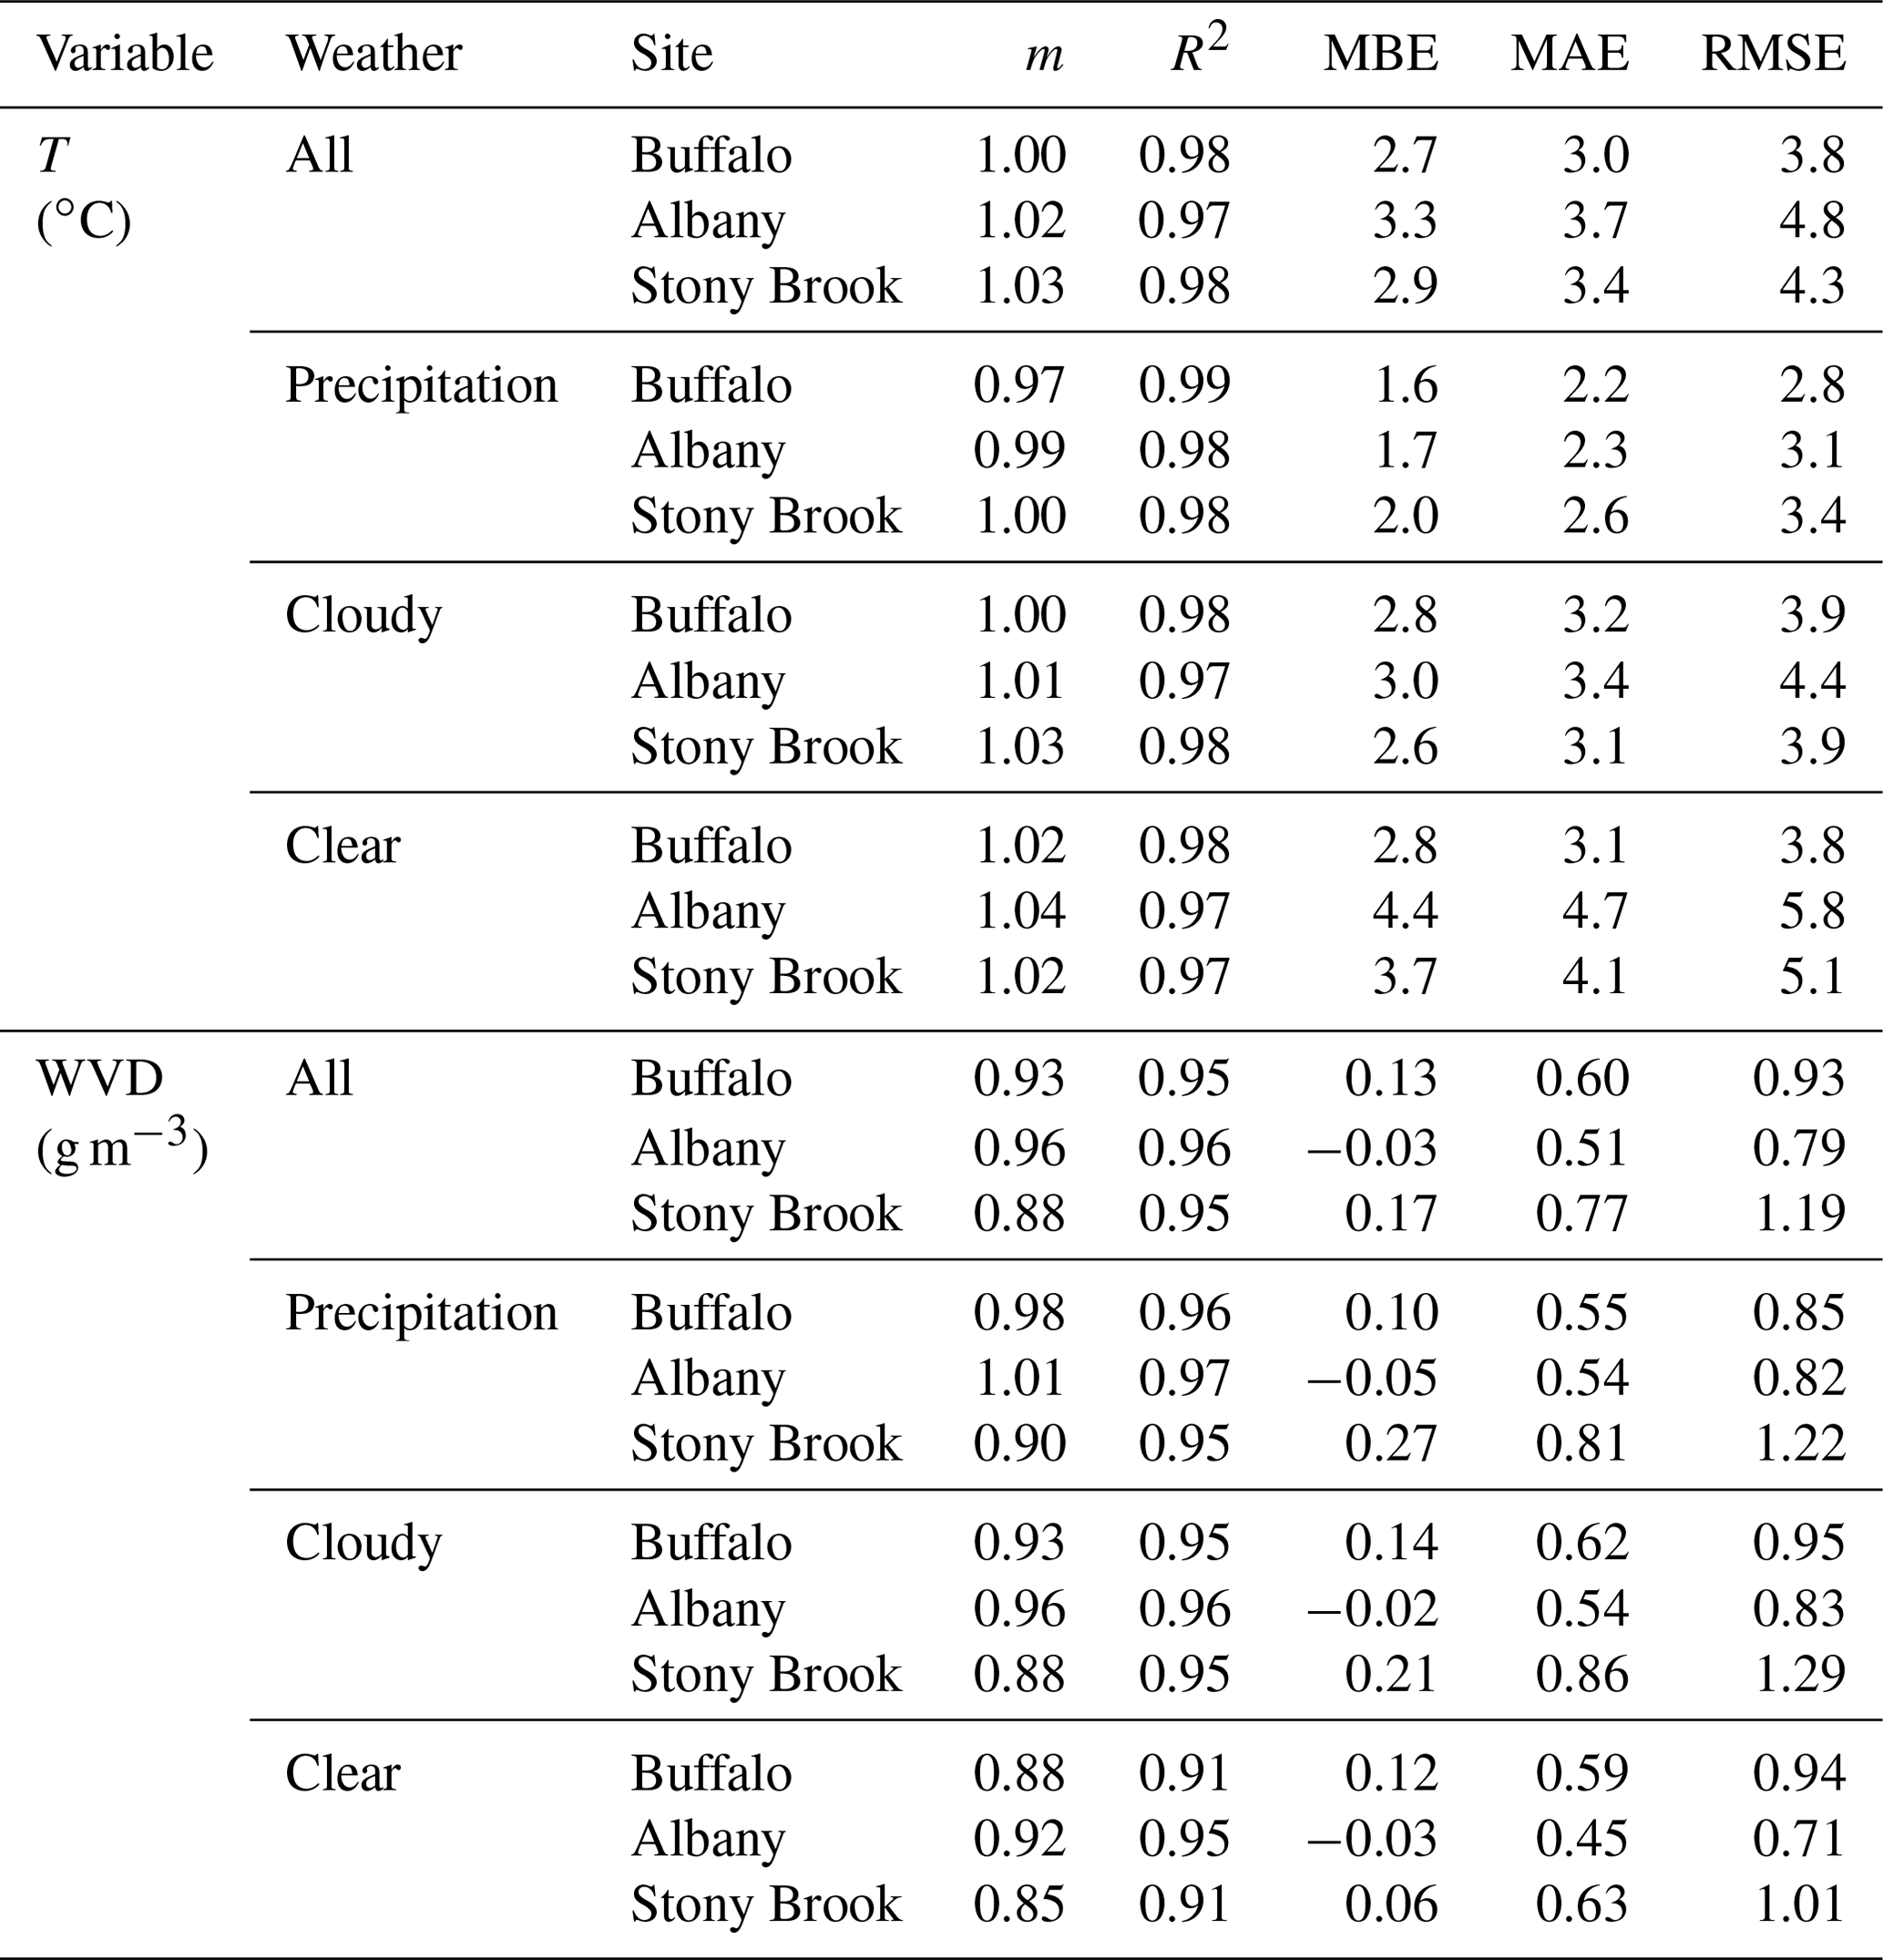
A comparison of temperature (T) from the RS and MWR for three sites shows m ∼ 1 and R2 ≥ 0.97 (Fig. 6a–c). Across the three sites, the MWR shows significant cold biases (positive MBE), with the MBE ranging between 2.7 and 3.3 ∘C. These cold biases are statistically significant (p ≤ 0.05). The MAE ranges between 3.0 and 3.7 ∘C and the RMSE ranges between 3.8 and 4.8 ∘C. Site-to-site error differences are within 1 ∘C, showing consistent behavior by the MWRs in measuring temperature.
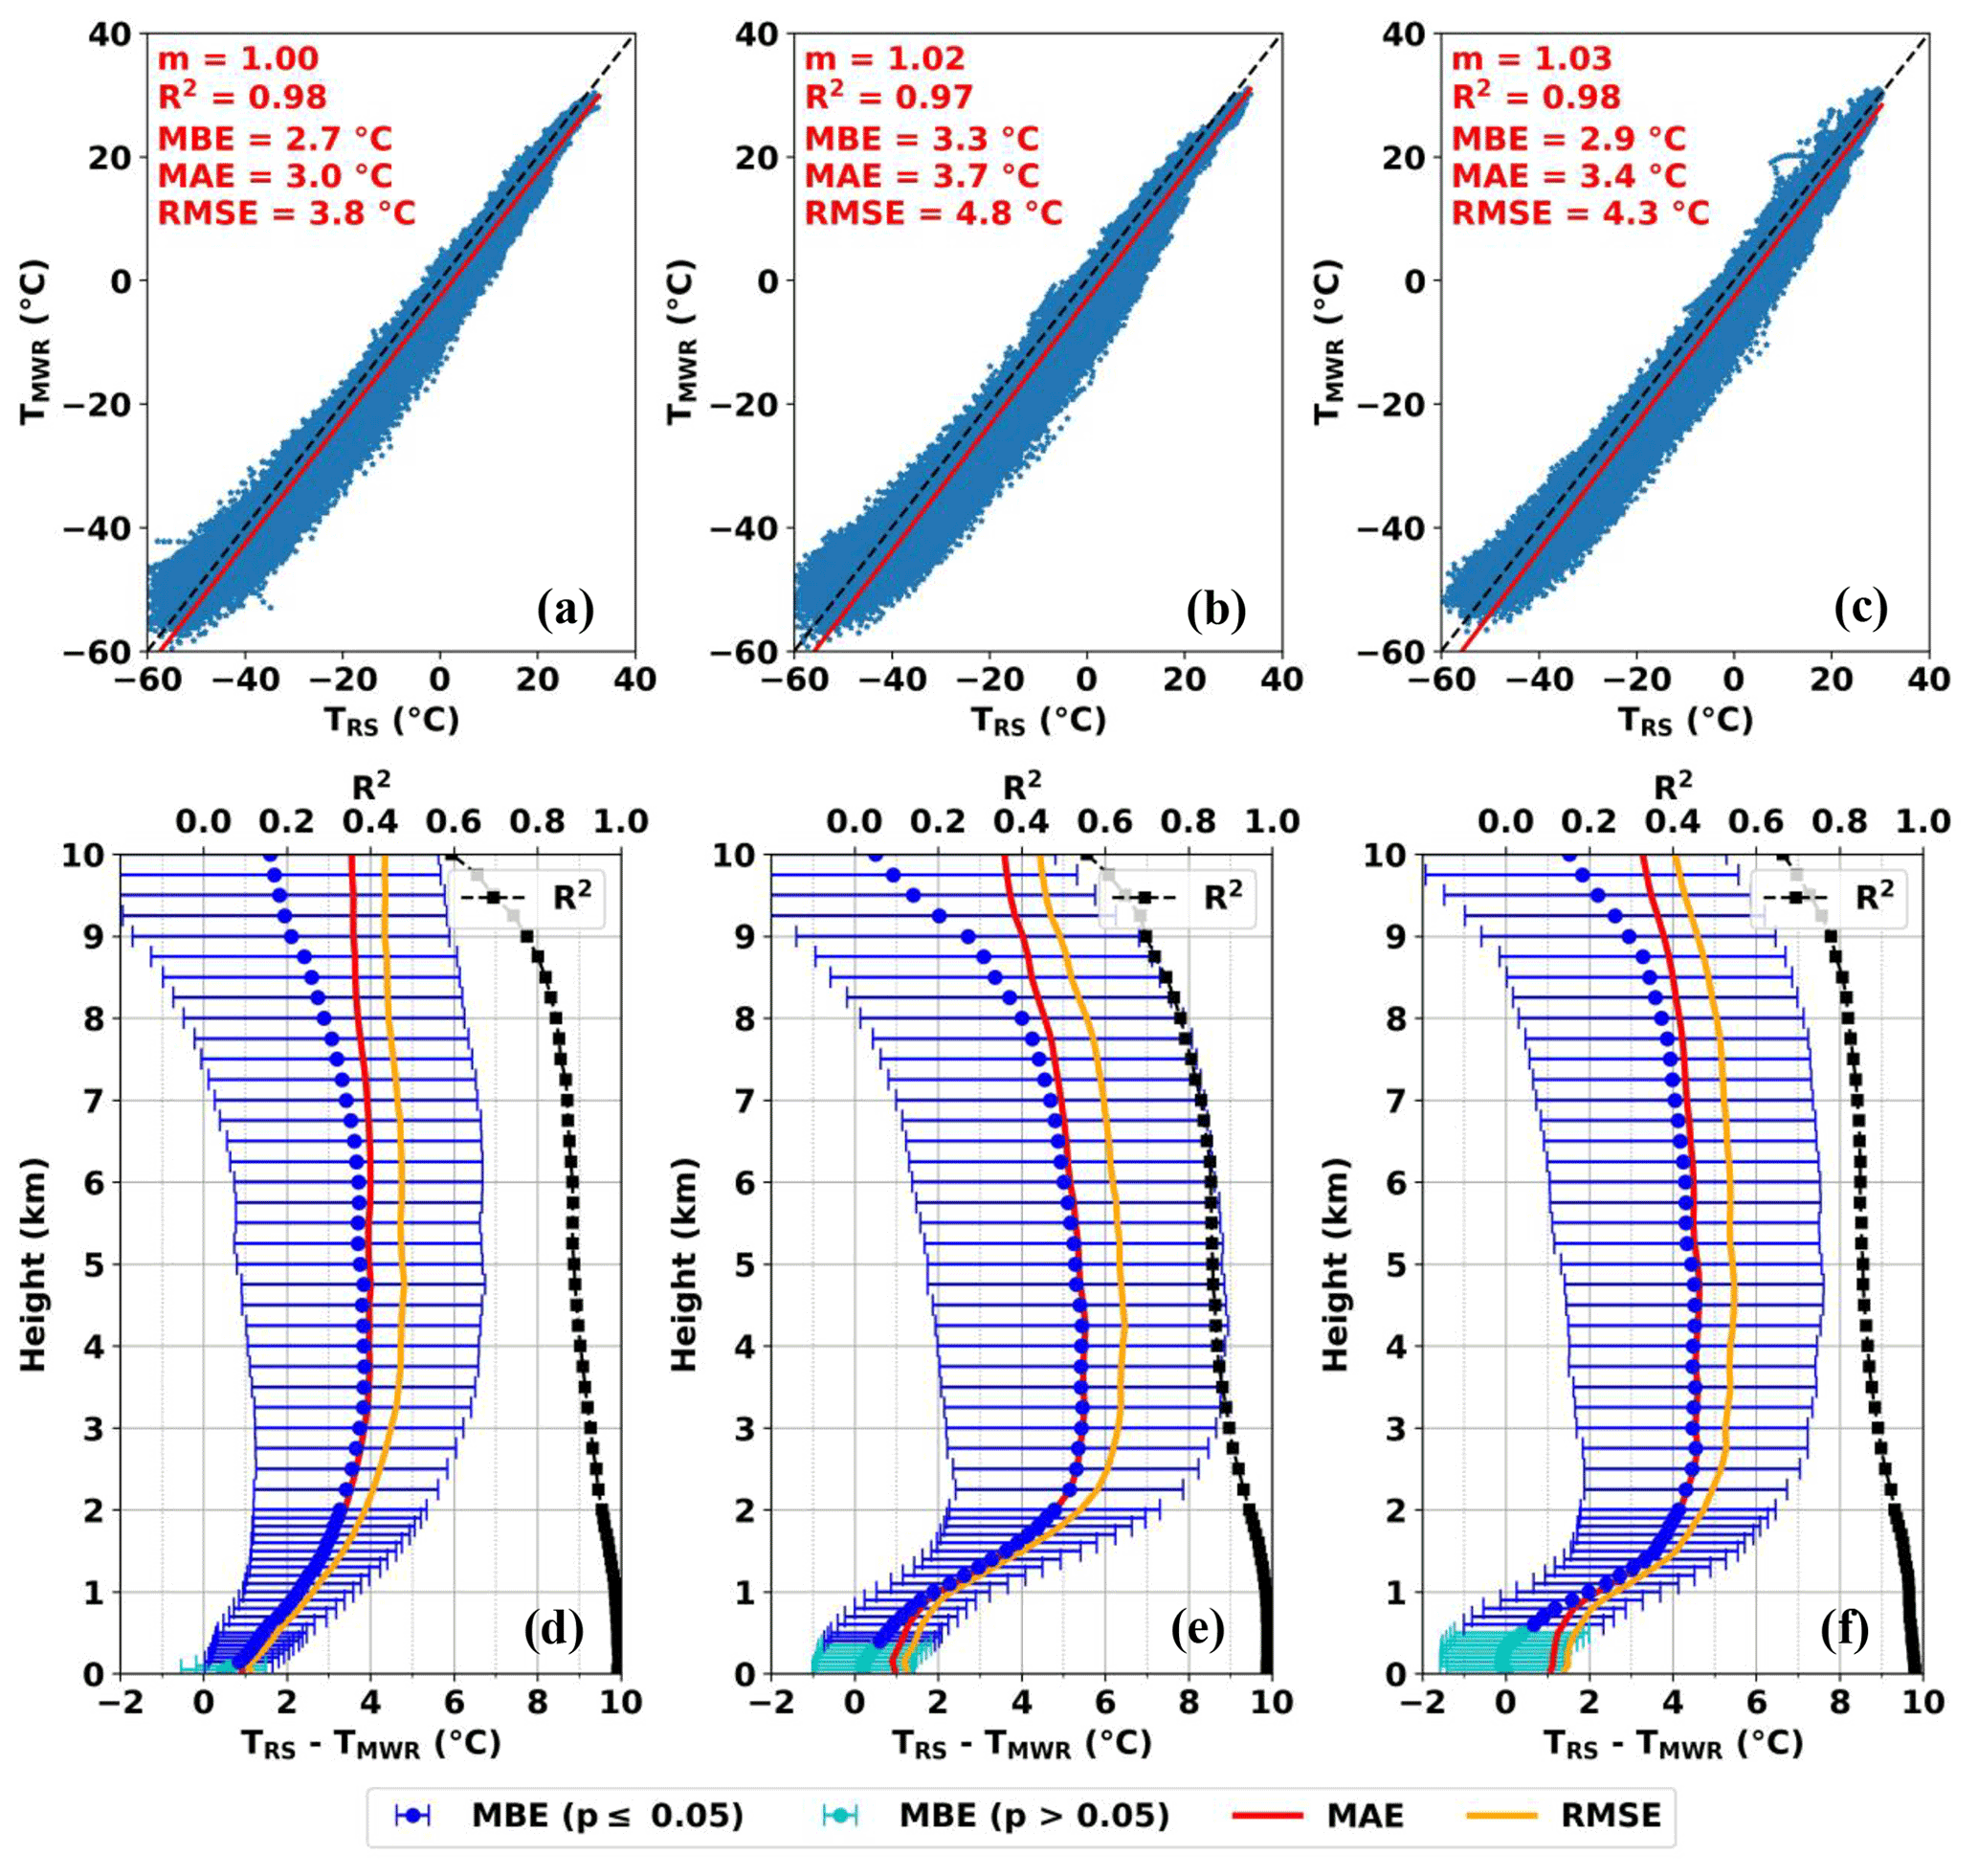
Figure 6Scatterplots for RS- and MWR-measured temperature (T) at three NYSM Profiler Network sites at (a) Buffalo, (b) Albany, and (c) Stony Brook. Vertical profiles of R2, MBE with one standard deviation error bars, MAE, and RMSE for the same variable at (d) Buffalo, (e) Albany, and (f) Stony Brook.
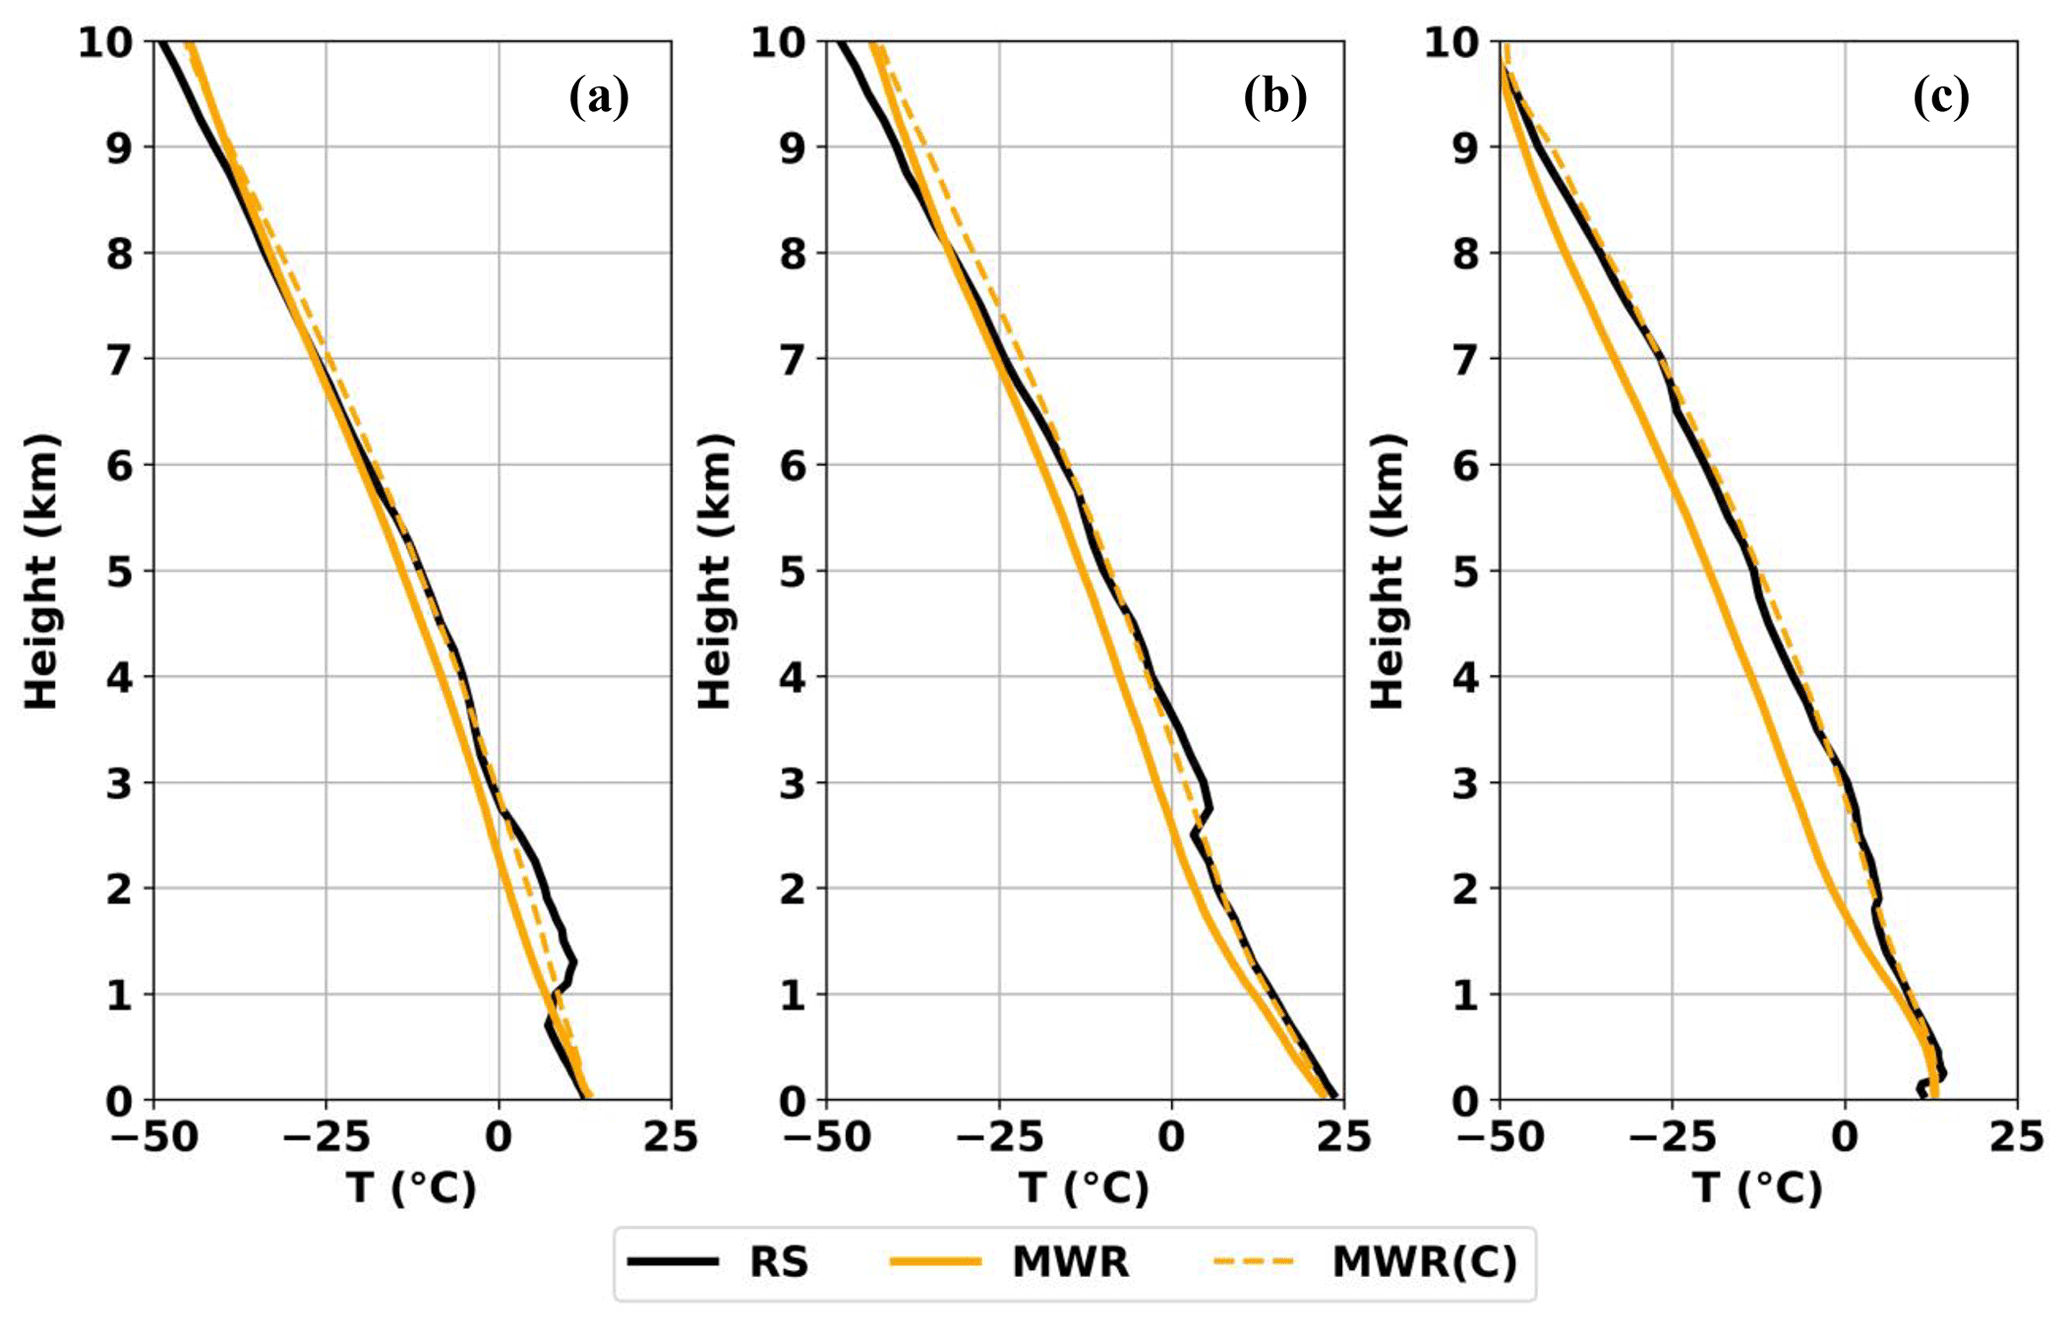
Figure 7Vertical profiles of temperature (T) measured by RS and MWR, original and corrected (C), at (a) 23:00 UTC on 2 May (precipitation day), (b) 23:00 UTC on 28 July (cloudy day), and (c) 11:00 UTC on 2 May 2021 (clear-sky day) at Albany.
Temperature error statistics are presented in Fig. 6d–f as a function of height and show very similar vertical structures from one site to another. All three sites show R2 > 0.90 below 2.5 km and R2 > 0.80 below 7.5 km. The MWR shows cold biases in temperature throughout the profile and are statistically significant (p ≤ 0.05) except for a few lower heights (for clarity at lower heights, please see Fig. S2). The observed cold biases are consistent with previous studies by Cimini et al. (2011, 2015) and Xu et al. (2015). The MBE, MAE, and RMSE increase rapidly within the boundary layer and reach as high as 5.4 ∘C at 2 km. Above 2 km, both MAE and RMSE only vary within ∼ 1 ∘C. RMSEs are > 4 ∘C above 2 km at all three sites and sometimes exceed 6 ∘C (as seen at Albany). In general, the MWR follows the overall vertical temperature structure as measured by the RS; however, the MWR consistently fails to detect the elevated temperature inversion layers such as at ∼ 1 km in Fig. 7a (precipitation day), ∼ 2.5 km in Fig. 7b (cloudy day), and ∼ 1.5 km (clear-sky day) in Fig. 7c. This causes a marked increase in cold biases above the layer. Such cold biases will have significant adverse impacts on operational applications, such as determining precipitation type and forecasting indices that rely upon temperature. Therefore, a simple correction method is developed and discussed in Sect. 4.5 to minimize such cold biases in MWR temperature.
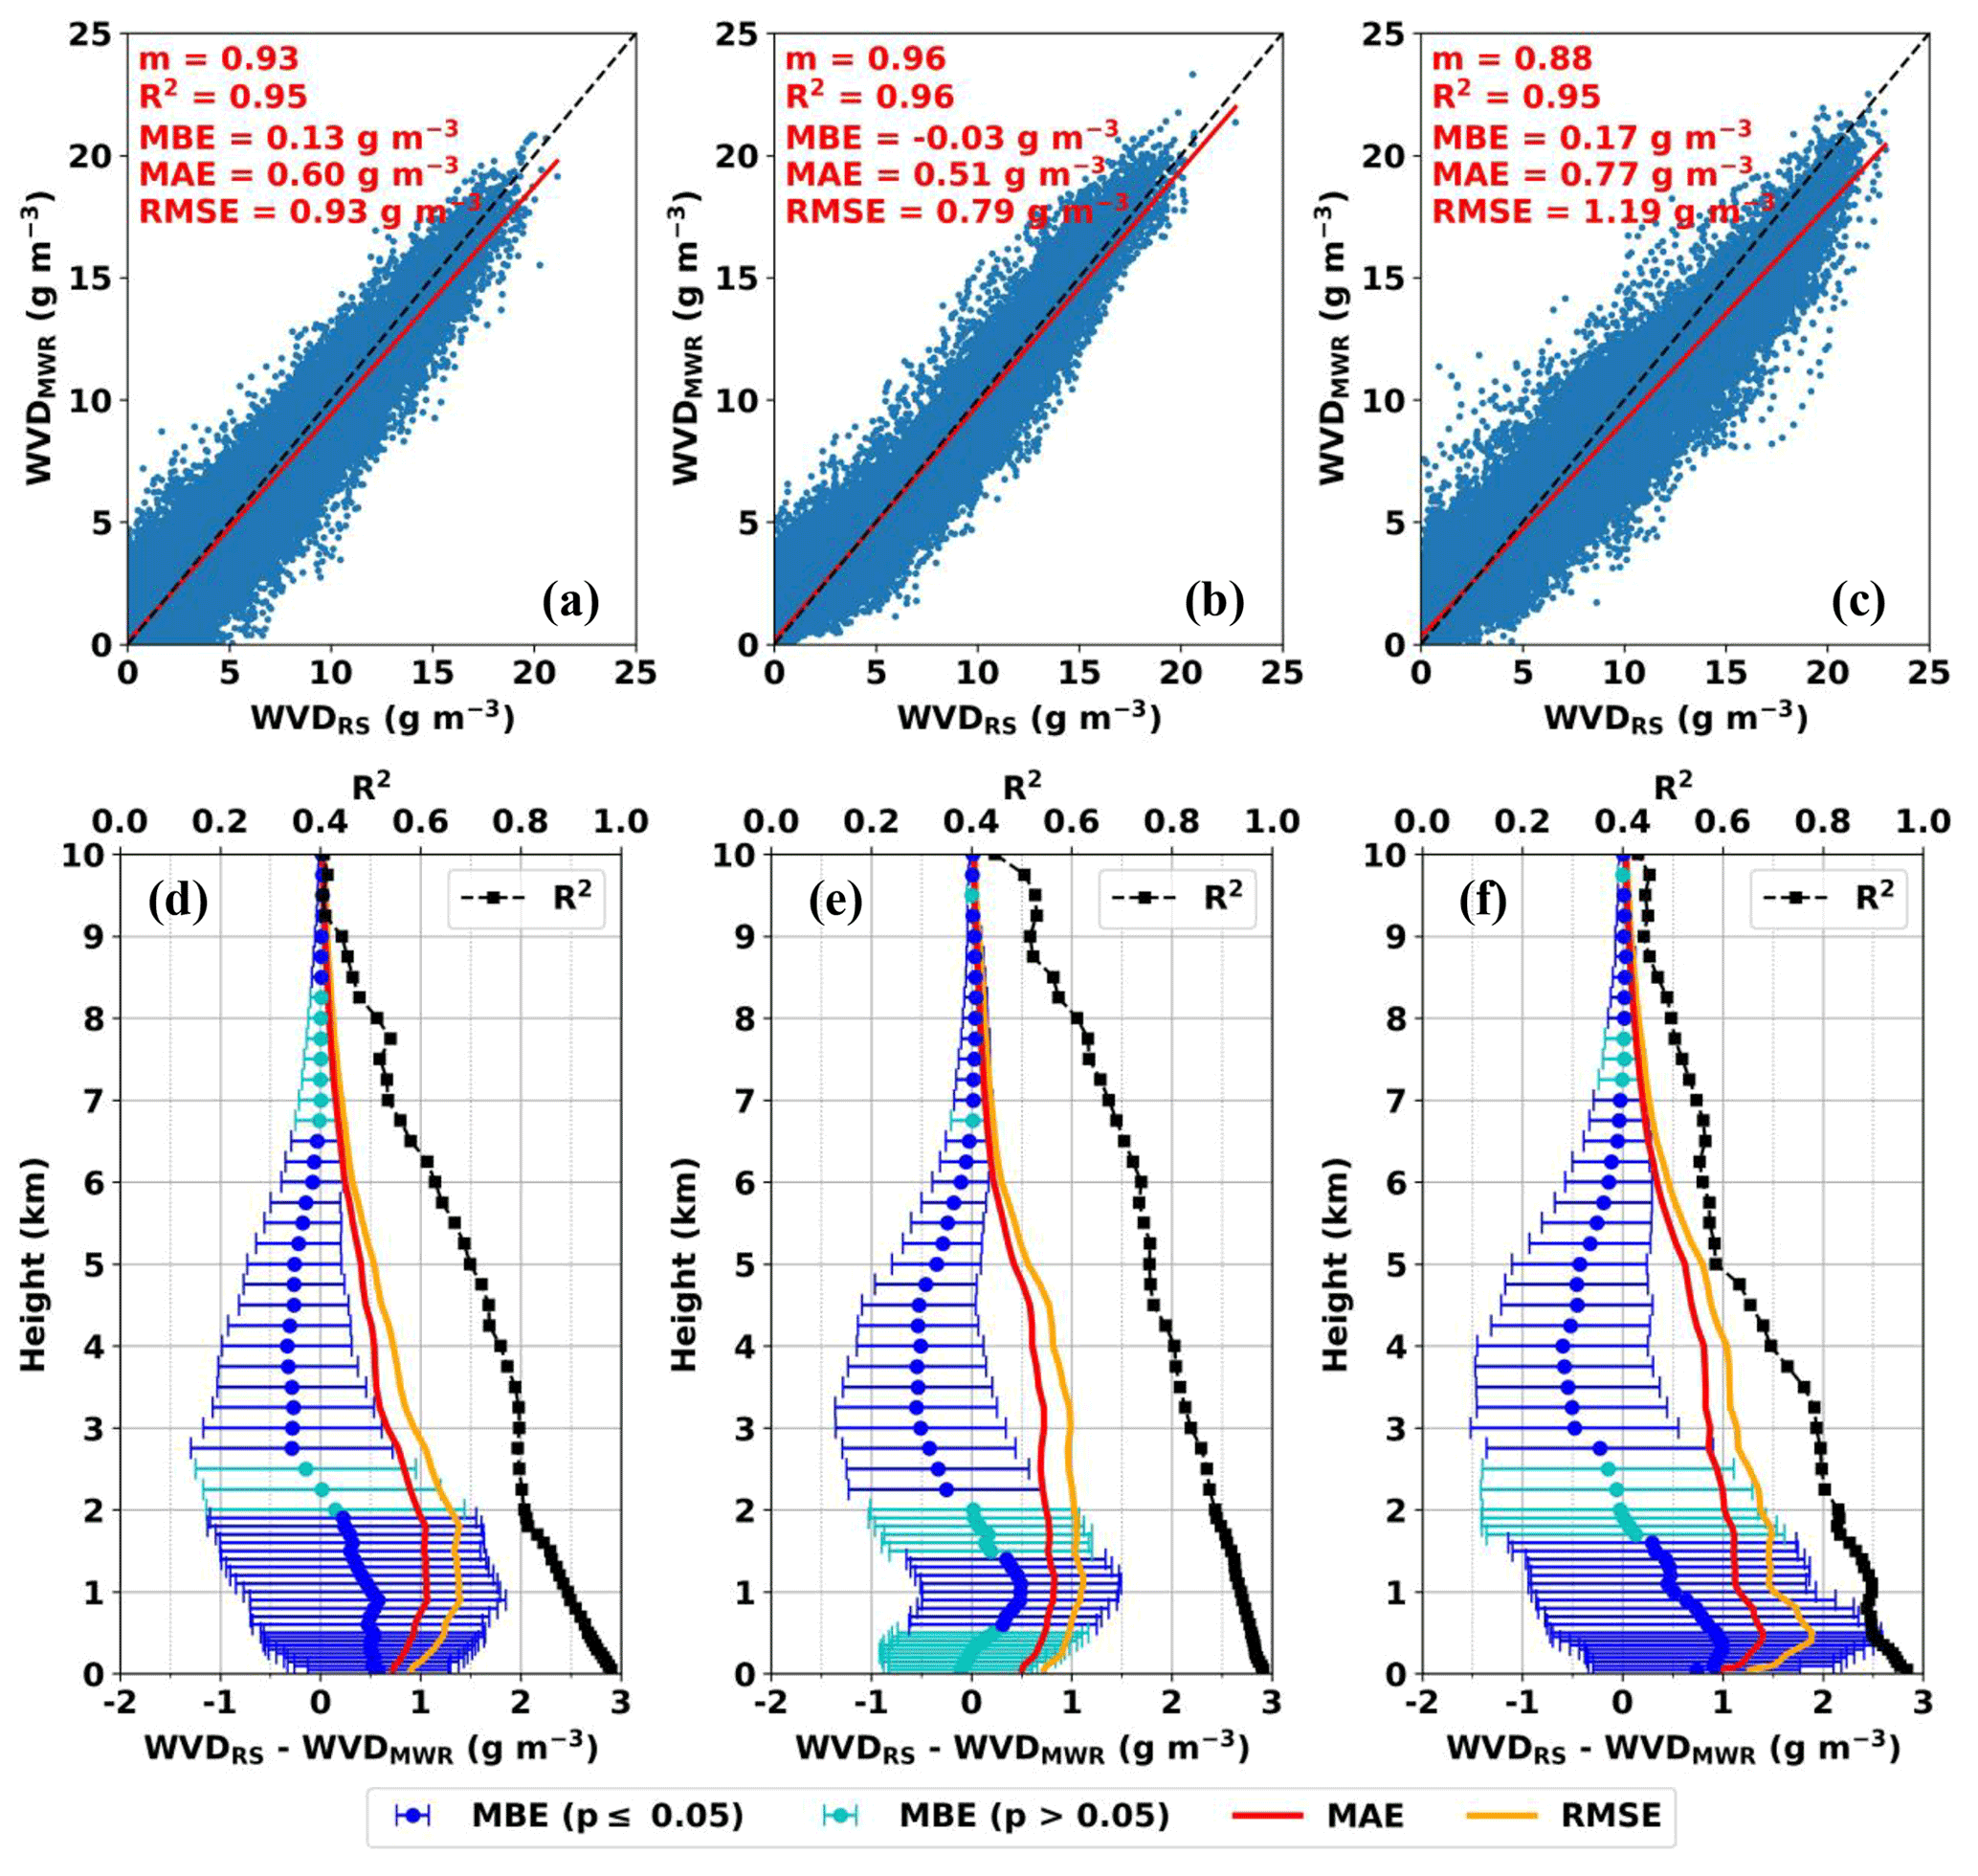
Figure 8Scatterplots for RS- and MWR-measured water vapor density (WVD) at three NYSM Profiler Network sites at (a) Buffalo, (b) Albany, and (c) Stony Brook. Vertical profiles of R2, MBE with 1 standard deviation error bars, MAE, and RMSE for the same variable at (d) Buffalo, (e) Albany, and (f) Stony Brook.
A comparison of water vapor density (WVD) from the RS and MWR is presented in Fig. 8a–c for the three sites. Results show values of m ≥ 0.88 and R2 ≥ 0.95. The MWR results indicate dry biases (positive MBE) at Buffalo and Stony Brook that are statistically significant (p ≤ 0.05), but the low wet bias at Albany is statistically insignificant (p > 0.05). The MAE ranges between 0.51 and 0.77 g m−3, and the RMSE ranges between 0.79 and 1.19 g m−3, with both being higher at Stony Brook. Site error differences vary within 0.40 g m−3, showing spatial consistency in the MWR retrievals.
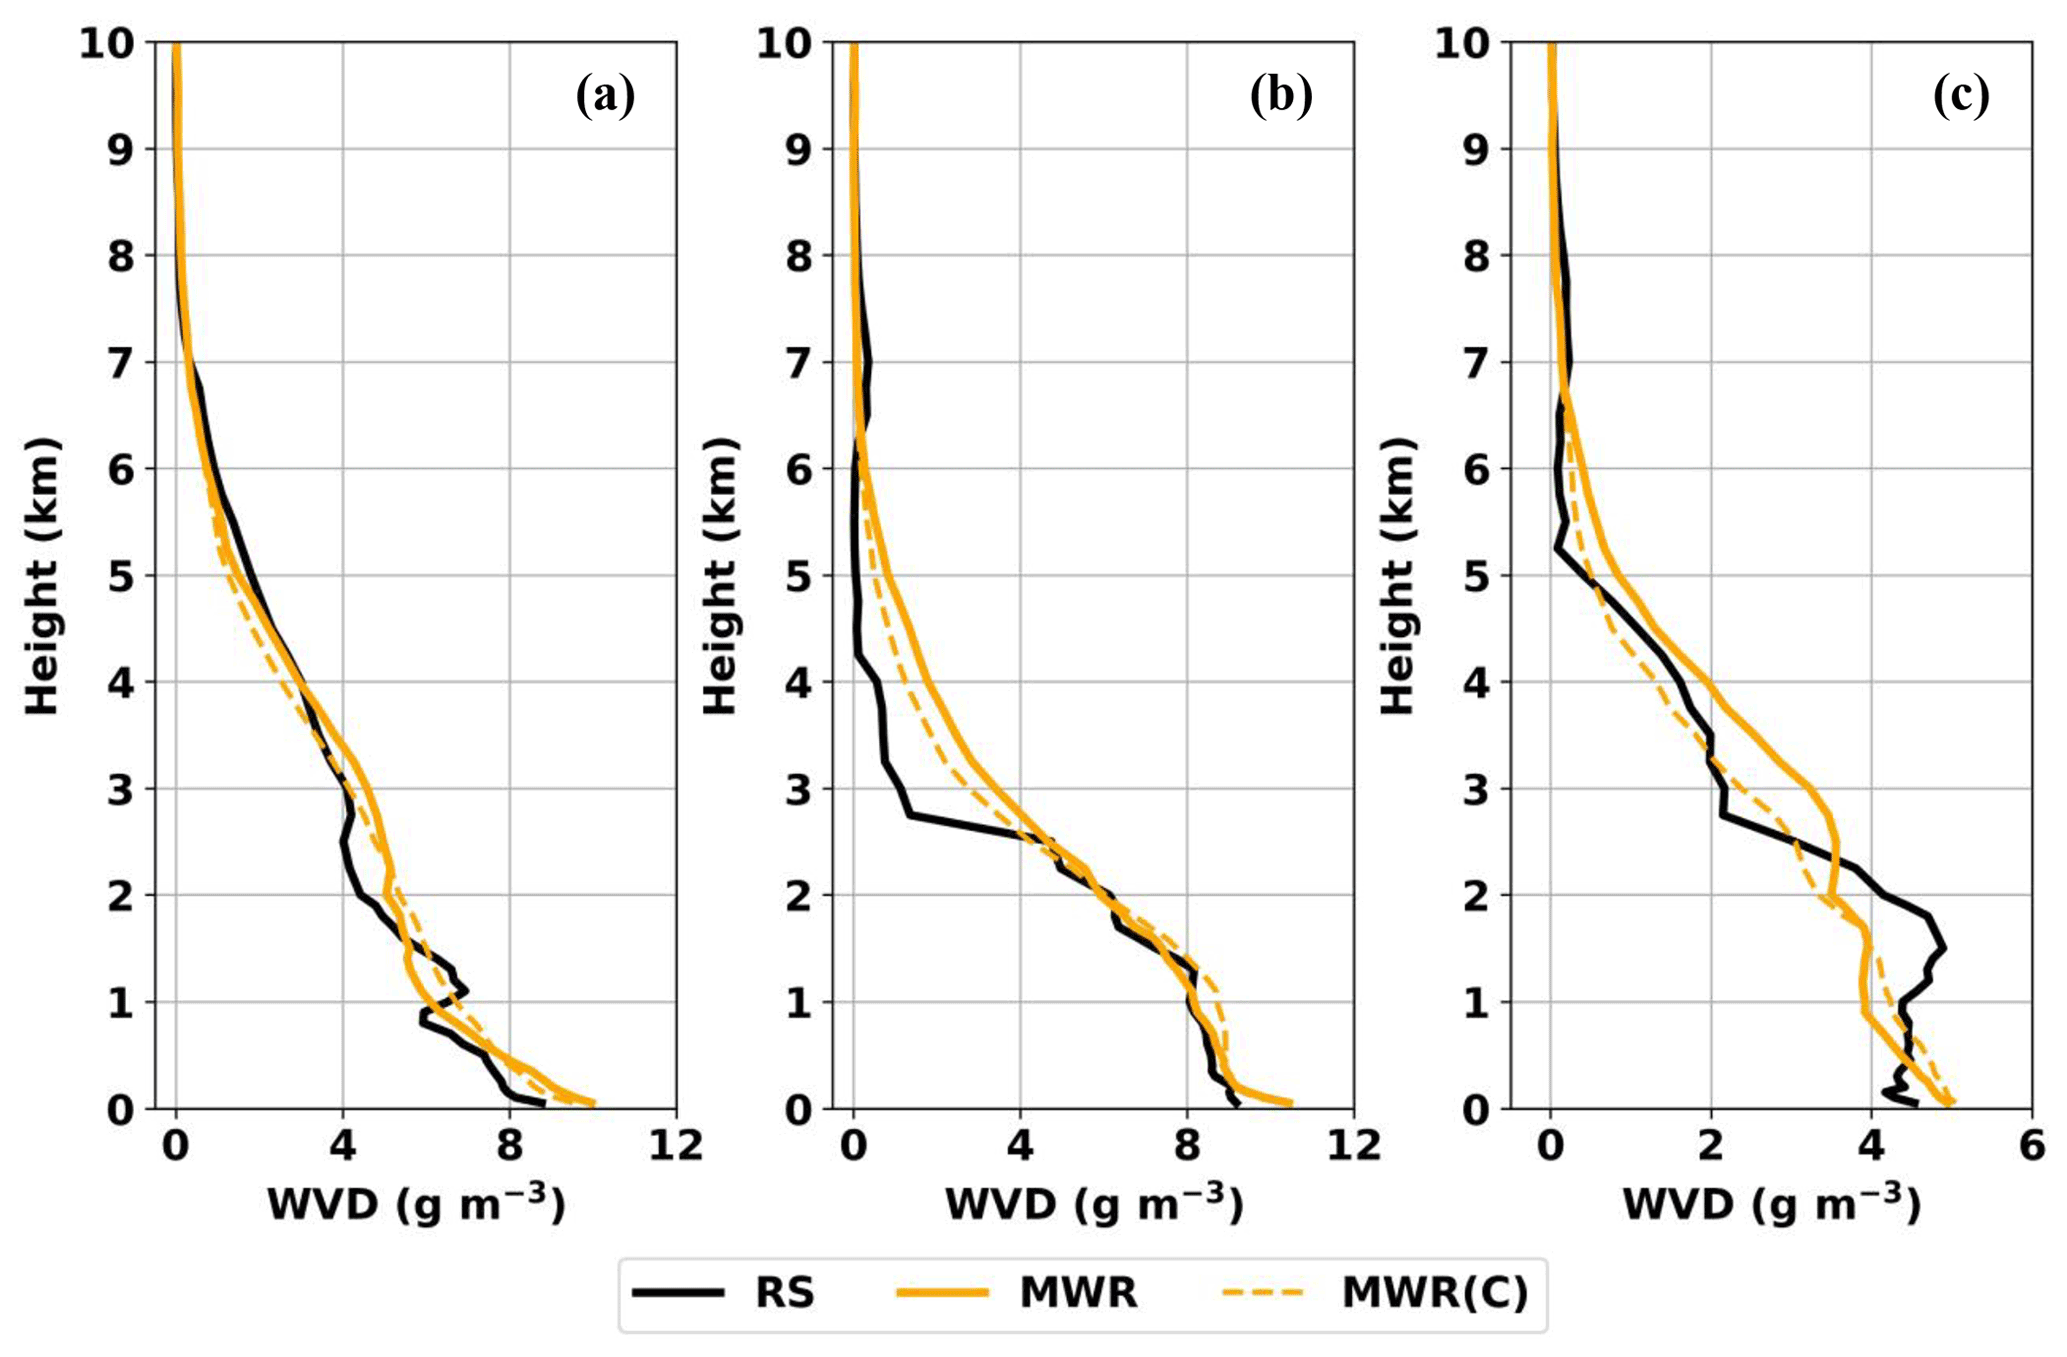
Figure 9Vertical profiles of water vapor density (WVD) measured by RS and MWR, original and corrected (C), at (a) 23:00 UTC on 2 May (precipitation day), (b) 23:00 UTC on 28 July (cloudy day), and (c) 11:00 UTC on 2 May 2021 (clear-sky day) at Albany.
The WVD error and R2 as a function of height is presented in Fig. 8d–f (please see Fig. S3 for clarity at lower heights). The MBEs are mostly statistically significant along the height. The MWR shows a dry bias below ∼ 2 km that changes to a wet biases above ∼ 2 km, with little bias observed above ∼ 6.5 km. Such characteristic changes from dry to wet biases are consistent with Xu et al. (2015). The vertical profiles of MAE and RMSE show values greater than 0.5 g m−3 below 4–6 km and below 0.5 g m−3 above that height, similar to Cimini et al. (2015) and Xu et al. (2015). Typically, errors are found to be largest within ∼ 2 km where the MWR indicates a dry bias, and among the three sites the errors are relatively large at Stony Brook compared to the other two sites, which could be due to the influence of the moisture from the local marine boundary layer. Across three sites, the mean water vapor density values are found to be 7.8–9.3 g m−3 at the surface, 5.5–6.6 g m−3 at 1 km, and 3.9–4.6 g m−3 at 2 km, giving rise to an error (RMSE/mean) of 9 %–14 % at surface, 20 %–25 % at 1 km, and 26 %–33 % at 2 km, with an overall error of 17 %–23 % below 2 km. The R2 decreases with height, with R2 ≥ 0.90 below 1 km and R2 ≥ 0.80 below 3 km across all three sites. The MWR tends to follow the general trend of the vertical structure of the WVD as measured by the RS; however, it consistently fails to capture the high-resolution vertical details, primarily due to its coarser resolution (Fig. 9a–c).
In summary, the RS- and MWR-measured temperature and water vapor density are strongly correlated across the three sites, with R2 only varying by 1 % from one site to another. Both temperature and water vapor density biases are found to be statistically significant. Temperature comparisons are found to be in better agreement at lower altitudes than at higher altitudes. This could be likely be due to the v-band weighting function peaking near the surface that rapidly fades along the height (Westwater, 1993; Cimini et al., 2011) and the fact that the temperature information is usually concentrated within lowest few kilometers in the boundary layer (Hewison, 2007). In contrast, the water vapor density comparisons show better results at higher altitudes than at lower altitudes. This may be because of the highly variable moisture field within the boundary layer and not much water vapor content above the boundary layer. Overall, the observed errors (mainly temperature) between the RS and MWR data could be mainly due to error inherent to the instrument and calibration uncertainty, as our self-test revealed the significant brightness temperature biases that were consistent with Hewison (2007) and Ware et al. (2013). It is reported by Löhnert and Maier (2012) and Illingworth et al. (2019) that the significant brightness temperature biases are observed immediately following liquid nitrogen calibration. Similarly, poor neural network performance due to the larger distance between the MWR and RS site and possibly the large RS drift distances, as discussed in Sect. 3, could also influence the observed errors. Nevertheless, the MWR exhibits consistent behavior across three sites with similar site-to-site error statistics showing the robustness of the instrument across different weather conditions and geographical locations. A summary of comparison statistics for the MWR data is presented in Table 4.
Table 4Comparison statistics between radiosondes and MWR data based on weather condition from January 2018 to August 2021.
4.4 Evaluation of MWR data collected during different weather conditions
Since the MWR is designed to perform during all types of weather conditions, the accuracy of the MWR data is analyzed separately for precipitation, cloudy, and clear-sky days. The MWR is equipped with a precipitation sensor that detects any precipitation over the MWR radome and provides a status flag of 0 for no precipitation and 1 for precipitation. The MWR is also equipped with an infrared radiation thermometer (IRT) that measures the cloud base temperature. The cloud base height (CBH) is set to the lowest height where the cloud base temperature is equal to the retrieved temperature profile (Ware et al., 2003). Therefore, a CBH > 0 represents a cloudy condition, CBH of −1 represents clear-sky conditions, and CBH of 0 represents fog or precipitation. It is important to note that the classification of three weather conditions is based on the observations of IRT pointing zenith, and thus an assumption is made that this classification still holds true for off-zenith observations since the average of two off-zenith values pointing in opposite directions are used in this study. Therefore, it is possible that this assumption will lead to some limitations and uncertainties when classifying three weather conditions using off-zenith retrievals.
A total of 234, 280, and 330 profiles were selected for precipitation days at Buffalo, Albany, and Stony Brook. Similarly, 1305, 1272, and 790 profiles were selected for cloudy days, while 472, 808, and 635 profiles were selected for clear-sky days at the respective sites. The overall statistical results between the RS- and MWR-measured temperature and water vapor density under precipitation, cloudy, and clear-sky days are presented in Table 4.
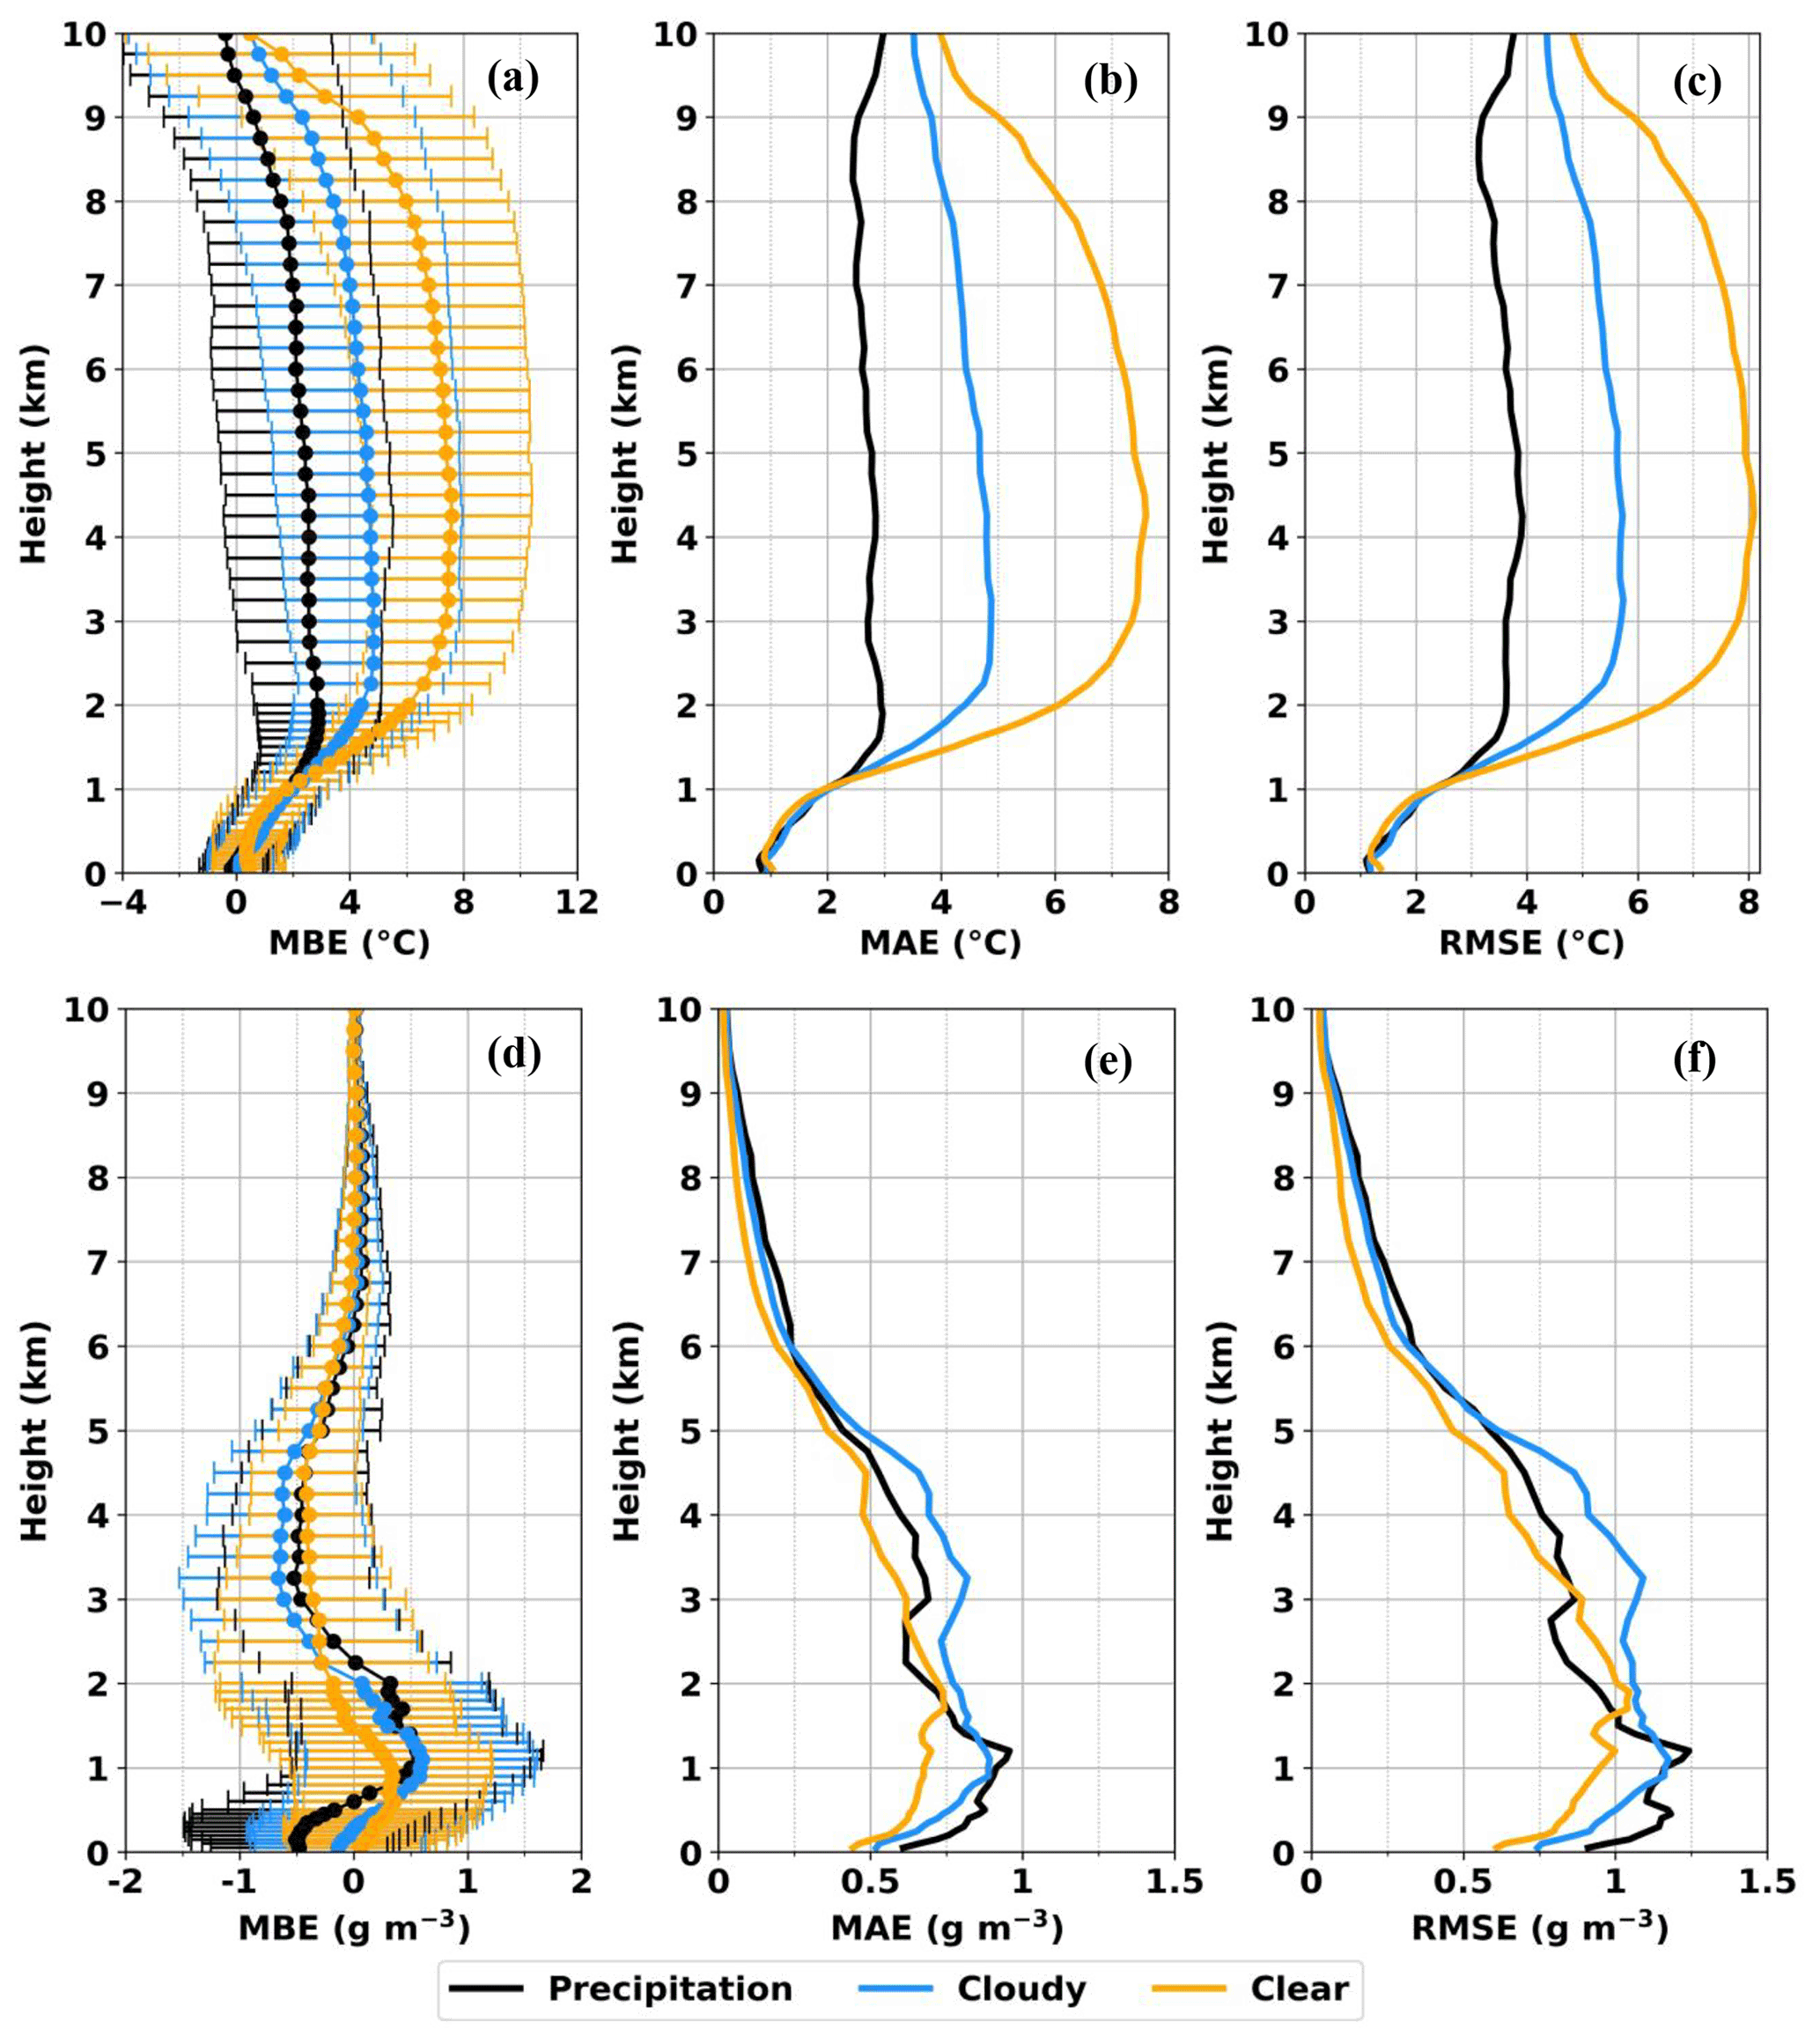
Figure 10Vertical profiles of MBE with 1 standard deviation error bars, MAE, and RMSE for (a–c) temperature and (d–f) water vapor density during three weather conditions from the NYSM Profiler Network site at Albany.
Temperature comparisons show high correlation with R2 ≥ 0.97 and are within 1 % when compared across different weather conditions and sites (Table 4). Precipitation days have the lowest MBE, MAE, and RMSE, while the clear-sky days have the greatest errors (at Buffalo, clear-sky and cloudy-day errors are nearly identical, only differing within 0.1 ∘C). Cold-temperature biases are observed during all three weather conditions across all three sites and are statistically significant (p ≤ 0.05). Clear-sky day errors are greater than those from the precipitation days by 0.9–2.7 ∘C, whereas the cloudy day errors are greater than those from the precipitation days by 0.5–1.3 ∘C. Along the profile, errors are similar below 1 km and are mostly within 2 ∘C, regardless of weather conditions (Fig. 10a–c, as a representative only Albany site shown, for clarity at lower heights, please see Fig. S4a–c). Above 1 km, the errors are at their maximum but lowest on precipitation days and highest on clear-sky days. The MWR temperature cold biases are clearly evident in the example profiles shown in Fig. 7a–c, which are much more pronounced during clear-sky days (Fig. 7c) than cloudy (Fig. 7b) and precipitation days (Fig. 7a). The larger cold biases during cloudy days than precipitation days are consistent with the results by Cimini et al. (2011), whereas the larger cold biases during clear-sky days than the cloudy days are consistent with the results by Xu et al. (2015). It is speculated that the better temperature accuracies during precipitation and cloudy days than clear-sky days could be due to the temperature profiles trending towards the moist adiabat and reduced temperature inversions.
For water vapor density, precipitation days have the highest R2 and clear-sky days have the lowest R2 (Table 4), similar to that for temperature. The R2 values between precipitation and cloudy days are nearly identical (within just 1 %), but precipitation and clear-sky days vary by 2 %–5 %. The largest errors occur on cloudy days and the lowest on clear-sky days, with an exception at Buffalo where the lowest errors occur on precipitation days. All weather condition errors vary within 0.1 g m−3 at Buffalo but up to 0.28 g m−3 between cloudy and clear-sky days at Albany and Stony Brook. Larger errors are expected during cloudy or precipitation days due to the higher variability of moisture in the clouds. Under all weather conditions, dry biases are observed at Buffalo and Stony Brook that are statistically significant (p ≤ 0.05), whereas a low wet biases are observed at Albany that are statistically insignificant. The error profiles for water vapor density during precipitation and cloudy days show similar values and are relatively high compared to those observed during clear-sky days (Fig. 10d–f, for clarity at lower heights, please see Fig. S4d–f). The relatively low errors in the MWR water vapor density during clear-sky days compared to cloudy days are also reported in Xu et al. (2015). The MWR-measured water vapor density profiles are smooth and lack high-resolution vertical details regardless of the weather conditions (Fig. 9a–c).
In summary, the MWR is found have varying performance under different weather conditions, particularly above 1 km for temperature and below ∼ 5 km for water vapor density. The temperature errors are largest during clear-sky days, whereas water vapor density errors are largest during the precipitation and cloudy days. Such discrepancies in the errors could be due to shifting of rapidly fading weighting function during different weather conditions apart from known calibration and neural network issues and an ill-posed MWR retrieval technique.
4.5 Correction to MWR biases
A simple correction method is developed and applied to the MWR data to minimize the biases in MWR retrievals as noted in Sect. 4.3 and 4.4. This method utilizes a linear regression fit between MWR and RS data as a function of height and is calculated and applied separately for temperature and water vapor density during three different weather conditions. Therefore, a best-fit linear model is developed at every height level for both variables separately for precipitation, cloudy, and clear-sky days. For each weather condition, the available pairs of MWR and RS profiles from January 2018 to August 2021 were divided and randomly selected into training datasets containing 75 % of profiles and testing datasets containing the remaining 25 % of profiles. A 10-fold cross-validation process was performed using the training dataset at each height. The mean statistics from the cross-validation were then used to develop the best-fit height-dependent linear model. The model was then applied to correct the MWR profiles from the testing datasets and compared against the corresponding RS profiles.
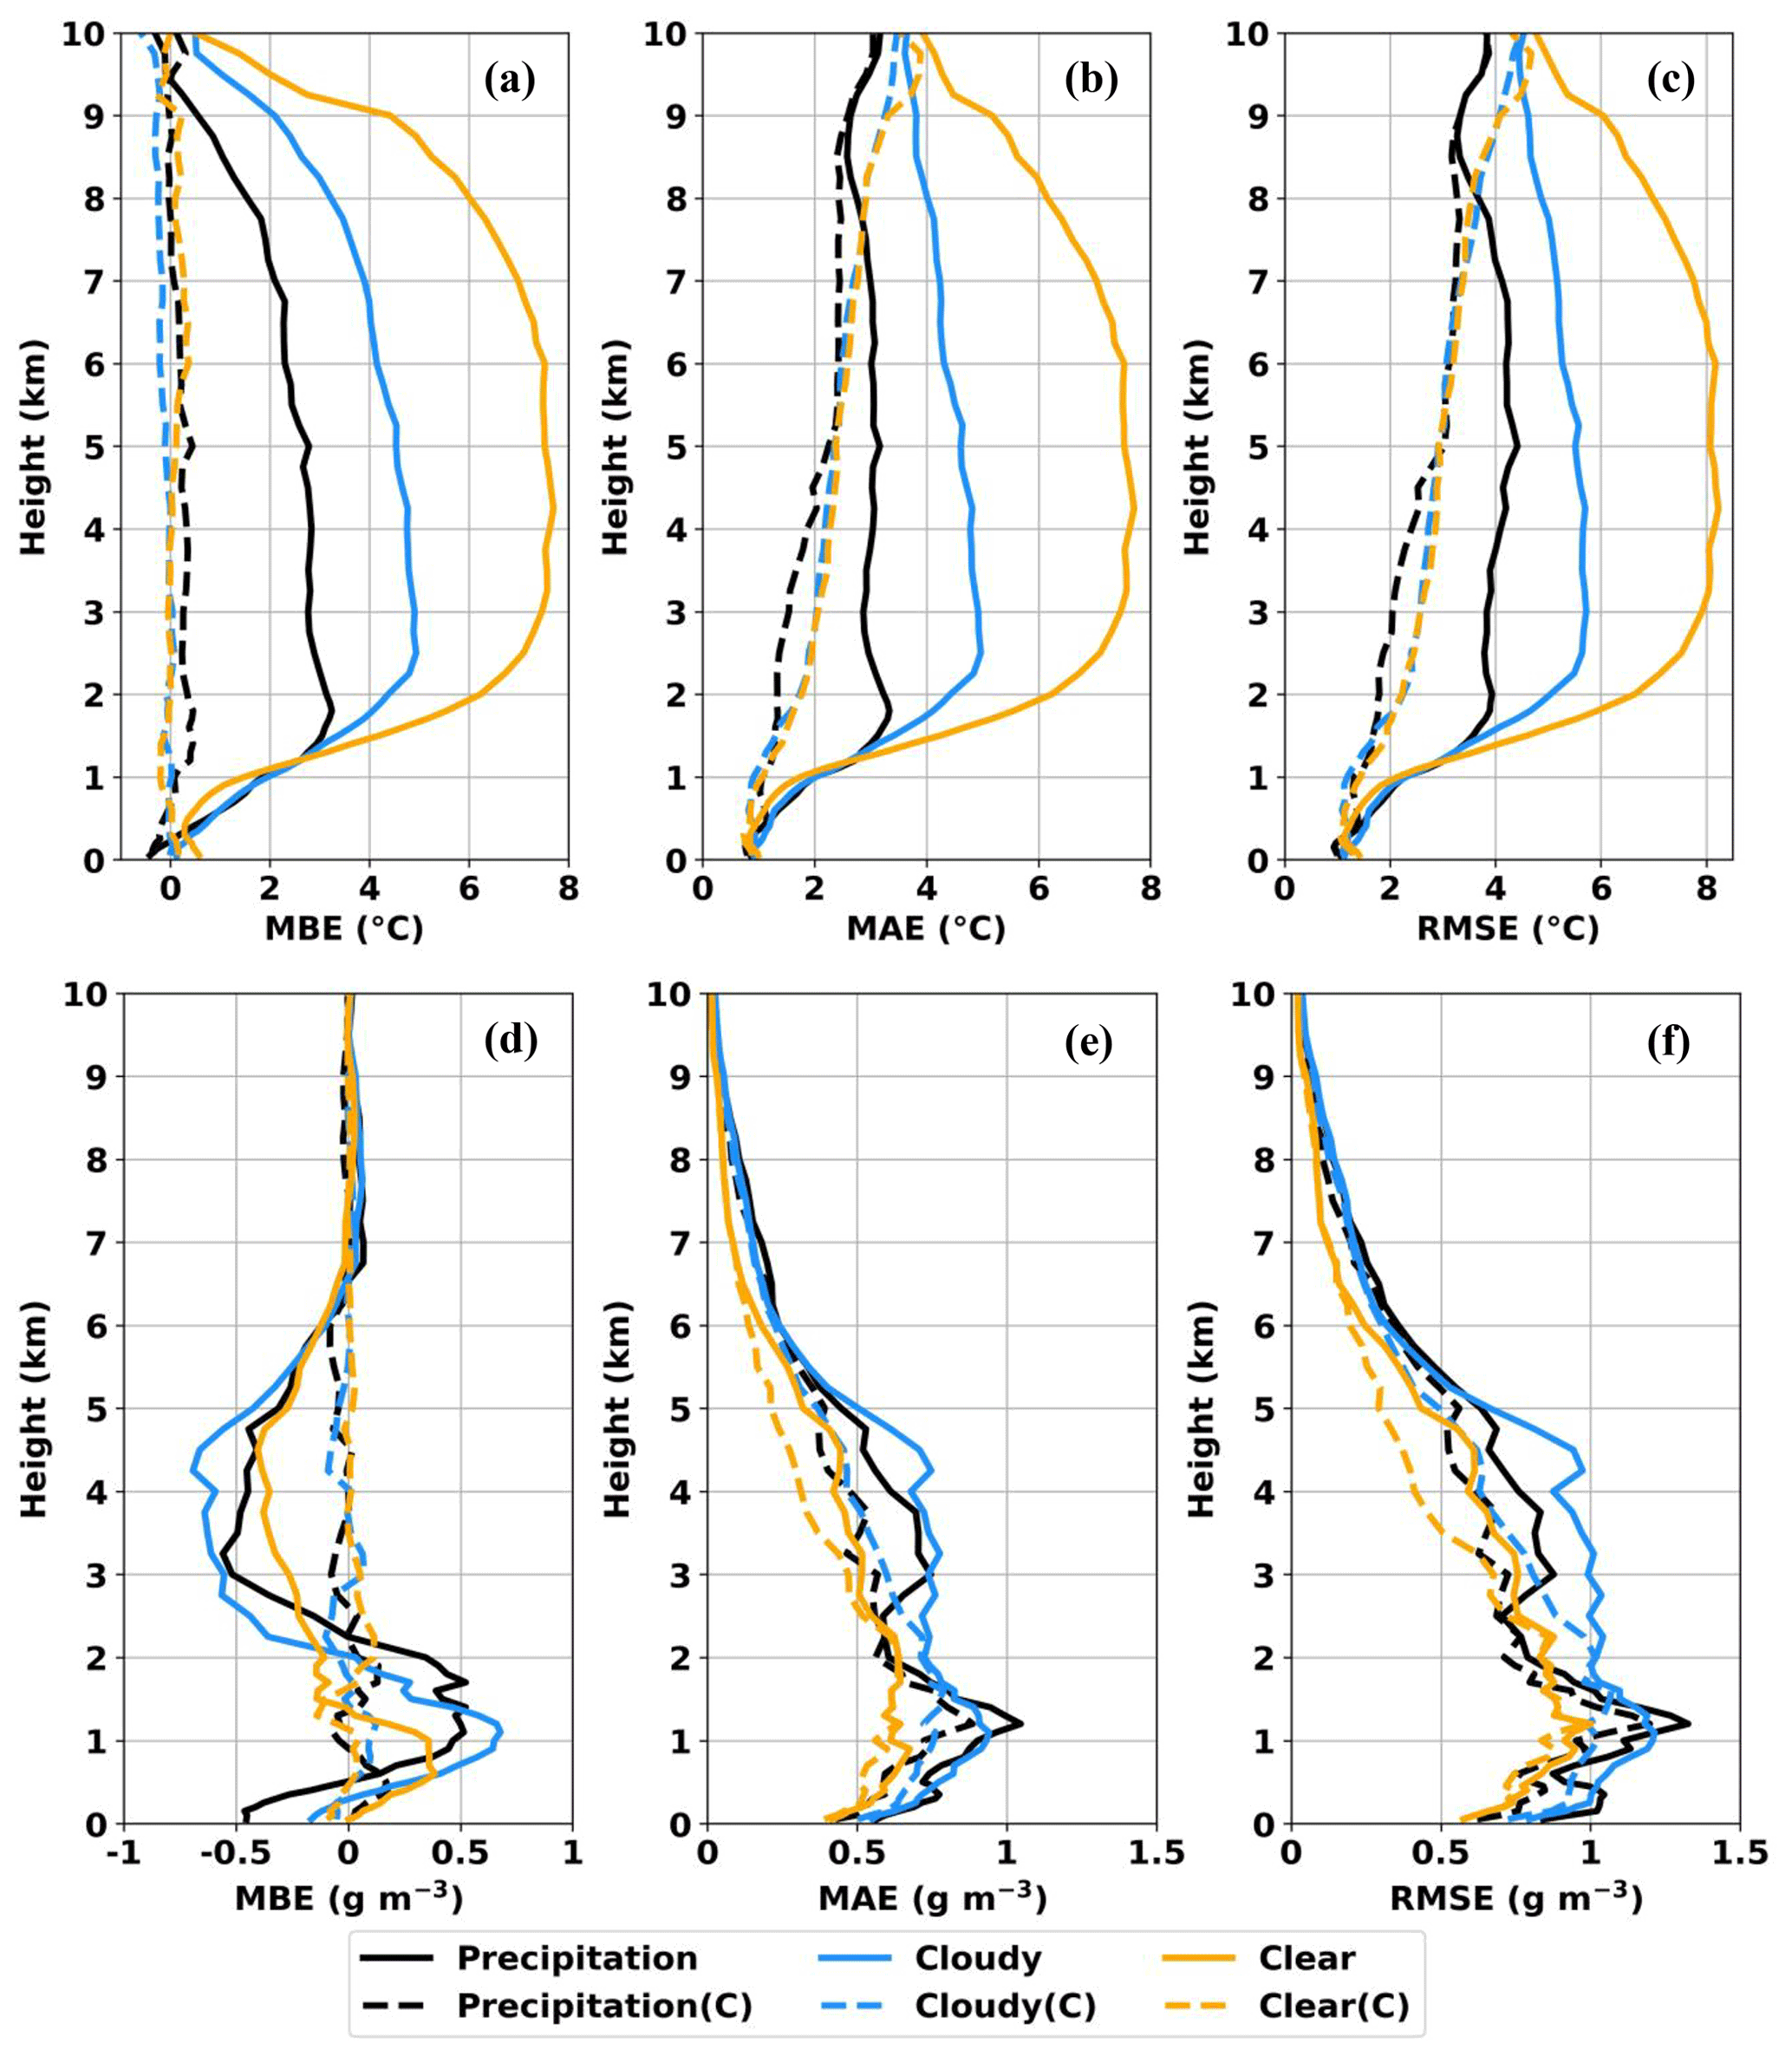
Figure 11Vertical profiles of MBE, MAE, and RMSE for original and corrected (C) MWR-measured (a–c) temperature and (d–f) water vapor density during three weather conditions from the NYSM Profiler Network site at Albany.
The error statistics between the RS and MWR data from the testing dataset, both original and corrected (C), during three weather conditions are presented in Fig. 11a–f (as a representative only the Albany site shown). Error is minimized at each height during all three weather conditions. For temperature, MBE(C) is close to 0 and both MAE(C) and RMSE(C) decrease significantly for all three weather conditions (Fig. 11a–c). Unlike MAE and RMSE, both MAE(C) and RMSE(C) increase monotonically with height, although absolute values were much more improved. As with temperature, the MBE(C) profiles for water vapor density showed significant improvement with the correction for all three weather conditions (Fig. 11d); however, the MAE(C) and RMSE(C) showed little improvement with height (Fig. 11e–f), which again could be due to the fact that the MWR-measured water vapor density profiles are smooth and lack the vertical details that the RS is able to capture with its higher vertical resolution (examples shown in Fig. 9). In summary, this simple linear regression correction method helps to reduce systematic biases in the MWR data, which is much more pronounced in temperature than the water vapor density profiles. This is also evident through the corrected individual profiles shown in Fig. 7 (temperature) and Fig. 9 (water vapor density). Furthermore, our results have shown that limited clear-sky RS data are found to be helpful to reduce biases in MWR retrievals and that MWR need not be colocated near an operational NWS RS site. Nevertheless, while this correction method shows improvement in the MWR retrievals, perhaps an alternate, more robust method would be to apply a bias correction to the MWR brightness temperature directly before applying the retrieval methodology, as was done in Löhnert and Maier (2012); however, this is beyond the scope of this paper.
4.6 Evaluation of MWR-derived thermodynamic indices
In this section, thermodynamic indices derived from the RS and MWR are examined. For this evaluation, only corrected MWR profiles from the selected testing dataset from Sect. 4.5 were used to compute the 14 independent thermodynamic parameters listed in Sect. 3. The corrected profiles significantly reduce biases of the parameters that are mostly statistically insignificant. On average, R2 increases by 7 % and MAE and RMSE decrease by 21 %. The comparison results presented in Table 5 show all the MWR-derived corrected parameters are in good agreement with those derived from the RS with R2 ≥ 0.55. Except for TT (all sites), meanRH (ps–700 hPa, both at Buffalo), and (θes–θe) at 850 hPa (Stony Brook), all other parameters show R2 ≥ 0.70. The TPW (R2 = 0.99), THTK (ps–850 hPa, R2 ≥ 0.97), and THTK (ps–500 hPa, R2 ≥ 0.93) are the highest correlated parameters. Among the four single-level indices (KI, LI, SI, and TT), LI shows the best results with the highest R2 ≥ 0.90 and the lowest MBE, MAE, and RMSE (≤ 3.0 ∘C) across the three sites. While R2 for TT is the worst among the four single-level indices, the MAE and RMSE are the highest for KI. The biases for the derived parameters are mostly statistically insignificant (p > 0.05) except for meanRH (ps–700 hPa), (θes–θe) at 850 hPa and THTK (ps–850 and ps–500 hPa).
Table 5Comparison statistics of thermodynamic parameters between radiosonde and corrected MWR data.

∗ MBE values in parentheses represent values from the original data.
Overall, thermodynamic indices derived from the RS and corrected MWR are well correlated. Thus, the real-time forecasting parameters obtained from the MWR can be a valuable tool to forecasters during high-impact weather events, which is otherwise not possible with typical twice-daily RS data. In addition, having the NYSM Profiler Network also provides opportunities for combining DL winds and MWR thermodynamic profiles to derive valuable parameters like bulk Richardson number (Rib) and planetary boundary layer (PBL) height. The utility of the network to derive and evaluate those parameters is a part of another study.
4.7 A case study of a thunderstorm event
A thunderstorm event is examined using the thermodynamic and wind shear parameters derived from the MWR and DL. On 12 August 2021, the National Weather Service reported a severe thunderstorm at Albany from 14:40 to 15:30 LT with heavy rainfall of 26.4 mm h−1 and maximum wind gust of 26.8 m s−1. Figure 12 shows the temporal variations of temperature, vapor density, liquid density, and relative humidity from the MWR and CNR from the DL overlaid with wind barbs from 09:00 to 19:00 LT. A sharp increase in vapor density between 1000 and 800 hPa (Fig. 12b), liquid density between 900 and 600 hPa (Fig. 12c), and relative humidity up to 500 hPa (Fig. 12d) are observed shortly after 14:00 LT. Similarly, the wind speed within the lowest 1 km a.g.l. doubles (10–15 to 25+ knots or 5.1–7.7 to 12.9+ m s−1) from 14:00 to 15:00 LT (Fig. 12e) with a change in wind direction from southerly and southwesterly to mostly northwesterly.
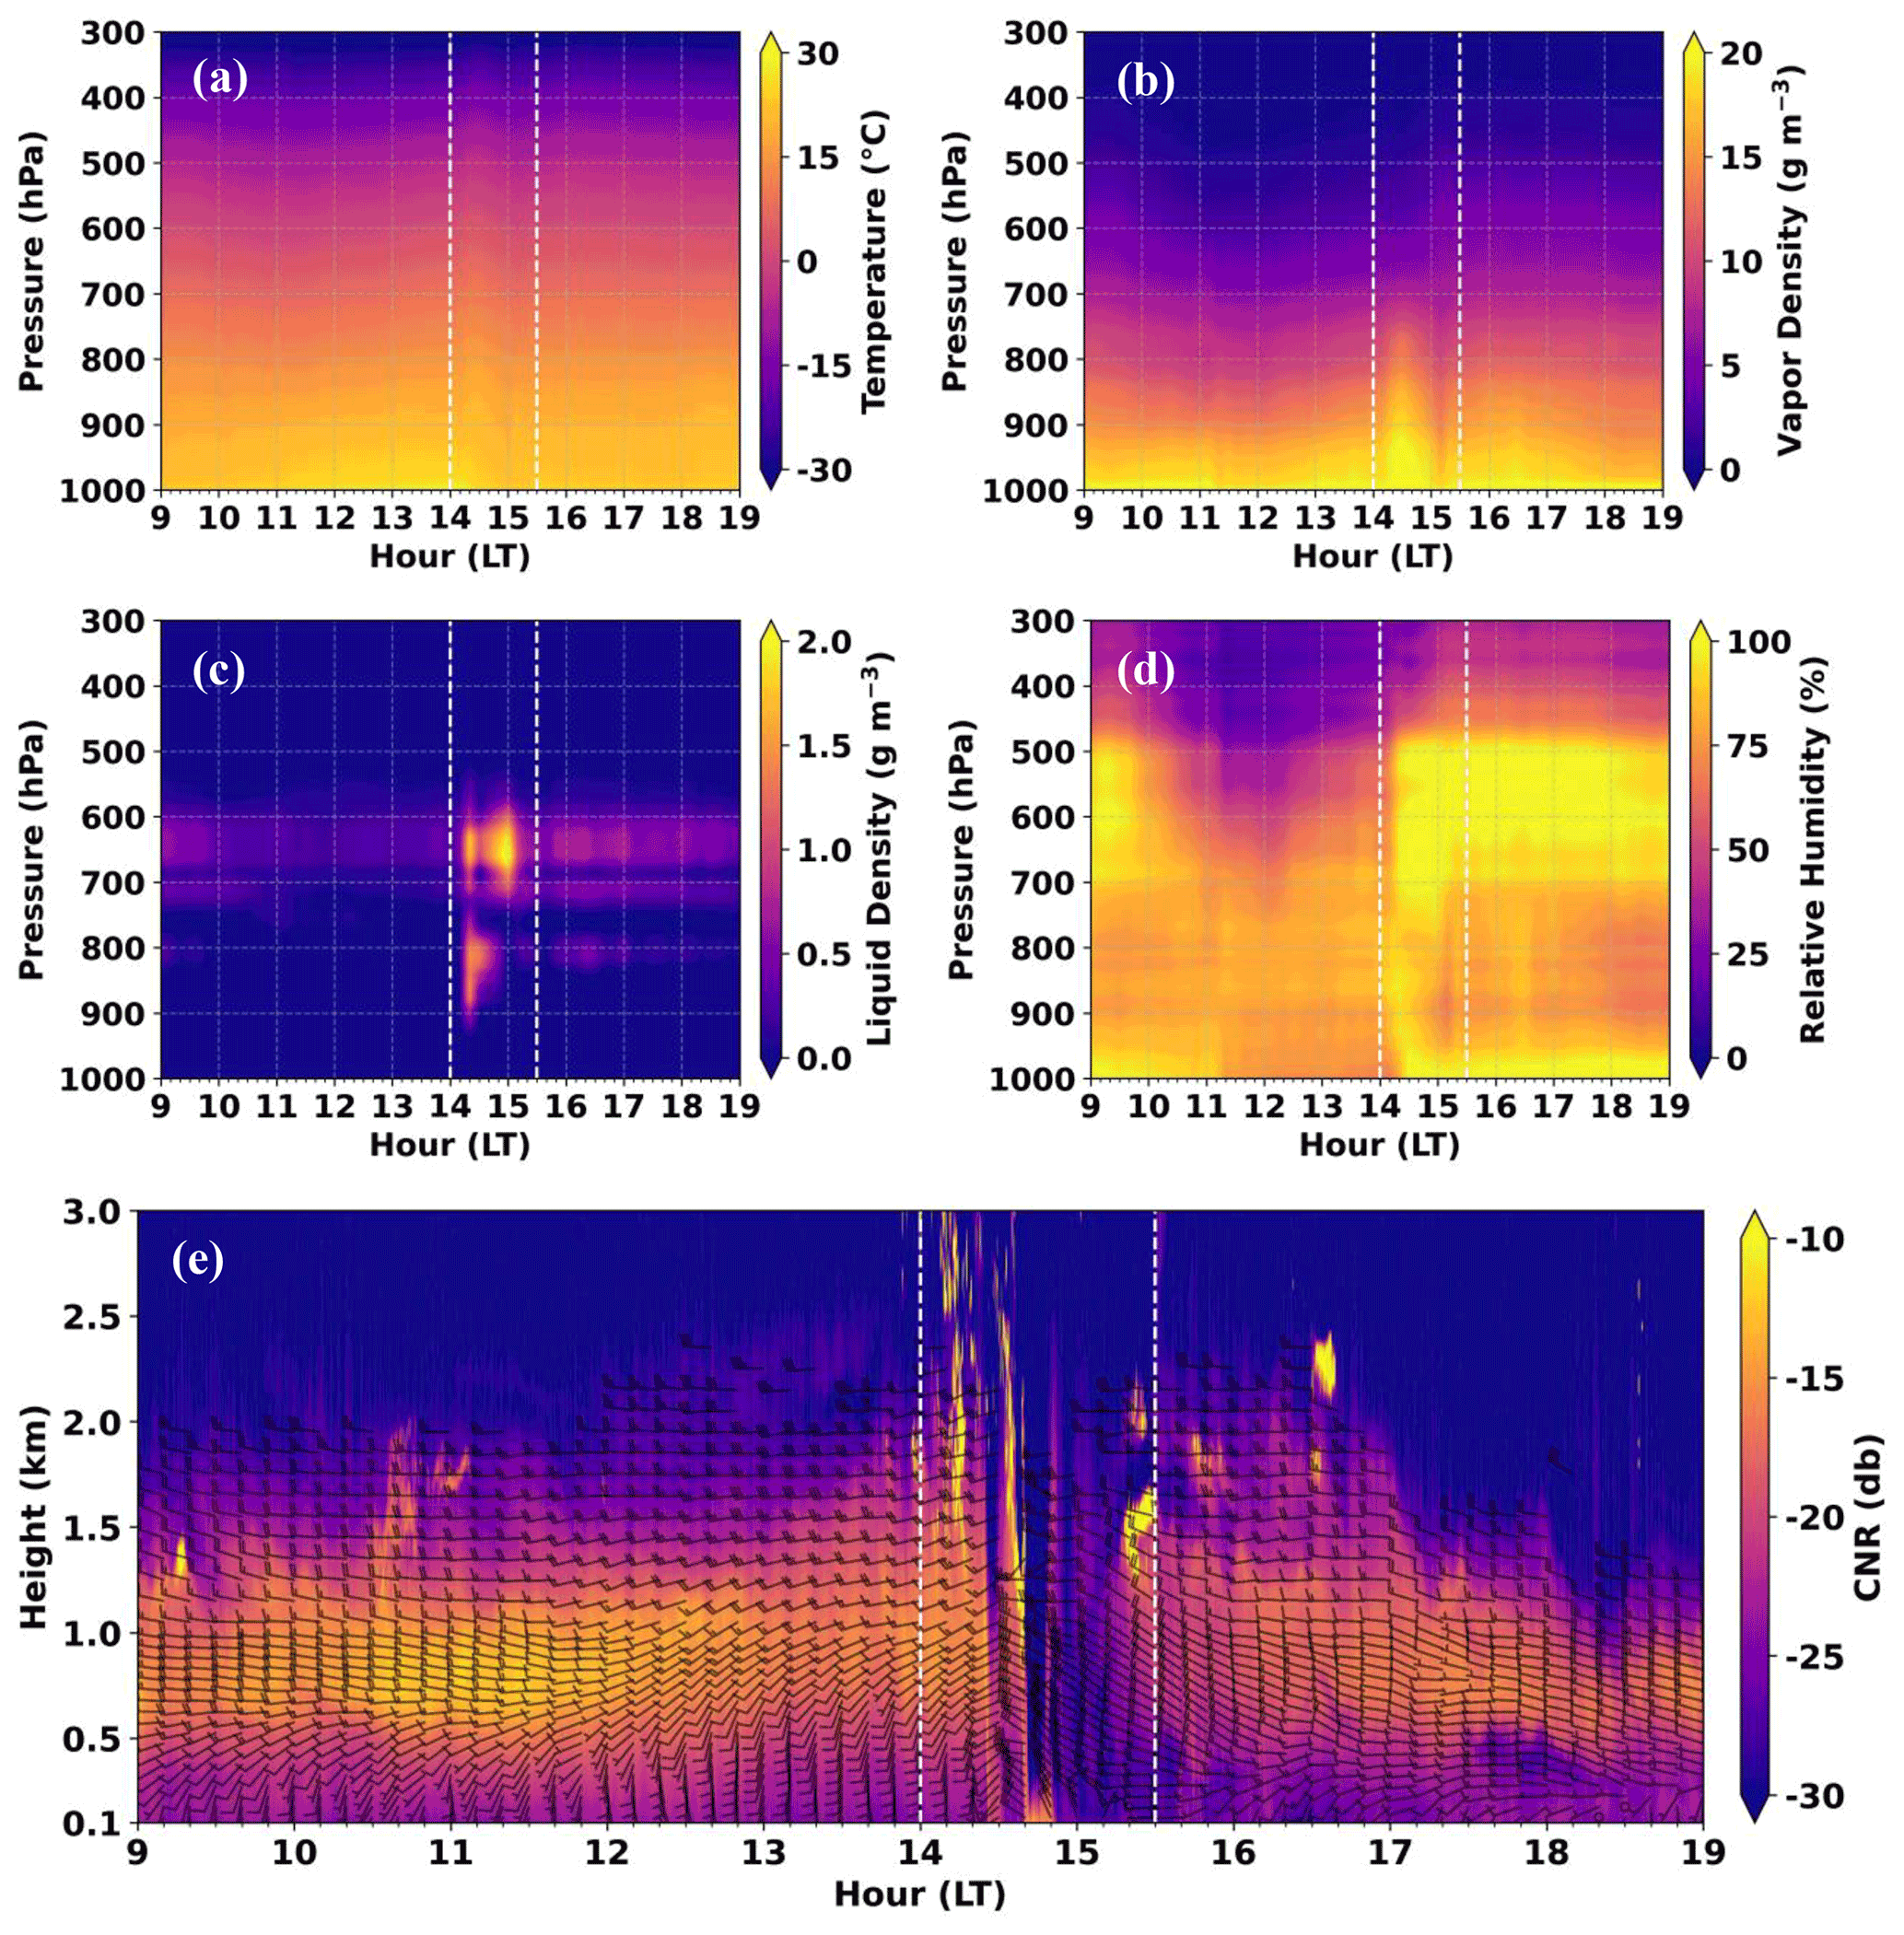
Figure 12The MWR-measured time–height cross section plots for (a) temperature (∘C), (b) vapor density (g m−3), (c) liquid density (g m−3), (d) relative humidity (%), and (e) DL-measured CNR (dB) with 10 min averaged wind barbs at Albany on 12 August 2021. Dotted box represents thunderstorm episode.
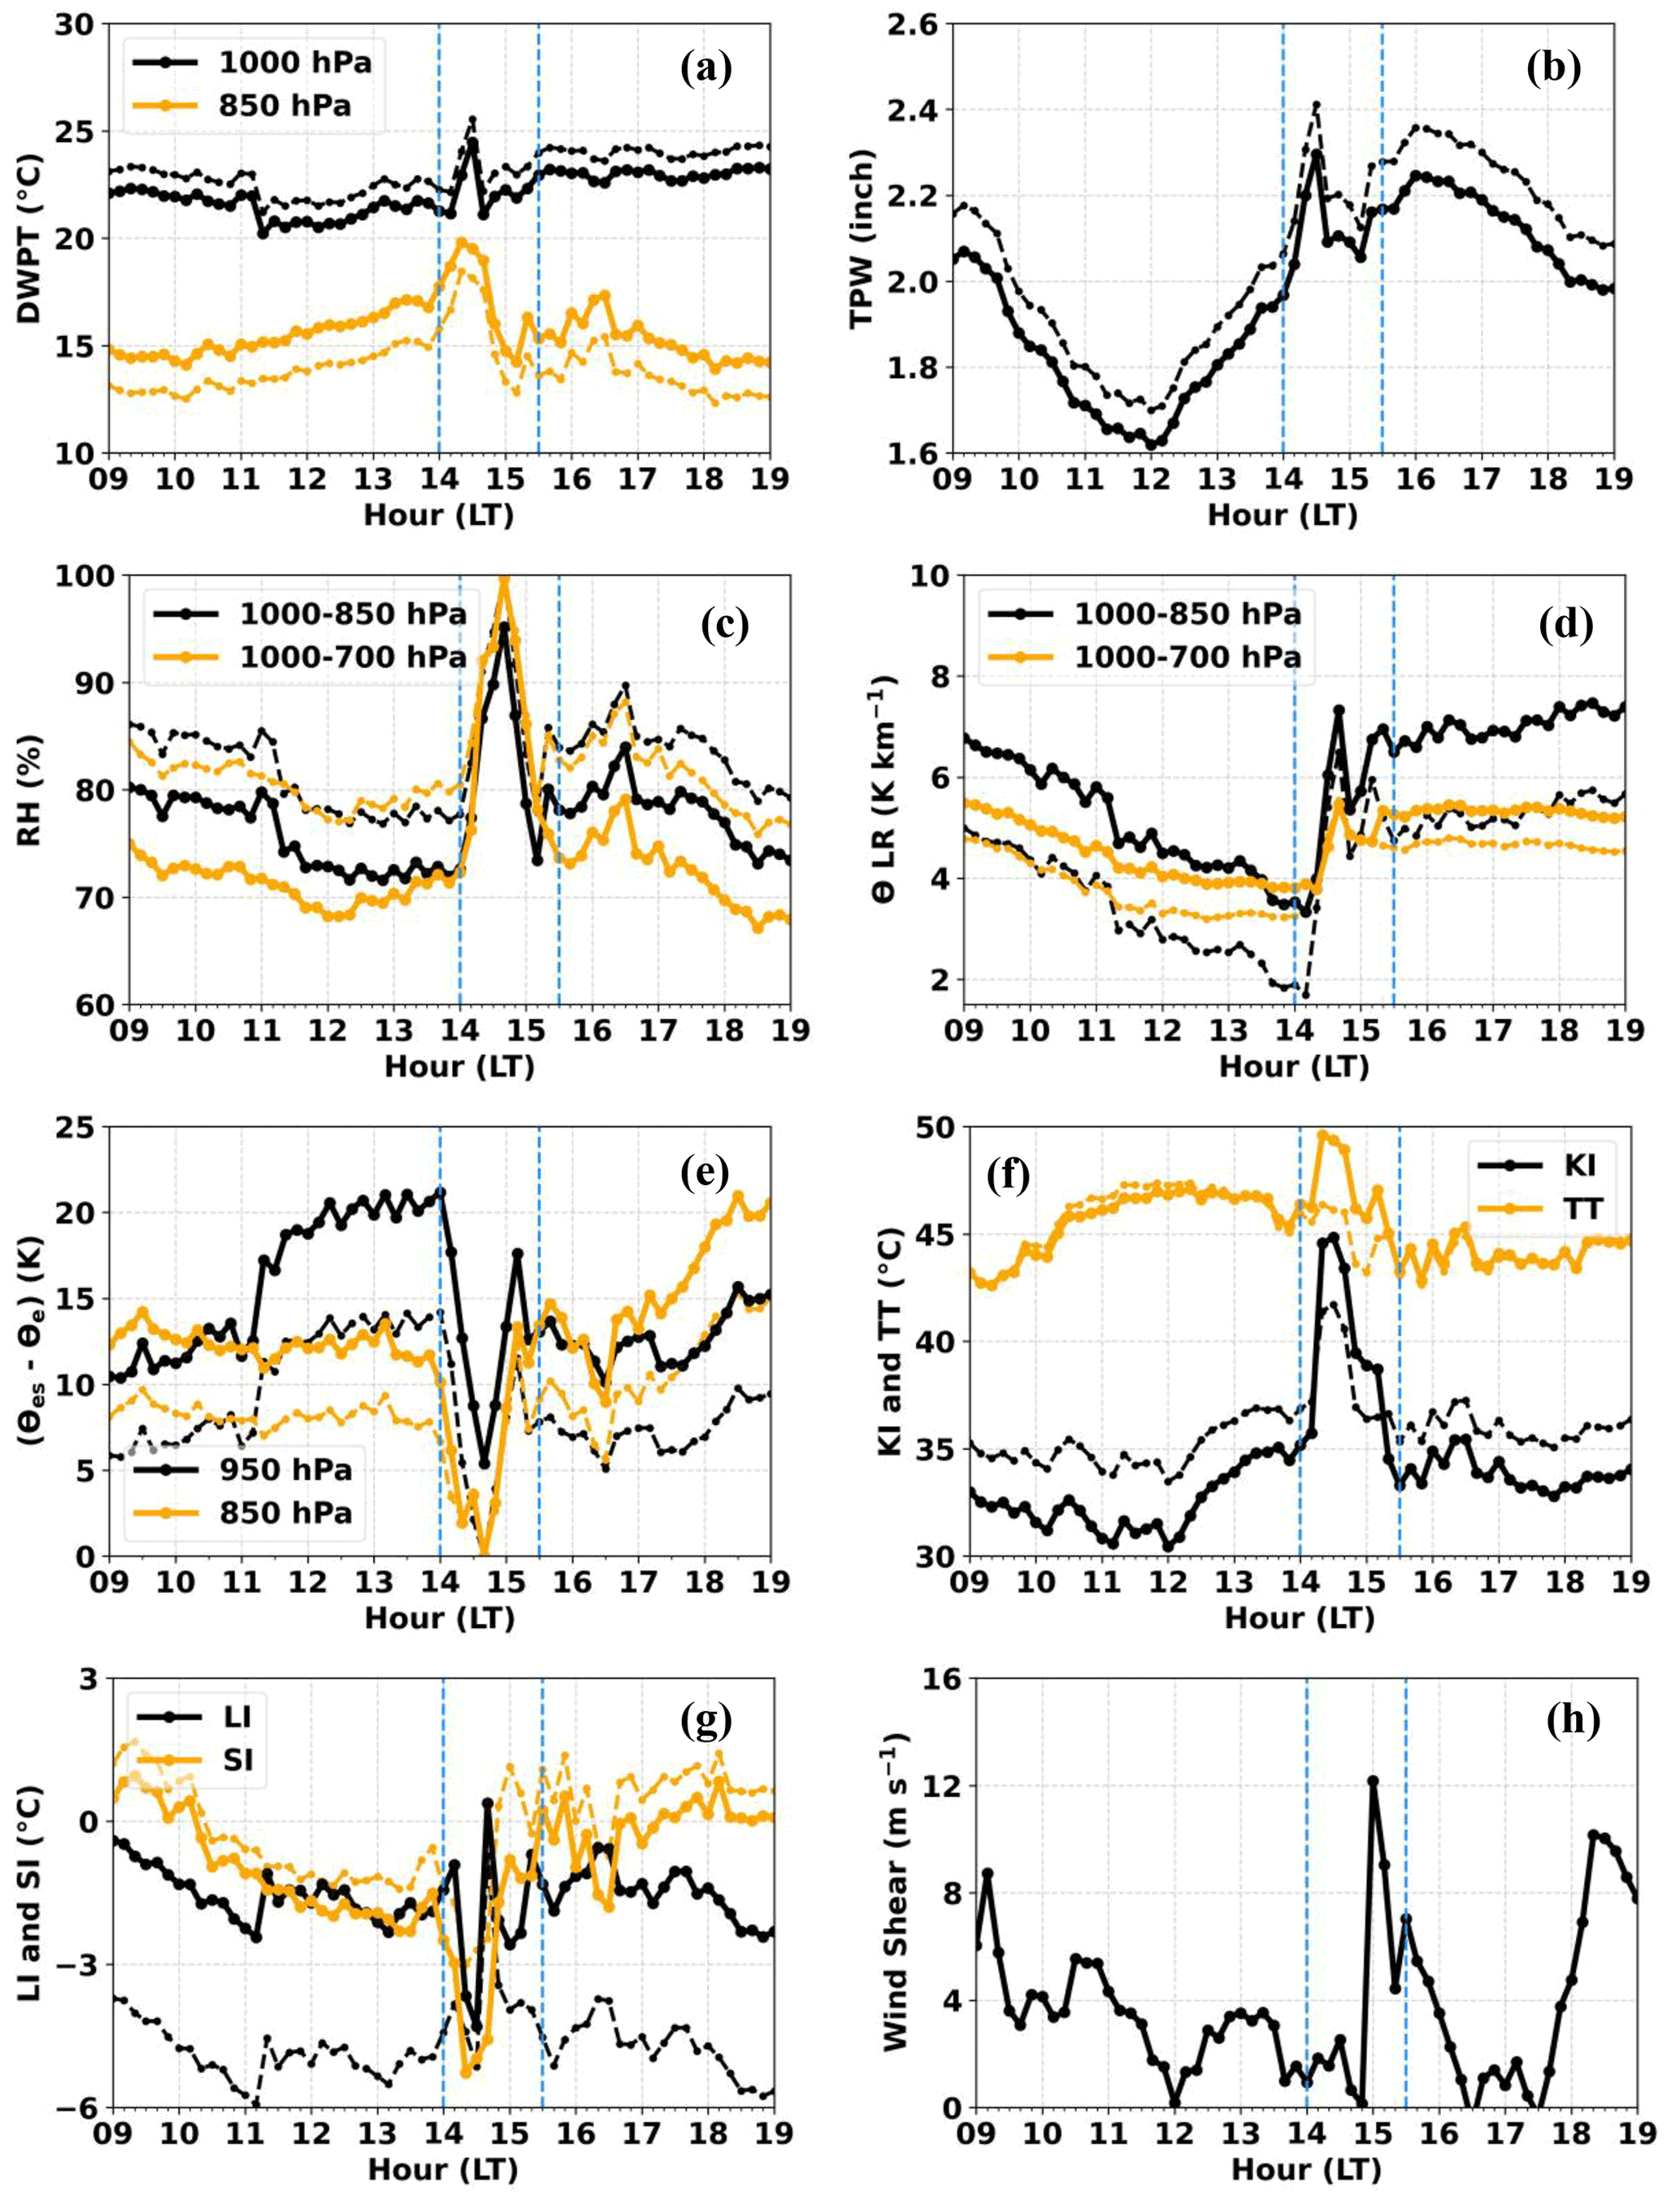
Figure 13Original (light color) and corrected (bold color) MWR-derived (a) DWPT, (b) TPW, (c) mean RH, (d) θ LR, (e) (θes–θe), (f) KI and TT, (g) LI, and SI and DL-derived (h) wind shear (100 m–1 km) at Albany on 12 August 2021. The dotted box represents the thunderstorm episode.
Figure 13a–h shows distinctive temporal variations before and during the storm. The dew point temperature (DWPT) at 850 hPa slowly increases from 11:00 LT, while the DWPT at 1000 hPa starts to increase an hour later around 12:00 LT, both increasing by ≥ 3 ∘C within 30 min of reaching a peak at 14:20 and 14:30 LT respectively, just prior to thunderstorm genesis (Fig. 13a). The TPW decreases until 12:00 LT but then starts to increase and reaches a peak at 14:30 LT just before storm initiation (Fig. 13b). Both DWPT and TPW increase for 2–3 h with a sharp increase ∼ 30 min prior to the storm. Both levels of mean RH (1000 to 850 and 700 hPa) increase sharply starting at 14:00 LT (coincident with the sharp increase in DWPT and TPW) and reach ≥ 90 %, just prior to the storm (Fig. 13c). Both potential temperature (θ) LRs (1000–850 and 1000–700 hPa) decrease continuously until 14:00 LT, indicative of instability prior to the thunderstorm occurrence (Fig. 13d). The stability index (θes–θe) at two levels (950 and 850 hPa) decrease sharply from 14:00 LT reaching the minimum value at 14:40 LT just before the storm initiation, suggesting a change from the warmer unsaturated to cooler saturated atmosphere (Fig. 13e). A KI ≥ 30 ∘C indicates a moderate chance for thunderstorms with rain, while the KI ≥ 40 ∘C indicates a high chance for thunderstorms with heavy rain. There is a relative increasing trend in the KI after 12:00 LT (∼ 2.5 h prior to the storm), where the KI increases roughly by 5 ∘C between 12:00 and 13:40 LT and further increases by ∼ 10 ∘C in 40 min, reaching a peak value of 44.8 ∘C at 14:30 LT (Fig. 13f, black line). A TT ≥ 45 ∘C indicates the possibility of thunderstorms, while TT ≥ 50 ∘C indicates a possibility of severe thunderstorms. The TT values are > 45 ∘C from 10:20 LT through the end of the storm event (Fig. 13f, yellow line). From 13:50 to 14:20 LT, TT increases by > 4 ∘C and reaches the peak value of 49.6 ∘C just prior to thunderstorm genesis. The more negative the LI and SI, the greater the instability. LI is mostly between 0 and −3 ∘C until 14:10 LT and drops below −3 ∘C and reaches minimum values of −4.3 ∘C at 14:30 LT (Fig. 13g, black line). SI drops steadily until 13:30 LT and then drops precipitously below −3 ∘C between 14:10 and 14:40 LT (Fig. 13g, yellow line). Finally, the wind shear (100 m–1 km) is mostly < 4 m s−1 (∼ 8 knots) until 14:50 LT and then drastically increases to 12 m s−1 (∼ 23 knots) at 15:00 LT shortly after the thunderstorm begins (Fig. 13h). Such a significant increase in shear generally indicates increasing storm severity. In summary, using a combination of one or more convective index parameters from a colocated DL and MWR, it is possible to monitor low-level moisture, instability, and wind shear for storm initiation and severity. With the normal RS launch times (00:00 and 12:00 UTC) outside of this 10 h window, crucial details of the thunderstorm could have been easily missed without the NYSM Profiler Network.
4.8 Evaluation of eSIR AOD data
Measurements of aerosol optical depth (AOD) as computed by the NYSM Profiler eSIR and AERONET were compared at Stony Brook and Bronx (Fig. 14a–f). The highest R2 observed for AOD was at 500 nm wavelength (R2≥0.92) and the lowest R2 observed was at 1040 nm wavelength (R2 ≥ 0.78) at both sites. Discrepancies at the 1040 nm wavelength could be due to the influence of trace gases such as CO2, O2, CO, NOx, CH4, and SO2. The eSIR-derived AOD only considers the optical depth contribution from Rayleigh scattering, water vapor, and ozone. The errors are within the expected range based on the accuracies of the eSIR and AERONET measurements listed in Table 1. The AOD biases are found to be statistically significant (p < 0.05) except for 1020 nm AOD at Bronx.
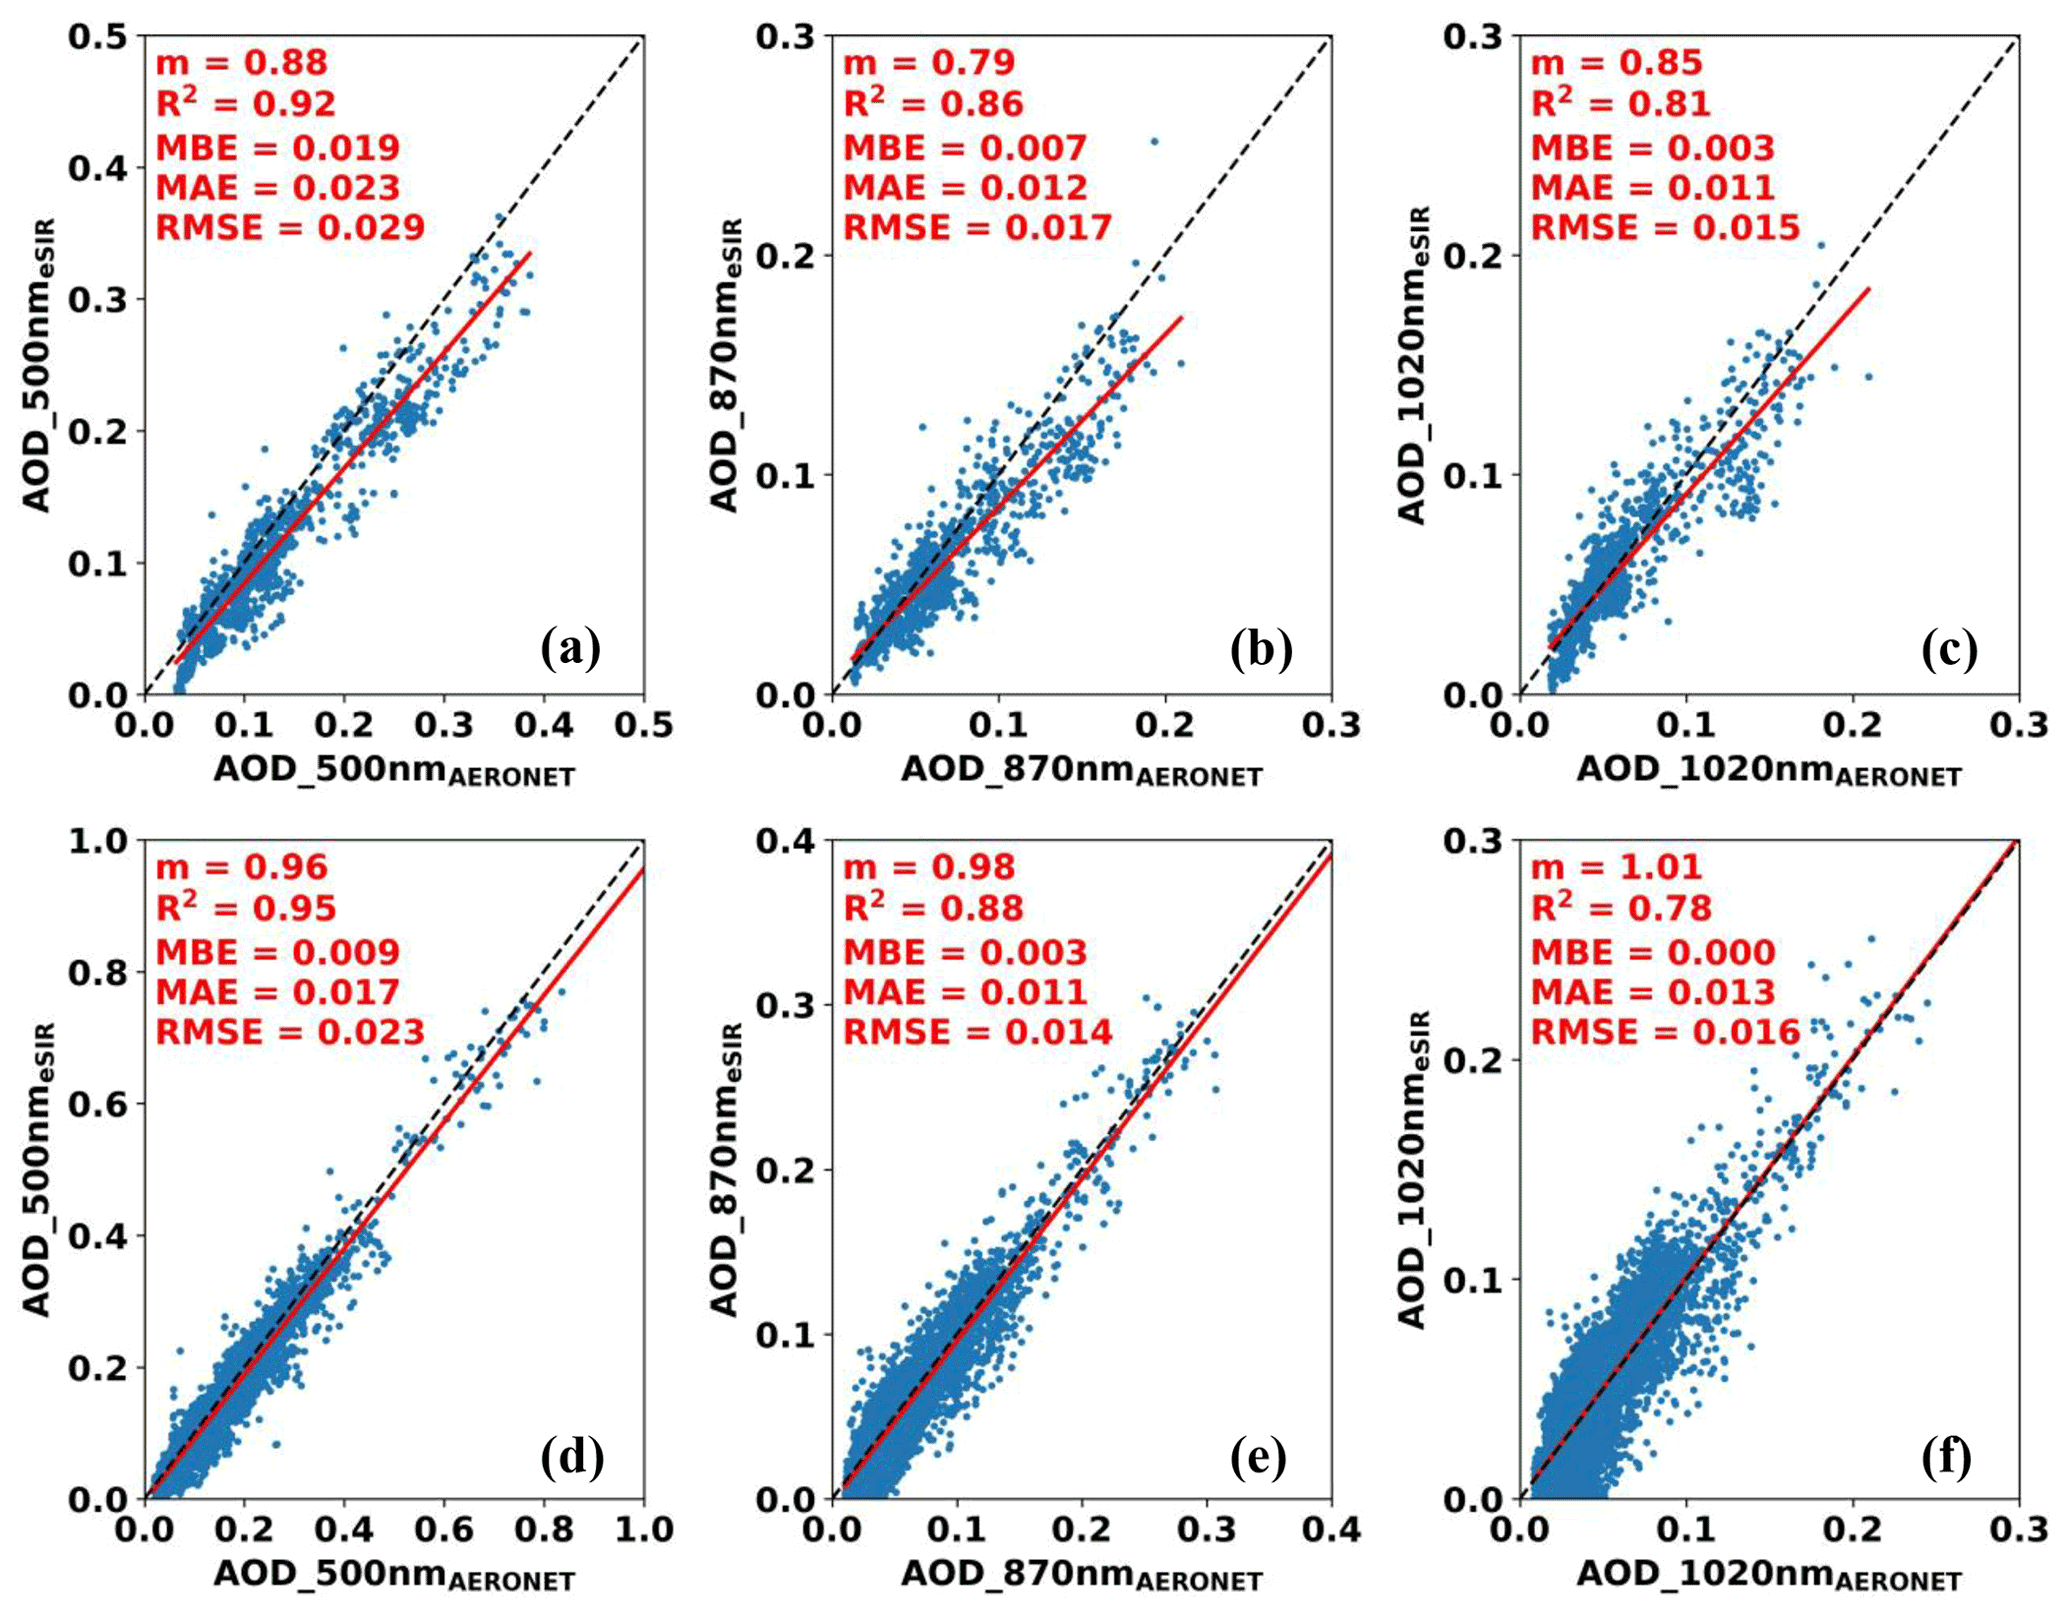
Figure 14Scatterplots for the eSIR- and AERONET-derived AOD for three channels: 500, 870, and 1020 nm at (a–c) Stony Brook and (d–f) Bronx.
In summary, AOD estimates from the eSIR and AERONET show close agreement with each other at both sites with AOD measurements at lower wavelengths being comparatively better than at higher wavelengths. Having accurate AOD data is valuable for air quality studies and forecasting because of its frequent use in the estimation of surface PM2.5 (Kumar et al., 2007; Schaap et al., 2009; Chudnovsky et al., 2014; Xie et al., 2015) and the classification and characterization of aerosol types and size (Eck et al., 1999; Schuster et al., 2006; Khan et al., 2016).
The primary objective of this study is to compare and assess the NYSM Profiler Network data with respect to in situ reference measurements from the NWS RS and AERONET. Data from January 2018 to August 2021 were used to assess the accuracy of wind speed up to 3 km from the DL and temperature and vapor density up to 10 km from the MWR. These data were evaluated at three NYSM Profiler Network sites (Buffalo, Albany, and Stony Brook) against RS measurements. Similarly, data from April to June 2018 and from March 2018 to October 2019 were used to assess the accuracy of AOD derived from the eSIR at Stony Brook and Bronx with respect to AERONET AOD measurements.
The comparison results show R2 ≥ 0.89 for wind speed and R2 mostly exceeding 0.86 for wind shear (100 m–1 km and 100 m–3 km) measurements with MAE and RMSE below 2.5 m s−1 across the three sites. MBE is found to be statistically equal to 0 at nearly all height levels. Wind speed measurements above 0.5 km are found to be better correlated than below 0.5 km due to irregular RS motions in the near-surface turbulent layer. Site-to-site MAE and RMSE differences for both wind speed and wind shear are ≤ 0.7 m s−1, indicating consistent performance of the DL across multiple sites.
The estimates of temperature and water vapor density from the MWR and RS show an overall high correlation of R2 ≥ 0.95 across the three sites. The MAE and RMSE for temperature and water vapor density are below 4.8 ∘C and 1.19 g m−3, respectively, with MBE statistically significant and different from 0. The temperature errors are found to be lower within the boundary layer than above it, while the water vapor density shows the opposite trend. Overall site-to-site MAE and RMSE differences for temperature and water vapor density are ≤ 1.0 ∘C and 0.4 g m−3, respectively. The relatively small differences and similar vertical structure in error profiles for the MWR data demonstrate a consistent performance of the MWR across the different geographical sites. This also implies that the existence of discrepancies between MWR and RS data (two different types of RSs are used at Buffalo, Albany, and Upton) is primarily due to the MWR ill-posed retrieval technique and is not limited to the calibration and neural network. This could be mainly due to the inherent biases in the brightness temperature from the instrument, model used, calibration uncertainty, and rapidly fading weighting function along the height. The overall statistics of the MWR data evaluated in different weather conditions (precipitation, cloudy, and clear-sky days) show somewhat varying performance. Correlations are found to be best during precipitation and worst during clear-sky days. Similarly, temperature errors are smaller on precipitation days and larger on clear-sky days, whereas the water vapor density errors are relatively small on clear-sky days and larger on cloudy or precipitation days. Such a varied performance under different weather conditions could be due to the possibility of shifting of a rapidly fading weighting function and the temperature profiles trending towards the moist adiabat and reduced temperature inversions. Because of a consistent bias observed in the MWR data with reference to the RS data, a linear bias correction is developed and applied at three sites with nearby RS stations. This method reduces the systematic biases significantly with the improvement in temperature much more pronounced than in water vapor density. Finally, the corrected MWR data are used to retrieve 14 different thermodynamics parameters and are compared against those derived from the RS data. All 14 parameters have R2 ≥ 0.55 across the three sites. Except for TT (all three sites) and meanRH (ps–700 hPa at Buffalo) and (θes–θe) at 850 hPa (Stony Brook), all other parameters have R2 ≥ 0.70, which demonstrates the value and reliability of the MWR for use in the monitoring of severe convection. Most of these parameters have no statistical bias. Overall, the MWR provides continuous and real-time measurement of atmospheric data and can be a valuable nowcasting tool for high-impact weather events despite cold biases in the temperature data. The availability of a system like the NYSM Profiler Network also provides an opportunity for combining DL and MWR data to derive valuable parameters like Rib and PBL height, which is a part of another study.
Finally, AODs as measured by the eSIR and AERONET show high correlations at both sites (Stony Brook and Bronx). The AOD comparisons for 500 nm wavelength show R2 ≥ 0.92, whereas they show R2 ≥ 0.78 for the 1020 nm wavelengths. Similar error statistics between the eSIRs at the two sites demonstrates a consistent performance.
A profiling station, consisting of a DL, MWR, and eSIR, provides a means for continuous monitoring of the lower boundary layer winds, aerosols, thermodynamic variables, and spectral direct and diffuse radiation at high resolutions. A network of such stations allows for regional monitoring, spatial comparisons, and neighborhood checks for quality control, ensuring a more accurate analysis. Overall, the NYSM Profiler Network provides low-level atmospheric and aerosol optical data for real-time weather operations. While some temperature and moisture biases are found with the MWR, these errors can be corrected easily with a simple linear fit using limited RS data. Therefore, the future plan is to launch several RSs to bias correct the remaining 14 MWRs and to further investigate the performance of MWR during the daytime (07:00–19:00 LT) apart from the twice-daily NWS launches. A second, possibly more robust option we will continue to explore is to apply a bias correction directly to the MWR brightness temperatures before applying any retrieval methodologies. In the meantime, we are also working with the MWR community to explore robust methods such as 1-DVAR (Cimini et al., 2011) and the radiometrically developed automatic calibration (Acal), a continuous calibration that replaces biannual liquid nitrogen calibration to resolve such bias issues. The preliminary analysis of the Acal technique has shown much-needed improvements to the MWR retrievals and is therefore under extensive evaluation and consideration for long-term use. A multi-year, multi-station evaluation of the NYSM Profiler Network sensors show minimal differences across different sites and meteorological conditions. As demonstrated, such a network can be useful for improving situational awareness during high-impact weather operations with its timely and much improved spatial and temporal monitoring of the boundary layer.
The NYSM Profiler Network data are available through data request at http://www.nysmesonet.org/weather/requestdata (New York State Mesonet (NYSM), 2022) according to the NYSM data policy stated in the web page. The NWS radiosonde data are available at the University of Wyoming Atmospheric Science Radiosonde Archive, http://weather.uwyo.edu/upperair/bufrraob.shtml (University of Wyoming, 2022), and the AERONET data are available at https://aeronet.gsfc.nasa.gov/new_web/aerosols.html (Aerosol Robotic Network (AERONET), 2022).
The supplement related to this article is available online at: https://doi.org/10.5194/amt-15-6011-2022-supplement.
BS designed the study, analyzed the results, and prepared the original manuscript. JAB and JW reviewed, made suggestions about, and edited the manuscript.
The contact author has declared that none of the authors has any competing interests.
Publisher's note: Copernicus Publications remains neutral with regard to jurisdictional claims in published maps and institutional affiliations.
This research is made possible by the New York State (NYS) Mesonet and its dedicated staff, especially our profiler technician Steven Perez for maintaining the profiler network. Original funding for the NYS Mesonet was provided by Federal Emergency Management Agency grant FEMA-4085-DR-NY, with the continued support of the Research Foundation for the State University of New York (SUNY); the University at Albany, SUNY; the Atmospheric Sciences Research Center (ASRC) at SUNY Albany; and the Department of Atmospheric and Environmental Sciences (DAES) at SUNY Albany. Special thanks to the University of Wyoming, Department of Atmospheric Science, for providing NWS Radiosonde data and AERONET for providing AOD data. Finally, the authors thank Randolph S. Ware and Matthew Mahaffey from Radiometrics for providing us valuable comments and suggestions.
This research has been partially supported by the Observations Program within the NOAA/OAR Weather Program Office under grant no. NA21OAR4590376, with the continued support of the National Mesonet Program.
This paper was edited by Laura Bianco and reviewed by three anonymous referees.
Aerosol Robotic Network (AERONET): Aerosol optical depth, AERONET [data set], https://aeronet.gsfc.nasa.gov/new_web/aerosols.html, last access: 13 October 2022.
Aitken, M. L., Rhodes, M. E., and Lundquist, J. K.: Performance of a wind-profiling lidar in the region of wind turbine rotor disks, J. Atmos. Ocean. Tech., 29, 347–355, https://doi.org/10.1175/JTECH-D-11-00033.1, 2012.
American Meteorological Society: Mandatory levels, Glossary of Meteorology, https://glossary.ametsoc.org/wiki/Mandatory_level (last access: 13 October 2022), 2014.
Bianco, L., Friedrich, K., Wilczak, J. M., Hazen, D., Wolfe, D., Delgado, R., Oncley, S. P., and Lundquist, J. K.: Assessing the accuracy of microwave radiometers and radio acoustic sounding systems for wind energy applications, Atmos. Meas. Tech., 10, 1707–1721, https://doi.org/10.5194/amt-10-1707-2017, 2017.
Boquet, M., Royer, P., Cariou, J. P., and Machta, M.: Simulation of Doppler lidar measurement range and data availability, J. Atmos. Ocean. Tech., 33, 977–987, https://doi.org/10.1175/JTECH-D-15-0057.1, 2016.
Brotzge, J. A., Wang, J., Thorncroft, C. D., Joseph, E., Bain, N., Bassill, N., Farruggio, N., Freedman, J. M., Hemker Jr., K., Johnston, D., Kane, E., McKim, S., Miller, S. D., Minder, J. R., Naple, P., Perez, S., Schwab, J. J., Schwab, M. J., and Sicker, J.: A technical overview of the New York state Mesonet standard network, J. Atmos. Ocean. Tech., 37, 1827–1845, https://doi.org/10.1175/JTECH-D-19-0220.1, 2020.
Chan, P. W. and Hon, K. K.: Application of ground-based, multi-channel microwave radiometer in the nowcasting of intense convective weather through instability indices of the atmosphere, Meteorol. Z., 20, 431–440, 2011.
Chudnovsky, A., Lyapustin, A., Wang, Y., Tang, C., Schwartz, J., and Koutrakis, P: High resolution aerosol data from MODIS satellite for urban air quality studies, Cent. Eur. J. Geo., 6, 17–26, https://doi.org/10.2478/s13533-012-0145-4, 2014.
Cimini, D., Campos, E., Ware, R., Albers, S., Guiliani, G., Oreamuno, J., Joe, P., Koch, S, E., Cober, S., and Westwater, E.: Thermodynamic atmospheric profiling during the 2010 Winter Olympics using ground-based microwave radiometry, IEEE T. Geosci. Remote, 49, 4959–4969, https://doi.org/10.1109/TGRS.2011.2154337, 2011.
Cimini, D., Nelson, M., Güldner, J., and Ware, R.: Forecast indices from a ground-based microwave radiometer for operational meteorology, Atmos. Meas. Tech., 8, 315–333, https://doi.org/10.5194/amt-8-315-2015, 2015.
Dai, L., Xin, J., Zuo, H., Ma, Y., Zhang, L., Wu, X., Ma, Y., Jia, D., and Wu, F.: Multilevel validation of Doppler Wind lidar by the 325 m meteorological tower in the planetary boundary layer of Beijing, Atmosphere, 11, 1051, https://doi.org/10.3390/atmos11101051, 2020.
Delgado, R., Caicedo, V., Taguba, K., Taylor, D., Maniktala, P., Rathod, A., Demoz, B. B., Sakai, R. K., Moshary, F., Welton, E. J., Lefer, B. L., Woodman, M., Krask, D., Szykman, J., and Cavender, K.: Unified Ceilometer Network, MARAMA Air Monitoring Training Committee Workshop, Online virtual training workshop, 8–10 December 2020, https://s3.amazonaws.com/marama.org/wp-content/uploads/2020/12/31190605/Ceilometer_Network-Delgado-2020.pdf (last access: 13 October 2022), 2020.
Eck, T. F., Holben, B. N., Reid, J. S., Dubovik, O., Smirnov, A., O'Neill, N. T., Slutsker, I., and Kinne, S.: Wavelength dependence of the optical depth of biomass burning, urban and desert dust aerosols, J. Geophys. Res., 104, 31333–31349, https://doi.org/10.1029/1999JD900923, 1999.
Feltz, W. F. and Mecikalski, J. R.: Monitoring high-temporal resolution convective stability indices using the ground based Atmospheric Emitted Radiance Interferometer (AERI) during the 3 May 1999 Oklahoma-Kansas Tornado Outbreak, Weather Forecast., 17, 445–455, https://doi.org/10.1175/1520-0434(2002)017<0445:MHTRCS>2.0.CO;2, 2002.
Giles, D. M., Sinyuk, A., Sorokin, M. G., Schafer, J. S., Smirnov, A., Slutsker, I., Eck, T. F., Holben, B. N., Lewis, J. R., Campbell, J. R., Welton, E. J., Korkin, S. V., and Lyapustin, A. I.: Advancements in the Aerosol Robotic Network (AERONET) Version 3 database – automated near-real-time quality control algorithm with improved cloud screening for Sun photometer aerosol optical depth (AOD) measurements, Atmos. Meas. Tech., 12, 169–209, https://doi.org/10.5194/amt-12-169-2019, 2019.
Granberg, I. G., Kramar, V. F., Kuznetsov, R. D., Chkhetiani, O. G., Kallistratova, M. A., Kulichkov, S. N., Astamonova, M. S., Kuznetsov, D. D., Perepelkin, V. G., Perepelkin, V. V., and Pogarskii, F. A.: A study of the spatial structure of the atmospheric boundary layer with a Doppler-Sodar network, Atmos. Ocean. Phys., 45, 541–548, https://doi.org/10.1134/S0001433809050016, 2009.
Harrison, L., Michalsky, J., and Berndt, J.: Automated multifilter rotating shadow-band radiometer: an instrument for optical depth and radiation measurements, Appl Opt., 33, 5118–5125, https://doi.org/10.1364/AO.33.005118, 1994.
Hewison, T. J.: 1D-VAR retrieval of temperature and humidity profiles from a ground-based microwave radiometer, IEEE T. Geosci. Remote, 45, 2163–2168, https://doi.org/10.1109/TGRS.2007.898091, 2007.
Hu, J., Yossouf, N., Turner, D. D., Jones, T. A., and Wang, X.: Impact of ground-based remote sensing boundary layer observations on short-term probalistic forecasts of a tornadic supercell event, Weather Forecast., 34, 1453–1476, https://doi.org/10.1175/WAF-D-18-0200.1, 2019.
Illingworth, A. J., Cimini, D., Gaffard, C., Haeffelin, M., Lehmann, V., Lohnert, U., O'Connor, E. J., and Ruffieux, D.: Exploiting existing ground-based remote sensing networks to improve high-resolution weather forecasts, B. Am. Meteorol. Soc., 96, 2107–2125, https://doi.org/10.1175/BAMS-D-13-00283.1, 2015.
Illingworth, A. J., Cimini, D., Haefele, A., Haeffelin, M., Hervo, M., Kotthaus, S., Löhnert, U., Martinet, P., Mattis, I., O'Connor, E. J., and Potthast, R.: How can existing ground-based profiling instruments improve European weather forecasts, B. Am. Meteorol. Soc., 100, 605–619, https://doi.org/10.1175/BAMS-D-17-0231.1, 2019.
Khan, A., Shaheen, K., Blaschke, T., Chishtie, F., Khan, H. U., and Haq, B. S.: Classification of aerosols in an urban environment on the basis of optical measurements, Aerosol Air Qual. Res., 16, 2535–2549, https://doi.org/10.4209/aaqr.2016.06.0219, 2016.
Knupp, K. R., Coleman T., Phillips, D., Ware, R., Cimini, D., Vandenberghe, F., Vivekanandan, J., and Westwater, E.: Ground-based passive microwave profiling during dynamic weather conditions, J. Atmos. Ocean. Tech., 26, 1057–1073, https://doi.org/10.1175/2008JTECHA1150.1, 2009.
Koontz, A., Hodges, G., Barnard, J., Flynn, C., and Michalsky, J.: Aerosol Optical Depth Value-Added Product, U.S. DOE Rep. DOE/SC-ARM/TR-129, 32 pp., https://www.arm.gov/publications/tech_reports/doe-sc-arm-tr-129.pdf (last access: 13 October 2022), 2013.
Koskinen, J. T., Poutiainen, J., Schultz, D. M., Joffre, S., Koistinen, J., Saltikoff, E., Gregow, E., Turtiainen, H., Dabberdt, W. F., Damski, J., Eresmaa, N., Göke, S., Hyvärinen, O., Järvi, L., Karppinen, A., Kotro, J., Kuitunen, T., Kukkonen, J., Kulmala, M., Moisseev, D., Nurmi, P., Pohjola, H., Pylkkö, P., Vesala, T., and Viisanen, Y.: The Helsinki Testbed: A mesoscale measurement, research, and service platform, B. Am. Meteorol. Soc., 92, 325–342, https://doi.org/10.1175/2010BAMS2878.1, 2011.
Kumar, N., Chu, A., and Foster, A.: An empirical relationship between PM2.5 and aerosol optical depth in Delhi Metropolitan, Atmos Environ., 41, 4492–4503, https://doi.org/10.1016/j.atmosenv.2007.01.046, 2007.
Kumer, V. M., Reuder, J., and Furevik, B. R.: A comparison of LiDAR and radiosonde wind measurements, Energ. Proced., 53, 214–220, 2014.
Löhnert, U. and Maier, O.: Operational profiling of temperature using ground-based microwave radiometry at Payerne: prospects and challenges, Atmos. Meas. Tech., 5, 1121–1134, https://doi.org/10.5194/amt-5-1121-2012, 2012.
Madhulatha, A., Rajeevan, M., Ratnam, M. V., Bhate, J., and Naidu, C. V.: Nowcasting severe convective activity over southeast India using ground-based microwave radiometer observations, J. Geophys. Res.-Atmos., 118, 1–13, https://doi.org/10.1029/2012JD018174, 2013.
Mariani, Z., Crawford, R., Casati, B., and Lemay, F.: A multi-year evaluation of Doppler lidar wind profile observations in the Arctic, Remote Sens., 12, 323, https://doi.org/10.3390/rs12020323, 2020.
Newman, J. F., Klein, P. M., Wharton, S., Sathe, A., Bonin, T. A., Chilson, P. B., and Muschinski, A.: Evaluation of three lidar scanning strategies for turbulence measurements, Atmos. Meas. Tech., 9, 1993–2013, https://doi.org/10.5194/amt-9-1993-2016, 2016.
New York State Mesonet (NYSM): Request data, NYSM [data set], http://www.nysmesonet.org/weather/requestdata, last access: 13 October 2022.
Oude Nijhuis, A. C. P., Thobois, L. P., Barbaresco, F., De Haan, S., Dolfi-Bouteyre, A., Kovalev, D., Krasnov, O. A., Vanhoenacker-Janvier, D., Wilson, R., and Yarovoy, A. G.: Wind Hazard and Turbulence Monitoring at Airports with Lidar, Radar, and Mode-S Downlinks: The UFO Project, B. Am. Meteorol. Soc., 99, 2275–2293, https://doi.org/10.1175/BAMS-D-15-00295.1, 2018.
Päschke, E., Leinweber, R., and Lehmann, V.: An assessment of the performance of a 1.5 µm Doppler lidar for operational vertical wind profiling based on a 1-year trial, Atmos. Meas. Tech., 8, 2251–2266, https://doi.org/10.5194/amt-8-2251-2015, 2015.
Peppier, R. A.: A review of static stability indices and related thermodynamic parameters, Illinois State Water Survey Division, Climate and Meteorology Section, 104, https://www.isws.illinois.edu/pubdoc/MP/ISWSMP-104.pdf (last access: 13 October 2022), 1988.
Schaap, M., Apituley, A., Timmermans, R. M. A., Koelemeijer, R. B. A., and de Leeuw, G.: Exploring the relation between aerosol optical depth and PM2.5 at Cabauw, the Netherlands, Atmos. Chem. Phys., 9, 909–925, https://doi.org/10.5194/acp-9-909-2009, 2009.
Schuster, G. L., Dubovik, O., and Holben, B. N.: Angstrom exponent and bimodal aerosol size distributions, J. Geophys. Res., 111, D07207, https://doi.org/10.1029/2005JD006328, 2006.
Shun, C. M. and Chan, P, W.: Applications of an infrared Doppler lidar in detection of wind shear, J. Atmos. Ocean. Tech., 25, 637–655, https://doi.org/10.1175/2007JTECHA1057.1, 2008.
Shrestha, B., Brotzge, J. A., Wang, J., Bain, N., Thorncroft, C. D., Joseph, E., Freedman, F., and Perez, S.: Overview and Applications of the New York State Mesonet Profiler Network, J. Appl. Meteorol. Clim., 60, 1591–1611, https://doi.org/10.1175/JAMC-D-21-0104.1, 2021.
Shrestha, B., Brotzge, J. A., and Wang, J.: Observations and impacts of long-range transported wildfire smoke on air quality across New York State during July 2021, Geophys. Res. Lett., 49, e2022GL100216, https://doi.org/10.1029/2022GL100216, 2022.
Solheim, F., Godwin, J. R., Westwater, E. R., Han, Y., Keihm, S. J., Marsh, K., and Ware, R.: Radiometric profiling of temperature, water vapor, and liquid water using various inversion methods, Radio Sci., 33, 393–404, https://doi.org/10.1029/97RS03656, 1998.
Solot, B.: Computation of depth of precipitable water in a column of air, Mon. Weather Rev., 67, 100–103, https://doi.org/10.1175/1520-0493(1939)67<100:CODOPW>2.0.CO;2, 1939.
Strauch, R. G., Merritt, D. A., Moran, K. P., Earnshaw, K. B., and Kamp, D.: The Colorado Wind Profiling Network, J. Atmos. Ocean. Tech., 1, 37–49, https://doi.org/10.1175/1520-0426(1984)001<0037:TCWPN>2.0.CO;2, 1984.
Thomas, W.: European ceilometer and lidar networks for aerosol profiling and aviation safety – the German contribution, Aeronautical meteorology scientific conference, 6–10 November 2017, Toulouse, France, https://library.wmo.int/doc_num.php?explnum_id=4444 (last access: 13 October 2022), 2017.
Univerity of Wyoming: University of Wyoming Atmospheric Science Radiosonde Archive, University of Wyoming [data set], http://weather.uwyo.edu/upperair/bufrraob.shtml, last access: 13 October 2022.
Vermeesch, K., Gentry, B., Koch, G., Boquet, M., Chen, H., Singh, U., Demoz, B., and Bacha, T.: Comparison of wind measurements at the Howard University Beltsville Research Campus, 5th Symposium on lidar atmospheric applications, Seattle, Washington, USA, 25 January 2011, Amer. Meteor. Soc., 4.4, https://ams.confex.com/ams/91Annual/webprogram/Paper181653.html (last access: 13 October 2022), 2011.
Wagner, T. J., Klein, P. M., and Turner, D. D.: A new generation of ground-based mobile platforms for active and passive profiling of the boundary layer, B. Am. Meteorol. Soc., 100, 137–153, https://doi.org/10.1175/BAMS-D-17-0165.1, 2019.
Wang, J. and Zhang, L.: Systematic errors in global radiosonde precipitable water data from comparisons with ground-based GPS measurements, J. Climate, 21, 2218–2238, https://doi.org/10.1175/2007JCLI1944.1, 2008.
Wang, J., Bian, J., Brown, W. O., Cole, H., Grubišić, V., and Young, K.: Vertical Air Motion from T-REX Radiosonde and Dropsonde Data, J. Atmos. Ocean. Tech., 26, 928–942, https://doi.org/10.1175/2008JTECHA1240.1, 2009.
Ware, R., Carpenter, R., Güldner, J., Liljegren, J., Nehrkorn, T., Solheim, F., and Vandenberghe, F.: A multichannel radiometric profiler of temperature, humidity, and cloud liquid, Radio Sci., 38, 8079, https://doi.org/10.1029/2002RS002856, 2003.
Ware, R., Cimini, D., Campos, E., Giuliani, G., Albers, S., Nelson, M., Koch, S. E., Joe, P., and Cober, S.: Thermodynamic and liquid profiling during the 2010 Winter Olympics, Atmos. Res., 132–133, 278–290, https://doi.org/10.1016/j.atmosres.2013.05.019, 2013.
Westwater, E. R.: Ground-based microwave remote sensing of meteorological variables: Atmospheric Remote Sensing Microwave Radiometry, edited by: Janssen, M. A., Wiley, New York, USA, 145–213, ISBN: 0-471-62891-3, 1993.
Wilczak, J. M., Gossard, E. E., Neff, W. D., and Eberhard, W. L.: Ground based remote sensing of the atmospheric boundary layer: 25 years of progress, Bound.-Lay. Meteorol., 78, 321–349, https://doi.org/10.1007/BF00120940, 1996.
Xie, Y., Wang, Y., Zhang, K., Dong, W., Lv, B., and Bai, Y.: Daily estimation of ground level PM2.5 concentrations over Beijing using 3km resolution MODIS AOD, Environ. Sci. Technol., 49, 12280–12288, https://doi.org/10.1021/acs.est.5b01413, 2015.
Xu, G., Ware, R., Zhang, W., Feng, G., Liao, K., and Liu, Y.: Effect of off-zenith observations on reducing the impact of precipitation on ground-based microwave radiometer measurement accuracy, Atmos. Res., 140–141, 85–94, https://doi.org/10.1016/j.atmosres.2014.01.021, 2014.
Xu, G., Xi, B., Zhang, W., Cui, C., Dong, X., Liu, Y., and Yan, G.: Comparison of atmospheric profiles between microwave radiometer retrievals and radiosonde soundings, J. Geophys. Res.-Atmos., 120, 10313–10323, https://doi.org/10.1002/2015JD023438, 2015.