the Creative Commons Attribution 4.0 License.
the Creative Commons Attribution 4.0 License.
 | 26 Oct 2022
Effects of temperature and salinity on bubble-bursting aerosol formation simulated with a bubble-generating chamber
Svetlana Sofieva
Eija Asmi
Nina S. Atanasova
Aino E. Heikkinen
Emeline Vidal
Jonathan Duplissy
Martin Romantschuk
Rostislav Kouznetsov
Jaakko Kukkonen
Dennis H. Bamford
Antti-Pekka Hyvärinen
A new bubble-generating glass chamber with an extensive set of aerosol production experiments is presented. Compared to the experiments described in the literature since the ground-setting works of Edward C. Monahan et al. in 1980s, the current setup is among the medium-sized installations allowing for accurate control of the air discharge, water temperature, and salinity. The size and material of the chamber offer a variety of applications due to its portability, measurement setup adjustability, and sterilization option. The experiments have been conducted in a cylindrical bubbling tank of 10 L volume that was filled by ∼ 30 %–40 % with water of controlled salt content and temperature and covered with a hermetic lid. The chamber was used to study the characteristics of aerosols produced by bursting bubbles under different conditions. In line with previous findings, the sea spray aerosol production was shown to depend linearly on the surface area covered by the bubbles, which in turn is a near-linear function of the air discharge through the water. Observed dependencies of the aerosol size spectra and particle fluxes on water salinity and temperature, being qualitatively comparable with the previous experiments, substantially refined the existing parameterizations. In particular, the bubble size was practically independent from the air discharge through the water body, except in the case of very small flows. Also, the dependence of aerosol spectrum and amount on salinity was much weaker than suggested in some previous experiments. The temperature dependence, to the contrary, was significant and consistent, with a transition in the spectrum shape at ∼ 10 ∘C. Theoretical analysis based on the basic conservation laws supported the main results of the experiments but also highlighted the need for a better understanding of the aerosol production from a cold water surface.
- Article
(7046 KB) - Full-text XML
- BibTeX
- EndNote


Sea spray aerosols (SSAs) emitted from ocean surfaces significantly affect climate, but their specific role in, e.g., cloud formation remains uncertain (Brooks and Thornton, 2018; Wilson et al., 2015). SSAs both scatter the incoming solar radiation and indirectly act as cloud condensation nuclei (CCN) or ice nuclei (IN), modifying cloud properties and precipitation patterns. The parameters influencing the production of SSAs include water temperature, salinity, sea state (wave direction, height, and shape), wind speed, and organic surface-active matter (Grythe et al., 2014; Lewis and Schwartz, 2004). Given that 70 % of the globe is covered by the oceans, the significance of SSAs is emphasized as a source of global aerosols (Grythe et al., 2014; Lewis and Schwartz, 2004; Soares et al., 2016; Sofiev et al., 2011). Furthermore, as a consequence of climate change and the complex feedback loops, the abundance and concentrations of SSAs are expected to increase in the future (Charlson et al., 1987; Latham and Smith, 1990; Soares et al., 2016).
The main mechanism of SSA production is bubble-mediated, when bubbles produced by breaking waves burst on the surface (Blanchard and Woodcock, 1980). The bursting process results in two types of droplets: film and jet. Film drops are formed when the film of a bubble cap bursts, whereas jet drops form when a vertical water capillary collapses as a result of gravity. It is known that the parent bubble size determines the number of produced film and jet drops: large bubbles produce mainly film drops, while small bubbles produce mostly jet drops (Woolf et al., 1987). Film drops are responsible for the major proportion (∼ 60 %–80 %) of sub-micrometer particles, whereas jet drops mostly contribute to the production of supermicron particles (Cipriano and Blanchard, 1981; Wang et al., 2017). A recent study by Jiang et al. (2022) reported observations of a flapping shear instability mechanism, which leads to a significant fraction of submicron aerosols produced by jet drops from very small (∼ 1 mm radius) bubbles.
Apart from size, the two types of the droplets also differ in their chemical composition: jet drops contain mostly inorganic salts, whereas the organic matter is mostly concentrated in film drops due to their mechanism of formation (Burrows et al., 2014; Wang et al., 2017). Marine bacteria and viruses are, however, found in both jet and film drops (Aller et al., 2005; Blanchard, 1989, 1978; Rastelli et al., 2017).
Another mechanism of the SSA production is the direct detachment of the water droplets from the wave crests by wind. This mechanism produces the largest aerosols but becomes significant only at very strong winds.
Numerous parameterizations have been proposed for describing the marine aerosol size spectra and the flux from the sea surface (see a critical review of Lewis and Schwartz, 2004, and later works, e.g., Sofiev et al., 2011). The most widely used approximation of marine SSA emissions was suggested by Monahan et al. (1986), albeit the majority of modern applications combine it with later amendments, expanding the emission size spectrum towards smaller particles. A consensus regarding the sub-micron and sub-0.1 µm aerosol production at the sea surface has been evolving along with the development of more sensitive and accurate measurement techniques. In one of the first approximations, Rossknecht et al. (1973) suggested an exponential shape of the marine aerosol number size distribution, though only super-micron particles were observed in the study. It has been gradually recognized, however, that particles as small as 10–30 nm in diameter comprise the bulk of the SSA number emission, but specific shapes of the spectrum suggested in different studies vary widely (Blot et al., 2013; Clarke et al., 2006; de Leeuw and Cohen, 2013; Lewis and Schwartz, 2004; Mårtensson et al., 2003, 2010; Sellegri et al., 2006). The water hydrodynamics, temperature, salinity, and wind forcing as well as the seawater chemical composition and surfactant concentrations can all modify the marine aerosol emission (Cochran et al., 2017; Mårtensson et al., 2003; Sellegri et al., 2006; Tseng et al., 1992; Tyree et al., 2007). Decreasing water temperature was suggested to shift the aerosol size distribution towards the smaller sizes (Mårtensson et al., 2003; Sellegri et al., 2006).
When SSA is generated in laboratory conditions, the challenge is to mimic the characteristics of the key processes of the bubble-mediated aerosol generation in the real environment. Commonly applied methods include atomizers and bubbling tanks with sintered glass diffusers or water jet bubbling systems (Christiansen et al., 2019; Drenckhan and Saint-Jalmes, 2015; Fuentes et al., 2010; Leifer et al., 2003; Mårtensson et al., 2003; Sellegri et al., 2006; Tyree et al., 2007). Aerosol atomizers, being widely used to produce aerosol mixtures in the laboratory, do not mimic the dynamics of the marine bubble bursting, whereas this process can be better replicated in a bubbling tank (Fuentes et al., 2010). Arguably, the closest reproduction of wave breaking and bubble generation processes was achieved in the ocean–atmosphere facility of Prather et al. (2013); however, the complexity and costs of the experiments were rather high.
Several designs of bubbling tanks have been presented (Christiansen et al., 2019; Fuentes et al., 2010; Leifer et al., 2003; Mårtensson et al., 2003; Prather et al., 2013; Rastelli et al., 2017; Salter et al., 2014; Schwier et al., 2015). The bubbling chamber presented by Mårtensson et al. (2003), one of most frequently cited works in application to atmospheric modeling, was a flask with a volume of 2.0 L that was filled with 1.0 L of water. The bubbles were generated with a sintered glass filter installed approximately 4 cm below the water surface, with pore sizes of 20–40 µm. Sellegri et al. (2006) used a 30 L sealed Perspex tank that was one-third filled and continuously flushed with 6 L min−1 of filtered air. They relied on two methods of bubble generation: weir created by pumping water and sintered glass filters. Tyree et al. (2007) constructed a bubbling tank that was a glass column filled with 7.2 L of water; the bubbles were generated using a fine- or a medium-pore diffuser (80 and 140 µm pore size, respectively). Fuentes et al. (2010) compared bubble and aerosol size distributions generated by a plunging-water jet system, porous media bubblers, and an aerosol atomizer in an 11 L polytetrafluoroethylene (PTFE) bubbling tank. Christiansen et al. (2019) performed bubbling experiments in a 34 L stainless steel, cylindrical tank using two bubble generation methods: a plunging jet and a diffuser. The varied parameters in their experiments were water temperature, bubble generation method, bubbling flow rate, and water algal concentration. Salter et al. (2014) used a 104 L stainless steel vessel coated with polytetrafluoroethylene (PTFE) below the water level and a plunging jet bubble generation method to study the effect of seawater temperature on SSA production over long periods of time. The temperature was accurately controlled with a circulating water bath containing 30 % glycerol. Schwier et al. (2015) studied the marine emission of cloud condensation nuclei (CCN), their aerosol size distribution, and the impact of the added organics on CCN. They used a portable 10 L glass tank filled with 3.6 L of seawater. The operating parameters were selected based on earlier studies (Fuentes et al., 2010; Leifer et al., 2003). Particle-free air was blown over the surface to mimic the wind effect. The effect of surfactants on CCN properties was also studied in sea spray generation tanks by Forestieri et al. (2018), King et al. (2012), and Moore et al. (2011). Many bubbling tanks included an optical system to monitor the bubble size (e.g., Leifer et al., 2003; Sellegri et al., 2006).
Many SSA generation experiments with a variety of different setups have not yet resulted in a consensus of the real-life processes forming the sea spray and aerosols. Conversely, the variety of the results and suggested parameterizations do not seem to be reducing with the increasing number of studies, except in the case of the demonstrated presence of the sub-0.1 µm particles. At the same time, parametrizations based on these experiments and applied to atmospheric composition models are not able to reproduce measured variations in atmospheric SSA emission fluxes over the globe (Sofiev et al., 2011; Textor et al., 2006; Witek et al., 2016). In particular, the dependencies of the production term on water temperature and salinity have been challenged.
The aim of the current study is to investigate the SSA production from both film and jet droplets as a function of water parameters and to compare the findings to basic analytical considerations regarding the bubble sizes and lifetime, the impact of salinity on aerosol size spectra, etc. We present a series of dedicated experiments in a new bubble-generating chamber with artificial salty water and with widely varying and tightly controlled bubbling air flow, water salinity, and temperature. To assess the effect of real water composition, two sets of experiments were conducted with water from the Mediterranean and Baltic seas. The study also lays down the technological background for further experiments with organic matter and biological species injected into the air with SSA.
The cylindrical glass bubbling tank constructed for this study has the advantages of being comparatively large among the bubbling tanks presented in Sect. 1 while also being portable, autoclavable, and equipped with multiple exit and entry points for different types of measurement devices (Fig. B1).
2.1 Assembly of the chamber
A cylindrical glass chamber (height 320 mm, diameter 204 mm, volume 10 L) and a compatible glass lid were custom made by Laborexin Oy with borosilicate glass, which is suitable for autoclaving. The interphase between the chamber and the lid is sealed with a silicon gasket and a metal ring with adjustable diameter. The chamber contains two inlets on the vertical wall (50 and 160 mm from the bottom) (Fig. B1). A capillary or a diffuser can be attached to the lower inlet and acts as a bubble-creating nozzle. For this study, we used a capillary with the upward-looking nozzle and the inner diameter of 1.2 mm, which was optimal for single-bubble formation tests and limited-airflow experiments. In particular, they produced a narrower range of bubble sizes compared to the sinter filters (e.g., we tested microporous borosilicate glass sinters filter as DURAN® Micro Filter Candle). The lid contains five inlets similar to those on the side. Particle counters, an exhaust air collecting tube, and a flush airline are connected to the chamber via lid inlets (Table 1). The inlets not connected to any external devices are sealed with plastic stoppers to form a closed system.
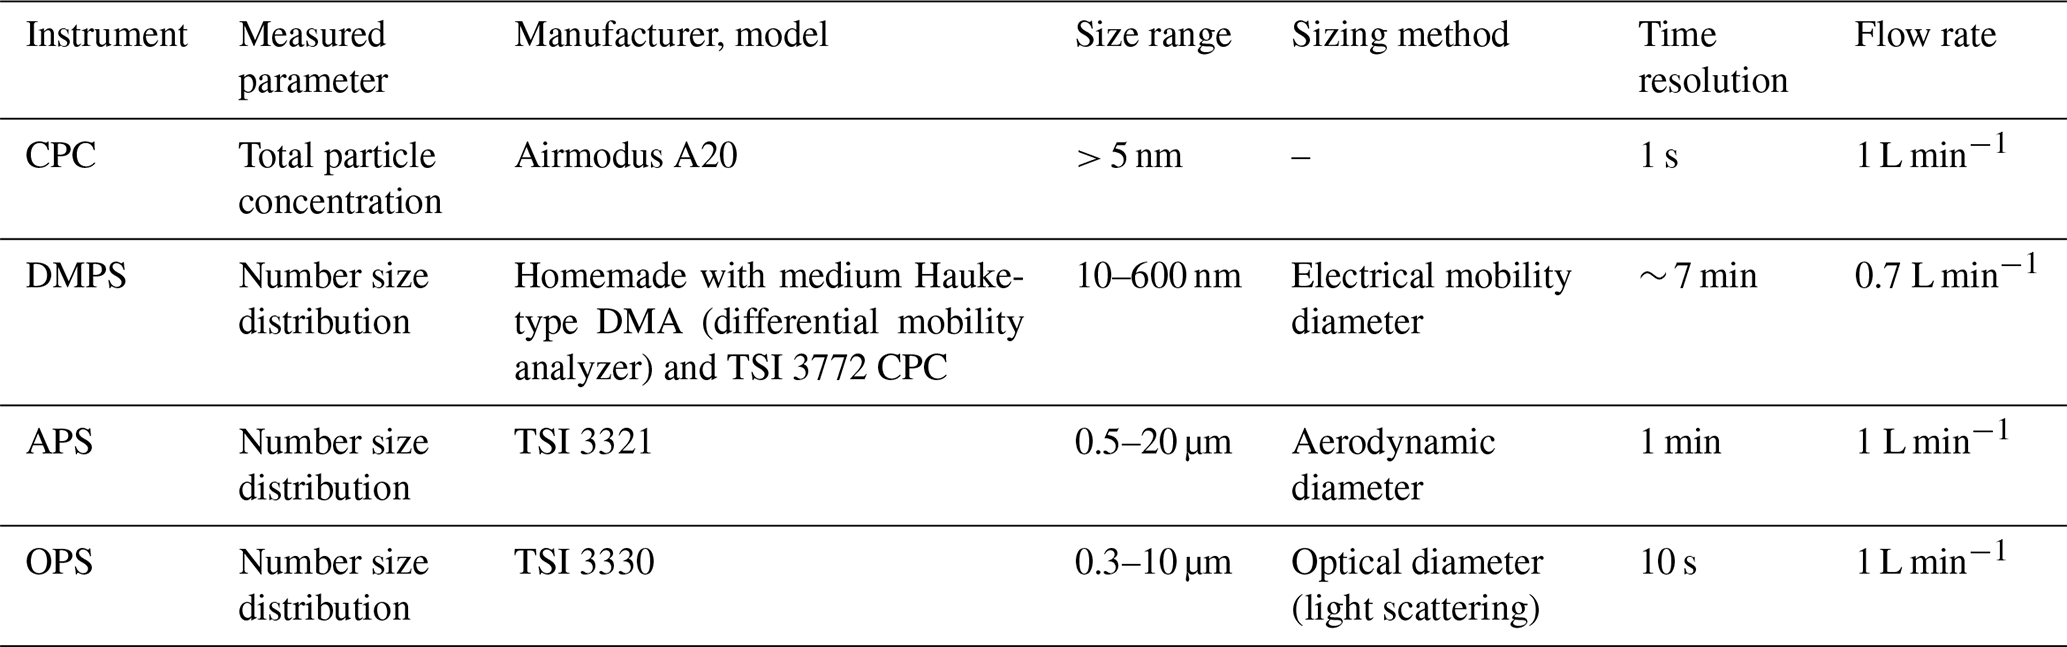
Table 1Particle counters and their specifications used in the experiment. Flow rate refers to sampling flow rate of the devices.
The chamber receives purified (2 × 1 µm pore-sized and 1 × 0.01 µm pore-sized filters – description in Appendix B), in-house compressed dry air (7 bar), which is first decreased to 2 bar and then directed to the manifold of two magnetic valves. The valve separates two air lines, hereinafter referred to as bubble and flush. The bubble line is attached to the bubble-creating capillary. The flush line attached to the lid is used to purify the system and to maintain atmospheric pressure inside the chamber. It also offers the possibility of efficiently diluting the chamber air. Both lines contain airflow controllers, and the bubble line includes an additional pressure regulator. Both lines also include a non-return valve and a ball valve to prevent water leakage.
Several tests have been conducted varying the input air stream temperature – e.g., pre-cooling it down to water temperature. The outcomes were compared to runs with the room-temperature air stream, and no difference was found. Therefore, the main set of experiments was run with the room-temperature bubbling air flow of ∼ 21 ∘C.
2.1.1 Aerosol characterization with particle counters
Four online particle counters were installed in the chamber system: a condensation particle counter (CPC), an optical particle sizer (OPS), a differential mobility particle sizer (DMPS) and an aerosol particle sizer (APS) (Table 1). The OPS, DMPS, and APS measured the particle number size distribution, and the CPC measured the total aerosol concentration in the experiments. The flow rate of each instrument was measured regularly (TSI mass flow meter 4143); DMPS raw data were inverted to final particle size distributions, as described by Wiedensohler et al. (2012) (FMI DMPS), and compared with the total CPC numbers. The specifications of the used aerosol measurement devices are listed in Table 1.
To ensure that only dry particles were measured, the sample air reaching the particle counters was dried with silica gel-based diffusion driers (Topas DDU 570). The relative humidity, RH, after the driers was monitored with Rotronic Hygroclip RH sensors and a chilled mirror dew point sensor (Edgetech DewMaster) to ensure RH < 30 %.
The equivalent particle sizes obtained by different devices and expressed as diameters are not directly comparable due to different measurement principles (see Table 1). Electrical mobility diameter measured by DMPS is a geometric diameter assuming the spherical shape of the particles. The aerodynamic diameter Da from the APS was converted to electrical mobility diameter De following Khlystov et al. (2004):
where χ is the shape factor, ρ is density, and subscripts 0 and p denote reference density and particle density, respectively. The shape factor for sodium chloride was estimated to be 1.10 for our size range based on Wang et al. (2010); the particle density was estimated to be 2.16 g cm−3, while the reference density was 1 g cm−3.
To relate the optical diameter with the electrical mobility diameter, we rely on the fact that the OPS is factory-calibrated utilizing polystyrene latex (PSL) spheres which have a refractive index of 1.588. As this is relatively close to the refractive index of sodium chloride (1.54) and since the sodium chloride shape factor is close to unity, we can assume that the difference between the PSL and the sodium chloride particle optical diameters is negligible but can cause insignificant discontinuity of the spectra over the overlapping size ranges (0.3–0.6 µm) (Viskari et al., 2012; Wiedensohler et al., 2012). Thus, the OPS data were used without any further diameter conversion.
2.1.2 Bubble size characterization with filming cameras
Two digital cameras (Creative Live! Cam Chat HD VF0790) were installed to record both horizontal and vertical views of the bubbling in the chamber. The bubble-generating air flow was sufficiently low to generate only a single layer of bubbles on the surface at all tested air flows (Fig. C1). Therefore, the images could be analyzed as two-dimensional still images from a vertical-view camera with the third dimension always being single-bubble thick. The distinctive circular shape of the interfacial bubbles allowed for the determination of the bubble diameter by photographic methods. The still images and films were used for analyzing the bubble size distributions and the foam area covering the surface (see calculations in Sect. 3.1.1, 3.1.2).
Five still images were taken for each experiment (Fig. C1, Table 2), and the images were analyzed with ImageJ software (version 1.51, National Institute of Health) (Schneider et al., 2012). The brightness and contrast were adjusted for each image to highlight the bubbles on the surface. Bubbles were characterized as circular shapes with dark outlines (Fig. C1, Appendix C). Scaling was adjusted according to the chamber diameter of 204 mm. The photographic methods for bubble size and shape determination have been compared for a range of techniques, such as the standard funnel method and the acoustic methods, generally showing good consistency (Leifer et al., 2003; Vazquez et al., 2005).
2.2 Experimental setup
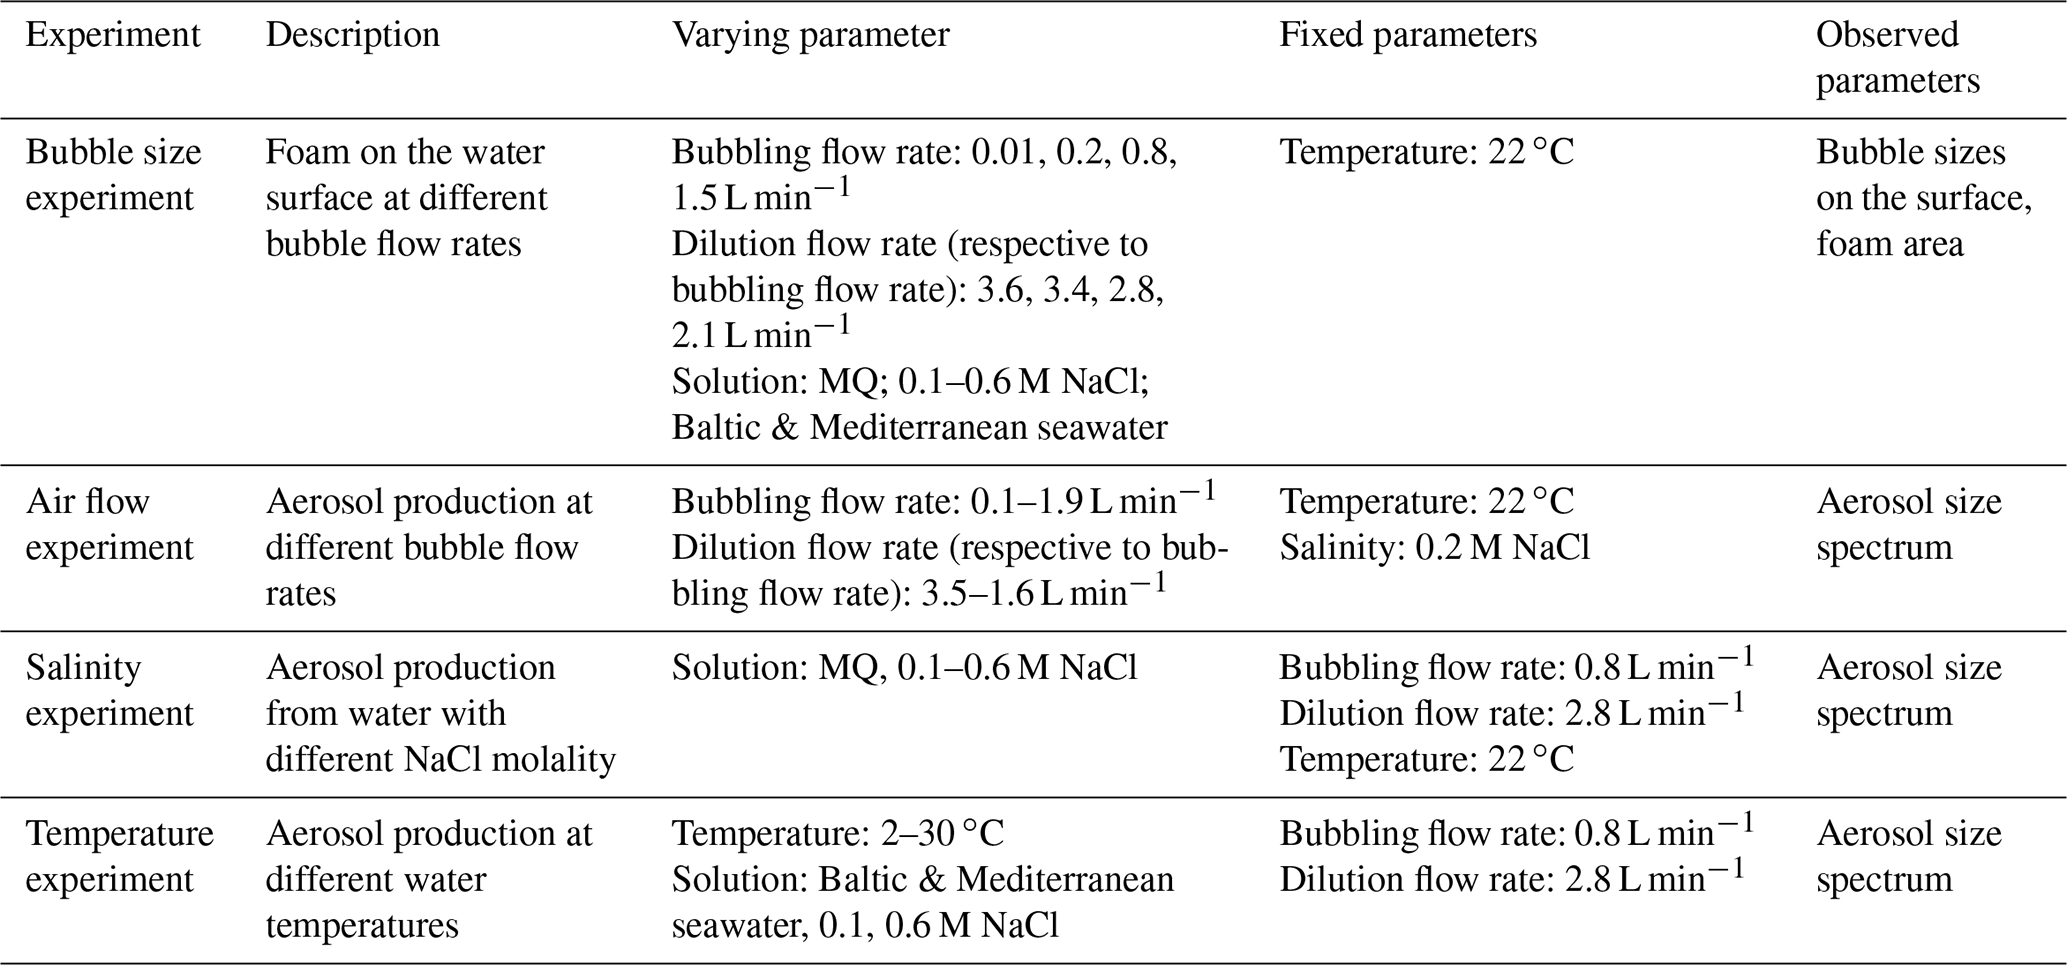
Four different sets of experiments have been performed in the chamber (Table 2). Most of the experiments were made with the chamber filled with sodium chloride (NaCl) solutions, with varying operational parameters (T, salinity, and bubble flow rate). The temperature-varying experiment also included testing the Baltic and Mediterranean seawaters. Similar protocols were applied in all experiments, as listed in Table 2 and described below. Prior to each experiment, the chamber was washed with tap water and detergent, then rinsed with MQ, autoclaved ultrapure water (type 1, resistivity > 18.2 MΩ cm) purified with Milli-Q® Direct System (used with Q-PAK® TEX-, Progard® T3-, and BioPak® UF cartridges), and allowed to air dry at room temperature. Even though the chamber can be autoclaved, sterilization was not required for the inorganic specimen experiments. At the beginning of each experiment, the chamber was flushed with purified in-house air for at least 30 min to remove all remaining particles from the system. After changing the controlling parameter, the system was let to equilibrate for 30 min prior to beginning the sampling. Sampling times ranged from 30 to 60 min.
The size of the chamber (Fig. B1) and the selected flow rates (Table 2) ensured that an upward air flow in the chamber created by the bubble air flow did not exceed 0.2 mm s−1 in any of our experiments. Such velocity is lower than the dry deposition velocity of any of the produced particles (Kouznetsov and Sofiev, 2012). The slowest deposition velocity of ∼ 1 mm s−1, which is still several times faster than the upward air flow in the chamber, is characteristic for smooth water surface and sub-micron particles. Therefore, the large diameter of the chamber allowed one to neglect the upward flux due to the bubble-generating air flow. It also made the particle deposition on the chamber walls insignificant compared to its production from the foam in the center of the chamber.
In the bubble size experiment, bubble production from 4 L of 0.1, 0.2, 0.3, 0.4, 0.5, and 0.6 M (5.8, 11.7, 17.5, 23.4, 29.3, and 35.1 g L−1, respectively) NaCl-solutions as well as from the Baltic and Mediterranean seawaters at 0.01, 0.2, 0.8, and 1.5 L min−1 bubble air flow rate was monitored with cameras. Bubble sizes were determined from still images of the vertical camera, as described in Sect. 2.1.2.
In the air flow experiment, 4 L of MQ and 0.1 M NaCl-solution were tested at bubbling air flow rates of 0.1, 0.3, 0.5, 0.7, 0.9, 1.1, 1.3, 1.5, 1.7, and 1.9 L min−1 to examine the effect of changing air flow on aerosol production, comparing pure and saline water (Sect. 3.1.2.). Based on these results, a flow rate of 0.8 L min−1 in the bubble line was selected for the following salinity and temperature experiments, since such flow rate ensured the optimal bubble generation and aerosol release – specifically, a sufficient amount of released aerosols for observing the whole particle size spectrum while still being limited to a single-bubble-thick foam area.
In the salinity experiment, the aerosol production was measured in 4 L of MQ – with NaCl concentrations varying from 0.1 to 0.6 M – at 0.1 intervals, maintaining the 0.8 L min−1 bubble line air flow rate at the room temperature of 22 ∘C.
The effect of varying temperature on aerosol size spectra was tested in 0.1 and 0.6 M NaCl solutions and in Baltic and Mediterranean seawaters. NaCl concentrations were selected to be equivalent to the range of seawater molarities: 0.1 M, corresponding to the concentration of the Baltic Sea (on average 10 ‰; Laakso et al., 2018), and 0.6 M, corresponding to that of the Mediterranean Sea (38 ‰; Borghini et al., 2014). The concentration of NaCl in the chamber was adjusted using sterile 5 M NaCl stock solution. The chamber was insulated with a plastic foam in order to maintain the temperature as constantly as possible while measuring. The tests were run at 2, 5, 9, 11, 13, 19.5, 25, and 30 ∘C. The volume of the artificial saline water was 4 L, and the volume of the natural seawaters was 2.7 L. Before the experiment, 0.5 L of water were frozen to ice cubes, added to the rest of the water, and thawed immediately before sampling. The remaining 3.5 L of saline water and 2.2 L of seawaters as well as the chamber and the insulations were kept at 4 ∘C overnight prior to the experiment. As a result, the solution reached as low as 2 ∘C, which was the first measurement point of the experiment (Table 2). Each measurement period lasted approximately 35 min, during which the temperature rose or went down by max 1–2 ∘C, depending on the relation between water and room temperature. A heating magnetic stirrer (Witeg Premium Hotplate Stirrer MSH-30D) was used for temperature control and water mixing.
Baltic Sea water was collected on 3 June 2018 at 08:40 UTC from Utö Island, Finland (59∘46.840′ N, 21∘22.130′ E), approximately 500 m from the shore. The surface microlayer was collected and stored in sterile plastic bottles. Bottles were transported to Helsinki within 9 h, keeping them at room temperature, after which they were frozen. Mediterranean Sea water was collected on 7 July 2018 at 13:00 UTC from Miami Playa, Spain (40∘59′53.2′′ N, 0∘56′04.3′′ E). At the time of sampling, the distance from the shore was 200–300 m. The bottles were frozen approximately 30 min after collection and transported in the frozen state to Helsinki.
3.1 Generation of bubbles and their lifetime
The generation and lifecycle of bubbles on the surface of various liquids has been attracting attention for centuries (Maxwell, 1874; Plateau, 1873). Despite the extensive interest and developed comprehensive models, substantial uncertainty still exists, mainly owing to the extreme complexity and diversity of the governing processes (Lewis and Schwartz, 2004; Lorenceau and Rouyer, 2020; Poulain et al., 2018).
Within the current study, we concentrate only on two parameters related to the bubble production: the characteristic bubble size and the bubble foam lifetime at the water surface. These parameters are important for future construction of a physical model of the sea spray generation. Wherever possible, the experiments are presented together with basic theoretical considerations, highlighting the controlling mechanisms and suggesting the shapes of the key dependencies.
3.1.1 Bubble size for different flow rates and salinities
The bubble formation and departure from the surface of the air-supply capillary on which it is formed are controlled by water density, surface tension, and the wettability of the surface on which the bubble is formed. If kinematic effects of the outgoing air jet can be neglected (air flow < 1 L min−1, see Sect. 3.1.2), the bubble breakout occurs when the buoyancy lifting the bubble exceeds the surface tension force, which attaches it to the surface (Fig. 1).
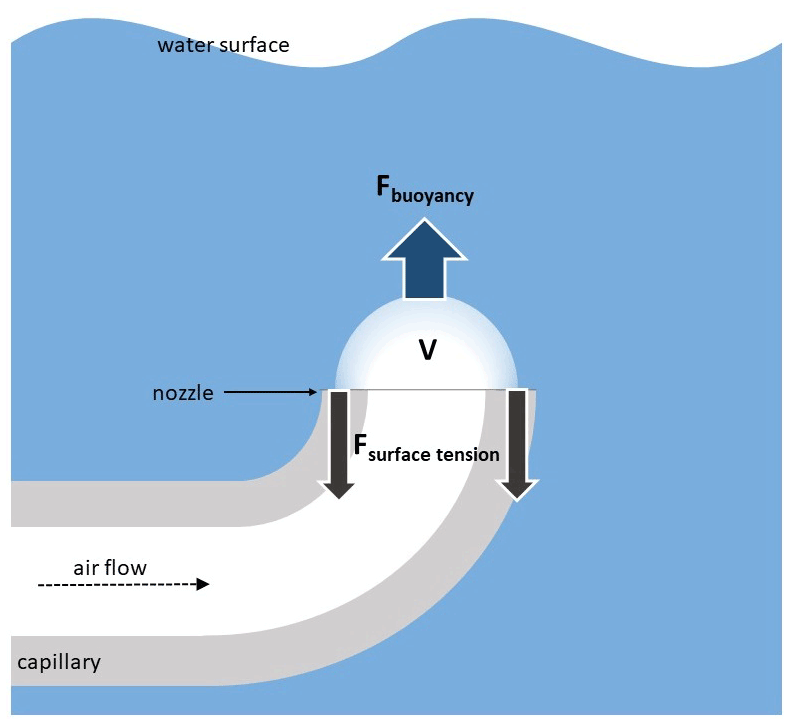
Figure 1Schematic representation of forces affecting a bubble at the capillary nozzle surface. V is volume of the bubble, Fbuoyancy is Archimedean force. Fsurface tension is the surface tension pulling down at the rim of the bubble.
Denoting the volume of the forming bubble as V, its diameter at the breakout plane as Db, water surface tension as γ, air and water densities as ρa and ρw, respectively, and gravity acceleration as g, one obtains the following relation for the breakout moment:
For pure water at 293 K, γ ∼ 73 mN m−1 (Pátek et al., 2016). The shape of the detaching bubble and, consequently, the relation between Vb and Db determine the final bubble volume. Here and in the below analysis, the water layer above the forming bubble is assumed to be thin, so that the additional pressure due to overlaying water can be neglected.
Analysis of videos of the bubble production suggested two distinct regimes of the bubble formation: (i) slow formation of a bubble at a capillary exit (Fig. 1), and (ii) bubble formation occurs far from the capillary due to the fast injection of air jet into the water body (the regime with kinematic effect). The slow bubble formation regime can be altered depending on capillary configuration: bubble formation at the exit plane of the upward-looking capillary or formation of a bubble around the exit hole of the downward or sideways looking capillary.

Figure 2Bubble sizes for different flow rates and water salinities formed from the upwards-looking capillary. Boxes span over quartiles Q1–Q3, with medians shown as a horizontal dash. The upper whisker extends from the hinge to the highest value that is within 1.5 × IQR of the hinge (Q1–Q3 distance). The lower whisker extends from the hinge to the lowest value within 1.5 × IQR of the hinge. Data beyond the end of the whiskers are considered as outliers and plotted as points.
For the upward-looking capillary (Fig. 1) used in all experiments discussed below, the forming bubble has the horizontal diameter equal to that of the capillary, whereas its volume is computed from the Eq. (1), with Db equal to the capillary diameter Dcap. The experiment was performed with Dcap=1.2 mm, i.e., the final bubble volume was 28 mm3, and the diameter of the rising spherical bubble (after it detached from the capillary and became spherical) was 3.7 mm. This prediction matches closely the experimental mean size of 3.74 mm (Fig. 2, 0.01 L min−1 flow, artificial water).
Equation (1) also describes the disintegration of the powerful air jet injected with high speed into the water body away from the capillary. Individual bubbles are formed dynamically, but their separation from the agglomerates is presumed to be controlled by the same competition between the surface tension keeping a large air volume together and the buoyancy promoting the random fluctuations in the shape of this volume and detaching the individual bubbles from it. This semi-qualitative reasoning was confirmed in the experiment, which showed same bubble size ∼ 7 mm for air flows of 0.2 and 0.8 L min−1 when the jet was sufficiently powerful but not yet producing large disturbances in the tank (Fig. 2). Finally, the jet produced by an air flow of 1.5 L min−1 (air speed in the capillary exceeding 20 m s−1) caused sufficient turbulence to disintegrate the large bubbles, broadening the size distribution towards the small ranges and getting closer to the bubble size ranges reported for plunger systems, aquarium aerators, and natural conditions (Deane and Stokes, 2002; Fuentes et al., 2010; Stokes et al., 2013). This effect was also visible at 0.8 L min−1 air flow, which can be considered as an upper limit of applicability of the above models and as the optimal air flow ensuring sufficient aerosol production and acceptable bubble size range without excessive dynamic effects.
Broadening of the distributions of Fig. 2 towards very large bubbles for powerful air flows has no relation to the production mechanisms. It refers to coagulation of aged bubbles.
For salty water, both density and surface tension change, but the variations do not exceed 10 % (Kalová and Mareš, 2018; Wang et al., 2018; Wen et al., 2018) and can be neglected, in full agreement with the experiment, which did not show significant salinity-driven variations.
3.1.2 Foam area and aerosol production
The foam area obtained during the bubble generation experiment showed a nearly linear dependence on the bubble flow rate (Fig. 3). A more precise fitting made for all salinities (excluding the Baltic and Mediterranean water samples) leads to a power-law relation showing some saturation:
Here, F0 and A0 are experimentally determined scaling factors. F0=0.01 L min−1 is flow scale, and A0=0.72 cm2 is area scale; together, they describe the geometry of the experiment relating the foam area A to the air flow F. The normalized root mean square error (RMSE) of the fit (2) is < 4 %. For smaller airflows approaching F0, no foam is formed: the bubbles are generated slower than they break.
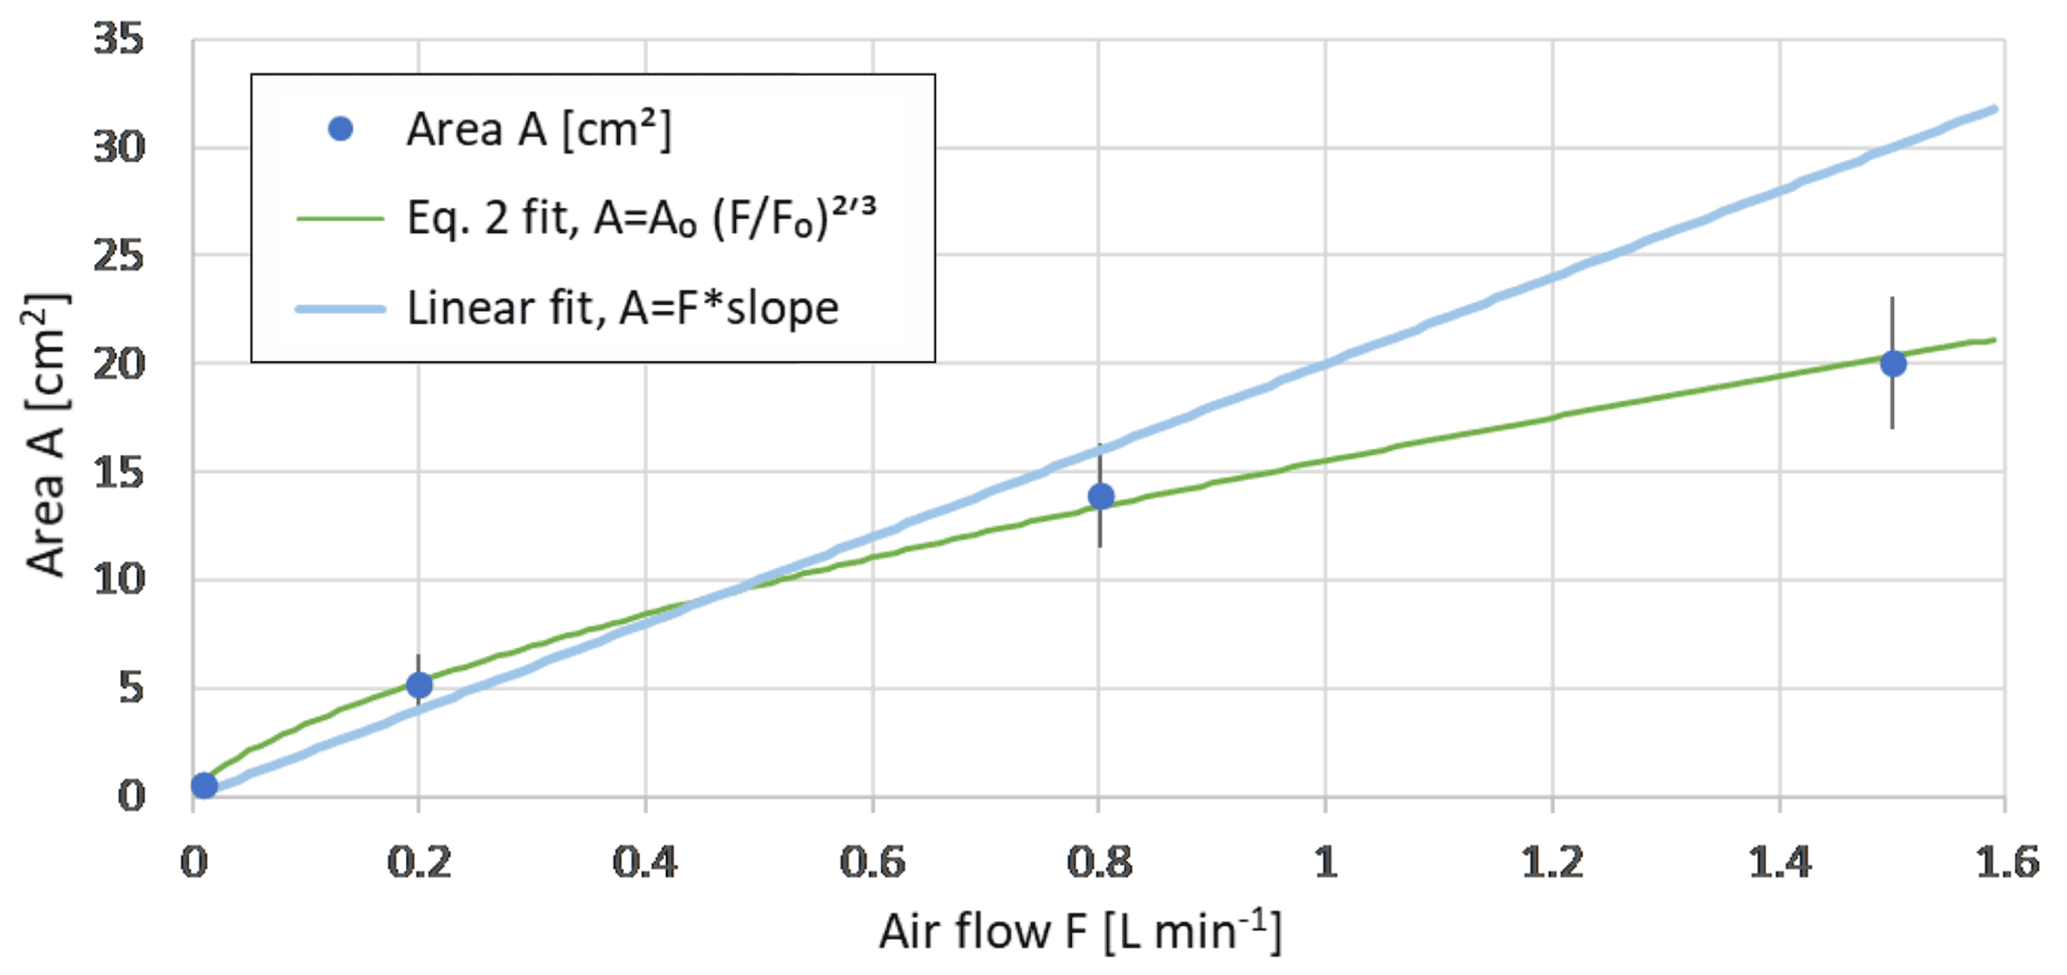
Figure 3Bubble foam area vs flow rate, fit of Eq. (2). Mean foam area calculated from MQ and NaCl-solutions observations at +21 ∘C. The green line shows the fit of Eq. (2), and the light blue line shows the linear fit to the mean foam area A. Error bars show standard deviation.
Comparing the linear and two-thirds power fits in Fig. 3, one can see that the bubble coagulation and the foam thickening become significant only for the flow above 1 L min−1. Omitting the F=1.5 L min−1 and making a zero-intercept linear regression through the remaining points (Fig. 3), one obtains the slope of 20 cm2 min L−1 = 0.033 s m−1. Assuming that the foam thickness h is equal to the bubble diameter db ∼ 7 mm, one gets 4.7 s as a typical lifetime of the bubbles obtained in the experiment. For smaller bubbles (thinner foam, smaller foam area, lower air flow), lifetime increases, i.e., the large bubbles produced by coagulation tend to burst faster.
The above estimate, however, should be taken with caution, because the dependence of the observed particle number concentration (presumably, linearly related to the foam area) on the flow rate was more complicated. In fact, the total aerosol concentration for low flow rates was practically stable, whereas for high rates, it grew faster than linear with the flow rate (Fig. 4), with certain change of behavior at ∼ 1 L min−1. Combined with the near-linear relation of the foam area and flow rate (Fig. 3), it suggests a reduction of the bubble lifetime with growing air flow rate. This is because, for the large foam area and strong air flow, new-coming bubbles squeeze into the center of the already existing foam, which leads to intense coagulation in the middle of the foam-covered area. In turn, coagulation results in the formation of large bubbles, which, as shown above, tend to burst faster. Therefore, below, we concentrate on the experiments with the bubble flow F lower but close to 1 L min−1 and accept linear relation of the foam area and bubble air flow.

Figure 4Total aerosol number concentration for MQ and 0.1 M NaCl-solution as a function of the flow rate from bubble generation line.
3.2 Produced aerosol size distributions
Typical size distributions obtained in the experiments have two distinct ranges with different slopes: Dp smaller and larger ∼ 2 µm (Fig. 5). These ranges roughly correspond to those of different mechanisms of the particle formation: film- and jet-originated bubbles (Monahan et al., 1986; Wang et al., 2017). A recent study (Jiang et al., 2022) also suggested that, in general, there might be some sub-micron contribution of jet droplets from small bubbles, but the addition is a few tens of %, hardly visible in the log–log charts. Also, in the current experiment the, bubble size was controlled, which further restricted the effect.
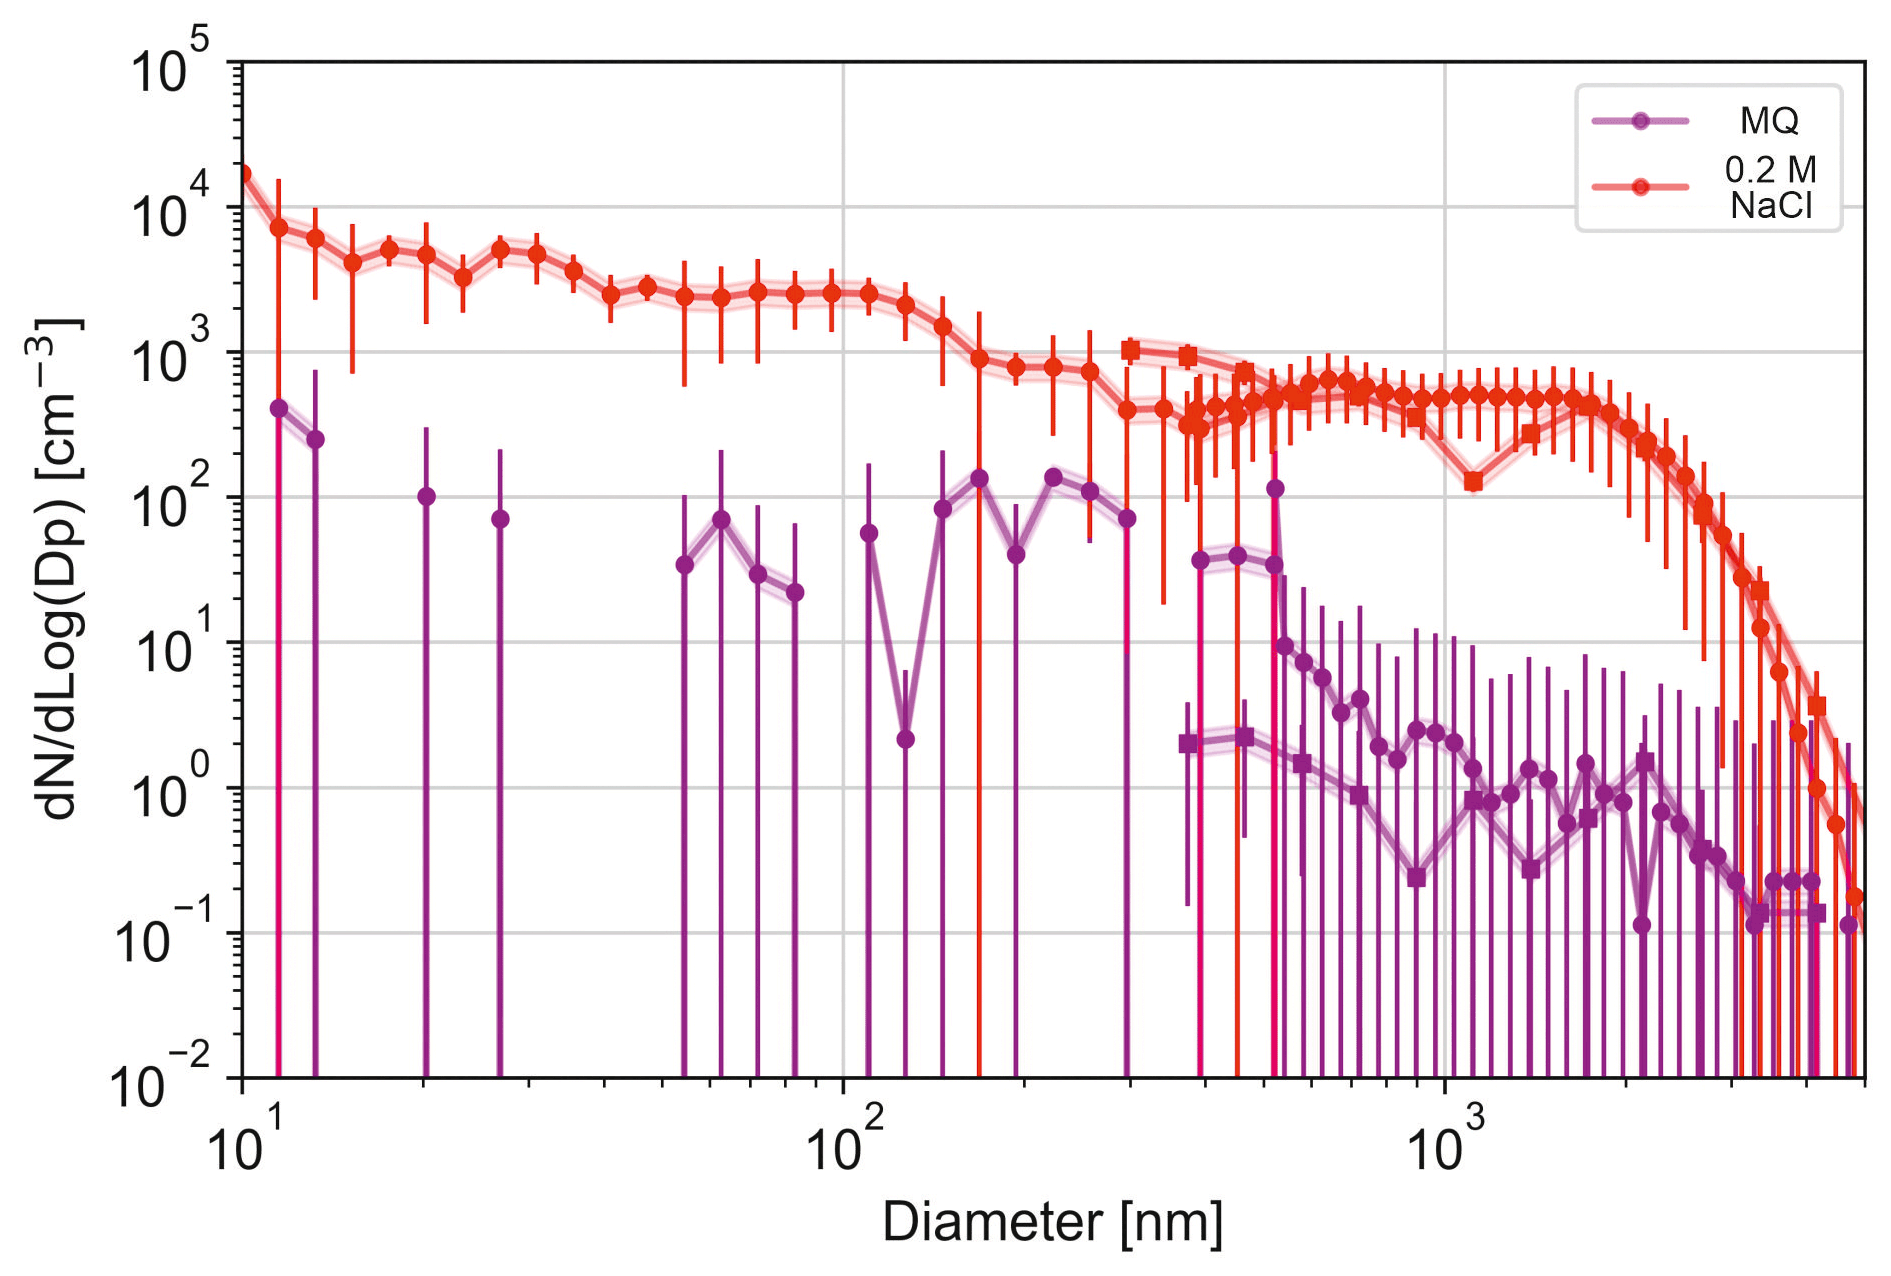
Figure 5Aerosol size distribution for MQ water (lilac markers) bubbled at 0.8 L min−1 and 0.2 M NaCl-solution (red markers) bubbled at 0.8 L min−1, as measured with the DMPS (circles), APS (circles), and OPS (rectangles). Shading indicates pm 20 % deviation and is based on a measured uncertainty range of the system using MQ water only. Error bars show the measured standard deviation during the experiments.
The curves on Fig. 5 reveal two other peculiarities: (i) there is no reduction of the particle number concentration towards the Dp = 10 nm limit of the experimental range, and (ii) the MQ water, albeit showing very few particles larger than 30 nm and significantly fewer particles than salty water across the experimental range, still produces a total number of particles comparable to the salty water. The same result was obtained for double-distilled water (not shown), suggesting that even these artificially purified liquids still contain minuscule amounts of impurities, which do not allow the droplets to evaporate completely, instead forming very small particles (Fig. 5). The effect is known and has been hypothesized to originate from residual water impurities but was also shown to greatly depend on container material, thus suggesting leaching from the walls as one of potential mechanisms (LaFranchi et al., 2003).
3.3 Impact of salinity on aerosol spectra
The observed effect of water salinity on the aerosol sizes is summarized in Fig. 6 via the bin-wise ratio of spectra at different salinities to that of the S = 0.6 M. As one can see, the effect is quite small and not uniform through the Dp range. In particular, lower salinity leads to a clear reduction of coarse and very small particles, whereas the intermediate-sized aerosols have a tendency to grow. The amplitude of the effect does not exceed a factor of 3–4, except for the coarsest aerosols and very low salinities. The number concentrations of coarse aerosols (Dp > 5 µm) were very low (Fig. 5), so the ratios in Fig. 6 for S < 0.3 M should be taken with caution (the error bars are not shown for clarity of the picture).
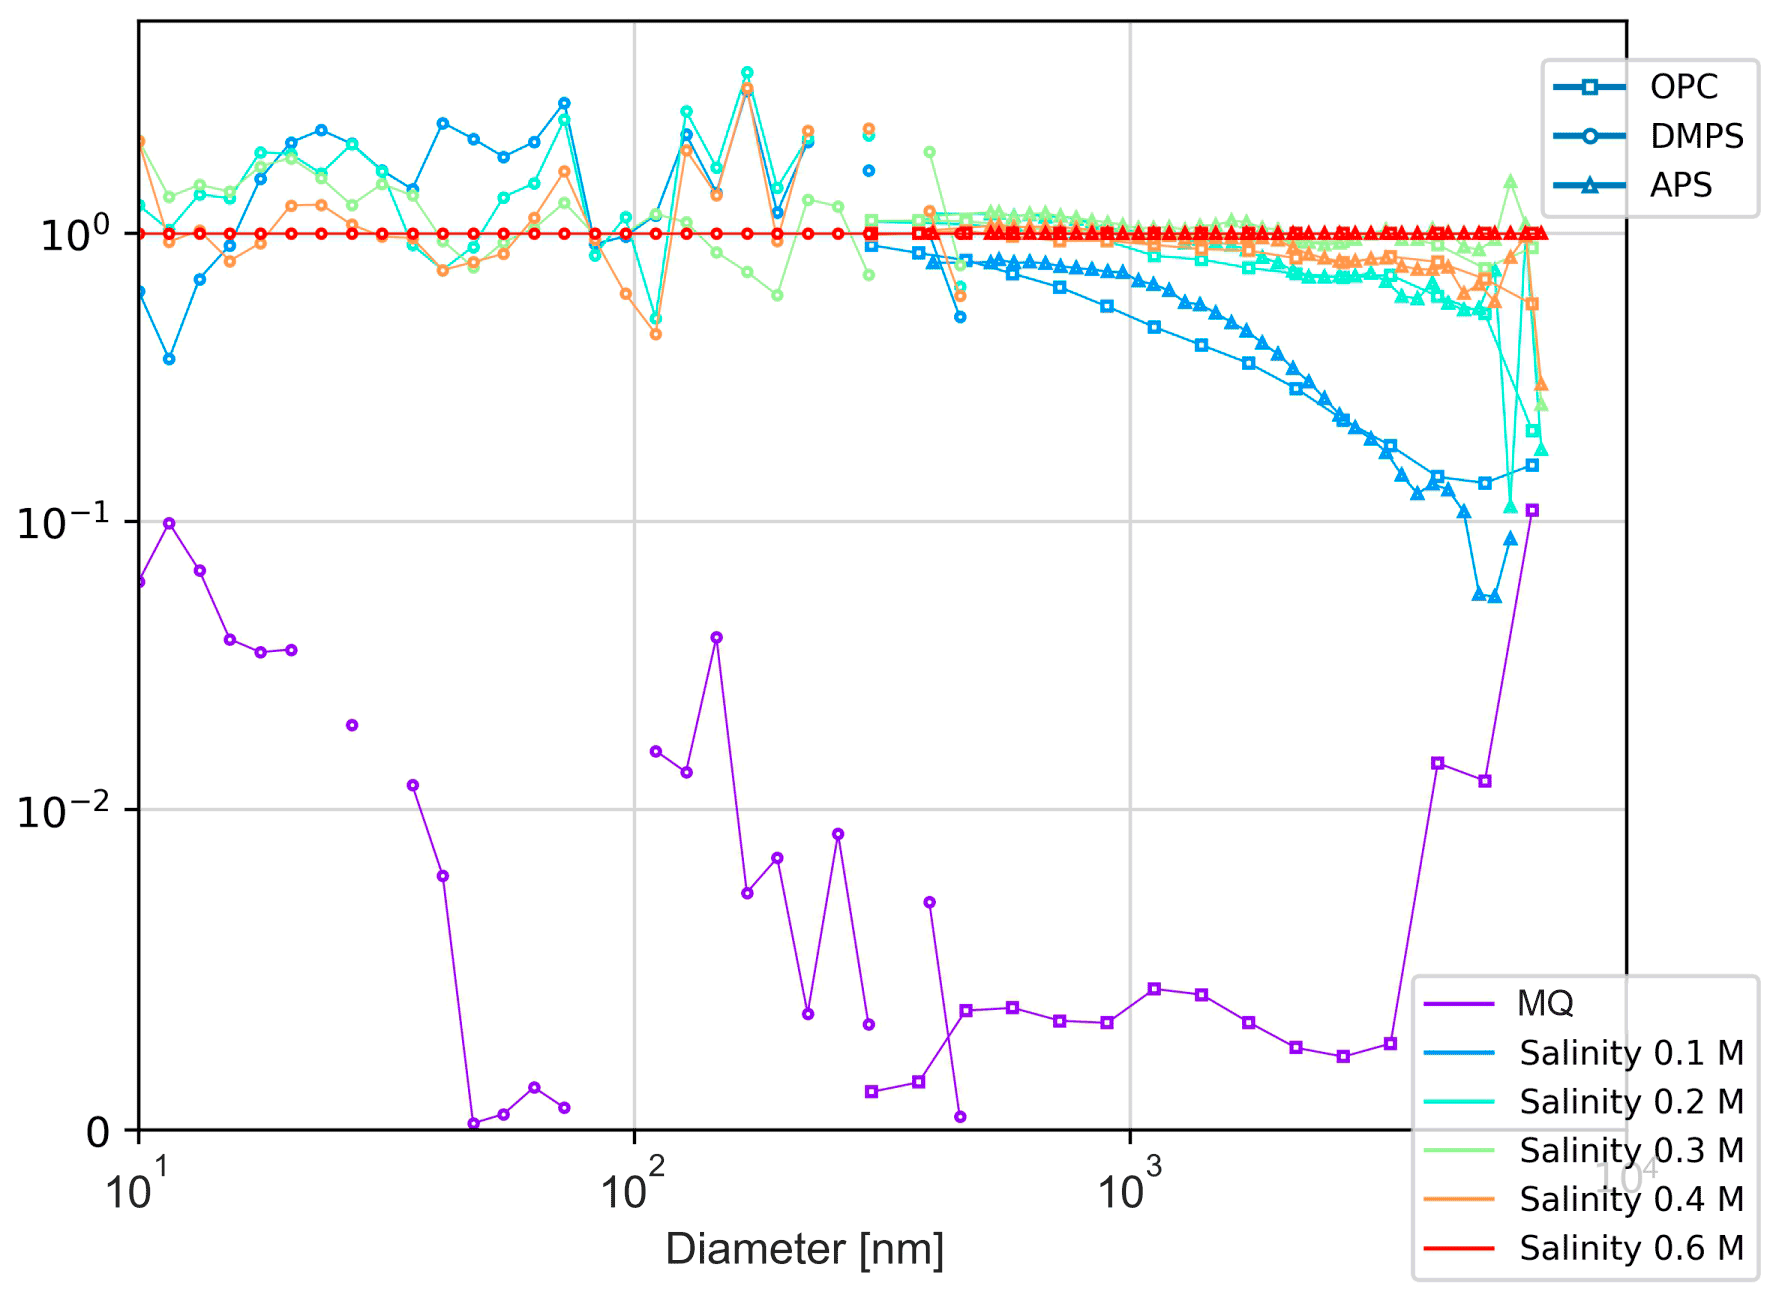
Figure 6Salinity effect on particle size spectrum: the spectra for different salinities normalized with the spectrum of the salinity S = 0.6 M.
The obtained relations are in sharp contrast to the dependencies suggested by the comparatively similar but smaller-scale experiment of Mårtensson et al. (2003), who reported more than 1 order of magnitude difference between the 3 % and 0.9 % salinities. However, an explanation for such a sharp effect was not provided. A simple physical mechanism of the salinity effect presented in the Sect. 4 (Discussion) suggests a much smaller effect, in agreement with Fig. 6.
3.4 Effect of water temperature on aerosol spectra
The experiments with varying water temperature (Figs. 7, 8) also brought about peculiar results, observed in all experiments and confirmed in numerous repetitions.
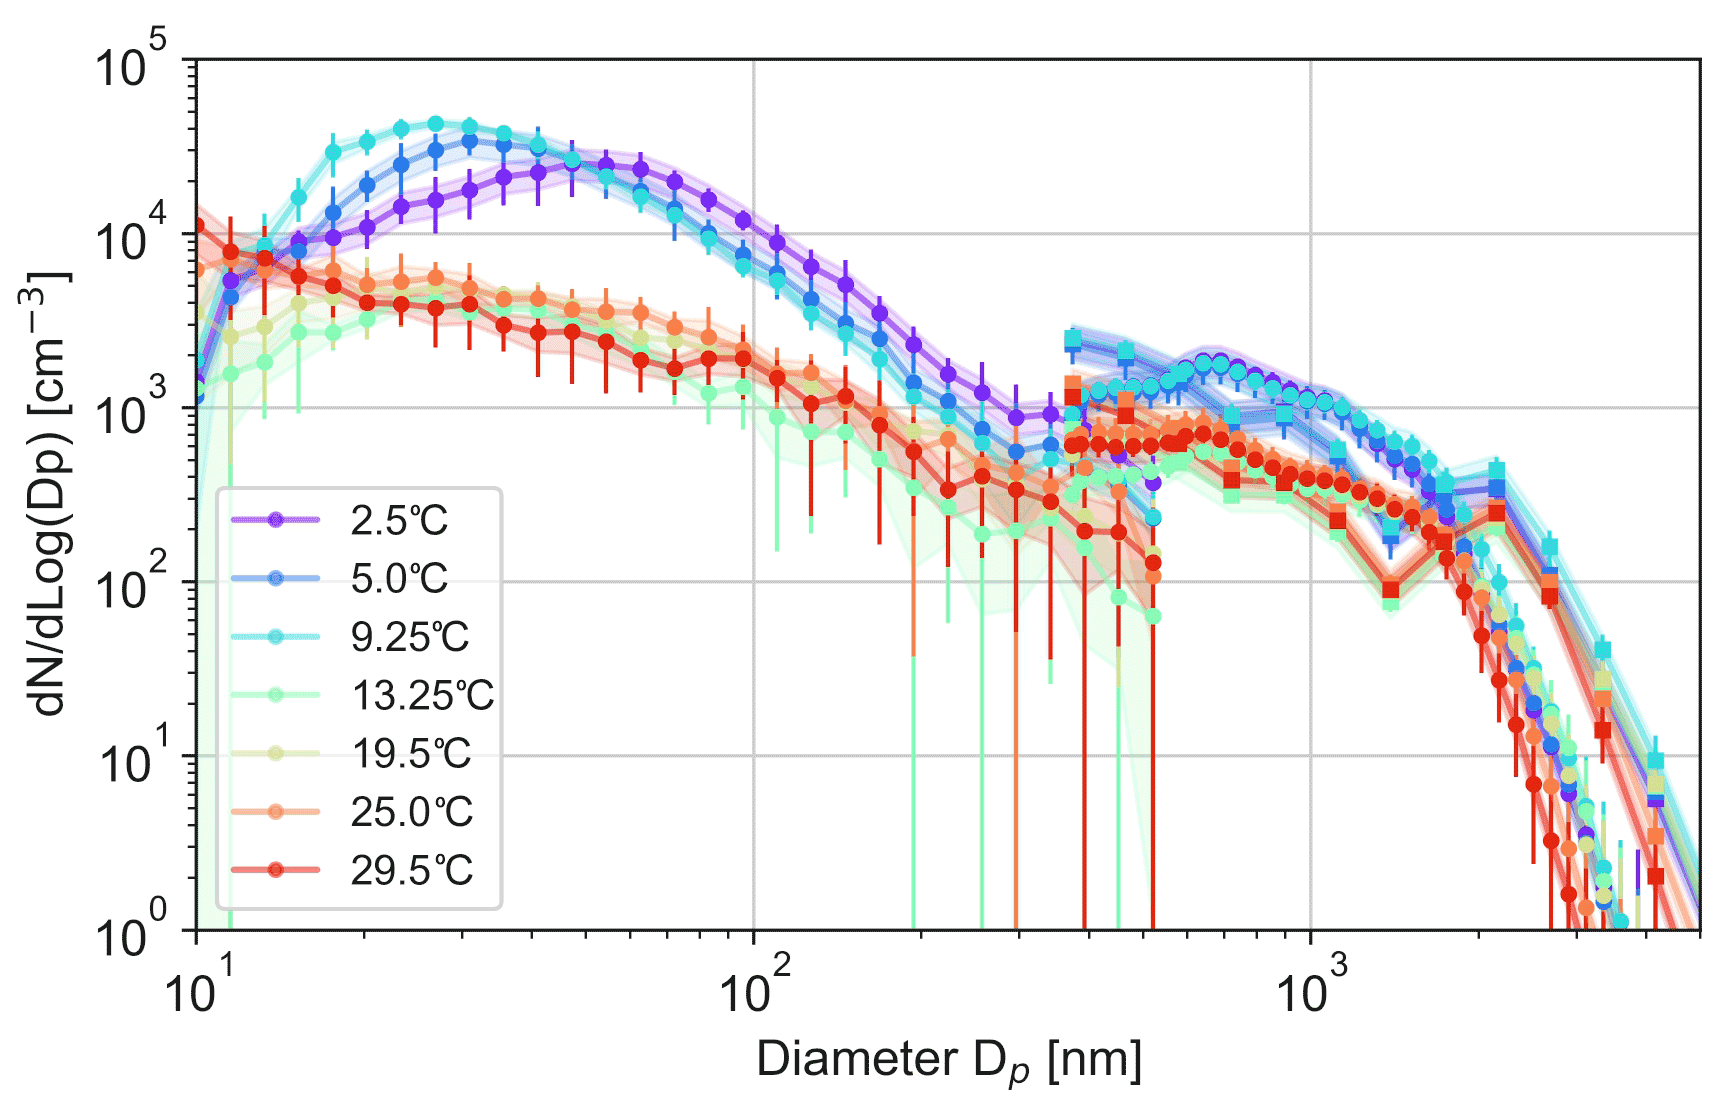
Figure 7Aerosol size distributions for 0.1 M NaCl solution bubbled at 0.8 L min−1, as measured with the DMPS (circles), OPS (rectangles), and APS (circles) for different water temperatures. During the experiments (∼ 30 min each), water temperature was rising or falling by 1–2∘ max, depending on the relation between water and room temperatures. Legend presents mean temperature for each experiment.
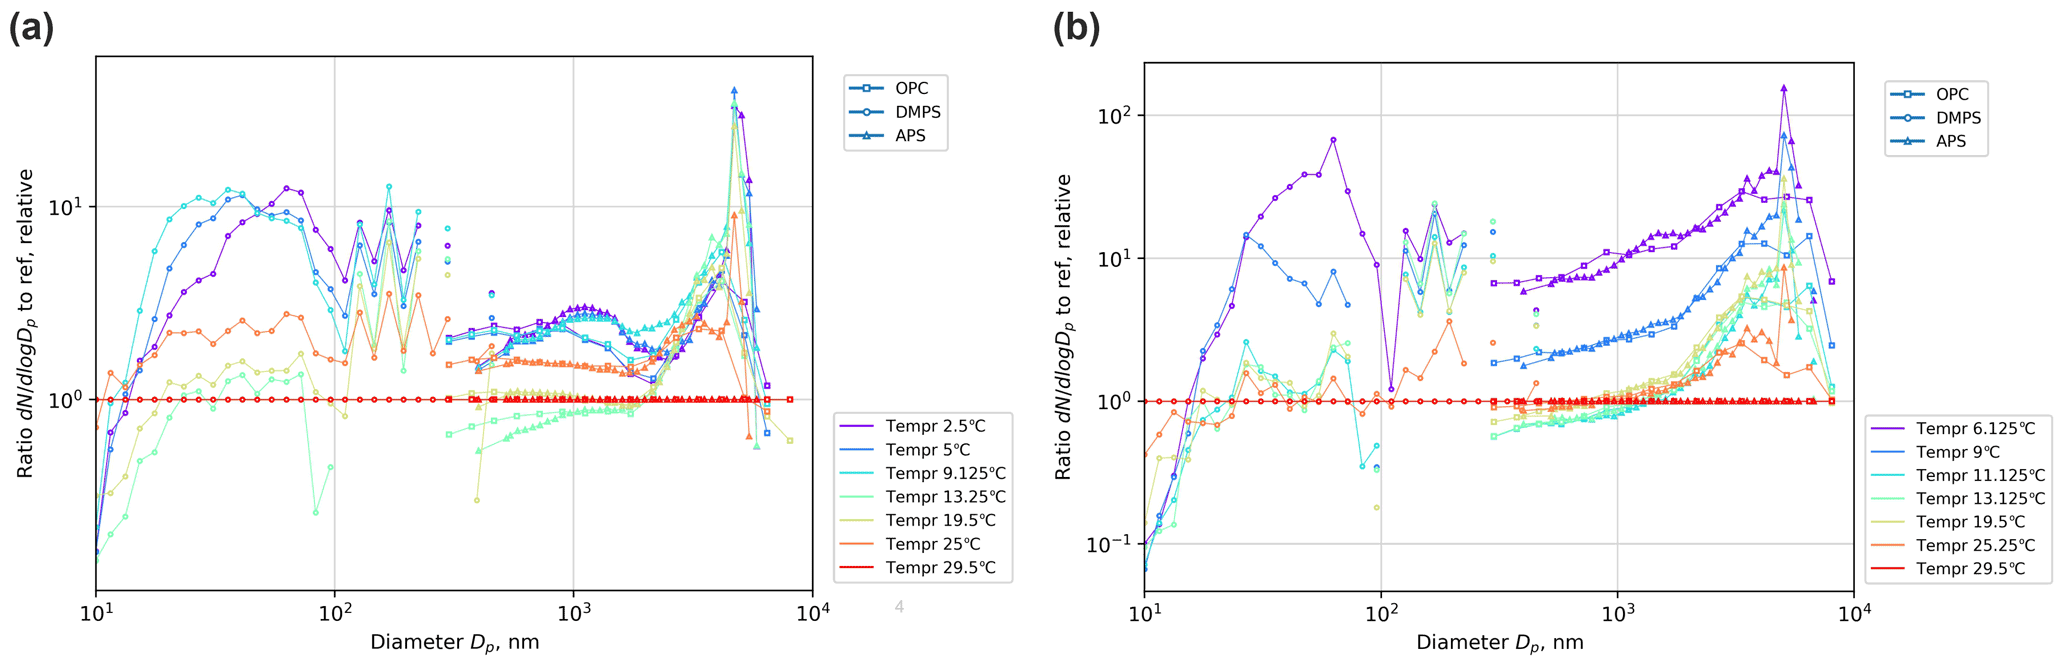
Figure 8Water temperature effect on particle size spectrum for salinity S = 0.1 M (a) and S = 0.6 M (b). In both panels, the spectra for different temperatures are normalized with the spectrum at T = 29.5 ∘C and the corresponding salinity. Color legends present mean temperatures of the experiments.
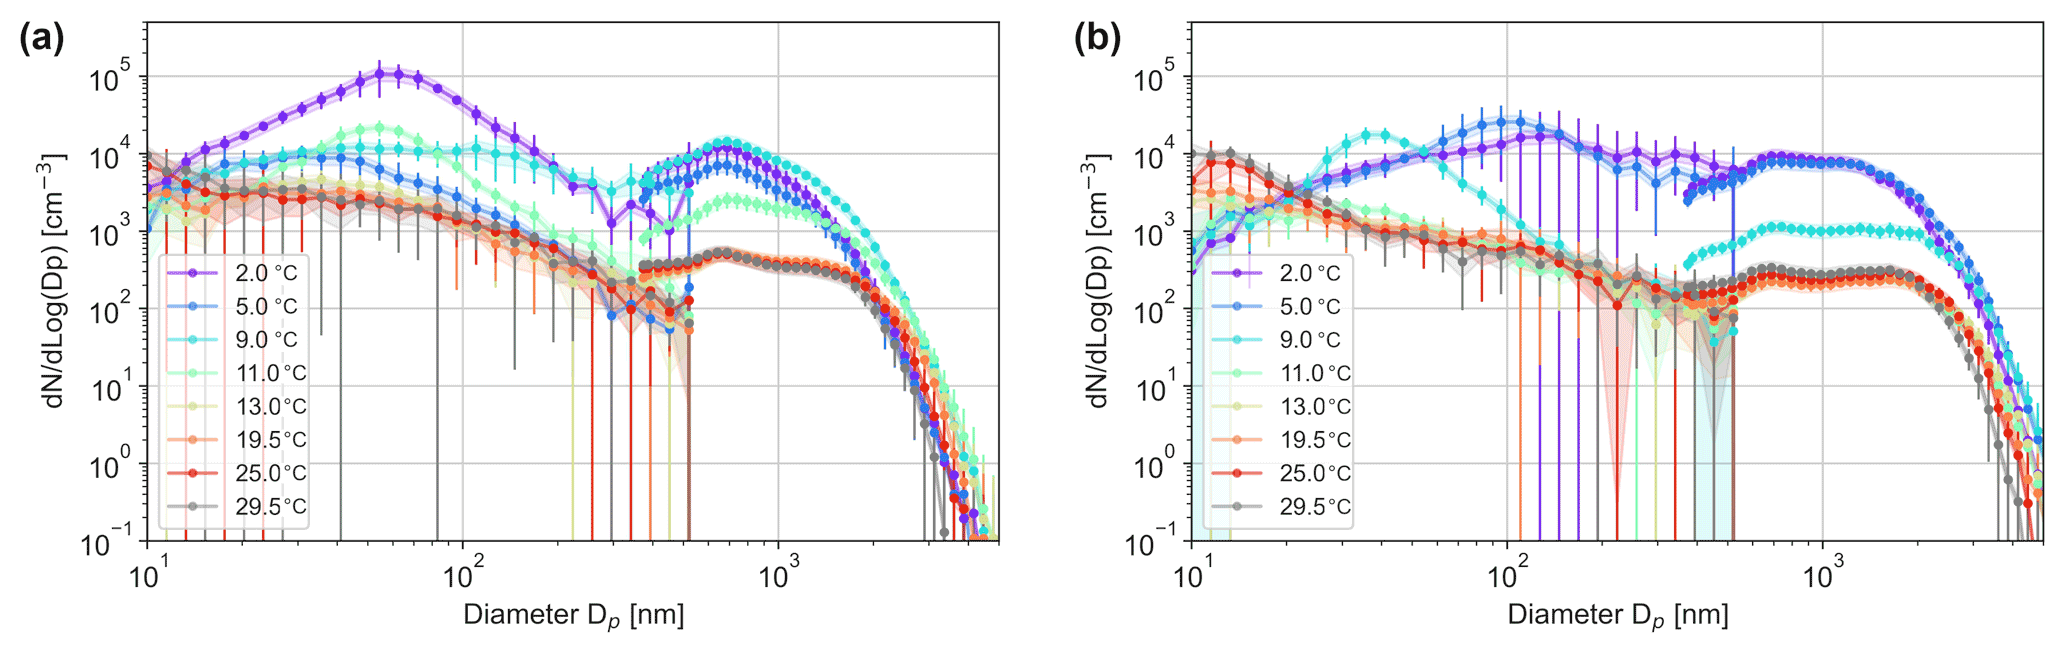
Figure 9Temperature-dependent aerosol size distributions for Baltic (a) and Mediterranean (b) seawater bubbled at 0.8 L min−1, measured with DMPS (circles) and APS (circles).
Firstly, the sensitivity of sub-100 nm particles appeared to be significantly higher than that of coarser ones. There was also some shift of the peak of the distribution: for the coldest water (2.5 ∘C), the size distribution has a peak at ∼ 60 nm, which shifts towards smaller sizes with growing temperature, so that at 10 ∘C, the distribution monotonically decreases, starting from the smallest measured size of 10 nm. Figure 8 also suggests a high temperature sensitivity in the production of particles > 2 µm in diameter, but this conclusion should be taken with caution, because the absolute concentrations of these particles were small (Fig. 7). The same trends were observed for all salinities (Figs. 7, 8, see also Fig. 11 in Discussion section).
Secondly, the dependence exhibits a sharp change at Tw ∼ 10 ∘C. For warmer water, the dependence is essentially negligible, but for colder water the dependence is steep: the difference in the production of small particles at 10 and 2.5 ∘C exceeds 1 order of magnitude. There is also a dependence on salinity: for low-saline water, the effect is smaller.
These findings are also in sharp contrast to those of Mårtensson et al. (2003) but broadly agree with the recent results of Nielsen and Bilde (2020), who measured the total particle counts coming from the burst of individual bubbles, and are in excellent agreement with Zábori et al. (2012), who also noticed 10 ∘C to be a threshold of the temperature dependence. Possible reasons for the effect are discussed in Sect. 4 (Discussion).
Throughout almost all experiments, a substantial discontinuity was observed between the concentrations reported by DMPS and APS/OPC for the common size range of Dp of 400–500 nm. The same issue is also evident in other experiments jointly using these devices (Viskari et al., 2012; Wiedensohler et al., 2012). Since the DMPS uncertainty grew starting from practically 200 nm, we conclude that the APS/OPC data show more accurate results. For the normalized relations (Fig. 8), such discontinuity is smaller than the fluctuations of the curves themselves and therefore does not affect the conclusions of the study.
3.5 Aerosol spectra for seawater samples
The experiment included two water samples collected from the Mediterranean and Baltic seas. They were included in the flow and temperature tests (Figs. 2, 9). The seawater sessions confirmed the above-mentioned temperature dependence of the particle spectra: a sharp difference in aerosol production for warm and cold water, with the threshold being around 10 ∘C. For water colder than 10 ∘C, production of sub-micron aerosols is much larger and becomes sensitive to water temperature. However, for water warmer than 10 ∘C, there is practically no dependence of the particle spectrum on temperature across all sizes.
For the Mediterranean Sea water, the particle size distribution has increased concentrations at Dp < 1000 nm, which can be observed at low temperatures. The effect seems more pronounced than for artificial NaCl-solutions. However, the distributions retract to a single baseline at temperatures > 11 ∘C.
The results for the Baltic Sea water show high similarity to the results for artificial NaCl-solutions. Low temperatures exhibit increased concentrations at all size ranges, yet the peak for 100 nm < Dp < 1000 nm is less evident.
The difference between the panels can also be related to the salinity effect: the Baltic water has about 0.93 % salt, whereas the Mediterranean has ∼ 3 %. In full agreement with the salinity tests, the distributions and the total particle production are very similar, sometimes being even higher for the less-saline water of the Baltic Sea. However, direct comparison may be inaccurate, because the biological content of these seas is very different, which can affect the water surface properties, bubble lifetime, and aerosol generation.
A usual challenge of laboratory studies is to demonstrate their representativeness for real-life conditions. It is also important to compare how the parameters, such as droplet size distribution, incidence, temperature, and salinity dependency, reflect those found in natural aerosols in environmental conditions (Blot et al., 2013; Clarke et al., 2006; de Leeuw and Cohen, 2013; Lewis and Schwartz, 2004; Mårtensson et al., 2003, 2010; Sellegri et al., 2006).
4.1 Does the laboratory experiment represent the reality?
This question can be approached indirectly through comparison with results from earlier chamber studies with different setups (Christiansen et al., 2019; Fuentes et al., 2010; Leifer et al., 2003; Mårtensson et al., 2003, 2010; Rastelli et al., 2017; Schwier et al., 2015; Stokes et al., 2013).
In particular, the experiments of Fuentes et al. (2010) (which compared two ways of generating bubbles: plunger and filters of porous media) and Sellegri et al. (2006) (water jet and sintered glass filters) concluded that a bubbling tank with a water jet system can closely mimic the actual oceanic distribution of the emitted bubbles and aerosols. A similar conclusion was made by Mårtensson et al. (2003) for filters. The later study is quite similar to the current one. An uncertainty, however, comes from the narrower range of the bubble size in the current study (Fig. 2). Since the film-droplet features are mostly determined by the bubble lifetime and are produced by large bubbles (larger than ∼ 2 mm in diameter; Lewis and Schwartz, 2004), the bubble size should have a limited effect on the sub-µm particles. However, the jet droplets can be affected by the very low fraction of sub-mm bubbles. That would result in lower production (a few tens of %) of droplets about 0.3–1 µm in diameter (Cipriano and Blanchard, 1981; Deane and Stokes, 2002; Jiang et al., 2022; Wang et al., 2017), which is an uncertainty of the current experiment.
The effect of water composition on SSA emission is more complicated. Christiansen et al. (2019) presented a systematic variability of the produced SSA flux in relation to water temperature and bubbling method as well as a non-linear correlation of total particle number concentration with the water phytoplankton mass. It is expected that the seawater chemical composition and the organic and inorganic fractions can be significant for the bubble production and the aerosol formation. Evidence of water chemical composition being the controlling parameter of seawater emission was presented by Nielsen and Bilde (2020). Therefore, replicability of our main conclusions made for the artificial NaCl solution to the water of Mediterranean and Baltic seas is a significant factor supporting the representativeness of the obtained results for real water.
4.2 The bubbles lifetime
One of the key parameters controlling aerosol production is the lifetime of the bubbles in the foam. This is not a directly measurable parameter, but it can be derived from the bubble size and the foam area. The foam area at the water surface is controlled by the dynamic equilibrium between the bubble supply and the foam deterioration due to the bubble burst. In the experiment, the foam area was always small enough to ensure a single layer of bubbles at the surface. Then the equilibrium leads to a simple equation for the foam lifetime:
Here, A is foam area, h is foam thickness, F is air flow rate, and τ is bubble lifetime.
Combining Eq. (2) from Sect. 3.1.2 and Eq. (3), we obtain the dependence of the foam lifetime on the air flow rate:
which is applicable for F>F0 when there is a sufficient area of the foam to measure.
For the bubble air flow below 1 L min−1, a simpler linear relation (Fig. 3) leads to
where α is the slope of the linear relation of A and F, shown in Fig. 3.
From Eq. (5), if the foam thickness his a constant equal to the bubble diameter in all experiments, the bubble lifetime is also the same in all experiments. For the air flows in Fig. 3 – 0.01, 0.2, 0.8, and 1.5 L min−1 and the corresponding mean bubble size – the lifetime will be 1.3, 0.9, 0.8, and 0.5 s, respectively. These values, especially for the low flow rates, are harmonious with the estimates of the detailed study of Poulain et al. (2018), who suggested a range between 0.7 and 1.5 s for water at room temperature. They also corroborate with the laboratory experiments of Anguelova and Huq (2017), who investigated the dependence of bubble properties on salinity varying over a very wide range and showed very limited dependence but substantial fluctuations of all parameters.
Equations (4)–(5) can be generalized to relate the foam thickness to the flow rate. The foam gets thicker with the increase of the air flow due to bubble coagulation, the importance of which grows with the foam area. As a result, at high flow rates, large bubbles are produced on the water surface, and the bubble size distribution extends towards the large sizes, as seen in Fig. 2.
4.3 Bubble generation
Comparison with the bubble sizes and lifetime observed in other lab studies and in open sea shows that the results of our experiment generally agree with other studies based on air-generated bubbles, though they deviate more from the setups based on water jet-generated bubbles (Fig. 10).
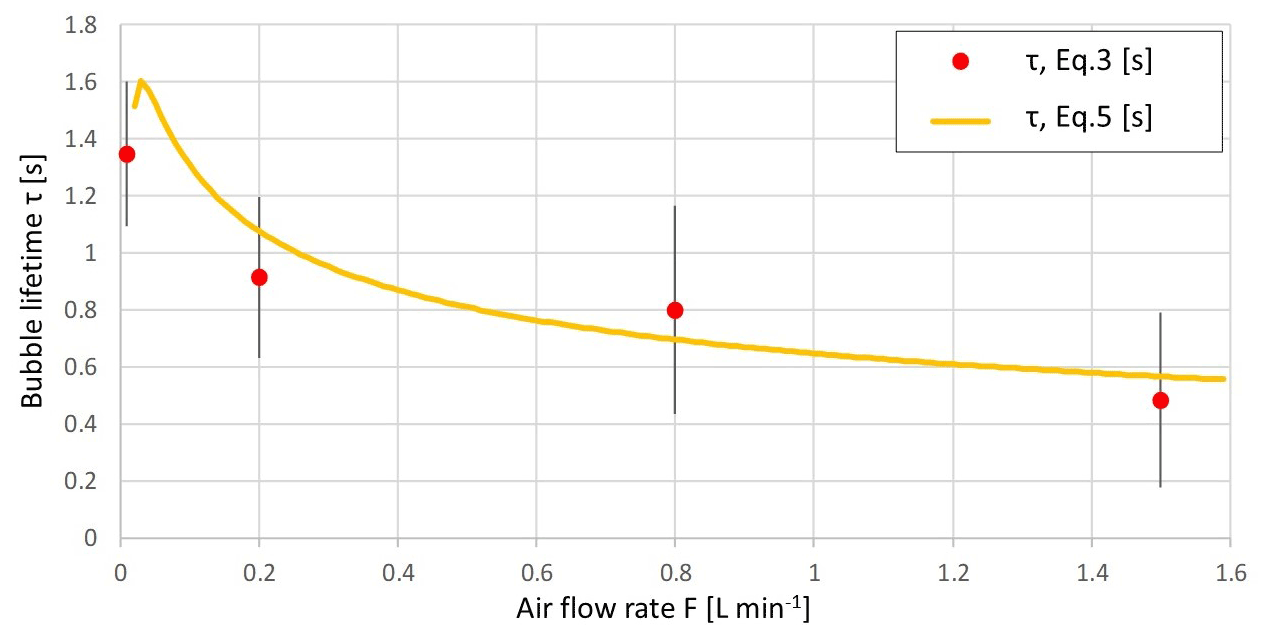
Figure 10Bubble lifetime, derived from the observed foam area and mean bubble size with Eq. (3); the approximation of Eq. (4) assumes the foam thickness of 7 mm.
The data suggest that the lifetime of the bubbles is within the range of 0.5–1.5 s at room temperature (20 ∘C), regardless of the water salinity. The values for the MQ water practically do not differ from those for the MQ with added salt, coinciding with conclusions of Anguelova and Huq (2017). This result, however, contradicts the theoretical expectation of Lorenceau and Rouyer (2020), who argued that individual bubbles on the surface of pure water should break within a few milliseconds. The practical result of that study, nevertheless, showed stability of the bubble size and its dependency of the surface tension. Using an alcohol–water mixture, the authors obtained the same 7 mm for the bubble diameter for pure water (γ = 73 mN m−1) and 5.6 mm for the 12 % ethanol admixture (γ = 46.5 mN m−1). The explanation for the apparent contradiction with the theoretical lifetime is probably that the MQ water still contains a substantial amount of impurities controlling the bursting process (LaFranchi et al., 2003; Poulain et al., 2018).
The obtained results revealed the specificity of natural water samples, both from the Mediterranean and Baltic seas. They have much larger variability in terms of foam area than the artificial water. In most cases, the foam area was also larger than for artificial salty water, but the bubble sizes showed practically no variability, being about 7 mm for practically all flow rates. Since the experiment included the artificial water samples with salinity corresponding to each of the natural samples, the large foam area and the long bubble lifetime should be attributed to the organic content in the natural water. In particular, the organics tend to form a thin film on the water surface, thus altering both surface tension and viscosity of the foam-forming water. This assumption is indirectly supported by the similarity of the bubble sizes of natural and artificial water: the same 7 mm were reported in most experiments for all salinities. Since the bubbles are formed deep in the water, same sizes indicate that the surface tension inside the water body is not substantially different between the samples, i.e., it is the surface layer properties that control the bubble lifetime, just as observed in real-life observations.
4.4 Salinity effect
Water salinity can affect the particle spectra via two mechanisms. Firstly, higher salt content would result in larger crystals after the same-size droplets dry. Secondly, the droplet sizes depend on the features of the bursting bubbles, i.e., the deciding parameters will be water viscosity, surface tension, and bubble lifetime.
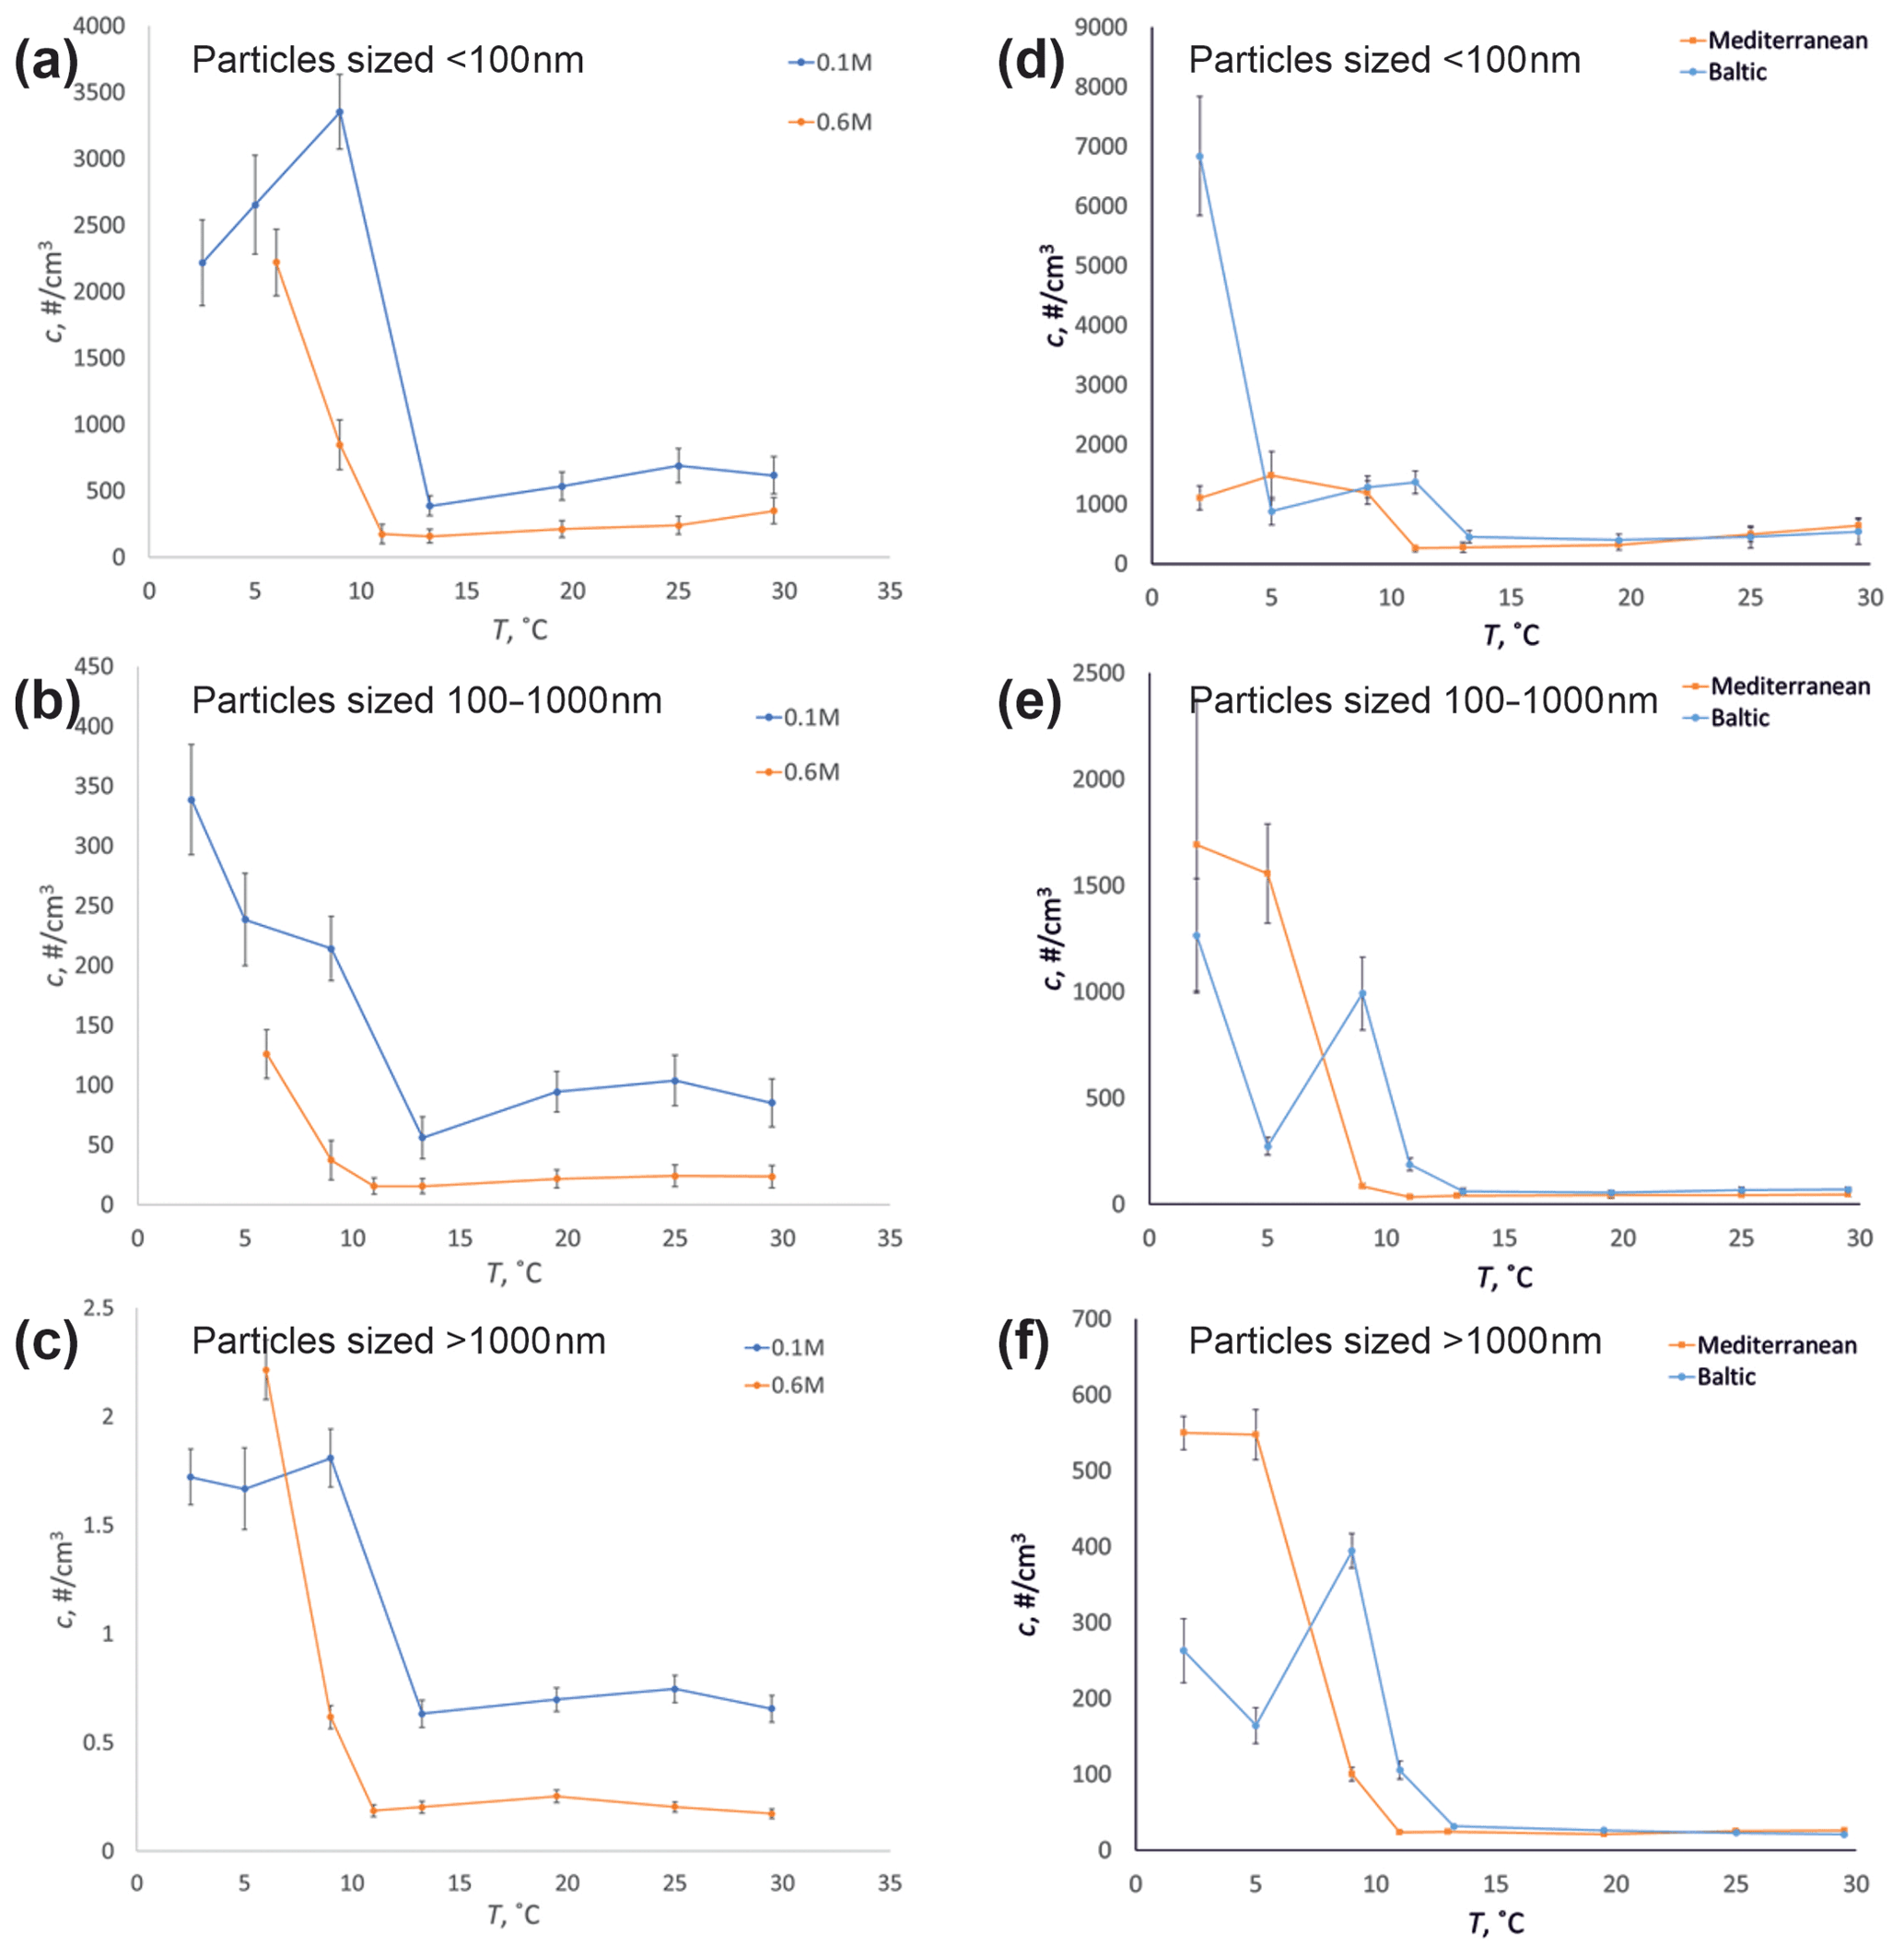
Figure 11Temperature dependence on particle concentration for aerosols sized below 100 nm (a, d), from 100 to 1000 nm (b, e), and above 1000 nm (c, f) for 0.1 and 0.6 M NaCl-solutions (a–c) and the water of the Mediterranean and Baltic seas (d–f) bubbled at 0.8 L min−1.
The first phenomenon leads to a simple relation: two droplets with different salt content S1 and S2 but that are otherwise identical would result in crystals with proportional volumes V1 and V2 and corresponding dry diameters D1 and D2:
Equation (6) describes the log-homogeneous shift of the whole spectrum with regard to particle diameter. Owing to the cubic-root dependence, the effect is modest. For instance, even a change of salinity from 0.1 to 0.8 M (wider than both the tested and realistic ranges) would just double the particle diameters with the corresponding shift of the spectrum to the right. From Fig. 5, one can see that, for sub-micron particles, the changes would indeed be small, because the size distribution slope is small. The effect will be significant only for (i) particles coarser than 1 µm, where the slope of the distribution is large,and (ii) very low salinities, owing to the S2 in denominator of Eq. (6).
The second phenomenon is more complicated but presumably small: the variations of water viscosity and surface tension are within 10 % for the realistic salinity range (Kalová and Mareš, 2018; Wang et al., 2018; Wen et al., 2018). It is also visible in Fig. 2, where bubble sizes (controlled by surface tension) show no sensitivity to salinity. The only noticeable impact could originate from bubble lifetime, which is sensitive to the abundance of the impurities in the water (Poulain et al., 2018). The higher concentration of salt should lead to the shorter bubble lifetime and the thicker bursting film of the bubbles, in turn leading to larger and fewer particles produced by the film bursting.
These expectations agree with Fig. 6, which shows the spectra for different salinities normalized with that of Sref = 0.6 M (the highest tested). The lower salinity indeed led to fewer coarse (> 1 µm) particles, up to a factor of a few times for S ≥ 0.2 M but with a much sharper reduction for low salinities. For very small (< 20 nm) particles, there is some reduction as well, whereas the range from 20 to 200 nm demonstrated some increase. In the MQ-water session, the number of particles was not enough for reliable observations, especially for coarse aerosols, which were produced in very small numbers (Fig. 5).
4.5 Temperature effect
The effect of temperature is arguably the most controversial in the literature. Many studies show substantial impact of Tw on aerosol production, often reporting a rise in colder conditions; however, they differ widely in details.
Our results suggested that the dependence exists only for sub-10 ∘C conditions, with practically no effect above that temperature (Fig. 11). Warming the water from +2 to +10 ∘C leads to a 10-fold reduction of the aerosol production. These are in a quantitative agreement with Zábori et al. (2012), who tested several artificial solutions and Arctic Ocean water, arriving at the same dependencies as registered in our experiment: 10 ∘C threshold and 10-fold change of production flow between 2 and 10 ∘C. They also reported a rise of a fraction of very small particles (Dp < 0.25 µm), in agreement with our results (Figs. 7–9, 11). However, the details of the size distribution were different: Zábori et al. (2012) showed a sharp peak of the distribution at Dp ∼ 200 nm, with values twice as low before and after. They also reported a general decline of the production from 100nm towards smaller particle sizes. In our results, on the contrary, the particles with Dp of 10—20 nm were dominant in almost all experiments.
A strong dependence of aerosol production on water temperature was observed by Nielsen and Bilde (2020), who analyzed individual bubbles and showed that the number of particles per bubble burst differs more than 10-fold between 0 and 19 ∘C, varying from a factor of 2–3 up to 20–30 for different artificial solutions and natural seawater samples. Conditions of their experiments and presentation of the results do not allow for firm conclusions, but a certain non-linearity of the dependencies around 10 ∘C can be noticed as well.
In contrast with those results as well as with the conclusions of the current study, several publications did not report substantial changes of the dependencies at 10 ∘C, or they are not evident from the results. In particular, a widely cited work (Mårtensson et al., 2003) did not show this dependence, rather suggesting some not-well-explained jumps for cold-water conditions. In particular, it was suggested that there is (i) a decrease of production of super-0.1 µm particles in colder water, and (ii) a strong difference between produced aerosol size spectra throughout the whole tested temperature range (25, 15, and 0 ∘C); (iii) the sub-zero conditions showed the same production as Tw = 0 ∘C (see the analysis of Sofiev et al. (2011), who quantified these dependencies). However, some elements of that setup were criticized by Lewis and Schwartz (2004) and later by Witek et al. (2016), who pointed out at a too-high temperature sensitivity of the aerosol production. The origin of the differences remained unexplained.
A recent experiment of Christiansen et al. (2019) compared two different ways of generating the bubbles – a diffuser, comparatively similar to our setup, and a plunger pumping the water from the bottom of the tank to its top and forcing it through a nozzle located a few tens of centimeters above the water level, causing a waterfall. These two setups produced radically different results. The diffuser setup qualitatively agreed with our conclusions but did not show the 10 ∘C threshold. However, the plunger setup, showing different tendencies, manifested a clear minimum of production at 9–10 ∘C, above which the coarse particle outflow was not temperature dependent. However, the installation used high air and water flows, thus potentially disturbing the dispersal of small aerosols and possibly adding particles produced by the waterfall itself.
A bubble generation setup with a plunging jet was also used in the experiment of Salter et al. (2014). In their study, the ∼ 10 ∘C threshold was observed as a significant shift in bubble size spectra towards smaller sizes. The dependence of total particle concentration on temperature was strong below 10 ∘C and insignificant above 10 ∘C.
In view of this ambiguity, the temperature experiment has been repeated many times with different setups, all firmly showing the above effect. Therefore, we conclude that this finding probably reflects the actual dependencies, despite no studies (including this one) having came up with plausible theoretical explanations.
We have built a new sea spray production chamber and characterized its performance in a set of controlled laboratory experiments. Characterization was done with detailed measurements of the bubble generation and aerosol formation processes. The stability of the glass chamber was demonstrated in repeated multiple experiments that varied the bubble-generating flow rate, water temperature, and salinity. The material of the chamber, its compact size, and its possibility for sterilization make it suitable for future studies of the effects of biological composition on SSA formation.
The flow rate-varying experiments covered the range of setups, from releasing individual bubbles one-by-one with intervals longer than their lifetime at the surface up to intense air flows forming air jets at the exit of the underwater capillary and a wide foam at the water surface. The water salinity experiments were performed with the moderate air flow rate and covered the realistic conditions: salinity from fresh (MQ) water up to 0.6 M of NaCl and temperature from 2 up to 29 ∘C. Experiments were also made with natural water from the Mediterranean and Baltic seas.
The experiments quantified the dependencies of aerosol production on the main environmental conditions and manifested two important refinements, which differ from the sea salt parameterizations broadly used in the models today. In particular, they showed modest dependence of aerosol production on the water salinity (even very clean MQ water resulted in high particle numbers, albeit predominantly of ∼ 10 nm size). Secondly, the dependence on temperature manifested a saturation effect: for < 10 ∘C cold water, the lower temperature led to stronger sub-micron aerosol production, whereas above that threshold no dependence was found in any of the experiments.
The obtained dependencies were accompanied by theoretical considerations, which supported and explained the findings, also showing good quantitative agreement.
These results generally agree with recent studies on sea salt aerosol generation but point out (i) the necessity of a better theoretical understanding of the differences in SSA generation in different experimental setups, which are mainly proclaimed but rarely explained, and (ii) the need for a review of the sea salt parameterizations currently adapted in many modern atmospheric and oceanic models.
| Surface area covered by bubbles for a given or reference air flows | |
| CCN | Cloud condensation nuclei |
| CPC | Condensation particle counter |
| Da | Aerodynamic diameter of a particle |
| Db | Diameter of a bubble at the breakout plane |
| Dcap | Inner diameter of a capillary output nozzle, 1.2 mm |
| De | Electrical mobility diameter of a particle |
| Dp | Observed dry-particle diameter after all corrections |
| DMA | Differential mobility analyzer |
| DMPS | Differential mobility particle sizer |
| Air flow and reference air flow of the bubble generator | |
| g | Gravity acceleration |
| h | Thickness of foam at the water surface |
| γ | Water surface tension |
| IN | Ice nuclei |
| N | Number concentrations of particles in the air (particles m−3) |
| OPS | Optical particle sizer |
| RH | Relative humidity |
| RMSE | Root mean squared error |
| ρa | Air density |
| ρw | Water reference density, estimated to be 1000 kg m−3 |
| ρp | Salt particle density, assumed to be 2600 kg m−3 |
| S | Water salinity, NaCl concentration in the solution |
| T | Water temperature (∘C) |
| τ | Foam lifetime (s) |
| χ | Shape factor, as defined in Khlystov et al. (2004) |
| Vb | Volume of bubble |
The chamber system presented in Fig. B1 receives in-house compressed air produced an with oil free compressor (WisAIR WIS25V, Worthington Creyssensac, Italy) and refrigeration dryer (DEiT 032, MTA S.p.A., Italy), with a dew point of +3 ∘C (equal to a maximum of ∼ 5–6 g of water per cubic meter). The compressed air passes through one 0.01 µm pore-sized filter (Friulair X Series) and two 1 µm pore-sized filters (Friulair S Series) before reaching the pressure regulator. Sequential filtering ensures the air purity, free from particles and micro-organisms. The pressure regulator lowers the pressure of incoming air from 7 to 2 bar, after which the air goes through HEPA-filter and reaches the manifold.
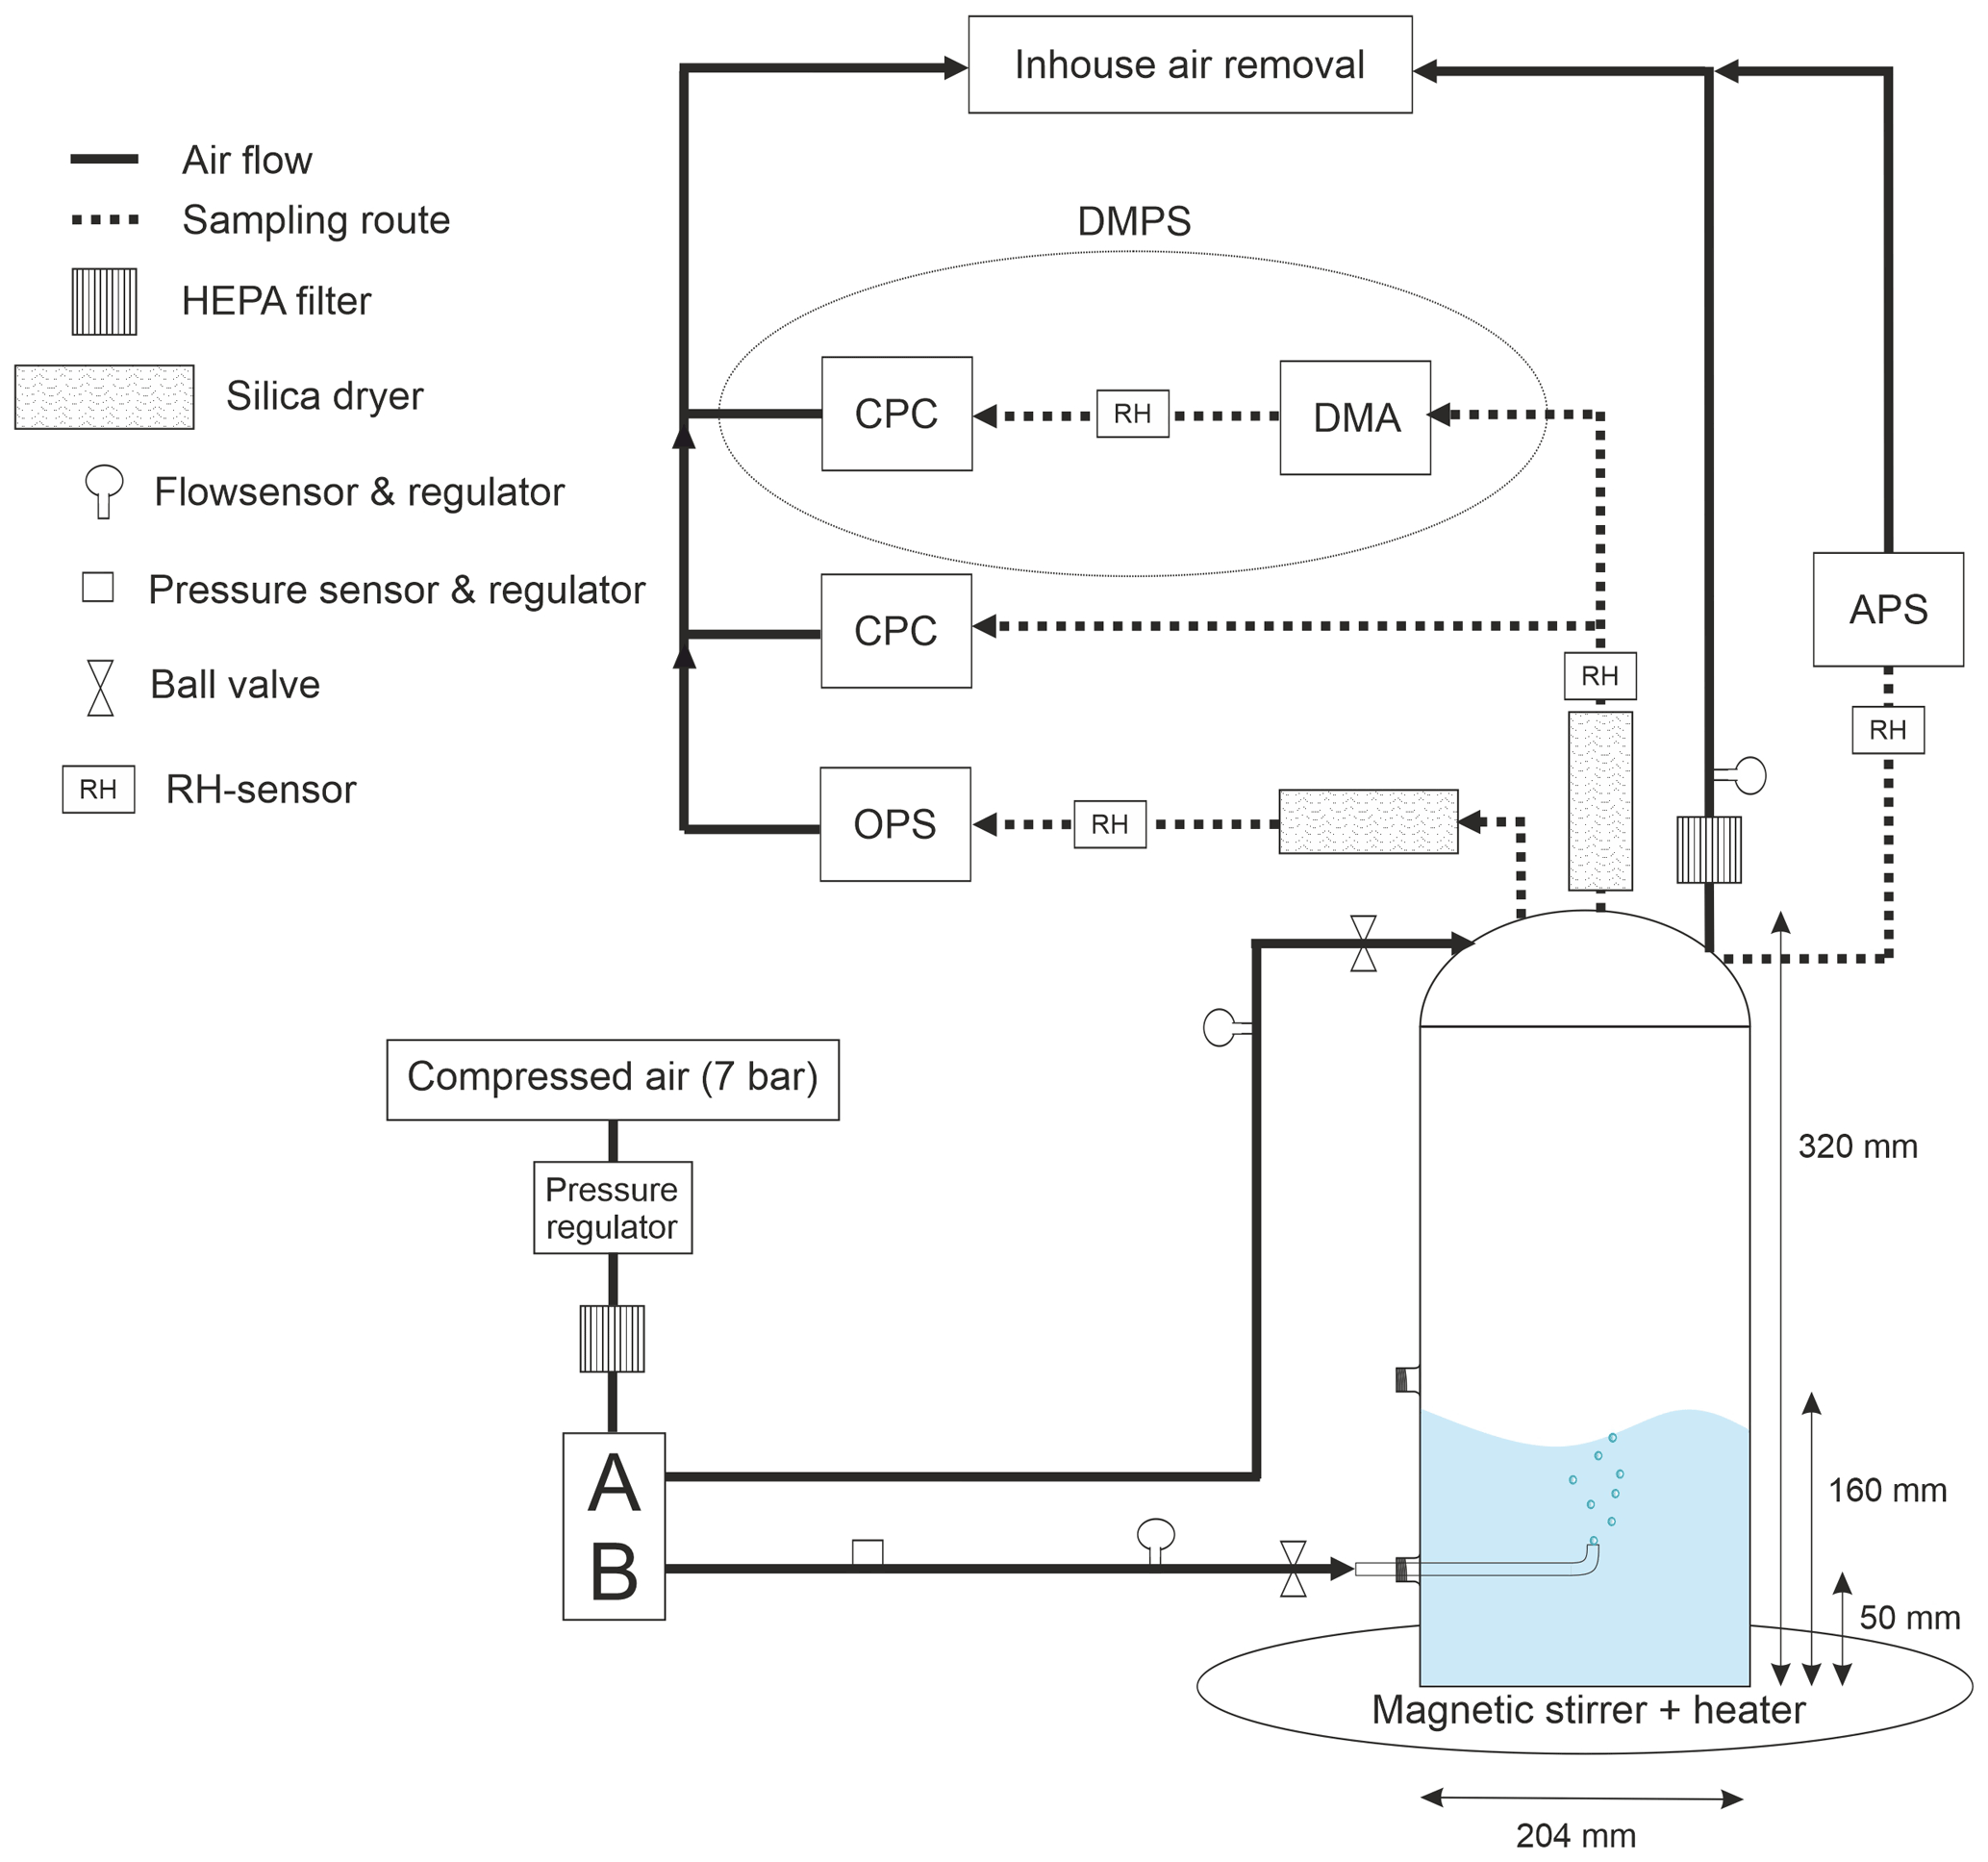
The manifold guides the air to two separate lines, flush (A) and bubble (B). The bubble line is connected to the chamber through a capillary, which is used for creating bubbles. The rate of the bubble formation can be regulated by an air flow controller attached to the bubble line. The flush line is connected on the chamber lid and is run for purifying the chamber and maintaining the atmospheric pressure. The air flow of the flush line is also regulated.
The total concentration and size distribution of the particles are analyzed by an optical particle sizer (OPS), a condensation particle counter (CPC), an aerodynamic particle sizer (APS), and differential mobility particle sizer (DMPS). DMPS consists of a differential particle analyzer (DMA) and CPC. Silica driers are inserted in to the system before the particle analyzers, and the RH meters are installed to monitor that the analyzed particles are all dry. All the particle counters and the exhaust air tube on the lid are connected to the in-house air removal, assuring that no air is released indoors.
Protocol for still-image analysis:
-
Change the image type to 8-bit. Larger pixel size allows easier determination of the significant color changes, and edges of the bubbles get clearer. Adjust brightness and contrast for clarity.
-
Select the diameter of the chamber by straight-line tool, then set the scale for the diameter to be 204 mm (Analyze → Set Scale).
-
Using the ROI manager tool and the straight-line tool, select all the bubble diameters. Use “Measure”-command from the ROI tool to determine the diameters.
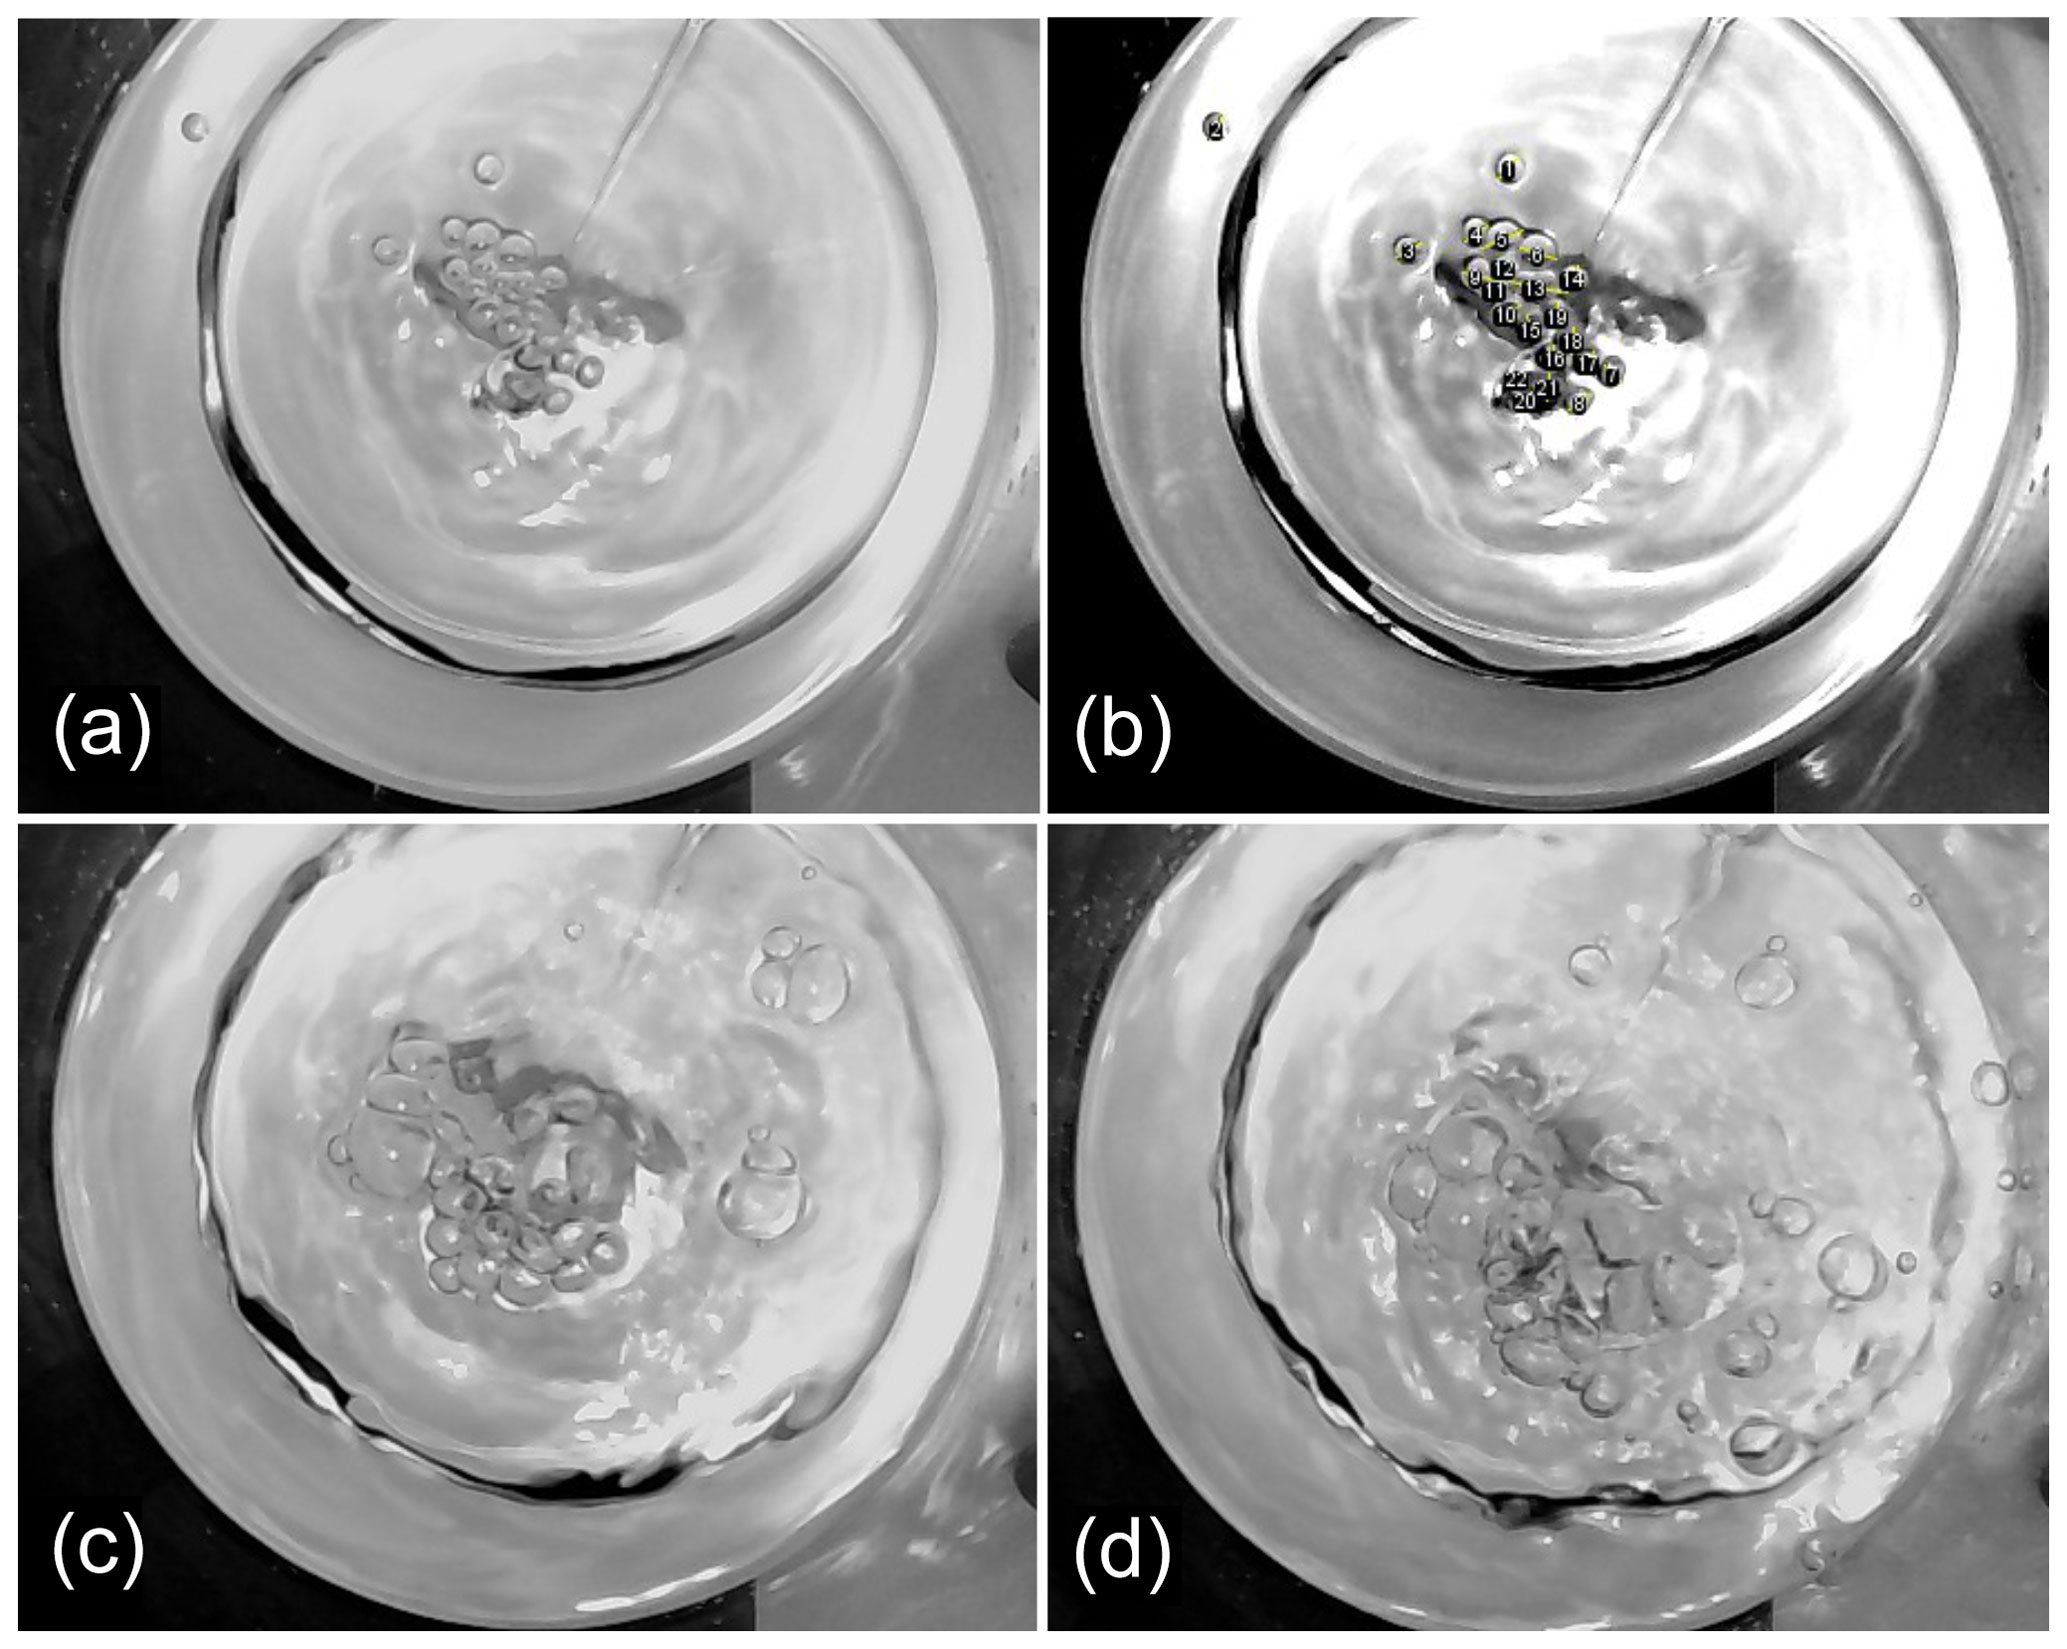
Figure C1One of five images taken at 0.2, 0.8, and 1.5 L min−1 flow rates and S = 0.1 M water salinity from above the bubbling area. (a) The initial picture at 0.2 L min−1. (b) Modified image at 0.2 L min−1, with the bubble diameters selected and numbered. (c) The initial picture at 0.8 L min−1. (d) The initial picture at 1.5 L min−1.
The data that was produced during this study is available from the corresponding authors, Mikhail Sofiev (mikhail.sofiev@fmi.fi), Antti-Pekka Hyvärinen (antti.hyvarinen@fmi.fi), and Svetlana Sofieva (svetlana.sofieva@helsinki.fi), upon reasonable request.
EA, NSA, JD, JK, DHB, APH, RK, and MS planned the experiments and participated in setting up the chamber system; SS, EA, NSA, AEH, EV, and APH performed the measurements; SS, EA, AEH, APH, and MS analyzed the data; SS, EA, NSA, AEH, and MS wrote the manuscript draft; SS, EA, NSA, JD, MR, JK, DHB, APH, RK, and MS reviewed and edited the manuscript; all authors have read and approved the paper.
The contact author has declared that none of the authors has any competing interests.
Publisher's note: Copernicus Publications remains neutral with regard to jurisdictional claims in published maps and institutional affiliations.
The authors would like to thank the staff of Laborexin and Ari Salminen at SMC. We thank Henri Servomaa, Esa Hautajoki, Virpi Mäntylä, and Olli Moisio for the excellent technical assistance.
This research has been supported by the Academy of Finland (grant nos. 309570, 337552, and 310372), the Academy of Finland project grant (grant no. 479507 (DASI) and grant no. 199997 (special funding for research on COVID-19 epidemic)), and the Horizon 2020 (EMERGE (grant no. 874990)).
Open-access funding was provided by the Helsinki University Library.
This paper was edited by Mingjin Tang and reviewed by two anonymous referees.
Aller, J. Y., Kuznetsova, M. R., Jahns, C. J., and Kemp, P. F.: The sea surface microlayer as a source of viral and bacterial enrichment in marine aerosols, J. Aerosol Sci., 36, 801–812, https://doi.org/10.1016/j.jaerosci.2004.10.012, 2005.
Anguelova, M. and Huq, P.: Effects of Salinity on Surface Lifetime of Large Individual Bubbles, Journal of Marine Science and Engineering, 5, 41, https://doi.org/10.3390/jmse5030041, 2017.
Blanchard, D. C.: Jet drop enrichment of bacteria, virus, and dissolved organic material, Pure Appl. Geophys., 116, 302–308, https://doi.org/10.1007/BF01636887, 1978.
Blanchard, D. C.: The Ejection of Drops from the Sea and Their Enrichment with Bacteria and Other Materials: A Review, Estuaries, 12, 127–137, https://doi.org/10.2307/1351816, 1989.
Blanchard, D. C. and Woodcock, A. H.: The Production, Concentration, And Vertical Distribution Of The Sea-Salt Aerosol, Ann. NY Acad. Sci., 338, 330–347, https://doi.org/10.1111/j.1749-6632.1980.tb17130.x, 1980.
Blot, R., Clarke, A. D., Freitag, S., Kapustin, V., Howell, S. G., Jensen, J. B., Shank, L. M., McNaughton, C. S., and Brekhovskikh, V.: Ultrafine sea spray aerosol over the southeastern Pacific: open-ocean contributions to marine boundary layer CCN, Atmos. Chem. Phys., 13, 7263–7278, https://doi.org/10.5194/acp-13-7263-2013, 2013.
Borghini, M., Bryden, H., Schroeder, K., Sparnocchia, S., and Vetrano, A.: The Mediterranean is becoming saltier, Ocean Sci., 10, 693–700, https://doi.org/10.5194/os-10-693-2014, 2014.
Brooks, S. D. and Thornton, D. C. O.: Marine Aerosols and Clouds, Annu. Rev. Mar. Sci., 10, 289–313, https://doi.org/10.1146/annurev-marine-121916-063148, 2018.
Burrows, S. M., Ogunro, O., Frossard, A. A., Russell, L. M., Rasch, P. J., and Elliott, S. M.: A physically based framework for modeling the organic fractionation of sea spray aerosol from bubble film Langmuir equilibria, Atmos. Chem. Phys., 14, 13601–13629, https://doi.org/10.5194/acp-14-13601-2014, 2014.
Charlson, R. J., Lovelock, J. E., Andreae, M. O., and Warren, S. G.: Oceanic phytoplankton, atmospheric sulphur, cloud albedo and climate, Nature, 326, 655–661, https://doi.org/10.1038/326655a0, 1987.
Christiansen, S., Salter, M. E., Gorokhova, E., Nguyen, Q. T., and Bilde, M.: Sea Spray Aerosol Formation: Laboratory Results on the Role of Air Entrainment, Water Temperature, and Phytoplankton Biomass, Environ. Sci. Technol., 53, 13107–13116, https://doi.org/10.1021/acs.est.9b04078, 2019.
Cipriano, R. J. and Blanchard, D. C.: Bubble and aerosol spectra produced by a laboratory `breaking wave, J. Geophys. Res., 86, 8085, https://doi.org/10.1029/JC086iC09p08085, 1981.
Clarke, A. D., Owens, S. R., and Zhou, J.: An ultrafine sea-salt flux from breaking waves: Implications for cloud condensation nuclei in the remote marine atmosphere, J. Geophys. Res., 111, D06202, https://doi.org/10.1029/2005JD006565, 2006.
Cochran, R. E., Laskina, O., Trueblood, J. V., Estillore, A. D., Morris, H. S., Jayarathne, T., Sultana, C. M., Lee, C., Lin, P., Laskin, J., Laskin, A., Dowling, J. A., Qin, Z., Cappa, C. D., Bertram, T. H., Tivanski, A. V., Stone, E. A., Prather, K. A., and Grassian, V. H.: Molecular Diversity of Sea Spray Aerosol Particles: Impact of Ocean Biology on Particle Composition and Hygroscopicity, Chem, 2, 655–667, https://doi.org/10.1016/j.chempr.2017.03.007, 2017.
Deane, G. B. and Stokes, M. D.: Scale dependence of bubble creation mechanisms in breaking waves, Nature, 418, 839–844, https://doi.org/10.1038/nature00967, 2002.
de Leeuw, G. and Cohen, L. H.: Bubble Size Distributions on the North Atlantic and North Sea, in: Geophysical Monograph Series, edited by: Donelan, M. A., Drennan, W. M., Saltzman, E. S., and Wanninkhof, R., American Geophysical Union, Washington, D. C., 271–277, https://doi.org/10.1029/GM127p0271, 2013.
Drenckhan, W. and Saint-Jalmes, A.: The science of foaming, Adv. Colloid Interfac., 222, 228–259, https://doi.org/10.1016/j.cis.2015.04.001, 2015.
Forestieri, S. D., Moore, K. A., Martinez Borrero, R., Wang, A., Stokes, M. D., and Cappa, C. D.: Temperature and Composition Dependence of Sea Spray Aerosol Production, Geophys. Res. Lett., 45, 7218–7225, https://doi.org/10.1029/2018GL078193, 2018.
Fuentes, E., Coe, H., Green, D., de Leeuw, G., and McFiggans, G.: Laboratory-generated primary marine aerosol via bubble-bursting and atomization, Atmos. Meas. Tech., 3, 141–162, https://doi.org/10.5194/amt-3-141-2010, 2010.
Grythe, H., Ström, J., Krejci, R., Quinn, P., and Stohl, A.: A review of sea-spray aerosol source functions using a large global set of sea salt aerosol concentration measurements, Atmos. Chem. Phys., 14, 1277–1297, https://doi.org/10.5194/acp-14-1277-2014, 2014.
Jiang, X., Rotily, L., Villermaux, E., and Wang, X.: Submicron drops from flapping bursting bubbles, P. Natl. Acad. Sci. USA, 119, e2112924119, https://doi.org/10.1073/pnas.2112924119, 2022.
Kalová, J. and Mareš, R.: The temperature dependence of the surface tension of water, 17th Conference of Power System Engineering, Thermodynamics and Fluid Mechanics, 13–14 June 2018, Pilsen, Czech Republic, 020007, https://doi.org/10.1063/1.5081640, 2018.
Khlystov, A., Stanier, C., and Pandis, S. N.: An Algorithm for Combining Electrical Mobility and Aerodynamic Size Distributions Data when Measuring Ambient Aerosol Special Issue of Aerosol Science and Technology on Findings from the Fine Particulate Matter Supersites Program, Aerosol Sci. Tech., 38, 229–238, https://doi.org/10.1080/02786820390229543, 2004.
King, S. M., Butcher, A. C., Rosenoern, T., Coz, E., Lieke, K. I., de Leeuw, G., Nilsson, E. D., and Bilde, M.: Investigating Primary Marine Aerosol Properties: CCN Activity of Sea Salt and Mixed Inorganic–Organic Particles, Environ. Sci. Technol., 46, 10405–10412, https://doi.org/10.1021/es300574u, 2012.
Kouznetsov, R. and Sofiev, M.: A methodology for evaluation of vertical dispersion and dry deposition of atmospheric aerosols, J. Geophys. Res., 117, D01202, https://doi.org/10.1029/2011JD016366, 2012.
Laakso, L., Mikkonen, S., Drebs, A., Karjalainen, A., Pirinen, P., and Alenius, P.: 100 years of atmospheric and marine observations at the Finnish Utö Island in the Baltic Sea, Ocean Sci., 14, 617–632, https://doi.org/10.5194/os-14-617-2018, 2018.
LaFranchi, B., W., Knight, M., and Petrucci, G., A.: Leaching as a source of residual particles from nebulization of deionized water, J. Aerosol Sci., 34, 1589–1594, https://doi.org/10.1016/S0021-8502(03)00188-5, 2003.
Latham, J. and Smith, M. H.: Effect on global warming of wind-dependent aerosol generation at the ocean surface, Nature, 347, 372–373, https://doi.org/10.1038/347372a0, 1990.
Leifer, I., de Leeuw, G., and Cohen, L. H.: Optical Measurement of Bubbles: System Design and Application, J. Atmos. Ocean. Tech., 20, 1317–1332, https://doi.org/10.1175/1520-0426(2003)020<1317:OMOBSD>2.0.CO;2, 2003.
Lewis, E. R. and Schwartz, S. E.: Sea salt aerosol production: mechanisms, methods, measurements and models; a critical review, American Geophysical Union, Washington, DC, 413 pp., ISBN 978-0-87590-417-7, 2004.
Lorenceau, E. and Rouyer, F.: Lifetime of a single bubble on the surface of a water and ethanol bath, Phys. Rev. Fluids, 5, 063603, https://doi.org/10.1103/PhysRevFluids.5.063603, 2020.
Mårtensson, E. M., Nilsson, E. D., de Leeuw, G., Cohen, L. H., and Hansson, H.-C.: Laboratory simulations and parameterization of the primary marine aerosol production: the primary marine aerosol source, J. Geophys. Res., 108, 4297, https://doi.org/10.1029/2002JD002263, 2003.
Mårtensson, M., Tunved, P., Korhonen, H., and Nilsson, D.: The role of sea-salt emissions in controlling the marine Aitken and accumulation mode aerosol: a model study, Tellus B, 62, 259–279, https://doi.org/10.1111/j.1600-0889.2010.00465.x, 2010.
Maxwell, J. C.: Plateau on soap bubbles, Nature, 10, 119–121, 1874.
Monahan, E. C., Spiel, D. E., and Davidson, K. L.: A model of marine aerosol generation via whitecaps and wave disruption, in: Oceanic whitecaps, D. Reidel, Norwell, Mass., 167–193, https://doi.org/10.1007/978-94-009-4668-2_16, 1986.
Moore, M. J. K., Furutani, H., Roberts, G. C., Moffet, R. C., Gilles, M. K., Palenik, B., and Prather, K. A.: Effect of organic compounds on cloud condensation nuclei (CCN) activity of sea spray aerosol produced by bubble bursting, Atmos. Environ., 45, 7462–7469, https://doi.org/10.1016/j.atmosenv.2011.04.034, 2011.
Nielsen, L. S. and Bilde, M.: Exploring controlling factors for sea spray aerosol production: temperature, inorganic ions and organic surfactants, Tellus B, 72, 1–10, https://doi.org/10.1080/16000889.2020.1801305, 2020.
Pátek, J., Souèková, M., and Klomfar, J.: Generation of Recommendable Values for the Surface Tension of Water Using a Nonparametric Regression, J. Chem. Eng. Data, 61, 928–935, https://doi.org/10.1021/acs.jced.5b00776, 2016.
Plateau, J. A. F.: Statique Expérimentale Et Théorique Des Liquides Soumis Aux Seules Forces Moléculaires, Nabu Press (reproduced copy, 8 March 2010), 508 pp., ISBN 1-146-92596-4, 1873.
Poulain, S., Villermaux, E., and Bourouiba, L.: Ageing and burst of surface bubbles, J. Fluid Mech., 851, 636–671, https://doi.org/10.1017/jfm.2018.471, 2018.
Prather, K. A., Bertram, T. H., Grassian, V. H., Deane, G. B., Stokes, M. D., DeMott, P. J., Aluwihare, L. I., Palenik, B. P., Azam, F., Seinfeld, J. H., Moffet, R. C., Molina, M. J., Cappa, C. D., Geiger, F. M., Roberts, G. C., Russell, L. M., Ault, A. P., Baltrusaitis, J., Collins, D. B., Corrigan, C. E., Cuadra-Rodriguez, L. A., Ebben, C. J., Forestieri, S. D., Guasco, T. L., Hersey, S. P., Kim, M. J., Lambert, W. F., Modini, R. L., Mui, W., Pedler, B. E., Ruppel, M. J., Ryder, O. S., Schoepp, N. G., Sullivan, R. C., and Zhao, D.: Bringing the ocean into the laboratory to probe the chemical complexity of sea spray aerosol, P. Natl. Acad. Sci. USA, 110, 7550–7555, https://doi.org/10.1073/pnas.1300262110, 2013.
Rastelli, E., Corinaldesi, C., Dell'Anno, A., Lo Martire, M., Greco, S., Cristina Facchini, M., Rinaldi, M., O'Dowd, C., Ceburnis, D., and Danovaro, R.: Transfer of labile organic matter and microbes from the ocean surface to the marine aerosol: an experimental approach, Sci. Rep., 7, 11475, https://doi.org/10.1038/s41598-017-10563-z, 2017.
Rossknecht, G. F., Elliot, W. P., and Ramsey, F. L.: The size distribution and inland penetraation of sea salt particles, J. Appl. Meteorol., 12, 825–830, 1973.
Salter, M. E., Nilsson, E. D., Butcher, A., and Bilde, M.: On the seawater temperature dependence of the sea spray aerosol generated by a continuous plunging jet, J. Geophys. Res.-Atmos., 119, 9052–9072, https://doi.org/10.1002/2013JD021376, 2014.
Schneider, C. A., Rasband, W. S., and Eliceiri, K. W.: NIH Image to ImageJ: 25 years of image analysis, Nat. Methods, 9, 671–675, https://doi.org/10.1038/nmeth.2089, 2012.
Schwier, A. N., Rose, C., Asmi, E., Ebling, A. M., Landing, W. M., Marro, S., Pedrotti, M.-L., Sallon, A., Iuculano, F., Agusti, S., Tsiola, A., Pitta, P., Louis, J., Guieu, C., Gazeau, F., and Sellegri, K.: Primary marine aerosol emissions from the Mediterranean Sea during pre-bloom and oligotrophic conditions: correlations to seawater chlorophyll a from a mesocosm study, Atmos. Chem. Phys., 15, 7961–7976, https://doi.org/10.5194/acp-15-7961-2015, 2015.
Sellegri, K., O'Dowd, C. D., Yoon, Y. J., Jennings, S. G., and de Leeuw, G.: Surfactants and submicron sea spray generation, J. Geophys. Res., 111, D22215, https://doi.org/10.1029/2005JD006658, 2006.
Soares, J., Sofiev, M., Geels, C., Christensen, J. H., Andersson, C., Tsyro, S., and Langner, J.: Impact of climate change on the production and transport of sea salt aerosol on European seas, Atmos. Chem. Phys., 16, 13081–13104, https://doi.org/10.5194/acp-16-13081-2016, 2016.
Sofiev, M., Soares, J., Prank, M., de Leeuw, G., and Kukkonen, J.: A regional-to-global model of emission and transport of sea salt particles in the atmosphere, J. Geophys. Res., 116, D21302, https://doi.org/10.1029/2010JD014713, 2011.
Stokes, M. D., Deane, G. B., Prather, K., Bertram, T. H., Ruppel, M. J., Ryder, O. S., Brady, J. M., and Zhao, D.: A Marine Aerosol Reference Tank system as a breaking wave analogue for the production of foam and sea-spray aerosols, Atmos. Meas. Tech., 6, 1085–1094, https://doi.org/10.5194/amt-6-1085-2013, 2013.
Textor, C., Schulz, M., Guibert, S., Kinne, S., Balkanski, Y., Bauer, S., Berntsen, T., Berglen, T., Boucher, O., Chin, M., Dentener, F., Diehl, T., Easter, R., Feichter, H., Fillmore, D., Ghan, S., Ginoux, P., Gong, S., Grini, A., Hendricks, J., Horowitz, L., Huang, P., Isaksen, I., Iversen, I., Kloster, S., Koch, D., Kirkevåg, A., Kristjansson, J. E., Krol, M., Lauer, A., Lamarque, J. F., Liu, X., Montanaro, V., Myhre, G., Penner, J., Pitari, G., Reddy, S., Seland, Ø., Stier, P., Takemura, T., and Tie, X.: Analysis and quantification of the diversities of aerosol life cycles within AeroCom, Atmos. Chem. Phys., 6, 1777–1813, https://doi.org/10.5194/acp-6-1777-2006, 2006.
Tseng, R.-S., Viechnicki, J. T., Skop, R. A., and Brown, J. W.: Sea-to-air transfer of surface-active organic compounds by bursting bubbles, J. Geophys. Res., 97, 5201, https://doi.org/10.1029/91JC00954, 1992.
Tyree, C. A., Hellion, V. M., Alexandrova, O. A., and Allen, J. O.: Foam droplets generated from natural and artificial seawaters, J. Geophys. Res., 112, D12204, https://doi.org/10.1029/2006JD007729, 2007.
Vazquez, A., Sanchez, R. M., Salinas-Rodríguez, E., Soria, A., and Manasseh, R.: A look at three measurement techniques for bubble size determination, Exp. Therm. Fluid Sci., 30, 49–57, https://doi.org/10.1016/j.expthermflusci.2005.03.018, 2005.
Viskari, T., Asmi, E., Virkkula, A., Kolmonen, P., Petäjä, T., and Järvinen, H.: Estimation of aerosol particle number distribution with Kalman Filtering – Part 2: Simultaneous use of DMPS, APS and nephelometer measurements, Atmos. Chem. Phys., 12, 11781–11793, https://doi.org/10.5194/acp-12-11781-2012, 2012.
Wang, X., Deane, G. B., Moore, K. A., Ryder, O. S., Stokes, M. D., Beall, C. M., Collins, D. B., Santander, M. V., Burrows, S. M., Sultana, C. M., and Prather, K. A.: The role of jet and film drops in controlling the mixing state of submicron sea spray aerosol particles, P. Natl. Acad. Sci. USA, 114, 6978–6983, https://doi.org/10.1073/pnas.1702420114, 2017.
Wang, X., Chen, C., Binder, K., Kuhn, U., Pöschl, U., Su, H., and Cheng, Y.: Molecular dynamics simulation of the surface tension of aqueous sodium chloride: from dilute to highly supersaturated solutions and molten salt, Atmos. Chem. Phys., 18, 17077–17086, https://doi.org/10.5194/acp-18-17077-2018, 2018.
Wang, Z., King, S. M., Freney, E., Rosenoern, T., Smith, M. L., Chen, Q., Kuwata, M., Lewis, E. R., Pöschl, U., Wang, W., Buseck, P. R., and Martin, S. T.: The Dynamic Shape Factor of Sodium Chloride Nanoparticles as Regulated by Drying Rate, Aerosol Sci. Tech., 44, 939–953, https://doi.org/10.1080/02786826.2010.503204, 2010.
Wen, J., Shi, K., Sun, Q., Sun, Z., and Gu, H.: Measurement for Surface Tension of Aqueous Inorganic Salt, Front. Energy Res., 6, 12, https://doi.org/10.3389/fenrg.2018.00012, 2018.
Wiedensohler, A., Birmili, W., Nowak, A., Sonntag, A., Weinhold, K., Merkel, M., Wehner, B., Tuch, T., Pfeifer, S., Fiebig, M., Fjäraa, A. M., Asmi, E., Sellegri, K., Depuy, R., Venzac, H., Villani, P., Laj, P., Aalto, P., Ogren, J. A., Swietlicki, E., Williams, P., Roldin, P., Quincey, P., Hüglin, C., Fierz-Schmidhauser, R., Gysel, M., Weingartner, E., Riccobono, F., Santos, S., Grüning, C., Faloon, K., Beddows, D., Harrison, R., Monahan, C., Jennings, S. G., O'Dowd, C. D., Marinoni, A., Horn, H.-G., Keck, L., Jiang, J., Scheckman, J., McMurry, P. H., Deng, Z., Zhao, C. S., Moerman, M., Henzing, B., de Leeuw, G., Löschau, G., and Bastian, S.: Mobility particle size spectrometers: harmonization of technical standards and data structure to facilitate high quality long-term observations of atmospheric particle number size distributions, Atmos. Meas. Tech., 5, 657–685, https://doi.org/10.5194/amt-5-657-2012, 2012.
Wilson, T. W., Ladino, L. A., Alpert, P. A., Breckels, M. N., Brooks, I. M., Browse, J., Burrows, S. M., Carslaw, K. S., Huffman, J. A., Judd, C., Kilthau, W. P., Mason, R. H., McFiggans, G., Miller, L. A., Nájera, J. J., Polishchuk, E., Rae, S., Schiller, C. L., Si, M., Temprado, J. V., Whale, T. F., Wong, J. P. S., Wurl, O., Yakobi-Hancock, J. D., Abbatt, J. P. D., Aller, J. Y., Bertram, A. K., Knopf, D. A., and Murray, B. J.: A marine biogenic source of atmospheric ice-nucleating particles, Nature, 525, 234–238, https://doi.org/10.1038/nature14986, 2015.
Witek, M. L., Diner, D. J., and Garay, M. J.: Satellite assessment of sea spray aerosol productivity: Southern Ocean case study: Sea Spray Emission: Satellite Assessment, J. Geophys. Res.-Atmos., 121, 872–894, https://doi.org/10.1002/2015JD023726, 2016.
Woolf, D. K., Bowyer, P. A., and Monahan, E. C.: Discriminating between the film drops and jet drops produced by a simulated whitecap, J. Geophys. Res., 92, 5142, https://doi.org/10.1029/JC092iC05p05142, 1987.
Zábori, J., Matisāns, M., Krejci, R., Nilsson, E. D., and Ström, J.: Artificial primary marine aerosol production: a laboratory study with varying water temperature, salinity, and succinic acid concentration, Atmos. Chem. Phys., 12, 10709–10724, https://doi.org/10.5194/acp-12-10709-2012, 2012.
- Abstract
- Introduction
- Materials and methods
- Results
- Discussion
- Conclusions
- Appendix A: Notations
- Appendix B: Chamber system
- Appendix C: Determination of foam area and bubble size distribution using ImageJ 1.53K software
- Data availability
- Author contributions
- Competing interests
- Disclaimer
- Acknowledgements
- Financial support
- Review statement
- References