the Creative Commons Attribution 4.0 License.
the Creative Commons Attribution 4.0 License.
 | 21 Nov 2022
Raindrop size distribution (DSD) during the passage of tropical cyclone Nivar: effect of measuring principle and wind on DSDs and retrieved rain integral and polarimetric parameters from impact and laser disdrometers
Raindrop size distribution (DSD) observations during the passage of landfalling tropical cyclone Nivar by impact (JWD) and laser (LPM and PARSIVEL) disdrometers are used to unveil the DSD characteristics in the eyewall as well as the inner and outer rainbands. Disdrometer measurements collected at the same location are used to study the effect of wind, measuring principle, and hardware processing on the DSDs and, in turn, on estimated rain integral and polarimetric parameters. The concentration of raindrops of diameters between 0.7 and 1.5 mm increases with rain rate (R) in all the regions of Nivar, while the magnitude of the increase is higher in the eyewall than in the inner and outer rainbands. The DSD characteristics reveal that for a given R, relatively larger reflectivity (Z) and mass-weighted mean diameter (Dm) are found in the outer rainband, and smaller Z and Dm are found in the eyewall than in other regions of a tropical cyclone (TC). Raindrops of diameter 3 mm in size are observed frequently in inner and outer rainbands; however, they are infrequent in the eyewall at R greater than 5 mm h−1. The DSDs and estimated rain integral and polarimetric parameters are distinctly different for various disdrometers at similar environmental conditions. Raindrops greater than 3 mm in size are infrequent in the JWD recordings, while they are frequent in the LPM and PARSIVEL, indicating that LPM and PARSIVEL overestimate the raindrop size when the fall path deviates from nadir due to horizontal wind. The wind effect on the recorded DSD as well as estimated rain integral and polarimetric parameters are not uniform in various regions of Nivar for different disdrometers as the measuring principle and hardware processing further influence these effects. Along with the differences in measured DSD spectra, the resonance effects at X band for raindrops greater than 3 mm cause variations in the estimated polarimetric parameters between the disdrometers.
- Article
(28265 KB) - Full-text XML
-
Supplement
(1246 KB) - BibTeX
- EndNote


Tropical cyclones (TCs) are destructive atmospheric phenomena associated with extremely high winds and ample rainfall, which cause severe damage to human life and the economy. The advancements made in recent years have noticeably improved numerical weather prediction (NWP) models that forecast TC genesis and tracks (Hendricks et al., 2011); however, intensity predictions are still to be improved (DeMaria et al., 2014). All scales (micro-scale to synoptic) of forcings influence the intensity fluctuations of a TC (Molinari and Vollaro, 1989; Bosart et al., 2000; Hanley et al., 2001); however, small-scale, transient, moist convective processes and resultant latent heating play a major role in different regions (McFarquhar et al., 2006). Convective processes and resulting rainfall in a TC are primarily governed by the evolution of the microphysics of a TC (Khain et al., 2016). The microphysical process information is obtained by studying the raindrop size distribution (DSD). DSD is the raindrop concentration per drop size per unit volume. Spatiotemporal variations of DSD at various scales in different rain types are essential for disclosing the fundamental precipitation microphysical processes, including collision–coalescence, breakup, and evaporation (Rosenfeld and Ulbrich, 2003; Radhakrishna et al., 2020). Considering the vast application of DSD, it is one of the prime measurements required in the fields of remote sensing and numerical weather prediction. The differences in dynamical and microphysical processes from the eyewall to inner rainbands and outer rainbands (Houze, 2010) cause changes in the DSD observed at the surface (Merceret, 1974; Homeyer et al., 2021). This shows the importance of DSD in various regions of a TC to better represent the microphysics in NWP models for improving intensity predictions (Fierro and Mansell, 2017; Wang et al., 2020).
DSD varies in different regions of a TC (Merceret, 1974; Homeyer et al., 2021) seasonally and from noncyclonic rain (Radhakrishna and Rao, 2010). Mass-weighted mean diameter (Dm) comparisons over the Pacific (Chen et al., 2012), Atlantic (Tokay et al., 2008), and Bay of Bengal (Radhakrishna and Rao, 2010) basins show the largest Dm values over the Bay of Bengal and smallest Dm values over the Pacific compared to other basins. The studies mentioned above used different disdrometers (impact, video, and laser-based) to measure the DSD at the surface. A laser-based particle size velocity (PARSIVEL) disdrometer underestimates small raindrops (Tokay et al., 2014; Thurai et al., 2017; Wen et al., 2018) compared to a two-dimensional video disdrometer (2DVD). These differences in DSDs are due to variations in measuring principles of drop diameter by various disdrometers. The Joss–Waldvogel disdrometer (JWD) measures the drop size by measuring the impact of falling raindrops on a pressure sensor converted into an electric signal (Joss and Waldvogel, 1967). Laser precipitation monitor (LPM) and PARSIVEL disdrometers measure drop size by accounting for the variations in the intensity of a laser beam between the emitter and receiver (Illingworth and Stevens, 1987; Löffler-Mang and Joss, 2000). Two orthogonal line-scan camera images of 2DVD provide raindrop size, shape, and velocity (Kruger and Krajewski, 2002). Each principle and hardware processing has its advantages and disadvantages, leading to errors and uncertainties in the measured DSD spectrum. 2DVD is considered the most reliable in measuring DSDs accurately (Raupach and Berne, 2015; Thurai et al., 2017); however, further works by Thurai and Bringi (2018) and Raupach et al. (2019) showed that these disdrometers underestimate small raindrops considerably.
The disdrometer evaluation experiment (DEVEX) showed good agreement between PARSIVEL, 2DVD, and a dual-beam spectropluviometer (Krajewski et al., 2006). However, PARSIVEL measured more smaller drops and higher rainfall rates than the other two. Considering DSDs from TCs and organized mesoscale convective systems, Thurai et al. (2011) showed that PARSIVEL and 2DVD show good agreement until 20 mm h−1, while PARSIVEL overestimates by 20 %–30 % at higher rainfall rates. Krajewski et al. (2006) attributed these differences to instrument background noise, condensation of water vapor on the lenses, splashes, and margin fallers. Tokay et al. (2014) compared JWD and PARSIVEL and showed good agreement in the DSD spectra above 0.5 mm diameter. Angulo-Martínez et al. (2018) and Guyot et al. (2019) found the recording of more smaller drops by LPM than PARSIVEL, and these errors are amplified with increasing rain intensity. Errors in DSD measurements are affected by instrument principle as well as associated hardware and external environmental conditions like wind speed and direction (Friedrich et al., 2013; Capozzi et al., 2021). Strong wind conditions create turbulence along the walls of 2DVD, deflecting the small drop path and resulting in more intersects, leading to an excess of smaller drops (Nešpor et al., 2000). To study the wind speed and direction effects on a laser disdrometer, Friedrich et al. (2013) used articulating and stationary disdrometers and found marginal variations for small drops (<2 mm). However, the articulating disdrometer recorded higher concentrations of large (>5 mm; 200–500 m−3 mm−1) and medium-sized (2–5 mm; 500–3000 m−3 mm−1) drops compared to the stationary disdrometer.
Disdrometers are used as ground truth to validate radar geophysical parameters. The artifacts and instrument errors associated with various kinds of disdrometers mentioned above need to be quantified as they propagate to the retrievals of radar geophysical parameters (Adirosi et al., 2018) and, in turn, surface rainfall from weather radars (both polarimetric and non-polarimetric). Mitigating these errors is crucial for representing the microphysics in NWP models correctly. Thus, considering all these artifacts and errors, the present study is aimed to study the differences in DSDs observed by JWD, PARSIVEL, and LPM in different regions of the landfalling very severe cyclonic storm Nivar originating over the Bay of Bengal. Also, this study assesses the effect of horizontal wind speed on DSDs observed by impact and laser disdrometers as well as the retrieved rain integral and polarimetric parameters.
2.1 Joss–Waldvogel disdrometer
JWD is an impact-type disdrometer that measures raindrops primarily in 127 diameter classes, hitting a surface area of 50 cm2 with an accuracy of 95 % in a 1 min time interval (Joss and Waldvogel, 1967). These 127 classes are further combined into 20 intervals, distributed more or less exponentially, measuring raindrops from 0.3 to 5.3 mm. The DSD is estimated in each diameter interval from the 1 min JWD observations as follows:
where i stands for the diameter interval number, N(Di) is the number of drops per unit volume per unit diameter interval, F is the measuring area (5000 mm2), t is the sampling time (60 s), ni is the number of drops in the ith class interval, Di is the ith class equivolume diameter (mm), v(Di) is the fall velocity of the drop with diameter Di (m s−1), and ΔDi is the ith class drop interval (mm).
2.2 Thesis Clima laser precipitation monitor
Thesis Clima LPM uses a 228 mm length, 20 mm width, and 0.75 mm thickness laser bean of wavelength 780 nm with a resulting sampling area of 45.6 cm2 (Illingworth and Stevens, 1987). However, the manufacturer provides information on slight variations in the dimensions of the laser beam for each disdrometer separately using a parameter called AUparameter. Hence, the measuring area is device-specific for LPM and is estimated using the following equation.
For the LPM used in this study, AUparameter is 916, resulting in a sampling area of 50.218 cm2. LPM measures raindrops between 0.18 and 8 mm in 22 different diameter intervals with 20 fall velocity intervals ranging from 0.1 to 10.5 m s−1. LPM records data at a 1 min resolution. The drops falling on the edges of the laser beam effectively reduce the sampling area of the LPM depending on the diameter of the drop (Löffler-Mang and Joss, 2000). The effective sampling area is given by
The drop size distribution is estimated as follows:
where ni,j is the number of drops recorded by LPM in i diameter and j velocity interval, and vL(j) is the fall velocity of a raindrop with diameter Di (m s−1) measured by the LPM.
2.3 OTT PARSIVEL disdrometer
The second-generation PARSIVEL disdrometer manufactured by OTT Hydromet Inc consists of a 780 nm laser beam with dimensions of 180 mm length, 30 mm width, and 1 mm thickness providing a sampling area of 54 cm2 (Löffler-Mang and Joss, 2000). PARSIVEL records raindrops in the range of 0.1 and 24.5 mm in 32 diameter and 32 velocity intervals (ranges between 0.05 and 20.8 m s−1). PARSIVEL also shows margin fallers; the effective sampling area and N(D) are calculated using the following relations.
Here, vP(j) is the fall velocity of a raindrop with diameter Di (m s−1) measured by PARSIVEL. The processing done by the manufacturer of the disdrometer converts the electrical signals into the number of drops in each drop diameter interval. After obtaining the number of drops in each diameter interval, Eqs. (1) to (6) are used to estimated N(D) from the respective disdrometer.
2.4 Rain integral and polarimetric parameters
In open fields, JWD and LPM are installed 10 m apart (13.4608∘ N, 79.1733∘ E), while PARSIVEL is 500 m away from both in the southeast direction (13.4565∘ N, 79.1758∘ E). During the passage of Nivar, JWD and PARSIVEL observations are available throughout the event, while LPM observations are available after 14:15 IST (Indian standard time) on 25 November 2020. The disdrometer data are quality-checked before estimating the rain integral and polarimetric parameters. The 1 min data recordings are considered only when they show drop measurements in more than five diameter class intervals and the number of drops measured is greater than 50. This threshold condition removes the spurious values from the disdrometer recordings caused by non-precipitating targets (Radhakrishna and Rao, 2010). The splashing and margin filler effects are removed using velocity thresholds following Jaffrain and Berne (2011) and Friedrich et al. (2013) for the laser disdrometers. The quality-controlled data are used to estimate the N(D) using Eqs. (1), (4), and (6). The estimated N(D) is used to calculate rain rate (R), reflectivity (Z) assuming Rayleigh approximation, Dm, and normalized intercept parameter (Nw) using the following relations.
The polarimetric parameters are estimated using scattering amplitudes from the T-matrix simulations (Mishchenko et al., 1996) at S- (2.8 GHz), C- (5.6 GHz), and X-band (9.3369 GHz, the frequency of X-band radar operating at Gadanki) frequencies. The scattering simulations are performed in the temperature ranges from 5 to 30 ∘C using the refractive index of raindrops estimated from Ray (1972) and the drop axis ratio relation from Brandes et al. (2002). The polarimetric radar parameter reflectivity in horizontal (ZH) and vertical (ZV) polarizations, differential reflectivity (ZDR), specific differential phase (KDP), the co-polar correlation coefficient between horizontal and vertical polarizations (ρHV), two-way specific differential attenuation (ADP), and specific attenuation at horizontal polarization (AH) are estimated using backscattering (SHH, SVV) and forward scattering (FHH, FVV) amplitudes (mm).
Here, i stands for diameter interval, c in superscript indicates the complex conjugate, λ is the wavelength (mm) considered, and K is the complex refractive index whose real part denotes the phase speed and whose imaginary part indicates the extinction. KDP is immune to attenuation and is widely used to correct the attenuation using KDP−AH and KDP−ADP relations, which is the advantage of polarimetric compared to conventional weather radars (Bringi et al., 1990; Jameson, 1991; Park et al., 2005). The studies by Bringi et al. (1990) and Jameson (1991) showed that KDP, AH, and ADP are related linearly, while Park et al. (2005) showed a power-law relation. As the powers are ∼1 over the Gadanki region (Rao et al., 2018), linear relations of KDP, AH, and ADP are considered following Bringi et al. (1990) and are given below.
γDP is the differential attenuation coefficient, γH is the attenuation coefficient, and both depend on the DSD characteristics, temperature, and drop shape. As ADP and AH are in decibels per kilometer (dB km−1), both γDP and γH are expressed in decibels per degree.
On 21 November 2020, a low-pressure area is formed over the equatorial Indian Ocean and adjoining central parts of the southern Bay of Bengal. It concentrated into a depression over the southwest and adjoining southeastern Bay of Bengal at 02:30 IST on 23 November, then moved west-northwestwards and intensified into a deep depression in the evening of the same day. It is further intensified into cyclonic storm Nivar over the southwestern Bay of Bengal at 05:30 IST on 24 November. It moved in the same direction and intensified into a severe cyclonic storm at midnight (23:30 IST) on 24 November and into a very severe cyclonic storm in the afternoon (14:30 IST) on 25 November. Moving further northwestwards, Nivar made landfall at 23:30 IST on 25 November at 12.1∘ N and 79.9∘ E near Puducherry as a very severe cyclonic storm with a wind speed of 120 km h−1. After landfall, it moved further northwestwards and weakened into a severe cyclonic storm at 02:30 IST on 26 November and further weakened into a cyclonic storm in the morning hours (08:30 IST) of the same day. It weakened into a deep depression and recurved its path towards north-northeastwards in the afternoon hours (14:30 IST) over the south of Andhra Pradesh and further into a depression at midnight (23:30 IST) over southern coastal Andhra Pradesh. The observed track (Knapp et al., 2010) and intensity based on Dvorak classification (Dvorak, 1984) of Nivar during 22 and 26 November 2020 are shown in Fig. 1. Nivar produced 130 mm of rainfall at Gadanki (13.5∘ N and 79.2∘ E) on 25 and 26 November, where the disdrometer observations were made. Nivar passed near Gadanki in the deep depression stage between 14:30 and 17:30 IST on 26 November.
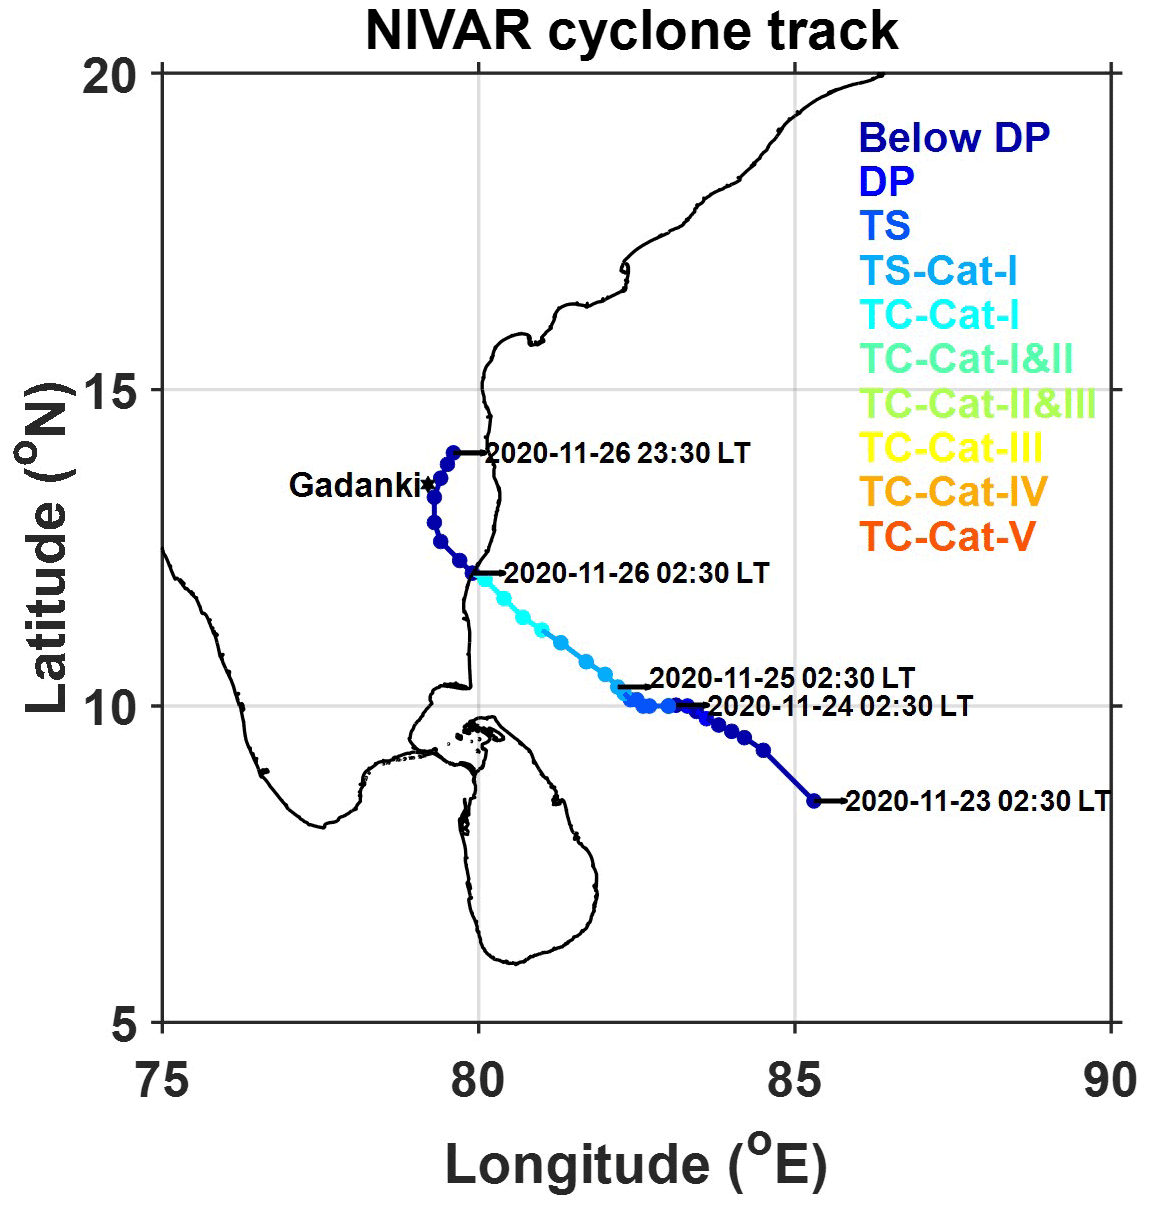
Figure 1The track and category of the Nivar cyclone formed over the Bay of Bengal are shown with a time interval of 3 h. The cyclone categories are based on the Dvorak classification. The black star indicates the location of Gadanki where disdrometers are installed.
A TC consists of a rain-free eye surrounded by a quasi-circular precipitation ring called an eyewall (<75 km in radius) and spiral rainbands (Cecil et al., 2002). The spiral rainbands are further classified into inner (between 75 and 150 km) and outer (>150 km) rainbands (Cecil et al., 2002). These regions are noted with concentric circles on the integrated multi-satellite retrievals for GPM (IMERG) final run V06B 30 min rainfall (Huffman et al., 2020) spatial maps during 25 and 26 November 2020 (Fig. 2). Also shown in Fig. 2 are the Nivar eye location indicated with a dot symbol and the Gadanki location with a star symbol. Over the Gadanki region, the Nivar eyewall produced rainfall during 13:00 IST and 16:00 IST on 26 November, the inner rainband between 03:00 IST and 13:00 IST as well as after 16:00 IST on 26 November, and the outer rainband during 25 November as well as up to 03:00 IST on 26 November. At Gadanki, tipping bucket rain gauge measurements show that the amount of rainfall produced by the Nivar eyewall is 21 mm, the inner rainband is 83 mm, and the outer rainband is 26 mm.
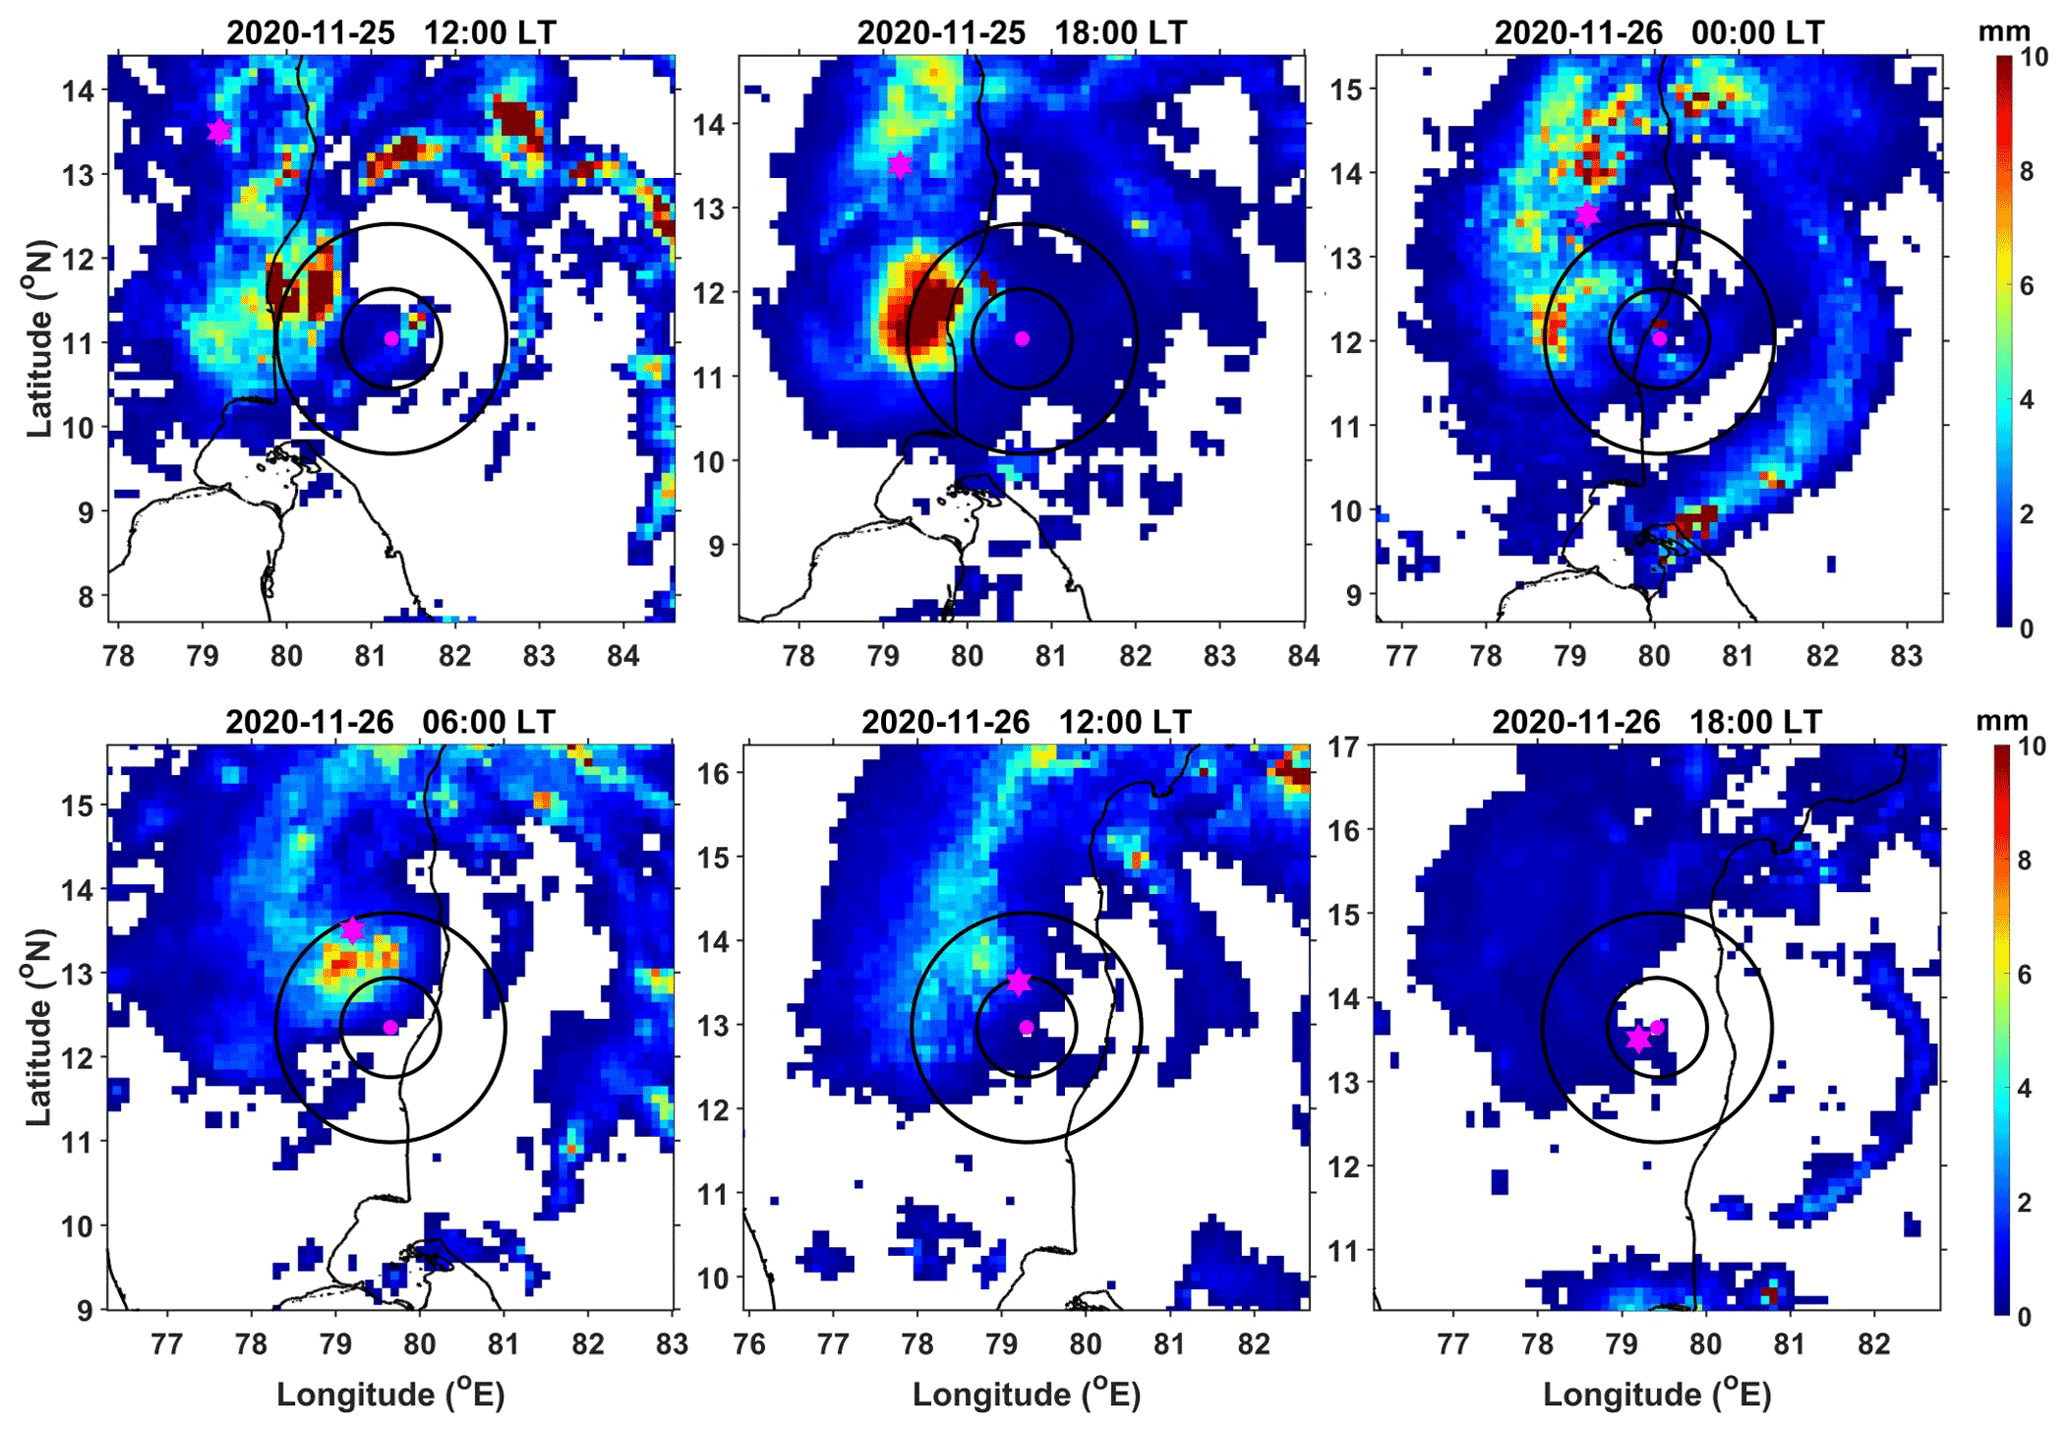
Figure 2IMERG 30 min accumulated rainfall (in mm) maps of the Nivar cyclone with the eye (pink closed circle), eyewall (75 km), and inner rainband (150 km) boundaries. The pink hexagon indicates the location of Gadanki; the inner black solid circle shows the eyewall and inner rainband, and the outer black solid circle indicates the inner and outer rainband boundaries.
The temporal variation of rain integral parameters (R, Z, and Dm) estimated from JWD, PARSIVEL, and LPM during the passage of Nivar is shown in Fig. 3. The time series of R, Z, and Dm show a maximum of 38 mm h−1, 44 dBZ, and 2 mm (except at one instance by LPM, which shows 2.5 mm), respectively. Nivar's intensity and reflectivity observations are similar to the TC Nisha (formed during 24 and 28 November 2008 over the Bay of Bengal) observations at Gadanki (Radhakrishna and Rao, 2010). The Dm observed during Nivar is similar to the Dm reported in cyclones elsewhere (Tokay et al., 2008; Wen et al., 2018) and in India (Radhakrishna and Rao, 2010). The rainfall observed during the passage of the outer rainband is mostly stratiform (rarely R≥10 mm h−1), while in the inner rainband and eyewall it is both convective and stratiform in nature. The horizontal wind at 8 m height shows maximum speeds during the inner rainband and eyewall passage. The three disdrometers observed similar variations in rain integral parameters with time while showing differences in magnitudes due to variations in the measuring principle and hardware processing. The time series of 1 min N(D) is plotted in Fig. 4 to investigate the differences in DSD observed by the three disdrometers. Irrespective of rain intensity, JWD rarely recorded raindrops greater than 3 mm, whereas LPM and PARSIVEL measurements showed raindrops up to 4 mm. The drops observed in the first few channels (<0.7 mm) are relatively higher in LPM than in JWD and PARSIVEL. The overestimation of the number of drops by LPM is also noticed at other geophysical locations (Europe) by Angulo-Martínez et al. (2018) compared to PARSIVEL. As explained in Angulo-Martínez et al. (2018), although the measuring principle is the same for LPM and PARSIVEL, the differences seen in the DSD spectra could be due to differences in the laser beam dimensions that can count the splashes and margin fallers. However, the corrections done using theoretical fall velocity and sampling area remove these effects to a greater extent. Thus, the differences caused in the DSD spectra measured by the LPM and PARSIVEL could be due to variations in the hardware processing, which are undisclosed by the manufacturers.
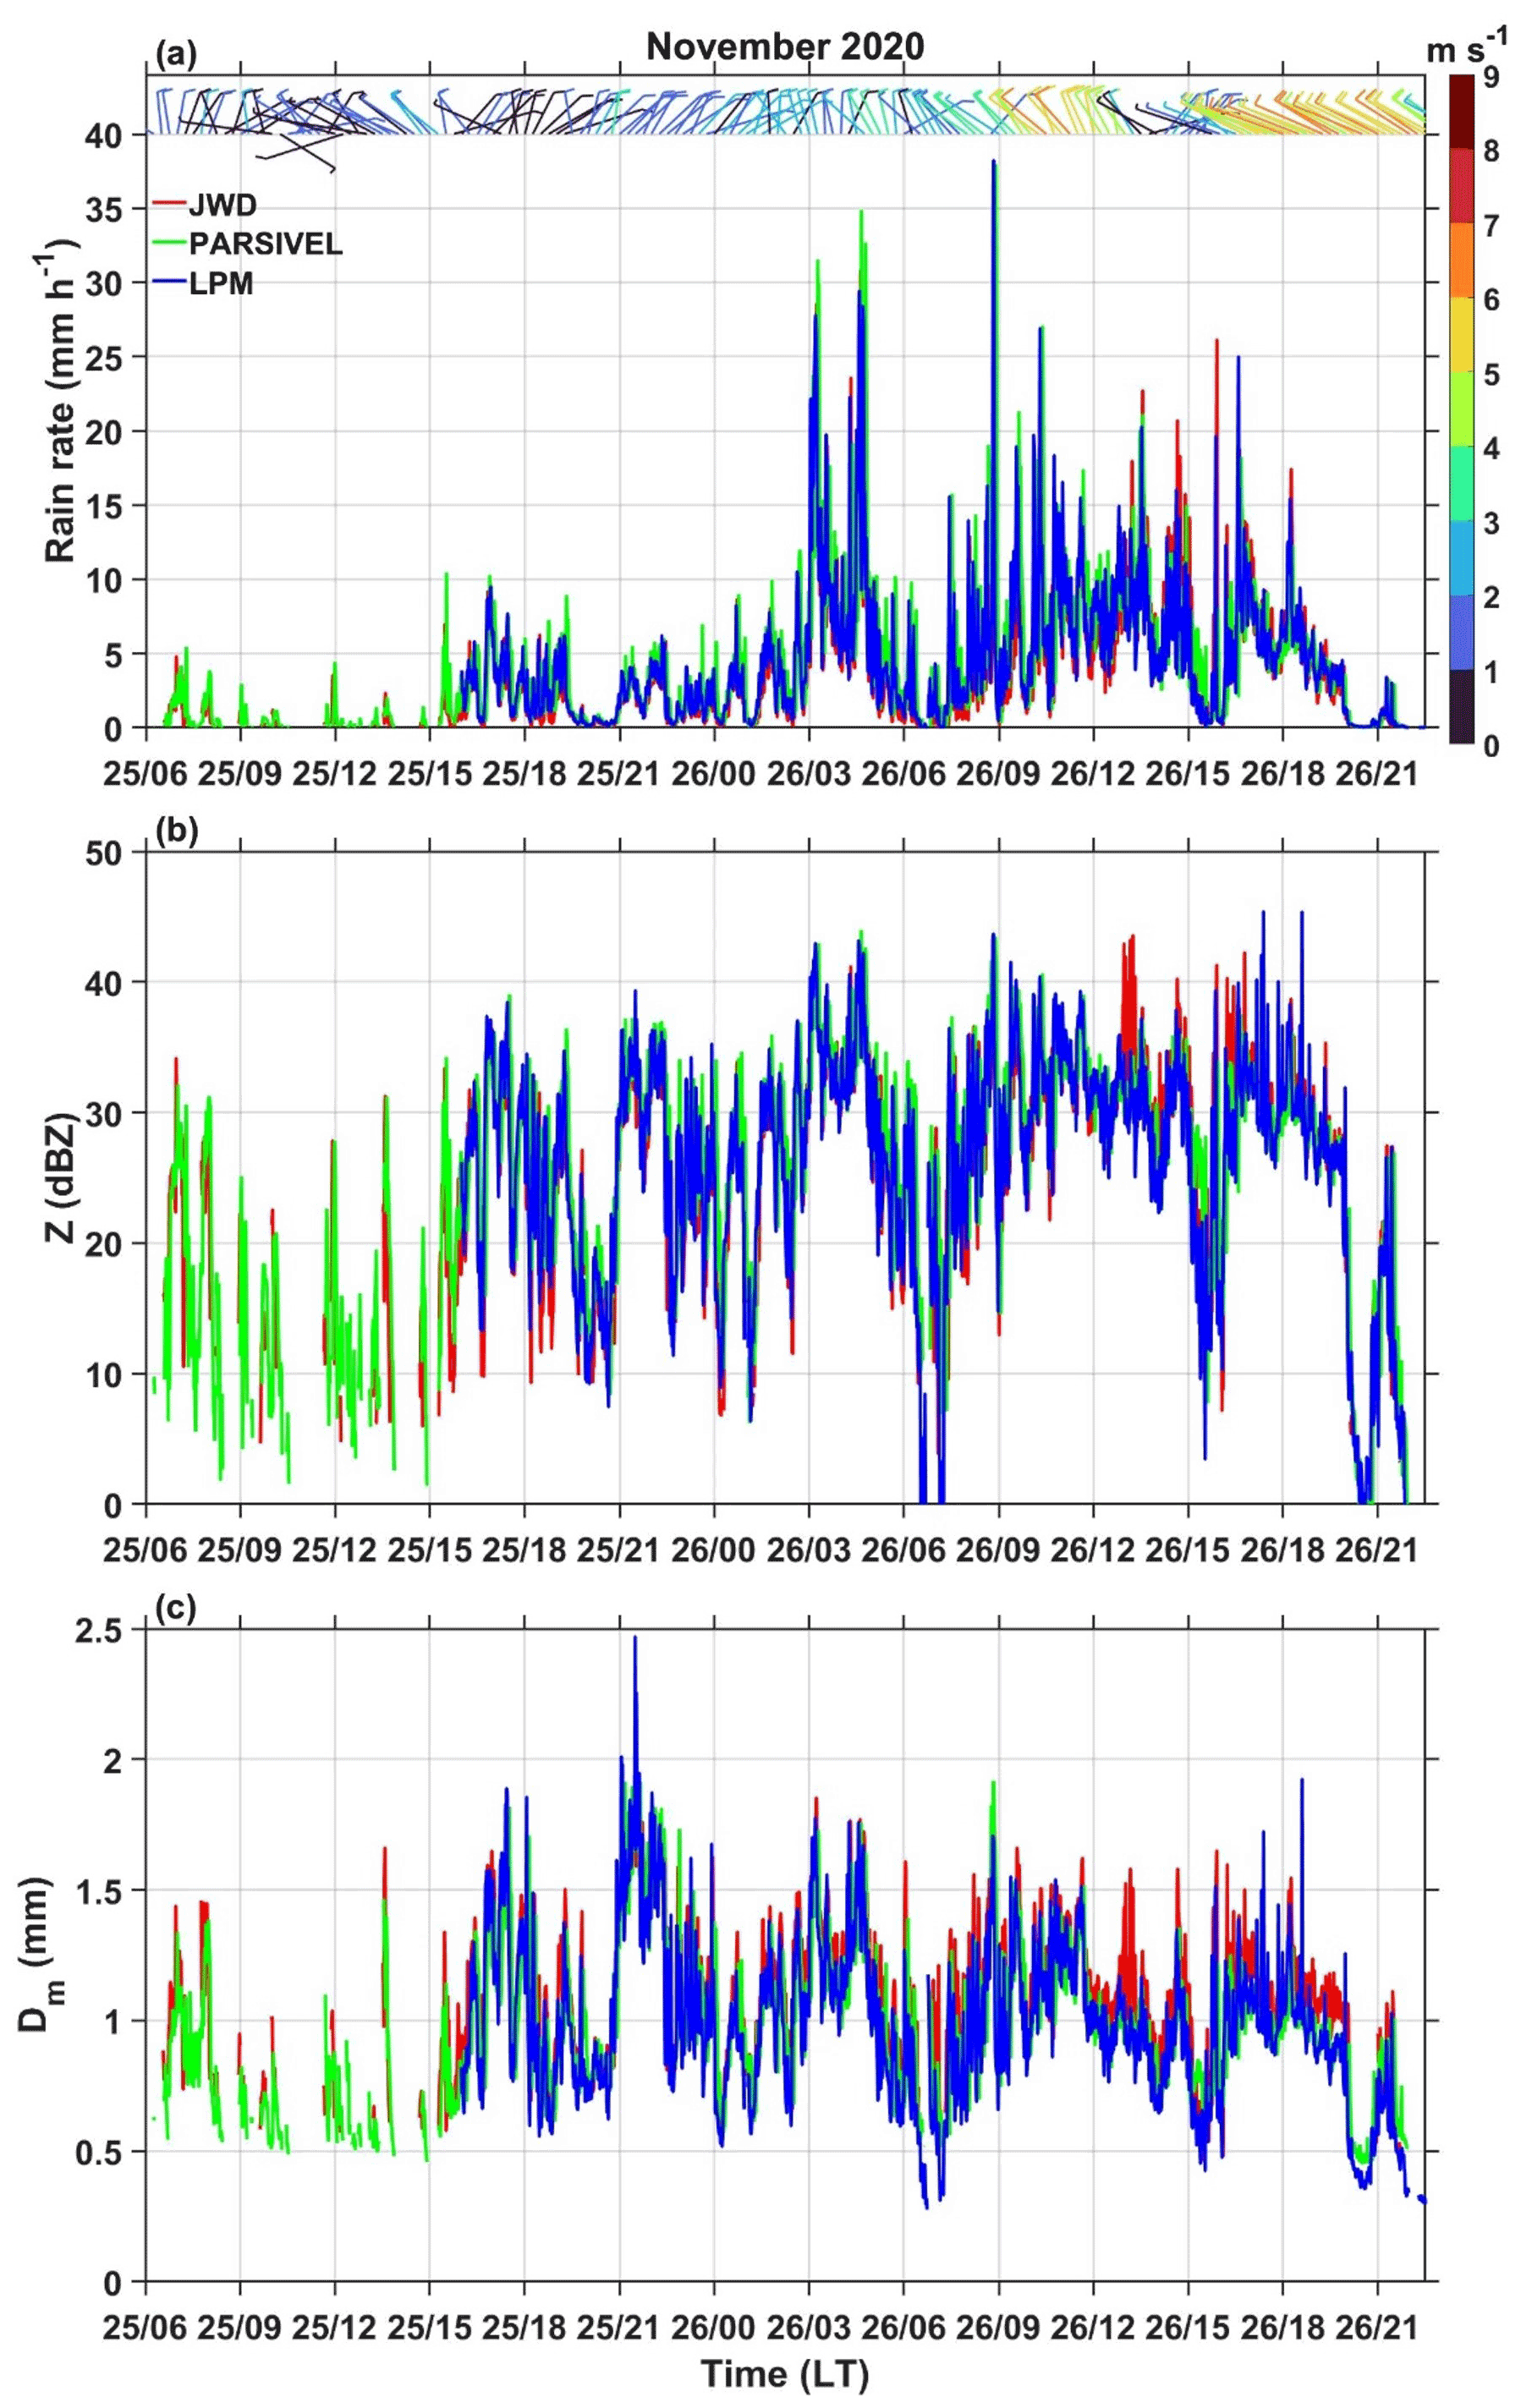
Figure 3(a) Rain rate (R in mm h−1), (b) reflectivity (Z in dBZ), and (c) mass-weighted mean diameter (Dm in mm) observed by three kinds of disdrometers (JWD, PARSIVEL, and LPM) with a temporal resolution of 1 min during the passage of the Nivar cyclone over the Gadanki region. The wind barbs shown in panel (a) are the 5 min averaged wind vectors at 8 m height, whose magnitudes are indicated with the colors mentioned in the color bar.

Figure 4Time series of 1 min N(D) (mm−1 m−3) observed by three kinds of disdrometers (JWD, PARSIVEL, and LPM) during the passage of the Nivar cyclone over the Gadanki region. The color bar indicates log 10N(D).
The DSD differences observed between JWD, LPM, and PARSIVEL and their effect on rain integral parameters in different regions of Nivar are studied using the variations of Dm, Nw, and Z with R. The slope and intercept of Dm–R curves estimated from JWD (red), PARSIVEL (green), and LPM (blue) in the eyewall, inner rainband, and outer rainband regions are shown in Fig. 5a–c. For a given R, Dm values from the three disdrometers show the comparatively largest values in the outer rainband and larger values in the inner rainband compared to the eyewall region. Dm values from the three disdrometers increase with increasing R, while the magnitudes of increase (slope) are different from each other. At a given R, the Dm estimated from PARSIVEL is smaller, and JWD is larger than the other two disdrometers in all the regions of Nivar. The DSD spectrum shape varies with R so that to make the spectra independent of shape, Nw is considered following Testud et al. (2001). The variation of 10×log 10Nw (in dB; Nw is in mm−1 m−3) with R in the three regions of Nivar is depicted in Fig. 5d–f. Nw shows an increase with R in the outer rainband region for all disdrometers. In the eyewall region, JWD shows a decrease in Nw with R (negative slope), whereas LPM and PARSIVEL show an increase (positive slope). During the passage of the inner rainband, JWD shows an increase in Nw with R (positive slope), while LPM and PARSIVEL show a decrease (negative slopes). Nw–R curves show larger intercept values in the eyewall region and smaller values in the outer rainband region than in other regions. Nonetheless, the slope values vary for different regions and disdrometers. The discrepancy in the slopes of the Nw–R curves between the disdrometers in the eyewall and inner rainband needs to be further validated with more data before interpreting microphysically. Conventional weather radars use Z–R relations (, where A and b are empirical constants) for the quantitative precipitation estimation. The Z–R relations are estimated using a linear fit in log space and converted into power-law forms for different disdrometers in various regions of a TC, as depicted in Fig. 5g–i. Both empirical constants vary considerably between the eyewall and other regions, suggesting that these regions' Z–R relations are distinctly different. The empirical coefficients vary from one disdrometer to another except for laser disdrometers in the outer rainband region. Comparing A and b values of the Z–R relations for a particular rain type in different regions provides information on precipitation microphysics. In particular, the coefficient A gives the size of raindrops, i.e., larger A for larger raindrops, and the power b provides the microphysical processes. In size or mixed controlled cases in which collision–coalescence dominates, the b value is greater than 1, and for a number-controlled case (collision, coalescence, and breakup) that produces equilibrium DSD, the b value is ∼1 (Atlas et al., 1999; Rosenfeld and Ulbrich, 2003). The smaller A value of LPM than PARSIVEL and JWD in all the regions indicates the overestimation of smaller drops by LPM. The retrieved b value is greater than 1 by all disdrometers in all the regions, suggesting the dominance of the collision–coalescence process. The Z–R relations obtained over the Atlantic basin during hurricane Anita (eyewall: Z=253R1.3; outer rainband: Z=341R1.25) given in Marks et al. (1993) and over the eastern Pacific basin during typhoon Lekima (eyewall: Z=961.54R1.85; inner rainband: Z=280.23R1.86; outer rainband: Z=74.25R1.98) in Bao et al. (2020) are distinctly different from the Bay of Bengal region (present study). Tropical cyclones over the Bay of Bengal and the Atlantic Ocean show an increase in A value and in turn the size of raindrops and Dm with increasing distance from the cyclone eye while showing the opposite in the eastern Pacific basin.
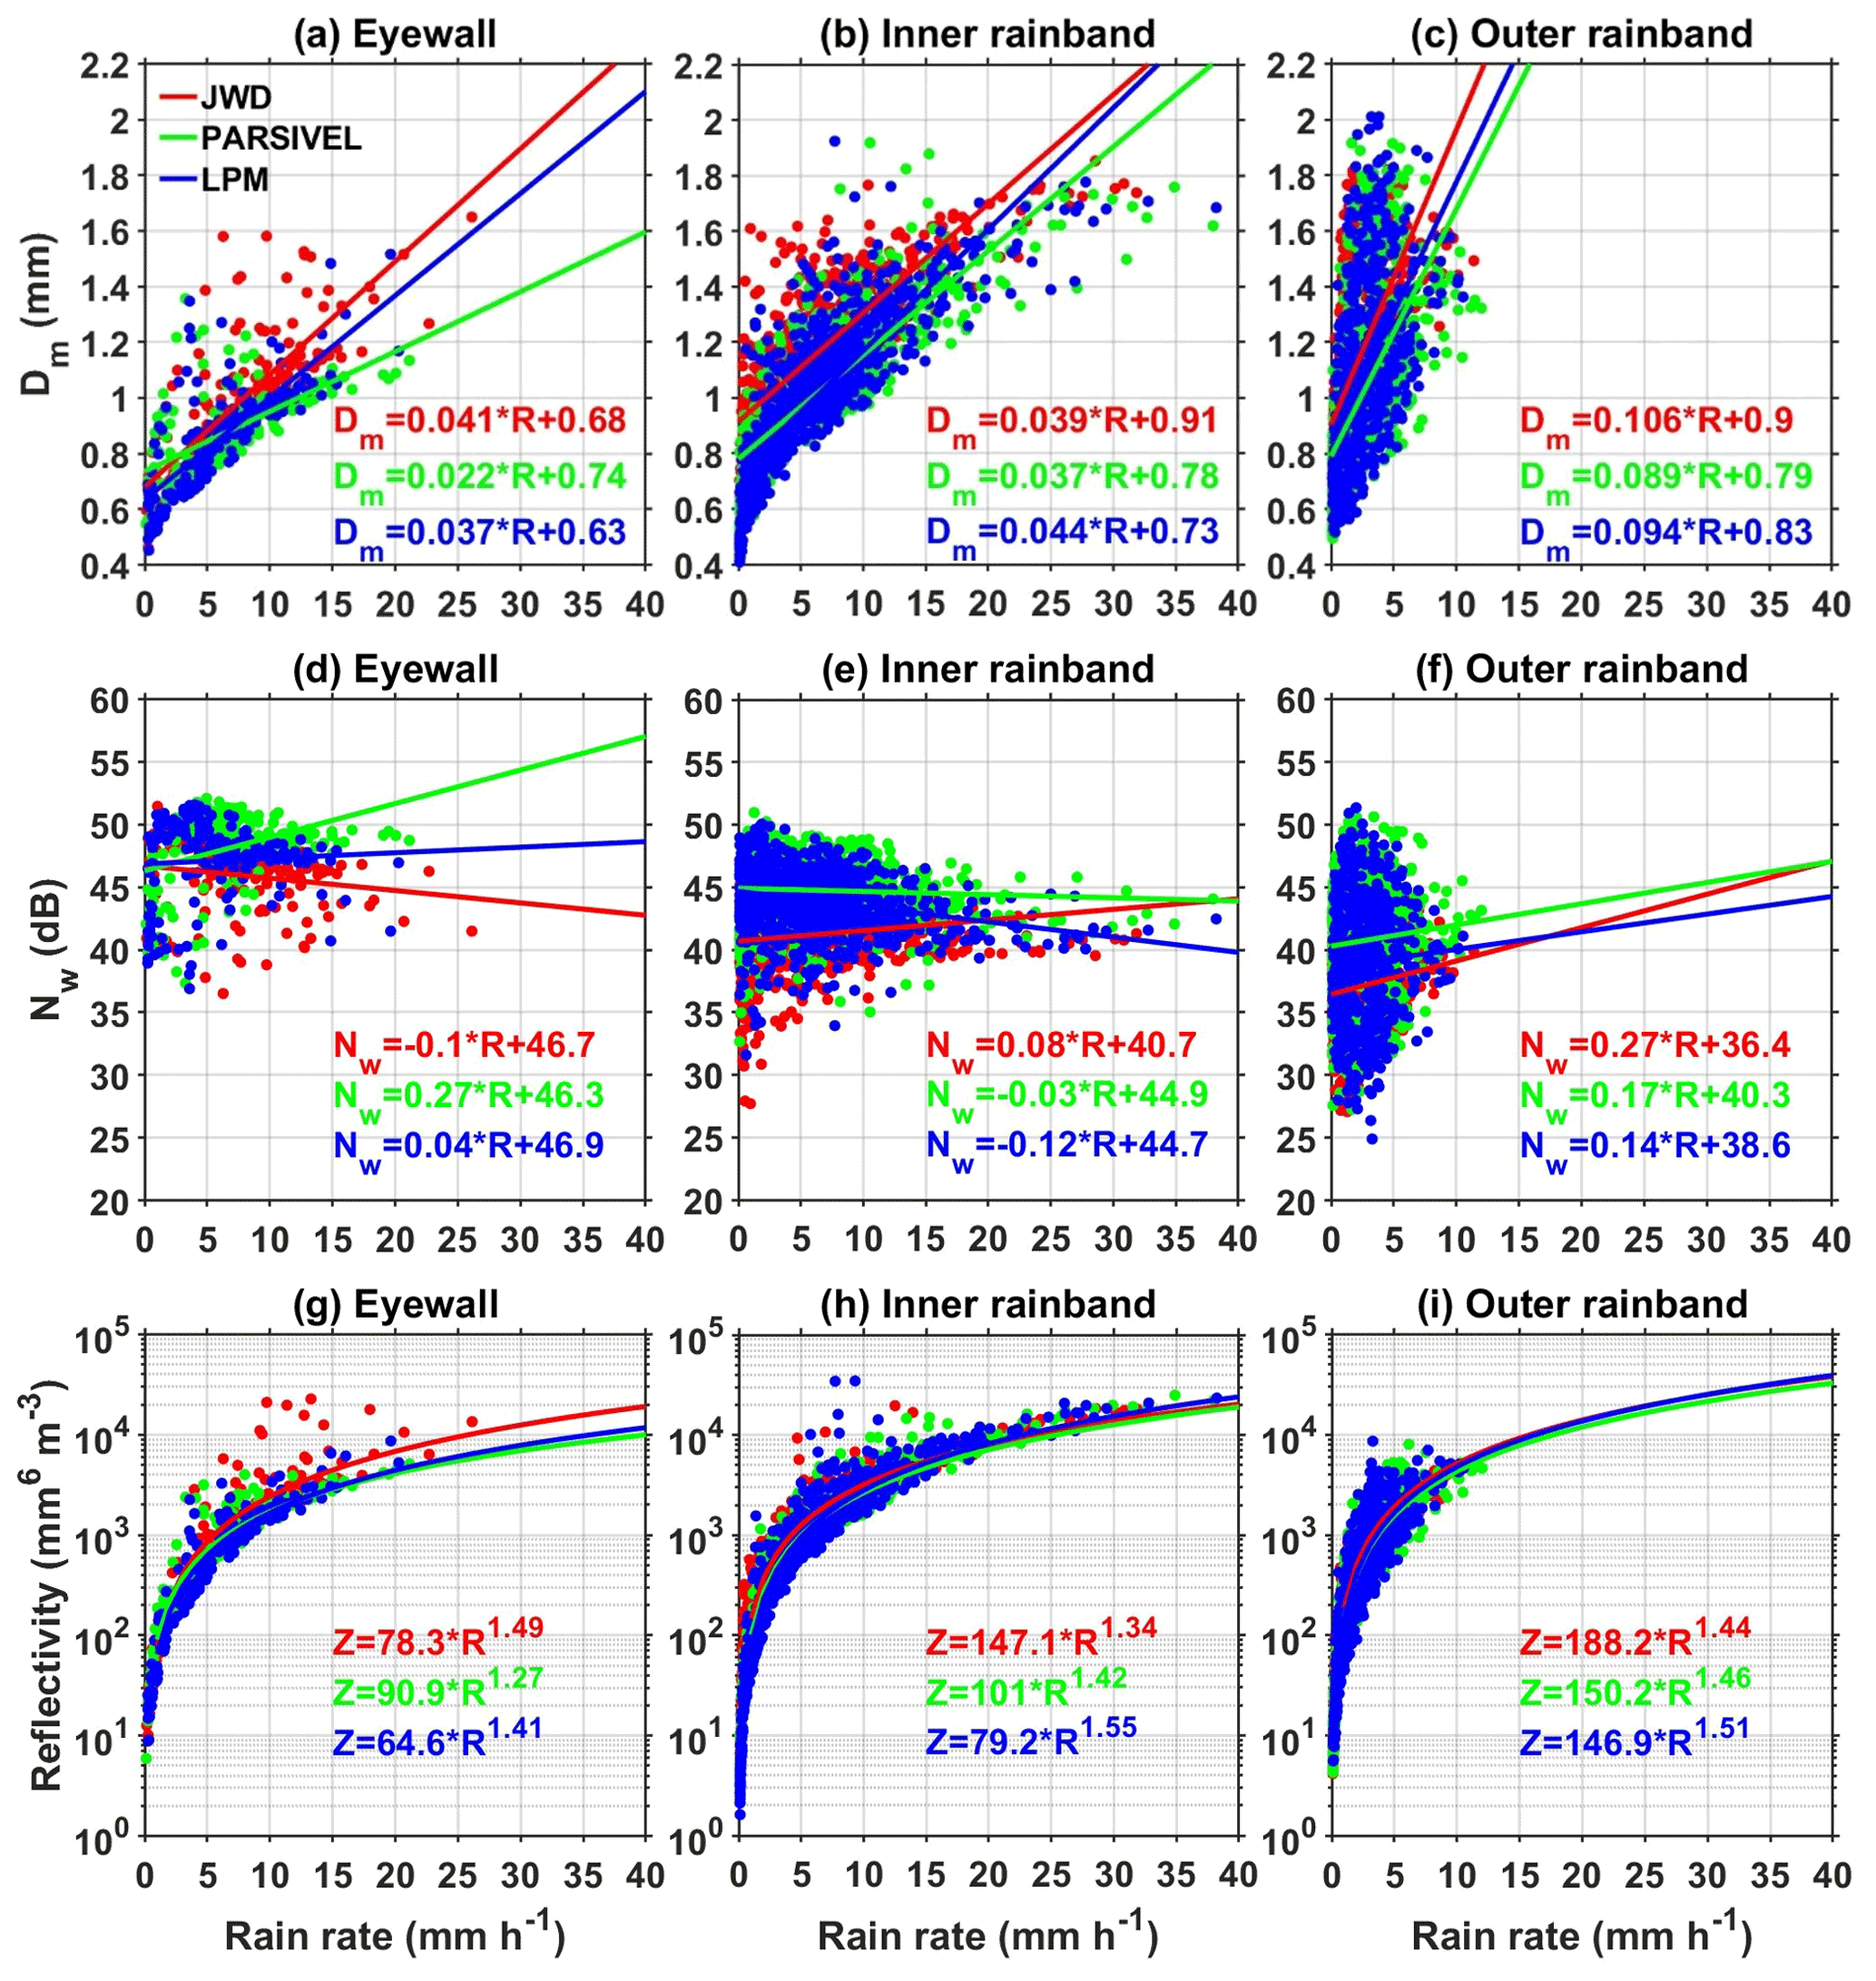
Figure 5Dm (mm) as a function of rain rate (mm h−1) in the (a) eyewall as well as the (b) inner and (c) outer rainband regions of Nivar observed by JWD, PARSIVEL, and LPM. The solid lines represent the linear fit at 95 % confidence level. (d–f) Same as panels (a)–(c) but for Nw. (g–i) Same as panels (a)–(c) but for Z, and the solid lines represent the power-law fit whose relations are shown in legends with the respective color.
The vertical wind aloft can influence the fall velocity of the hydrometeors. Vertical wind greater than 2 m s−1 is sustained for very little time below 300 m altitude and persists for longer times at higher altitudes (Rogers et al., 1993). Thus, the vertical wind close to the Earth's surface is assumed to be small, and its effect on drop fall velocity is neglected as raindrops of 4 mm or larger require less than 12 m to attain terminal velocity (van Boxel, 1998). As the disdrometers are installed at the Earth's surface, the vertical wind effects are not considered in this study. The horizontal wind changes the raindrop falling path, resulting in variations in the recorded DSD spectrum. When a raindrop falls with an angle, the residence time of the raindrop in the laser beam increases, which enhances the attenuation at the detector, increases the measuring diameter, and decreases the fall velocity. The wind speed measured at 8 m altitude near the disdrometer location is considered to account for the effects of horizontal wind on DSD measurements. The number of data points observed in the eyewall (eight 1 min samples) and outer rainband (six 1 min samples) with wind speeds greater than 4 m s−1 is small, so the present study is confined to two different wind speed intervals (0–2 and >2 m s−1).
Cyclonic DSDs are different from the eyewall to the inner rainband and outer rainband (Homeyer et al., 2021). The DSD observations during the Nivar passage are first categorized into eyewall, inner rainbands, and outer rainbands following the classification in Cecil et al. (2002). These categorized DSD spectra are further segregated with respect to R and wind speed, and the mean spectra are plotted in Fig. 6. The DSD observations are not available at R>10 mm h−1 with wind speed greater than 2 m s−1 in the outer rainband, so the mean DSD spectra are not shown in Fig. 6. Since the observations are made at the same location, similarities between the three disdrometers specify the DSD characteristics of a TC, and disparities indicate the errors in the observations due to differences in the measuring principle and hardware processing of disdrometers. Similarities show an increase in the maximum raindrop size with increasing R up to 5 mm h−1, and at higher intensities, the slope of the DSD spectrum changes by increasing the number concentration of medium-sized raindrops (between 0.7 and 2 mm) at all wind speeds in the three regions of a TC. The disparities show overestimation of small raindrops (<0.7 mm) by a factor of 10 to 100 by the LPM compared to JWD (except in the eyewall at R<5 mm h−1) and PARSIVEL at all R. At the large drop end (>2 mm), LPM and PARSIVEL overestimate raindrop concentrations more than JWD at R>5 mm h−1 in the inner rainband and at R>2 mm h−1 in the outer rainband, while this overestimation is not seen in the eyewall region. The overestimation of large raindrops by laser disdrometers compared to JWD is not uniform in all the regions of Nivar. This could be due to variations in the path of the falling raindrops from the vertical direction that cause errors in the measuring diameter of raindrops by the laser disdrometers or hardware issues present in the JWD, as noted in Tokay et al. (2005). Compared to PARSIVEL, LPM records marginally more larger drops (>2 mm), which could be due to changes in the hardware processing of these disdrometers.
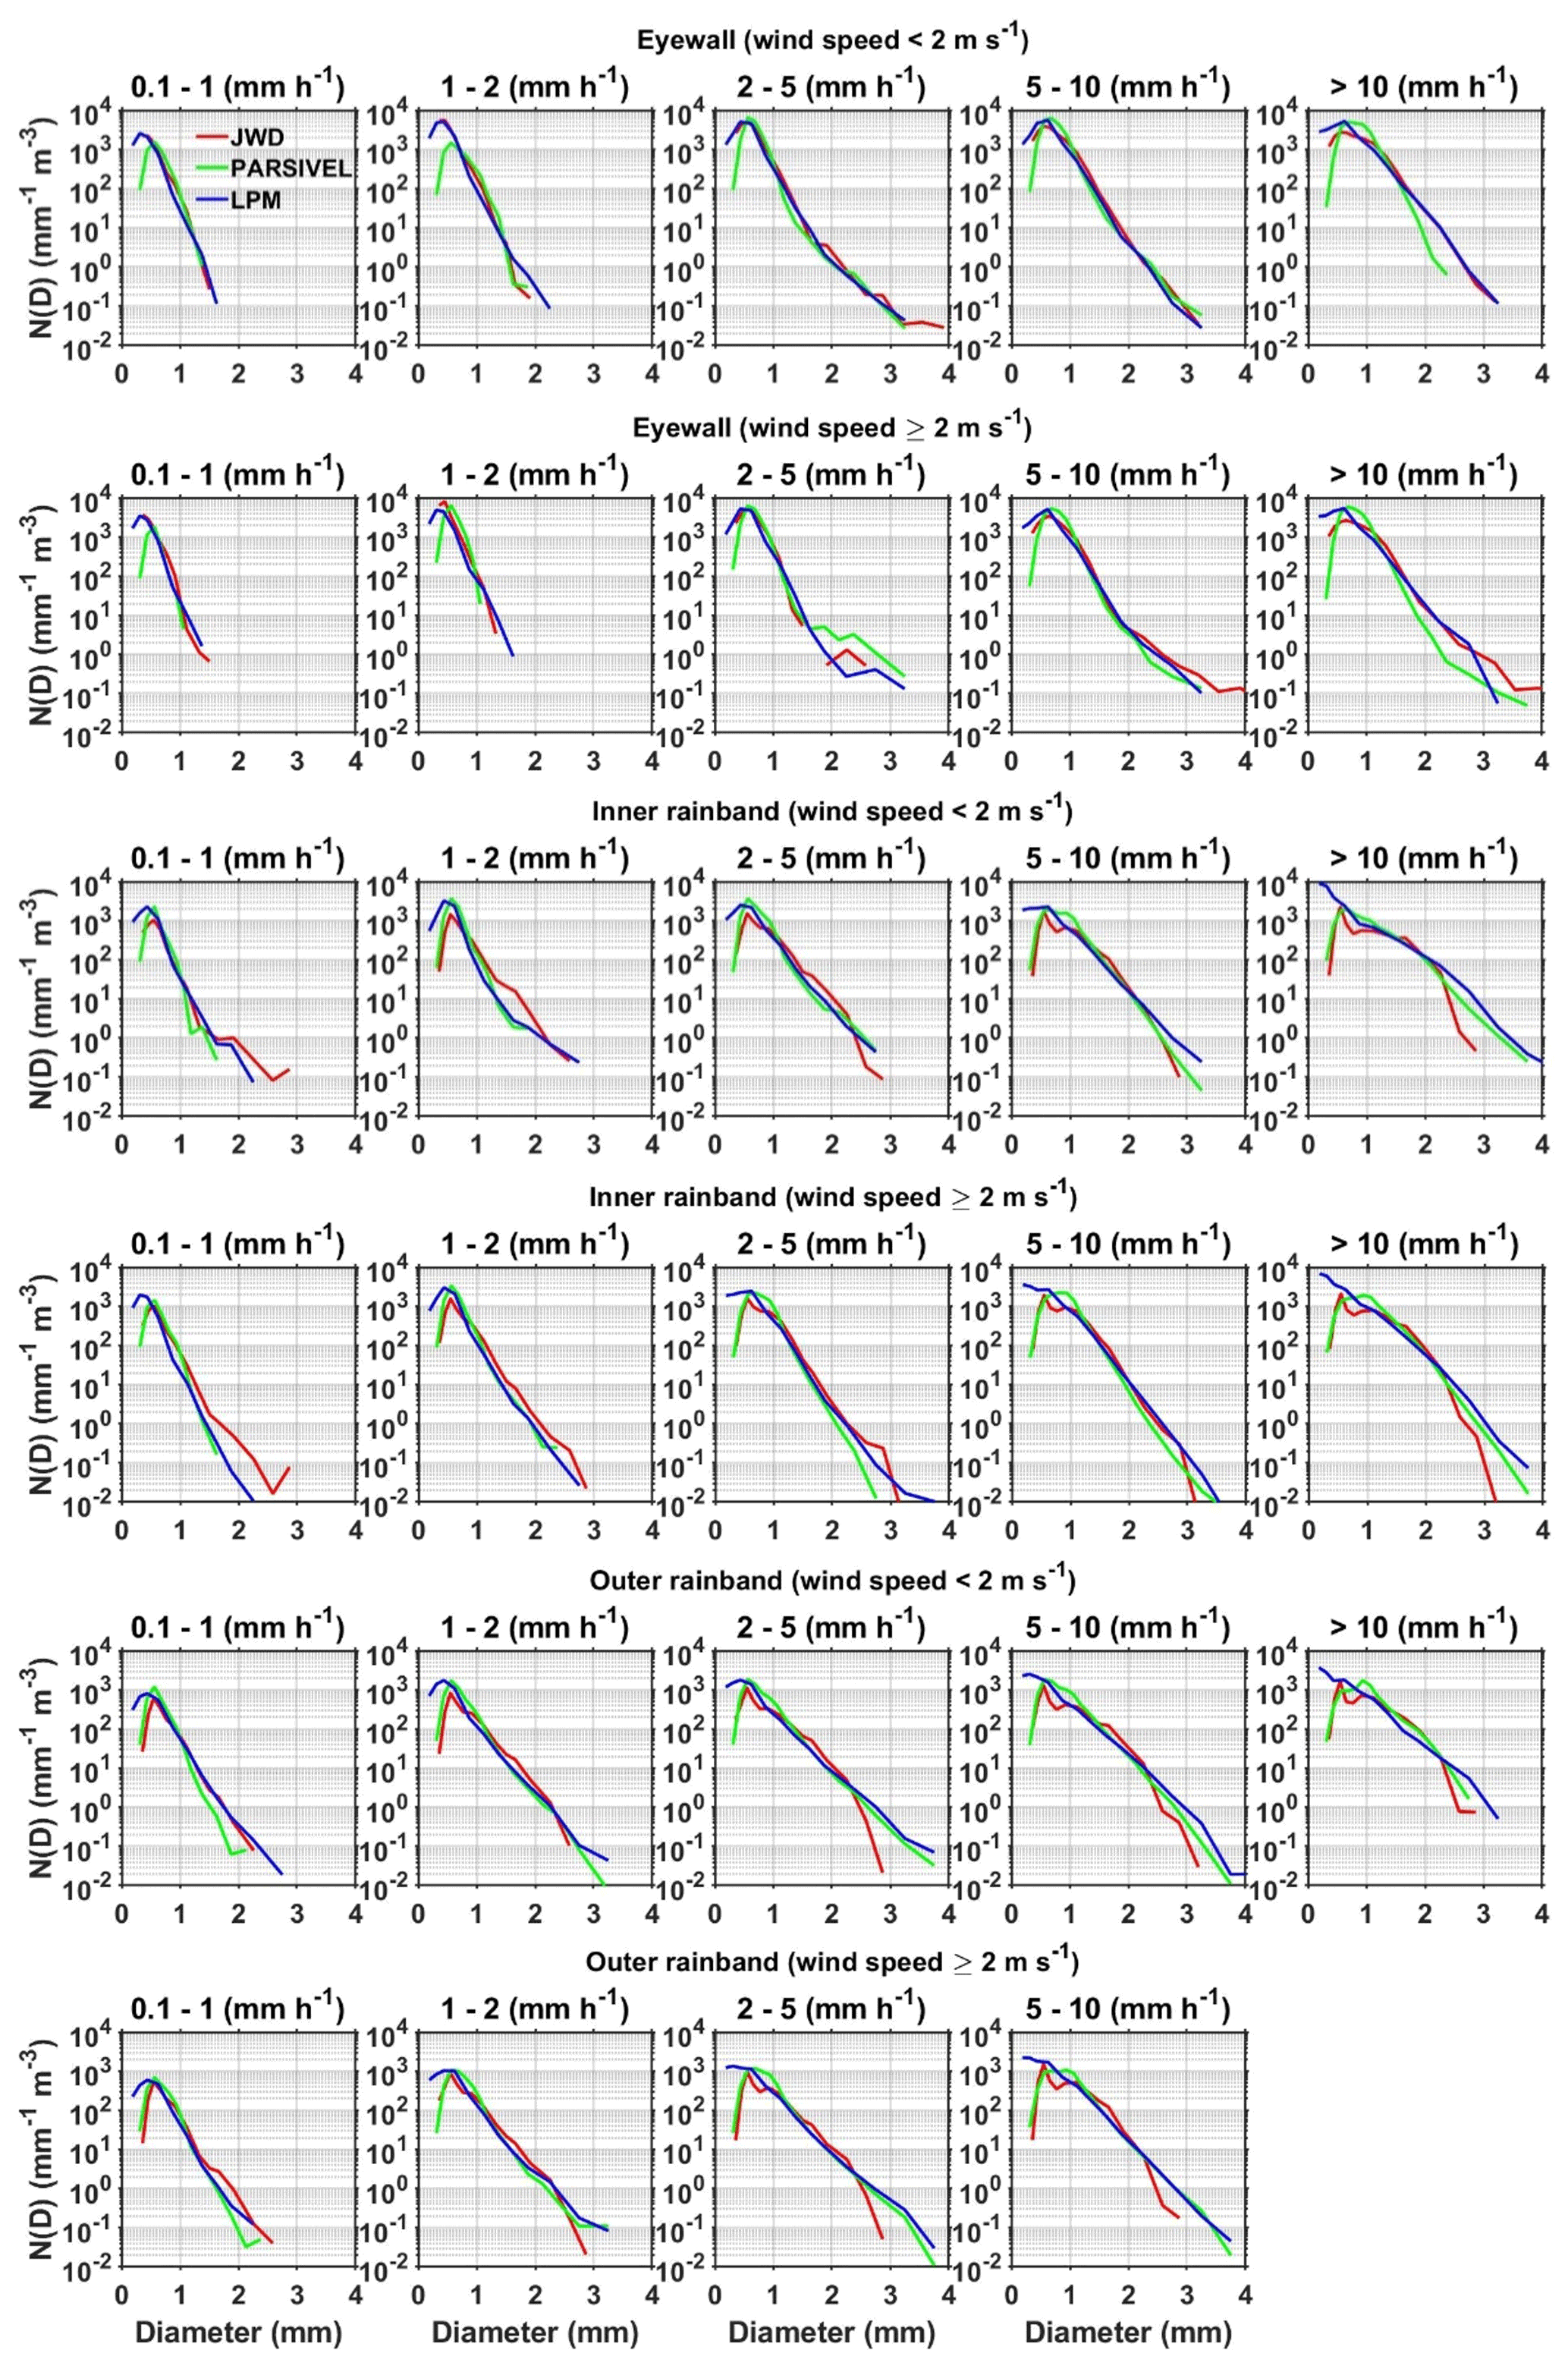
Figure 6N(D) (mm−1 m−3) as a function of raindrop diameter (mm) in different rain rate and wind speed intervals associated with the eyewall, inner rainband, and outer rainband of the Nivar cyclone observed by JWD, PARSIVEL, and LPM installed at Gadanki.
The Dm–R data segregated based on the wind speed and region of TC Nivar are depicted in Fig. 7. The best liner fit at 95 % confidence level to the Dm–R data obtained from each disdrometer is also indicated with solid lines (JWD – red; PARSIVEL – green; LPM – blue) in Fig. 7. The effect of wind speed is not uniform for all the disdrometers in different regions of a TC. For a given R, JWD shows an increase in Dm with wind speed in the eyewall region, while there is a small variation in Dm with the wind in the inner and outer rainbands. PARSIVEL data show an increase in Dm with the wind in the eyewall, a decrease in Dm with the wind in the inner rainband, and small variations in the outer rainband. LPM shows an increase in Dm with the wind in the eyewall and inner rainband as well as minor variations in the outer rainband. The observed differences in the Dm–R relations under the same environmental conditions indicate that the DSD spectra recorded by three disdrometers are different. At a given R, irrespective of wind speed, larger Dm values are found in the outer rainband and smaller Dm values in the eyewall region than in other regions of a TC. This is due to a decrease in the concentration of small raindrops and increases in the large raindrops from the eyewall to the inner rainband and outer rainband (Fig. 6). Though PARSIVEL underestimates the smaller drop concentrations, the estimated smaller Dm values than LPM and JWD at all wind speeds with R>5 mm h−1 in the eyewall are due to recording a low concentration of large raindrops. At R<5 mm h−1, PARSIVEL recordings show a similar DSD as LPM and JWD for medium to large raindrops with a low concentration of small raindrops, resulting in larger Dm. In the eyewall, the overestimate of small and underestimate of large raindrops by LPM compared to JWD result in relatively smaller Dm values of LPM than JWD. However, at low wind speeds, the DSDs are similar, except that the overestimation of small raindrops by LPM compared to JWD results in marginally smaller Dm for LPM than JWD in the eyewall. In the inner rainband, the concentrations of small raindrops observed by JWD and PARSIVEL are similar and low compared to LPM. For medium and large raindrops, the raindrop concentration observed by PARSIVEL and LPM is similar and lower than the JWD. Thus, at all wind speeds with R<5 mm h−1, the Dm values are small for PARSIVEL and large for JWD in the inner rainband. At higher rain intensities, LPM overestimates the small raindrop concentration (by 2 orders of magnitude), while both LPM and PARSIVEL underestimate the medium-sized and overestimate the large-sized raindrops more than JWD. The imbalance between the small, medium, and large raindrops results in large Dm values for JWD at all wind speeds, while for LPM there are smaller Dm values at wind speed less than 2 m s−1 and larger Dm values at higher wind speeds than for PARSIVEL in the inner rainband. Although LPM and PARSIVEL show nearly the same distribution for medium raindrops in the outer rainband, LPM overestimates the small and large raindrops, resulting in marginally larger Dm than PARSIVEL at all R and wind speeds. Compared to JWD, LPM and PARSIVEL record a high concentration of large raindrops and a low concentration of medium-sized raindrops at all R and wind speeds, which imbalances the DSD spectrum to produce marginally smaller Dm than JWD in the outer rainband.
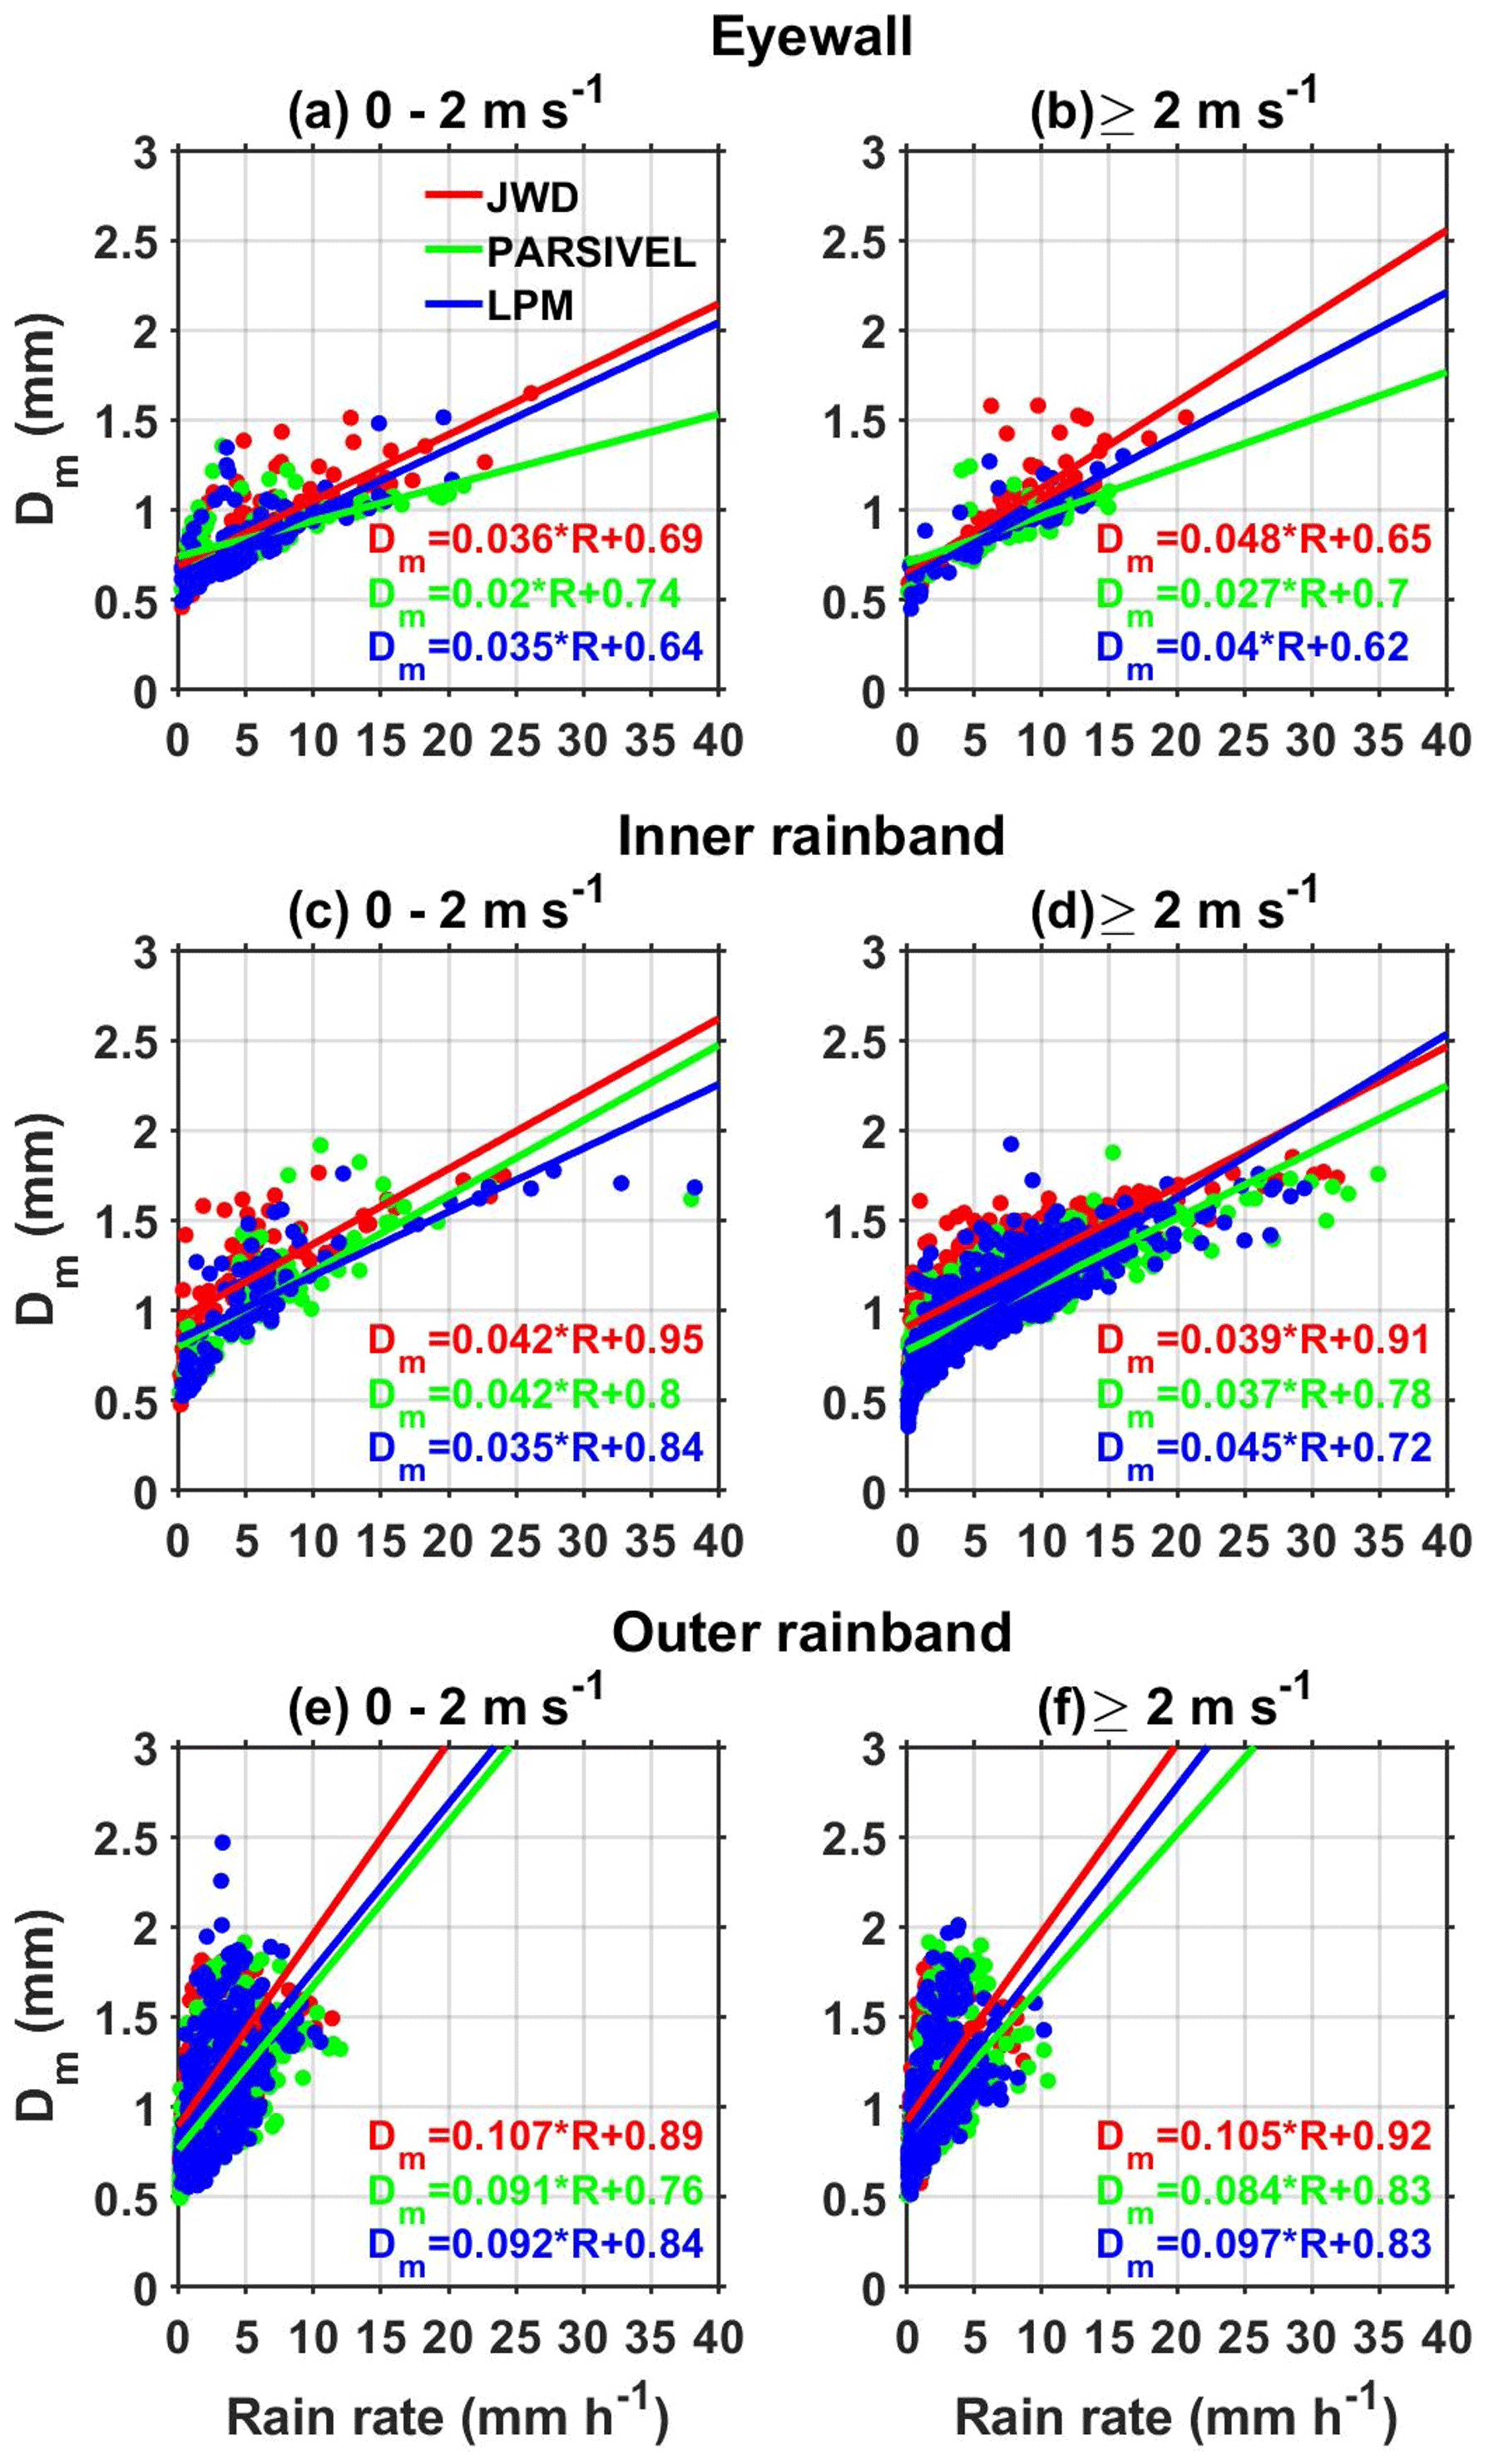
Figure 7(a–b) Dm (mm) as a function of rain rate (mm h−1) in the eyewall of Nivar observed by JWD, PARSIVEL, and LPM during different surface wind speed intervals. The solid lines represent the linear fit at 95 % confidence level whose relations are shown in legends with the respective color. Panels (c)–(d) and (e)–(f) are the same as panels (a)–(b) but in the inner and outer rainbands of Nivar, respectively.
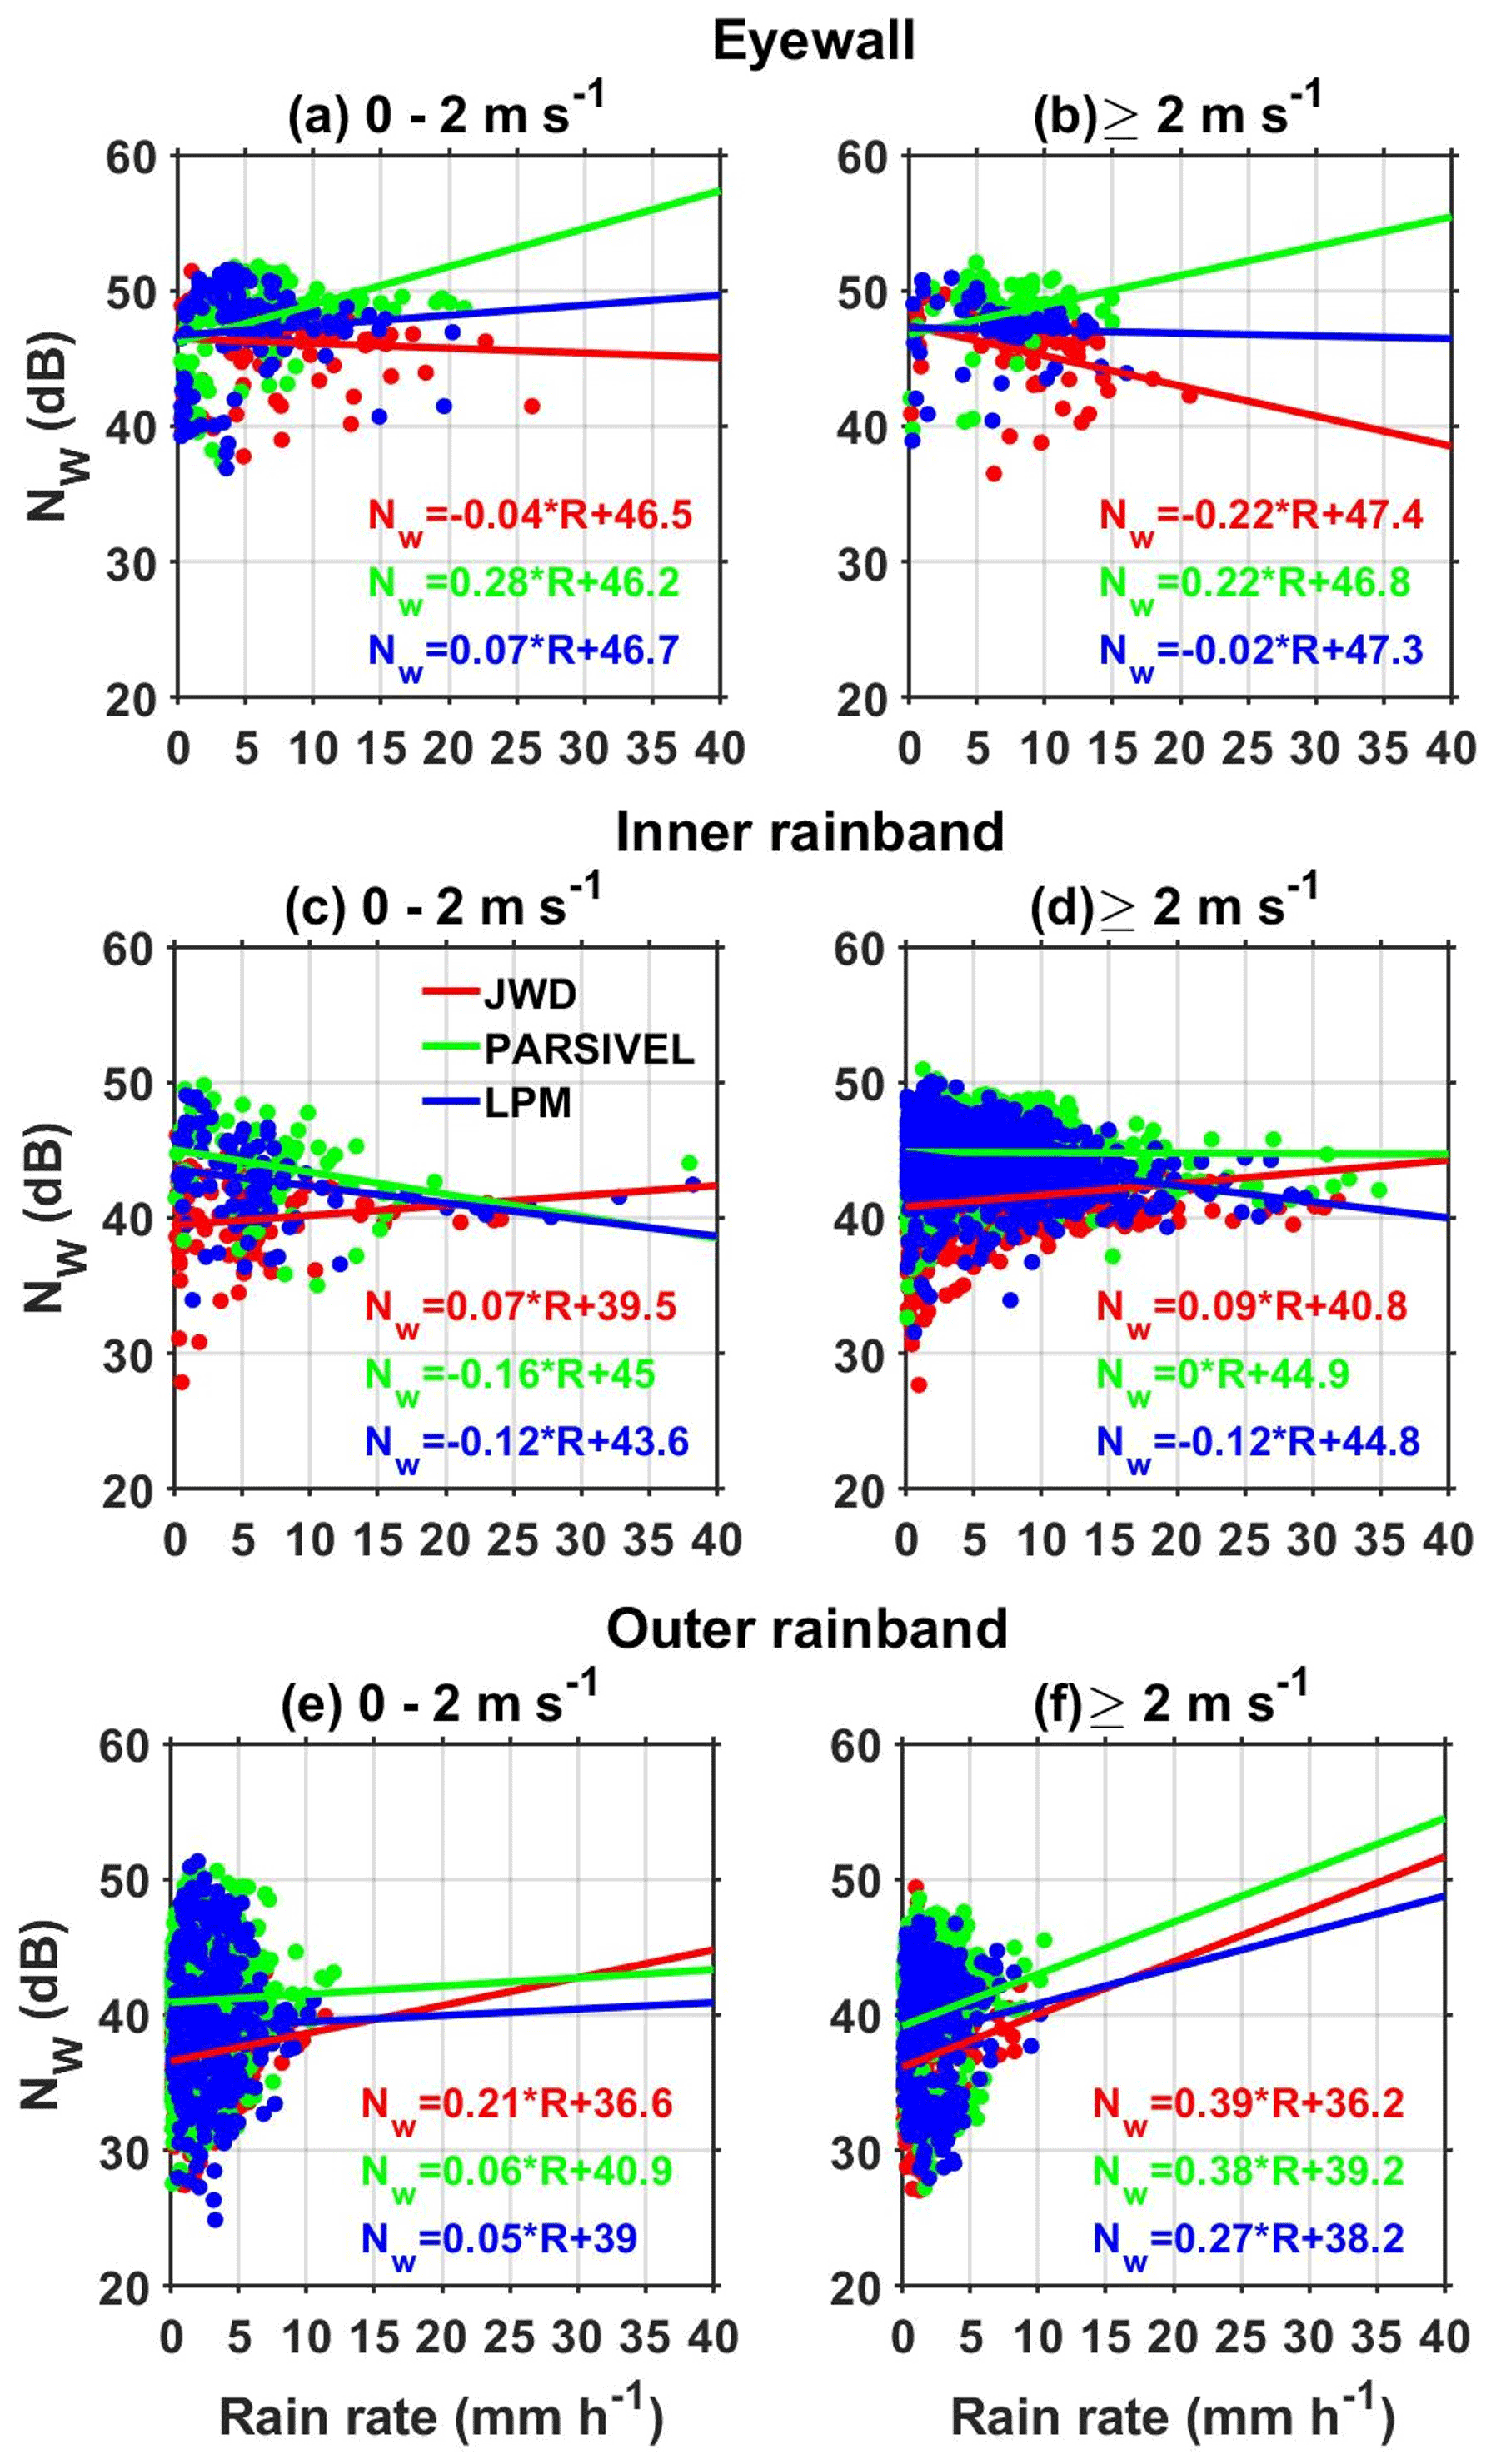
The normalized DSD (Testud et al., 2001) indicates that Nw (mm−1 m−3) is an intercept parameter of the exponential DSD with the same liquid water content and Dm of an observed DSD spectrum with any shape. Nw is converted into decibels (10×log 10Nw), and as a function of R and wind for different regions of Nivar it is plotted in Fig. 8 to understand the effect of wind on drop concentration. In general, Nw increases with increasing R (Testud et al., 2001), while this is not always true when there is an imbalance between the decrease in small and increase in medium and large-sized raindrops (Ma et al., 2019). The Nw–R curves are different for various regions of a TC and vary with wind speed. JWD shows an increase in Nw with R in the inner and outer rainbands, while there is a decrease in the eyewall at all wind speeds. The decrease in Nw with R of JWD is small at lower wind speed and considerable at higher wind speeds. PARSIVEL measurements indicate an increase in Nw with R in the eyewall and outer rainbands, while there is a decrease in the inner rainband. The change in Nw with R of PARSIVEL is considerable at all wind speeds in all the regions of a TC except at low wind speeds in the outer rainband and high wind speeds in the inner rainband. LPM data show an increase in Nw with R in the outer rainband and a decrease in the inner rainband, while there is an increase at low wind speeds and decrease at high wind speeds in the eyewall. A sizable change in Nw with R of LPM is observed in the inner rainband and at high winds in the outer rainband; the change is small in the eyewall and at low wind speeds in the outer rainband. The Nw values are larger for PARSIVEL than LPM in the three regions of a TC at all wind speeds. This could be due to the presence of more large drops in LPM than PARSIVEL. JWD shows smaller Nw values than LPM and PARSIVEL at R less than 15 mm h−1. The change in the concentration of small raindrops observed by three disdrometers with R and wind speed is minimal in the outer rainband, resulting in an increase in Nw with R, as also observed in Fig. 5. Nonetheless, in the inner rainband and eyewall, the small drop concentration increases with R at all wind speeds, making an imbalance between the small and medium-sized raindrops that causes variations (increase or decrease) in Nw with R differently for different disdrometers.
The polarimetric parameter ZDR provides information on measuring the reflectivity-weighted hydrometeors' shape within a sampling volume. ZDR at a temperature of 20 ∘C (average surface temperature is 21 ∘C at Gadanki during the passage of Nivar) in the X-band frequency estimated from the DSD spectra of JWD, LPM, and PARSIVEL as a function of R at different wind speeds is depicted in Fig. 9. For a given R, all disdrometers show larger ZDR in the outer rainband than in other regions of a TC. Relating the three disdrometers, LPM shows larger values than PARSIVEL and JWD in all regions of Nivar except at wind speeds greater than 2 m s−1 in the eyewall, where JWD shows relatively large values. These observations are in accordance with the measurement of more large raindrops by LPM in all the regions except in the eyewall at high wind speeds. Though Dm values of JWD are large and for LPM are small in all regions, the small ZDR derived from JWD and large ZDR from LPM indicate that the dependency of large raindrops is more pronounced in computing ZDR than Dm. This could be due to the resonance effect of raindrops with drops greater than 3 mm in diameter at X-band frequency (Carey and Petersen, 2015) as depicted in Fig. 10. ZDR at S band shows monotonic behavior with raindrop diameter, while at C and X bands it shows nonmonotonic behavior. The nonmonotonic behavior is mainly due to the resonance effect at D>5 mm for C-band and D>3 mm for X-band frequency radars. At resonating frequencies, the maximum deviation in ZDR between C band and S band is ∼5 dB, and between X band and S band it is ∼0.7 dB. As the maximum raindrop size observed during Nivar is less than 4 mm, the resonance effect is not applicable for C- and S-band retrievals. Regardless of wind speed, the laser disdrometer shows a larger ZDR in the inner rainband than in the eyewall, while JWD displays opposite features. This is due to the resonance effect caused by the presence of raindrops with a diameter greater than 3 mm in the eyewall region of the JWD data, while in the inner rainband this is in the laser disdrometer data (Fig. 6). ZDR values estimated from LPM are marginally larger at high wind speeds than at low wind speeds in all regions of Nivar. JWD-estimated ZDR increases with wind speed in the eyewall and nearly the same in the inner and outer rainbands. ZDR of PARSIVEL shows an increase with wind speed in the eyewall, a decrease in the inner rainband, and no change in the outer rainband.

Figure 9(a–b) ZDR (dB) as a function of rain rate (mm h−1) in the eyewall of Nivar observed by JWD, PARSIVEL, and LPM during different surface wind speed intervals at X-band frequency in the ambient atmosphere with 20 ∘C temperature. The solid lines represent the linear fit at 95 % confidence level whose relations are shown in legends with the respective color. Panels (c)–(d) and (e)–(f) are the same as panels (a)–(b) but in the inner and outer rainbands of Nivar, respectively.
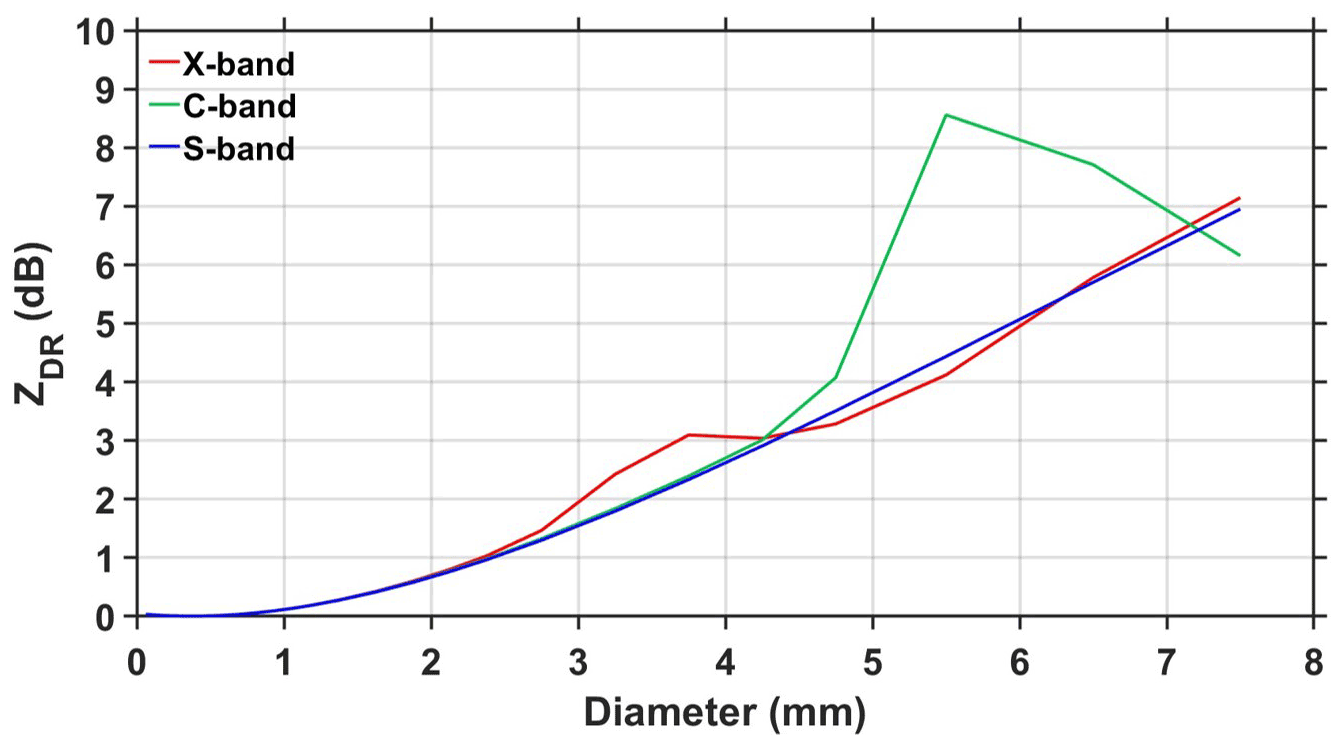
Figure 10ZDR (dB) as a function of monodisperse raindrop diameter (mm) at X-band (red), C-band (green), and S-band (blue) wavelengths. For the monodisperse simulations at a drop temperature of 20 ∘C, the refractive index of raindrops is estimated from Ray (1972), and the drop axis ratio is considered from Brandes et al. (2002).
The KDP offers information on the mass of nonspherical hydrometeors in the volume of a radar beam. The KDP estimated at X-band frequency with a temperature of 20 ∘C from three disdrometers as a function of R at different wind speeds is depicted in Fig. 11. The power-law relations of KDP–R are also shown in Fig. 11. The KDP–R relations show diversity in different regions of Nivar, but all disdrometers show approximately the same relations in a given region except PARSIVEL in the eyewall. The increase in KDP indicates the increase in nonspherical particles with wind speed in the eyewall. However, KDP decreases with wind speed in the outer rainband and shows the same values in the inner rainband.
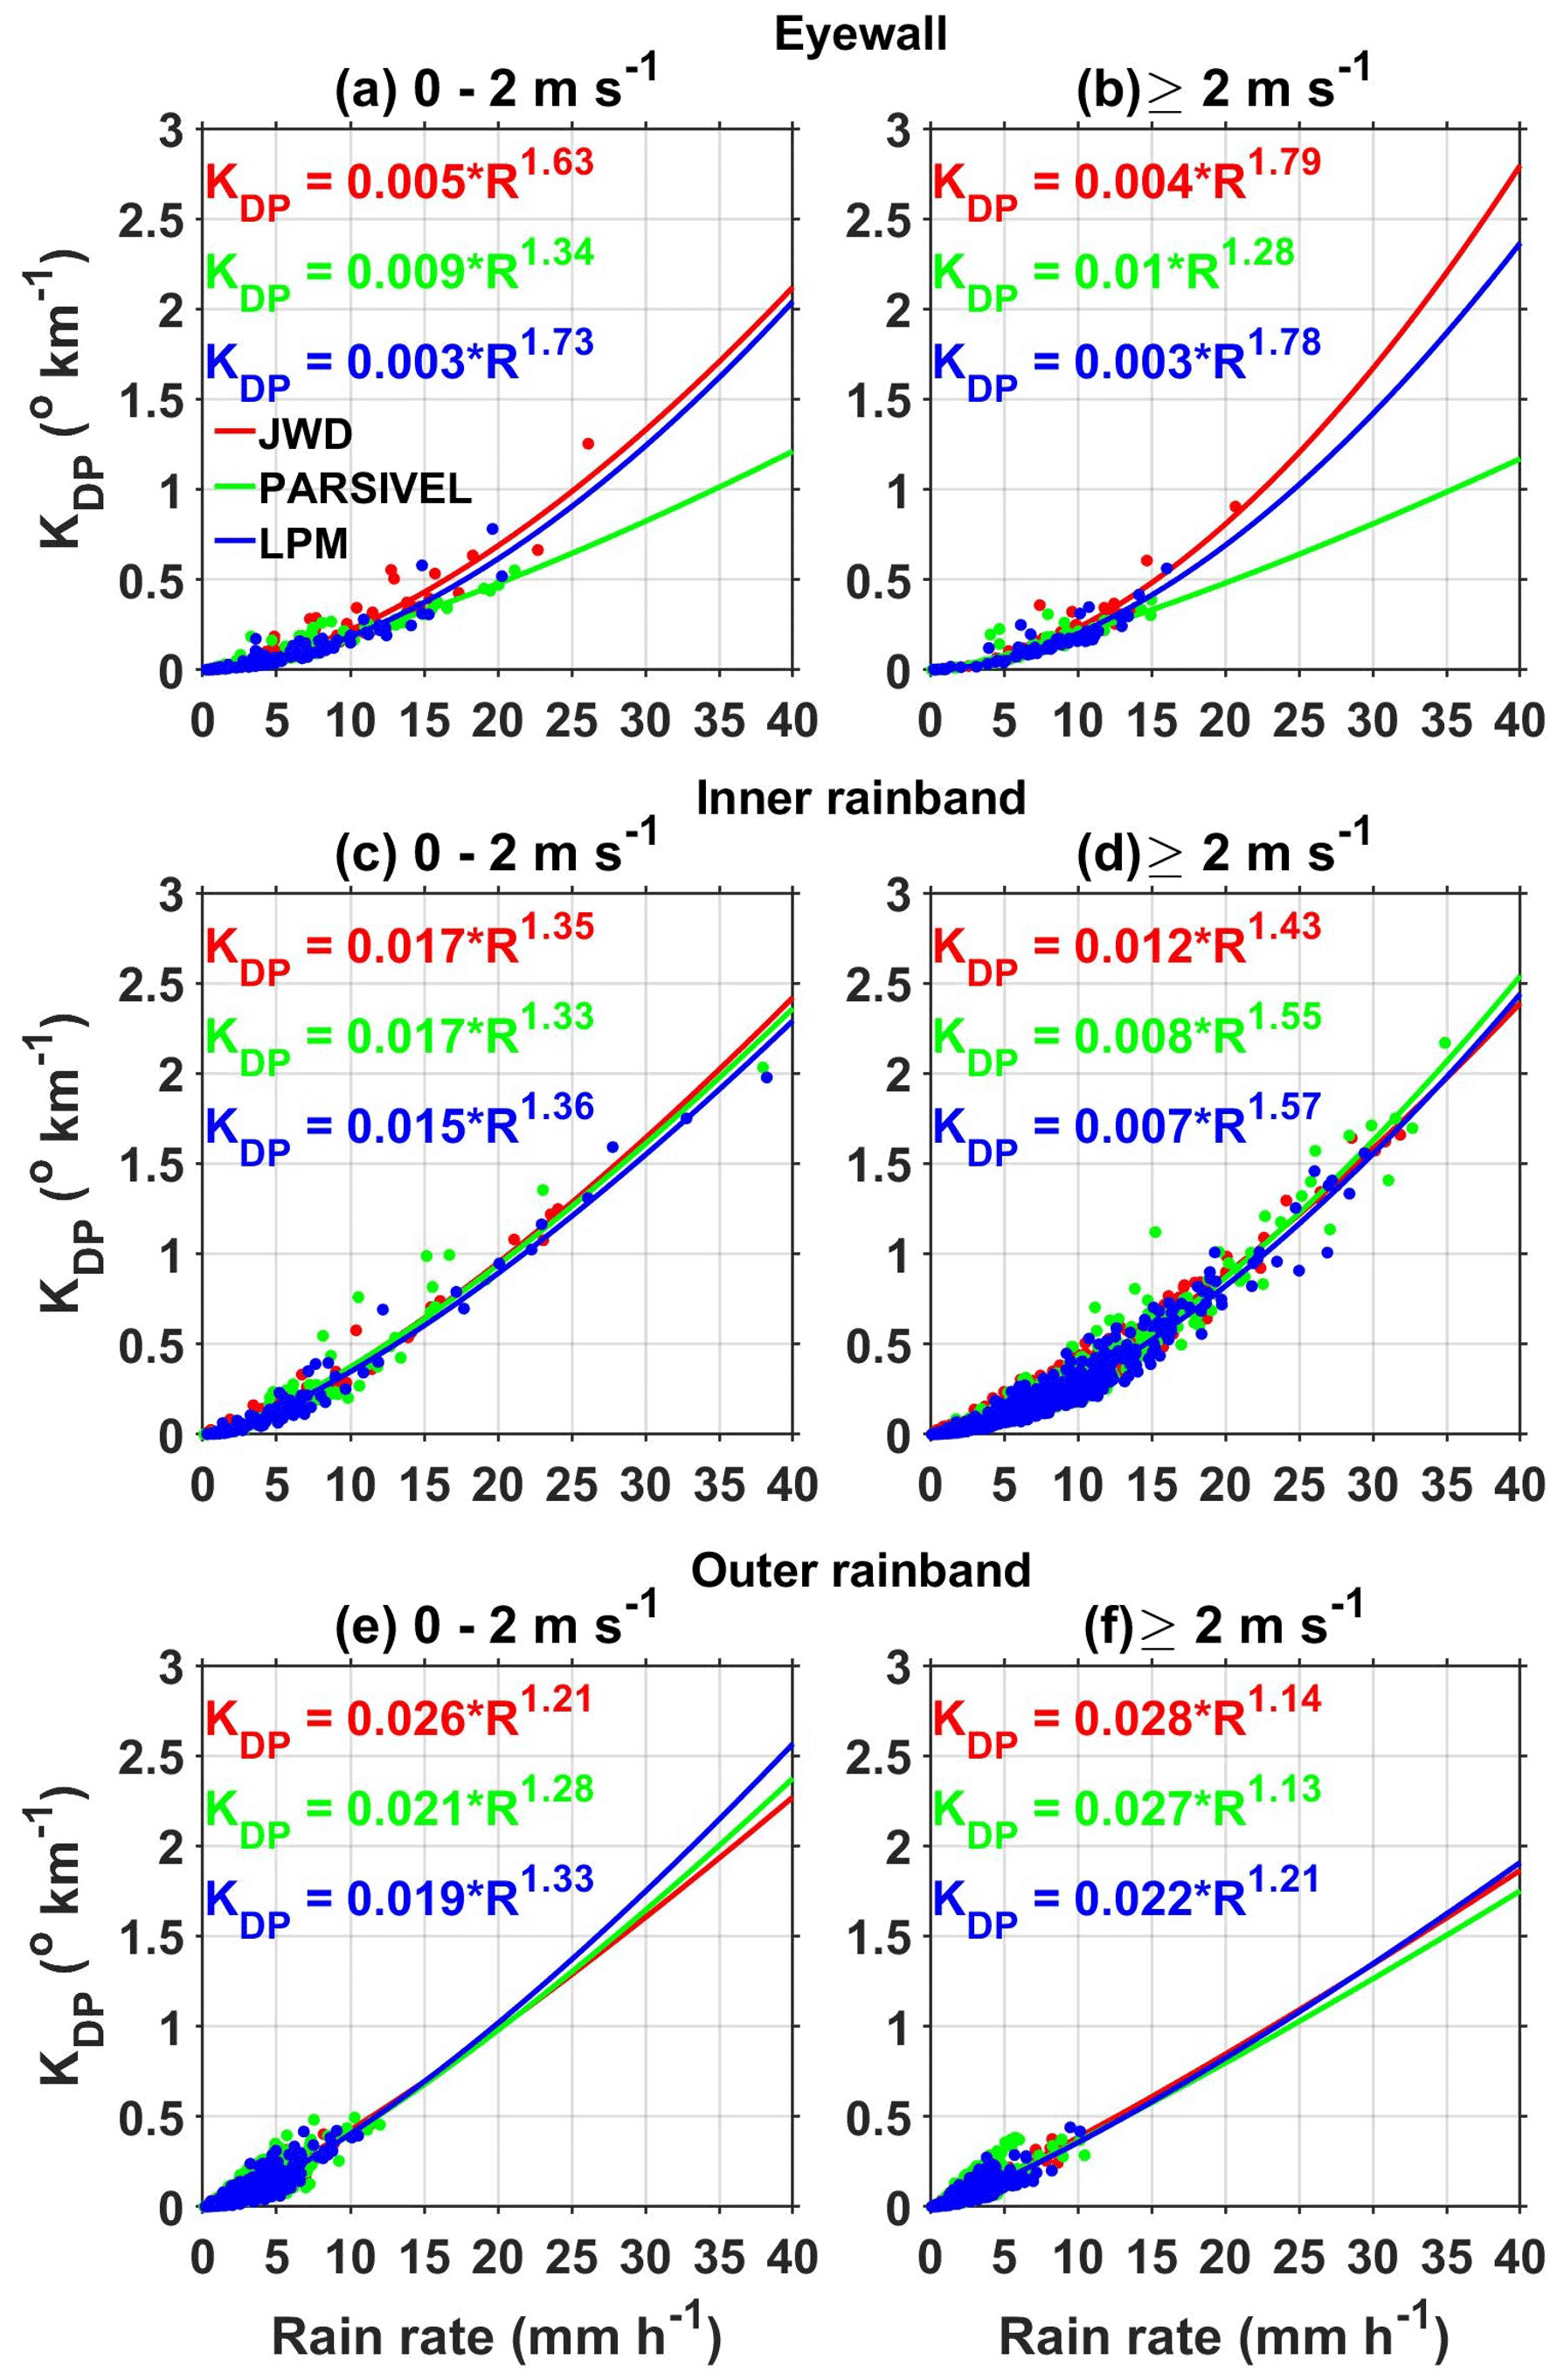
Figure 11Same as Fig. 9 but for KDP (∘ km−1), and the solid lines represent the power-law fit.
The polarimetric parameter KDP is measured using the phase difference between the two polarizations, which is immune from attenuation. Hence, KDP is widely used to correct attenuation and differential attenuation. Molecular absorption and scattering out of the beam control the attenuation. The relations between AH, ADP, and KDP are given in Eqs. (17) and (18), and DSD measurements obtained from disdrometers are used to estimate these relations, whose coefficients are reliant on temperature (Jameson, 1992). The coefficient γH of the AH–KDP relation at X-band frequency in the eyewall, inner rainbands, and outer rainbands at different temperatures and wind speeds are plotted in Fig. 12. The γH estimated from JWD, LPM, and PARSIVEL decreases with increasing temperature in all the regions of a TC. The molecular absorption (the imaginary part of the complex refractive index) is enhanced at low temperatures and causes an increase in attenuation with a decrease in temperature (Jameson, 1992; Smyth and Illingworth, 1998). The change in γH with temperature is not uniform in different regions of Nivar due to variations in DSD between the eyewall, inner rainband, and outer rainband. γH estimated from JWD is smaller (except in the eyewall at temperature >25 ∘C and wind speed >2 m s−1) than other disdrometers in all regions of Nivar. LPM-estimated γH values are larger in the inner and outer rainbands, while PARSIVEL-estimated values are larger in the eyewall at all temperatures and wind speeds than other disdrometers. In the inner and outer rainbands, the derived γH values are the same for laser disdrometers at lower temperatures and show marginal differences with increasing temperature. For a given temperature, γH derived from all disdrometers shows slightly larger values at high wind speeds than at low wind speeds. For a given temperature and wind, γH shows negligible variations within the regions of a TC except for PARSIVEL in the eyewall. The γH variation with temperature shows a considerable difference between the laser disdrometers in the eyewall region at all wind speeds due to large differences in kDP between them.
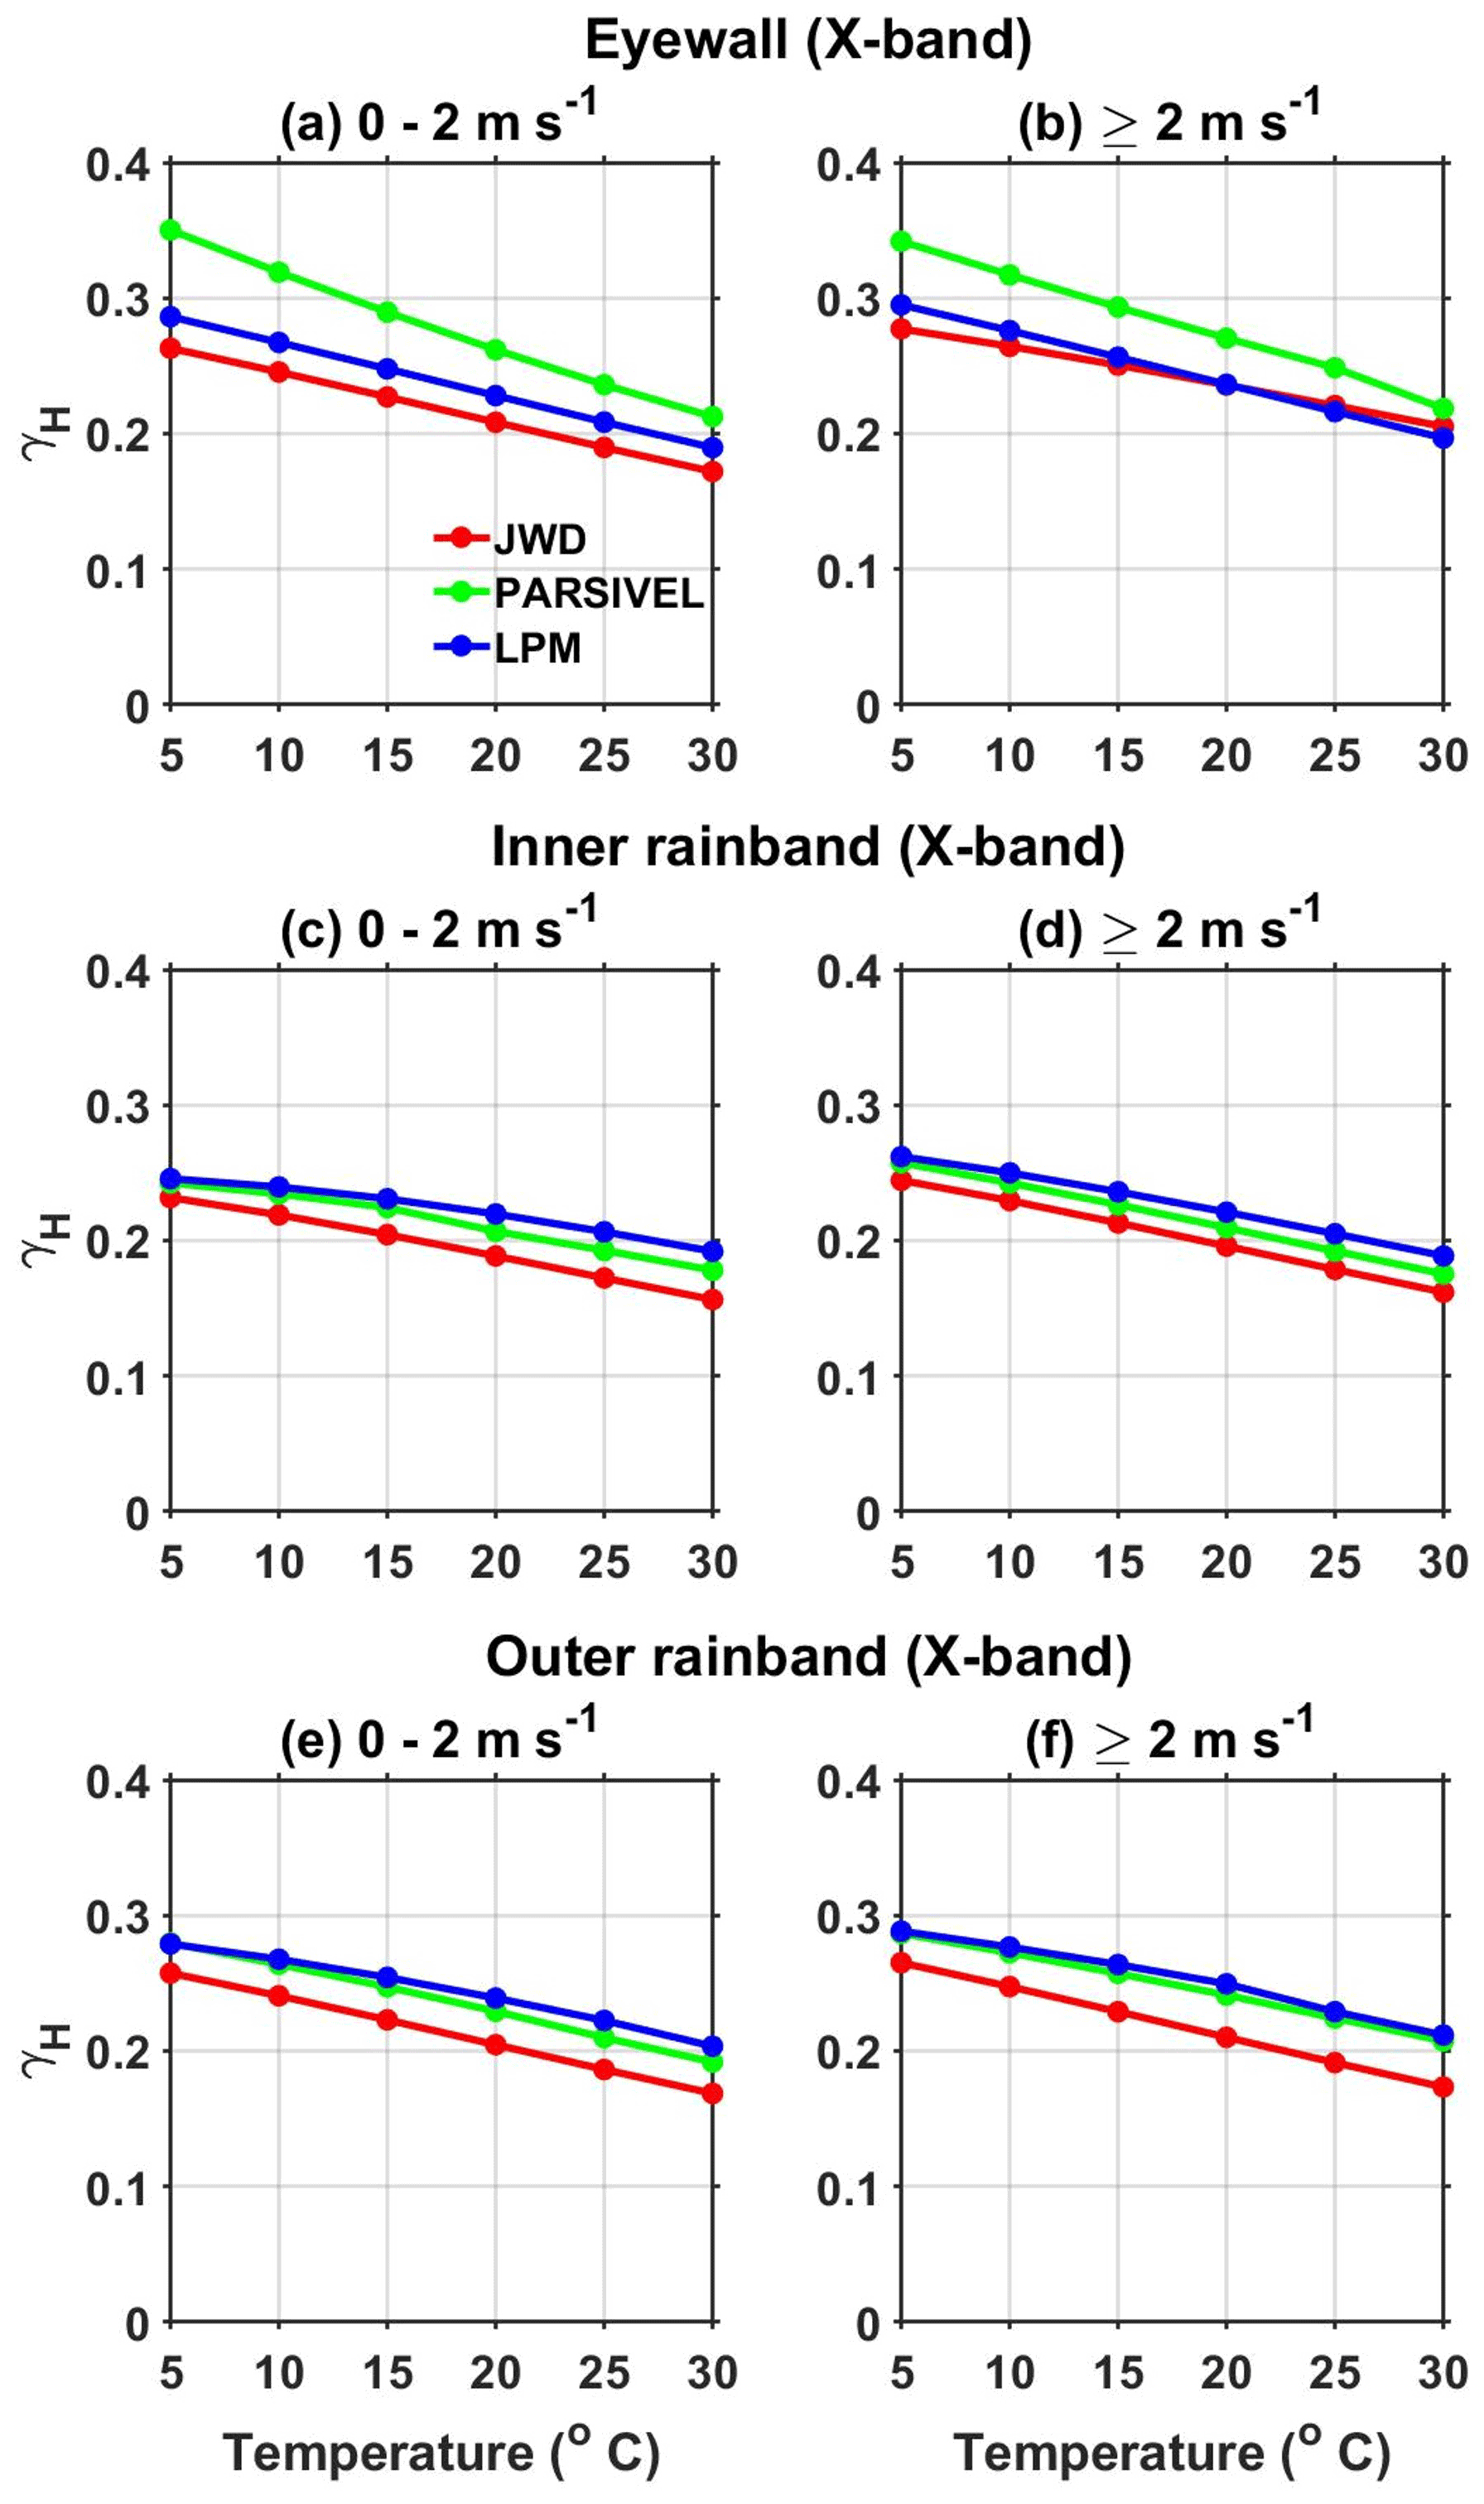
Figure 12(a–b) γH as a function of temperature (∘C) in the eyewall of Nivar observed by JWD, PARSIVEL, and LPM during different surface wind speed intervals at X-band frequency. Panels (c)–(d) and (e)–(f) are the same as panels (a)–(b) but for the inner and outer rainbands of Nivar, respectively.
The differential attenuation coefficient γDP derived from ADP–KDP relations from JWD, LPM, and PARSIVEL at different temperatures and wind in the eyewall, inner rainband, and outer rainband is depicted in Fig. 13. For a given wind and temperature, larger γDP values are observed for LPM and smaller values for JWD than other disdrometers in the inner and outer rainbands. In the eyewall for a given wind and temperature, γDP values are smaller for PARSIVEL, larger for LPM at wind speeds less than 2 m s−1, and larger for JWD at higher wind speeds than other disdrometers. JWD-estimated γDP values show a small decrease with an increase in temperature in all the regions of a TC (except the eyewall at high wind speeds). LPM- and PARSIVEL-estimated γDP values show a minuscule decrease with an increase in temperature in all regions of Nivar at all wind speeds. JWD-estimated γDP values are larger at high wind speeds than at low wind speeds in the eyewall and do not show variations with wind speeds in the inner and outer rainbands. PARSIVEL- and LPM-estimated γDP values are larger or nearly equal at high wind speeds compared to low wind speeds in the eyewall and outer rainband, while they are smaller in the inner rainband. Comparing Figs. 12 and 13, the γDP values are smaller and γH values are larger for PARSIVEL than LPM in the eyewall region, indicating the effect of more medium-sized raindrops on ZDR, KDP, AH, and ADP. The presence of more medium-sized raindrops that slightly deviate from sphericity will result in smaller ZDR, KDP, and ADP and larger AH.

The variation of γH and γDP with temperature estimated from DSD data recordings of JWD, LPM, and PARSIVEL at C-band and S-band frequencies is depicted in Figs. 1S–4S in the Supplement. Similar to earlier studies (Bringi et al., 1990; Jameson, 1991; Park et al., 2005), the γH and γDP values are smaller at S band followed by C band than at X band. The estimated γH and γDP values of all disdrometers decrease with increasing temperature at both S and C bands. For a given temperature and wind, γH values are approximately the same for the three disdrometers in the inner and outer rainbands but show differences in the eyewall at S and C bands. Also, the effect of wind on γH is negligible in the eyewall and inner rainbands. Similar to X-band frequency, the γH values estimated at S and C band also show larger values for PARSIVEL and smaller values for JWD than for other disdrometers in the eyewall regardless of the temperature and wind. Unlike γH, γDP shows variations between disdrometers in any given region of Nivar at C band while showing negligible variations at S band. Regardless of temperature and wind γDP values are the same for a given disdrometer in the inner and outer rainbands but increase with wind speed in the eyewall.
The characteristics of landfalling TC Nivar are revealed using JWD, PARSIVEL, and LPM observations made at Gadanki, India. The three disdrometers are installed at the same location; the measurements are used to study the effect of wind speed as well as variations in measuring principles and data processing algorithms on the recorded DSD spectra and, in turn, on the retrieved rain integral and polarimetric parameters.
-
JWD measures raindrops of diameters up to 3 mm, while LPM and PARSIVEL record up to 4 mm. The raindrop has more residing time in the laser beam due to deviation in fall path from nadir by strong horizontal winds, resulting in an additional reduction in the beam intensity at the receiver. Thus, the laser disdrometers overestimate the size of the raindrops in the presence of horizontal winds.
-
The DSD spectrum width increases with increasing R by observing larger-sized raindrops. Also, the concentration of raindrops with diameters between 0.7 and 1.5 mm increases in all the regions of a TC. However, the magnitude of the increase is higher in the eyewall than in the inner and outer rainbands.
-
The DSD characteristics reveal relatively larger Dm in the outer rainband and smaller Dm in the eyewall than in other regions of a TC. The maximum Dm observed is less than 2 mm, which follows earlier studies. Raindrops of diameter 3 mm in size are observed infrequently in the eyewall, while they are present in the inner and outer rainbands at R greater than 5 mm h−1.
-
The Z–R relations are distinctly different in various regions of a TC and for different disdrometers. The Z–R relations estimated from three disdrometers indicate comparatively larger Z for a given R in the outer rainband followed by the inner rainband and smaller Z in the eyewall.
-
The Nw increases with increasing R at all wind speeds in the outer rainband while showing an increase or decrease differently for various disdrometers in the eyewall and inner rainbands. The imbalance between small and medium-sized raindrops causes variations in Nw with R at different wind speeds.
-
ZDR estimated at X-band frequency with a temperature of 20 ∘C shows larger values in the outer rainband than in the eyewall and inner rainband. ZDR values estimated by the three disdrometers show differences in the inner rainband and eyewall at different wind speeds. In the inner and outer rainbands, the laser disdrometers observe raindrops with a diameter greater than 3 mm, which cause resonance at X-band frequency and result in larger ZDR than JWD, whose measurements show raindrops up to 3 mm only.
-
In the eyewall region, the observed smaller KDP by PARSIVEL at all wind speeds and R indicates the presence of a low number concentration of nonspherical raindrops, resulting in smaller ZDR values than in LPM and JWD.
-
The coefficients of attenuation (γH) and specific attenuation (γDP) decrease with increasing temperature but differ for different disdrometers. Regardless of wind, for a given KDP, attenuation and differential attenuation are more for LPM and PARSIVEL than JWD in the inner and outer rainbands while differing in the eyewall.
-
LPM overestimates small raindrops (<0.7 mm) by a factor of 10 to 100 compared to JWD (except in the eyewall) and PARSIVEL at all R. At the large drop end (>2 mm), JWD underestimates raindrop concentrations compared to LPM and PARSIVEL at R>5 mm h−1 in the inner rainband and at R>2 mm h−1 in the outer rainband, while this underestimation is not seen in the eyewall region. The underestimation of large raindrops by JWD is not uniform in all the regions of Nivar. Compared to PARSIVEL, LPM records marginally more larger drops (>2 mm).
-
The effects of wind speed on the recorded DSD as well as estimated rain integral and polarimetric parameters are not uniform in various regions of Nivar for different disdrometers as these effects are further modified by the measuring principle and hardware processing.
The complete dataset used in the analysis can be obtained by contacting the data dissemination unit of the National Atmospheric Research Laboratory (https://www.narl.gov.in/, last access: 17 November 2022). The figures are generated using MATLAB software.
The supplement related to this article is available online at: https://doi.org/10.5194/amt-15-6705-2022-supplement.
The author has declared that there are no competing interests.
Publisher's note: Copernicus Publications remains neutral with regard to jurisdictional claims in published maps and institutional affiliations.
The author thanks the three anonymous reviewers and associate editor Zamin A. Kanji for their suggestions in improving the quality of the paper.
This paper was edited by Zamin A. Kanji and reviewed by three anonymous referees.
Adirosi, E., Roberto, N., Montopoli, M., Gorgucci, E., and Baldini, L.: Influence of Disdrometer Type on Weather Radar Algorithms from Measured DSD: Application to Italian Climatology, Atmosphere, 9, 560, https://doi.org/10.3390/atmos9090360, 2018. a
Angulo-Martínez, M., Beguería, S., Latorre, B., and Fernández-Raga, M.: Comparison of precipitation measurements by OTT Parsivel2 and Thies LPM optical disdrometers, Hydrol. Earth Syst. Sci., 22, 2811–2837, https://doi.org/10.5194/hess-22-2811-2018, 2018. a, b, c
Atlas, D., Ulbrich, C. W., Marks Jr., F. D., Amitai, E., and Williams, C. R.: Systematic variation of drop size and radar-rainfall relations, J. Geophys. Res.-Atmos., 104, 6155–6169, https://doi.org/10.1029/1998JD200098, 1999. a
Bao, X., Wu, L., Zhang, S., Yuan, H., and Wang, H.: A Comparison of Convective Raindrop Size Distributions in the Eyewall and Spiral Rainbands of Typhoon Lekima (2019), Geophys. Res. Lett., 47, e2020GL090729, https://doi.org/10.1029/2020GL090729, 2020. a
Bosart, L. F., Bracken, W. E., Molinari, J., Velden, C. S., and Black, P. G.: Environmental Influences on the Rapid Intensification of Hurricane Opal (1995) over the Gulf of Mexico, Mon. Weather Rev., 128, 322–352, https://doi.org/10.1175/1520-0493(2000)128<0322:EIOTRI>2.0.CO;2, 2000. a
Brandes, E. A., Zhang, G., and Vivekanandan, J.: Experiments in Rainfall Estimation with a Polarimetric Radar in a Subtropical Environment, J. Appl. Meteorol., 41, 674–685, https://doi.org/10.1175/1520-0450(2002)041<0674:EIREWA>2.0.CO;2, 2002. a, b
Bringi, V. N., Chandrasekar, V., Balakrishnan, N., and Zrnić, D. S.: An Examination of Propagation Effects in Rainfall on Radar Measurements at Microwave Frequencies, J. Atmos. Ocean. Tech., 7, 829–840, https://doi.org/10.1175/1520-0426(1990)007<0829:AEOPEI>2.0.CO;2, 1990. a, b, c, d
Capozzi, V., Annella, C., Montopoli, M., Adirosi, E., Fusco, G., and Budillon, G.: Influence of wind-induced effects on laser disdrometer measurements: Analysis and compensation strategies, Remote Sensing, 13, 3028, https://doi.org/10.3390/rs13153028, 2021. a
Carey, L. D. and Petersen, W. A.: Sensitivity of C-Band Polarimetric Radar–Based Drop Size Estimates to Maximum Diameter, J. Appl. Meteorol. Clim., 54, 1352–1371, https://doi.org/10.1175/JAMC-D-14-0079.1, 2015. a
Cecil, D. J., Zipser, E. J., and Nesbitt, S. W.: Reflectivity, Ice Scattering, and Lightning Characteristics of Hurricane Eyewalls and Rainbands. Part I: Quantitative Description, Mon. Weather Rev., 130, 769–784, https://doi.org/10.1175/1520-0493(2002)130<0769:RISALC>2.0.CO;2, 2002. a, b, c
Chen, B.-J., Wang, Y., and Ming, J.: Microphysical characteristics of the raindrop size distribution in typhoon Morakot (2009), J. Trop. Meteorol., 18, 162–171, https://doi.org/10.3969/j.issn.1006-8775.2012.02.006, 2012. a
DeMaria, M., Sampson, C. R., Knaff, J. A., and Musgrave, K. D.: Is Tropical Cyclone Intensity Guidance Improving?, B. Am. Meteorol. Soc., 95, 387–398, https://doi.org/10.1175/BAMS-D-12-00240.1, 2014. a
Dvorak, V. F.: Tropical cyclone intensity analysis using satellite data, Vol. 11, US Department of Commerce, National Oceanic and Atmospheric Administration, National Environmental Satellite, Data, and Information Service, 1984. a
Fierro, A. O. and Mansell, E. R.: Electrification and Lightning in Idealized Simulations of a Hurricane-Like Vortex Subject to Wind Shear and Sea Surface Temperature Cooling, J. Atmos. Sci., 74, 2023–2041, https://doi.org/10.1175/JAS-D-16-0270.1, 2017. a
Friedrich, K., Higgins, S., Masters, F. J., and Lopez, C. R.: Articulating and Stationary PARSIVEL Disdrometer Measurements in Conditions with Strong Winds and Heavy Rainfall, J. Atmos. Ocean. Tech., 30, 2063–2080, https://doi.org/10.1175/JTECH-D-12-00254.1, 2013. a, b, c
Guyot, A., Pudashine, J., Protat, A., Uijlenhoet, R., Pauwels, V. R. N., Seed, A., and Walker, J. P.: Effect of disdrometer type on rain drop size distribution characterisation: a new dataset for south-eastern Australia, Hydrol. Earth Syst. Sci., 23, 4737–4761, https://doi.org/10.5194/hess-23-4737-2019, 2019. a
Hanley, D., Molinari, J., and Keyser, D.: A Composite Study of the Interactions between Tropical Cyclones and Upper-Tropospheric Troughs, Mon. Weather Rev., 129, 2570–2584, https://doi.org/10.1175/1520-0493(2001)129<2570:ACSOTI>2.0.CO;2, 2001. a
Hendricks, E. A., Peng, M. S., Ge, X., and Li, T.: Performance of a Dynamic Initialization Scheme in the Coupled Ocean–Atmosphere Mesoscale Prediction System for Tropical Cyclones (COAMPS-TC), Weather Forecast., 25, 650–663, https://doi.org/10.1175/WAF-D-10-05051.1, 2011. a
Homeyer, C. R., Fierro, A. O., Schenkel, B. A., Didlake, A. C., McFarquhar, G. M., Hu, J., Ryzhkov, A. V., Basara, J. B., Murphy, A. M., and Zawislak, J.: Polarimetric Signatures in Landfalling Tropical Cyclones, Mon. Weather Rev., 149, 131–154, https://doi.org/10.1175/MWR-D-20-0111.1, 2021. a, b, c
Houze, R. A.: Clouds in Tropical Cyclones, Mon. Weather Rev., 138, 293–344, https://doi.org/10.1175/2009MWR2989.1, 2010. a
Huffman, G. J., Bolvin, D. T., Braithwaite, D., Hsu, K.-L., Joyce, R. J., Kidd, C., Nelkin, E. J., Sorooshian, S., Stocker, E. F., Tan, J., Wolff, D. B., and Xie, P.: Integrated Multi-satellite Retrievals for the Global Precipitation Measurement (GPM) Mission (IMERG), Springer International Publishing, Cham, 343–353, https://doi.org/10.1007/978-3-030-24568-9_19, 2020. a
Illingworth, A. J. and Stevens, C. J.: An Optical Disdrometer for the Measurement of Raindrop Size Spectra in Windy Conditions, J. Atmos. Ocean. Tech., 4, 411–421, https://doi.org/10.1175/1520-0426(1987)004<0411:AODFTM>2.0.CO;2, 1987. a, b
Jaffrain, J. and Berne, A.: Experimental Quantification of the Sampling Uncertainty Associated with Measurements from PARSIVEL Disdrometers, J. Hydrometeorol., 12, 352–370, https://doi.org/10.1175/2010JHM1244.1, 2011. a
Jameson, A. R.: Polarization Radar Measurements in Rain at 5 and 9 GHz, J. Appl. Meteorol. Clim., 30, 1500–1513, https://doi.org/10.1175/1520-0450(1991)030<1500:PRMIRA>2.0.CO;2, 1991. a, b, c
Jameson, A. R.: The Effect of Temperature on Attenuation-Correction Schemes in Rain Using Polarization Propagation Differential Phase Shift, J. Appl. Meteorol. Clim., 31, 1106–1118, https://doi.org/10.1175/1520-0450(1992)031<1106:TEOTOA>2.0.CO;2, 1992. a, b
Joss, J. and Waldvogel, A.: Ein spektrograph für niederschlagstropfen mit automatischer auswertung, Pure Appl. Geophys., 68, 240–246, https://doi.org/10.1007/BF00874898, 1967. a, b
Khain, A., Lynn, B., and Shpund, J.: High resolution WRF simulations of Hurricane Irene: Sensitivity to aerosols and choice of microphysical schemes, Atmos. Res., 167, 129–145, https://doi.org/10.1016/j.atmosres.2015.07.014, 2016. a
Knapp, K. R., Kruk, M. C., Levinson, D. H., Diamond, H. J., and Neumann, C. J.: The International Best Track Archive for Climate Stewardship (IBTrACS): Unifying Tropical Cyclone Data, B. Am. Meteorol. Soc., 91, 363–376, https://doi.org/10.1175/2009BAMS2755.1, 2010. a
Krajewski, W. F., Kruger, A., Caracciolo, C., Golé, P., Barthes, L., Creutin, J.-D., Delahaye, J.-Y., Nikolopoulos, E. I., Ogden, F., and Vinson, J.-P.: DEVEX-disdrometer evaluation experiment: Basic results and implications for hydrologic studies, Adv. Water Resour., 29, 311–325, https://doi.org/10.1016/j.advwatres.2005.03.018, 2006. a, b
Kruger, A. and Krajewski, W. F.: Two-Dimensional Video Disdrometer: A Description, J. Atmos. Ocean. Tech., 19, 602–617, https://doi.org/10.1175/1520-0426(2002)019<0602:TDVDAD>2.0.CO;2, 2002. a
Löffler-Mang, M. and Joss, J.: An Optical Disdrometer for Measuring Size and Velocity of Hydrometeors, J. Atmos. Ocean. Tech., 17, 130–139, https://doi.org/10.1175/1520-0426(2000)017<0130:AODFMS>2.0.CO;2, 2000. a, b, c
Ma, Y., Ni, G., Chandra, C. V., Tian, F., and Chen, H.: Statistical characteristics of raindrop size distribution during rainy seasons in the Beijing urban area and implications for radar rainfall estimation, Hydrol. Earth Syst. Sci., 23, 4153–4170, https://doi.org/10.5194/hess-23-4153-2019, 2019. a
Marks, F. D., Atlas, D., and Willis, P. T.: Probability-matched Reflectivity-Rainfall Relations for a Hurricane from Aircraft Observations, J. Appl. Meteorol. Clim., 32, 1134–1141, https://doi.org/10.1175/1520-0450(1993)032<1134:PMRRRF>2.0.CO;2, 1993. a
McFarquhar, G. M., Zhang, H., Heymsfield, G., Halverson, J. B., Hood, R., Dudhia, J., and Marks, F.: Factors Affecting the Evolution of Hurricane Erin (2001) and the Distributions of Hydrometeors: Role of Microphysical Processes, J. Atmos. Sci., 63, 127–150, https://doi.org/10.1175/JAS3590.1, 2006. a
Merceret, F. J.: On the Size Distribution of Raindrops in Hurricane Ginger, Mon. Weather Rev., 102, 714–716, https://doi.org/10.1175/1520-0493(1974)102<0714:OTSDOR>2.0.CO;2, 1974. a, b
Mishchenko, M. I., Travis, L. D., and Mackowski, D. W.: T-matrix computations of light scattering by nonspherical particles: A review, J. Quant. Spectrosc. Ra., 55, 535–575, https://doi.org/10.1016/0022-4073(96)00002-7, 1996. a
Molinari, J. and Vollaro, D.: External Influences on Hurricane Intensity. Part I: Outflow Layer Eddy Angular Momentum Fluxes, J. Atmos. Sci., 46, 1093–1105, https://doi.org/10.1175/1520-0469(1989)046<1093:EIOHIP>2.0.CO;2, 1989. a
National Atmospheric Research Laboratory: https://www.narl.gov.in/, last access: 17 November 2022.
Nešpor, V., Krajewski, W. F., and Kruger, A.: Wind-Induced Error of Raindrop Size Distribution Measurement Using a Two-Dimensional Video Disdrometer, J. Atmos. Ocean. Tech., 17, 1483–1492, https://doi.org/10.1175/1520-0426(2000)017<1483:WIEORS>2.0.CO;2, 2000. a
Park, S.-G., Bringi, V. N., Chandrasekar, V., Maki, M., and Iwanami, K.: Correction of Radar Reflectivity and Differential Reflectivity for Rain Attenuation at X Band. Part I: Theoretical and Empirical Basis, J. Atmos. Ocean. Tech., 22, 1621–1632, https://doi.org/10.1175/JTECH1803.1, 2005. a, b, c
Radhakrishna, B. and Rao, T. N.: Differences in cyclonic raindrop size distribution from southwest to northeast monsoon season and from that of noncyclonic rain, J. Geophys. Res.-Atmos., 115, D16205, https://doi.org/10.1029/2009JD013355, 2010. a, b, c, d, e
Radhakrishna, B., Saikranthi, K., and Rao, T. N.: Regional differences in raindrop size distribution within Indian subcontinent and adjoining seas as inferred from global precipitation measurement dual-frequency precipitation radar, J. Meteorol. Soc. Jpn. Ser. II, 98, 573–584, https://doi.org/10.2151/jmsj.2020-030, 2020. a
Rao, T. N., Amarjyothi, K., and Rao, S.: Attenuation relations for monsoonal rain at the X band from disdrometric measurements: Dependency on temperature, raindrop size distribution and drop shape models, Q. J. Roy. Meteor. Soc., 144, 64–76, https://doi.org/10.1002/qj.3291, 2018. a
Raupach, T. H. and Berne, A.: Correction of raindrop size distributions measured by Parsivel disdrometers, using a two-dimensional video disdrometer as a reference, Atmos. Meas. Tech., 8, 343–365, https://doi.org/10.5194/amt-8-343-2015, 2015. a
Raupach, T. H., Thurai, M., Bringi, V. N., and Berne, A.: Reconstructing the Drizzle Mode of the Raindrop Size Distribution Using Double-Moment Normalization, J. Appl. Meteorol. Clim., 58, 145–164, https://doi.org/10.1175/JAMC-D-18-0156.1, 2019. a
Ray, P. S.: Broadband Complex Refractive Indices of Ice and Water, Appl. Optics, 11, 1836–1844, https://doi.org/10.1364/AO.11.001836, 1972. a, b
Rogers, R. R., Ecklund, W. L., Carter, D. A., Gage, K. S., and Ethier, S. A.: Research Applications of a Boundary-Layer Wind Profiler, B. Am. Meteorol. Soc., 74, 567–580, https://doi.org/10.1175/1520-0477(1993)074<0567:RAOABL>2.0.CO;2, 1993. a
Rosenfeld, D. and Ulbrich, C. W.: Cloud Microphysical Properties, Processes, and Rainfall Estimation Opportunities, Meteor. Mon., 30, 237–258, https://doi.org/10.1175/0065-9401(2003)030<0237:CMPPAR>2.0.CO;2, 2003. a, b
Smyth, T. J. and Illingworth, A. J.: Correction for attenuation of radar reflectivity using polarization data, Q. J. Roy. Meteor. Soc., 124, 2393–2415, https://doi.org/10.1002/qj.49712455111, 1998. a
Testud, J., Oury, S., Black, R. A., Amayenc, P., and Dou, X.: The Concept of “Normalized” Distribution to Describe Raindrop Spectra: A Tool for Cloud Physics and Cloud Remote Sensing, J. Appl. Meteorol., 40, 1118–1140, https://doi.org/10.1175/1520-0450(2001)040<1118:TCONDT>2.0.CO;2, 2001. a, b, c
Thurai, M. and Bringi, V. N.: Application of the Generalized Gamma Model to Represent the Full Rain Drop Size Distribution Spectra, J. Appl. Meteorol. Clim., 57, 1197–1210, https://doi.org/10.1175/jamc-d-17-0235.1, 2018. a
Thurai, M., Petersen, W. A., Tokay, A., Schultz, C., and Gatlin, P.: Drop size distribution comparisons between Parsivel and 2-D video disdrometers, Adv. Geosci., 30, 3–9, https://doi.org/10.5194/adgeo-30-3-2011, 2011. a
Thurai, M., Gatlin, P., Bringi, V. N., Petersen, W., Kennedy, P., Notaroš, B., and Carey, L.: Toward Completing the Raindrop Size Spectrum: Case Studies Involving 2D-Video Disdrometer, Droplet Spectrometer, and Polarimetric Radar Measurements, J. Appl. Meteorol. Clim., 56, 877–896, https://doi.org/10.1175/JAMC-D-16-0304.1, 2017. a, b
Tokay, A., Bashor, P. G., and Wolff, K. R.: Error Characteristics of Rainfall Measurements by Collocated Joss–Waldvogel Disdrometers, J. Atmos. Ocean. Tech., 22, 513–527, https://doi.org/10.1175/JTECH1734.1, 2005. a
Tokay, A., Bashor, P. G., Habib, E., and Kasparis, T.: Raindrop Size Distribution Measurements in Tropical Cyclones, Mon. Weather Rev., 136, 1669–1685, https://doi.org/10.1175/2007MWR2122.1, 2008. a, b
Tokay, A., Wolff, D. B., and Petersen, W. A.: Evaluation of the New Version of the Laser-Optical Disdrometer, OTT Parsivel2, J. Atmos. Ocean. Tech., 31, 1276–1288, https://doi.org/10.1175/JTECH-D-13-00174.1, 2014. a, b
van Boxel, J.: Numerical model for the fall speed of raindrops in a rainfall simulator, I.C.E. Special Report, 1998/1, 77–85, https://dare.uva.nl/search?identifier=f900db81-bbe8-43eb-b266-676dbfb7ba6d (last access: 17 November 2022), 1998. a
Wang, M., Zhao, K., Pan, Y., and Xue, M.: Evaluation of Simulated Drop Size Distributions and Microphysical Processes Using Polarimetric Radar Observations for Landfalling Typhoon Matmo (2014), J. Geophys. Res.-Atmos., 125, e2019JD031527, https://doi.org/10.1029/2019JD031527, 2020. a
Wen, L., Zhao, K., Chen, G., Wang, M., Zhou, B., Huang, H., Hu, D., Lee, W.-C., and Hu, H.: Drop Size Distribution Characteristics of Seven Typhoons in China, J. Geophys. Res.-Atmos., 123, 6529–6548, https://doi.org/10.1029/2017JD027950, 2018. a, b