the Creative Commons Attribution 4.0 License.
the Creative Commons Attribution 4.0 License.
 | 22 Nov 2022
Retrieval of atmospheric CFC-11 and CFC-12 from high-resolution FTIR observations at Hefei and comparisons with other independent datasets
Xiangyu Zeng
Wei Wang
Changgong Shan
Yu Xie
Peng Wu
Qianqian Zhu
Minqiang Zhou
Martine De Mazière
Emmanuel Mahieu
Irene Pardo Cantos
Jamal Makkor
Alexander Polyakov
Synthetic halogenated organic chlorofluorocarbons (CFCs) play an important role in stratospheric ozone depletion and contribute significantly to the greenhouse effect. In this work, the mid-infrared solar spectra measured by ground-based high-resolution Fourier transform infrared spectroscopy (FTIR) were used to retrieve atmospheric CFC-11 (CCl3F) and CFC-12 (CCl2F2) at Hefei, China. The CFC-11 columns observed from January 2017 to December 2020 and CFC-12 columns from September 2015 to December 2020 show a similar annual decreasing trend and seasonal cycle, with an annual rate of % yr−1 and % yr−1, respectively. So the decline rate of CFC-11 is significantly lower than that of CFC-12. CFC-11 total columns were higher in summer, and CFC-12 total columns were higher in summer and autumn. Both CFC-11 and CFC-12 total columns reached the lowest in spring. Further, FTIR data of NDACC (Network for the Detection of Atmospheric Composition Change) candidate station Hefei were compared with the ACE-FTS (Atmospheric Chemistry Experiment Fourier transform spectrometer) satellite data, WACCM (Whole Atmosphere Community Climate Model) data, and the data from other NDACC-IRWG (InfraRed Working Group) stations (St. Petersburg, Jungfraujoch, and Réunion). The mean relative difference between the vertical profiles observed by FTIR and ACE-FTS is % and 4.8±0.9 % for CFC-11 and CFC-12 for an altitude of 5.5 to 17.5 km, respectively. The results demonstrate that our FTIR data agree relatively well with the ACE-FTS satellite data. The annual decreasing rate of CFC-11 measured from ACE-FTS and calculated by WACCM is % yr−1 and % yr−1, respectively. The interannual decreasing rates of atmospheric CFC-11 obtained from ACE-FTS and WACCM data are higher than that from FTIR observations. Also, the annual decreasing rate of CFC-12 from ACE-FTS and WACCM is % yr−1 and % yr−1, respectively, close to the corresponding values from the FTIR measurements. The total columns of CFC-11 and CFC-12 at the Hefei and St. Petersburg stations are significantly higher than those at the Jungfraujoch and Réunion (Maïdo) stations, and the two values reached the maximum in local summer or autumn and the minimum in local spring or winter at the four stations. The seasonal variability at the three stations in the Northern Hemisphere is higher than that at the station in the Southern Hemisphere.
- Article
(2817 KB) - Full-text XML
- BibTeX
- EndNote


Synthetic halogenated organic chlorofluorocarbons (CFCs) have been widely used in industry as refrigerants, foam-blowing agents, and propellants, due to their stable and non-toxic chemical properties (Mcculloch et al., 2003). The photolysis of CFCs in the stratosphere significantly causes the depletion of stratospheric ozone, so CFC-11 (CCl3F) and CFC-12 (CCl2F2) are currently classified as important ozone-depleting substances (ODSs) (Molina and Rowland, 1974). With the long atmospheric lifetime, about 52 years for CFC-11 and 102 years for CFC-12, they can be transported to the polar region and accumulated to cause polar ozone depletion (WMO, 2018). CFCs also have high global warming potentials (GWPs), being regarded as greenhouse gases (Molina et al., 2009). GWP refers to the ratio of radiative forcing for a given mass of a substance relative to CO2 emissions of the same mass over a given time (Fang et al., 2018). The GWPs of CFC-11 and CFC-12 are reported to be 5160 and 10 300 for 100 years (WMO, 2018).
The Montreal Protocol on Substances that Deplete the Ozone Layer came into effect in 1989, for the limitation of ozone-depleting substances in industrial products and to avoid their continued damage to the Earth's ozone layer. China, as one of the countries with the highest CFCs emissions, has committed to phasing out CFC production by 2010 (Wan et al., 2009; Wu et al., 2018). The atmospheric concentrations of CFCs declined slowly, and the ozone layer began to recover gradually under the implementation of the ban. However, there was a slowdown in the global declining CFC-11 concentrations after 2012 from the observations at remote measurement sites, and the difference between expectations of accelerated rates of decline and observations widened from 2012 to 2017, suggesting unreported new productions of CFC-11 (Montzka et al., 2018). The atmospheric in situ observations at Gosan, South Korea, and Hateruma, Japan, combined with the simulations of atmospheric chemical transport models showed that there was an increase in CFC-11 emissions around Shandong and Hebei provinces in China from 2014 to 2017 (Rigby et al., 2019). Also, a study based on a Bayesian parameter estimation (BPE) model estimates that global unexpected CFC-11 and CFC-12 emissions reached 23.2 and 18.3 Gg yr−1 during 2014–2016 (Lickley et al., 2021). Meanwhile, the atmospheric measurements and simulations at Mauna Loa Observatory, Gosan, South Korea, and Hateruma, Japan, show that CFC-11 emissions in China decreased since 2019 and the decline in the global average CFC-11 concentrations accelerated (Montzka et al., 2021; Park et al., 2021).
Studying the temporal–spatial distribution and variations in CFCs in the atmosphere is of great significance for improving understanding and implementing policies to reduce stratospheric ozone depletion and greenhouse gas emissions. In recent decades, in situ and remote-sensing techniques have been used to monitor CFCs (Khosrawi et al., 2004; Eckert et al., 2016; Kellmann et al., 2012; Lin et al., 2019; Zhang et al., 2011). The surface in situ measurements monitor long-term trend and seasonal variations in the target gases, such as those in the Advanced Global Atmospheric Gases Experiment (AGAGE), the World Data Centre for Greenhouse Gases (WDCGG), NOAA's Halocarbons & other Atmospheric Trace Species Group (HATS) (Rigby et al., 2013). In the last decade, the in situ CFC measurements were also performed in many Chinese cities and suburbs (G. Zhang et al., 2017; Lin et al., 2019; Zhen et al., 2020; Yang et al., 2021; Yi et al., 2021; Benish et al., 2021). In situ observations provide highly precise atmospheric concentration data. Yi et al. (2021) measured the annual mean mixing ratios of major halocarbons in five different cities in China from 2009 to 2019 for 4–7 d each month, and the CFC-11 and CFC-12 concentrations in the atmosphere showed a downward trend. Benish et al. (2021) collected air samples in 500–3500 m by aircraft above Hebei Province in 2016 and found atmospheric CFC-11 and CFC-12 were higher than global tropospheric background levels and deduced that CFC-11 and CFC-12 has new production in eastern China.
Satellite remote-sensing techniques, such as the High Resolution Dynamics Limb Sounder (HIRDLS, the vertical resolution is 1 km), the Improved Limb Atmospheric Spectrometer (ILAS, the vertical resolution is 1 km), the collocated Michelson Interferometer for Passive Atmospheric Sounding (MIPAS, the vertical resolution is 4 km), and the Atmospheric Chemistry Experiment Fourier transform spectrometer (ACE-FTS, the vertical resolution is 2–2.5 km), also play an important role in measuring the global distribution of CFCs (Eckert et al., 2016; Hoffmann et al., 2014; Kellmann et al., 2012; Khosrawi et al., 2004; Oshchepkov et al., 2006; Tegtmeier et al., 2016; Steffen et al., 2019). In addition, in the study of Chen et al. (2020), global CFC-11 surface concentration and trend are observed by the Atmospheric Infrared Sounder (AIRS, the spatial resolution is 30∘ longitude by 10∘ latitude) aboard the NASA Aqua satellite. Garkusha et al. (2017) reported that the modern satellite Fourier spectrometer IRFS-2 instrument has the capability to retrieve CFC-11 and CFC-12 in the information gathering mode. Airborne remote-sensing instruments are also used to measure atmospheric CFCs, such as limb-imaging infrared FTS (Fourier transform spectrometer) GLORIA (Gimballed Limb Observer for Radiance Imaging of the Atmosphere, the vertical resolution is 0.5–2 km) and limb-scanning infrared FTS MIPAS-STR (Michelson Interferometer for Passive Atmospheric Sounding – STRatospheric aircraft, the vertical resolution is 1–2 km) (Woiwode et al., 2012; Johansson et al., 2018; Woiwode et al., 2015). However, due to the low sensitivity and large measurement error near the surface, satellite and airborne remote-sensing data need to be verified by ground-based observations (Eckert et al., 2016).
The ground-based remote-sensing Fourier transform infrared (FTIR) spectroscopy is used to detect the vertical profile and long-term trend of trace gases with high precision (Godin-Beekmann, 2009; De Mazière et al., 2018). Notholt (1994) measured atmospheric CFCs in the polar night by ground-based FTIR with the moon as the light source in the 1990s. Mahieu et al. (2010) measured the CFC-11, CFC-12, and HCFC-22 ((CHClF2)) total columns and annual trends above the Jungfraujoch station, Switzerland, by FTIR technique. Zhou et al. (2016) observed the vertical profiles and the annual variations in CFC-11, CFC-12, and HCFC-22 at the Réunion (St Denis and Maïdo) FTIR sites from 2004 to 2016 and compared them with MIPAS/ENVISAT satellite data. Prignon et al. (2019) utilized the Tikhonov regularization strategy to improve the retrieval of atmosphere HCFC-22 vertical profiles, observed by FTIR from 1988 to 2017 above Jungfraujoch. Polyakov et al. (2021) refined the infrared solar radiation retrieval strategy to estimate the column-averaged dry-air mole fractions of CFC-11, CFC-12, and HCFC-22 at St. Petersburg. Pardo Cantos et al. (2022) analyzed the trend of CFC-11 total columns in Jungfraujoch station and Lauder station in the last 20 years. Jungfraujoch, Réunion, St. Petersburg, and Lauder FTIR stations have joined NDACC-IRWG (Network for the Detection of Atmospheric Composition Change – InfraRed Working Group), and Hefei is a candidate NDACC-IRWG station now.
The objective of this paper is to obtain the CFC-11 and CFC-12 total columns from the solar spectra based on ground-based FTIR spectroscopy and compare them with the ACE-FTS satellite data, Whole Atmosphere Community Climate Model (WACCM) data, and the data from other NDACC-IRWG stations (St. Petersburg, Jungfraujoch, and Réunion). Section 2 describes the Hefei FTIR observing site, the retrieval parameters, and retrieval strategy. Then we present the retrieval results and discuss the interannual variability and seasonality of CFC-11 and CFC-12 and compare the data with the ACE-FTS satellite data, the WACCM data, and the data from other NDACC-IRWG stations in Sect. 3. A conclusion is drawn in Sect. 4.
2.1 Observing site and instruments
The Hefei ground-based solar FTIR remote-sensing site (31.91∘ N, 117.17∘ E and 29 m above sea level) is located at the Anhui Institute of Optics and Fine Mechanics, Chinese Academy of Sciences, in the northwestern rural area of Hefei city in eastern China, adjacent to a lake in a flat terrain. Hefei site has followed the standard measurements of NDACC-IRWG since 2015. Hefei site is not an NDACC-IRWG station now but is applying to join the NDACC-IRWG. The locations of Hefei station and the other three NDACC-IRWG stations are shown in Fig. 1. The instruments include a high-resolution Fourier transform infrared Bruker IFS 125HR spectrometer and a solar tracker (A547N) installed on the roof. A meteorological station (Zeno, coastal environmental systems, USA) on the roof records surface pressure, temperature, relative humidity, wind speed, and other meteorological information since September 2015 (Yin et al., 2020; Zhang et al., 2020; Shan et al., 2021a, b; Wang et al., 2017; Yin et al., 2019). The spectrometer uses a liquid-nitrogen-cooled mercury cadmium telluride (MCT) detector combined with a KBr beamsplitter to record the mid-infrared spectra. We replaced the CaF2 incoming light window with a KCl window for the FTIR spectrometer in December 2016, which increased the covered spectral range from greater than 1000 cm−1 to greater than 700 cm−1. The mid-infrared solar absorption spectra covering about 800–1200 cm−1 are used to retrieve the target gases in this study, with a spectral resolution of 0.005 cm−1 and an optical path difference (OPD) of 180 cm.
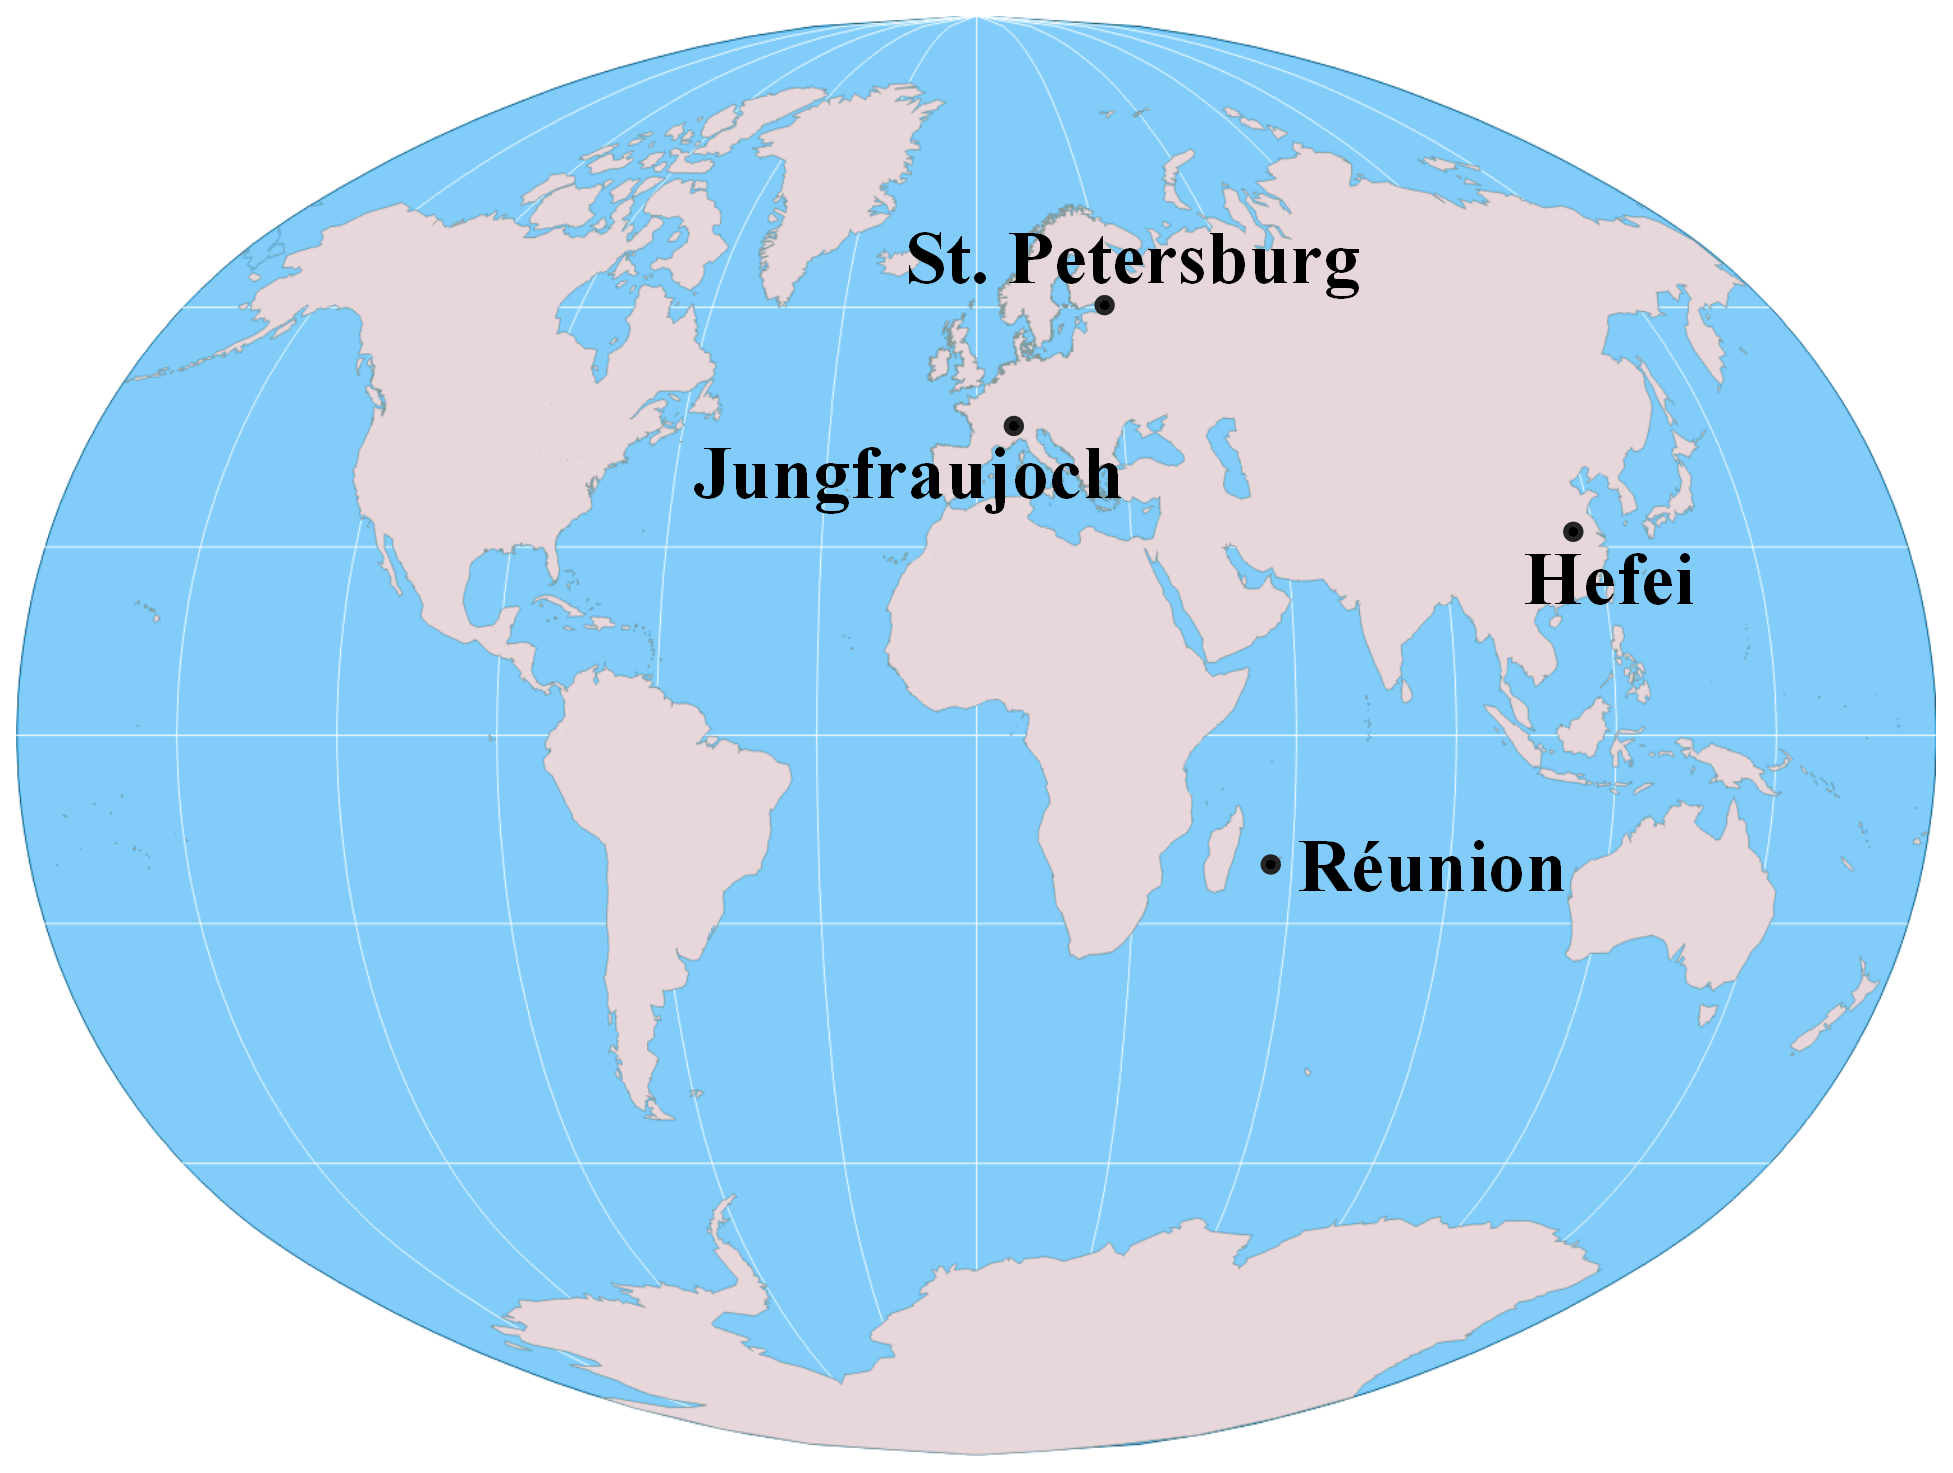
Figure 1Location of the three participating NDACC-IRWG stations and Hefei station.
2.2 Retrieval parameter setting
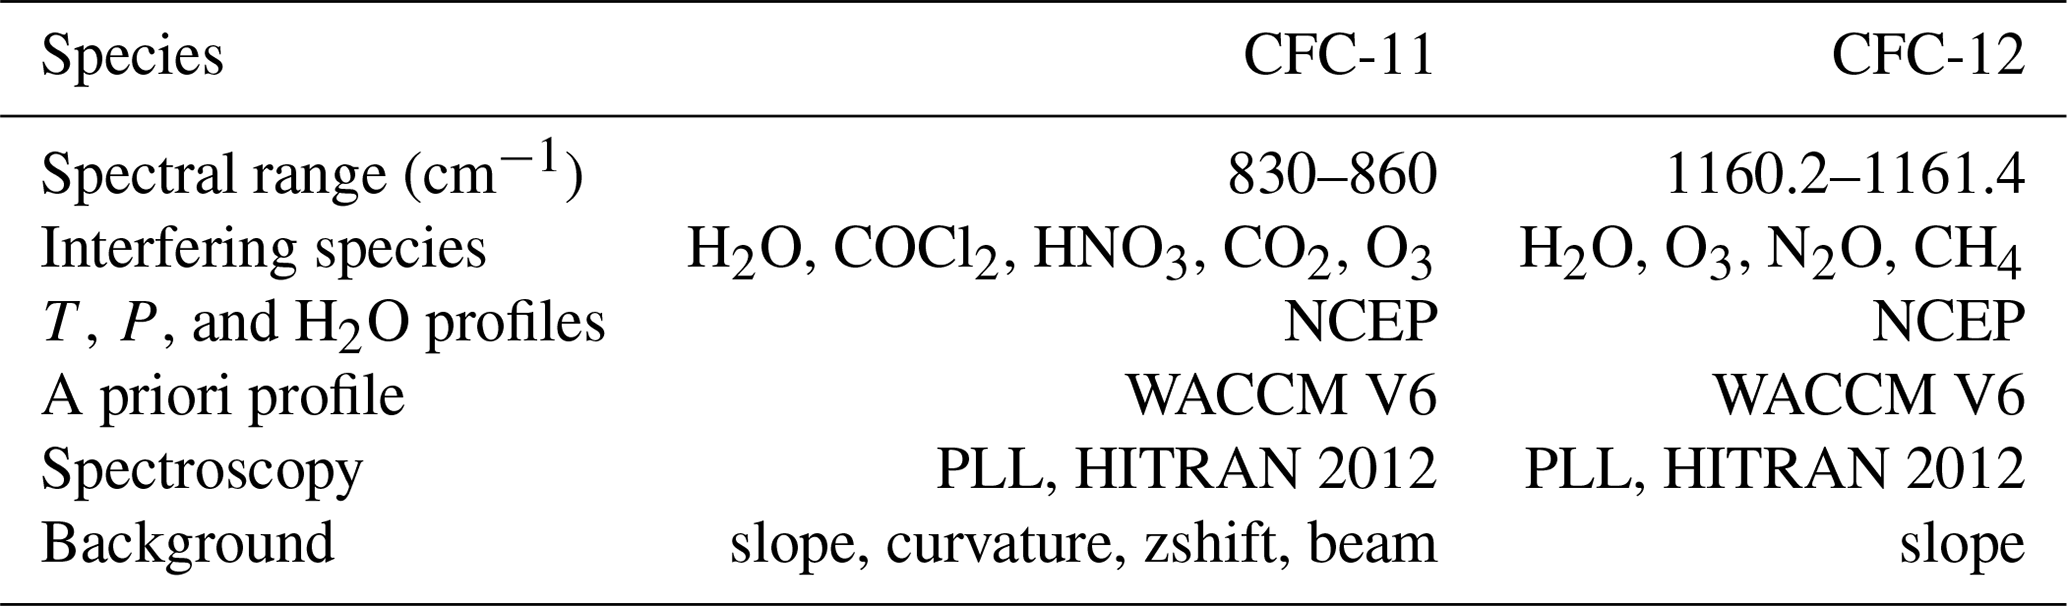
Table 1 lists the parameters used for CFC-11 and CFC-12 retrievals. The retrieval window of CFC-11 is 830–860 cm−1, and the spectral window centered at 1161 cm−1 was chosen to retrieve atmospheric CFC-12 (Zhou et al., 2016; Polyakov et al., 2021). Atmospheric parameters, such as H2O, temperature, and pressure profiles are adopted from National Centers for Environment Protection (NCEP) reanalysis data (Kalnay et al., 1996). The a priori profiles of CFCs and interfering gases except H2O are derived from WACCM version 6, and the a priori profiles of CFC-11 and CFC-12 are from the mean of 2017–2020 and 2015–2020 WACCM V6 data, respectively. The spectroscopic line parameters for CFC-11, CFC-12, and COCl2 are calculated based on empirical pseudo-line lists (PLLs), and the line parameters of other interfering gases are provided by HITRAN 2012 (Rothman et al., 2013). Pseudo-line lists are created by Geoff Toon (NASA-JPL, http://mark4sun.jpl.nasa.gov/pseudo.html, last access: 3 January 2022), obtained by spectral measurement and fitting to laboratory transmission spectra. According to the study of Polyakov et al. (2021), because the CFC-11 retrieval window is wide, it is necessary to consider the influence of the increase in the thickness of amorphous water ice in the instrument caused by water vapor in the atmosphere. Therefore, the curvature is considered to be used in the retrieval and the uncertainty is set to 10−6. In the microwindow, there are some low-frequency oscillations of the baseline caused by optical instruments. For a wide retrieval spectral microwindow, such as for CFC-11, this shape can affect the fitting of the spectrum. Therefore, we added zero level offset (zshift) correction and beam correction in the retrieval parameters of CFC-11. The a priori value of zshift is set to 0, and the uncertainty is set to 0.1. The channel model is selected as the interferogram perturbation (IP) model (Zhou et al., 2016). The beam correction parameters, such as amplitude, period, phase, and slope, are set to 0.003, 0.93, 845, and 0.
2.3 Retrieval strategy
The total columns and vertical profiles of CFC-11 and CFC-12 are retrieved by the SFIT4 (version 0.9.4.4) algorithm, which implements the optimal estimation method (OEM) (Rodgers, 2000). The vector of measurement y is described by the forward model F and the state vector x as
The forward model F(x,b) relates the true state of the atmosphere and the observation system, where ε represents the random noise of measurement and the uncertainty of retrieval, state vector x is unknown, containing vertical profiles of gas and instrument-related parameters to be retrieved, b is a vector including the temperature and pressure profiles, and instrument specifications and other information that has impact on measurement vector but cannot be retrieved. The retrieved state vector can be found by the known result y. The forward model is nonlinear for FTIR measurement, so the algorithm uses the method of Newtonian iteration to calculate the result of iteration index i:
where xa is the a priori profile, K is the Jacobian matrix, Sa and Sε are the a priori covariance matrix and the measurement covariance matrix. The best-fitting retrieved state vector and the true state vector x can be expressed as
where εx represents the error terms, mainly including the measurement error covariance matrix Sm=GSεGT, the smoothing error covariance matrix , and the forward parameter error covariance matrix . Kb is the sensitivity of the measurements to the parameter b, and G is the gain matrix. A is the averaging kernel matrix, representing the sensitivity of the retrieved states to the true atmosphere, and the formula is
and the trace of the averaging kernel matrix can be used to represent the vertically independent information obtained by the measurement, which is called the degrees of freedom for signal (DOFs).
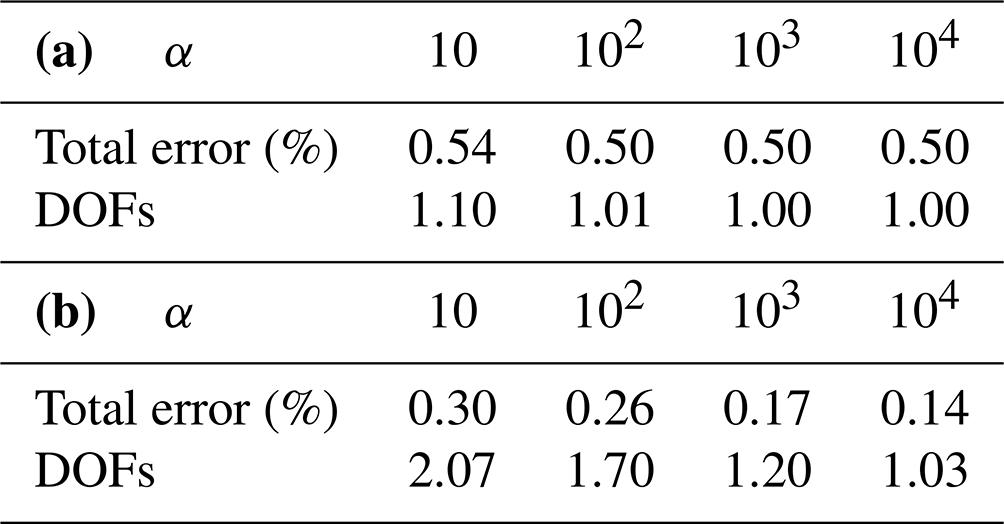
The solution of the inverse problem is an ill-posed process constrained by a priori state vector xa and regularization matrix . In this study, we use the Tikhonov L1 regularization to define the constrain matrix R; this method is described in Tikhonov (1963), Vigouroux et al. (2009), and Sussmann et al. (2011). The regularization strength α is crucial to constrain the retrieved profiles and extract more information from measurements, so we follow the approach described in Steck (2002) that minimizes the total error calculated by the measurement error and smoothing error. The measurement error (Sm) and the smoothing error (Ss) are calculated to get the total error according to the a posteriori error estimation method. Using all spectra collected in 2020 to test the regularization strength, the test results are listed in Table 2. CFC-11 has a minimum total error of 0.50 % (the measurement error is 0.50 % and the smoothing error is 0.06 %) for regularization strength α=102, while CFC-12 has a minimum total error of 0.14 % (the measurement error is 0.14 % and the smoothing error is 0.03 %) for α= 104, and the degrees of freedom for signal (DOFs) of the two gases are greater than 1. So the regularization strength is chosen as 102 and 104 for CFC-11 and CFC-12 retrieval, respectively.
Table 2The total error (Stot) and retrieved DOFs for (a) CFC-11 and (b) CFC-12 by using different regularization strength α values.
2.4 Spectral retrieval of CFC-11 and CFC-12
A typical spectrum was analyzed to retrieve CFC-11 and CFC-12, and the spectrum was collected at 01:55:48 UTC on 15 January 2017, with a solar zenith angle of 63.03∘. The spectral retrieval window, the retrieved vertical profile, and the averaging kernels and DOFs for CFC-11 and for CFC-12 are plotted in Figs. 2 and 3, respectively. The fitting residuals of CFC-11 are within ±2 %, and the root-mean-square (rms) error is 0.309 %. The fitting residuals of CFC-12 are within ±1 %, and the rms error is 0.298 %. The profile of the mixing ratio for CFC-11 and CFC-12 is mainly distributed within 0–20 km. The a priori profile of CFC-12 is similar to the retrieved profile with the Tikhonov regularization, and tropospheric concentrations of the retrieved CFC-11 profile are significantly higher than those of the a priori profile. The averaging kernels in Figs. 2c and 3c, describe the sensitivity of the height dependence of the retrieved profile to concentration perturbations at various atmospheric levels. The high sensitivity means the profile retrieved mainly comes from the measured spectrum rather than a priori information (Rodgers and Connor, 2003). It can be seen that each layer of CFC-11 has high sensitivity below 30 km and has the highest sensitivity at about 4 km. For CFC-12, each layer has high sensitivity at about 15 and 4 km, and the sensitivity tends to be zero above 40 km. The DOFs of typical spectra for CFC-11 and CFC-12 are 1.02 and 1.31, respectively.
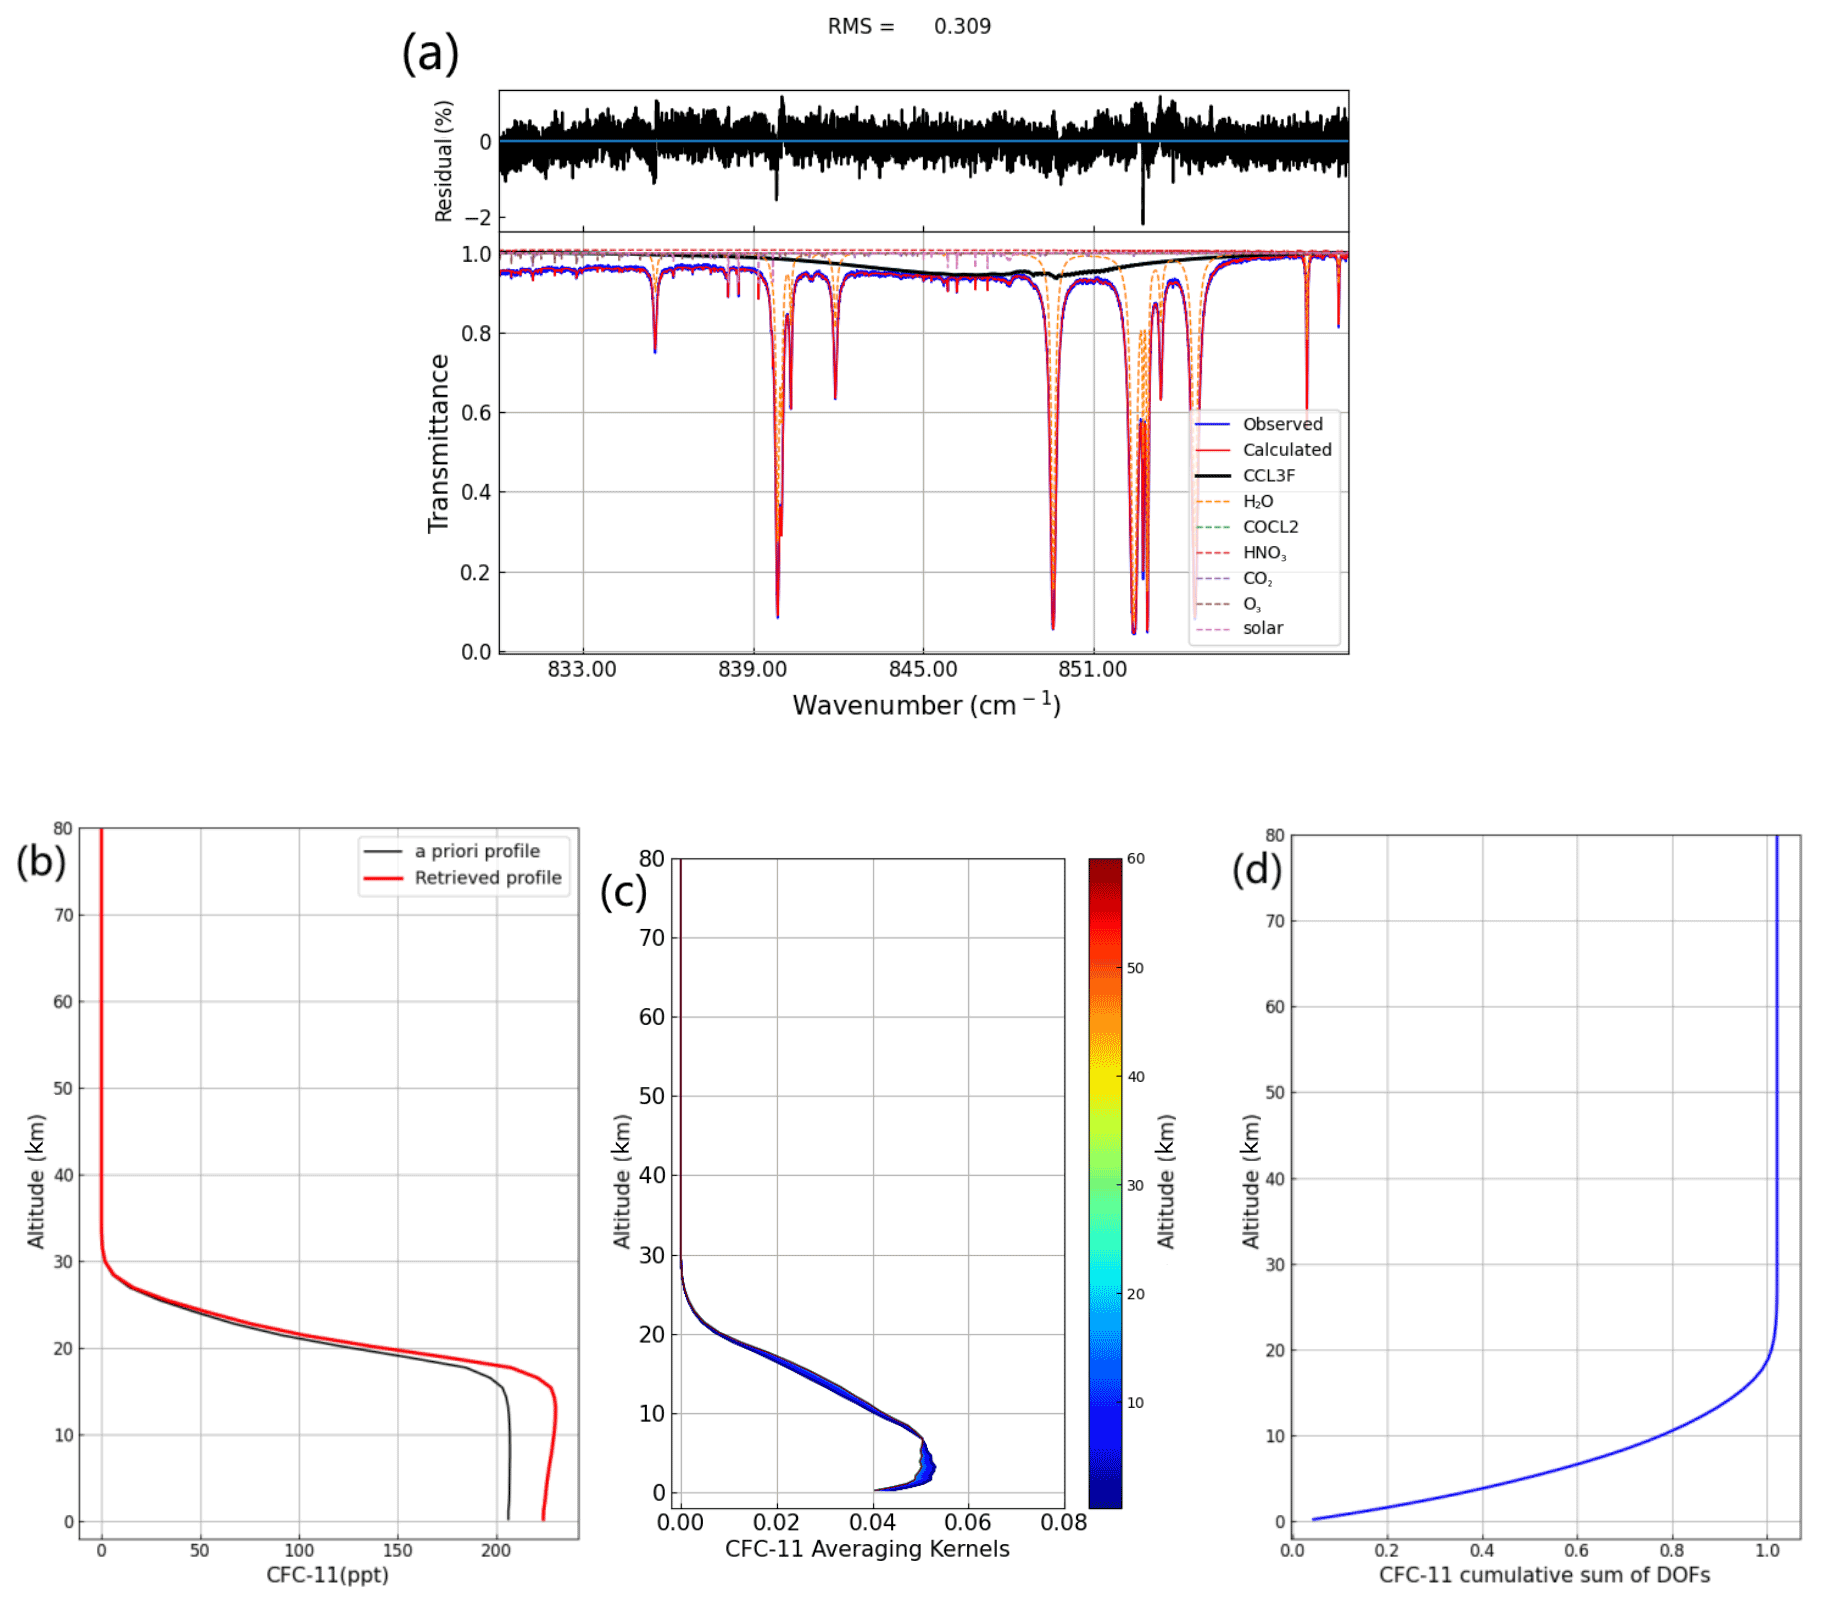
Figure 2(a) Measured (blue) and fitted (red) CFC-11 (CCl3F) spectrum (01:55:48 UTC 15 January 2017, solar zenith angle of 63.03∘) in the one microwindow; (b) the CFC-11 profiles (the black line represents a priori profile; the red line represents a retrieved profile); (c) the averaging kernels of CFC-11; (d) the degrees of freedom for signal (DOFs) of CFC-11.
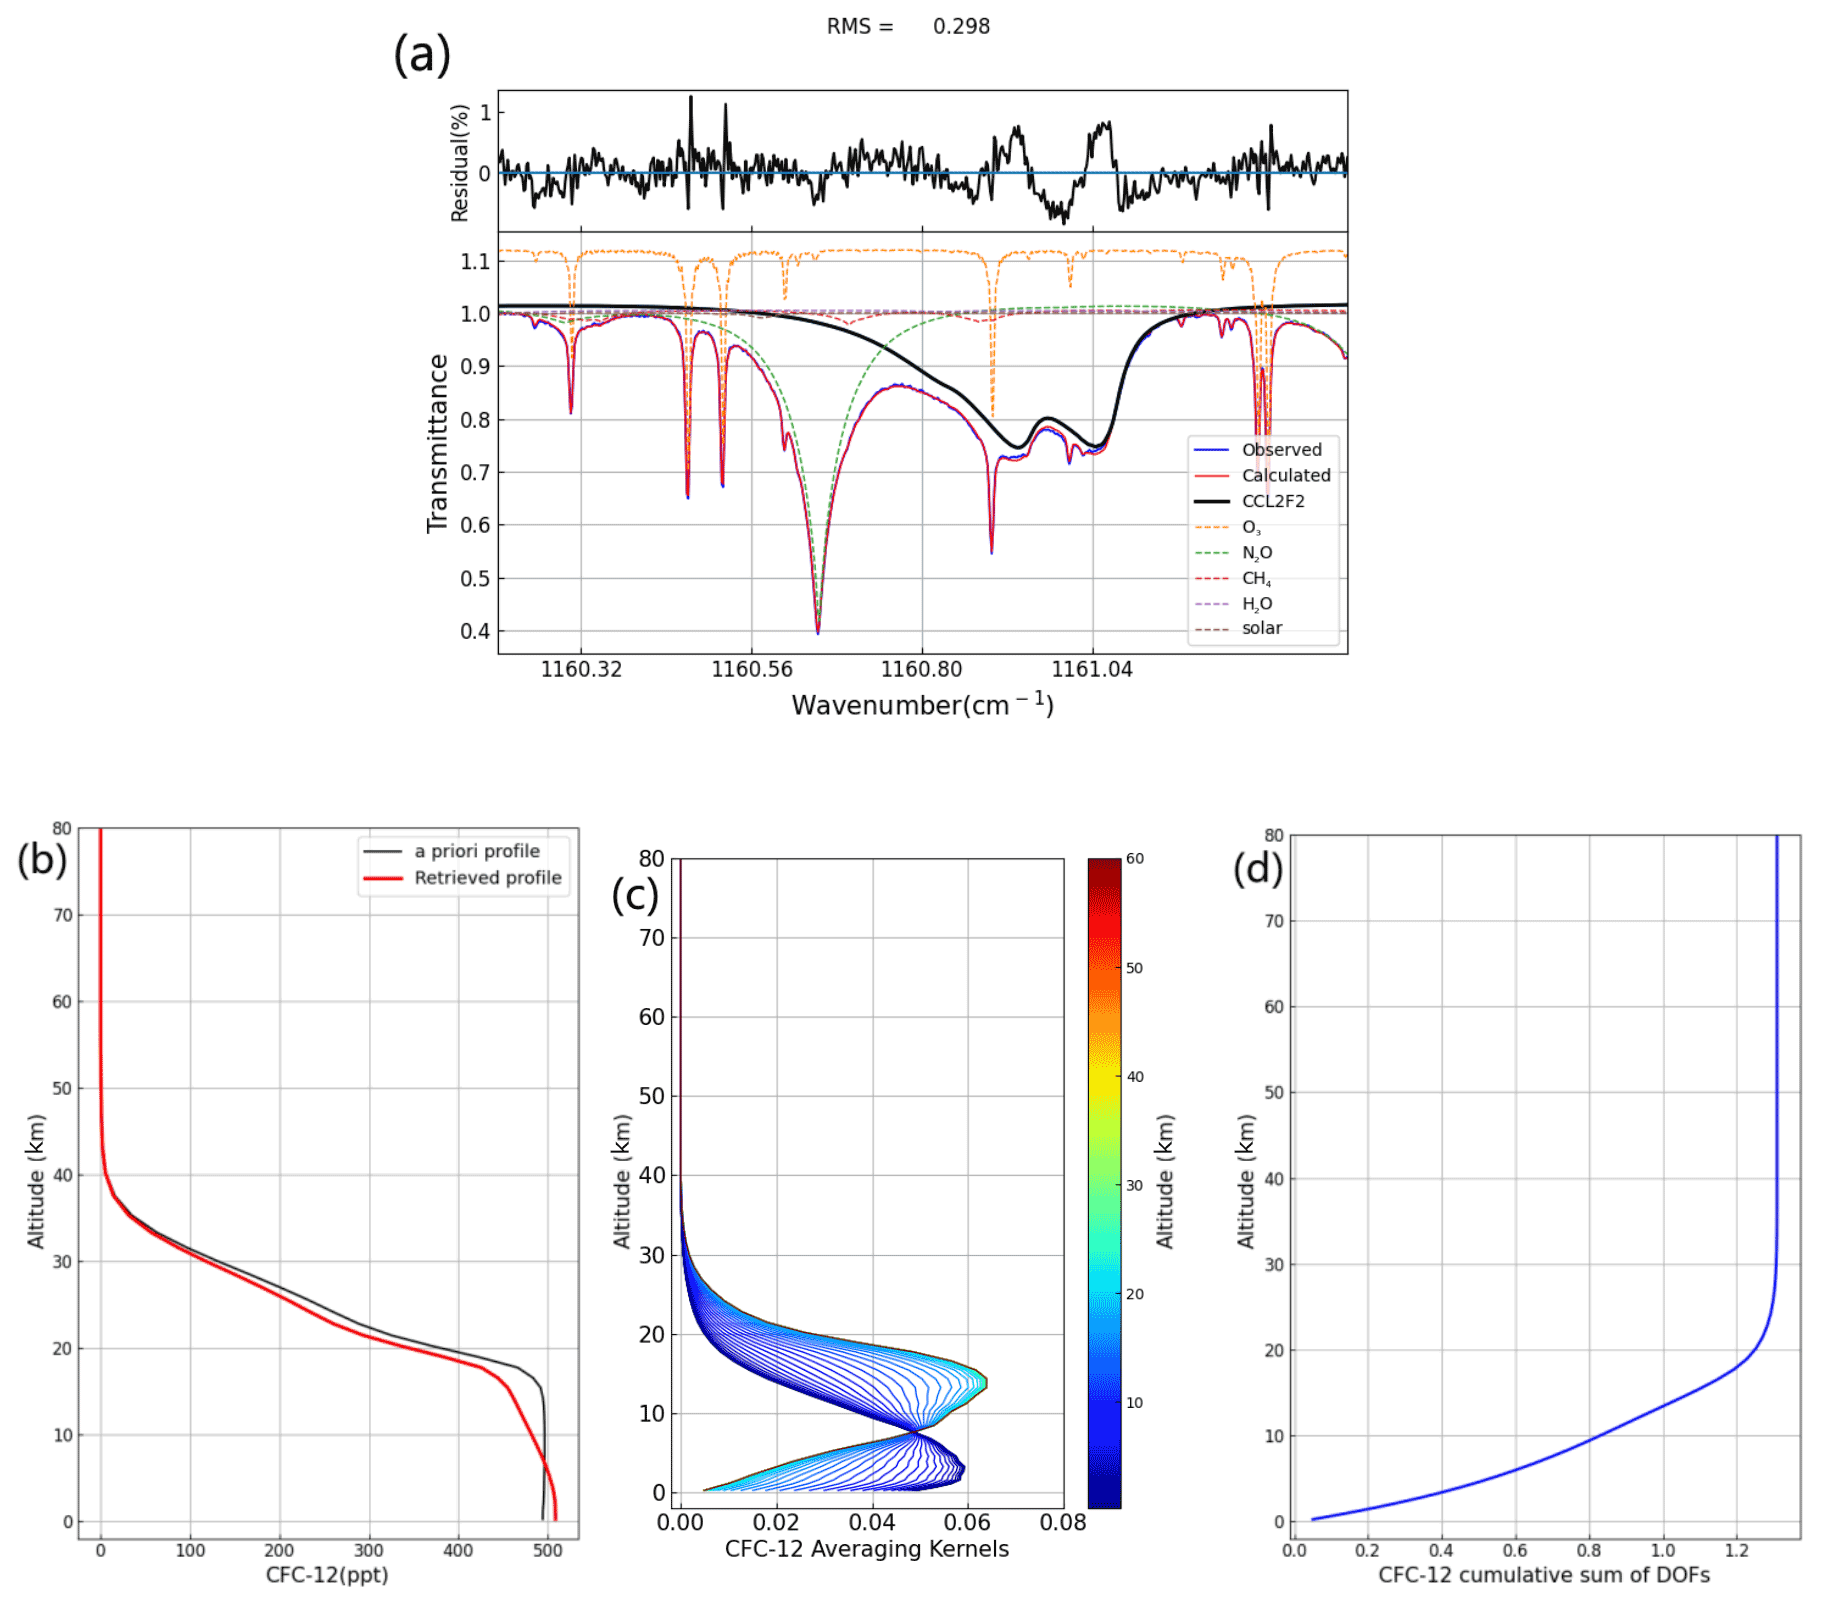
Figure 3(a) Measured (blue) and fitted (red) CFC-12 (CCl2F2) spectrum (01:55:48 UTC 15 January 2017, solar zenith angle of 63.03∘) in the one microwindow; (b) the CFC-12 profiles (the black line represents a priori profile; the red line represents a retrieved profile); (c) the averaging kernels of CFC-12; (d) the degrees of freedom for signal (DOFs) of CFC-12.
2.5 Error analysis
We analyze the smoothing error, forward model error, model parameter error, and measurement error of the target gases based on the a posteriori error estimation method described in Rodgers and Connor (2003). The error items and their relative uncertainties in the error budget are listed in Table 3. For the uncertainty of atmospheric temperature, the systematic error is about 2 K for the vertical range from 0 to 30 km, 5–9 K above 30 km, and the temperature random error is 5 K for the whole atmosphere. The systematic and random uncertainties of solar zenith angle (SZA) are 0.1 and 0.2∘, respectively. The line intensity uncertainty, the uncertainty of the temperature dependence of line width and the air broadening of line width for CFC-11 and CFC-12 are 7 % and 1 %, respectively, referring to the maximum absorption coefficient error given in pseudo-line lists. The uncertainty of H2O spectroscopy is set to 10 %, and the uncertainty of instrument line shape (ILS) is 2 %. In the error budget estimation of CFC-11, zero level offset (zshift) is included in the retrieval parameter error.
Table 3Random and systematic error uncertainty and budget for CFC-11 and CFC-12 retrieval.

The total errors for CFC-11 and CFC-12 are about 4.12 % and 1.79 %, respectively, based on the combination of random and systematic errors. The systematic error and random error for CFC-11 are 4.07 % and 0.66 %, respectively. The line intensity and H2O spectroscopy in CFC-11 are the dominating systematic errors, with errors of 2.88 % and 2.87 %, respectively. Temperature error is the dominating random error for CFC-11. For CFC-12, the systematic error and random error are 1.32 % and 1.21 %, respectively, while the dominating errors are temperature, H2O spectroscopy, and zshift. At the St. Petersburg site, the systematic error for CFC-11 is 7.61 % and the random error is 3.08 %, and for CFC-12, the systematic error is 2.24 % and the random error is 2.40 % (Polyakov et al., 2021). Our error estimates are similar to those at the St. Petersburg station, and slightly smaller compared with the latter.
3.1 Time series of CFC-11 and CFC-12 at the Hefei site
Figure 4a shows the time series of the CFC-11 total columns observed from January 2017 to December 2020 at the Hefei site. Figure 4b shows CFC-12 total columns observed from September 2015 to December 2020 at the Hefei site. The average total column of CFC-11 and CFC-12 is molec. cm−2 and molec. cm−2, respectively. The time series F(t) are fitted by Fourier series containing first-order polynomial and three harmonic terms to simulate the interannual and seasonal variation in CFC-11 and CFC-12:
where t is the time fraction in years, a is the intercept, b represents annual trend, and c1 to c6 represent sin/cosine harmonic term coefficients.
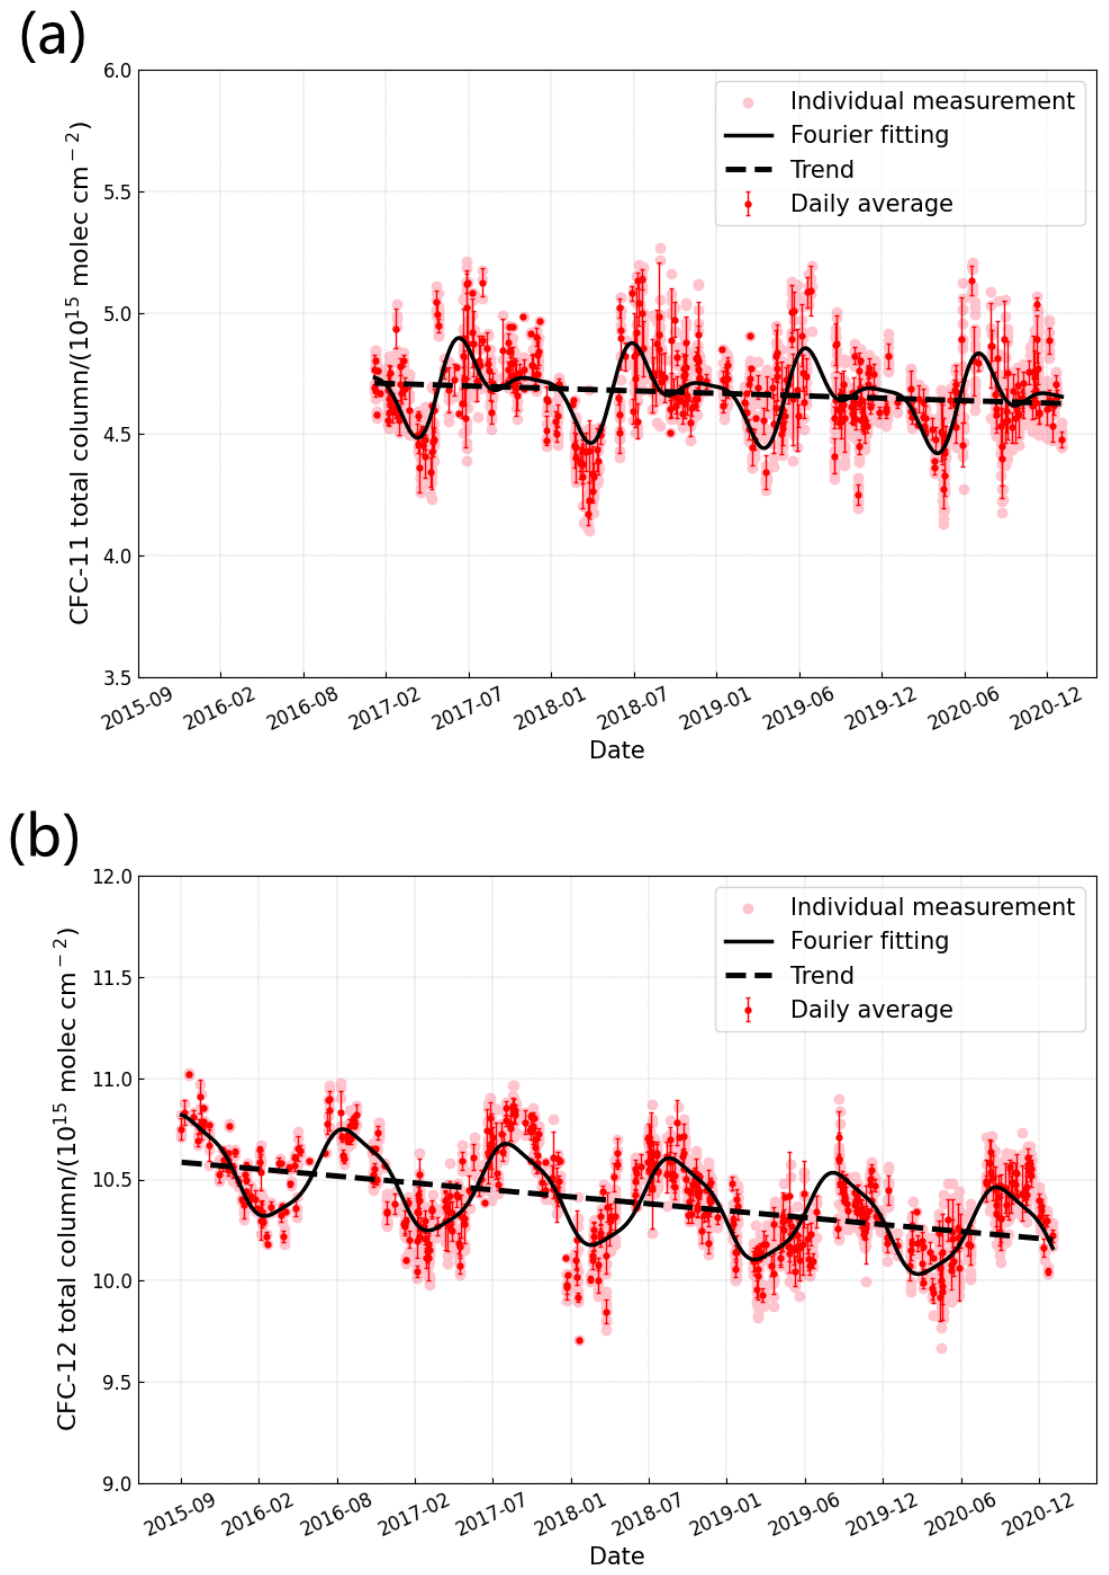
Figure 4The time series of the total columns of (a) CFC-11 and (b) CFC-12 from FTIR measurements at Hefei. The light red dots are the individual measurements, the red dots are the daily average, the error bars are standard deviations of the daily average, and the black solid line and the black dash line are the fitting curve of individual measurements and annual trend, respectively.
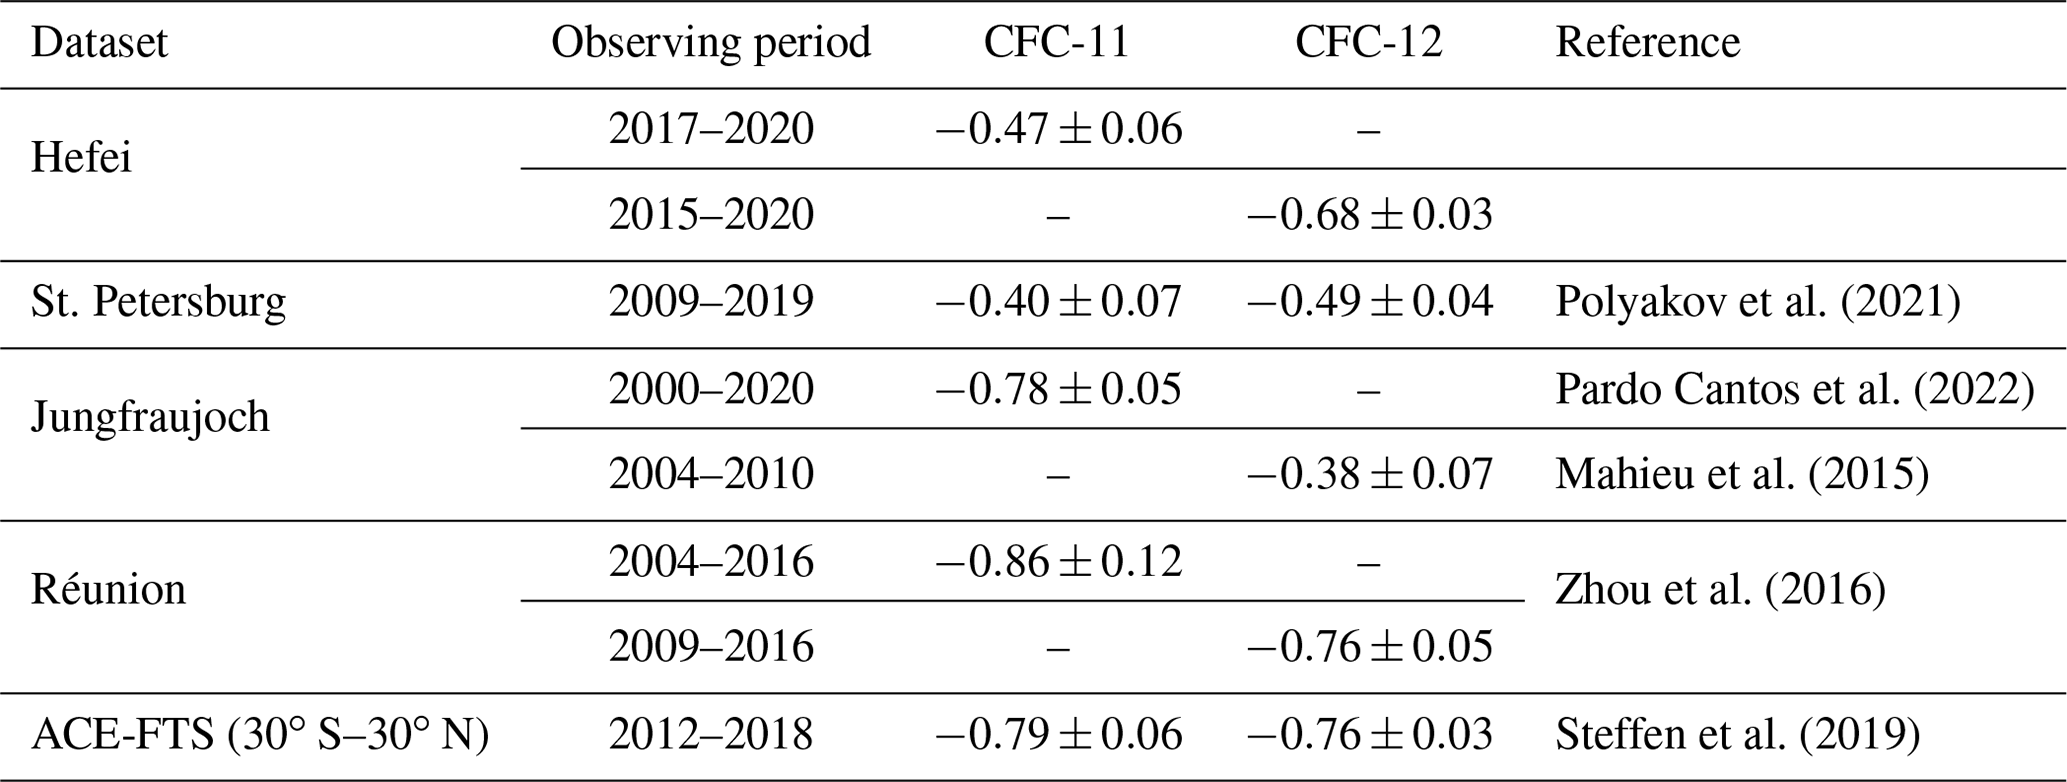
CFC-11 and CFC-12 show an obvious seasonal variation and annual decreasing trend. The annual decline in CFC-11 and CFC-12 is due to the prohibition of emissions from industrial production. For CFC-11, the annual decreasing rate of the total column is % yr−1 listed in Table 4, which is close to the value of −0.40 % yr−1 at St. Petersburg observed from 2009 to 2019. However, it is lower than the value of % yr−1 reported at the St Denis and Maïdo (Réunion) station observed from 2004 to 2016, the value of % yr−1 reported at the Jungfraujoch station observed from 2000 to 2020, and the value of % yr−1 derived from ACE-FTS from 2012 to 2018 covering the region between 30∘ S and 30∘ N. For CFC-12, the annual decreasing rate of the total column is % yr−1 at the Hefei site, close to the value of % yr−1 derived from St Denis and Maïdo (Réunion) measurements and to % yr−1 derived from ACE-FTS observations between 30∘ S and 30∘ N latitude. However, it is larger than the value of −0.49 % yr−1 from St. Petersburg measurements and the value of % yr−1 reported at the Jungfraujoch station (Polyakov et al., 2021; Steffen et al., 2019; Mahieu et al., 2015; Pardo Cantos et al., 2022). The total-column decline rate of CFC-11 is significantly lower than that of CFC-12.
Table 4The annual trend (% yr−1) of CFC-11 and CFC-12 at the Hefei, St. Petersburg, Jungfraujoch, and Réunion FTIR stations and ACE-FTS between 30∘ S and 30∘ N.
The seasonal variations in detrended CFC-11 and CFC-12 total columns are given in Fig. 5. The detrended values are obtained by subtracting the respective annual average value from individual measurements at the Hefei site. Both CFC-11 and CFC-12 show an obvious seasonal variation. CFC-11 has the highest total column in summer and a trough in spring, and CFC-12 has the highest column in summer and autumn and a trough in spring. The peak value of CFC-11 appears in July and the minimum in April, with a seasonal amplitude of 3.89×10¹⁴ molec. cm−2 and a seasonal variability of 8 %. The seasonal amplitude is the difference between the maximum and the minimum monthly mean, and the seasonal variability is the seasonal amplitude divided by the annual mean. The peak of CFC-12 is in September and the minimum in March, with a seasonal amplitude of 4.53×10¹⁴ molec. cm−2 and a seasonal variability of 4 %. Compared with CFC-12, CFC-11 has smaller difference in autumn and winter. Yang et al. (2021) measured a higher CFC concentration in August at the top of Mount Tai in northern China from June 2017 to April 2018. CFC-11 and CFC-12 at the St Denis and Maïdo stations also show a seasonal cycle, with high concentrations in summer and autumn (Zhou et al., 2016).
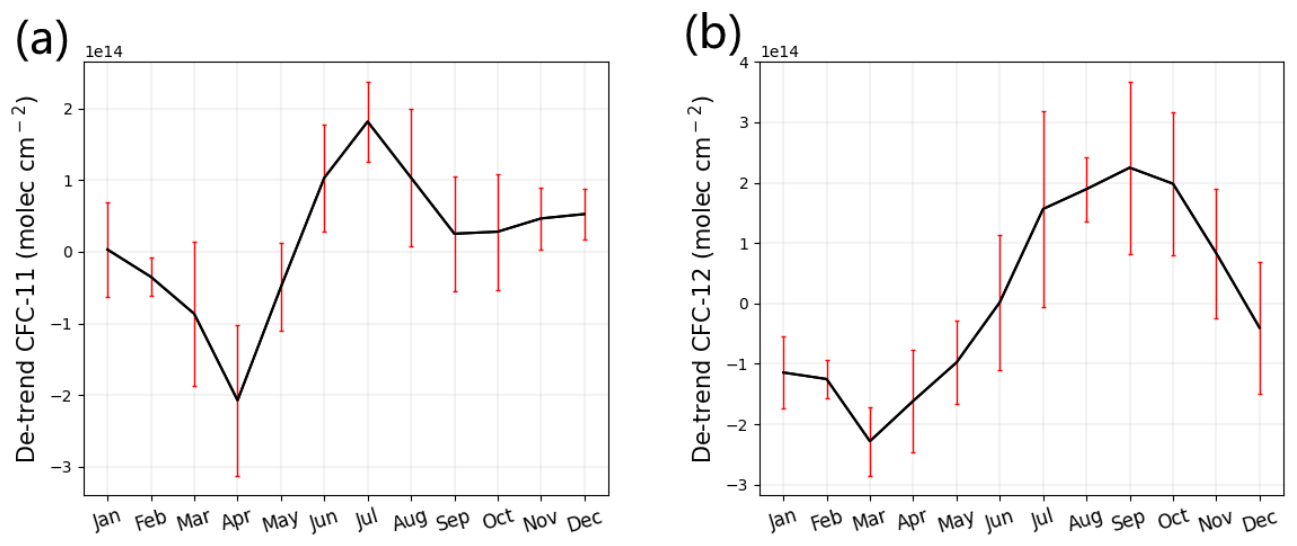
Figure 5(a) The detrended total columns of CFC-11; (b) the detrended total columns of CFC-12. The error bars show the standard deviation of monthly averaged value.
At present, China still has a large reserve of CFCs. CFC-11 is often used as blowing agent and tobacco shred expander, and CFC-12 is mainly used as refrigerant and blowing agent (Wang et al., 2010). Some studies in China indicate that the leakage of CFCs from waste treatment in municipal solid waste landfills, the wide use of air conditioners and other refrigeration equipment in summer, and low-leak tightness of automobile mobile air conditioning systems on hot and humid days are potential sources of CFCs (Y. Zhang et al., 2017; Zhen et al., 2020). This seasonal variation is also related to the seasonal cycle of the Brewer–Dobson circulation, and the inconsistency in CFC-11 and CFC-12 lifetime may be the other reason for their seasonal variation difference (Tegtmeier et al., 2016). Primary sinks of CFC-11 and CFC-12 are in the stratosphere, and the lifetime of CFC-11 is shorter than CFC-12, so CFC-11 has more depletion with height in the stratosphere due to photochemical destruction. Nevison et al. (2004) described that CFC-11 has a shorter lifetime than CFC-12 and greater sensitivity to stratospheric downwelling, which causes greater seasonal variability in CFC-11.
3.2 Comparison with satellite and model data
The Atmospheric Chemistry Experiment Fourier Transform Spectrometer (ACE-FTS) was launched onboard the SCISAT-1 satellite and recorded 16 halogen-containing gases, which provide the data for studying ozone chemistry and dynamic processes in the stratosphere and upper troposphere (Bernath, 2002; Boone et al., 2004; Bernath, 2017). The ACE-FTS is a high-resolution (0.02 cm−1) spectrometer with a spectral range of 750–4400 cm−1, which operates in the solar occultation mode, and continuously collects infrared solar spectra from 150 km altitude down to the cloud top (Mahieu et al., 2008). ACE-FTS observations cover almost the whole world, but the main observing target is not China. ACE is mainly aimed at studying the ozone chemical process at high latitude, so there are a few observations for tropical and subtropical areas. We choose the satellite data centered at the Hefei site with a latitude of and longitude of (27–37∘ N, 107–127∘ E). In this study, we use the v4.1/v4.2 Level 2 ACE data. The observation period is from 2017 to 2020 for CFC-11 and from 2015 to 2020 for CFC-12. The method of Brown et al. (2011) was adopted to eliminate the points deviating from the 2.5 times median absolute deviations (MADs) to filter the outliers. The a priori profile and vertical sensitivity of ACE-FTS and ground-based FTIR are different, so it is difficult to directly compare the raw profiles observed from ACE-FTS with FTIR data. In order to compare the two types of data, we interpolated the profiles of ACE-FTS to the FTIR vertical grid and smoothed the interpolated data by the FTIR averaging kernel and a priori profile using the method of Rodgers and Connor (2003), that is
where xa and A are the a priori profile and averaging kernel of FTIR observations, respectively, xsat is the satellite profile after interpolation, and xsmooth is the smoothed profile of the satellite. The profile obtained from satellite and the ground-based FTIR are shown in Fig. 6. The vertical VMR (volume mixing ratio) profiles of CFC-11 measured by ground-based FTIR are slightly larger than ACE-FTS VMR profiles below 30.5 km. The measured CFC-12 profiles by FTIR are slightly smaller than ACE-FTS profiles below 20.5 km. The relative difference in ACE and FTIR data is calculated by the concentration observed by satellite minus FTIR data divided by FTIR data at the same altitude. The mean relative difference between the two types of data is % and 4.8±0.9 % for CFC-11 and CFC-12 profiles from 5.5 to 17.5 km, respectively. The results demonstrate our FTIR data agree relatively well with the ACE-FTS satellite data.
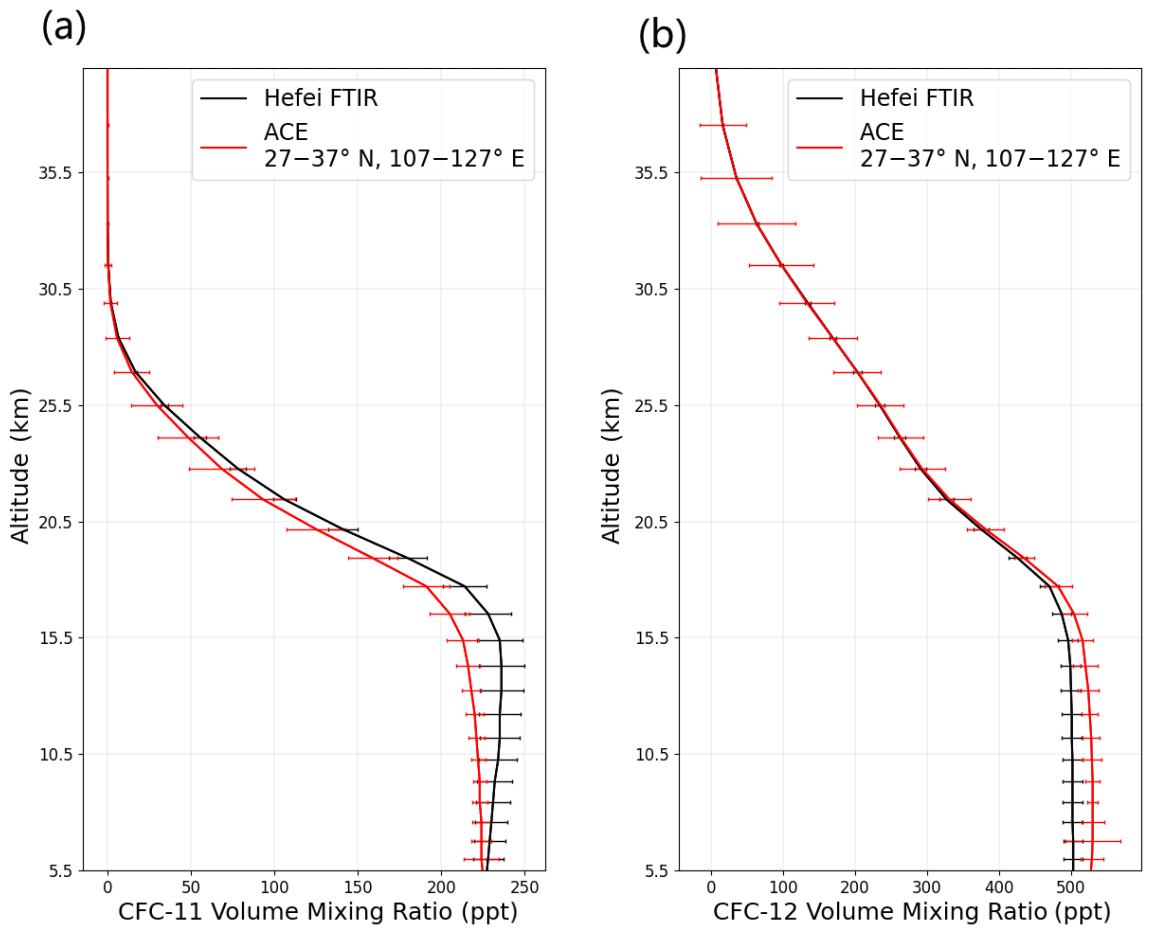
Figure 6The vertical profile of (a) CFC-11 and (b) CFC-12 obtained from ground-based FTIR (black) and ACE-FTS satellite (red) measurements. The error bars are the standard deviations of the mixing ratio profile for CFC-11 and CFC-12 at each layer.
The spatial range of satellite data selected is wide, the observation time is not the same as FTIR observations, and the a priori profiles of satellite and FTIR data are different, leading to the difference between ACE-FTS and FTIR data. Mahieu et al. (2008) compared the profiles retrieved from the balloon-borne FTIR spectrometer Mark-IV (MkIV) with ACE-FTS data and found that the VMR concentrations of ACE-FTS were systematically smaller than MkIV values for CFC-11, with a difference of −10 % above 12 km and about −20 % below 12 km, while for CFC-12, ACE-FTS VMR concentrations are systematically lower than MkIV values, with maximum differences of −10 %.
The retrieved profiles of CFC-11 for ACE-FTS are mainly at 5–23 km, and CFC-11 and CFC-12 are mainly distributed below 20 km. So we refer to the study of Steffen et al. (2019) and calculate Xgas of CFC-11 and CFC-12 at 5.5–17.5 km. The dry-air averaged mole fraction (Xgas) of the target gas from ACE-FTS and FTIR is calculated as follows:
where columnG and columndry air are columns obtained from target gas and dry air, respectively. and are the molecular mass of dry air and water vapor. Ps is the surface pressure, and gair is the average gravitational acceleration.
The dry-air averaged mole fractions of CFC-11 and CFC-12 obtained from the ACE-FTS satellite are 221±4 and 527±13 ppt, respectively, while the column-averaged dry-air mole fractions from FTIR observation are 232±11 and 501±14 ppt, respectively. Yang et al. (2021) reported that the concentrations of CFC-11 and CFC-12 from in situ measurements at the top of Mount Tai in northern China from 2017 to 2018 were 257 and 577 ppt, respectively. The surface mean mixing ratio of CFC-11 in five cities in China (Beijing, Hangzhou, Guangzhou, Lanzhou, and Chengdu) observed from 2017 to 2019 was in the range of 244 to 268 ppt, and that of CFC-12 ranged from 526 to 585 ppt during 2015 to 2019 (Yi et al., 2021). Benish et al. (2021) found concentrations of 281±44 ppt for CFC-11 and 552±93 ppt for CFC-12 from aircraft observations at 500–3500 m above Hebei Province, China, in 2016. The reported values observed from different locations in China are similar to the dry-air averaged mole fraction of CFC-11 and CFC-12 measured at Hefei, which reflects the reliability of our results. On the other hand, the lower concentrations of CFC-11 and CFC-12 may be due to the smaller emissions at Hefei.
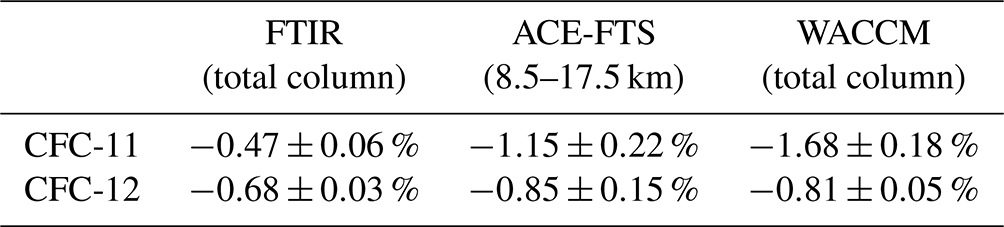
Table 5 lists the annual decreasing rate of CFC-11 and CFC-12 at the Hefei site calculated from ground-based FTIR data, ACE-FTS satellite data, and the data from WACCM V6. WACCM V6 data are available from the website ftp://nitrogen.acom.ucar.edu/user/jamesw/IRWG/2013/WACCM/V6/ (last access: 20 January 2022), and the simulated data consider the Hefei site (31.9∘ N, 117.17∘ E) as the center, with a horizontal resolution of . The annual decreasing rate of CFC-11 obtained from FTIR total columns, ACE-FTS, and WACCM is %, %, and % yr−1, respectively. The decreasing trend of CFC-11 obtained from ACE-FTS and WACCM is significantly higher. The annual decreasing rate of CFC-12 from FTIR total columns, ACE-FTS, and WACCM data is %, %, and % yr−1, respectively. The three independent values are close. The wide observation range of ACE-FTS and few matching data for Hefei observations lead to low representativeness of the annual decreasing rate for ACE-FTS data. Polyakov et al. (2021) also found that the decreasing trend of FTIR data is different from ACE-FTS data and WACCM data, and the difference in CFC-11 is greater than that of CFC-12.
Table 5Summary of annual decreasing rate obtained from measurements of FTIR, ACE-FTS satellite, and WACCM data.
3.3 Comparison with data from other FTIR sites
Further, we compared our data with those from other NDACC-IRWG stations. NDACC is an international global atmospheric observation network, which operates a variety of high-precision ground-based observation technologies and provides long-term observations of a variety of atmospheric components (De Mazière et al., 2018). The ground-based high-resolution FTIR data at the St. Petersburg station are obtained from the NDACC database (https://www-air.larc.nasa.gov/missions/ndacc/data.html/, last access: 2 March 2022), and the ground-based high-resolution FTIR data at the Jungfraujoch and Réunion stations are provided by their respective researchers. The sites and data information are listed in Table 6.
Table 6Four FTIR stations and data information, including longitude, latitude, altitude, and observing period.
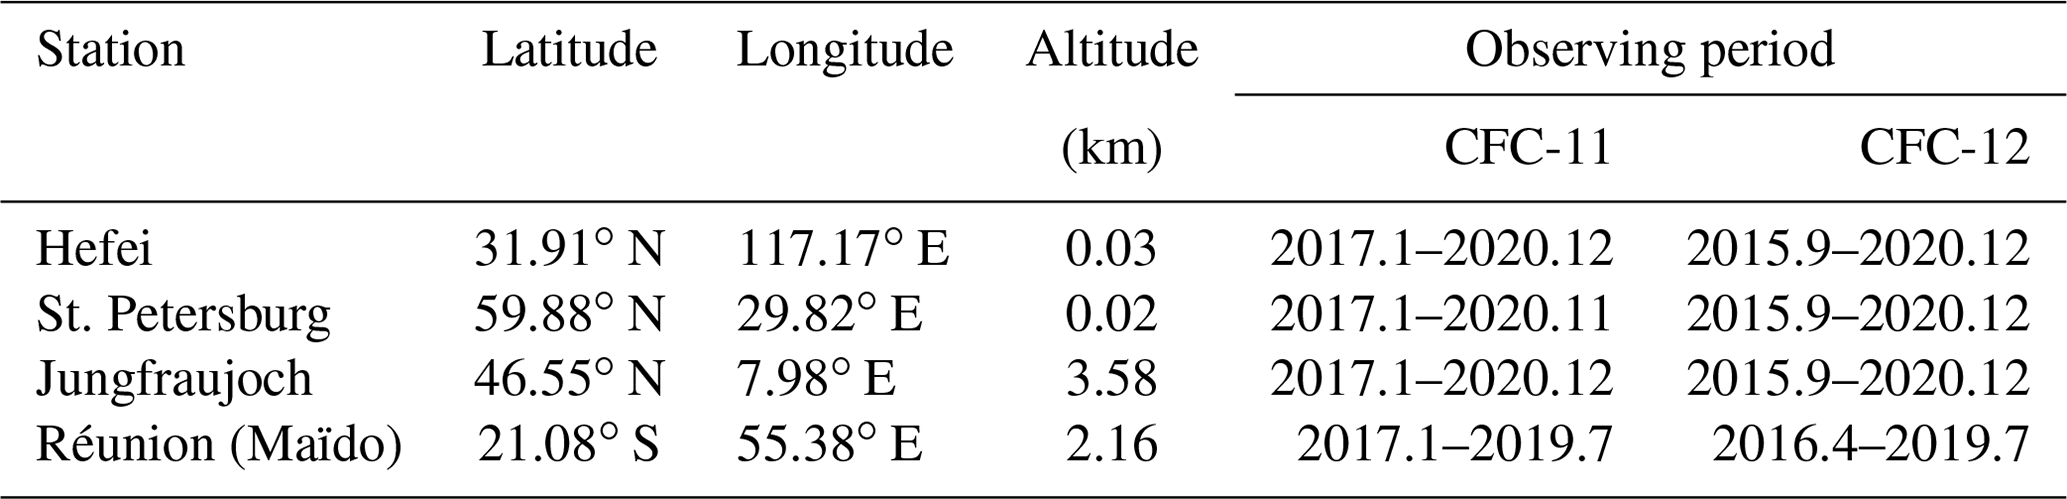
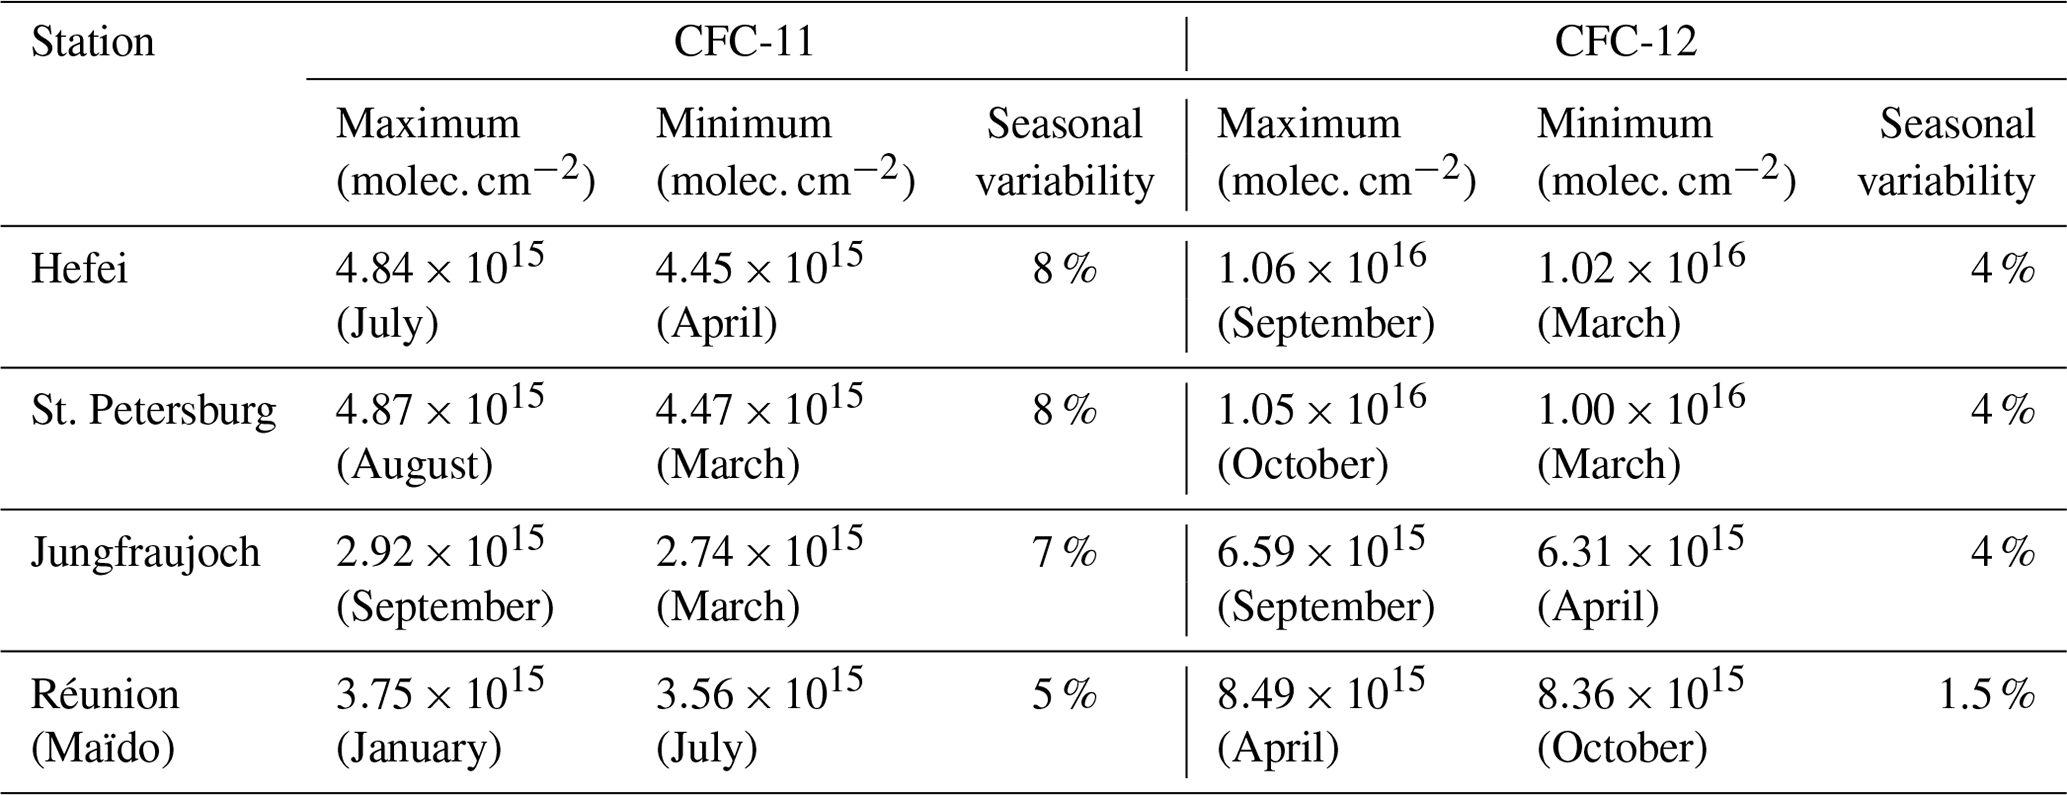
Hefei, St. Petersburg, and Jungfraujoch stations are located in the Northern Hemisphere, while Réunion (Maïdo) station is located in the Southern Hemisphere. Figure 7 shows the monthly means of CFC-11 and CFC-12 total columns at the four FTIR stations. Both monthly means of CFC-11 and CFC-12 total columns are very close for the Hefei and St. Petersburg stations. Also, the total columns at the Hefei and St. Petersburg stations are significantly higher than those of Jungfraujoch and Réunion stations, which may be due to the low altitude of the Hefei and St. Petersburg stations and their proximity to large cities. China and Russia have a large number of CFC-11 and CFC-12 reserves (Hurst et al., 2004). St. Petersburg is close to the industrially developed European part of Russia, and Hefei is located in the Yangtze River Delta of China, subject to relatively high urban and industrial emissions. The Jungfraujoch station is located at the high elevation of the Swiss Alps, and the Réunion station is located on an island in the western Indian Ocean, so the anthropogenic emissions have little impact on the two stations. Figure 8 is comparison of the detrended total columns of CFC-11 and CFC-12 at the four FTIR stations. In Fig. 8, it can be seen that the CFC-11 and CFC-12 total columns of the four stations reach a high amplitude in local summer or autumn and a low amplitude in local spring or winter. Table 7 summarizes the differences between the maximum and minimum monthly means and the seasonal variability of CFC-11 and CFC-12 at each FTIR station. For the four stations, CFC-11 has a higher seasonal variability than CFC-12. The three stations of Hefei, St Petersburg, and Jungfraujoch located in the Northern Hemisphere have very similar seasonal variability, and the seasonal variability is significantly higher than that of Réunion station located in the Southern Hemisphere.

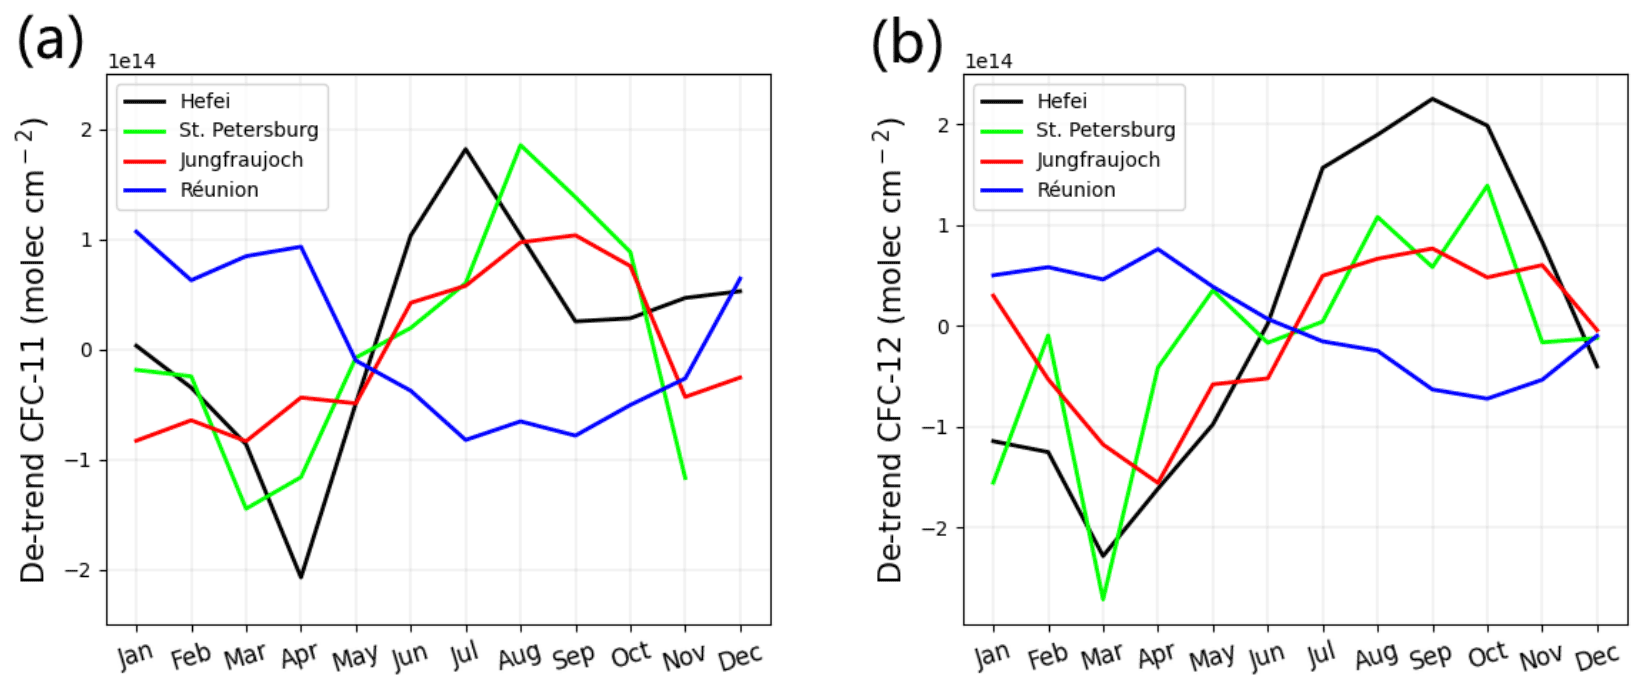
Table 7The maximum and minimum monthly means and seasonal variability of CFC-11 and CFC-12 at the four FTIR stations.
Tegtmeier et al. (2016) also found that CFCs are at a minimum in late winter/early spring and at a maximum in late summer from MIPAS and HIRDLS data at high latitudes, and this seasonality may be related to the descent of aged air caused by the Brewer–Dobson circulation. At the same time, high latitudes are affected by the winter polar vortex, leading to the gradual decline in atmospheric CFC concentration since autumn. After March, the final vortex breakup and the atmospheric CFC concentration begin to increase gradually. In summer, the Brewer–Dobson circulation causes the young tropical air to flood the extratropical lower stratosphere, and higher concentrations of CFCs from developing regions in Asia such as China are also transported to the Asian monsoon anticyclone and then to high latitudes in autumn (Chirkov et al., 2016). Prignon et al. (2019) calculated the ERA mid-term reanalysis and found that, for the lower stratosphere of the Jungfraujoch site latitude band, the mean age of air is older in spring and winter and younger in summer and autumn. Réunion has lower seasonal variation, which may be due to the fact that the lower-latitude site is less modulated by polar processes and the weaker wave breaking and the stronger polar vortex over Antarctica inhibit aged air downwelling in the Southern Hemisphere (Nevison et al., 2004).
In this study, the atmospheric CFC-11 and CFC-12 total columns are retrieved from ground-based FTIR measurements over Hefei, China, during January 2017 to December 2020 and September 2015 to December 2020, respectively. The seasonal variation and annual trend of the two gases are analyzed, and then the data are compared with other independent datasets, such as satellite data, model simulations, and other NDACC-IRWG stations. This is one of the few reports about the detection of CFC-11 and CFC-12 columns and their temporal–spatial variations in China.
Tikhonov L1 regularization was applied to constrain the retrieved profile in the retrieval strategy. Atmospheric CFC-11 and CFC-12 are mainly distributed within 0–20 km vertical atmosphere. The total retrieval error is 4.12 % for CFC-11 and 1.79 % for CFC-12. CFC-11 and CFC-12 total columns over Hefei showed a decreasing rate of % yr−1 and % yr−1, respectively. CFC-11 total columns are higher in summer, and CFC-12 total columns are higher in summer and autumn. Both CFC-11 and CFC-12 total columns are lower in spring. The seasonal amplitude between the maximum value of CFC-11 in July and the minimum value in April is 3.89×10¹⁴ molec. cm−2, while CFC-12 has the peak in September and the minimum in March, with a difference of 4.53×10¹⁴ molec. cm−2. Further, we compared FTIR data with the ACE-FTS satellite and WACCM data as well as the data from other NDACC-IRWG stations. The dry-air averaged mole fractions of CFC-11 and CFC-12 calculated from an altitude of 5.5 to 17.5 km for ACE-FTS satellite data are 221±4 and 527±13 ppt, while the column-averaged dry-air mole fractions from FTIR observations are 232±11 and 501±14 ppt, respectively. The mean relative difference between the FTIR and ACE-FTS concentrations at an altitude of 5.5 to 17.5 km is % and 4.8±0.9 % for CFC-11 and CFC-12, respectively. The results demonstrate our FTIR data agree relatively well with the ACE-FTS satellite data. Then the interannual variations from ground-based FTIR measurements, ACE-FTS observations, and WACCM V6 data for CFC-11 and CFC-12 were compared. The annual decreasing rate of CFC-11 measured from ACE-FTS and calculated by WACCM V6 is % yr−1 and % yr−1, respectively. The decreasing trend of ACE-FTS and WACCM is significantly higher, while the corresponding value of FTIR total columns is % yr−1. The annual decreasing rate of CFC-12 from ACE-FTS and WACCM V6 is % yr−1 and % yr−1, respectively, values which are close to the corresponding value of % yr−1 from the FTIR total-column measurements.
We compared the monthly means of CFC-11 and CFC-12 total columns at Hefei with those at the St Petersburg, Jungfraujoch, and Réunion (Maïdo) NDACC-IRWG stations. The total columns of CFC-11 and CFC-12 at the Hefei and St. Petersburg stations are significantly higher than those of the Jungfraujoch and Réunion stations, due to the first two stations' low elevation and their proximity to industrial areas. The CFC-11 and CFC-12 total columns of the four stations reach high values in summer or autumn and low values in spring or winter. The seasonal variability of the three stations in the Northern Hemisphere, Hefei, St. Petersburg, and Jungfraujoch, is higher than that at the Réunion station in the Southern Hemisphere. The seasonal cycle of CFC-11 and CFC-12 and the difference between the northern and southern hemispheres may be related to the Brewer–Dobson circulation and the winter polar vortex.
The FTIR CFC-11 and CFC-12 data at Hefei are available by contacting the corresponding author. We will continue to update the data and upload them to the NDACC database after joining NDACC-IRWG. ACE-FTS data are publicly available via https://databace.scisat.ca/level2/ (last access: 25 January 2022; Boone et al., 2020, https://doi.org/10.1016/j.jqsrt.2020.106939). WACCM V6 data are available from the website ftp://nitrogen.acom.ucar.edu/user/jamesw/IRWG/2013/WACCM/V6/ (last access: 20 January 2022; IRWG-NDACC, 2022). The FTIR CFC-11 and CFC-12 retrievals at the St. Petersburg site are available from https://www-air.larc.nasa.gov/missions/ndacc/data.html/ (last access: 2 March 2022). Réunion data and Jungfraujoch data are available by contacting Minqiang Zhou and Emmanuel Mahieu, respectively.
XZ retrieved the data and wrote the paper. WW and CS designed the experiment and revised the paper. CL and YX contributed to the discussion of the paper and explanation of the results. PW and QZ took part in FTIR measurements. AP provided retrieval guidance and St. Petersburg data. MZ and MDM provided Réunion data. EM, IPC, and JM provided Jungfraujoch data.
At least one of the (co-)authors is a member of the editorial board of Atmospheric Measurement Techniques. The peer-review process was guided by an independent editor, and the authors also have no other competing interests to declare.
Publisher’s note: Copernicus Publications remains neutral with regard to jurisdictional claims in published maps and institutional affiliations.
We gratefully acknowledge Nicholas Jones, School of chemistry, Wollongong University, Australia, for guidance on ground-based spectra retrieval. Thanks to the Canadian Space Agency for funding the ACE mission. Thanks to James W. Hannigan (National Center for Atmospheric Research) for providing the WACCM model data. We sincerely thank the workers at each station. The FTIR site at Réunion is operated by the BIRA-IASB and locally supported by LACy/UMR8105, Université de La Réunion.
The ULiège contribution to this work has been supported by the Fonds de la Recherche Scientifique (F.R.S. – FNRS, Brussels, Belgium), the GAW-CH program of MeteoSwiss (Zürich, CH) and the University of Liège. Emmanuel Mahieu is a senior research associate with F.R.S. – FNRS. The ULiège team thanks the International Foundation High Altitude Research Stations Jungfraujoch and Gornergrat (HFSJG, Bern, CH) for supporting the facilities needed to perform the Fourier transform infrared observations at Jungfraujoch.
This research has been supported by the National Key Technology R&D Program of China (grant no. 2019YFC0214702), the National Natural Science Foundation of China (grant no. 41775025), the Major Projects of High Resolution Earth Observation Systems of National Science and Technology (grant no. 05-Y30B01-9001-19/20-3), the Strategic Priority Research Program of the Chinese Academy of Sciences (grant no. XDA23020301), the National Key Project for Causes and Control of Heavy Air Pollution (grant nos. DQGG0102 and DQGG0205), the Natural Science Foundation of Guangdong Province (grant no. 2016A030310115), the State Environmental Protection Key Laboratory of Sources and Control of Air Pollution Complex (grant no. SCAPC202110), the Fonds de la Recherche Scientifique (F.R.S. – FNRS, Brussels, Belgium; grant no. J.0126.21), the GAW-CH program of MeteoSwiss (Zürich, CH), and the University of Liège.
This paper was edited by Sandip Dhomse and reviewed by two anonymous referees.
Benish, S. E., Salawitch, R. J., Ren, X., He, H., and Dickerson, R. R.: Airborne Observations of CFCs Over Hebei Province, China in Spring 2016, J. Geophys. Res.-Atmos., 126, e2021JD035152, https://doi.org/10.1029/2021jd035152, 2021.
Bernath, P. F.: Atmospheric Chemistry Experiment (ACE): An overview, Conference on Earth Observing Systems VII, Seattle, WA, 7–10 July 2002, WOS:000179201500006, 39–49, https://doi.org/10.1117/12.451546, 2002.
Bernath, P. F.: The Atmospheric Chemistry Experiment (ACE), J. Quant. Spectrosc. Ra., 186, 3–16, https://doi.org/10.1016/j.jqsrt.2016.04.006, 2017.
Boone, C. D., Walker, K. A., McLeod, S. D., Nassar, R., and Bernath, P. F.: Atmospheric Chemistry Experiment (ACE): Mission overview and early results, Conference on Chemical and Biological Standoff Detection II, Philadelphia, PA, 27–28 October 2004, WOS:000226254200026, 230–240, https://doi.org/10.1117/12.579945, 2004.
Boone, C. D., Bernard, P. F., Cok, D., Jones, S. C., and Steffen, J.: Version 4 retrievals for the atmospheric chemistry experience Fourier transform spectrometer (ACE-FTS) and images, J. Quant. Spectrosc. Ra., 247, 106939, https://doi.org/10.1016/j.jqsrt.2020.106939, 2020 (data available at: https://databace.scisat.ca/level2/, last access: 25 January 2022).
Brown, A. T., Chipperfield, M. P., Boone, C., Wilson, C., Walker, K. A., and Bernath, P. F.: Trends in atmospheric halogen containing gases since 2004, J. Quant. Spectrosc. Ra., 112, 2552–2566, https://doi.org/10.1016/j.jqsrt.2011.07.005, 2011.
Chen, X., Huang, X., and Strow, L. L.: Near-Global CFC-11 Trends as Observed by Atmospheric Infrared Sounder From 2003 to 2018, J. Geophys. Res.-Atmos., 125, e2020JD033051, https://doi.org/10.1029/2020JD033051, 2020.
Chirkov, M., Stiller, G. P., Laeng, A., Kellmann, S., von Clarmann, T., Boone, C. D., Elkins, J. W., Engel, A., Glatthor, N., Grabowski, U., Harth, C. M., Kiefer, M., Kolonjari, F., Krummel, P. B., Linden, A., Lunder, C. R., Miller, B. R., Montzka, S. A., Mühle, J., O'Doherty, S., Orphal, J., Prinn, R. G., Toon, G., Vollmer, M. K., Walker, K. A., Weiss, R. F., Wiegele, A., and Young, D.: Global HCFC-22 measurements with MIPAS: retrieval, validation, global distribution and its evolution over 2005–2012, Atmos. Chem. Phys., 16, 3345–3368, https://doi.org/10.5194/acp-16-3345-2016, 2016.
De Mazière, M., Thompson, A. M., Kurylo, M. J., Wild, J. D., Bernhard, G., Blumenstock, T., Braathen, G. O., Hannigan, J. W., Lambert, J.-C., Leblanc, T., McGee, T. J., Nedoluha, G., Petropavlovskikh, I., Seckmeyer, G., Simon, P. C., Steinbrecht, W., and Strahan, S. E.: The Network for the Detection of Atmospheric Composition Change (NDACC): history, status and perspectives, Atmos. Chem. Phys., 18, 4935–4964, https://doi.org/10.5194/acp-18-4935-2018, 2018.
Eckert, E., Laeng, A., Lossow, S., Kellmann, S., Stiller, G., von Clarmann, T., Glatthor, N., Höpfner, M., Kiefer, M., Oelhaf, H., Orphal, J., Funke, B., Grabowski, U., Haenel, F., Linden, A., Wetzel, G., Woiwode, W., Bernath, P. F., Boone, C., Dutton, G. S., Elkins, J. W., Engel, A., Gille, J. C., Kolonjari, F., Sugita, T., Toon, G. C., and Walker, K. A.: MIPAS IMK/IAA CFC-11 (CCl3F) and CFC-12 (CCl2F2) measurements: accuracy, precision and long-term stability, Atmos. Meas. Tech., 9, 3355–3389, https://doi.org/10.5194/amt-9-3355-2016, 2016.
Fang, X., Ravishankara, A. R., Velders, G. J. M., Molina, M. J., Su, S., Zhang, J., Hu, J., and Prinn, R. G.: Changes in Emissions of Ozone-Depleting Substances from China Due to Implementation of the Montreal Protocol, Environ. Sci. Technol., 52, 11359–11366 https://doi.org/10.1021/acs.est.8b01280, 2018.
Garkusha, A. S., Polyakov, A. V., and Timofeyev, Y. M.: Analysis of Capabilities for Satellite Monitoring of Atmospheric Gaseous Composition Using IRFS-2 Instrument, Izvestiya Atmospheric and Oceanic Physics, 53, 1016–1018, https://doi.org/10.1134/S0001433817090377, 2017.
Godin-Beekmann, S.: International Multi-Instruments Ground-Based Networks: Recent Developments Within the Network for the Detection of Atmospheric Composition Changes, Twenty Years of Ozone Decline, Dordrecht, 135–156, https://doi.org/10.1007/978-90-481-2469-5_10, 2009.
Hoffmann, L., Hoppe, C. M., Müller, R., Dutton, G. S., Gille, J. C., Griessbach, S., Jones, A., Meyer, C. I., Spang, R., Volk, C. M., and Walker, K. A.: Stratospheric lifetime ratio of CFC-11 and CFC-12 from satellite and model climatologies, Atmos. Chem. Phys., 14, 12479–12497, https://doi.org/10.5194/acp-14-12479-2014, 2014.
Hurst, D. F., Romashkin, P. A., Elkins, J. W., Oberlander, E. A., Elansky, N. F., Belikov, I. B., Granberg, I. G., Golitsyn, G. S., Grisenko, A. M., Brenninkmeijer, C. A. M., and Crutzen, P. J.: Emissions of ozone-depleting substances in Russia during 2001, J. Geophys. Res., 109, D14303, https://doi.org/10.1029/2004jd004633, 2004.
IRWG-NDACC: WACCM V.6 profiles dataset for IRWG sites, NDACC Infrared Working Group [data set], ftp://nitrogen.acom.ucar.edu/user/jamesw/IRWG/2013/WACCM/V6, last access: 20 January 2022.
Johansson, S., Woiwode, W., Höpfner, M., Friedl-Vallon, F., Kleinert, A., Kretschmer, E., Latzko, T., Orphal, J., Preusse, P., Ungermann, J., Santee, M. L., Jurkat-Witschas, T., Marsing, A., Voigt, C., Giez, A., Krämer, M., Rolf, C., Zahn, A., Engel, A., Sinnhuber, B.-M., and Oelhaf, H.: Airborne limb-imaging measurements of temperature, HNO3, O3, ClONO2, H2O and CFC-12 during the Arctic winter 2015/2016: characterization, in situ validation and comparison to Aura/MLS, Atmos. Meas. Tech., 11, 4737–4756, https://doi.org/10.5194/amt-11-4737-2018, 2018.
Kalnay, E., Kanamitsu, M., Kistler, R., Collins, W., Deaven, D., Gandin, L., Iredell, M., Saha, S., White, G., Woollen, J., Zhu, Y., Chelliah, M., Ebisuzaki, W., Higgins, W., Janowiak, J., Mo, K. C., Ropelewski, C., Wang, J., Leetmaa, A., Reynolds, R., Jenne, R., and Joseph, D.: The NCEP/NCAR 40-year reanalysis project, B. Am. Meteorol. Soc., 77, 437–471, https://doi.org/10.1175/1520-0477(1996)077<0437:Tnyrp>2.0.Co;2, 1996.
Kellmann, S., von Clarmann, T., Stiller, G. P., Eckert, E., Glatthor, N., Höpfner, M., Kiefer, M., Orphal, J., Funke, B., Grabowski, U., Linden, A., Dutton, G. S., and Elkins, J. W.: Global CFC-11 (CCl3F) and CFC-12 (CCl2F2) measurements with the Michelson Interferometer for Passive Atmospheric Sounding (MIPAS): retrieval, climatologies and trends, Atmos. Chem. Phys., 12, 11857–11875, https://doi.org/10.5194/acp-12-11857-2012, 2012.
Khosrawi, F., Muller, R., Irie, H., Engel, A., Toon, G. C., Sen, B., Aoki, S., Nakazawa, T., Traub, W. A., Jucks, K. W., Johnson, D. G., Oelhaf, H., Wetzel, G., Sugita, T., Kanzawa, H., Yokota, T., Nakajima, H., and Sasano, Y.: Validation of CFC-12 measurements from the Improved Limb Atmospheric Spectrometer (ILAS) with the version 6.0 retrieval algorithm, J. Geophys. Res.-Atmos., 109, D06311, https://doi.org/10.1029/2003jd004325, 2004.
Lickley, M., Fletcher, S., Rigby, M., and Solomon, S.: Joint inference of CFC lifetimes and banks suggests previously unidentified emissions, Nat. Commun., 12, 2920, https://doi.org/10.1038/s41467-021-23229-2, 2021.
Lin, Y. J., Gong, D. C., Lv, S. J., Ding, Y. Z., Wu, G. C., Wang, H., Li, Y. L., Wang, Y. J., Zhou, L., and Wang, B. G.: Observations of High Levels of Ozone-Depleting CFC-11 at a Remote Mountain-Top Site in Southern China, Environ. Sci. Tech. Let., 6, 114–118, https://doi.org/10.1021/acs.estlett.9b00022, 2019.
Mahieu, E., Duchatelet, P., Demoulin, P., Walker, K. A., Dupuy, E., Froidevaux, L., Randall, C., Catoire, V., Strong, K., Boone, C. D., Bernath, P. F., Blavier, J.-F., Blumenstock, T., Coffey, M., De Mazière, M., Griffith, D., Hannigan, J., Hase, F., Jones, N., Jucks, K. W., Kagawa, A., Kasai, Y., Mebarki, Y., Mikuteit, S., Nassar, R., Notholt, J., Rinsland, C. P., Robert, C., Schrems, O., Senten, C., Smale, D., Taylor, J., Tétard, C., Toon, G. C., Warneke, T., Wood, S. W., Zander, R., and Servais, C.: Validation of ACE-FTS v2.2 measurements of HCl, HF, CCl3F and CCl2F2 using space-, balloon- and ground-based instrument observations, Atmos. Chem. Phys., 8, 6199–6221, https://doi.org/10.5194/acp-8-6199-2008, 2008.
Mahieu, E., Rinsland, C. P., Gardiner, T., Zander, R., Demoulin, P., Chipperfield, M. P., Ruhnke, R., Chiou, L. S., and De Mazière, M.: Recent trends of inorganic chlorine and halogenated source gases above the Jungfraujoch and Kitt Peak stations derived from high-resolution FTIR solar observations, EGU General Assembly, Vienna, Austria, 2–7 May 2010, EGU2010-2420-3, 2010.
Mahieu, E., Bader, W., and Franco, B.: Recent results derived from 80 regular ground-based FTIR observations at the Jungfraujoch and other NDACC stations, ACE Science Team Meeting, Waterloo, Canada, 20–21 May 2015, https://hdl.handle.net/2268/181923 (last access: 20 June 2022), 2015.
McCulloch, A., Midgley, P. M., and Ashford, P.: Releases of refrigerant gases (CFC-12, HCFC-22 and HFC-134a) to the atmosphere, Atmos. Environ., 37, 889–902, https://doi.org/10.1016/s1352-2310(02)00975-5, 2003.
Molina, M., Zaelke, D., Sarma, K. M., Andersen, S. O., Ramanathan, V., and Kaniaru, D.: Reducing abrupt climate change risk using the Montreal Protocol and other regulatory actions to complement cuts in CO2 emissions, P. Natl. Acad. Sci. USA, 106, 20616–20621, https://doi.org/10.1073/pnas.0902568106, 2009.
Molina, M. J. and Rowland, F. S.: Stratospheric Sink for Chlorofluoromethanes – Chlorine Atomic-Catalysed Destruction of ozone, Nature, 249, 810–812, https://doi.org/10.1038/249810a0, 1974.
Montzka, S. A., Dutton, G. S., Yu, P., Ray, E., Portmann, R. W., Daniel, J. S., Kuijpers, L., Hall, B. D., Mondeel, D., Siso, C., Nance, D., Rigby, M., Manning, A. J., Hu, L., Moore, F., Miller, B. R., and Elkins, J. W.: An unexpected and persistent increase in global emissions of ozone-depleting CFC-11, Nature, 557, 413–417, https://doi.org/10.1038/s41586-018-0106-2, 2018.
Montzka, S. A., Dutton, G. S., Portmann, R. W., Chipperfield, M. P., Davis, S., Feng, W., Manning, A. J., Ray, E., Rigby, M., Hall, B. D., Siso, C., Nance, J. D., Krummel, P. B., Muhle, J., Young, D., O'Doherty, S., Salameh, P. K., Harth, C. M., Prinn, R. G., Weiss, R. F., Elkins, J. W., Walter-Terrinoni, H., and Theodoridi, C.: A decline in global CFC-11 emissions during 2018–2019, Nature, 590, 428–432, https://doi.org/10.1038/s41586-021-03260-5, 2021.
NDACC (Network for the Detection of Atmospheric Composition Change): FTIR, NDACC Public Data Archive [data set], https://www-air.larc.nasa.gov/missions/ndacc/data.html, last access: 2 March 2022.
Nevison, C. D., Kinnison, D. E., and Weiss, R. F.: Stratospheric influences on the tropospheric seasonal cycles of nitrous oxide and chlorofluorocarbons, Geophys. Res. Lett., 31, L20103, https://doi.org/10.1029/2004GL020398, 2004.
Notholt, J.: FTIR Measurements of HF, N2O and CFCs during the Arctic Polar Night with the Moon as Light-Source, Subsidence during winter 1992/93, Geophys. Res. Lett., 21, 2385–2388, https://doi.org/10.1029/94GL02351, 1994.
Oshchepkov, S., Sasano, Y., Yokota, T., Nakajima, H., Uemura, N., Saitoh, N., Sugita, T., and Matsuda, H.: ILAS data processing for stratospheric gas and aerosol retrievals with aerosol physical modeling: Methodology and validation of gas retrievals, J. Geophys. Res.-Atmos., 111, D02307, https://doi.org/10.1029/2005jd006543, 2006.
Pardo Cantos, I., Mahieu, E., Chipperfield, M. P., Smale, D., Hannigan, J. W., Friedrich, M., Fraser, P., Krummel, P., Prignon, M., Makkor, J., Servais, C., and Robinson, J.: Determination and analysis of time series of CFC-11 (CCl3F) from FTIR solar spectra, in situ observations, and model data in the past 20 years above Jungfraujoch (46∘ N), Lauder (45∘ S), and Cape Grim (40∘ S) stations, Environ. Sci.: Atmos., online first, https://doi.org/10.1039/D2EA00060A, 2022.
Park, S., Western, L. M., Saito, T., Redington, A. L., Henne, S., Fang, X., Prinn, R. G., Manning, A. J., Montzka, S. A., Fraser, P. J., Ganesan, A. L., Harth, C. M., Kim, J., Krummel, P. B., Liang, Q., Muhle, J., O'Doherty, S., Park, H., Park, M.-K., Reimann, S., Salameh, P. K., Weiss, R. F., and Rigby, M.: A decline in emissions of CFC-11 and related chemicals from eastern China, Nature, 590, 433–437, https://doi.org/10.1038/s41586-021-03277-w, 2021.
Polyakov, A., Poberovsky, A., Makarova, M., Virolainen, Y., Timofeyev, Y., and Nikulina, A.: Measurements of CFC-11, CFC-12, and HCFC-22 total columns in the atmosphere at the St. Petersburg site in 2009–2019, Atmos. Meas. Tech., 14, 5349–5368, https://doi.org/10.5194/amt-14-5349-2021, 2021.
Prignon, M., Chabrillat, S., Minganti, D., O'Doherty, S., Servais, C., Stiller, G., Toon, G. C., Vollmer, M. K., and Mahieu, E.: Improved FTIR retrieval strategy for HCFC-22 (CHClF2), comparisons with in situ and satellite datasets with the support of models, and determination of its long-term trend above Jungfraujoch, Atmos. Chem. Phys., 19, 12309–12324, https://doi.org/10.5194/acp-19-12309-2019, 2019.
Rigby, M., Prinn, R. G., O'Doherty, S., Montzka, S. A., McCulloch, A., Harth, C. M., Mühle, J., Salameh, P. K., Weiss, R. F., Young, D., Simmonds, P. G., Hall, B. D., Dutton, G. S., Nance, D., Mondeel, D. J., Elkins, J. W., Krummel, P. B., Steele, L. P., and Fraser, P. J.: Re-evaluation of the lifetimes of the major CFCs and CH3CCl3 using atmospheric trends, Atmos. Chem. Phys., 13, 2691–2702, https://doi.org/10.5194/acp-13-2691-2013, 2013.
Rigby, M., Park, S., Saito, T., Western, L. M., Redington, A. L., Fang, X., Henne, S., Manning, A. J., Prinn, R. G., Dutton, G. S., Fraser, P. J., Ganesan, A. L., Hall, B. D., Harth, C. M., Kim, J., Kim, K. R., Krummel, P. B., Lee, T., Li, S., Liang, Q., Lunt, M. F., Montzka, S. A., Muhle, J., O'Doherty, S., Park, M. K., Reimann, S., Salameh, P. K., Simmonds, P., Tunnicliffe, R. L., Weiss, R. F., Yokouchi, Y., and Young, D.: Increase in CFC-11 emissions from eastern China based on atmospheric observations, Nature, 569, 546–550, https://doi.org/10.1038/s41586-019-1193-4, 2019.
Rodgers, C. D.: Inverse methods for atmospheric sounding: theory and practice, Oceanic and Planetary Physics, Vol. 2, World scientific, Singapore, https://doi.org/10.1142/3171, 2000.
Rodgers, C. D. and Connor, B. J.: Intercomparison of remote sounding instruments, J. Geophys. Res.-Atmos., 108, 4116, https://doi.org/10.1029/2002jd002299, 2003.
Rothman, L. S., Gordon, I. E., Babikov, Y., Barbe, A., Benner, D. C., Bernath, P. F., Birk, M., Bizzocchi, L., Boudon, V., Brown, L. R., Campargue, A., Chance, K., Cohen, E. A., Coudert, L. H., Devi, V. M., Drouin, B. J., Fayt, A., Flaud, J. M., Gamache, R. R., Harrison, J. J., Hartmann, J. M., Hill, C., Hodges, J. T., Jacquemart, D., Jolly, A., Lamouroux, J., Le Roy, R. J., Li, G., Long, D. A., Lyulin, O. M., Mackie, C. J., Massie, S. T., Mikhailenko, S., Muller, H. S. P., Naumenko, O. V., Nikitin, A. V., Orphal, J., Perevalov, V., Perrin, A., Polovtseva, E. R., Richard, C., Smith, M. A. H., Starikova, E., Sung, K., Tashkun, S., Tennyson, J., Toon, G. C., Tyuterev, V. G., and Wagner, G.: The HITRAN2012 molecular spectroscopic database, J. Quant. Spectrosc. Ra., 130, 4–50, https://doi.org/10.1016/j.jqsrt.2013.07.002, 2013.
Shan, C. G., Wang, W., Liu, C., Guo, Y., Xie, Y., Sun, Y. W., Hu, Q. H., Zhang, H. F., Yin, H., and Jones, N.: Retrieval of vertical profiles and tropospheric CO2 columns based on high-resolution FTIR over Hefei, China, Opt. Express, 29, 4958–4977, https://doi.org/10.1364/oe.411383, 2021a.
Shan, C. G., Zhang, H. F., Wang, W., Liu, C., Xie, Y., Hu, Q. H., and Jones, N.: Retrieval of Stratospheric HNO3 and HCl Based on Ground-Based High-Resolution Fourier Transform Spectroscopy, Remote Sens., 13, 2159, https://doi.org/10.3390/rs13112159, 2021b.
Steck, T.: Methods for determining regularization for atmospheric retrieval problems, Appl. Optics, 41, 1788–1797, https://doi.org/10.1364/ao.41.001788, 2002.
Steffen, J., Bernath, P. F., and Boone, C. D.: Trends in halogen-containing molecules measured by the Atmospheric Chemistry Experiment (ACE) satellite, J. Quant. Spectrosc. Ra., 238, 106619, https://doi.org/10.1016/j.jqsrt.2019.106619, 2019.
Sussmann, R., Forster, F., Rettinger, M., and Jones, N.: Strategy for high-accuracy-and-precision retrieval of atmospheric methane from the mid-infrared FTIR network, Atmos. Meas. Tech., 4, 1943–1964, https://doi.org/10.5194/amt-4-1943-2011, 2011.
Tegtmeier, S., Hegglin, M. I., Anderson, J., Funke, B., Gille, J., Jones, A., Smith, L., von Clarmann, T., and Walker, K. A.: The SPARC Data Initiative: comparisons of CFC-11, CFC-12, HF and SF6 climatologies from international satellite limb sounders, Earth Syst. Sci. Data, 8, 61–78, https://doi.org/10.5194/essd-8-61-2016, 2016.
Tikhonov, A. N.: On the solution of incorrectly stated problems and a method of regularization, Dokl. Acad. Nauk SSSR, 151, 501–504, 1963.
Vigouroux, C., Hendrick, F., Stavrakou, T., Dils, B., De Smedt, I., Hermans, C., Merlaud, A., Scolas, F., Senten, C., Vanhaelewyn, G., Fally, S., Carleer, M., Metzger, J.-M., Müller, J.-F., Van Roozendael, M., and De Mazière, M.: Ground-based FTIR and MAX-DOAS observations of formaldehyde at Réunion Island and comparisons with satellite and model data, Atmos. Chem. Phys., 9, 9523–9544, https://doi.org/10.5194/acp-9-9523-2009, 2009.
Wan, D., Xu, J. H., Zhang, J. B., Tong, X. C., and Hu, J. X.: Historical and projected emissions of major halocarbons in China, Atmos. Environ., 43, 5822–5829, https://doi.org/10.1016/j.atmosenv.2009.07.052, 2009.
Wang, F., Zhang, J., Feng, J., and Liu, D.: Estimated historical and future emissions of CFC-11 and CFC-12 in China, Acta Scientiae Circumstantiae, 30, 1758–1765, 2010.
Wang, W., Tian, Y., Liu, C., Sun, Y., Liu, W., Xie, P., Liu, J., Xu, J., Morino, I., Velazco, V. A., Griffith, D. W. T., Notholt, J., and Warneke, T.: Investigating the performance of a greenhouse gas observatory in Hefei, China, Atmos. Meas. Tech., 10, 2627–2643, https://doi.org/10.5194/amt-10-2627-2017, 2017.
WMO (World Meteorological Organization): Scientific Assessment of Ozone Depletion: 2018, Global Ozone Research and Monitoring Project, Geneva, Switzerland, Report No. 58, 588 pp., 2018.
Woiwode, W., Oelhaf, H., Gulde, T., Piesch, C., Maucher, G., Ebersoldt, A., Keim, C., Höpfner, M., Khaykin, S., Ravegnani, F., Ulanovsky, A. E., Volk, C. M., Hösen, E., Dörnbrack, A., Ungermann, J., Kalicinsky, C., and Orphal, J.: MIPAS-STR measurements in the Arctic UTLS in winter/spring 2010: instrument characterization, retrieval and validation, Atmos. Meas. Tech., 5, 1205–1228, https://doi.org/10.5194/amt-5-1205-2012, 2012.
Woiwode, W., Sumińska-Ebersoldt, O., Oelhaf, H., Höpfner, M., Belyaev, G. V., Ebersoldt, A., Friedl-Vallon, F., Grooß, J.-U., Gulde, T., Kaufmann, M., Kleinert, A., Krämer, M., Kretschmer, E., Kulessa, T., Maucher, G., Neubert, T., Piesch, C., Preusse, P., Riese, M., Rongen, H., Sartorius, C., Schardt, G., Schönfeld, A., Schuettemeyer, D., Sha, M. K., Stroh, F., Ungermann, J., Volk, C. M., and Orphal, J.: Validation of first chemistry mode retrieval results from the new limb-imaging FTS GLORIA with correlative MIPAS-STR observations, Atmos. Meas. Tech., 8, 2509–2520, https://doi.org/10.5194/amt-8-2509-2015, 2015.
Wu, H. X., Chen, H., Wang, Y. T., Ding, A. J., and Chen, J. M.: The changing ambient mixing ratios of long-lived halocarbons under Montreal Protocol in China, J. Clean. Prod., 188, 774–785, https://doi.org/10.1016/j.jclepro.2018.03.159, 2018.
Yang, M. M., Yang, F. C., Li, H. L., Li, T., Cao, F. F., Nie, X. L., Zhen, J. B., Li, P. Y., and Wang, Y.: CFCs measurements at high altitudes in northern China during 2017-2018: Concentrations and potential emission source regions, Sci. Total Environ., 754, 142290, https://doi.org/10.1016/j.scitotenv.2020.142290, 2021.
Yi, L., Wu, J., An, M., Xu, W., Fang, X., Yao, B., Li, Y., Gao, D., Zhao, X., and Hu, J.: The atmospheric concentrations and emissions of major halocarbons in China during 2009–2019, Environ. Pollut., 284, 117190, https://doi.org/10.1016/j.envpol.2021.117190, 2021.
Yin, H., Sun, Y. W., Liu, C., Zhang, L., Lu, X., Wang, W., Shan, C. G., Hu, Q. H., Tian, Y., Zhang, C. X., Su, W. J., Zhang, H. F., Palm, M. A., Notholt, J., and Liu, J. G.: FTIR time series of stratospheric NO2 over Hefei, China, and comparisons with OMI and GEOS-Chem model data, Opt. Express, 27, A1225–A1240, https://doi.org/10.1364/OE.27.0A1225, 2019.
Yin, H., Sun, Y. W., Liu, C., Lu, X., Smale, D., Blumenstock, T., Nagahama, T., Wang, W., Tian, Y., Hu, Q. H., Shan, C. G., Zhang, H. F., and Liu, J. G.: Ground-based FTIR observation of hydrogen chloride (HCl) over Hefei, China, and comparisons with GEOS-Chem model data and other ground-based FTIR stations data, Opt. Express, 28, 8041–8055, https://doi.org/10.1364/oe.384377, 2020.
Zhang, F., Zhou, L. X., Yao, B., Zhang, X. C., Xu, L., Zhang, X. L., Zhou, H. G., Dong, F., and Zhou, L. Y.: In-situ measurement of atmospheric CFC-11 at the Shangdianzi Global Atmosphere Watch (GAW) Regional Station, Science China-Earth Sciences, 54, 298–304, https://doi.org/10.1007/s11430-010-4118-5, 2011.
Zhang, G., Yao, B., Vollmer, M. K., Montzka, S. A., Muhle, J., Weiss, R. F., O'Doherty, S., Li, Y., Fang, S. X., and Reimann, S.: Ambient mixing ratios of atmospheric halogenated compounds at five background stations in China, Atmos. Environ., 160, 55–69, https://doi.org/10.1016/j.atmosenv.2017.04.017, 2017.
Zhang, H. F., Wang, W., Liu, C., Shan, C. G., Hu, Q. H., Sun, Y. W., and Jones, N.: Detection of Temporal and Spatial Distributions of Atmospheric Nitric Acid Based on Ground-Based High-Resolution Solar Absorption Spectra, Acta Optica Sinica, 40, 23–33, https://doi.org/10.3788/aos202040.0201003, 2020.
Zhang, Y., Yang, W., Huang, Z., Liu, D., Simpson, I., Blake, D. R., George, C., and Wang, X.: Leakage Rates of Refrigerants CFC-12, HCFC-22, and HFC-134a from Operating Mobile Air Conditioning Systems in Guangzhou, China: Tests inside a Busy Urban Tunnel under Hot and Humid Weather Conditions, Environ. Sci. Tech. Let., 4, 481–486, https://doi.org/10.1021/acs.estlett.7b00445, 2017.
Zhen, J., Yang, M., Zhou, J., Yang, F., Li, T., Li, H., Cao, F., Nie, X., Li, P., and Wang, Y.: Monitoring Chlorofluorocarbons in Potential Source Regions in Eastern China, Atmosphere, 11, 1299, https://doi.org/10.3390/atmos11121299, 2020.
Zhou, M., Vigouroux, C., Langerock, B., Wang, P., Dutton, G., Hermans, C., Kumps, N., Metzger, J.-M., Toon, G., and De Mazière, M.: CFC-11, CFC-12 and HCFC-22 ground-based remote sensing FTIR measurements at Réunion Island and comparisons with MIPAS/ENVISAT data, Atmos. Meas. Tech., 9, 5621–5636, https://doi.org/10.5194/amt-9-5621-2016, 2016.