the Creative Commons Attribution 4.0 License.
the Creative Commons Attribution 4.0 License.
 | 12 Dec 2022
Mass spectrometry-based Aerosolomics: a new approach to resolve sources, composition, and partitioning of secondary organic aerosol
Franziska Bachmeier
Felix Leonard Gottwald
Mario Simon
Alexander Lucas Vogel
Particulate matter (PM) largely consists of secondary organic aerosol (SOA) that is formed via oxidation of biogenic and anthropogenic volatile organic compounds (VOCs). Unambiguous identification of SOA molecules and their assignment to their precursor vapors are challenges that have so far only succeeded for a few SOA marker compounds, which are now well characterized and (partly) available as authentic standards. In this work, we resolve the complex composition of SOA by means of a top-down approach based on the newly created Aerosolomics database, which is fed by non-target analysis results of filter samples from oxidation flow reactor experiments. We investigated the oxidation products from the five biogenic VOCs α-pinene, β-pinene, limonene, 3-carene, and trans-caryophyllene and from the four anthropogenic VOCs toluene, o-xylene, 1,2,4-trimethylbenzene, and naphthalene. Using ultrahigh-performance liquid chromatography coupled to a high-resolution (Orbitrap) mass spectrometer, we determine the molecular formula of 596 chromatographically separated compounds based on exact mass and isotopic pattern. We utilize retention time and fragmentation mass spectra as a basis for unambiguous attribution of the oxidation products to their parent VOCs. Based on the molecular-resolved application of the database, we are able to assign roughly half of the total signal of oxygenated hydrocarbons in ambient suburban PM2.5 to one of the nine studied VOCs. The application of the database enabled us to interpret the appearance of diurnal compound clusters that are formed by different oxidation processes. Furthermore, by performing a hierarchical cluster analysis (HCA) on the same set of filter samples, we identified compound clusters that depend on sulfur dioxide mixing ratio and temperature. This study demonstrates how Aerosolomics tools (database and HCA) applied to PM filter samples can improve our understanding of SOA sources, their formation pathways, and temperature-driven partitioning of SOA compounds.
- Article
(4609 KB) - Full-text XML
-
Supplement
(5578 KB) - BibTeX
- EndNote


Secondary organic aerosol (SOA) is a complex mixture forming through the oxidation of biogenic (BVOCs) and anthropogenic volatile organic compounds (AVOCs) in the atmosphere. Aerosol particles influence Earth's climate as well as human health (Hallquist et al., 2009; Shrivastava et al., 2017). Earlier work has shown that SOA makes up a large fraction of fine particulate matter (PM2.5, particles with an aerodynamic diameter less than 2.5 µm) (Jimenez et al., 2009; Huang et al., 2014; McDonald et al., 2018). Globally, the emissions of BVOCs are considerably higher than those of AVOCs, with 760–1150 compared to 140 TgC yr−1, respectively (Kari et al., 2019; Shrivastava et al., 2017; Sindelarova et al., 2014). BVOC emissions can mainly be distributed among isoprene (70 %), monoterpenes (11 %), methanol (6 %), and others (13 %) (Sindelarova et al., 2014). AVOCs and BVOCs are not only emitted by different sources but also have different SOA yields and result in different products with distinct properties. Furthermore, it is known that both organic and inorganic anthropogenic emissions can affect SOA formation from BVOCs (Kari et al., 2019; Xu et al., 2021). Still, major knowledge gaps exist on the sources and formation pathways of SOA, its transformation and lifetime in the atmosphere, and its underlying effect on Earth's climate and human health. Furthermore, emissions of anthropogenic and biogenic precursors as well as their atmospheric fate are uncertain, resulting in a discrepancy between measured and modeled SOA (Fuzzi et al., 2015). Improved chemical characterization of ambient SOA can help the understanding of sources, formation pathways, and the effects on both climate and human health.
Many controlled laboratory studies have increased our mechanistic understanding of the oxidation of volatile organic compounds (VOCs) (Burkholder et al., 2017). However, the ambient atmosphere is usually more complex than chamber experiments, and unaccounted chemical interactions can therefore alter SOA yields that are derived from simple laboratory systems (McFiggans et al., 2019). Furthermore, it is likely that many VOCs that are relevant for SOA formation are understudied. Therefore, a comprehensive top-down investigation of SOA can enable the identification of missing important precursor gases or relevant formation pathways. Numerous previous investigations (Glasius et al., 2000; Kristensen et al., 2016; Nozière et al., 2015; Surratt et al., 2007) clearly highlight the advantages of offline measurement techniques, which apply separation techniques like gas chromatography or (ultrahigh-performance) liquid chromatography (UHPLC) coupled to (high-resolution) mass spectrometry (HRMS), because with these techniques, the unambiguous identification of different compounds becomes possible. In recent years, non-target analysis (NTA) of UHPLC-HRMS measurements has become a powerful tool that builds peak lists of all detected compounds in complex samples and determines the molecular formula based on the exact mass and isotopic pattern. Furthermore, MS2 spectra can be compared to fragmentation libraries and enable database-assisted identification of compounds (Ditto et al., 2018; Ma et al., 2022; Pereira et al., 2021; Pleil et al., 2018). However, there are currently no established databases of atmospheric SOA tracers which can be applied to measurements of ambient PM2.5 filter samples.
Inspired by metabolomics, a tool widely used in the life sciences to identify metabolites, metabolic pathways, and biomarkers (Fiehn, 2002; Johnson et al., 2016), we created an aerosolomics database for database-assisted identification of marker compounds (without having the need for authentic standards), hence enabling the investigation of atmospheric transformation pathways of VOCs under different oxidation conditions. The database enables compound matching based on filters from potential aerosol mass (PAM) oxidation flow reactor (OFR) experiments on nine biogenic and anthropogenic VOCs. We applied the database to ambient air filter samples collected in summer 2018 near Vienna, Austria. Figure 1 shows the principal steps of the new Aerosolomics approach that is based on the comparison between filter samples from OFR experiments and from the ambient. Additionally, a hierarchical cluster analysis (HCA) was performed in order to reduce the complexity of the ambient dataset and to assign compounds to certain formation processes or emission sources. Both strategies combined allow the identification of oxidation products from either biogenic or anthropogenic VOCs and enable a better understanding of the oxidation conditions and of temperature-driven gas-to-particle partitioning.
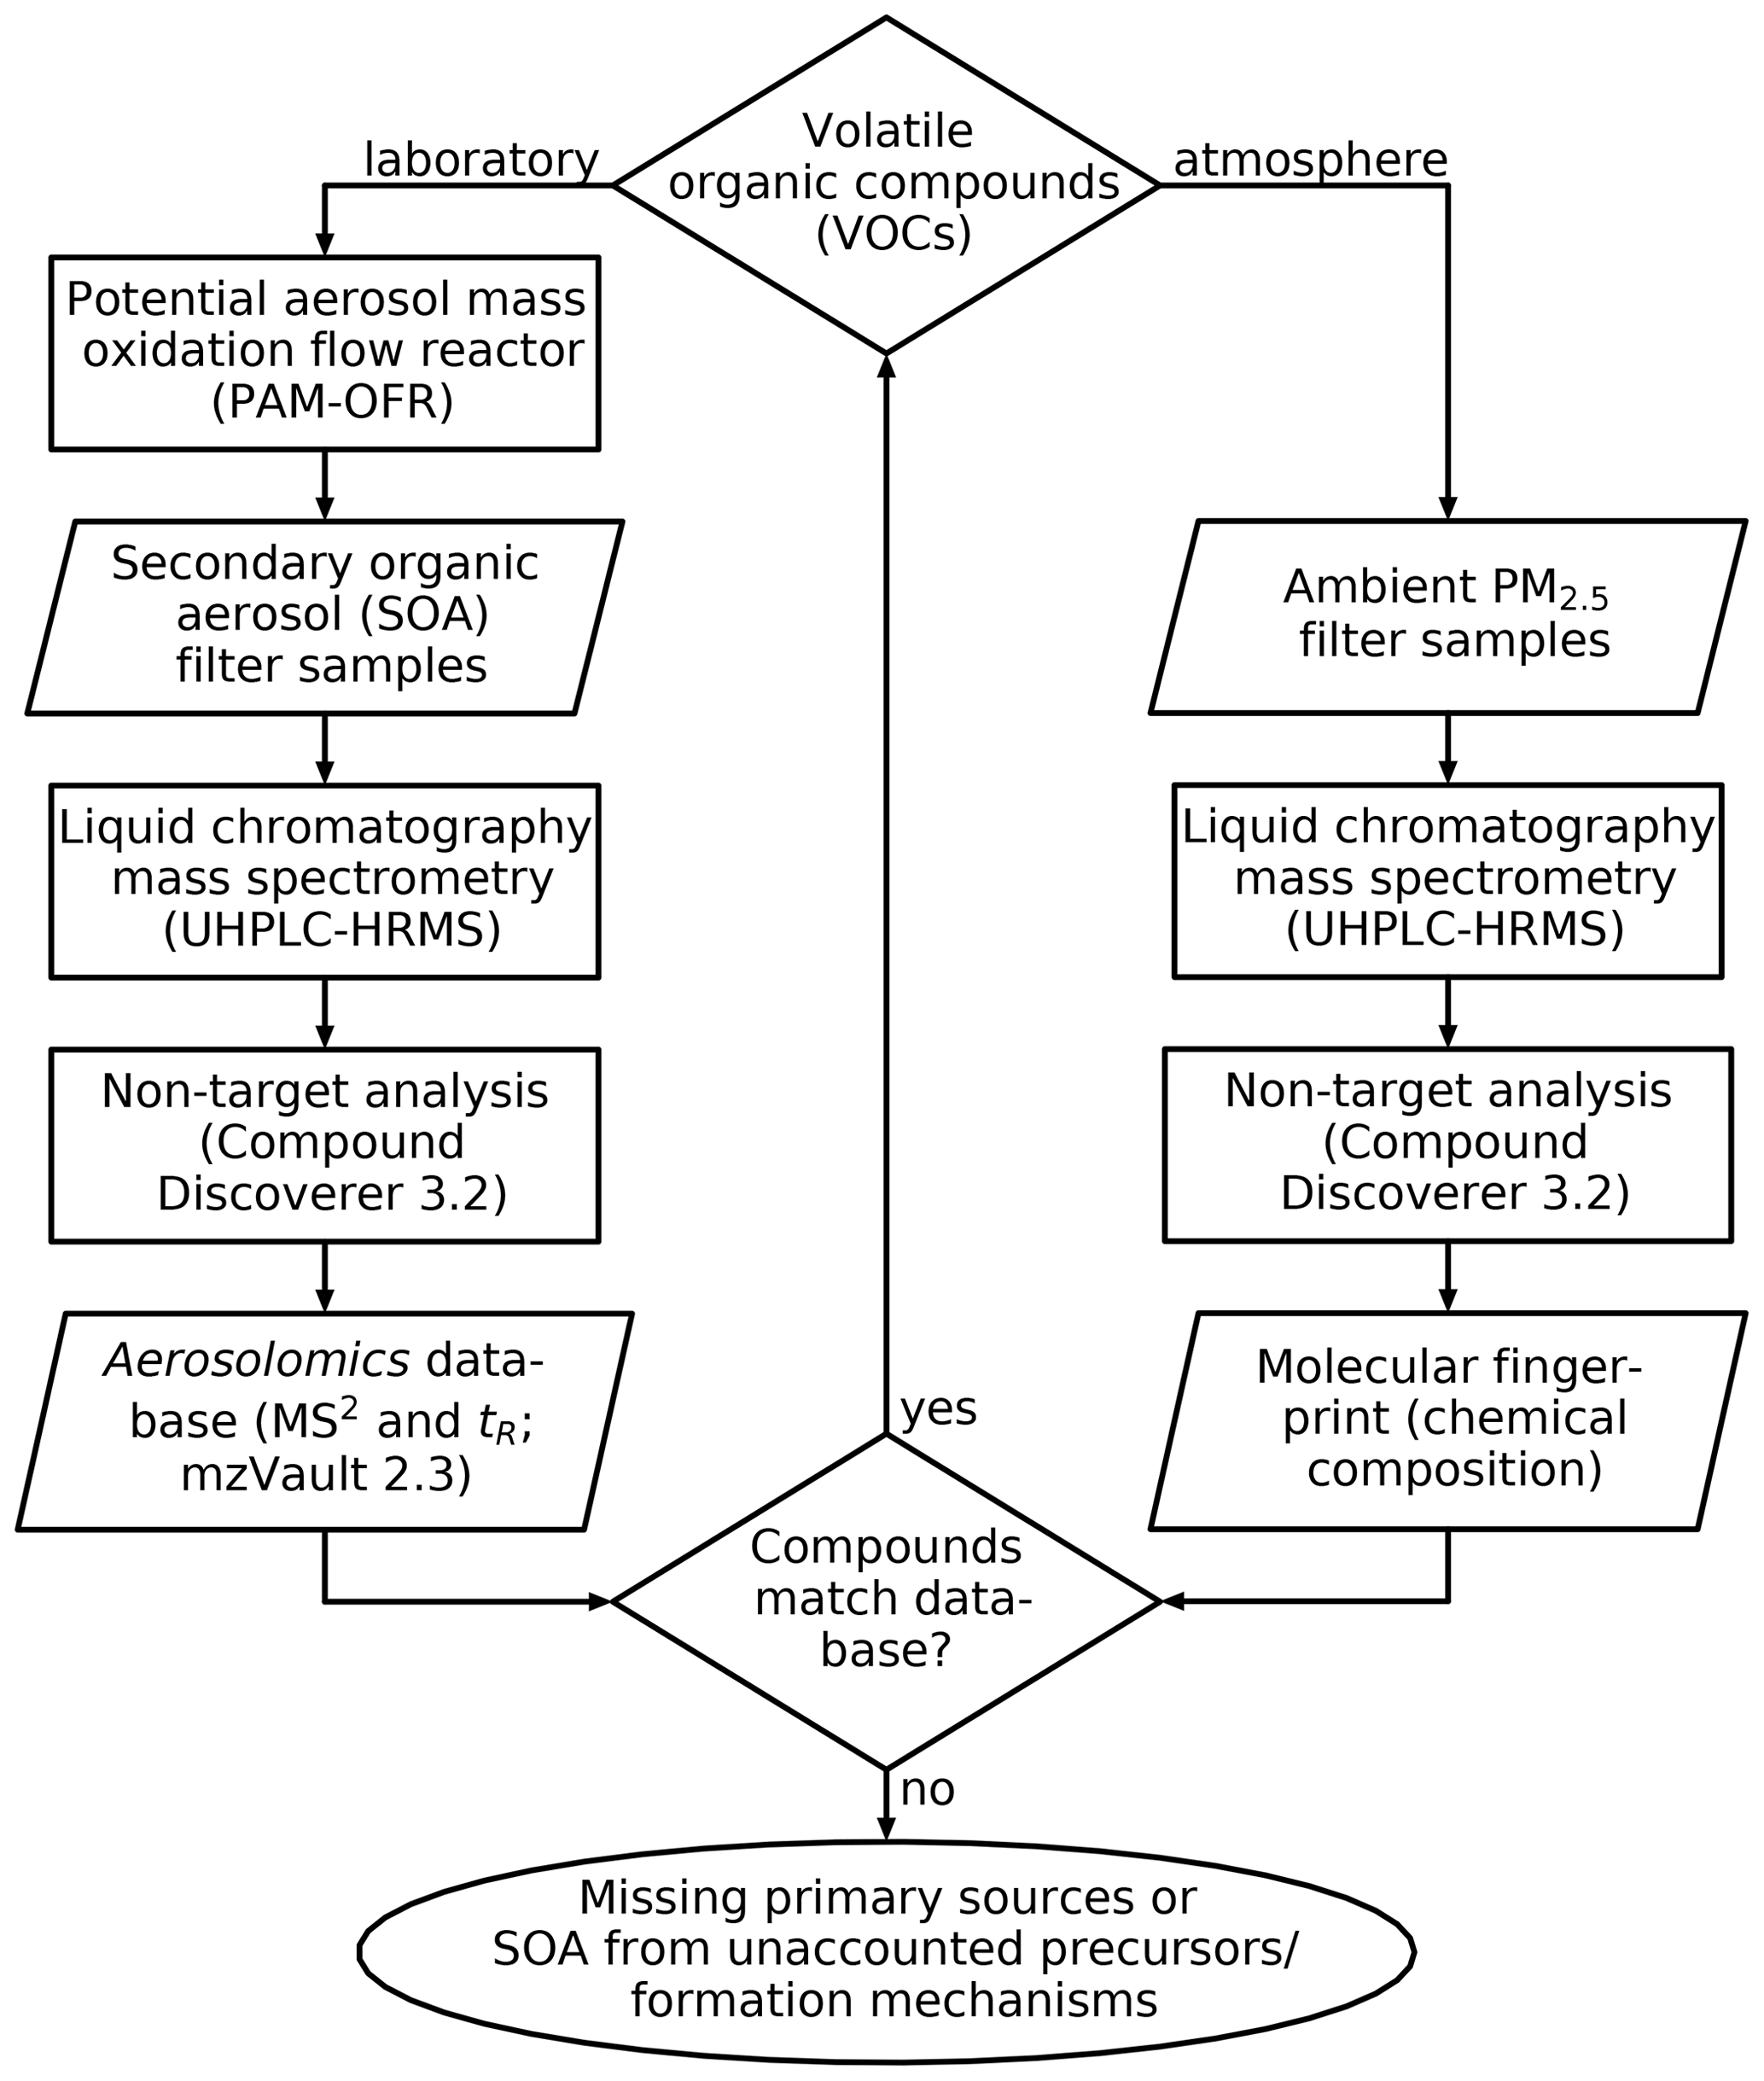
Figure 1Establishment and application of the Aerosolomics database. The database is filled with the results of several PAM-OFR experiments with different precursors and reactants and is compared to the molecular fingerprints of ambient PM2.5 filter samples. Matching compounds can be assigned to the corresponding VOC precursor. Knowledge about non-matching compounds, due to missing primary sources or SOA from unaccounted precursors or formation mechanisms, can guide further experiments.
2.1 Oxidation flow reactor experiments
We used a PAM-OFR (Aerodyne Research Inc.) (Kang et al., 2007; Lambe et al., 2011) for laboratory SOA formation of biogenic VOCs (-)-α-pinene (98 %, Alfa Aesar, CAS: 7785-26-4), (+)-β-pinene (98 %, Sigma-Aldrich, CAS: 19902-08-0), (S)-(-)-limonene (96 %, Sigma-Aldrich, CAS: 5989-54-8), (+)-3-carene (≥ 98.5 %, Fluka Analytical, CAS: 498-15-7), and (-)-trans-caryophyllene (≥ 98 %, Sigma-Aldrich, CAS: 87-44-5), as well as the anthropogenic VOCs toluene (>99.5 %, Fluka Analytical, CAS: 108-88-3), o-xylene (>99.0 %, Fluka Analytical, CAS: 95-47-6), 1,2,4-trimethylbenzene (98 %, Sigma-Aldrich, CAS: 95-63-6), and naphthalene (>99 %, Merck KGaA, CAS: 91-20-3). In dark ozonolysis experiments, all BVOCs were oxidized with externally produced ozone (O3). Hydroxyl radicals (OH) formed during ozonolysis of VOCs were not scavenged. Under daytime simulations, OH was generated by UV light (λ=254 nm) inside the OFR.
We evaporated the VOCs in a heated glass flask purged continuously with nitrogen (N2, 6.0 purity, Nippon Gases). The aerosol mass concentration was measured with a scanning mobility particle sizer spectrometer (SMPS, consisting of an electrostatic classifier 3082, a differential mobility analyzer 3081A, and an ultrafine condensation particle counter 3776, TSI Inc.). Changing the precursor concentration by varying the temperature inside the flask resulted in aerosol mass concentrations between 20 and 184 µg m−3. The individual settings and the resulting mass concentrations are given in Table S1.
In all experiments, the nitrogen flow into the reactor was 4.8 L min−1, and the oxygen (O2, 5.0 purity, Nippon Gases) flow was 1.2 L min−1, resulting in a mean residence time of 2.4 min. The relative humidity was 55 %. The O3 concentration was ∼1 ppm, decreasing to 0.8 ppm under OH conditions. Based on these experimental conditions, we calculated the external OH reactivity (Eq. S1) and the OH exposure using the OFR exposure estimator (Peng et al., 2015, 2016). The resulting OH exposures (Table S1) correspond to approximately 0.1–6 d of equivalent atmospheric OH exposure, based on the assumption of an averaged tropospheric OH concentration of 1.09×10⁶ molecules cm−3 (Li et al., 2018).
The aged air leaving the OFR passed through two 50 cm denuders packed with charcoal (IAC-402, Infiltec GmbH) and potassium permanganate (KMnO4, IAC-630, Infiltec GmbH) in order to remove (reactive) gas-phase compounds. Glass fiber filters (47 mm, Pallflex Emfab Filters, Pall) sampled the formed SOA particles with a flow of 3 L min−1 for a duration of 90 min. Until sample preparation and analysis, filter samples were packed in aluminum foil and stored at −18 ∘C.
2.2 Ambient air filter sampling campaign
PM2.5 filter samples were collected in August 2018 during a field campaign (48.127∘ N, 16.534∘ E) at a suburban background station between the Vienna International Airport in the east and the Schwechat Industrial Park and city of Vienna in the northwest. A total of 52 glass fiber filters (150 mm, Ahlstrom-Munksjö) were sampled for 12 h, starting at 05:00 (UTC) or 17:00 (UTC) respectively, using a high-volume sampler (DHA-80, Digitel Elektronik AG) at a flow rate of 30 m3 h−1. The meteorological parameters (i.e., wind direction, wind speed, and temperature), the trace gas concentration (i.e., nitrogen oxide – NO, nitrogen dioxide – NO2, sulfur dioxide – SO2, and carbon monoxide – CO), and the PM2.5 mass concentration were monitored continuously.
2.3 Sample preparation
From each ambient filter sample, one punch (25 mm diameter) was cut into small pieces and extracted in a glass vial using 200 µL of ultrapure water (Milli-Q Reference A+, Merck KGaA) and methanol (Optima LC/MS Grade, Thermo Fisher Scientific Inc.) (, ) for 20 min on an orbital shaker with 300 rpm. Afterwards, the solvent was drawn up with a syringe (Injekt-F, Braun Melsungen AG) and filtered through a 0.2 µm syringe filter (non-sterile PTFE Syringe Filter, Thermo Fisher Scientific Inc.). In a second step, 100 µL of the solvent mixture was added, and the procedure was repeated; 50 µL of the extracted sample was mixed with 5 µL of an internal standard containing isotopically labeled benzoic acid (C6H513CO2H, 99 atom % 13C, Sigma-Aldrich, c=0.1 mg mL−1).
Half of each filter from the OFR experiments was cut into small pieces and extracted analogously to the ambient air filter samples with an adjustment in the eluent volume: 180 µL was used in the first and 80 µL was used in the second step. Finally, 100 µL of the extracted sample was mixed with 10 µL of the internal standard.
2.4 Standard mixture for non-target analysis validation
A solution of 13 analytical standards was used to validate UHPLC-HRMS measurements and the NTA workflow, with primary attention toward automated compound identification but also toward fragmentation and adduct formation, which can result in false positives. To cover a variety of atmospherically relevant compounds, the mixture consists of carboxylic acids, organosulfates, and organophosphates, as well as nitrogen-containing compounds. The injection volume for the analysis was 1 µL. A detailed overview of the substances used and their concentrations in the mixture is given in Table S2.
2.5 UHPLC-HESI-HRMS measurements
The extracts of the ambient PM samples were separated by ultrahigh-performance liquid chromatography (Vanquish Flex, Thermo Fisher Scientific Inc.) on a reversed phase column (Accucore C18, 2.6 µm, 150×2.1 mm, Thermo Fisher Scientific Inc.), ionized in the negative mode using a heated electrospray ionization source (HESI-II Probe, Thermo Fisher Scientific Inc.), and detected with a high-resolution hybrid quadrupole-Orbitrap mass spectrometer (Q Exactive Focus, Thermo Fisher Scientific Inc.). Eluents were ultrapure water (eluent A) and methanol (eluent B), both mixed with 0.1 % formic acid (98 %, Merck KGaA). The injection volume was 5 µL, the flow rate was 400 µL min−1, and the temperature was 40 ∘C. The gradient started with 1 % eluent B (0–0.5 min), increased linearly to 99 % B (0.5–14 min), stayed at 99 % B (14–16 min), and was backflushed in 1 min and equilibrated in 3 min, resulting in a total run time of 20 min. The ion source settings were −3.5 kV spray voltage, 40 psi sheath gas, 8 arbitrary units auxiliary gas, and 262.5 ∘C capillary temperature. The spectra were recorded in full-scan MS with data-dependent tandem mass spectrometry (ddMS2) using a higher-energy collisional dissociation (HCD) cell with stepped collision energies of 15, 30, and 45 eV. The scan range in full MS was 50–750, with a resolution of 70 000 at 200. For ddMS2, the resolution was 17 500.
A representative selection of 10 ambient PM samples was measured a second time. The selection was based on external influences like wind direction, temperature, time of day, and trace gas concentrations. In one sequence, together with filter samples from laboratory OFR experiments, we applied and improved the gradient on another reversed phase column (Cortecs Solid Core T3, 2.7 µm, 150×3 mm, with the corresponding VanGuard Cartridge, Waters Corp.). The gradient also started with 1 % B for 30 s, increased linearly to 99 % B in 15 min, and held it for 2 min. Afterwards, the column was backflushed in 90 s and equilibrated in 2.5 min , resulting in a total run time of 21.5 min. This dataset is the basis for the application of the database on ambient samples.
As a quality control routine, we extracted one filter three times to estimate the reproducibility of the extraction procedure. In addition, we determined the instrument performance by a triplicate measurement of one filter extract. We calculated the relative standard deviation (RSD) for seven compounds ( 115–357 and signal intensities of 3×10⁵–5×10⁸ counts). Averaged over all seven compounds, we determined a mean RSD of 6.7 % for the reproducibility of the extraction procedure and 2.1 % for the instrumental performance.
2.6 Non-target analysis, MS2 libraries, hierarchical cluster analysis, and volatility estimation
We used Compound Discoverer 3.2 (Thermo Fisher Scientific Inc.) for the NTA of the UHPLC-HRMS raw files. Chromatographic peaks of interest were aligned with a maximum shift of 0.1 min in retention time and a mass tolerance of ±1 ppm. Ions were detected if the peak intensity was at least 5×10⁵ counts for one of the following ions: , , , and . In addition to the mass-to-charge ratio of the detected ion, at least one corresponding isotopologue has to be measured. The tolerance between the measured and calculated intensity of the isotopologue has to be less than 30 %. Unknown compounds were then grouped with a retention time tolerance of 0.1 min, and those of them with a sample-to-blank ratio smaller than 5 were marked as background. A predicted composition was calculated within ±1 ppm, allowing the elements carbon (C), hydrogen (H), bromine (Br), chlorine (Cl), nitrogen (N), oxygen (O), and sulfur (S). Compounds were grouped together as CHO, CHNO, CHOS, CHNOS, and “other” if the elemental composition contained other heteroatoms. For unidentified compounds, the software does not predict a composition under the given conditions. The detailed workflow is given in Table S3.
To be clear on the degree of certainty regarding compound identification, we used the confidence levels from Schymanski et al. (2014). Probable and tentatively labeled compounds correspond to level 2 and level 3, respectively. We used the mzCloud database (HighChem LLC, 2013-2021) for comparing MS2 spectra of commercial chemicals. Unambiguously identified compounds (reference standard, MS2 spectrum) correspond to confidence level 1.
Based on the Compound Discoverer results from the OFR experiments, we created a library for every examined chemical system (e.g., limonene and ozone) using mzVault 2.3 (Thermo Fisher Scientific Inc.), resulting in a total of 14 libraries of the Aerosolomics database. Every entry in a library contains the exact mass-to-charge ratio, the retention time, the MS2 spectrum, and the relative abundance to the major product of the respective system if the relative abundance is higher than 1 %. These libraries were implemented in Compound Discoverer and aligned with the identified compounds from the representative selection of the field campaign. An entry in the library was dedicated to a compound in the ambient air filter samples if the difference in the retention times was smaller than 0.2 min, the measured mass-to-charge ratios of the ddMS2 scans were within a window of 10 ppm, and the match factor indicating the similarity of the MS2 spectra was bigger than 50 %. Detailed settings of this node are given in Table S3. If a compound appeared in several libraries, the match factor was crucial for an assignment. If match factors were equal, the system in which the compound had the highest relative abundance was chosen.
We calculated the effective saturation mass concentration (log10 C*) for each compound with a predicted composition including at least the elements C, H, and O as well as N and S, based on Li et al. (2016). However, we would like to point out that this parameterization comprises a large molecular corridor and thus leads to a wide range of log10 C*. A bias has been reported for nitrogen-containing compounds (Isaacman-VanWertz and Aumont, 2021); CHO compounds also appear to be biased. For example, log10 C* of the atmospheric tracer 3-methyl-1,2,3-butanetricarboxylic acid (C8H12O6, MBTCA, Szmigielski et al., 2007) results in 1.97 µg m−3, while with SIMPOL.1 (Pankow and Asher, 2008), we find log10 C* at 298 K to be −2.2 µg m−3. However, this difference of 4 orders of magnitude is certainly an extreme case, as all oxygen atoms of MBTCA are a part of a carboxylic acid functional group.
We performed an HCA with MATLAB R2020a (The MathWorks) based on the complete dataset from the Vienna field campaign, including the blank-corrected integrated sample peak areas. After z-transformation, we used a Euclidean distance metric and the Ward algorithm for computing the distance between the clusters. For the compound clusters of the HCA, an intensity-weighted mean of log10 C* was calculated. The borders of the different volatility classes are given according to Schervish and Donahue (2020). Based on this, the organic compounds can be classified as volatile (VOC), intermediate volatile (IVOC), semi-volatile (SVOC), low volatile (LVOC), extremely low volatile (ELVOC), and ultra-low volatile (ULVOC).
3.1 Oxidation flow reactor
OFR experiments provided SOA from several individually studied VOCs under different oxidation conditions. NTA of UHPLC-HRMS measurements of the SOA extracts enabled us to populate our Aerosolomics database with individual oxidation products of the studied VOCs in a qualitative way. We investigated five BVOCs and four AVOCs, and we identified 481 and 115 oxidation products, respectively. Each of these 596 oxidation products is listed in the database with the information on precursor, oxidation condition, exact mass-to-charge ratio, retention time, MS2 spectrum, and relative abundance in the respective system. Although we are not able to determine the individual chemical structure of the different SOA compounds, their individual structures lead to compound-specific retention times. Using all these parameters in the presented database allows unambiguous attribution of SOA compounds in ambient samples to their major parent VOC.
3.1.1 SOA compounds from oxidation of biogenic VOCs
We investigated the composition of SOA from the atmospherically most abundant biogenic monoterpenes (C10H16) α-pinene, β-pinene, limonene, and 3-carene. The results are shown as mirror spectra in Fig. 2. The upper half of each subplot shows the ozonolysis products under dark conditions, while the lower spectra show the products from OH oxidation (254 nm UV). The most abundant compounds are labeled with the predicted formula and their retention time; however, the database contains these entries of all compounds down to 1 % relative peak intensity.
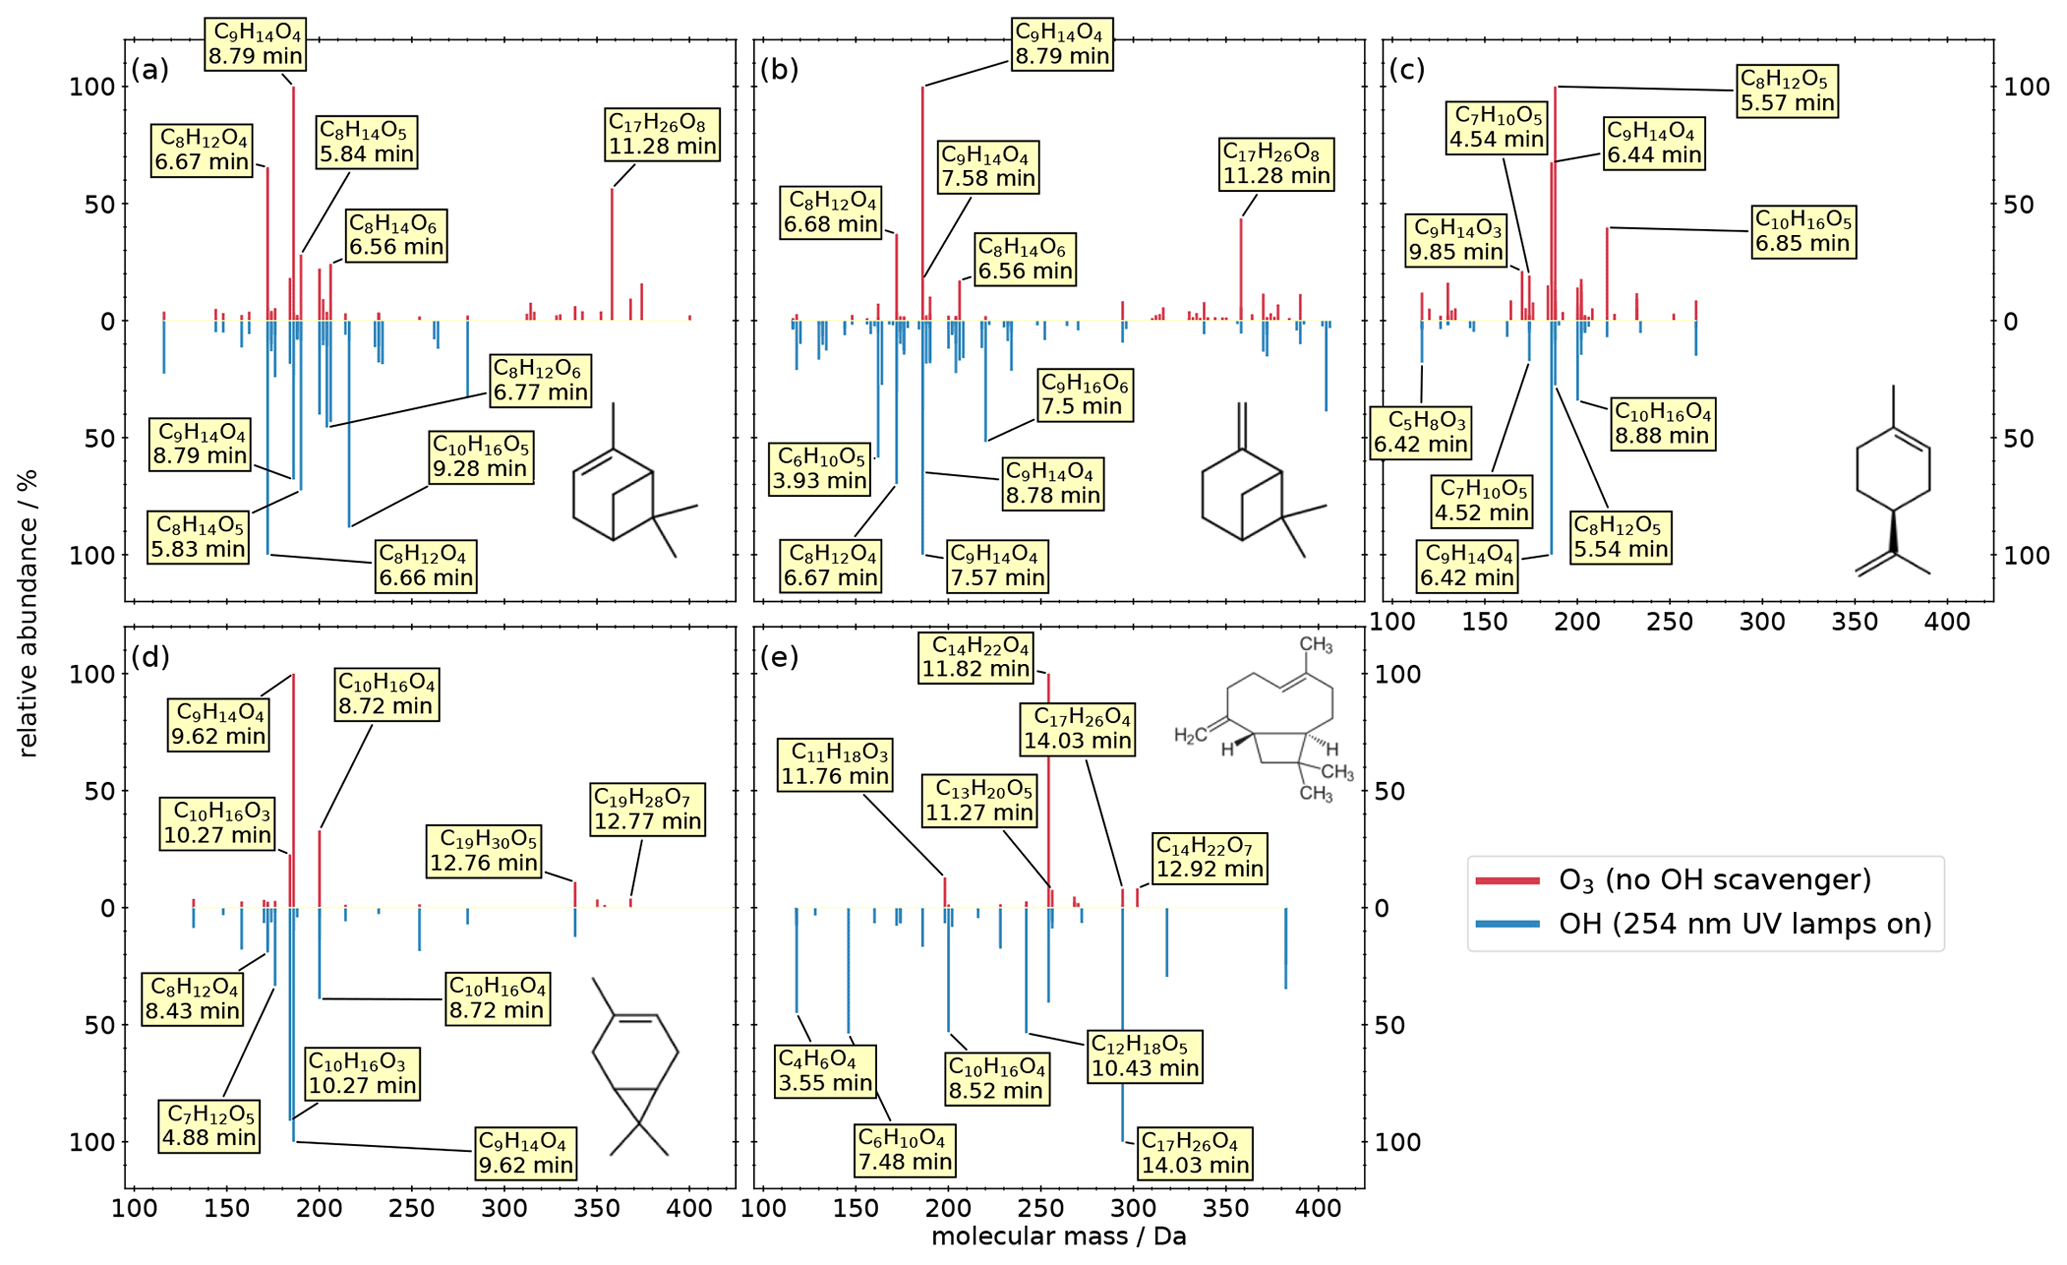
Figure 2Mass spectra of the detected products from the OFR experiments of five biogenic precursors: (a) α-pinene, (b) β-pinene, (c) limonene, (d) 3-carene, (e) and trans-caryophyllene. The intensity is normalized to the highest signal of each chemical system. The most abundant compounds of each experiment are labeled with their predicted composition and the according retention time.
Panel (a) shows the results of the α-pinene oxidation experiments. Monomers produced during ozonolysis are mainly in the mass range between 140 and 210 Da, while dimers are in the range between 300 and 400 Da. The major products during ozonolysis are pinic acid (C9H14O4 at 8.79 min, level 1; Yu et al., 1999), terpenylic acid (C8H12O4 at 6.67 min, level 2; Claeys et al., 2009), pinyl-diaterpenyl ester (C17H26O8 at 11.28 min, level 2; Kahnt et al., 2018; Yasmeen et al., 2010), C8H14O5 (at 5.84 min), and C8H14O6 (at 6.56 min). Oxidation by OH reduces the absolute signal intensity of most oxidation products (see Fig. S1). Furthermore, this oxidation environment prevents the production of dimers and certain monomers and changes the relative abundance of several monomers. For example, the relative abundance of pinic acid, which is the major compound of the ozonolysis, decreases by 30 % under OH conditions. In contrast, the relative abundance of several other compounds increases, which indicates a higher relevance in the OH system, like terpenylic acid increasing to 100 % relative abundance, C10H16O5 (at 9.28 min) increasing to 88 % relative abundance, C8H14O5 (at 5.84 min) increasing from 28 % to 73 % relative abundance, and MBTCA increasing from 4 % to 46 % relative abundance. Panel (b) shows the results of the β-pinene oxidation experiments. Here, many compounds are similar to the α-pinene oxidation products, with the exception of dimer formation during OH conditions. For both ozonolysis and OH oxidation, C9H14O4 is the compound with the highest relative abundance, although the chromatography resolves different isomers: in the upper spectrum (O3), pinic acid has a relative abundance of 100 %, whereas homoterpenylic acid (C9H14O4 at 7.58 min, level 2; Yasmeen et al., 2010) has a relative abundance of 17 %. In the lower spectrum (OH), the relative abundances are reversed, with 100 % at 7.57 min and 65 % at 8.78 min. This indicates that different oxidation conditions of the same precursor result in different isomers of C9H14O4, which can only be resolved with chromatographic separation. Furthermore, homoterpenylic acid does not appear in any other experiment in higher amounts, for which reason it can be used as a specific β-pinene tracer. While the most prominent dimer (pinyl-diaterpenyl ester) appears analogously to the α-pinene system during ozonolysis, here, under OH conditions, β-pinene oxidation results in dimer oxidation products like C19H32O9 (at 13.23 min) in contrast to no dimers in α-pinene system.
Panel (c) shows the results of the limonene oxidation experiments. In contrast to the other three monoterpenes, no dimers were formed, which is in general agreement with Hammes et al. (2019). The ozonolysis shows three major products: hydroxyterpenylic acid (C8H12O5 at 5.57 min, level 2; Kahnt et al., 2014), ketolimononic acid (C9H14O4 at 6.44 min, level 2; Yasmeen et al., 2011), and C10H16O5 (at 6.85 min). In the OH system, ketolimononic acid becomes the major compound, whereas the intensity of hydroxyterpenylic acid increases clearly. Analogous to the β-pinene oxidation, the C9H14O4 isomer ketolimononic acid can be used as a specific limonene tracer due to the missing appearance of this isomer in other experiments.
Panel (d) shows the results of the 3-carene oxidation experiments. Three monomers are the most prominent products in both systems: caric acid (C9H14O4 at 9.62 min, level 2; Yasmeen et al., 2011), hydroxy-3-caric acid (C10H16O4 at 8.72 min, level 3; Larsen et al., 2001), and 3-caronic acid (C10H16O3 at 10.27 min, level 3; Larsen et al., 2001). The four dimers C19H30O5 (at 12.76 min), C19H28O7 (at 12.77 min), C20H30O5 (at 13.74 min), and C19H28O9 (at 11.40 min) appear during ozonolysis, three of which are also reported by Thomsen et al. (2021), tentatively identified as dimers from 3-carene. Under OH conditions, the dimers disappear, with the exception of C19H30O5.
In addition to the four monoterpenes, we investigated the composition of sesquiterpene SOA from trans-caryophyllene (C15H24). During ozonolysis, we find one major and four minor products in the mass range between 198 and 302 Da (Fig. 2e). The major compound is tentatively identified as β–norcaryophyllonic acid (C14H22O4 at 11.82 min, level 3; van Eijck et al., 2013; Jaoui et al., 2003). In contrast, the reaction with OH leads to one major and seven minor products in the range of 118–382 Da. The major compound C17H26O4 (at 14.03 min) also appears during ozonolysis but only with a relative abundance of 8 %.
Considering BVOC oxidation in general, it is worth mentioning that different isomers of C9H14O4 are clearly separated by the chromatographic system, and we can use them as specific tracers for different BVOCs in the Aerosolomics database. These and even more isomers are present in ambient filter samples (Fig. S2), which demonstrates the necessity of chromatographic separation if an unambiguous assignment is desired. Furthermore, ion source dimerization is a known phenomenon that hinders the unambiguous identification of atmospheric dimers or leads to misinterpretation of results from direct-injection HESI. Based on the knowledge of the exact and the mass dependence of the retention time, we can assign ion source-related dimers to the associated atmospheric monomer. This allows us an unambiguous distinction between monomers and covalently bonded “real” dimers (Fig. S3).
3.1.2 SOA compounds from oxidation of anthropogenic VOCs
We investigated the composition of SOA from the anthropogenic VOCs 1,2,4-trimethylbenzene, toluene, o-xylene, and naphthalene. We carried out only OH oxidation of AVOCs because oxidation of aromatic compounds by O3 is negligible. The filter criteria were similar to the experiments with BVOCs, and the resulting spectra are shown in Fig. 3. All experiments show a noticeably lower number of oxidation products compared to biogenic precursors. We observe dimers only in the 1,2,4-trimethylbenzene and the o-xylene systems.
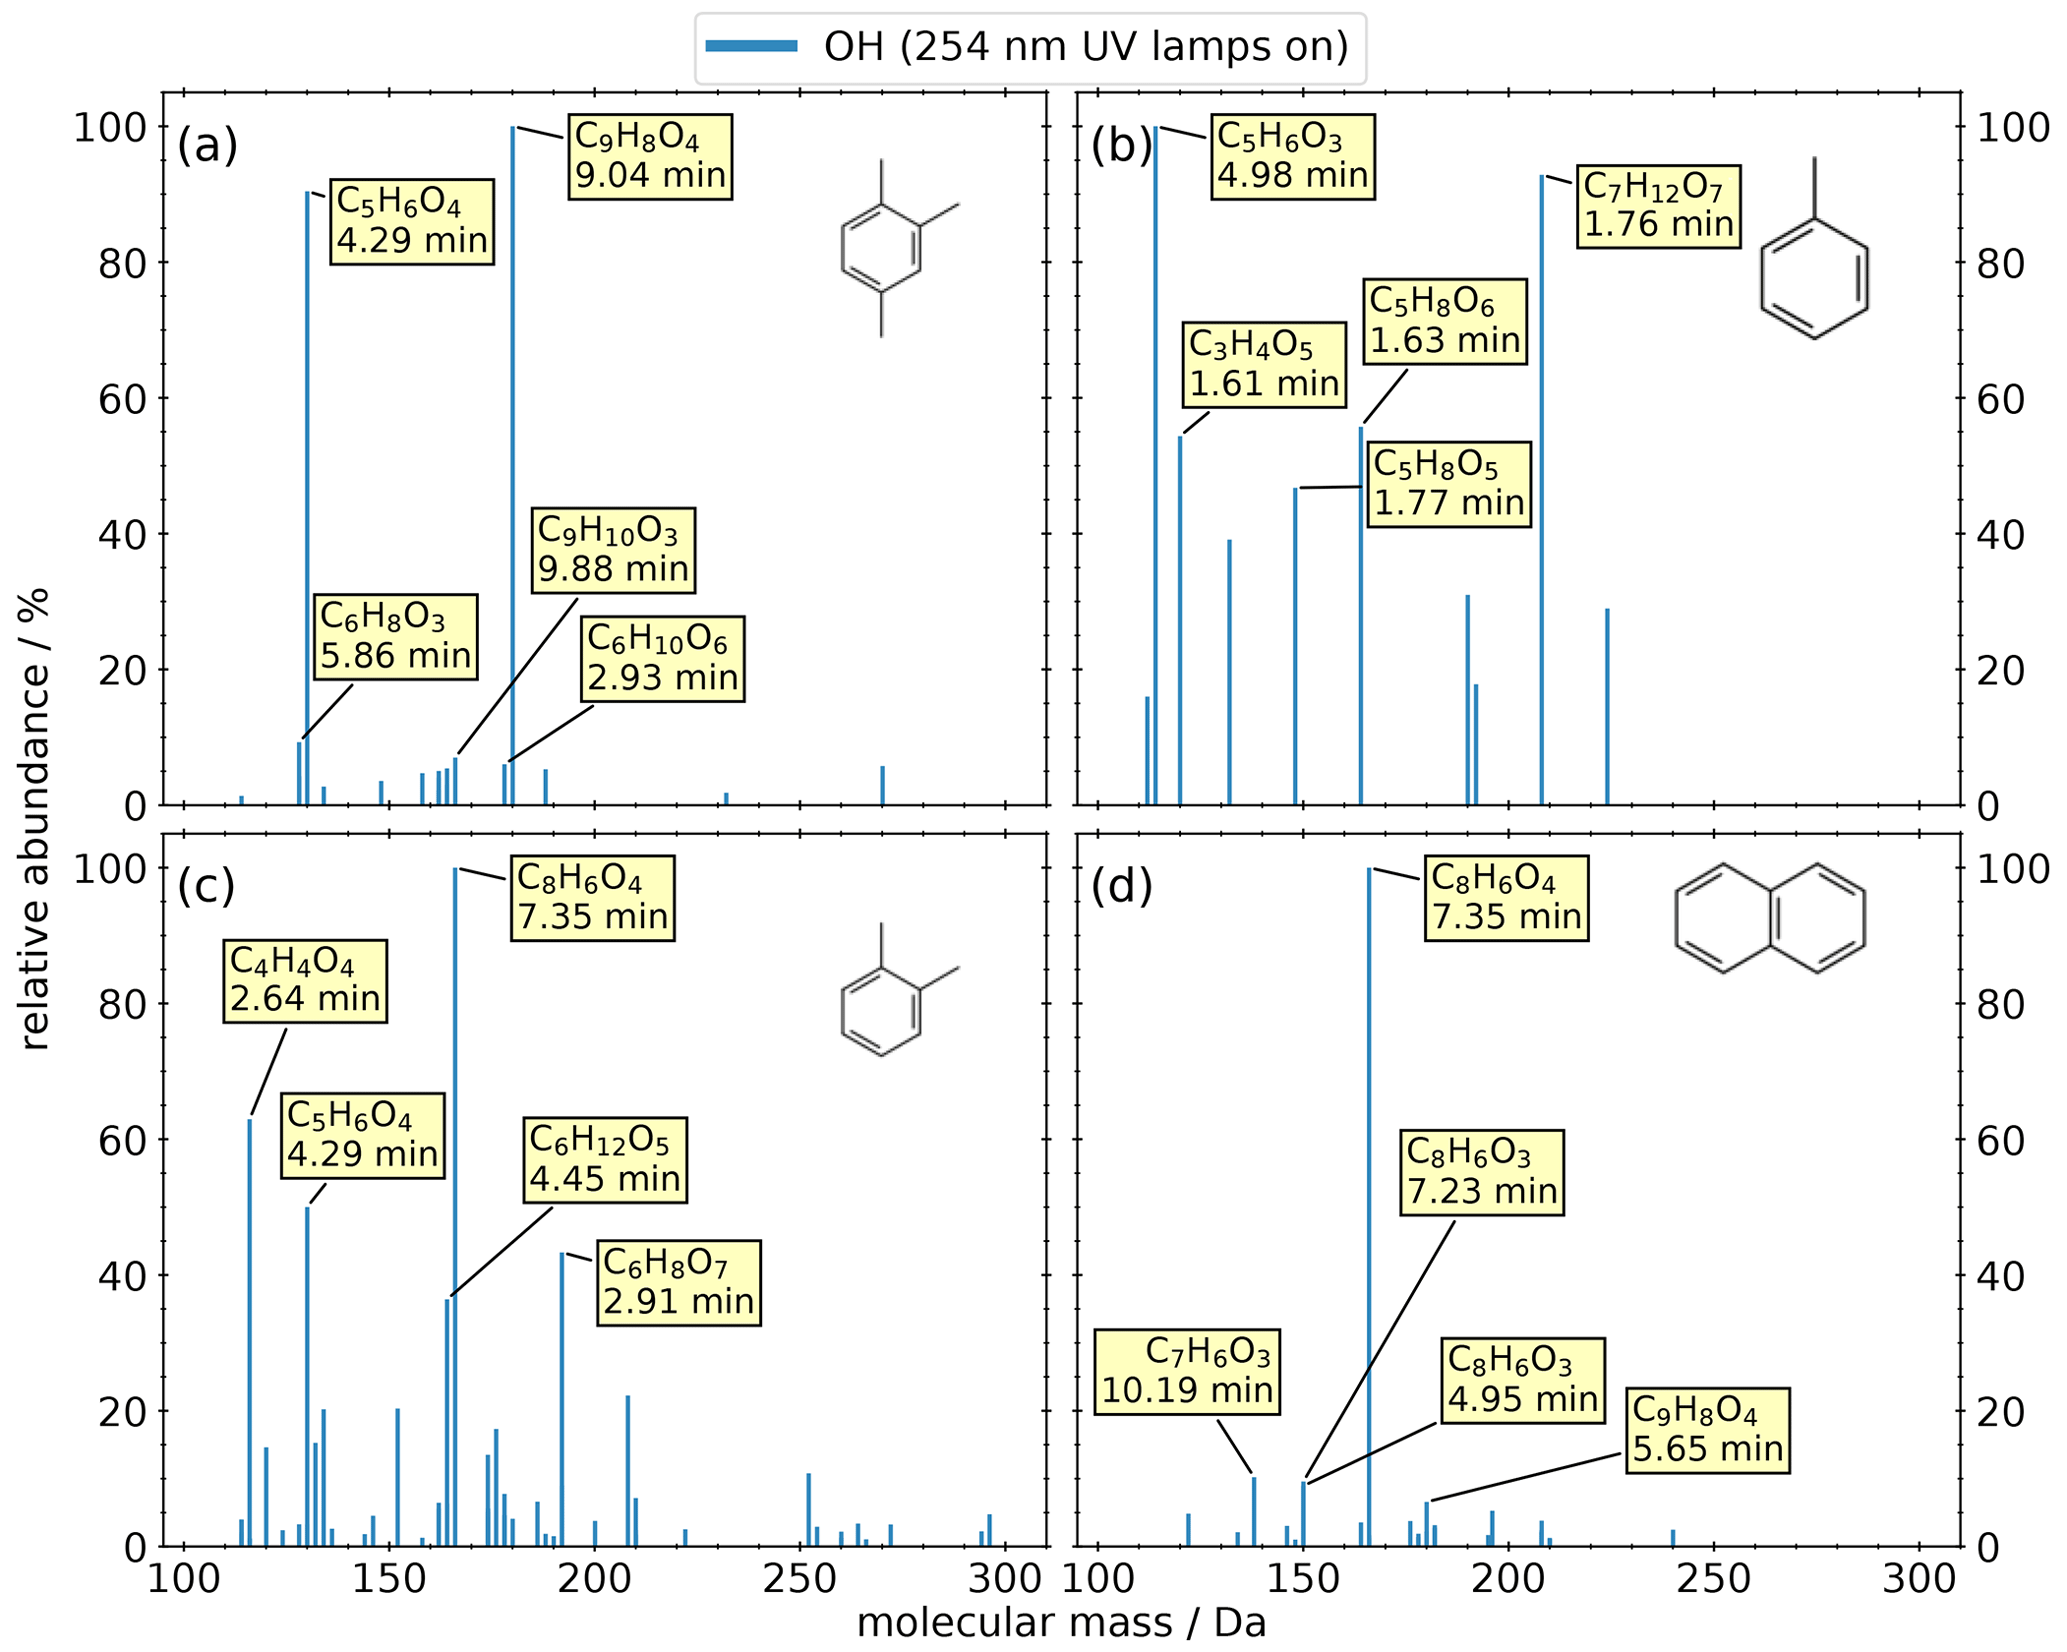
Figure 3Mass spectra of detected products from OFR experiments of four anthropogenic precursors: (a) 1,2,4-trimethylbenzene, (b) toluene, (c) o-xylene, (d) and naphthalene. The intensity is normalized to the highest signal of each chemical system. The most abundant compounds of each experiment are labeled with their predicted composition and the according retention time.
Panel (a) shows the results of the 1,2,4-trimethylbenzene oxidation. The two most prominent compounds are C9H8O4 (at 9.04 min) and C5H6O4 (at 4.29 min). The remaining compounds play a minor role due to their relative abundances being less than 10 %.
Panel (b) shows the results from the oxidation of toluene. The five most prominent compounds show a relative abundance higher than 40 %, and no compound has a relative abundance lower than 15 %. Most of these products are highly oxygenated with more than four oxygen atoms, with the exception of the highest signal corresponding to C5H6O3. All the small (C ≤ 5) highly oxygenated molecules also exhibit a high polarity (tR < 2 min) compared to the oxidation products of other anthropogenic precursors.
Panel (c) shows the results of the o-xylene oxidation, the anthropogenic precursor with the largest number of detected oxidation products (n=52) of the four investigated AVOCs. While no composition could be assigned by the NTA software for the highest signal due to an invalid isotopic pattern, the most abundant product in panel (d) appears on the same mass trace and at the same retention time. This peak was identified as phthalic acid (C8H6O4, level 1), which is described as a naphthalene SOA tracer by Al-Naiema et al. (2020).
Panel (d) shows the oxidation of naphthalene, resulting in the main oxidation product, phthalic acid. All other compounds have a relative abundance smaller than 20 %. It is worth mentioning that two isomers of C8H6O3 appear with a similar relative abundance but with two distinguishable retention times.
3.2 Aerosolomics database application on ambient samples
3.2.1 Fingerprint
The NTA of the representative selection of the Vienna field campaign extracts results in 1312 compounds, shown in panel (a) of Fig. 4 as retention time as a function of molecular mass. The scatter size represents the mean signal intensity of the 10 measurements on a linear scale. The majority are CHO compounds (54.7 %), followed by CHOS (17.3 %), CHNOS (13.1 %), and unidentified (12.3 %) compounds (Fig. 5), spanning the range from 100 to 350 Da. CHNO and other compounds, especially halogenated hydrocarbons, play a minor role, with proportions of 2.2 % and 0.4 %, respectively. The entire range of retention times indicates a broad mixture of polarities. Among the most common signals are terpene-derived nitrooxy organosulfates like C10H17NO7S (Wang et al., 2021), isoprene-derived CHOS like C2H4O6S (Claeys and Maenhaut, 2021), and monoterpene oxidation products like MBTCA, terpenylic acid, and pinic acid.
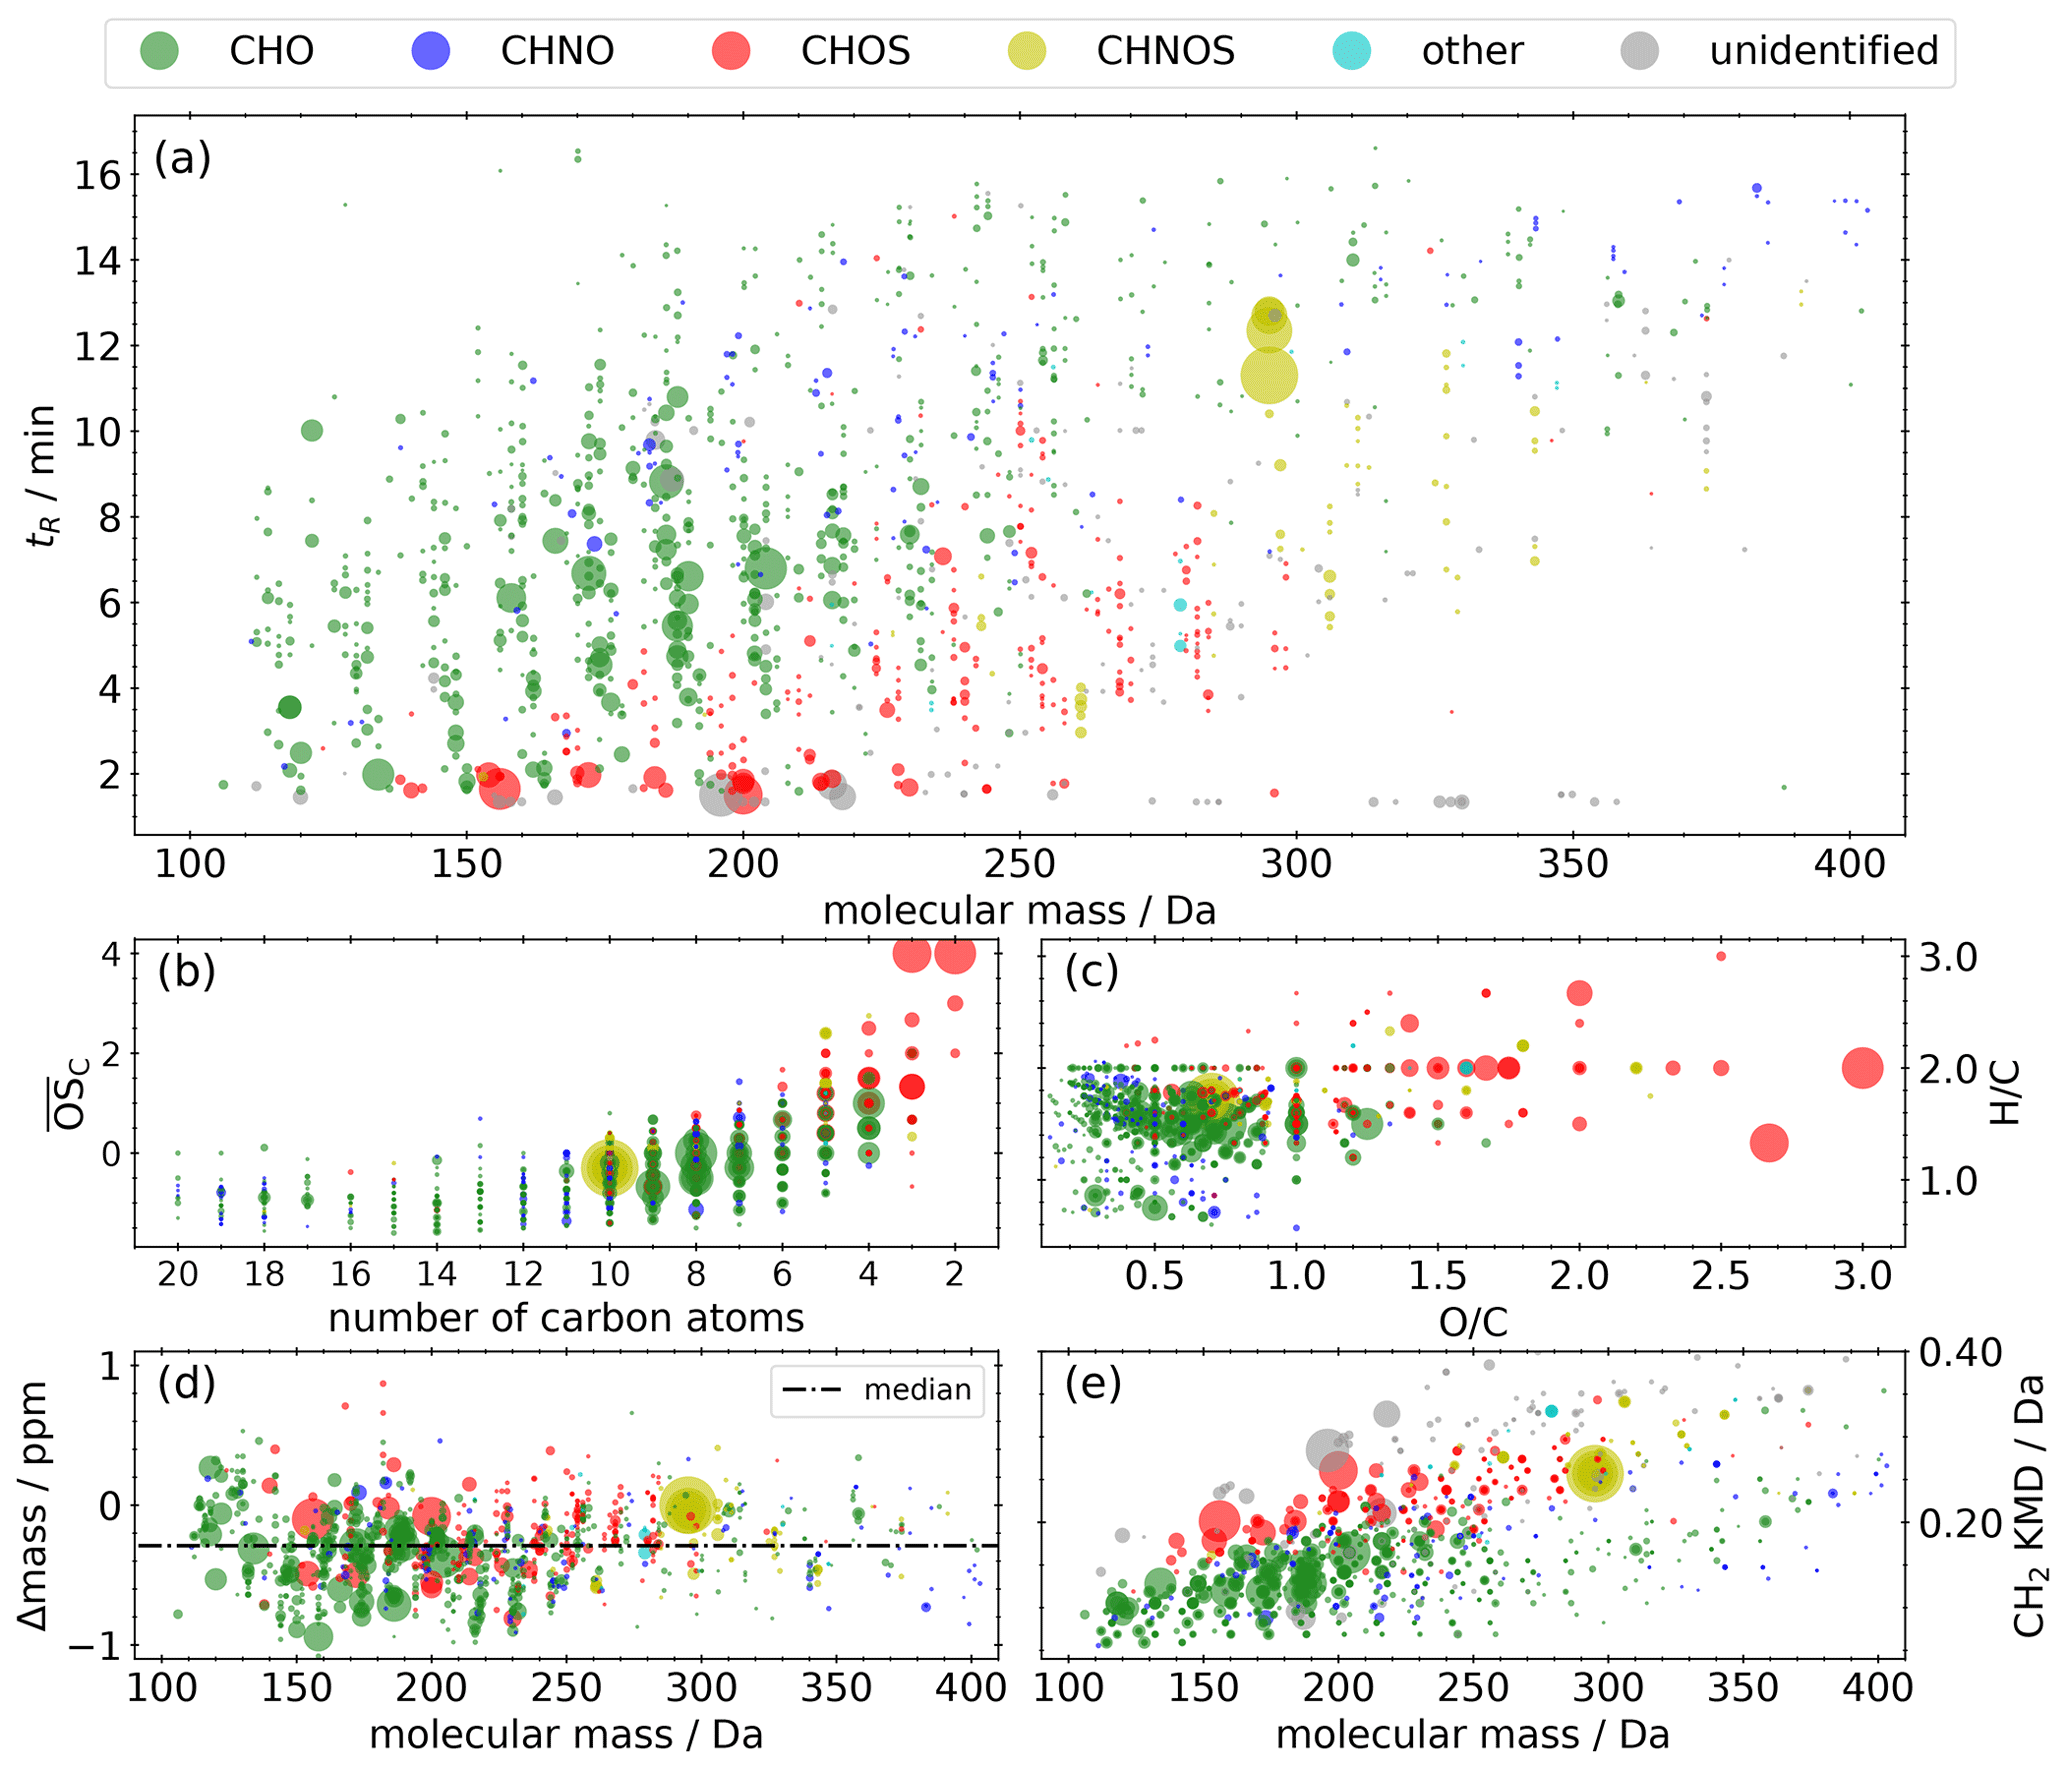
Figure 4Molecular fingerprint of the representative selection of the field campaign samples. The area of the scatters represents the qualitative mean signal intensity on a linear scale. (a) Retention time vs. molecular mass. (b) Kroll diagram. (c) Van Krevelen diagram. (d) Mass difference between calculated and measured molecular mass (Δmass) vs. molecular mass. (e) Kendrick mass defect plot. Panels (b), (c), and (d) only include compounds with a predicted composition.
Beside the two series of isoprene-derived CHNOS isomers highlighted in Sect. 3.3.1, three additional series of isomers can be found in the molecular fingerprint: C10H17NO7S (295 Da), C10H17NO9S (327 Da), and C10H17NO10S (343 Da) are all described as monoterpene-derived SOA (Surratt et al., 2008). In particular, C10H17NO7S plays a prominent role due to the overall maximum intensity, and it illustrates the anthropogenic influence on the oxidation products from BVOCs in the presence of NOx and SO2. The appearance of the ions and in the MS2 spectra prove that these compounds are nitrooxy organosulfates. Overall, 86 % of the CHNOS compounds show both ions in their MS2 spectra and can also be attributed to this group.
The average carbon oxidation state () according to Kroll et al. (2011) is in the range between −1.5 and 3, with the exception of two small CHOS compounds with an of up to 4 (Fig. 4b). The majority of the CHO compounds consist of 10 carbon atoms or fewer, while the majority of the CHOS compounds consist of 5 carbon atoms or fewer. This pattern indicates the importance of monoterpenes and isoprene as SOA precursors.
The van Krevelen diagram (Fig. 4c) clarifies the influence of biogenic precursors. On the one hand, the majority of the CHO compounds appear in the H C range between 1.2 and 1.8, described as a surrogate for biogenic SOA (Daellenbach et al., 2019; Kourtchev et al., 2015). On the other hand, compounds with an H C< 1.2, indicating aromatic character, are rare despite proximity to an airport and a large refinery. Even though several CHNO tracers for biomass burning could be identified, they only play a minor role with regard to noticeably lower signal intensities: C7H5NO5 (nitrosalicylic acid, level 3), C7H7NO4 (methylnitrocatechol, level 3), C7H6N2O5 (dinitrocresol, level 2), C7H6N2O6, C6H5NO4 (nitrocatechol, level 2), C6H4N2O5 (dinitrophenol, level 2), C8H7NO4 (methylnitrobenzoic acid, level 3), and C8H9NO5 (Kitanovski et al., 2012; Salvador et al., 2021).
In order to evaluate optimal settings for chemical composition prediction during NTA and to avoid false predictions, the mass difference between calculated and measured molecular mass (Δmass) has to be considered. Figure 4d shows that, over the entire mass range, only a slight shift to negative values (median = −0.29 ppm) can be observed within the space between −1 and 1 ppm deviation. Within the set of allowed elemental compositions, an enlargement of the range (±1 ppm) would increase false predictions due to the increased mathematical possibility of other elemental combinations. The Kendrick mass defect (KMD) plot (Fig. 4e) allows the identification of homologous series. Members of such series have the same Kendrick mass defect (Kendrick, 1963), such as CnH2n−2O3 with n= 5–15 (KMD = 0.082), CnH2n−4O4 with n= 4–16 (KMD = 0.119), or CnH2n−2O5 with n = 3–14 (KMD = 0.128). Also, CHOS compounds form homologous series like CnH2nO5S with n= 2–8 (KMD = 0.178) or CnH2nO6S with n= 2–10 (KMD = 0.201). The appearance of these homologous series can be interpreted as oxygenated aliphatic hydrocarbons of fossil origin, as homologous series of (sulfur-containing) aliphatics can be detected in crude oil.
3.2.2 Aerosolomics database assignment
The results from the NTA of the ambient samples were compared with the outcome from the PAM-OFR experiments in order to estimate the contribution of oxidation products formed by several precursors to ambient PM2.5. Out of a total of 580 detected CHO compounds, we can assign 108 CHO compounds to biogenic precursors and 24 CHO compounds to anthropogenic VOCs using our Aerosolomics database. The bar plot in Fig. 5 divides the CHO fraction into the different contributions examined; 40.8 % of the mean signal intensity can be attributed to SOA that originated from biogenic precursors (gradations of green and yellow). Out of this, 26.5 % accounts for experiments with OH oxidation, and 14.3 % accounts for ozonolysis experiments. The two major biogenic precursors are α- and β-pinene, with a respective share of 17.6 % and 13.2 %. The remaining shares are distributed among trans-caryophyllene products (4.2 %), limonene products (3.6 %), and 3-carene products (2.2 %). Anthropogenic precursors (gradations of magenta) play a minor role, with a total contribution of 5.7 %. From that, 2 % can be assigned to o-xylene, 1.9 % to naphthalene, 1.2 % to 1,2,4-trimethylbenzene, and 0.6 % to toluene. Apart from this, 53.5 % of the mean signal intensity could not be assigned (diagonally hatched).
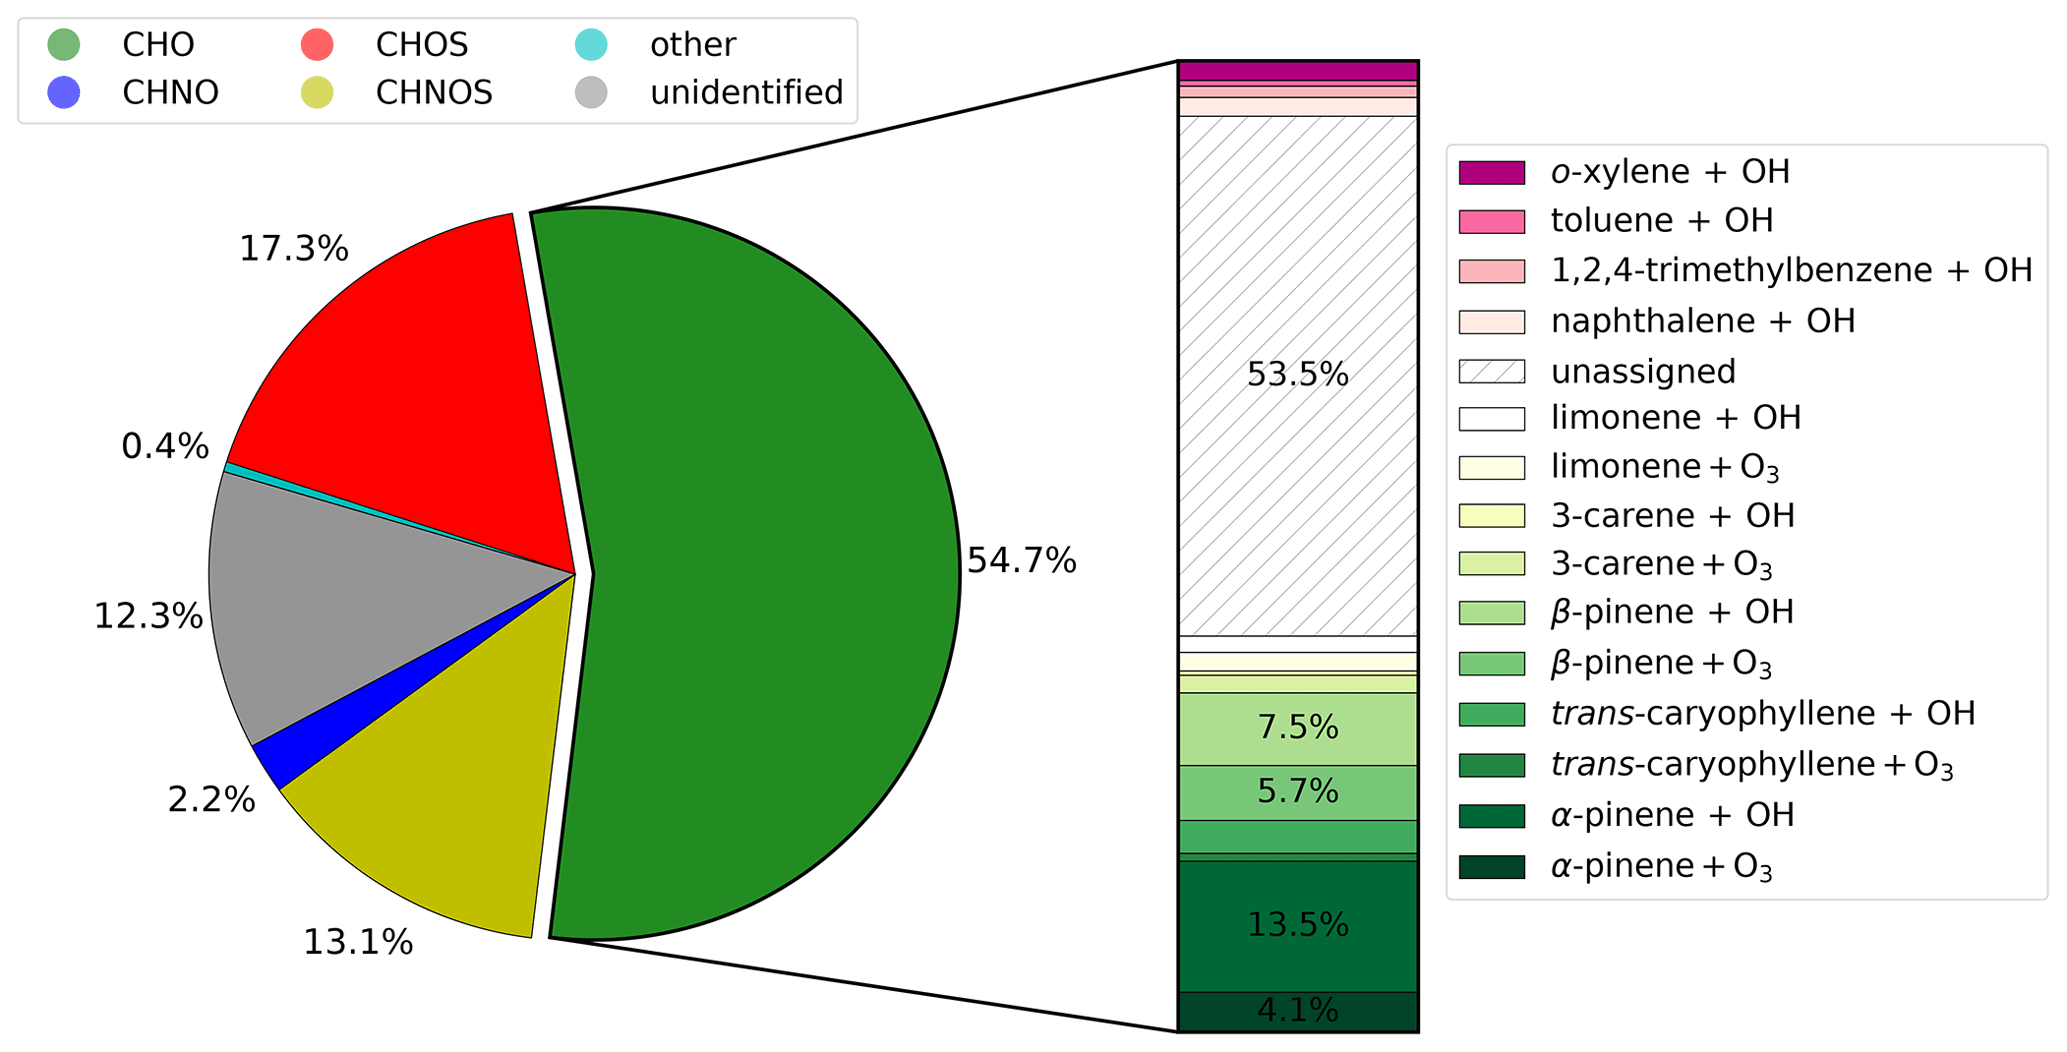
Figure 5Contribution of different molecular formula groupings to the mean signal intensity of the molecular fingerprint from the representative selection shown in Fig. 4. Compounds of the CHO group were compared to the libraries of the individual OFR experiments presented in Sect. 3.1 and dedicated to a plausible SOA precursor and oxidation condition shown in the bar.
The majority of the assigned compounds from the representative selection of the Vienna field campaign have molecular masses smaller than 250 Da and a retention time lower than 10 min (Fig. S4a). The mean number of carbon atoms is 9, and the mean is −0.4 (Fig. S4b). SOA that originated from biogenic precursors is located in the H C area between 1.2 and 1.8 (Fig. S4c), while compounds with H C < 1.2 can be of aromatic character. The observation that 19 % of the CHO compounds (number-wise) in the database are responsible for nearly 50 % of the mean signal intensity demonstrates the high relevance of the investigated VOCs in SOA formation. Nevertheless, a few compounds with high signal intensities remain unassigned, such as C8H14O5, C7H6O2, C9H16O4, or the tentatively isoprene-derived C4H6O5 and C4H8O4 (Claeys and Maenhaut, 2021; Krechmer et al., 2015). Considering the retention behavior and the molecular mass of these unassigned compounds (Fig. S4a), we expect isoprene as well as other monoterpenes to be promising candidates for closing this gap. In addition, the precursors already used should be investigated under varying chemical conditions, such as with further oxidants or more complex mixtures of VOCs. A comprehensive study of isoprene oxidation is planned, and the outcome will be uploaded to the Aerosolomics database in the near future.
Beside CHO compounds, CHOS and CHNOS compounds play an important role in the overall composition of suburban SOA. Based on these outcomes, further experiments with various VOCs and complex mixtures including inorganic trace gases need to be performed, and the results have to be added to the Aerosolomics database.
3.3 Hierarchical cluster analysis
In Fig. 6, we show the results of the HCA (as a heatmap with dendrograms), with the ambient PM2.5 filter samples from the Vienna field campaign on the horizontal axis and the detected compounds of the NTA on the vertical axis. The color code of the heatmap represents the standardized values of the integrated peak intensities after background correction. We find that the driving factors for the clustering of the filter samples are the wind direction overlaid by the diurnal cycle and the influence of decreasing temperatures, as explained in the following section. Clusters that contain mostly nighttime samples are shaded by a gray background. The ones that contain mainly daytime samples are shaded by a yellow background, while samples during a low-temperature period are shaded by a blue background. Over the entire period, the mean PM2.5 mass concentration was 8.7 ± 4.4 µg m−3, the mean NOx concentration was 15.4 ± 16.7 µg m−3, the mean SO2 concentration was 1.5 ± 1.2 µg m−3, and the mean CO concentration was 0.17 ± 0.03 mg m−3. A detailed time series of meteorological data, PM2.5, and trace gas concentrations is shown in Fig. S5. Additionally, Fig. S6 shows the distribution of the wind direction of sample clusters a to i. With the exception of sample clusters b and f, all clusters show a predominant wind direction. The overall mean PM2.5 mass concentration was higher during collection in sample cluster I (10.3 ± 4.1 µg m−3) compared to sample cluster II (5.0 ± 2.4 µg m−3).
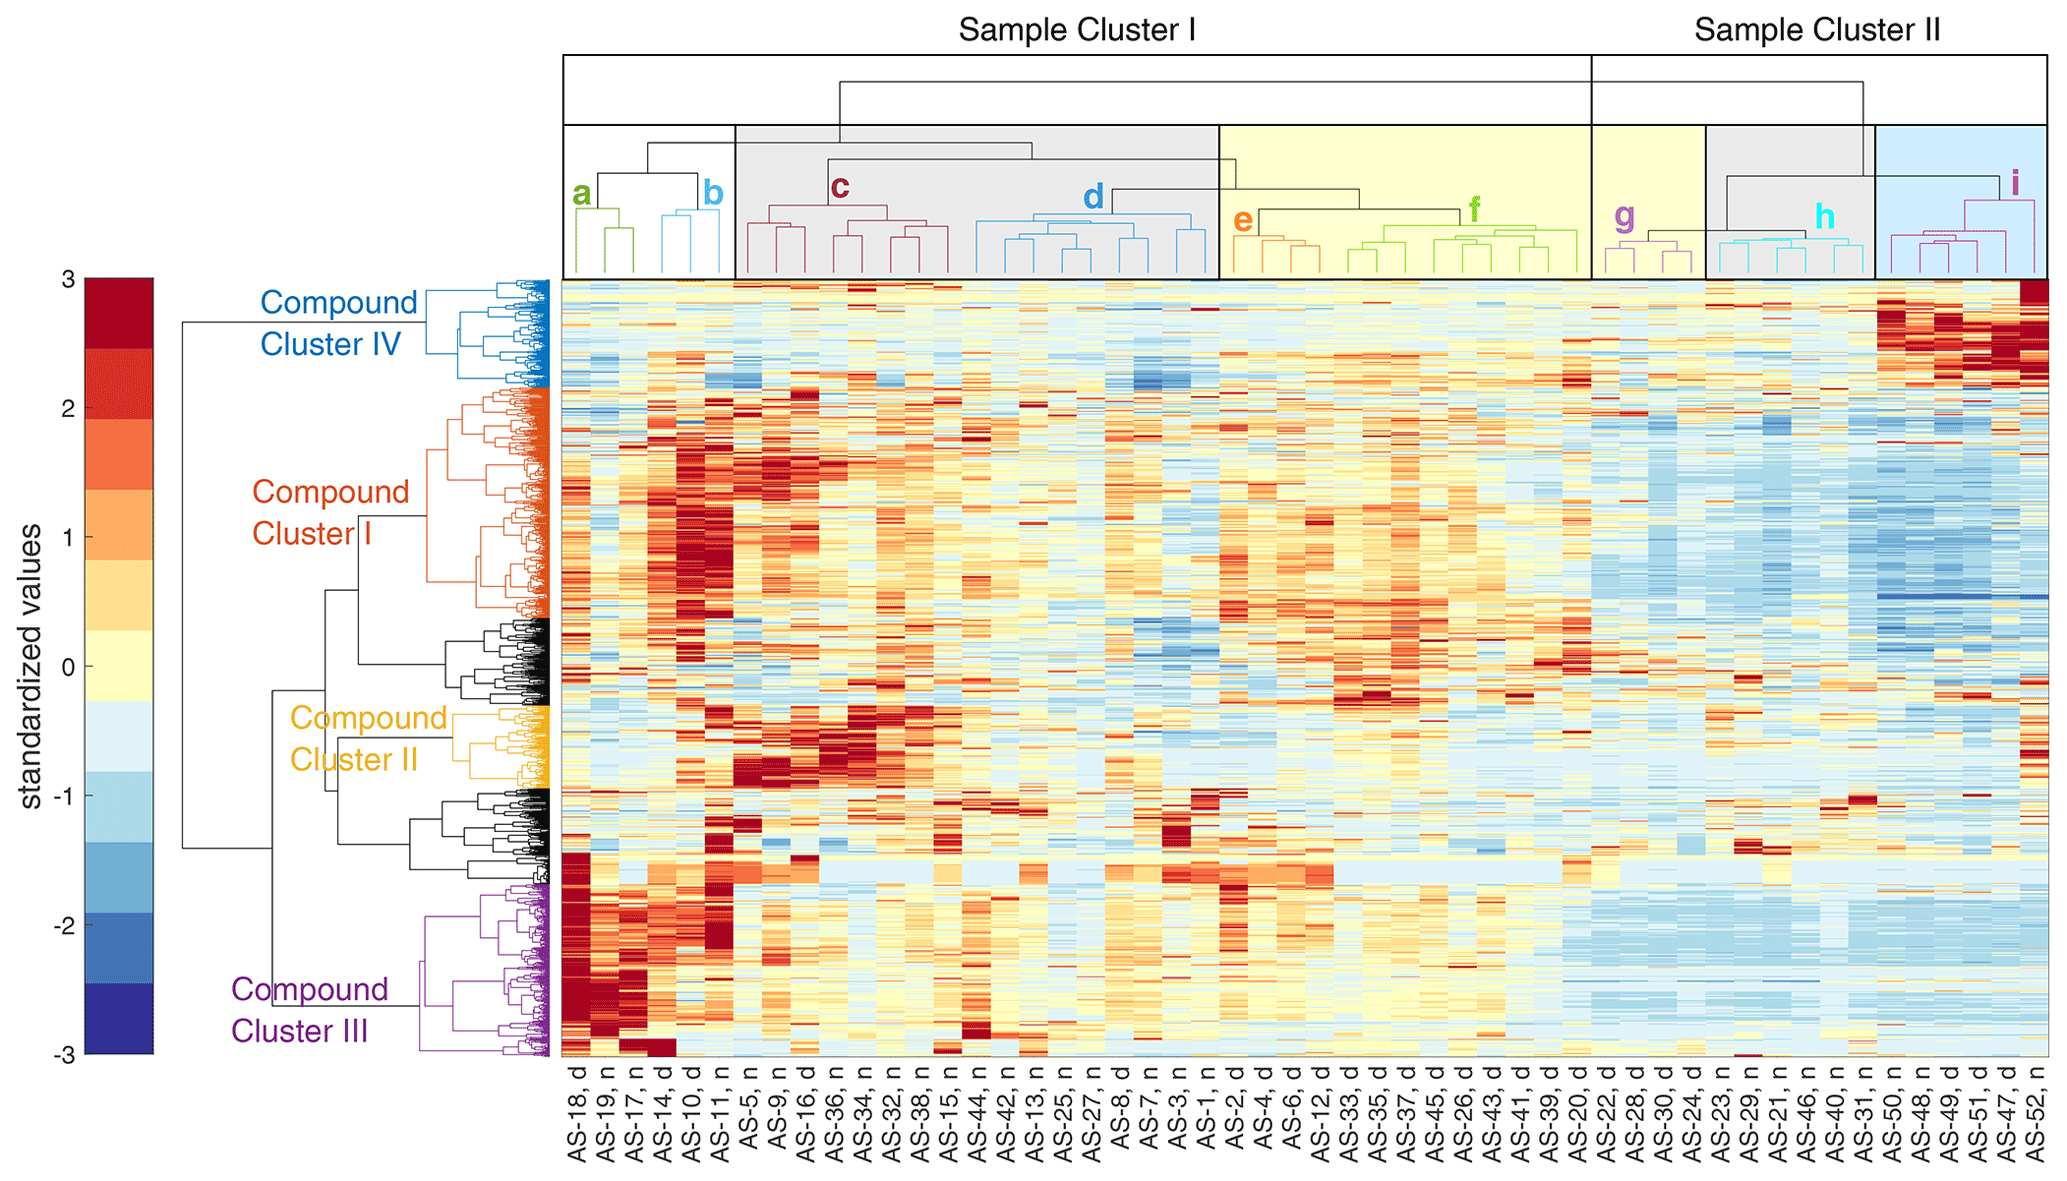
Figure 6Standardized matrix of the detected compounds from the NTA of the filter samples from the Vienna field campaign. Parts of the horizontal dendrogram of the filter samples are shaded in gray for night cluster, yellow for day cluster, and blue for clustered samples at decreasing temperatures. The vertical compound clusters are separated into four subclusters according to day- and nighttime chemistry, organosulfates, and temperature dependency. For a better differentiation, the dendrograms are colored randomly.
3.3.1 Compound cluster I – daytime chemistry
Figure 7a–c illustrate the molecular fingerprint of the 373 compounds occurring in compound cluster I; 79 % of the mean signal intensity is caused by CHO compounds, 16 % is unidentified, and 4 % is caused by CHOS compounds. The molecular masses of the compounds are in the range between 100 and 350 Da. CHO compounds mainly have masses smaller than 250 Da and a mean bulk composition of C8.5H12.5O5, which is in good agreement with the appearance of monomers from monoterpene oxidation during daytime. The number of carbon atoms ranges mainly between 4 and 10 (Fig. 7b), indicating biogenic VOCs, like monoterpenes, as potential precursors. The compounds cover a large range in volatility, with log10 C* values between −4.0 and 6.5 µg m−3 (Fig. 8a), corresponding mainly to LVOC–IVOC, with an intensity-weighted log10 C* mean value of 2.3 ± 1.6 µg m−3. Only a small fraction of the detected compounds have an H C smaller 1.2, indicating an aromatic character. The five most abundant compounds with a predicted composition are MBTCA (Aerosolomics database library: α-pinene + OH), hydroxyterpenylic acid, C5H6O7, C4H6O5, and C7H10O5. All five compounds are characterized as biogenic SOA compounds derived from isoprene or monoterpenes (Chen et al., 2018, 2020; Ehn et al., 2012; Müller et al., 2012; Qi et al., 2020).
CHOS compounds appear less important in this compound cluster based on a 5 % contribution to the mean signal intensity. Nevertheless, about 45 % of the mean CHOS signal intensity can be attributed to monoterpene- and isoprene-derived SOA (Brüggemann et al., 2020).
It is also remarkable that compounds appearing in this cluster show low standardized values in sample cluster II. Low standardized values indicate lower signal intensities of the MS measurements. However, it needs to be considered that equal signal intensities of different compounds do not necessarily mean equal concentrations. It is well known that the ionization efficiency of HESI varies greatly for several compounds and compound classes (Kenseth et al., 2020; Ma et al., 2022). Nevertheless, variation in the intensity of a single compound or class of compounds can be qualitatively interpreted as a variation of its concentration. Compared to a mean temperature of 25.5 ± 4.8 ∘C during sample cluster I, the mean temperature of sample cluster II is noticeably lower at 19.3 ± 4.3 ∘C. In particular, the sub-cluster including the last six samples of the entire field campaign shows the lowest standardized values and the lowest mean temperature of 16.1 ± 3.3 ∘C. The correlation of lower temperatures and low standardized values can be explained due to the temperature dependency of terpene emissions from plants (Holzke et al., 2006) resulting in a lower biogenic SOA burden in the atmosphere.
3.3.2 Compound cluster II – nighttime chemistry
The mean signal intensity of the 134 compounds appearing in compound cluster II (Fig. 7d–f) is mainly caused by CHO (78 %) and CHNO (14 %) compounds. The molecular masses reach up to 440 Da, and the mean bulk composition is C11.9H18.2O5.1. The of these CHO compounds is in the range of −1 to 0.5 (Fig. 7e). Analogously to compound cluster I, the H C is in the range of 1.2–1.8 (Fig. 7f), indicating biogenic SOA. Log10 C* values range from −7.1 to 6.7 µg m−3 (Fig. 8b), corresponding mainly to LVOC–IVOC with an intensity-weighted mean of 2.3 ± 2.7 µg m−3. The most prominent compound is pinic acid (Aerosolomics database library: α-pinene/β-pinene + O3) with a contribution of about 24 % to the mean signal intensity. It is well described as a α- and β-pinene ozonolysis product (Christoffersen et al., 1998; Glasius et al., 2000).
In contrast to sample cluster I, compounds from nighttime chemistry form a higher ratio of dimers, with oxidation products up to 20 carbon atoms (Fig. 7e). A total of 14 of 23 CHO dimers occurring in compound cluster II are also reported from OFR experiments performed by Kristensen et al. (2016) and agree with our findings from the OFR experiments described in Sect. 3.1. These 14 dimers are responsible for 72 % of the mean dimer signal intensity. Among them are pinyl-diaterpenyl ester C17H26O8 (Aerosolomics database library: α-pinene β-pinene + O3) and C19H28O7 (Aerosolomics database library: α-pinene 3-carene + O3), both of which are described as esters between pinic acid and terpenylic acid (Gao et al., 2010) or pinic acid and hydroxypinonic acid (Müller et al., 2008), respectively. Furthermore, Yasmeen et al. (2010) reported pinyl-diaterpenyl ester in nighttime ambient aerosol.
While, the main oxidant of VOCs is OH during the day, at night, O3 and NO3 dominate the oxidation process, resulting in the formation of organonitrates (Kiendler-Scharr et al., 2016). In accordance, we observed several nitrogen-containing monomers and dimers, including , in the corresponding MS2 spectra. Hence, about 87 % of the CHNO compounds at night are tentatively identified as organonitrates (R−ONO2).
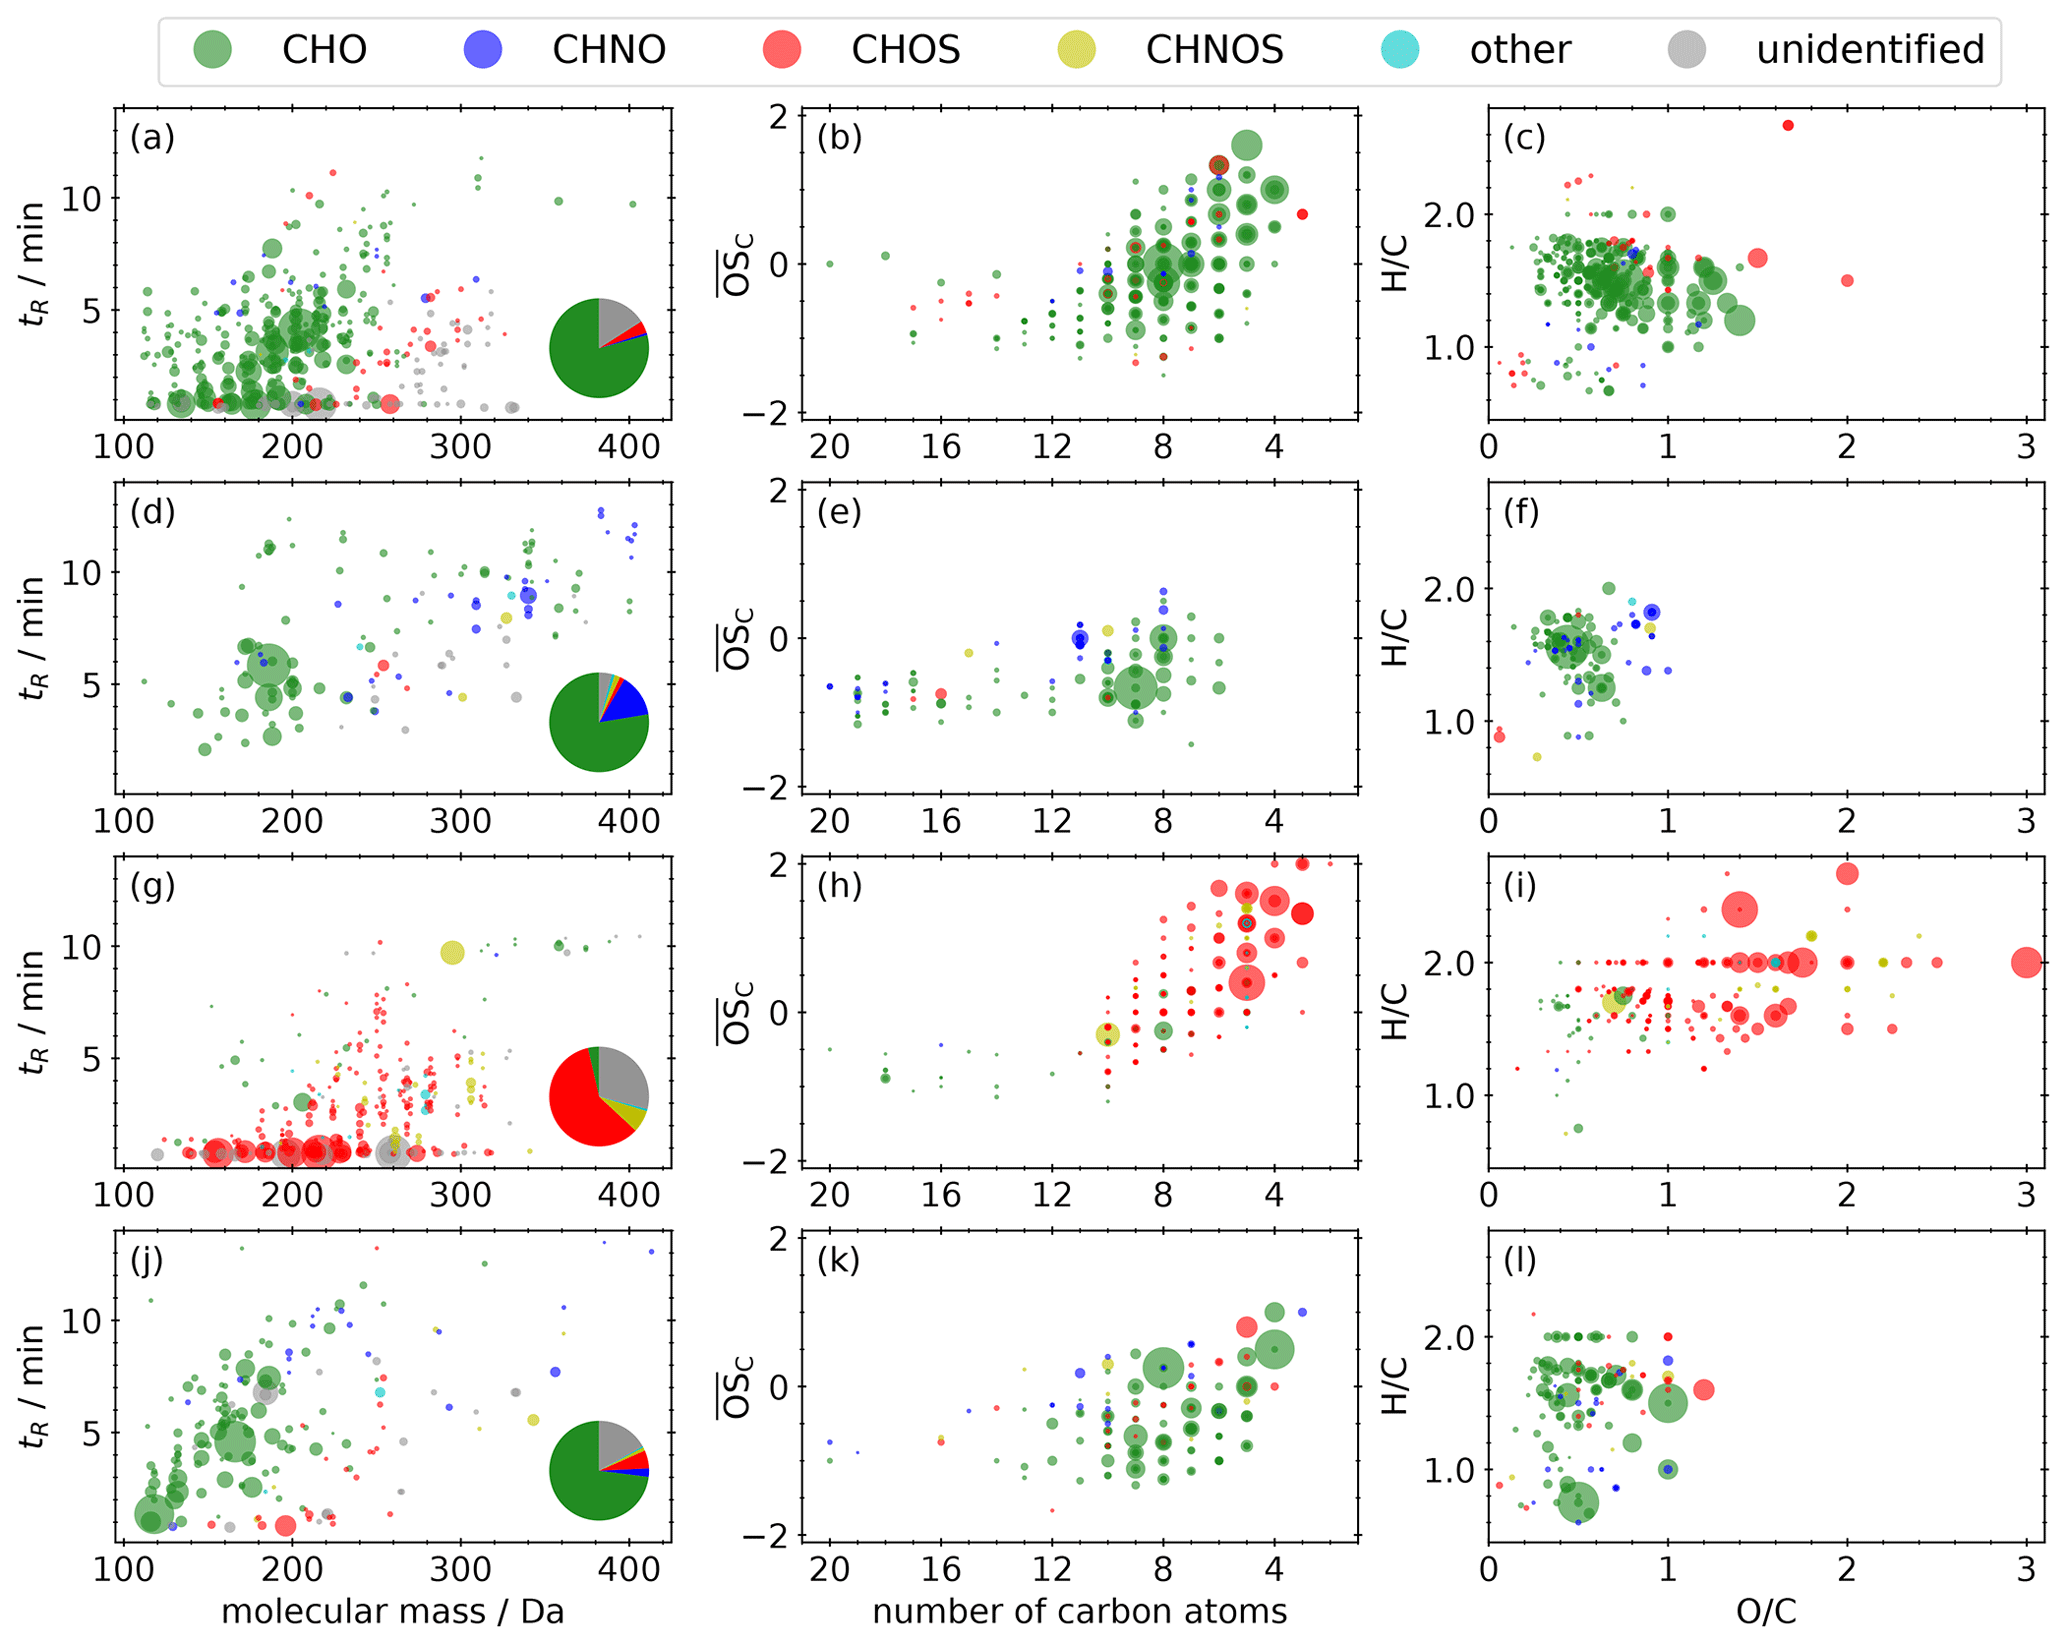
Figure 7Molecular fingerprint of compounds that appear in compound clusters I (a–c), II (d–f), III (g–i), and IV (j–l), illustrated as retention time vs. molecular mass, Kroll diagram, and van Krevelen diagram. The area of the scatters represents the mean signal intensity on a linear scale. The pie chart shows the proportions of the different molecular formula groupings.
3.3.3 Compound cluster III – organosulfates (CHOS)
Compound cluster III includes 279 compounds (Fig. 7g–i). The mean signal intensity of compound cluster III is mainly caused by CHOS compounds (60 %), followed by unidentified (29 %) and CHNOS compounds (7 %). The molecular masses of the compounds reach from 120 to 350 Da; those with higher mean signal intensities show only a very limited retention (<0.9 min) due to high polarity and represent about 72 % of the mean signal intensity. These compounds have ≤ 5 carbon atoms and an between 0 and 4 (Fig. 7h). The generally higher H C compared to other compound clusters, shown in panel (i), indicates a predominantly aliphatic character of the detected compounds. The saturation vapor pressure (log10 C*) ranges between −8.8 and 5.0 µg m−3 (Fig. 8c), which is noticeably lower compared to compound clusters I and II. The intensity-weighted mean of log10 C* of this cluster yields −0.9 ± 2.0 µg m−3.
Several of the chemical formulas can be described as isoprene-derived SOA (Brüggemann et al., 2020; Chen et al., 2018; Nestorowicz et al., 2018; Riva et al., 2016; Surratt et al., 2007). From 174 CHOS compounds in compound cluster III, 163 MS2 spectra were recorded. From those, the vast majority (98 %) shows the fragment at 96.9601 (), indicating an organosulfate functional group (R−OSO3). The remaining 2 % only show 79.9573 (). While this sulfur trioxide radical anion can indeed occur in an organosulfate fragment spectra (Wang et al., 2019), it could also originate from organosulfonates (R−SO3) (Liang et al., 2020; Liu et al., 2015). Besides one high signal intensity of a CHNOS compound at 295 Da and 9.7 min (C10H17NO7S), three further series of isomers appear in the CHOS cluster. We identified six isomers of C5H10N2O11S, four isomers of C5H11NO9S, and three isomers of C5H9NO8S. All three chemical formulas can be described as isoprene-derived SOA (Nestorowicz et al., 2018; Surratt et al., 2007, 2008). Furthermore, three isomers of C5H9NO7S also appear in this compound cluster but have not yet been described as isoprene-derived SOA.
The distinct increased standardized values of several cluster III compounds in the heatmap between 8 August 2018 at 17:00 (UTC, AS-17) and 10 August 2018 at 05:00 (UTC, AS-19) can be explained by high SO2 concentrations up to 18 µg m−3 around noon on 8 August 2018 (Fig. S5). The nearby airport can be excluded as a main source due to similar high SO2 concentrations at the Stixneusiedl monitoring station (Umweltbundesamt GmbH, 2021), located 12 km southeast of the airport and thus in the upwind direction of the airport. It is also noticeable that the standardized values of these cluster III compounds are very low during northwest trajectories, analogously to compound cluster I (Sect. 3.3.1). Therefore, it is likely that this cluster is mainly linked to long-range transport of pollution from the southeast.
3.3.4 Compound cluster IV – decreasing temperature
Compounds occurring in compound cluster IV (Fig. 7j–l) show clearly increased standardized values during the last six filter samples of the field campaign and are mainly CHO (73 %) and unidentified (17 %) compounds. The majority of the cluster IV compounds have molecular masses <200 Da. The of those compounds ranges between −1.5 and 1, while the numbers of carbon are less than 10 (Fig. 7k). The majority of the 174 compounds have a non-aromatic character, illustrated in panel (l). Dicarboxylic acids like phthalic acid (C8H6O4, level 1), succinic acid (C4H6O4, level 3), or maleic and fumaric acid (C4H4O4, level 3) are reported as tracers for emissions from biomass burning, vehicular exhaust, and fossil fuel combustion (Zhao et al., 2018). Furthermore, this compound cluster contains the homologous series , , and , which can be interpreted as oxygenated aliphatics of fossil origin.
Compound cluster IV includes log10 C* values between −8.6 and 6.5 µg m−3 (Fig. 8d), corresponding predominantly to SVOC–IVOC with an intensity-weighted mean of 3.9 ± 1.9 µg m−3. The high standardized values in the dendrogram of these compounds in sample sub-cluster i can be attributed to their intermediate volatility, which will only occur in the condensed particle phase at low ambient temperatures. During sample cluster I, which is characterized by a higher mean temperature, those compounds would likely partition predominantly into the gas phase.
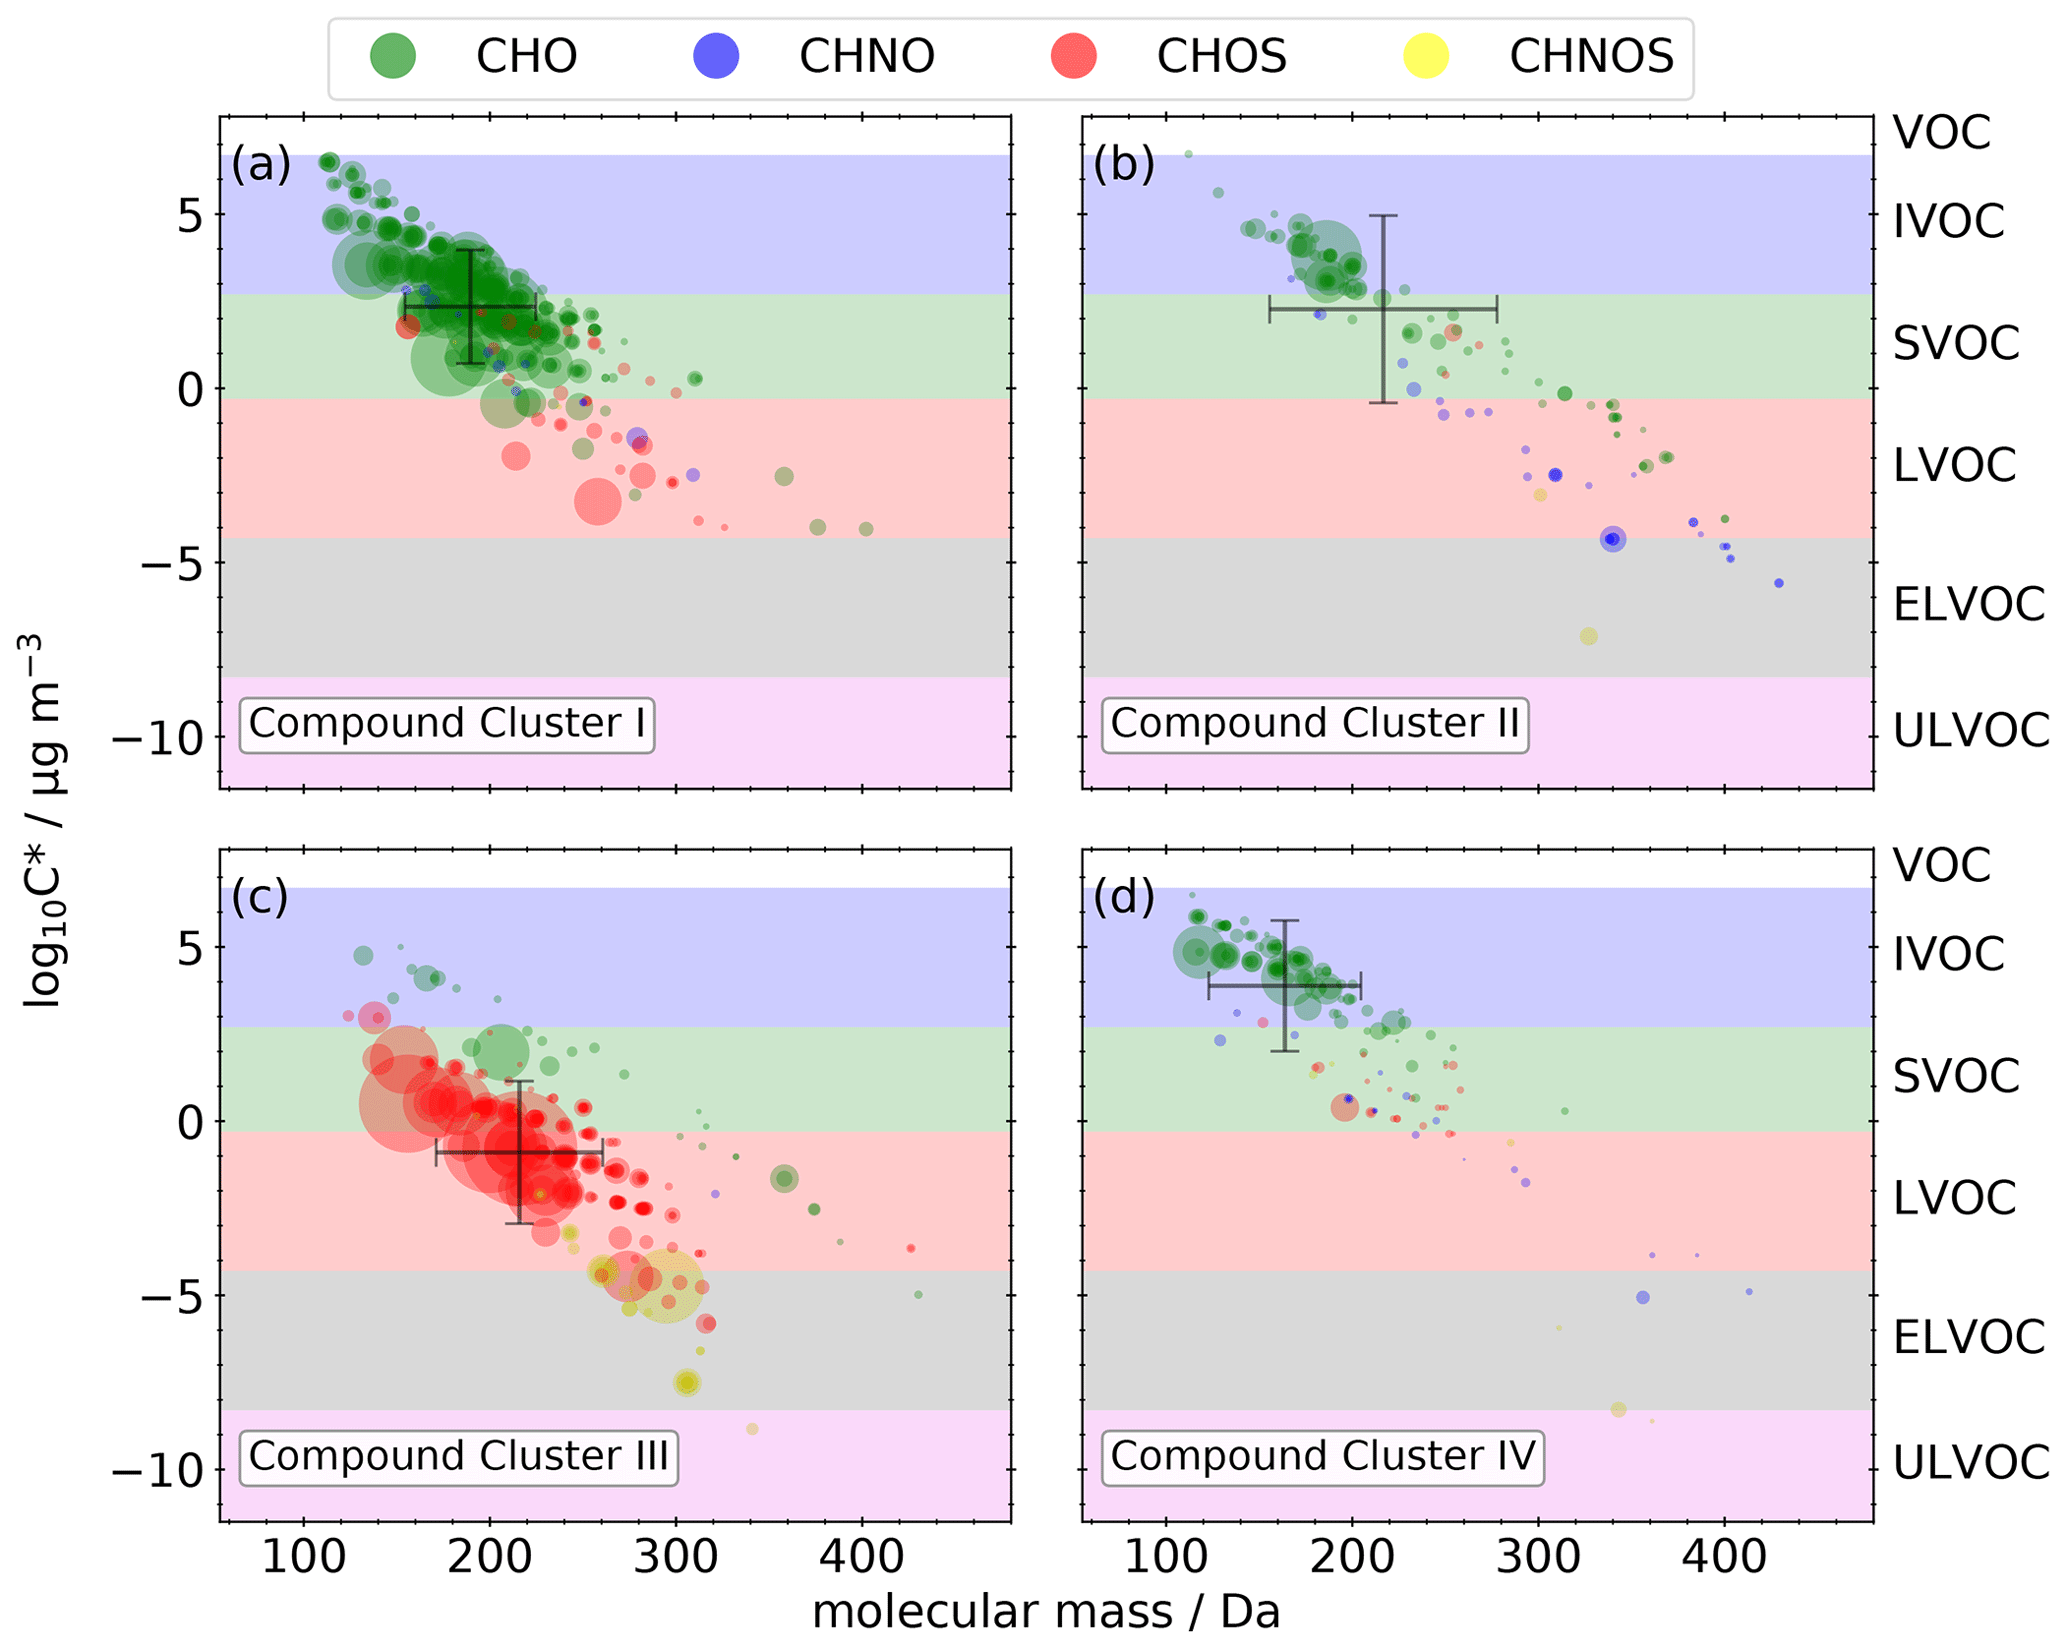
Figure 8Calculated effective saturation mass concentrations of compounds appearing in compound clusters I–IV (a–d) with the intensity-weighted mean and standard deviation.
3.4 Challenges with measurements in HESI positive ionization mode
All results in this paper are based on negative ionization mode measurements. For a comprehensive assessment of the chemical composition of the investigated PM2.5, measurements in positive ionization mode ((+)HESI) are essential with respect to relevant compound classes that are considerably better ionized in (+)HESI (e.g., organophosphates, phthalates, pesticides, and others). Issues due to strong fragmentation or ion source adduct formation, which are explained in detail in the Supplement, highlight the need for further optimization of the NTA workflow to prevent false identifications and thus misinterpretations of the results.
A large fraction of ambient PM2.5 consists of anthropogenic and biogenic SOA. The chemical composition of this mixture is highly complex, which hinders the identification and attribution of single molecules to their precursors, potential sources, and formation pathways. In this study, we present two complementary approaches that enable complexity reduction and the identification of the precursors, formation pathways, and partitioning effects of various IVOCs.
The introduced Aerosolomics database for compound matching and precursor identification is based on PAM-OFR experiments with five biogenic and four anthropogenic precursors, as well as different oxidizing regimes (OH, O3). In order to validate the method on ambient samples, we applied the database to a set of PM2.5 filter samples. Based on the average composition of these samples, we find that CHO compounds account for the largest proportion, with about 55 % of the mean signal intensity. Approximately 45 % of the CHO compounds can be attributed to one of the investigated VOC precursors, which we confirmed by the compound-matching procedure. Hence, the compounds are identified based on retention time, exact mass-to-charge ratio, isotopic pattern, and the MS2 fragmentation spectrum.
On a 1-month set of 12 h filter samples, we performed an HCA to reduce the complexity due to the large number of compounds detected. The compounds were clustered when their intensities showed similar behavior over time, which in turn indicates similar sources or (trans)formation pathways. The clustering of the various PM2.5 filter samples was primarily driven by wind direction, as well as by the diurnal cycle (day or night) and temperature-driven partitioning changes. Known proxies for monoterpene ozonolysis, like pinic acid or α-pinene-derived dimers, were identified in the nighttime compound cluster. The SOA-aging tracer MBTCA appeared in the daytime compound cluster. A large number of sulfur-containing compounds were clustered together, and this cluster was clearly elevated during a southeasterly wind direction. Small IVOCs were clustered and showed high intensities during a cold period. These observations are a proof of principle for the following: (1) the presented Aerosolomics database enables the identification of tracers from the oxidation of different VOC precursors; (2) in combination with HCA, we can attribute different oxidation products to either nighttime or daytime chemistry, identify periods of multiphase-chemistry processes resulting in organosulfate formation, and observe temperature-driven partitioning of IVOCs.
We would like to encourage the community to apply the database to their own samples. Therefore, we provide the database as db-files, msp-files, and csv-files, which allows the application of the database with Compound Discoverer, MZmine 3, or any self-built solution. As a community effort, further input to the database is desirable to improve our understanding of the sources and formation of secondary organic aerosol.
Data from this work are freely available at zenodo.org https://doi.org/10.5281/zenodo.6623244 (Thoma et al., 2022).
The supplement related to this article is available online at: https://doi.org/10.5194/amt-15-7137-2022-supplement.
MT wrote the paper, and ALV and MS advised on the writing of paper. MT and ALV conceptualized the study. MT, FB, FLG, and MS were responsible for the laboratory experiments, sample preparation, and measurements. Data evaluation was done by MT. ALV directed the project administration. All authors commented on the paper and contributed to the scientific discussion.
The contact author has declared that none of the authors has any competing interests.
Publisher’s note: Copernicus Publications remains neutral with regard to jurisdictional claims in published maps and institutional affiliations.
We thank Sophia Brilke, Dominik Stolzenburg, Paulus Bauer, and Paul Winkler (Faculty of Physics, University of Vienna) for the ambient filter sampling and trace gas monitoring. We also thank the working group of Joachim Curtius (Institute for Atmospheric and Environmental Sciences, Goethe-University Frankfurt) for the experimental support.
This research has been supported by the Deutsche Forschungsgemeinschaft (DFG; German Research Foundation) (grant nos. 410009325 and 428312742 (TRR 301)).
This open-access publication was funded by the Goethe University Frankfurt.
This paper was edited by Bin Yuan and reviewed by two anonymous referees.
Al-Naiema, I. M., Offenberg, J. H., Madler, C. J., Lewandowski, M., Kettler, J., Fang, T., and Stone, E. A.: Secondary Organic Aerosols from Aromatic Hydrocarbons and their Contribution to Fine Particulate Matter in Atlanta, Georgia, Atmos. Environ., 223, 117227, https://doi.org/10.1016/j.atmosenv.2019.117227, 2020. a
Brüggemann, M., Xu, R., Tilgner, A., Kwong, K. C., Mutzel, A., Poon, H. Y., Otto, T., Schaefer, T., Poulain, L., Chan, M. N., and Herrmann, H.: Organosulfates in Ambient Aerosol: State of Knowledge and Future Research Directions on Formation, Abundance, Fate, and Importance, Environ. Sci. Technol., 54, 3767–3782, https://doi.org/10.1021/acs.est.9b06751, 2020. a, b
Burkholder, J. B., Abbatt, J. P. D., Barnes, I., Roberts, J. M., Melamed, M. L., Ammann, M., Bertram, A. K., Cappa, C. D., Carlton, A. G., Carpenter, L. J., Crowley, J. N., Dubowski, Y., George, C., Heard, D. E., Herrmann, H., Keutsch, F. N., Kroll, J. H., McNeill, V. F., Ng, N. L., Nizkorodov, S. A., Orlando, J. J., Percival, C. J., Picquet-Varrault, B., Rudich, Y., Seakins, P. W., Surratt, J. D., Tanimoto, H., Thornton, J. A., Tong, Z., Tyndall, G. S., Wahner, A., Weschler, C. J., Wilson, K. R., and Ziemann, P. J.: The Essential Role for Laboratory Studies in Atmospheric Chemistry, Environ. Sci. Technol., 51, 2519–2528, https://doi.org/10.1021/acs.est.6b04947, 2017. a
Chen, X., Xie, M., Hays, M. D., Edgerton, E., Schwede, D., and Walker, J. T.: Characterization of organic nitrogen in aerosols at a forest site in the southern Appalachian Mountains, Atmos. Chem. Phys., 18, 6829–6846, https://doi.org/10.5194/acp-18-6829-2018, 2018. a, b
Chen, Y., Takeuchi, M., Nah, T., Xu, L., Canagaratna, M. R., Stark, H., Baumann, K., Canonaco, F., Prévôt, A. S. H., Huey, L. G., Weber, R. J., and Ng, N. L.: Chemical characterization of secondary organic aerosol at a rural site in the southeastern US: insights from simultaneous high-resolution time-of-flight aerosol mass spectrometer (HR-ToF-AMS) and FIGAERO chemical ionization mass spectrometer (CIMS) measurements, Atmos. Chem. Phys., 20, 8421–8440, https://doi.org/10.5194/acp-20-8421-2020, 2020. a
Christoffersen, T., Hjorth, J., Horie, O., Jensen, N., Kotzias, D., Molander, L., Neeb, P., Ruppert, L., Winterhalter, R., Virkkula, A., Wirtz, K., and Larsen, B.: cis-pinic acid, a possible precursor for organic aerosol formation from ozonolysis of α-pinene, Atmos. Environ., 32, 1657–1661, https://doi.org/10.1016/S1352-2310(97)00448-2, 1998. a
Claeys, M. and Maenhaut, W.: Secondary Organic Aerosol Formation from Isoprene: Selected Research, Historic Account and State of the Art, Atmosphere, 12, 6, https://doi.org/10.3390/atmos12060728, 2021. a, b
Claeys, M., Iinuma, Y., Szmigielski, R., Surratt, J. D., Blockhuys, F., Van Alsenoy, C., Böge, O., Sierau, B., Gómez-González, Y., Vermeylen, R., Van der Veken, P., Shahgholi, M., Chan, A. W. H., Herrmann, H., Seinfeld, J. H., and Maenhaut, W.: Terpenylic Acid and Related Compounds from the Oxidation of α-Pinene: Implications for New Particle Formation and Growth above Forests, Environ. Sci. Technol., 43, 6976–6982, https://doi.org/10.1021/es9007596, 2009. a
Daellenbach, K. R., Kourtchev, I., Vogel, A. L., Bruns, E. A., Jiang, J., Petäjä, T., Jaffrezo, J.-L., Aksoyoglu, S., Kalberer, M., Baltensperger, U., El Haddad, I., and Prévôt, A. S. H.: Impact of anthropogenic and biogenic sources on the seasonal variation in the molecular composition of urban organic aerosols: a field and laboratory study using ultra-high-resolution mass spectrometry, Atmos. Chem. Phys., 19, 5973–5991, https://doi.org/10.5194/acp-19-5973-2019, 2019. a
Ditto, J. C., Barnes, E. B., Khare, P., Takeuchi, M., Joo, T., Bui, A. A. T., Lee-Taylor, J., Eris, G., Chen, Y., Aumont, B., Jimenez, J. L., Ng, N. L., Griffin, R. J., and Gentner, D. R.: An omnipresent diversity and variability in the chemical composition of atmospheric functionalized organic aerosol, Commun. Chem., 1, 75, https://doi.org/10.1038/s42004-018-0074-3, 2018. a
Ehn, M., Kleist, E., Junninen, H., Petäjä, T., Lönn, G., Schobesberger, S., Dal Maso, M., Trimborn, A., Kulmala, M., Worsnop, D. R., Wahner, A., Wildt, J., and Mentel, Th. F.: Gas phase formation of extremely oxidized pinene reaction products in chamber and ambient air, Atmos. Chem. Phys., 12, 5113–5127, https://doi.org/10.5194/acp-12-5113-2012, 2012. a
Fiehn, O.: Metabolomics – the link between genotypes and phenotypes, Plant Mol. Biol., 48, 155–171, https://doi.org/10.1023/A:1013713905833, 2002. a
Fuzzi, S., Baltensperger, U., Carslaw, K., Decesari, S., Denier van der Gon, H., Facchini, M. C., Fowler, D., Koren, I., Langford, B., Lohmann, U., Nemitz, E., Pandis, S., Riipinen, I., Rudich, Y., Schaap, M., Slowik, J. G., Spracklen, D. V., Vignati, E., Wild, M., Williams, M., and Gilardoni, S.: Particulate matter, air quality and climate: lessons learned and future needs, Atmos. Chem. Phys., 15, 8217–8299, https://doi.org/10.5194/acp-15-8217-2015, 2015. a
Gao, Y., Hall, W. A., and Johnston, M. V.: Molecular Composition of Monoterpene Secondary Organic Aerosol at Low Mass Loading, Environ. Sci. Technol., 44, 7897–7902, https://doi.org/10.1021/es101861k, 2010. a
Glasius, M., Lahaniati, M., Calogirou, A., Di Bella, D., Jensen, N. R., Hjorth, J., Kotzias, D., and Larsen, B. R.: Carboxylic Acids in Secondary Aerosols from Oxidation of Cyclic Monoterpenes by Ozone, Environ. Sci. Technol., 34, 1001–1010, https://doi.org/10.1021/es990445r, 2000. a, b
Hallquist, M., Wenger, J. C., Baltensperger, U., Rudich, Y., Simpson, D., Claeys, M., Dommen, J., Donahue, N. M., George, C., Goldstein, A. H., Hamilton, J. F., Herrmann, H., Hoffmann, T., Iinuma, Y., Jang, M., Jenkin, M. E., Jimenez, J. L., Kiendler-Scharr, A., Maenhaut, W., McFiggans, G., Mentel, Th. F., Monod, A., Prévôt, A. S. H., Seinfeld, J. H., Surratt, J. D., Szmigielski, R., and Wildt, J.: The formation, properties and impact of secondary organic aerosol: current and emerging issues, Atmos. Chem. Phys., 9, 5155–5236, https://doi.org/10.5194/acp-9-5155-2009, 2009. a
Hammes, J., Lutz, A., Mentel, T., Faxon, C., and Hallquist, M.: Carboxylic acids from limonene oxidation by ozone and hydroxyl radicals: insights into mechanisms derived using a FIGAERO-CIMS, Atmos. Chem. Phys., 19, 13037–13052, https://doi.org/10.5194/acp-19-13037-2019, 2019. a
HighChem LLC: mzCloud Advanced Mass Spectral Database, https://www.mzcloud.org (last access: 10 August 2021), 2013–2021. a
Holzke, C., Dindorf, T., Kesselmeier, J., Kuhn, U., and Koppmann, R.: Terpene emissions from European beech (shape Fagus sylvatica∼L.): Pattern and Emission Behaviour Over two Vegetation Periods, J. Atmos. Chem., 55, 81–102, https://doi.org/10.1007/s10874-006-9027-9, 2006. a
Huang, R.-J., Zhang, Y., Bozzetti, C., Ho, K.-F., Cao, J.-J., Han, Y., Daellenbach, K. R., Slowik, J. G., Platt, S. M., Canonaco, F., Zotter, P., Wolf, R., Pieber, S. M., Bruns, E. A., Crippa, M., Ciarelli, G., Piazzalunga, A., Schwikowski, M., Abbaszade, G., Schnelle-Kreis, J., Zimmermann, R., An, Z., Szidat, S., Baltensperger, U., Haddad, I. E., and Prévôt, A. S. H.: High secondary aerosol contribution to particulate pollution during haze events in China, Nature, 514, 218–222, https://doi.org/10.1038/nature13774, 2014. a
Isaacman-VanWertz, G. and Aumont, B.: Impact of organic molecular structure on the estimation of atmospherically relevant physicochemical parameters, Atmos. Chem. Phys., 21, 6541–6563, https://doi.org/10.5194/acp-21-6541-2021, 2021. a
Jaoui, M., Leungsakul, S., and Kamens, R. M.: Gas and Particle Products Distribution from the Reaction of β-Caryophyllene with Ozone, J. Atmos. Chem., 45, 261–287, https://doi.org/10.1023/A:1024263430285, 2003. a
Jimenez, J. L., Canagaratna, M. R., Donahue, N. M., Prevot, A. S. H., Zhang, Q., Kroll, J. H., DeCarlo, P. F., Allan, J. D., Coe, H., Ng, N. L., Aiken, A. C., Docherty, K. S., Ulbrich, I. M., Grieshop, A. P., Robinson, A. L., Duplissy, J., Smith, J. D., Wilson, K. R., Lanz, V. A., Hueglin, C., Sun, Y. L., Tian, J., Laaksonen, A., Raatikainen, T., Rautiainen, J., Vaattovaara, P., Ehn, M., Kulmala, M., Tomlinson, J. M., Collins, D. R., Cubison, M. J., E., Dunlea, J., Huffman, J. A., Onasch, T. B., Alfarra, M. R., Williams, P. I., Bower, K., Kondo, Y., Schneider, J., Drewnick, F., Borrmann, S., Weimer, S., Demerjian, K., Salcedo, D., Cottrell, L., Griffin, R., Takami, A., Miyoshi, T., Hatakeyama, S., Shimono, A., Sun, J. Y., Zhang, Y. M., Dzepina, K., Kimmel, J. R., Sueper, D., Jayne, J. T., Herndon, S. C., Trimborn, A. M., Williams, L. R., Wood, E. C., Middlebrook, A. M., Kolb, C. E., Baltensperger, U., and Worsnop, D. R.: Evolution of Organic Aerosols in the Atmosphere, Science, 326, 1525–1529, https://doi.org/10.1126/science.1180353, 2009. a
Johnson, C. H., Ivanisevic, J., and Siuzdak, G.: Metabolomics: beyond biomarkers and towards mechanisms, Nat. Rev. Mol., 17, 451–459, https://doi.org/10.1038/nrm.2016.25, 2016. a
Kahnt, A., Iinuma, Y., Blockhuys, F., Mutzel, A., Vermeylen, R., Kleindienst, T. E., Jaoui, M., Offenberg, J. H., Lewandowski, M., Böge, O., Herrmann, H., Maenhaut, W., and Claeys, M.: 2-Hydroxyterpenylic Acid: An Oxygenated Marker Compound for α-Pinene Secondary Organic Aerosol in Ambient Fine Aerosol, Environ. Sci. Technol., 48, 4901–4908, https://doi.org/10.1021/es500377d, 2014. a
Kahnt, A., Vermeylen, R., Iinuma, Y., Safi Shalamzari, M., Maenhaut, W., and Claeys, M.: High-molecular-weight esters in α-pinene ozonolysis secondary organic aerosol: structural characterization and mechanistic proposal for their formation from highly oxygenated molecules, Atmos. Chem. Phys., 18, 8453–8467, https://doi.org/10.5194/acp-18-8453-2018, 2018. a
Kang, E., Root, M. J., Toohey, D. W., and Brune, W. H.: Introducing the concept of Potential Aerosol Mass (PAM), Atmos. Chem. Phys., 7, 5727–5744, https://doi.org/10.5194/acp-7-5727-2007, 2007. a
Kari, E., Hao, L., Ylisirniö, A., Buchholz, A., Leskinen, A., Yli-Pirilä, P., Nuutinen, I., Kuuspalo, K., Jokiniemi, J., Faiola, C. L., Schobesberger, S., and Virtanen, A.: Potential dual effect of anthropogenic emissions on the formation of biogenic secondary organic aerosol (BSOA), Atmos. Chem. Phys., 19, 15651–15671, https://doi.org/10.5194/acp-19-15651-2019, 2019. a, b
Kendrick, E.: A Mass Scale Based on CH2 = 14.0000 for High Resolution Mass Spectrometry of Organic Compounds., Anal. Chem., 35, 2146–2154, https://doi.org/10.1021/ac60206a048, 1963. a
Kenseth, C. M., Hafeman, N. J., Huang, Y., Dalleska, N. F., Stoltz, B. M., and Seinfeld, J. H.: Synthesis of Carboxylic Acid and Dimer Ester Surrogates to Constrain the Abundance and Distribution of Molecular Products in α-Pinene and β-Pinene Secondary Organic Aerosol, Environ. Sci. Technol., 54, 12 829–12 839, https://doi.org/10.1021/acs.est.0c01566, 2020. a
Kiendler-Scharr, A., Mensah, A. A., Friese, E., Topping, D., Nemitz, E., Prevot, A. S. H., Äijälä, M., Allan, J., Canonaco, F., Canagaratna, M., Carbone, S., Crippa, M., Dall Osto, M., Day, D. A., De Carlo, P., Di Marco, C. F., Elbern, H., Eriksson, A., Freney, E., Hao, L., Herrmann, H., Hildebrandt, L., Hillamo, R., Jimenez, J. L., Laaksonen, A., McFiggans, G., Mohr, C., O'Dowd, C., Otjes, R., Ovadnevaite, J., Pandis, S. N., Poulain, L., Schlag, P., Sellegri, K., Swietlicki, E., Tiitta, P., Vermeulen, A., Wahner, A., Worsnop, D., and Wu, H.-C.: Ubiquity of organic nitrates from nighttime chemistry in the European submicron aerosol, Geophys. Res. Lett., 43, 7735–7744, https://doi.org/10.1002/2016GL069239, 2016. a
Kitanovski, Z., Grgić, I., Vermeylen, R., Claeys, M., and Maenhaut, W.: Liquid chromatography tandem mass spectrometry method for characterization of monoaromatic nitro-compounds in atmospheric particulate matter, J. Chromatogr. A, 1268, 35–43, https://doi.org/10.1016/j.chroma.2012.10.021, 2012. a
Kourtchev, I., Doussin, J.-F., Giorio, C., Mahon, B., Wilson, E. M., Maurin, N., Pangui, E., Venables, D. S., Wenger, J. C., and Kalberer, M.: Molecular composition of fresh and aged secondary organic aerosol from a mixture of biogenic volatile compounds: a high-resolution mass spectrometry study, Atmos. Chem. Phys., 15, 5683–5695, https://doi.org/10.5194/acp-15-5683-2015, 2015. a
Krechmer, J. E., Coggon, M. M., Massoli, P., Nguyen, T. B., Crounse, J. D., Hu, W., Day, D. A., Tyndall, G. S., Henze, D. K., Rivera-Rios, J. C., Nowak, J. B., Kimmel, J. R., Mauldin, R. L., Stark, H., Jayne, J. T., Sipilä, M., Junninen, H., St. Clair, J. M., Zhang, X., Feiner, P. A., Zhang, L., Miller, D. O., Brune, W. H., Keutsch, F. N., Wennberg, P. O., Seinfeld, J. H., Worsnop, D. R., Jimenez, J. L., and Canagaratna, M. R.: Formation of Low Volatility Organic Compounds and Secondary Organic Aerosol from Isoprene Hydroxyhydroperoxide Low-NO Oxidation, Environ. Sci. Technol., 49, 10330–10339, https://doi.org/10.1021/acs.est.5b02031, 2015. a
Kristensen, K., Watne, A. K., Hammes, J., Lutz, A., Petäjä, T., Hallquist, M., Bilde, M., and Glasius, M.: High-Molecular Weight Dimer Esters Are Major Products in Aerosols from α-Pinene Ozonolysis and the Boreal Forest, Environ. Sci. Technol. Lett., 3, 280–285, https://doi.org/10.1021/acs.estlett.6b00152, 2016. a, b
Kroll, J. H., Donahue, N. M., Jimenez, J. L., Kessler, S. H., Canagaratna, M. R., Wilson, K. R., Altieri, K. E., Mazzoleni, L. R., Wozniak, A. S., Bluhm, H., Mysak, E. R., Smith, J. D., Kolb, C. E., and Worsnop, D. R.: Carbon oxidation state as a metric for describing the chemistry of atmospheric organic aerosol, Nature Chem., 3, 133–139, https://doi.org/10.1038/nchem.948, 2011. a
Lambe, A. T., Ahern, A. T., Williams, L. R., Slowik, J. G., Wong, J. P. S., Abbatt, J. P. D., Brune, W. H., Ng, N. L., Wright, J. P., Croasdale, D. R., Worsnop, D. R., Davidovits, P., and Onasch, T. B.: Characterization of aerosol photooxidation flow reactors: heterogeneous oxidation, secondary organic aerosol formation and cloud condensation nuclei activity measurements, Atmos. Meas. Tech., 4, 445–461, https://doi.org/10.5194/amt-4-445-2011, 2011. a
Larsen, B. R., Di Bella, D., Glasius, M., Winterhalter, R., Jensen, N. R., and Hjorth, J.: Gas-Phase OH Oxidation of Monoterpenes: Gaseous and Particulate Products, J. Atmos. Chem., 38, 231–276, https://doi.org/10.1023/A:1006487530903, 2001. a, b
Li, M., Karu, E., Brenninkmeijer, C., Fischer, H., Lelieveld, J., and Williams, J.: Tropospheric OH and stratospheric OH and Cl concentrations determined from CH4, CH3Cl, and SF6 measurements, npj Clim. Atmos. Sci., 1, 29, https://doi.org/10.1038/s41612-018-0041-9, 2018. a
Li, Y., Pöschl, U., and Shiraiwa, M.: Molecular corridors and parameterizations of volatility in the chemical evolution of organic aerosols, Atmos. Chem. Phys., 16, 3327–3344, https://doi.org/10.5194/acp-16-3327-2016, 2016. a
Liang, M., Xian, Y., Wang, B., Hou, X., Wang, L., Guo, X., Wu, Y., and Dong, H.: High throughput analysis of 21 perfluorinated compounds in drinking water, tap water, river water and plant effluent from southern China by supramolecular solvents-based microextraction coupled with HPLC-Orbitrap HRMS, Environ. Pollut., 263, 114389, https://doi.org/10.1016/j.envpol.2020.114389, 2020. a
Liu, Y., Pereira, A. D. S., and Martin, J. W.: Discovery of C5–C17 Poly- and Perfluoroalkyl Substances in Water by In-Line SPE-HPLC-Orbitrap with In-Source Fragmentation Flagging, Anal. Chem., 87, 4260–4268, https://doi.org/10.1021/acs.analchem.5b00039, 2015. a
Ma, J., Ungeheuer, F., Zheng, F., Du, W., Wang, Y., Cai, J., Zhou, Y., Yan, C., Liu, Y., Kulmala, M., Daellenbach, K. R., and Vogel, A. L.: Nontarget Screening Exhibits a Seasonal Cycle of PM2.5 Organic Aerosol Composition in Beijing, Environ. Sci. Technol., https://doi.org/10.1021/acs.est.1c06905, 2022. a, b
McDonald, B. C., de Gouw, J. A., Gilman, J. B., Jathar, S. H., Akherati, A., Cappa, C. D., Jimenez, J. L., Lee-Taylor, J., Hayes, P. L., McKeen, S. A., Cui, Y. Y., Kim, S.-W., Gentner, D. R., Isaacman-VanWertz, G., Goldstein, A. H., Harley, R. A., Frost, G. J., Roberts, J. M., Ryerson, T. B., and Trainer, M.: Volatile chemical products emerging as largest petrochemical source of urban organic emissions, Science, 359, 760–764, https://doi.org/10.1126/science.aaq0524, 2018. a
McFiggans, G., Mentel, T. F., Wildt, J., Pullinen, I., Kang, S., Kleist, E., Schmitt, S., Springer, M., Tillmann, R., Wu, C., Zhao, D., Hallquist, M., Faxon, C., Le Breton, M., Hallquist, Å. M., Simpson, D., Bergström, R., Jenkin, M. E., Ehn, M., Thornton, J. A., Alfarra, M. R., Bannan, T. J., Percival, C. J., Priestley, M., Topping, D., and Kiendler-Scharr, A.: Secondary organic aerosol reduced by mixture of atmospheric vapours, Nature, 565, 587–593, https://doi.org/10.1038/s41586-018-0871-y, 2019. a
Müller, L., Reinnig, M.-C., Warnke, J., and Hoffmann, Th.: Unambiguous identification of esters as oligomers in secondary organic aerosol formed from cyclohexene and cyclohexene/α-pinene ozonolysis, Atmos. Chem. Phys., 8, 1423–1433, https://doi.org/10.5194/acp-8-1423-2008, 2008. a
Müller, L., Reinnig, M.-C., Naumann, K. H., Saathoff, H., Mentel, T. F., Donahue, N. M., and Hoffmann, T.: Formation of 3-methyl-1,2,3-butanetricarboxylic acid via gas phase oxidation of pinonic acid – a mass spectrometric study of SOA aging, Atmos. Chem. Phys., 12, 1483–1496, https://doi.org/10.5194/acp-12-1483-2012, 2012. a
Nestorowicz, K., Jaoui, M., Rudzinski, K. J., Lewandowski, M., Kleindienst, T. E., Spólnik, G., Danikiewicz, W., and Szmigielski, R.: Chemical composition of isoprene SOA under acidic and non-acidic conditions: effect of relative humidity, Atmos. Chem. Phys., 18, 18101–18121, https://doi.org/10.5194/acp-18-18101-2018, 2018. a, b
Nozière, B., Kalberer, M., Claeys, M., Allan, J., D’Anna, B., Decesari, S., Finessi, E., Glasius, M., Grgić, I., Hamilton, J. F., Hoffmann, T., Iinuma, Y., Jaoui, M., Kahnt, A., Kampf, C. J., Kourtchev, I., Maenhaut, W., Marsden, N., Saarikoski, S., Schnelle-Kreis, J., Surratt, J. D., Szidat, S., Szmigielski, R., and Wisthaler, A.: The Molecular Identification of Organic Compounds in the Atmosphere: State of the Art and Challenges, Chem. Rev., 115, 3919–3983, https://doi.org/10.1021/cr5003485, 2015. a
Pankow, J. F. and Asher, W. E.: SIMPOL.1: a simple group contribution method for predicting vapor pressures and enthalpies of vaporization of multifunctional organic compounds, Atmos. Chem. Phys., 8, 2773–2796, https://doi.org/10.5194/acp-8-2773-2008, 2008. a
Peng, Z., Day, D. A., Stark, H., Li, R., Lee-Taylor, J., Palm, B. B., Brune, W. H., and Jimenez, J. L.: HOx radical chemistry in oxidation flow reactors with low-pressure mercury lamps systematically examined by modeling, Atmos. Meas. Tech., 8, 4863–4890, https://doi.org/10.5194/amt-8-4863-2015, 2015. a
Peng, Z., Day, D. A., Ortega, A. M., Palm, B. B., Hu, W., Stark, H., Li, R., Tsigaridis, K., Brune, W. H., and Jimenez, J. L.: Non-OH chemistry in oxidation flow reactors for the study of atmospheric chemistry systematically examined by modeling, Atmos. Chem. Phys., 16, 4283–4305, https://doi.org/10.5194/acp-16-4283-2016, 2016. a
Pereira, K. L., Ward, M. W., Wilkinson, J. L., Sallach, J. B., Bryant, D. J., Dixon, W. J., Hamilton, J. F., and Lewis, A. C.: An Automated Methodology for Non-targeted Compositional Analysis of Small Molecules in High Complexity Environmental Matrices Using Coupled Ultra Performance Liquid Chromatography Orbitrap Mass Spectrometry, Environ. Sci. Technol., 55, 7365–7375, https://doi.org/10.1021/acs.est.0c08208, 2021. a
Pleil, J. D., Wallace, M. A. G., and McCord, J.: Beyond monoisotopic accurate mass spectrometry: ancillary techniques for identifying unknown features in non-targeted discovery analysis, J. Breath Res., 13, 012001, https://doi.org/10.1088/1752-7163/aae8c3, 2018. a
Qi, L., Vogel, A. L., Esmaeilirad, S., Cao, L., Zheng, J., Jaffrezo, J.-L., Fermo, P., Kasper-Giebl, A., Daellenbach, K. R., Chen, M., Ge, X., Baltensperger, U., Prévôt, A. S. H., and Slowik, J. G.: A 1-year characterization of organic aerosol composition and sources using an extractive electrospray ionization time-of-flight mass spectrometer (EESI-TOF), Atmos. Chem. Phys., 20, 7875–7893, https://doi.org/10.5194/acp-20-7875-2020, 2020. a
Riva, M., Budisulistiorini, S. H., Chen, Y., Zhang, Z., D’Ambro, E. L., Zhang, X., Gold, A., Turpin, B. J., Thornton, J. A., Canagaratna, M. R., and Surratt, J. D.: Chemical Characterization of Secondary Organic Aerosol from Oxidation of Isoprene Hydroxyhydroperoxides, Environ. Sci. Technol., 50, 9889–9899, https://doi.org/10.1021/acs.est.6b02511, 2016. a
Salvador, C. M. G., Tang, R., Priestley, M., Li, L., Tsiligiannis, E., Le Breton, M., Zhu, W., Zeng, L., Wang, H., Yu, Y., Hu, M., Guo, S., and Hallquist, M.: Ambient nitro-aromatic compounds – biomass burning versus secondary formation in rural China, Atmos. Chem. Phys., 21, 1389–1406, https://doi.org/10.5194/acp-21-1389-2021, 2021. a
Schervish, M. and Donahue, N. M.: Peroxy radical chemistry and the volatility basis set, Atmos. Chem. Phys., 20, 1183–1199, https://doi.org/10.5194/acp-20-1183-2020, 2020. a
Schymanski, E. L., Jeon, J., Gulde, R., Fenner, K., Ruff, M., Singer, H. P., and Hollender, J.: Identifying Small Molecules via High Resolution Mass Spectrometry: Communicating Confidence, Environ. Sci. Technol., 48, 2097–2098, https://doi.org/10.1021/es5002105, 2014. a
Shrivastava, M., Cappa, C. D., Fan, J., Goldstein, A. H., Guenther, A. B., Jimenez, J. L., Kuang, C., Laskin, A., Martin, S. T., Ng, N. L., Petaja, T., Pierce, J. R., Rasch, P. J., Roldin, P., Seinfeld, J. H., Shilling, J., Smith, J. N., Thornton, J. A., Volkamer, R., Wang, J., Worsnop, D. R., Zaveri, R. A., Zelenyuk, A., and Zhang, Q.: Recent advances in understanding secondary organic aerosol: Implications for global climate forcing, Rev. Geophys., 55, 509–559, https://doi.org/10.1002/2016RG000540, 2017. a, b
Sindelarova, K., Granier, C., Bouarar, I., Guenther, A., Tilmes, S., Stavrakou, T., Müller, J.-F., Kuhn, U., Stefani, P., and Knorr, W.: Global data set of biogenic VOC emissions calculated by the MEGAN model over the last 30 years, Atmos. Chem. Phys., 14, 9317–9341, https://doi.org/10.5194/acp-14-9317-2014, 2014. a, b
Surratt, J. D., Kroll, J. H., Kleindienst, T. E., Edney, E. O., Claeys, M., Sorooshian, A., Ng, N. L., Offenberg, J. H., Lewandowski, M., Jaoui, M., Flagan, R. C., and Seinfeld, J. H.: Evidence for Organosulfates in Secondary Organic Aerosol, Environ. Sci. Technol., 41, 517–527, https://doi.org/10.1021/es062081q, 2007. a, b, c
Surratt, J. D., Gómez-González, Y., Chan, A. W. H., Vermeylen, R., Shahgholi, M., Kleindienst, T. E., Edney, E. O., Offenberg, J. H., Lewandowski, M., Jaoui, M., Maenhaut, W., Claeys, M., Flagan, R. C., and Seinfeld, J. H.: Organosulfate Formation in Biogenic Secondary Organic Aerosol, J. Phys. Chem. A, 112, 8345–8378, https://doi.org/10.1021/jp802310p, 2008. a, b
Szmigielski, R., Surratt, J. D., Gómez-González, Y., Van der Veken, P., Kourtchev, I., Vermeylen, R., Blockhuys, F., Jaoui, M., Kleindienst, T. E., Lewandowski, M., Offenberg, J. H., Edney, E. O., Seinfeld, J. H., Maenhaut, W., and Claeys, M.: 3-methyl-1,2,3-butanetricarboxylic acid: An atmospheric tracer for terpene secondary organic aerosol, Geophys. Res. Lett., 34, 24, https://doi.org/10.1029/2007GL031338, 2007. a
Thoma, M., Bachmeier, F., Gottwald, F. L., Simon, M., and Vogel, A. L.: Mass spectrometry-based aerosolomics: a new approach to resolve sources, composition, and partitioning of secondary organic aerosol, Zenodo [data set], https://doi.org/10.5281/zenodo.6623244, 2022. a
Thomsen, D., Elm, J., Rosati, B., Skønager, J. T., Bilde, M., and Glasius, M.: Large Discrepancy in the Formation of Secondary Organic Aerosols from Structurally Similar Monoterpenes, ACS Earth Space Chem., 5, 632–644, https://doi.org/10.1021/acsearthspacechem.0c00332, 2021. a
Umweltbundesamt GmbH: Aktuelle Luftgütemesswerte des Bundes und der Länder, http://luft.umweltbundesamt.at/pub/gmap/start.html (last access: 26 July 2022), 2021. a
van Eijck, A., Opatz, T., Taraborrelli, D., Sander, R., and Hoffmann, T.: New tracer compounds for secondary organic aerosol formation from β-caryophyllene oxidation, Atmos. Environ., 80, 122–130, https://doi.org/10.1016/j.atmosenv.2013.07.060, 2013. a
Wang, Y., Ma, Y., Li, X., Kuang, B. Y., Huang, C., Tong, R., and Yu, J. Z.: Monoterpene and Sesquiterpene α-Hydroxy Organosulfates: Synthesis, MS/MS Characteristics, and Ambient Presence, Environ. Sci. Technol., 53, 12278–12290, https://doi.org/10.1021/acs.est.9b04703, 2019. a
Wang, Y., Tong, R., and Yu, J. Z.: Chemical Synthesis of Multifunctional Air Pollutants: Terpene-Derived Nitrooxy Organosulfates, Environ. Sci. Technol., 55, 8573–8582, https://doi.org/10.1021/acs.est.1c00348, 2021. a
Xu, L., Du, L., Tsona, N. T., and Ge, M.: Anthropogenic Effects on Biogenic Secondary Organic Aerosol Formation, Adv. Atmos. Sci., 38, 1053–1084, https://doi.org/10.1007/s00376-020-0284-3, 2021. a
Yasmeen, F., Vermeylen, R., Szmigielski, R., Iinuma, Y., Böge, O., Herrmann, H., Maenhaut, W., and Claeys, M.: Terpenylic acid and related compounds: precursors for dimers in secondary organic aerosol from the ozonolysis of α- and β-pinene, Atmos. Chem. Phys., 10, 9383–9392, https://doi.org/10.5194/acp-10-9383-2010, 2010. a, b, c
Yasmeen, F., Szmigielski, R., Vermeylen, R., Gómez-González, Y., Surratt, J. D., Chan, A. W. H., Seinfeld, J. H., Maenhaut, W., and Claeys, M.: Mass spectrometric characterization of isomeric terpenoic acids from the oxidation of α-pinene, β-pinene, d-limonene, and Δ3-carene in fine forest aerosol, J. Mass Spectrom., 46, 425–442, https://doi.org/10.1002/jms.1911, 2011. a, b
Yu, J., Cocker, D. R., Griffin, R. J., Flagan, R. C., and Seinfeld, J. H.: Gas-Phase Ozone Oxidation of Monoterpenes: Gaseous and Particulate Products, J. Atmos. Chem., 34, 207–258, https://doi.org/10.1023/A:1006254930583, 1999. a
Zhao, W., Kawamura, K., Yue, S., Wei, L., Ren, H., Yan, Y., Kang, M., Li, L., Ren, L., Lai, S., Li, J., Sun, Y., Wang, Z., and Fu, P.: Molecular distribution and compound-specific stable carbon isotopic composition of dicarboxylic acids, oxocarboxylic acids and α-dicarbonyls in PM2.5 from Beijing, China, Atmos. Chem. Phys., 18, 2749–2767, https://doi.org/10.5194/acp-18-2749-2018, 2018. a