the Creative Commons Attribution 4.0 License.
the Creative Commons Attribution 4.0 License.
 | 22 Dec 2022
Icing wind tunnel measurements of supercooled large droplets using the 12 mm total water content cone of the Nevzorov probe
Tina Jurkat-Witschas
Romy Heller
Valerian Hahn
Matthew Hamman
Wolfgang Breitfuss
Venkateshwar Reddy Bora
Manuel Moser
Christiane Voigt
Supercooled large droplet (SLD) icing can occur behind the protected surfaces of an aircraft and create severe aerodynamic disturbances, which represent a safety hazard for aviation. Liquid water content (LWC) measurements in icing conditions that contain SLDs require instruments that are able to sample unimodal and bimodal droplet size distributions with droplet diameters from 2 to 2000 µm. No standardized detection method exists for this task. A candidate instrument, which is currently used in icing wind tunnel (IWT) research, is the Nevzorov probe. In addition to the standard 8 mm total water content (TWC) collector cone, a novel instrument version also features a 12 mm diameter cone, which might be advantageous for collecting the large droplets characteristic of SLD conditions. In the scope of the two EU projects, SENSors and certifiable hybrid architectures for safer aviation in ICing Environment (SENS4ICE) and ICE GENESIS, we performed measurement campaigns in SLD icing conditions in IWTs in Germany, Austria and the USA. We obtained a comprehensive data set of measurements from the LWC sensor, the 8 mm cone sensor and the 12 mm cone sensor of the Nevzorov probe, and from the tunnel reference instrumentation. In combination with measurements of the particle size distribution, we experimentally derive a collision efficiency curve that is based on a suitable functional form for the new 12 mm cone for median volume diameters (MVDs) between 12 and 58 µm and wind tunnel speeds from 40 to 85 m s−1. Knowledge of this curve allows us to correct the LWC measurements of the 12 mm cone (LWC12) in particular for the inevitably high decrease in collision efficiency for small droplet diameters. In unimodal SLD conditions, with MVDs between 128 and 720 µm, LWC12 generally agrees within ±20 % with the tunnel LWC reference values from a WCM-2000 and an isokinetic probe. An increase in the difference between LWC12 and the WCM-2000 measurements at larger MVDs indicates better droplet collection properties of the 12 mm cone. Similarly, the favorable detector dimensions of the 12 mm cone explain a 7 % enhanced detection efficiency compared to the 8 mm cone; however this difference falls within the instrumental uncertainties. Data collected in various bimodal SLD conditions with MVDs between 16 and 534 µm and LWCs between 0.22 and 0.72 g m−3 also show an agreement within ±20 % between LWC12 and the tunnel LWC, which demonstrates the suitability of the Nevzorov sensor head with the 12 mm cone for measurements of LWC in Appendix O icing conditions.
- Article
(5574 KB) - Full-text XML
- BibTeX
- EndNote


The fatal accident of an ATR 72 aircraft near Roselawn, Indiana, in 1994 (National Transportation Safety Board, 1996; Marwitz et al., 1997) prompted the Federal Aviation Administration (FAA) and European Union Aviation Safety Agency (EASA) to review the existing regulations for flight in icing conditions. It also initiated numerous research activities which aimed to study the occurrence and the distributions of supercooled large droplets (SLDs), which are defined as droplets with diameters larger than 100 µm. SLDs mostly occur as part of bimodal droplet size distributions, i.e., a significant number of small droplets are present alongside the SLDs (Cober and Isaac, 2012). Cober et al. (2009) separated SLD conditions into four subsets based on the maximum drop size and the median volume diameter (MVD) of the droplet size distribution (DSD). Icing conditions which contained drops with diameters larger than 500 µm were classified as freezing rain (FZRA), and conditions without drops larger than 500 µm were classified as freezing drizzle (FZDZ). Furthermore, they distinguished between the conditions with an overall MVD smaller than 40 µm (representing a strong, small droplet mode) and those with an overall MVD larger than 40 µm (representing a strong, large droplet mode). They also found that the occurrence of SLD conditions is in most cases limited to a temperature range from −25 to 0 ∘C and to a relatively low liquid water content (<0.44 g m−3). Based on this analysis they developed an engineering standard that aircraft need to comply with in order to operate in SLD conditions. This standard was eventually added to part 25 of the Federal Aviation Regulations (14 CFR) and to EASA's “Certification Specifications for Large Aeroplanes” (CS-25) as Appendix O (Office of the Federal Register, 2016; EASA, 2021); hence the SLD conditions which fall within its specifications are also called Appendix O conditions. Prior to the addition of Appendix O, aircraft were only certified for flying in icing conditions that fall into Appendix C of 14 CFR part 25 (Appendix C conditions). The droplet distributions of Appendix C conditions consist of droplets with a mean effective diameter smaller than 50 µm and do not contain SLDs. Established instruments for measuring the liquid water content (LWC) in Appendix C conditions include the King probe (King et al., 1978), the WCM-2000 multi-element water content system (Steen et al., 2016) and the Nevzorov probe (Korolev et al., 1998, 2007, 2013; Schwarzenboeck et al., 2009; Strapp et al., 2003). In icing wind tunnels (IWTs), rotating cylinders of various diameters (Stallabrass, 1978; Orchard et al., 2019) and icing blades (Ide, 1990) are used. In the absence of standardized measurement methods, many of these techniques are also employed to measure Appendix O conditions. However, since the DSDs of Appendix O conditions span a significantly wider range of droplet sizes than Appendix C conditions, the uncertainties associated with the measurement principles are significantly larger and have not yet been discussed in detail in the literature.
In this work, we assess the performance of a Nevzorov probe in IWT conditions that contain SLDs. Specifically for the purpose of measuring SLDs, Environment and Climate Change Canada (ECCC) designed a Nevzorov sensor head with a second, larger total water content (TWC) collector cone with a diameter of 12 mm, which was subsequently produced by the manufacturer of the Nevzorov probe, the Canadian company SkyPhysTech Inc. The new sensor head was tested by the ECCC in the altitude icing wind tunnel of the National Research Council of Canada (Oleskiw et al., 2001; Orchard et al., 2018, 2019) and employed during the In-cloud Icing and Large-drop Experiment (ICICLE) flight campaign (Bernstein et al., 2021).
Apart from the larger diameter, the interior of the new 12 mm cone also differs from that of the standard 8 mm Nevzorov cone. In order to increase the heated surface area and to prevent splashing and bouncing of particles, the inside of the 12 mm cone was given a bell-shaped form, such that the cone attains a depth of approximately 14.5 mm. At the inlet, the angle between the interior wall and the frontal area is 30∘, the same as for the 8 mm cone (see Fig. 1). An additional advantage of the new cone is the larger sample area, which provides better sampling statistics.
However, due to its larger size, the 12 mm cone has a lower collision efficiency for small droplets, which has not yet been characterized. In this work, we experimentally derive this collision efficiency and verify the new sensor's suitability to cover the large droplet size range of Appendix O conditions. The measurements on which we base our study were conducted in the scope of two EU projects, which we introduce in the following section. Subsequently we describe the principle of operation of the Nevzorov probe, present the full set of measurements and derive a collision efficiency curve for the 12 mm cone. In the final sections we analyze the performance of the Nevzorov probe in unimodal and bimodal SLD conditions and investigate the errors that are introduced when correcting for droplet collision efficiency with the MVD approximation.
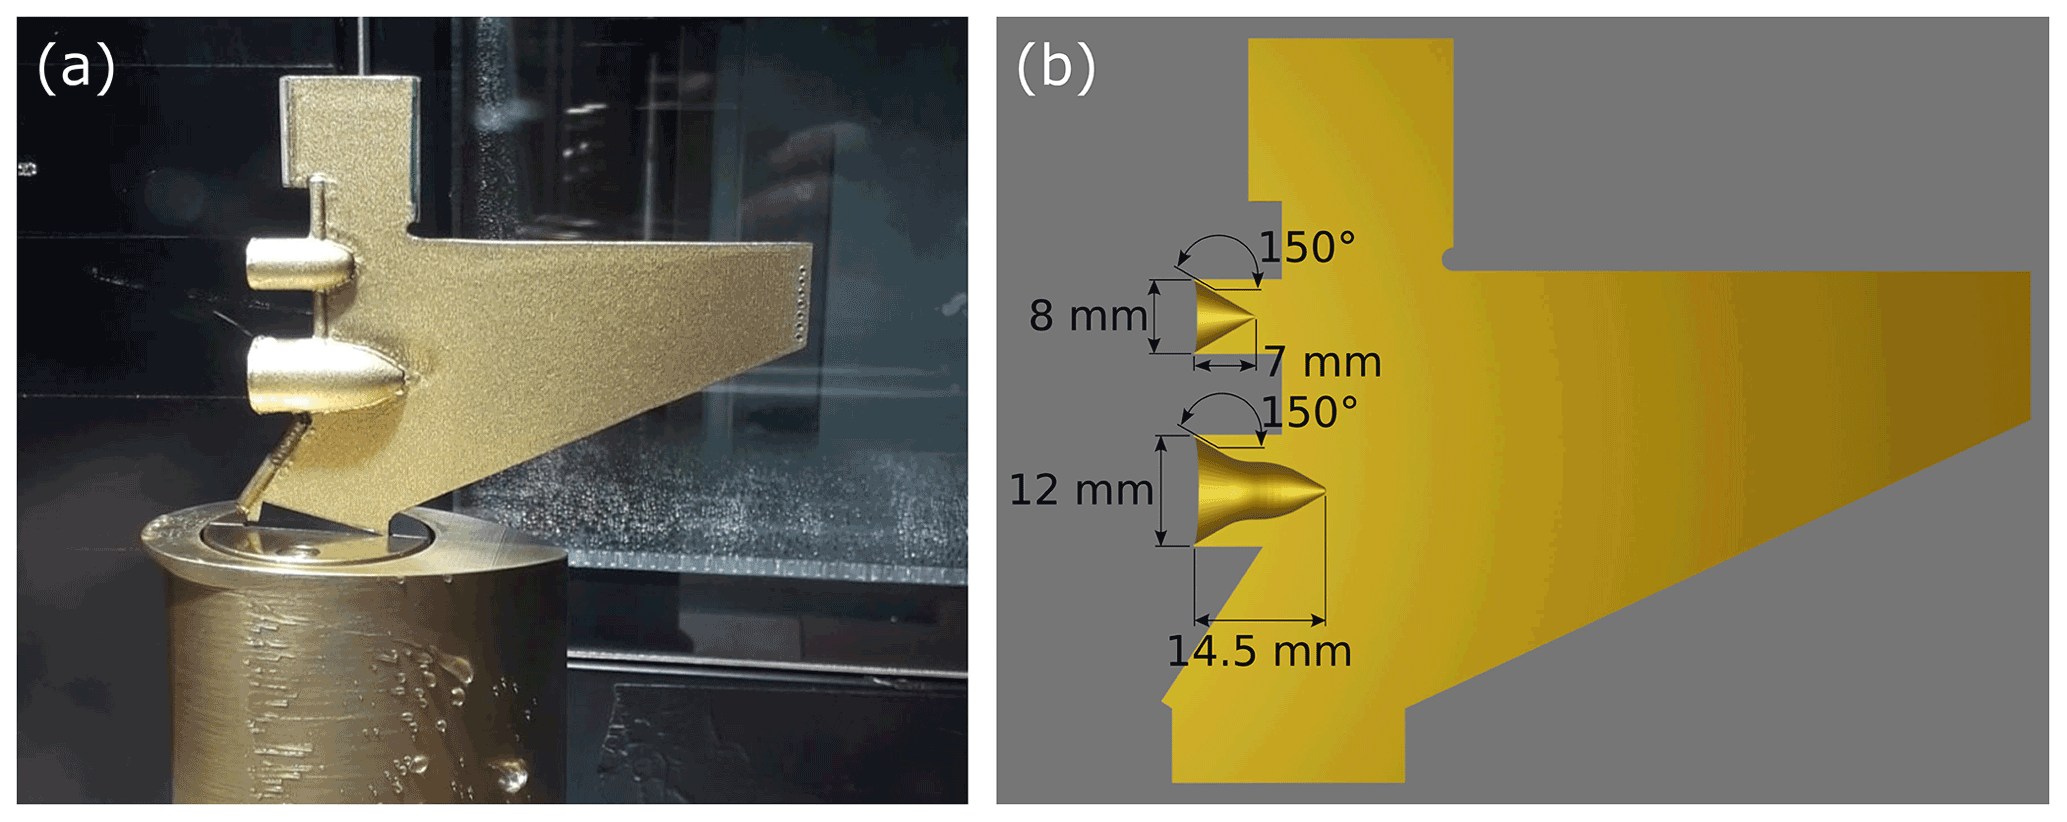
Figure 1(a) Nevzorov probe in the Braunschweig IWT (BIWT) with the new sensor head, which features an LWC sensor (top), an 8 mm TWC collector cone (middle) and the new 12 mm TWC collector cone (bottom). The sensor head contains only one reference sensor, which is positioned on the downwind side of the banneret that constitutes the top of the sensor head. (b) Cross section through the new Nevzorov sensor head and approximate dimensions of the sensors. The Nevzorov sensor heads are handmade; therefore small differences may exist between sensor heads that are nominally the same model.
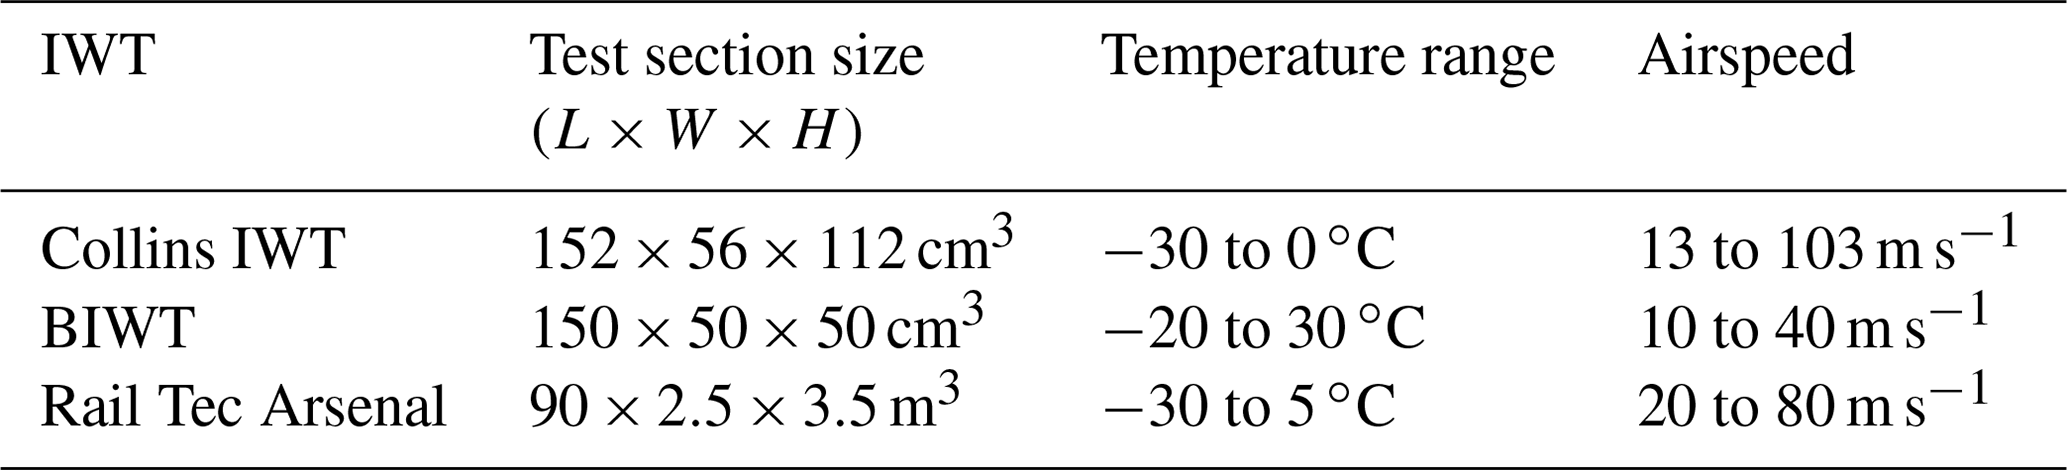
In the framework of Horizon 2020, the European Union funded two projects, SENSors and certifiable hybrid architectures for safer aviation in ICing Environment (SENS4ICE) and ICE GENESIS, with the goal to advance the capabilities of measuring, detecting, and modeling SLD icing conditions and ice accretion. The SENS4ICE project aims to develop an airborne hybrid ice detection system that is able to detect and differentiate between Appendix C and Appendix O conditions (Schwarz et al., 2019; Schwarz, 2021; Deiler, 2021). The system uses the measurements of direct icing sensors in combination with data that are obtained by monitoring the aircraft's flight characteristics (SENS4ICE, 2021). The ICE GENESIS project on the other hand focuses on developing advanced tools for the 3D simulation of SLDs and snow icing conditions (ICE GENESIS, 2021). In both projects IWTs play a key role for the validation of the technology that is developed. The participating IWTs consequently enhanced and adapted their spray system for Appendix O conditions. The production of Appendix O conditions is especially challenging because SLDs sediment faster than smaller droplets and take longer to reach the free-stream tunnel velocity and temperature (Orchard et al., 2018). Furthermore, the low LWC constraints of Appendix O complicate the generation of a continuous and homogeneous droplet spray (Ferschitz et al., 2017). In the framework of SENS4ICE, Appendix C and O conditions produced in three different IWTs were compared by using measurements with the Nevzorov hot-wire probe and the Cloud Combination Probe (CCP). Within ICE GENESIS, several campaigns were performed in the Rail Tec Arsenal (RTA) IWT with these and similar airborne instruments. We report on the measurements that were collected in Appendix C and O conditions as part of SENS4ICE and ICE GENESIS at the Goodrich IWT of Collins Aerospace in Ohio, the RTA IWT in Vienna, Austria, and the Braunschweig IWT (BIWT) in Germany. We selected these three IWTs for this study, because taken together they are able to produce a very large range of icing conditions with distinctively different spray systems (e.g., rotating nozzles for the production of freezing rain at RTA; Breitfuß et al., 2019). The usage of three wind tunnels also helps us to mitigate the influence of possible biases that are only present in one facility. Another criterion for the selection of the wind tunnels was the requirement to have DSDs available for all test points. The technical parameters of the three IWTs are listed in Table 1, and schematics are shown in Fig. 2. The Collins IWT and the RTA IWT are well-established facilities that have been involved in icing research for decades (Herman, 2006; Collins Aerospace, 2021; Haller, 2005). Breitfuß et al. (2019) provide detailed information about the Appendix O conditions that are produced at RTA. The BIWT is a new facility whose design is described in Bansmer et al. (2018). The tunnel was used for numerous research activities on ice crystal and supercooled liquid water icing in recent years (Esposito et al., 2019; Knop et al., 2021). In 2019 and 2020 the tunnel spray system was upgraded to include the capability to create Appendix O conditions. All three wind tunnels have been calibrated per SAE ARP 5905 (AC-9C Aircraft Icing Technology Committee, 2015). For the characterization of the 12 mm Nevzorov TWC cone, we evaluate measurements of LWCs from these three tunnels in combination with the DSD measurements from the CCP and the tunnel reference instrumentation.

Figure 2Schematics of the IWTs that were used for the measurements: (a) Goodrich IWT of Collins Aerospace (image modified from Collins Aerospace, 2021), (b) Braunschweig Icing Wind Tunnel of the Technical University of Braunschweig (figure source: Institute of Fluid Mechanics of TU Braunschweig) and (c) Climatic Wind Tunnel of Rail Tec Arsenal (image modified from Rail Tec Arsenal, 2022).
Table 1Specifications of the IWTs that were used for the measurements.
The Nevzorov probe is the primary instrument that we investigate in this work. Therefore we describe its principle of operation and the procedure to derive LWCs from its measurements. The Nevzorov probe belongs to the category of hot-wire instruments (SkyPhysTech Inc., 2020; Korolev et al., 1998). Such instruments contain heated sensing elements which are maintained at a constant temperature. Heat losses of these sensing elements are caused by convection and by impinging droplets which are heated and evaporated. From the power that is needed to maintain a constant temperature of the sensing elements, the LWC and the TWC are estimated. In order to differentiate between convective heat losses and heat losses that are due to impinging water, the Nevzorov contains two types of sensors. Collector sensors are exposed to the airflow and the droplet spray. Their heat losses are due to evaporation and convection. The reference sensor on the other hand is protected from droplet impingement, and its heat loss is solely due to convection. The Nevzorov probe outputs the voltages Vc and currents Ic of the collector sensors, as well as the voltages Vr and currents Ir of the reference sensor. The power required by a collector sensor and a reference sensor is Pc=VcIc and Pr=VrIr respectively. Since the heat losses of a reference sensor are mainly due to convection, its power consumption is assumed to be equal to (Korolev et al., 1998)
Here, Tr and Ta are the temperatures of the reference sensor and the ambient air, and Sr is the sample area of the reference sensor. The factor αr is the heat transfer coefficient for the sensor, which in the literature is specified as αr=κgrNur, where κ is the thermal conductivity of air, gr the factor which takes into account the surface geometry of the sensor and Nur the Nusselt number (Korolev et al., 1998). In purely liquid clouds, the collector sensors need to heat the droplets from the droplet temperature Td to the evaporation temperature Te. The latent heat required for the evaporation at temperature Te is L(Te). Td can be assumed to be equal to Ta. Even a difference of 10 ∘C between Td and Ta would result in an error of less than 2 % in the specific energy necessary for heating and evaporation (L*). This is because the latent heat term L(Te) is the dominant contribution to L*:
Here, cw=4.1813 J g−1 K−1, which is the specific heat capacity of water. L(Te) can be approximated by the following formula (Science Engineering Associates, 2016):
The IWTs were unpressurized; hence Te is equal to 100 ∘C. Korolev et al. (1998) state a value of 2580 J g−1 as a good average for the value of L*; however this value was suggested for aircraft measurements where temperature and pressure differ from that in an IWT. Figure 3 shows that this value is indeed an underestimate for IWT conditions; hence L* is determined from Eqs. (2) and (3) in this study.
The total power consumption of the collector sensors is calculated by adding the convective term to the power required for heating and evaporating the impinging water:
Here, W denotes the water content of the air, Sc is the sensor sample area, U is the airspeed and ε is the collection efficiency of the sensor. A relation between the convective heat losses of the reference sensor and the convective heat losses of the collector sensor can be obtained from measurements in dry air:
The ratio k only depends on parameters such as airspeed, altitude and temperature (Korolev et al., 1998) and is thus constant for individual test points in IWTs. Rearranging and inserting Eq. (5) into Eq. (4), and solving for W yields
The collection efficiencies that are required for solving Eq. (6) are partly available from the literature. The shape of the LWC sensor is approximately cylindrical and its collision efficiency can be calculated analytically from the formulae of Finstad et al. (1988a) or Langmuir and Blodgett (1946); for this study we use the latter, which is also recommended by the AC-9C Aircraft Icing Technology Committee (2015) for the rotating cylinder method. It is worth noting that the computed efficiencies only take into account the collision efficiency of droplets with the sensor. The overall collection efficiency of the LWC sensor decreases once droplets reach sizes of 30–40 µm due to droplet splashing, as has been shown in Schwarzenboeck et al. (2009). Collision efficiency curves of the 8 mm cone were published by Strapp et al. (2003) for velocities of 67 and 100 m s−1 based on a 2D fluid simulation. We use the curve for the velocity value which best matches the actual tunnel velocity to correct the 8 mm cone measurements. Strapp et al. (2003) remark however that these collision efficiency curves may contain significant errors for small droplet sizes. Splashing is assumed to be irrelevant for the 8 mm cone in Appendix C conditions (Strapp et al., 2003). For the 12 mm cone, which is a new addition to the Nevzorov sensor head, no collision efficiencies have been published up to now. In this paper, we experimentally derive the collision efficiency of the 12 mm cone from the measurements that we obtained during the wind tunnel campaigns.

Figure 3The energy needed to heat and evaporate water (L*) plotted versus the evaporation temperature Te.
This section defines the IWT conditions that have been tested and the instruments, measurement principles, and uncertainties. We differentiate between three droplet spray categories: small droplet spray (SDS), freezing drizzle (FZDZ) and freezing rain (FZRA). SDS includes the nominal Appendix C conditions (Jeck, 2002), as well as conditions where the LWC and MVD are outside the Appendix C envelopes, but no supercooled large droplet mode (D>100 µm) is present. FZDZ and FZRA conditions include unimodal and bimodal SLD conditions, of which some fall within the LWC specifications of Appendix O (Cober and Isaac, 2012), while others exceed the maximum LWC significantly. The distinction between FZDZ and FZRA is made according to the maximum of the LWC distribution in the large droplet mode; if the maximum is positioned at a diameter smaller than 500 µm we identify the condition as FZDZ, otherwise we identify it as FZRA. This definition is slightly different to that used in Cober and Isaac (2012), where FZRA is defined by the presence of droplets larger than 500 µm. The distribution of the droplet spray produced in the wind tunnels is relatively broad so that sprays with a droplet mode centered around 200 µm still contain a small, but not insignificant (>1 % of total LWC) number of droplets larger than 500 µm. We decided that such conditions are nonetheless better described by the characteristics of FZDZ as defined in Cober and Isaac (2012) and hence list them as such.
4.1 Instrumentation
Complementary to the Nevzorov LWC measurements, LWCs of all the test points used in this work have been measured by the tunnel operators. These measurements are designated as the tunnel LWC and serve as a comparison to the Nevzorov measurements. For the tunnel LWC measurements, the IWT operators employed a wide range of instruments, which we refer to as the tunnel reference instrumentation. The tunnel reference instrumentation depends on the type of the produced droplet spray. Collins and RTA use icing blades to measure SDS conditions. The LWCs for the SDS conditions of the BIWT were measured with high-accuracy flow meters, but the tunnel has previously also been calibrated with rotating cylinders and an isokinetic probe (IKP) (Knop et al., 2021). In FZDZ conditions the BIWT relies on flow meters again, while Collins uses a WCM-2000. RTA computes its LWC in FZDZ conditions from the measurements of multiple instruments, among them icing blades, the WCM-2000 (King-Steen et al., 2021b; Steen et al., 2016), the Nevzorov probe (Korolev et al., 1998), and the cloud, aerosol and precipitation spectrometer (CAPS) (Baumgardner et al., 2001, 2017). The LWC of FZRA conditions was determined solely from IKP measurements (Davison et al., 2012; Strapp et al., 2016; Ratvasky et al., 2021). An overview of all the instrumentation used in the tunnels is shown in Table 2.
Table 2Tunnel reference instrumentation used by the IWT operators.

Beside the LWC measurements, DSDs obtained with airborne instrumentation were provided by DLR, Embraer and the wind tunnel owners. The DSDs constitute an important input parameter for the collision efficiency calculation of the Nevzorov probe. At the BIWT we measured the DSDs with the DLR HALO CCP, which was flown during various flight campaigns (Voigt et al., 2017; Jurkat-Witschas et al., 2019; Voigt et al., 2022) and has been described in Braga et al. (2017a, b). The CCP used at Collins was provided by Embraer. For the measurements at RTA we use DSDs derived from data of an Fast Cloud Droplet Probe (FCDP) (Glienke and Mei, 2020; Kirschler et al., 2022), a Two-Dimensional Stereo Cloud Probe (2D-S) (Lawson et al., 2006), a Precipitation Imaging Probe (PIP) (Baumgardner et al., 2017), a CAPS that was provided by DLR and a Malvern Spraytec probe provided by the tunnel operator (Ferschitz et al., 2017).
4.2 Measurements with the CCP
We now give an overview of the CCP and the data evaluation for the DSDs. The CCP consists of two instruments, the cloud droplet probe (CDP) which measures droplet size based on the intensity of the forward scattered light and the cloud imaging probe (CIP) which records the shadow images of droplets on its array of photo diodes. The CDP detects droplets in the size range 2–50 µm and outputs data in bins with 1–2 µm bin width. We applied a size binning for liquid droplets based on a laboratory calibration to the lower end of the CDP size range in order to consider ambiguities caused by the Mie resonances (Lance et al., 2010; Rosenberg et al., 2012).
The CIP measures particles in the size range 15–950 µm with a size resolution of 15 µm. We processed its data with the SODA software (Bansemer, 2013). The software incorporates a shattering (Field et al., 2006) and a depth of field correction (Korolev, 2007). For the combination of the measurements of CDP and CIP we defined a threshold within the overlap region of the instruments at which we transitioned from using the CDP data to using the CIP data. The threshold value was chosen in a way that ensured that the CDP provided sufficient sampling statistics. Depending on the number concentration of droplets in the transition region it therefore varied between 39 and 47 µm. After combining the data of the two instruments we followed the procedure in Cober and Isaac (2012) and performed a logarithmic interpolation between the bin centers to obtain a size distribution with 1 µm bins.
4.3 Measurement uncertainties
All instruments are subject to measurement uncertainties, which we discuss now. For hot-wire LWC measurement techniques, Baumgardner et al. (2017) state a propagated uncertainty of 10 %–30 % due to errors related to the removal of convective heat losses and the uncertain response to large droplets and ice crystals. Only liquid water conditions were investigated in this study; hence uncertainties due to the response to ice crystals are irrelevant. We performed a detailed investigation of the error sources in the Nevzorov probe measurements (see Appendix A). The uncertainty values strongly depend on LWC, MVD, temperature, airspeed and the sensor that is considered. For the SDS measurements presented in this study, the uncertainties of the 8 mm cone and the 12 mm cone can be expected to be below ±11 % and ±15 % respectively once the MVD exceeds 20 µm. Measurements of the LWC sensor are estimated to be accurate within ±15 % for MVDs between 10 and 20 µm. We note that our uncertainties are in fairly good agreement with those stated in Korolev et al. (1998). For the WCM-2000, King-Steen et al. (2021a) found biases of 5 %–15 % between two sensor heads, which were caused by a misaligned calibration and an increased amount of solder on one of the sensing elements. For both instruments these accuracy values apply for the size range of typical Appendix C conditions, whereas uncertainties in SLD conditions are not yet quantified.
Uncertainties of accretion-based methods such as the rotating cylinder and the icing blade are generally assumed to be low in low LWC Appendix C conditions; Stallabrass (1978) states an absolute LWC accuracy within ±10 % for both methods in conditions with MVDs between 14 and 34 µm. Accretion-based methods however have their limitations when high LWCs or large droplets are involved and uncertainties depend on the size of the element that is used (Steen et al., 2016; Orchard et al., 2019).
For optical particle measurements we distinguish between the sizing and the counting accuracy. For instruments based on light scattering, such as the CDP, the propagated uncertainty is 10 %–50 % for particle sizing, while the uncertainty in concentration is 10 %–30 % (Baumgardner et al., 2017). For imaging probes, uncertainties generally may extend from 10 %–100 % for both size and concentration (Baumgardner et al., 2017). For the CIP we performed an analysis of the uncertainty in the measured number concentration based on a laboratory calibration and information from the literature. According to the analysis, the uncertainty in the measured number concentration is smaller than 15 % for droplets larger than 80 µm but could increase to 60 % for droplets smaller than 80 µm.
Further uncertainty is introduced into the measurements due to the different mounting positions of the instruments. Differences in the mounting positions are especially problematic when the spray homogeneity is poor, as is often the case in SLD conditions (Ferschitz et al., 2017; Orchard et al., 2018). In this study, we generally attempted to measure at the same position with all our instruments. However, this was not always possible, either due to constraints from the wind tunnel or due to the inherent spatial separation of sensors on the same instrument. For example, on the CCP, the CDP and CIP sample volumes are separated by approximately 13.5 cm, and on the Nevzorov probe, the LWC sensor and the 12 mm cone are positioned approximately 2 cm above and below the 8 mm cone respectively. In the BIWT, we established from traverse measurements in bimodal conditions that the LWC in the area where the Nevzorov sensor head was placed was homogeneous within ±3 %. The CIP sample volume was positioned in the same area. The CDP was positioned outside of this area, but we assume that the small droplet spray that is measured by the CDP is evenly distributed across the wind tunnel cross section. At Collins, the Nevzorov probe was mounted horizontally in the wind tunnel, such that all its sensors measured at the same height. Collins provided information that the SDS and FZDZ conditions are uniform within ±10 % in the area spanned by the Nevzorov sensors. Due to mounting constraints in the wind tunnel, the measurement location of the Nevzorov was 45 cm downstream of the WCM-2000 calibration position. Assuming Stokes' law, the sedimentation of a 100 µm diameter droplet over this distance is just 0.2 cm, but for a 400 µm diameter droplet it is almost 3 cm. The sample position may therefore have had a minor influence on the measured LWC at Collins. For RTA, uniformity measurements presented in Breitfuß et al. (2019), as well as further internal tunnel calibrations, show that LWC deviations between the locations of the LWC sensor, the 8 mm cone and the 12 mm cone are no larger than ±5 % in FZDZ and FZRA conditions.
4.4 IWT conditions
Figure 4 and Table 3 provide an overview of all the test points from the three IWTs used for this study. At Collins, we measured a total of 21 SDS conditions at airspeeds of 40, 67 and 85 m s−1. Eight different SDS conditions were measured in the BIWT at the maximum tunnel airspeed of 40 m s−1. At RTA, four SDS conditions were measured at a tunnel speed of 60 m s−1. The SDS conditions were selected in a way that large portions of the Appendix C icing envelopes were covered. Additional SDS test points at MVDs beyond 40 µm were measured in order to characterize the collision efficiency of the Nevzorov probe at larger droplet sizes.
The FZDZ conditions vary significantly between the tunnels. The examined FZDZ test points represent the set of conditions which were attainable with the spray system of the tunnel and regarded as suitable under consideration of the trade-off between low LWC and preservation of icing cloud uniformity. Collins produced unimodal SLD conditions with MVDs between 128 and 221 µm at an airspeed of 76 m s−1. At RTA and the BIWT we measured mostly bimodal freezing drizzle distributions with varying fractions of LWC in the small and large droplet modes. Only test point U19 at RTA is unimodal. Currently, of the three IWTs, only RTA is able to produce freezing rain conditions. We obtained measurements in unimodal and bimodal freezing rain conditions at airspeeds of 50 and 60 m s−1 respectively.
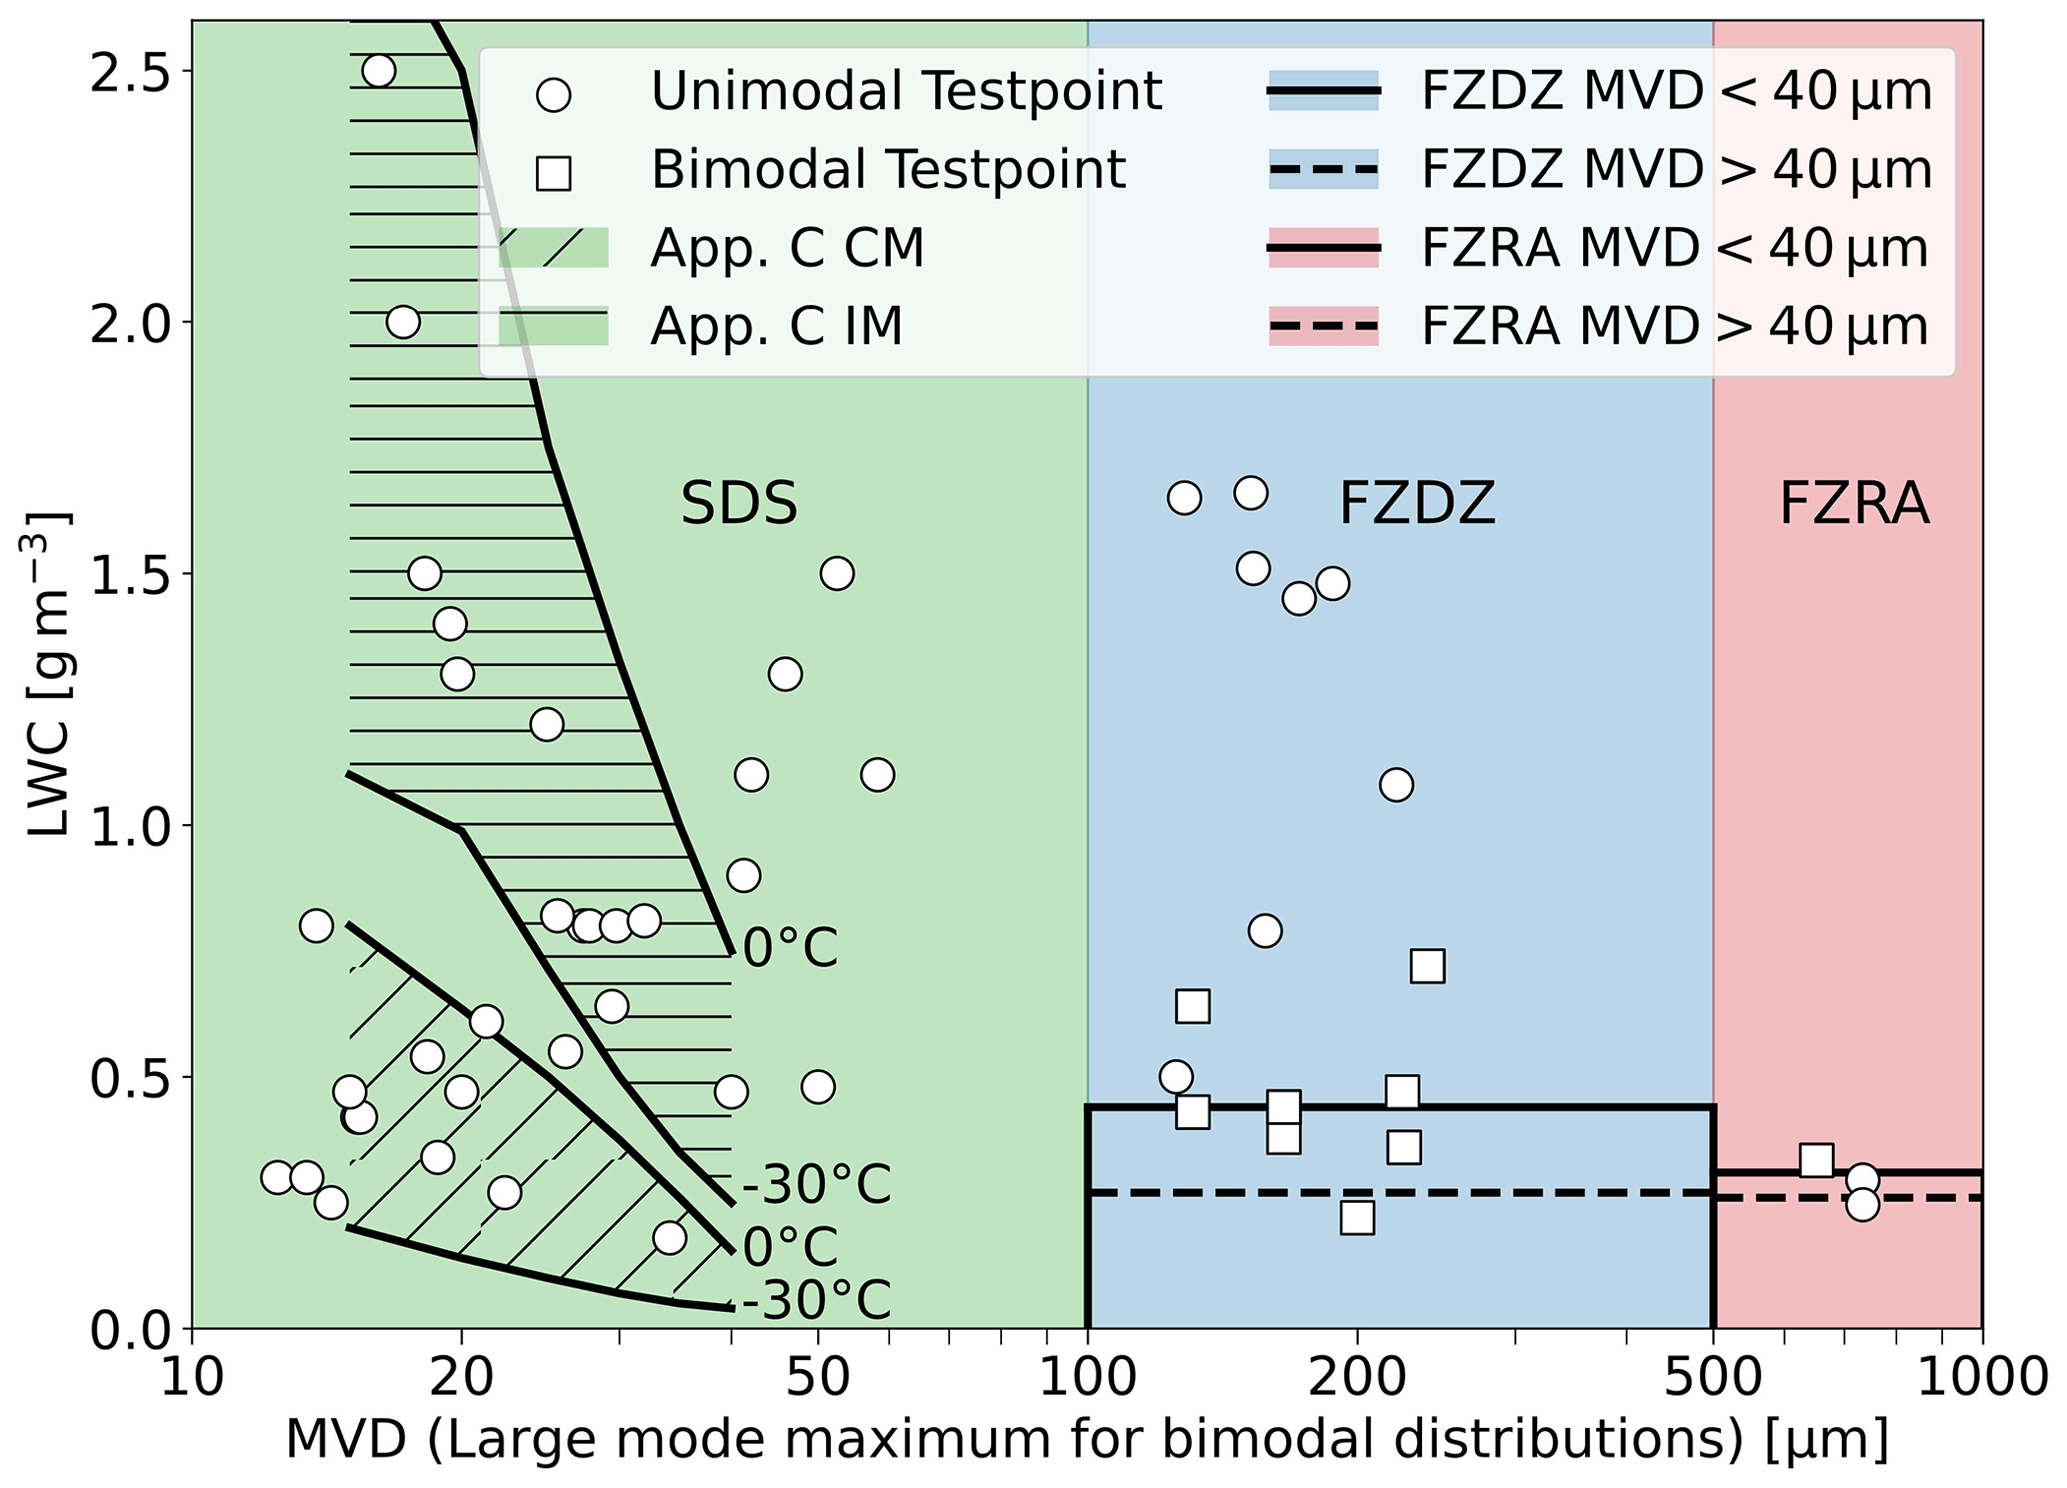
Figure 4IWT test points used in this study, grouped by droplet spray category. For unimodal test points, the markers represent the MVD, while for bimodal test points the diameter at the maximum of the large droplet mode is shown. We also show the Appendix C envelopes for continuous maximum icing conditions (CM) and intermittent maximum icing conditions (IM) and the Appendix O maximum LWC envelopes from Cober and Isaac (2012) for comparison.
Table 3Overview of the test points measured in the SENS4ICE and ICE GENESIS IWTs. The LWC values stem from the internal tunnel calibration. MVD values were derived from CCP measurements at the BIWT and Collins and from CAPS and Malvern measurements at RTA. For bimodal distributions, the diameter corresponding to the maximum of the large droplet mode is provided in brackets behind the MVD.

a Bimodal distribution.
b For testing purposes the tunnel temperature was raised above the melting point.
The problem of droplet collision efficiency on various geometries has been thoroughly investigated in the literature (Langmuir and Blodgett, 1946; McComber and Touzot, 1981; Lozowski et al., 1983; Makkonen, 1984; Finstad et al., 1988a). A droplet trajectory can be described as a function of two parameters: the droplet inertia parameter K, which relates the droplet inertia to the drag forces that act on the droplet, and the free-stream droplet Reynolds number Re (Heinrich et al., 1991). The two parameters are specified in Eqs. (7) and (8) respectively.
In the equations d denotes the droplet diameter, U the free-stream velocity, ρa and ρw are the densities of air and water, c is the characteristic length of the geometry for which the impingement is calculated, and μa is the dynamic viscosity of air. If the Reynolds number is held constant, droplet collision efficiencies increase with an increase in the droplet inertia parameter K (Heinrich et al., 1991). Therefore, larger droplets, a larger airspeed and a smaller sensor geometry result in higher collision efficiencies. Consequently, we expect lower collision efficiencies for the Nevzorov 12 mm cone than for the LWC sensor and the 8 mm cone.
One possibility to experimentally derive the collision efficiencies of the 12 mm cone is to compare its measurements in the IWT with a reference LWC value, measured with well-established sensors such as those listed in ARP5905 (AC-9C Aircraft Icing Technology Committee, 2015). Collision efficiency curves can then be estimated with a fit through the data points. Such reference LWC values exist for the SDS conditions of the three IWTs; however they were measured with different instruments. Alternatively, the measurements of the Nevzorov LWC sensor and the 8 mm cone can be used as a reference. The collection efficiencies of these two sensors are well characterized; hence their measurements can be corrected and serve as a measure for the true tunnel LWC. The advantage of using these two sensors as a reference is that they were subjected to the exact same condition as the 12 mm cone; consequently the comparison is not affected by random fluctuations of LWC in the IWTs.
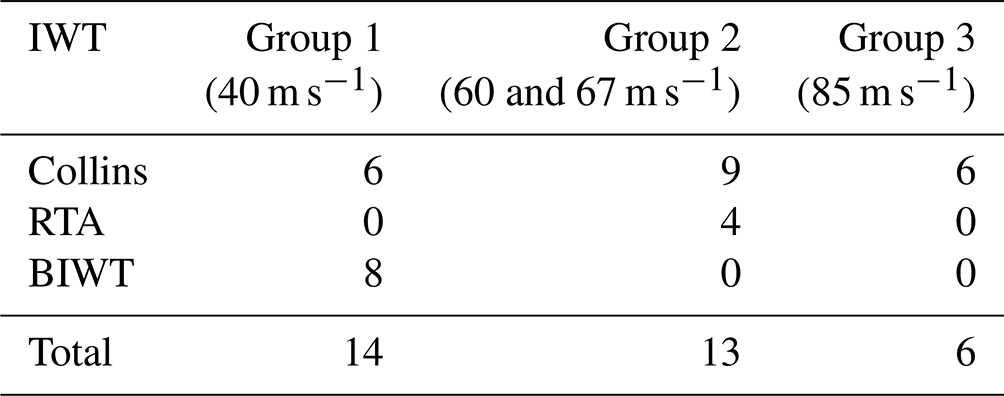
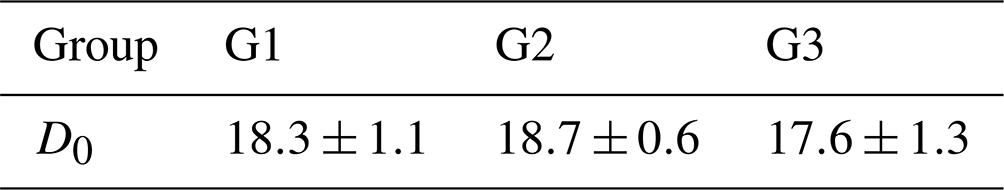
Since the collision efficiency curve changes with airspeed, we define three groups of measurements in Appendix C conditions, which can be seen in Fig. 6 and Table 4. Group 1 contains measurements at 40 m s−1 from Collins and the BIWT, Group 2 contains measurements at 60 and 67 m s−1 from Collins and RTA, and Group 3 contains measurements at 85 m s−1 from Collins. The measurements in Group 2 differ in airspeed by 7 m s−1. We group these measurements together, because we assume that the gain in accuracy of the collision efficiency curve that we obtain from using more measurements outweighs the inaccuracy that we induce by not differentiating between the airspeeds.
Table 4Number of small droplet spray measurements per airspeed group.
We compute the LWC that was present in the tunnel from the LWC sensor and the 8 mm cone measurements of the Nevzorov. As mentioned before, large droplets tend to splash on the LWC sensor, whereas for the 8 mm cone the collision efficiency of small droplets is low, which makes the LWC estimate prone to large uncertainties. We use the appropriate sensor for each measurement; if the MVD is smaller than or equal to 20 µm we utilize the collision-efficiency corrected measurements of the cylindrical LWC sensor (LWCcyl), while for an MVD larger than 20 µm we use the collision-efficiency corrected 8 mm cone measurements (LWC8). From now on we call this combination of LWC values from the LWC sensor and the 8 mm cone the Nevzorov reference LWC and denote it as LWCNevz. In an ideal experimental setup the Nevzorov probe would be exposed to monodisperse droplet distributions, the measurements of the 12 mm cone would be compared to LWCNevz and a collision efficiency curve could be derived. Realistic conditions differ from that setup because dispersed droplet distributions are produced. In our experiments, these droplet distributions are derived from the CCP or from the tunnel reference instrumentation. We assume the collision efficiency curve of the 12 mm cone can be described by a function f(d), where d is the droplet diameter. For an ideal measurement, the raw LWC measured by the 12 mm cone (W12) is equal to the LWC in the tunnel, which we approximate with LWCNevz, multiplied by the overall collision efficiency of the 12 mm cone (ε12); see Eq. (9).
Here, v(di) is the fraction of total LWC in size bin i, calculated from the available size distributions. The question arises of what kind of analytical function f(d) should be. Korolev et al. (1998) suggested Eq. (10) for f(d), where D0 is the free parameter, which can be adjusted depending on the sensor that is modeled. We also experimented with other functional forms but found that Korolev's curve produced the best results.
In the next step we formulate a system of equations for each airspeed group, where each equation represents one measurement and is of the form of Eq. (9). We find the optimal solution for D0 for each airspeed group with least squares estimation, which minimizes the sum of squared residuals (RSS; see Eq. 11) with respect to D0.
In the equation above, TPj denote the individual test points. The results of the least squares estimation is shown in Table 5. Figure 5 shows the computed collision efficiency curves. The three curves for the three different airspeed groups lie very close together so that they are hardly distinguishable. The collision efficiency of a 10 µm diameter droplet is only 0.2 but then rises steeply to 0.5 for 20 µm droplets. Beyond 20 µm the slope of the collision efficiency curve decreases continuously and the collision efficiency attains 0.7 for 30 µm droplets and 0.9 for 60 µm droplets. We note that the collision efficiency curve for Group 1 (40 m s−1) is slightly higher than that of Group 2 (60 to 67 m s−1). This is unexpected, because a higher airspeed leads to higher momentum and therefore results in a higher collision efficiency, in line with Eqs. (7) and (8). However, within the stated error margins the scenario is also possible. Figure 6 shows the corrected LWC measurements from the 12 mm cone (LWC12) and LWCNevz for the SDS test points. For all measurements the collision efficiency was computed using the full DSD. Each row of Fig. 6 contains a different airspeed group. The left panels depict the ratio of LWCNevz to the tunnel LWC; i.e., they compare how well the reference measurements from the Nevzorov probe and the tunnel agree. The shaded areas denote 10 % and 20 % deviation from the tunnel LWC measurements. The comparisons show a good agreement between LWCNevz and the tunnel LWC, where, across all airspeed groups, 58 % and 94 % of the Nevzorov measurements fall within ±10 % and ±20 % of the tunnel LWC respectively. The scatter of the data points can therefore be explained through the combined uncertainties of the Nevzorov probe and the wind tunnel.
Table 5D0 values computed from the curve fit for the different airspeed groups. The uncertainties represent the 1σ intervals that are associated with the curve fit.
The right panels show the ratio of LWC12 to the tunnel LWC. For airspeed Group 2 (Fig. 6d), LWC12 exhibits a similarly good agreement to the tunnel LWC as LWCNevz (Fig. 6c). For airspeed Groups 1 and 3 (Fig. 6b and f), the discrepancies between LWC12 and the tunnel LWC are a bit larger than between LWCNevz and the tunnel LWC (Fig. 6a and e). Across all airspeed groups, 42 % and 79 % of the LWC12 values fall within ±10 % and ±20 % of the tunnel LWC respectively. The outliers at low MVDs are mostly data points with high LWCs. There has been an ongoing discussion concerning the ability of the Nevzorov to evaporate all of the impinging water. For an earlier, shallower version of the 8 mm TWC cone, Emery et al. (2004) observed that a pool of water formed inside the cone and was occasionally swept out, which led to an underestimate of the LWC. The effect occurred during ice shaver conditions run at an airspeed of 67 m s−1 and a TWC larger than 2.1 g m−3. For this work, a thorough analysis of the data found no evidence of pooling. Pooling and subsequent underestimates of LWC should be a function of LWC flux. While LWC12 is lower than the tunnel LWC for some of the high LWC flux test points, it is equal or higher for many others (see Fig. 6 and Table 3). The discrepancy between LWC12 and the tunnel LWC for the low MVD and high LWC points can in part be explained through droplet coincidence effects in the CDP. The number concentrations for these test points exceeded 2000 cm−3, and droplet coincidence (Lance et al., 2010; Lance, 2012) was present (see Appendix B). Droplet coincidence results in a shift towards larger particles in the size distribution, which in turn decreases the applied collision efficiency. The magnitude of the effect and its exact influence on LWC12 could not be determined, because the interarrival time data, which we use to correct for coincidence, were not available for the measurements at Collins.
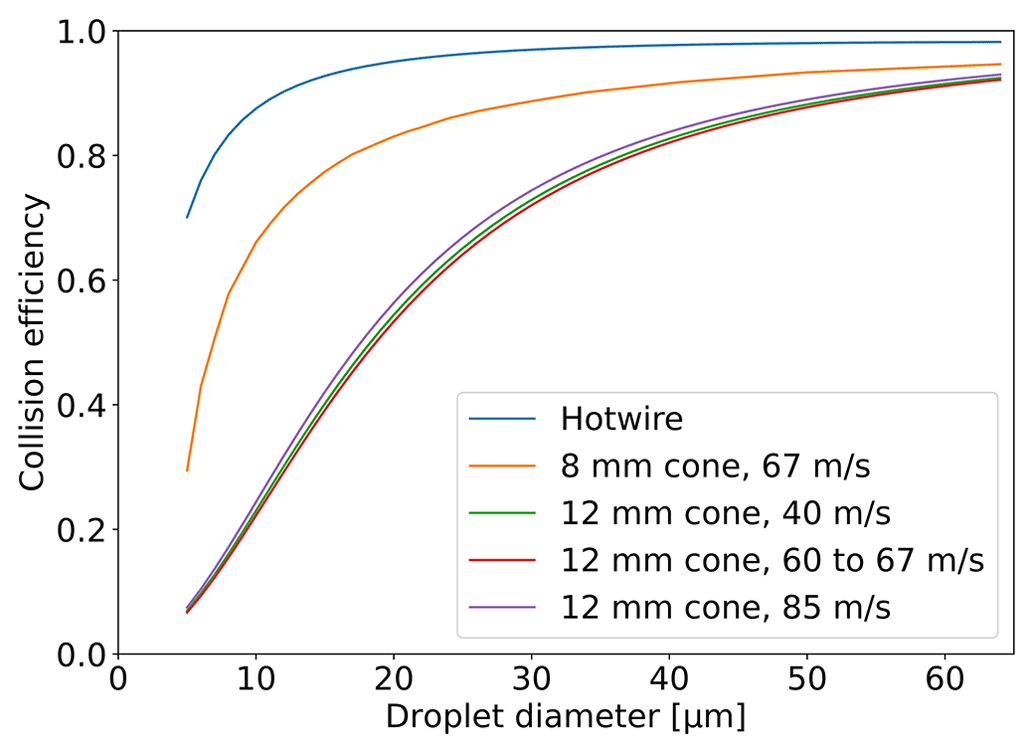
Figure 5Collision efficiency curves of the 12 mm cone for the three airspeed groups; the collision efficiencies of the LWC sensor and the 8 mm cone from the literature are shown for comparison.
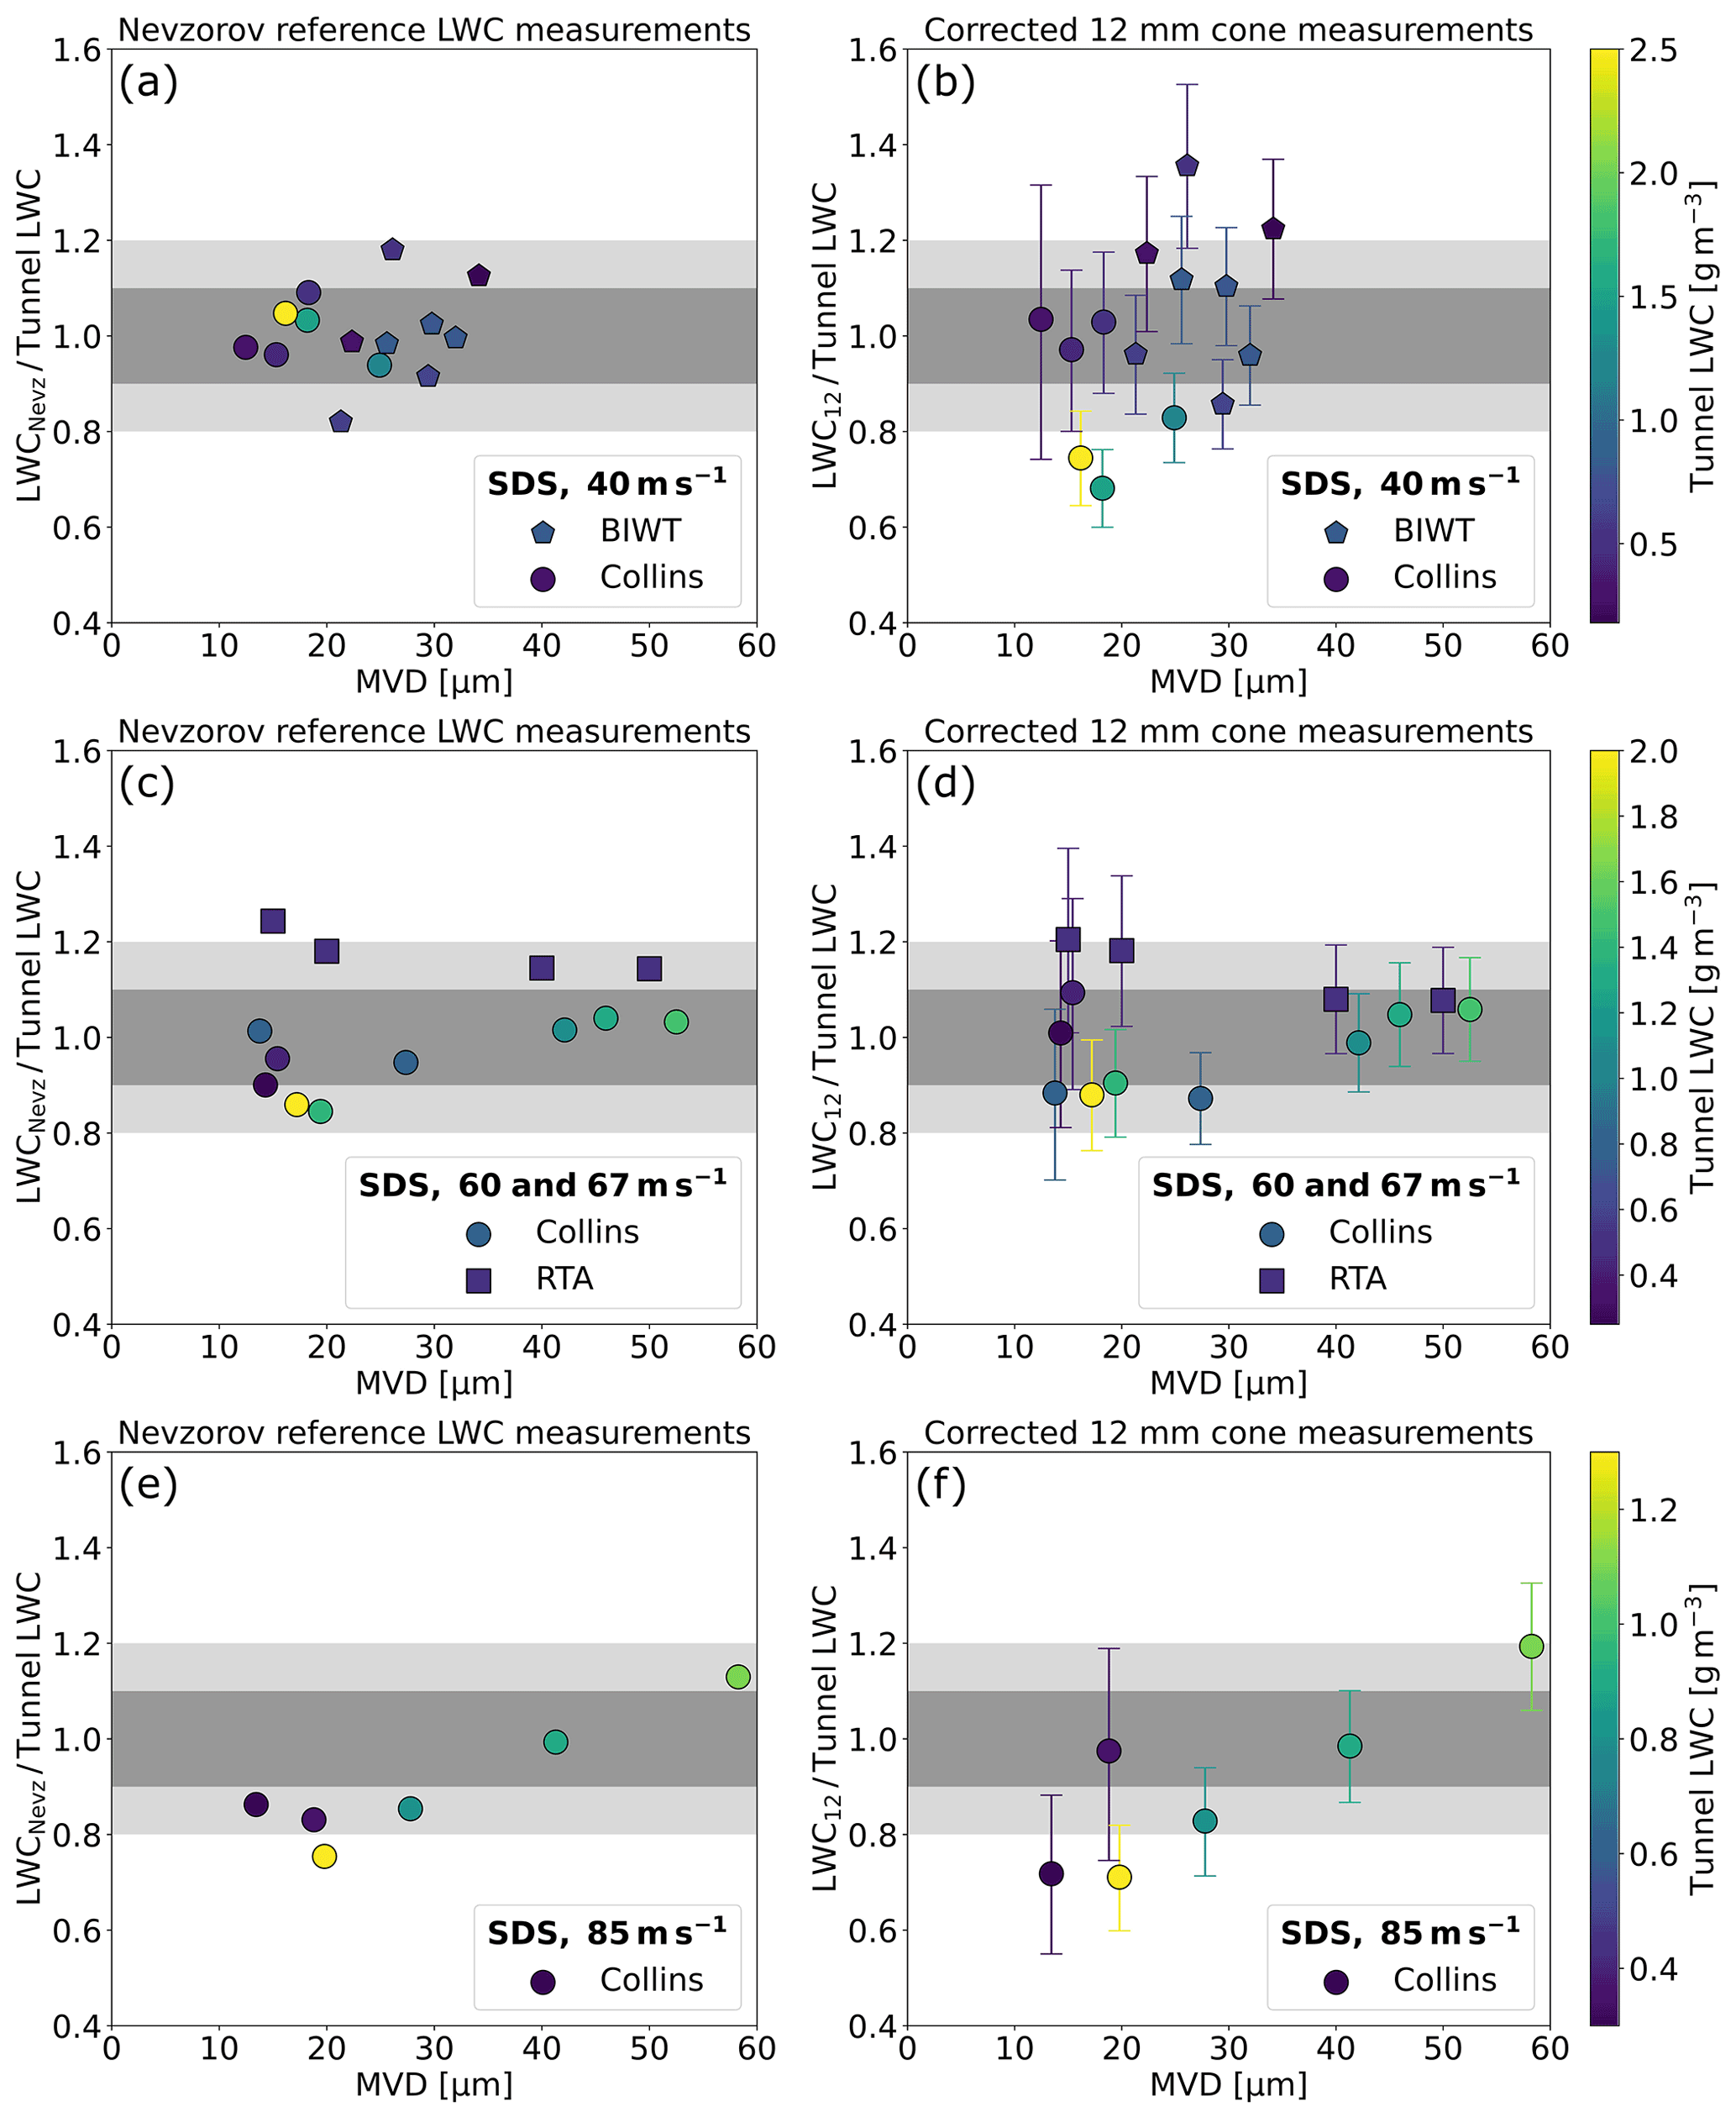
Figure 6Comparison of the Nevzorov reference LWC and the corrected 12 mm cone LWC to the tunnel LWC for the three different airspeed groups. The error bars incorporate all uncertainty sources of the Nevzorov probe as detailed in Appendix A, including the uncertainty in the collision efficiency curve that is described by the standard deviation of D0 (see Table 5). The error bars do not consider uncertainties not related to the Nevzorov probe, e.g., the IWT variability.
The Nevzorov probe was also tested in unimodal large droplet conditions; see Table 3. These test points provide valuable information on the response of the Nevzorov sensors to large drops. Figure 7 shows the results of the measurements in comparison to the tunnel LWC, determined with the WCM-2000 instrument for the FZDZ cases (except for the lowest MVD FZDZ test point that was measured at RTA with multiple instruments) and with an IKP for the FZRA test points. No collision efficiency corrections were applied to any of these measurements, because the droplet diameters were deemed to be sufficiently large for collision efficiency effects to be irrelevant (hence LWC12=W12). The overall agreement between the Nevzorov and the tunnel LWC is good; all LWC8 measurements and all but one LWC12 measurement fall within ±20 % of the tunnel LWC. LWC8 and LWC12 generally follow a similar trend in comparison to the tunnel LWC, but the LWC12 measurement is on average 6.5 % higher than the LWC8 measurement. For the FZDZ test points, where the tunnel LWC was determined with the WCM-2000, LWC8 and LWC12 increasingly exceed the tunnel LWC for increasing MVD values. This does not apply for the FZRA test points, for which the tunnel LWC was determined with the IKP.
The results suggest that the Nevzorov TWC sensors are better suited than the WCM-2000 for the collection of droplets with diameters of approximately 200 µm or more. A possible explanation is the greater depth and width of the Nevzorov sensors, which allows them to retain most of the large droplets. Splashing and bouncing effects, similar to those described by Korolev et al. (2013) for an earlier, shallower version of the Nevzorov TWC cone, might occur on the 2.1 mm wide WCM-2000 TWC sensor. In line with these observations, a comparison of the WCM-2000 and the IKP shows that the LWC measurements of the IKP exceeded those of the WCM-2000 (Lang et al., 2021) in FZRA conditions even by as much as 65 %.
We remark that there can be other factors which cause or contribute to the discrepancies between Nevzorov and WCM-2000, such as the different mounting positions of the two instruments or an uneven distribution of the large droplet spray. Also, the high LWC large droplet spray at Collins led to oscillations of the sensor head, which may have affected the result of the measurements.
The fact that LWC12 is on average higher than LWC8 suggests that the 12 mm cone is preferable to the 8 mm cone for the collection of large droplets; as its depth is larger and its perimeter-to-area ratio is smaller than that of the 8 mm cone, the probability of droplet re-entrainment into the airflow after impacting inside the cone is reduced. However, we note that the difference between the two cones is still within the uncertainty range of the instrument.

Figure 7Measurements of the 12 mm cone and the 8 mm cone in comparison to the tunnel LWC in unimodal SLD conditions. The tunnel LWC is based on WCM-2000 measurements for all the FZDZ test points and on the IKP for the FZRA test points.
We now apply the newly computed droplet collision efficiencies to bimodal distributions measured in the BIWT and the RTA wind tunnel. As Collins only produces unimodal DSDs, there are no data available from this IWT. An overview of cumulative liquid water content (CWC) from the bimodal DSDs measured with the CCP in the BIWT can be seen in Fig. 8. Often, collision efficiencies of DSDs are approximated by using the MVD as a representative diameter for the entire distribution. This has been shown to work well for small cylindrical sensors and unimodal droplet distributions (Stallabrass, 1978; Finstad et al., 1988b). Recently, Sokolov and Virk (2019) found that Langmuir A–J distributions with similar MVDs had very different collision efficiencies on a 30 mm cylinder at an airspeed of 4 m s−1. Furthermore, larger errors can be introduced when using the MVD approximation for bimodal distributions (FAA, 2014). Van Zante et al. (2021) also caution that bimodal distributions cannot be fully captured and represented by the MVD. We investigate the magnitude of the errors introduced by using the MVD approximation for droplet collision efficiency for a number of bimodal distributions measured in the BIWT; see Fig. 8. The figure also shows the relative error in the LWC when the MVD approximation for droplet collision efficiency is used. It highlights the importance of computing the collision efficiency from the entire DSD, especially for sensors such as the 12 mm cone where a large collision efficiency correction is applied. In one bimodal distribution the error from the usage of the MVD approximation for droplet collision efficiency exceeded 30 %. Note that the relative error is not a function of the MVD but rather depends on how well the MVD represents the DSD. As a consequence of the findings presented above, we use the full DSD as input to the collision efficiency function when computing LWC12 and LWC8 in bimodal distributions.
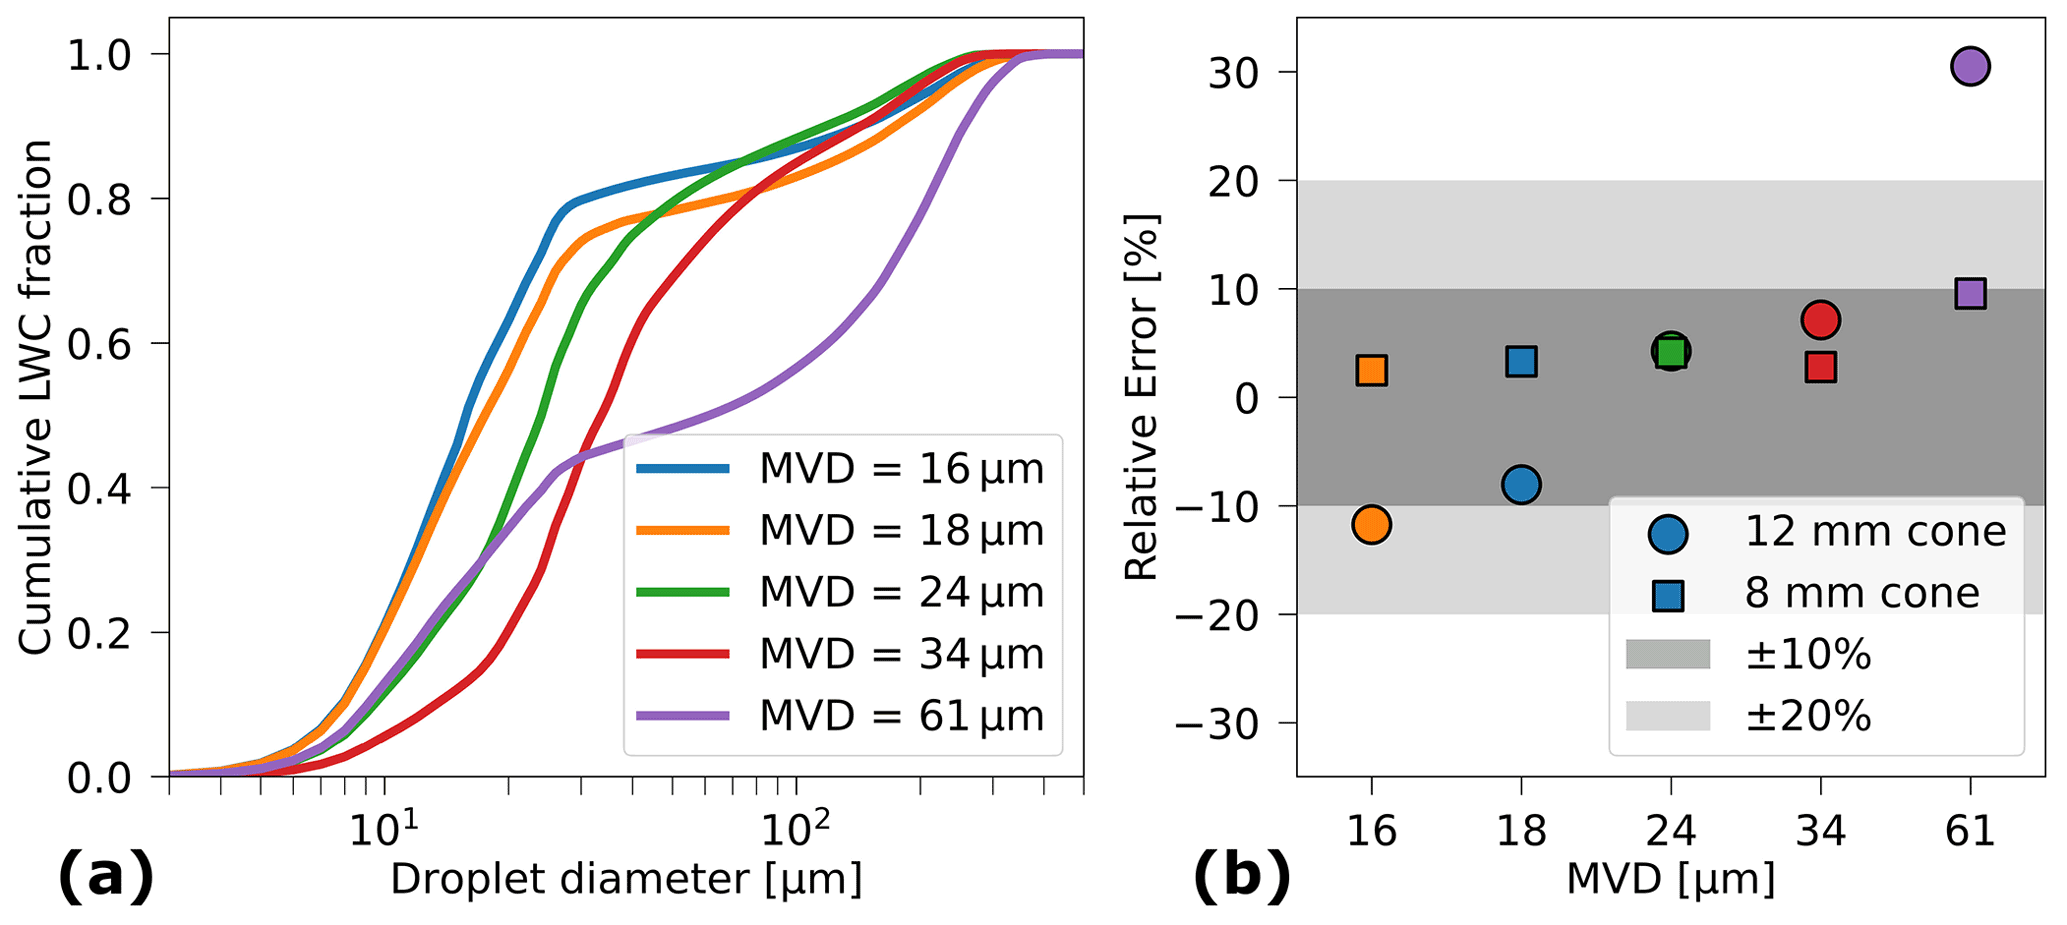
Figure 8(a) Cumulative liquid water content of the bimodal DSDs measured in the BIWT. The distributions with the MVDs of 16, 18 and 61 µm have a small droplet mode centered around 15 µm and a large droplet mode at approximately 230 µm. They differ mainly in the ratio of LWC contained in small droplets to LWC contained in large droplets. The distributions with MVDs of 24 and 34 µm have their small droplet mode centered at 20 and 30 µm respectively and their large droplet mode at 166 µm. (b) Relative error of the LWC estimate that is introduced when approximating the collision efficiency from the MVD as compared to the collision efficiency estimated using the DSDs shown on the left side.
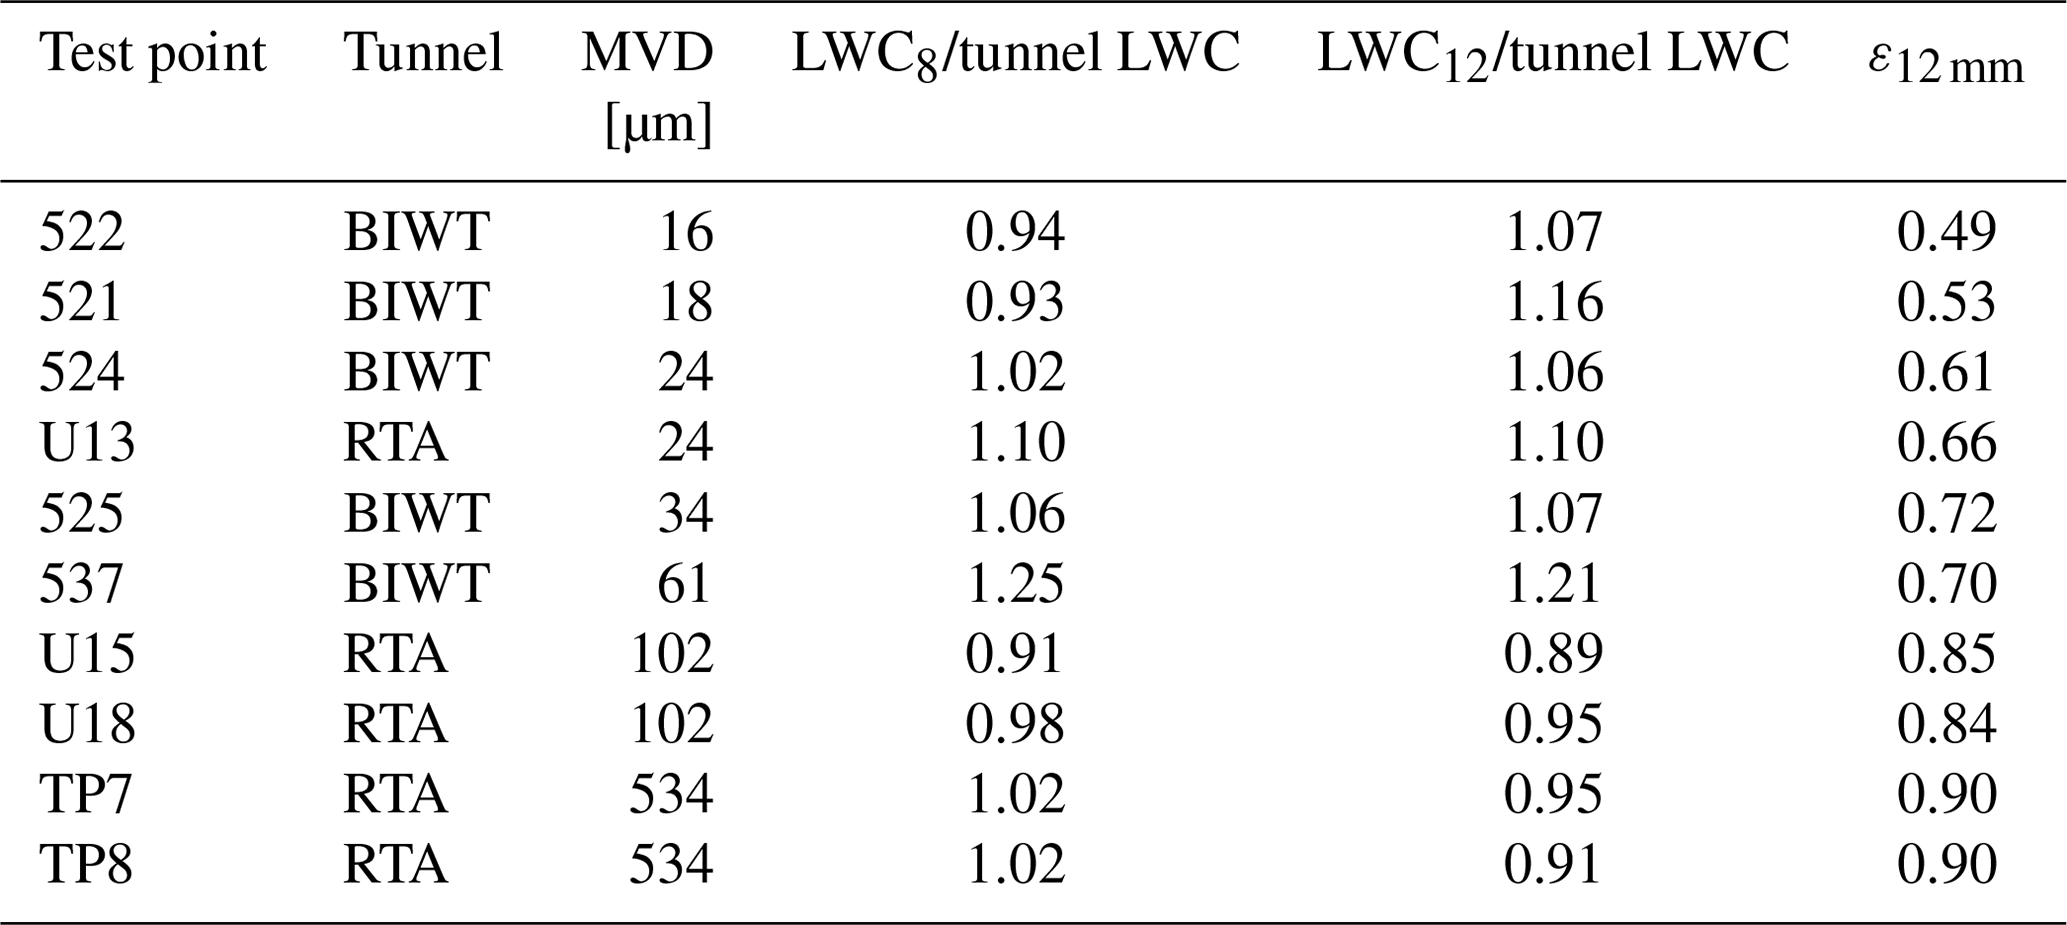
In Fig. 9 and Table 6 we present a comparison of LWC12 to the tunnel LWC for the bimodal FZDZ and FZRA conditions that we measured in the BIWT and at RTA. The LWC8 is plotted for comparison. The results show that LWC12 and LWC8 agree within ±20 % with the tunnel LWC for all but one test point. We also observe that the measurements of the two Nevzorov cones, LWC12 and LWC8, coincide closely with each other once the MVD exceeds 24 µm. At lower MVDs, LWC12 and LWC8 diverge into opposite directions from the tunnel LWC.
The results prove that reliable measurements of LWC in bimodal SLD conditions can be achieved with the 12 mm TWC cone of the Nevzorov probe. The collision efficiency correction appears to be very accurate once the MVD exceeds 24 µm. The divergence of LWC12 and LWC8 from the tunnel LWC at lower MVD can be seen as an indication that minor errors still exist in the collision efficiency curve of the 12 mm cone and possibly also in that of the 8 mm cone, as acknowledged by Strapp et al. (2003). The analytical form for the collision efficiency curve of the 12 mm cone is simple; therefore it is probable that the curve cannot accurately represent the collision efficiency for all diameters. Furthermore, the collision efficiency at small diameters is low so that even a small offset in the curve introduces large errors in the result. For the test point at an MVD of 61 µm, both LWC12 and LWC8 exceed the tunnel LWC by approximately the same value, and the offset is consistent for both measurements that were made in this condition. This indicates that the discrepancy is not due to a problem with the Nevzorov probe or the collision efficiency correction, but more likely a larger uncertainty in the tunnel calibration exists for this point. Finally we would like to note that errors in the size distribution, which we use as an input for the computation of the collision efficiency, propagate into the errors of the LWC.
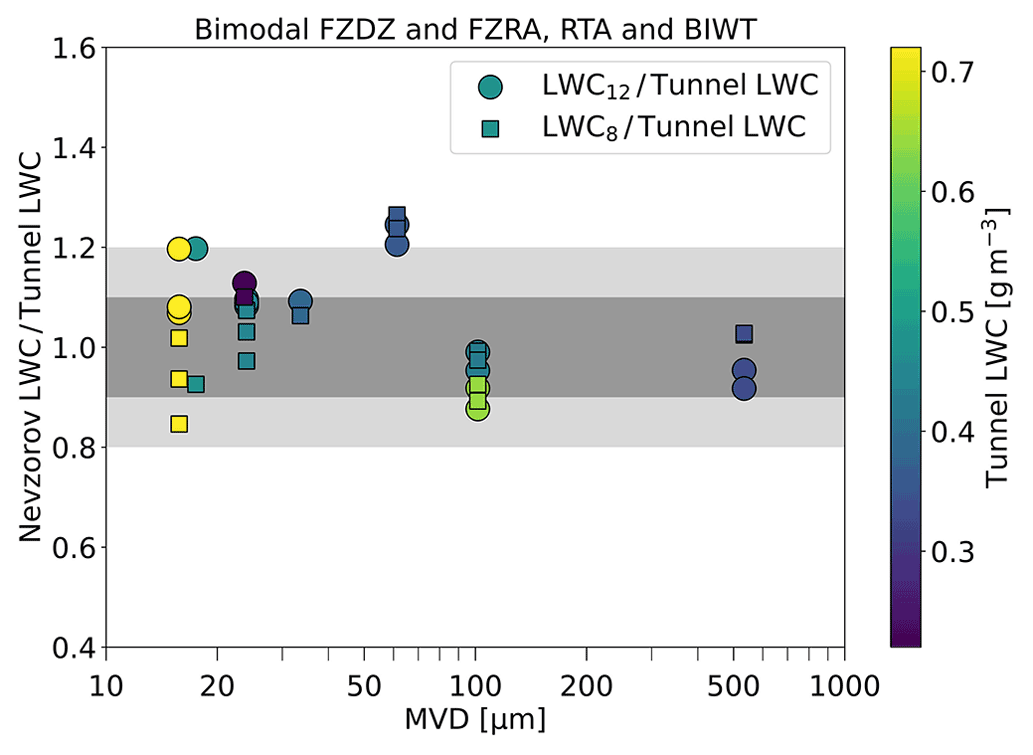
Figure 9Same as Fig. 7 but for bimodal distributions and with collision efficiencies applied. For the BIWT FZDZ test points, the tunnel LWC is based on flow meter measurements. The tunnel LWC of the FZDZ test points from RTA was determined from a combination of icing blade and WCM-2000. The tunnel LWC of the FZRA test points from RTA stems from a combination of icing blade and IKP measurements. Table 6 lists the IWT where the individual test points originated.
Table 6Comparison of the LWC12 to the tunnel LWC and LWC8. The values of test points that were measured multiple times were averaged.
This work investigates the performance of a new, 12 mm diameter TWC cone of the Nevzorov probe, using data collected in three different IWTs. We compared the LWC measured with the 12 mm cone to the measurements of the LWC sensor and the 8 mm cone of the Nevzorov probe as well as to the tunnel LWC. We found that a large correction needs to be applied to compensate for the low droplet collision efficiency of the cone. We experimentally derived this collision efficiency for three different airspeeds, using test points with MVDs between 12 and 58 µm. For the shape of the collision efficiency curve we prescribed the functional form suggested in Korolev et al. (1998). In order to obtain the highest accuracy, we used the droplet size distributions of each individual test point for the derivation. We verified the capability of the 12 mm cone to collect SLDs through a comparison with the tunnel reference instrumentation, which included a WCM-2000 and an IKP. The results indicate that the 12 mm cone has better droplet collection properties than the WCM-2000 when the droplet size exceeds 200 µm. Even in FZRA conditions, the 12 mm cone does not suffer from any significant losses of LWC; instead our comparison showed a good agreement to the values of the IKP. The 12 mm cone also appears to be better suited for the collection of SLDs than the 8 mm cone, because it measured slightly but consistently higher LWC values. The difference between the two cones is however still within their mutual uncertainty range.
We subsequently applied the new collision efficiency correction to measurements collected with the 12 mm cone in bimodal distributions and compared the resulting LWCs to those of the 8 mm cone and the tunnel LWC. The comparison showed an agreement within ±20 % with the tunnel LWC for all but one test point, highlighting the ability of the 12 mm cone to provide accurate measurements across the entire size range of Appendix O conditions. We observed that some inaccuracies remain in the computed curves at small droplet diameters and caution should therefore be exercised when using the 12 mm cone in conditions that contain strong small droplet modes. For such conditions the collision efficiency curve for the 12 mm cone may be applied, but the corrected LWC readings should be compared to those of the LWC sensor and the 8 mm cone to assess their plausibility.
We also investigated the magnitude of the errors that can be introduced when one approximates the collision efficiency via the MVD instead of using the entire size distribution. The error depends on the collision efficiency correction that is applied and the size distribution. For the collision efficiency curve of the 12 mm cone the error exceeded 30 % in one case, which stresses the importance of using the entire size distribution in the collision efficiency calculation.
In summary, our results and findings demonstrate that the 12 mm cone of the Nevzorov probe is suitable for the measurement of SLD icing environments. Future IWT and flight campaigns with the Nevzorov will be able to use the 12 mm cone as a reliable source for the LWC with excellent properties for the collection of SLDs. The larger sample area of the 12 mm cone also represents an improvement over the 8 mm cone, which is especially relevant when measuring FZDZ, FZRA or mixed-phase conditions in natural clouds, where very few large particles are present, and a short sampling time is crucial.
Like any other measurement method, the Nevzorov probe measurements are subject to uncertainties. Here, we will attempt to quantify the uncertainties. First of all, let us categorize the uncertainties which affect the Nevzorov measurements:
- –
general accuracy. This category comprises all the uncertainties which are intrinsically connected to the sensor, e.g., uncertainties related to the response of the electronics or slight differences in the sensor geometry. Each Nevzorov sensor head is handmade; therefore we consider it likely that some differences exist between each of them. We conservatively estimate these uncertainties to influence the LWC measurement by up to ±10 %.
- –
accuracy of the convective heat loss term. The convective heat losses that are experienced by each sensor depend on airspeed, temperature, pressure and the sensor geometry. We will disregard the influence of pressure changes here, as it was approximately constant in all wind tunnels. Generally, a higher airspeed, lower temperature and larger sensor geometry lead to larger convective heat losses. However, in order to assess how an inaccuracy in the estimated convective heat losses affects the overall LWC measurement, we need to consider the contribution of the convective heat-loss term to the total power expenditure. The contribution of the convective heat-loss term decreases with increasing LWC; hence the relative error caused by an inaccuracy in the estimated convective heat losses is smaller for high LWC test points than for low LWC test points. To ensure comparability, we state all uncertainties with respect to a reference LWC value of 0.2 g m−3. The 8 mm cone and the 12 mm cone have larger absolute convective heat losses than the LWC sensor; however they also capture significantly more liquid water due to their larger sample area. Their inverted-conical shape inhibits the airflow and thus reduces convective heat losses (see Fig. A1). The energy that is expended by the 8 and 12 mm cone for convective heating per unit volume of air is 2.5 to 3 times less than that of the LWC sensor. Lastly, convective heat losses increase sub-linearly with airspeed, while the liquid water influx on the sensor sample area is a linear function of airspeed. Consequently, measurements at high airspeed are less affected by errors in the convective heat loss term. For the wind tunnel test points, we were able to determine the factor k with an uncertainty below 2 %. The error that results from this uncertainty can amount to approximately 11 % for the LWC sensor under the least favorable conditions ( ∘C, U=40 m s−1). For the 8 and 12 mm cone the uncertainties for this condition are 5 % and 3.5 % respectively. In favorable conditions, such as ∘C and U=85 m s−1, the uncertainties due to convective heat losses for the LWC, 8 mm cone and 12 mm cone sensors are only 7 %, 2.5 % and 2 % respectively.
- –
accuracy of the collision efficiency. The formulations of Langmuir and Blodgett (1946) and Finstad et al. (1988a) for the flow of droplets around a cylinder agree within 2 % for the droplet sizes that are relevant for this study. Hence we assume that the uncertainty in the LWC collision efficiency estimate is not greater than that value. Strapp et al. (2003) did not publish any uncertainties for their collision efficiency curve of the 8 mm cone but noted that the curve may contain significant errors at small droplet diameters. We found that the values of LWC8 indeed fall significantly below that of the tunnel LWC and LWCcyl at small droplet diameters (see Fig. A2). A downward shift of the collision efficiency curve by 0.14 and 0.07 yielded the best agreement of LWC8 with the tunnel LWC and LWCcyl respectively if only test points with an MVD <20 µm were considered. Above 20 µm the agreement between LWC8 and the tunnel LWC is very good; only a very slight downward shift of the collision efficiency curve by 0.02 would lead to marginally lower residuals between the tunnel LWC and LWC8 (we did not compare LWC8 to LWCcyl, because we considered the measurement of the LWC sensor unreliable because of possible splashing effects). We therefore assume that the collision efficiency curve of Strapp et al. (2003) is accurate to within ±0.02 for diameters of 20 µm or larger.
We consider all the abovementioned uncertainties to be uncorrelated biases which are Gaussian distributed. We combine them using the procedure suggested in AGARD-AR-304 (1994). For LWCcyl the maximum combined uncertainty that we expect for MVDs between 10 and 20 µm is ±15 %; in IWT conditions which are more favorable in terms of the magnitude of the convective heat losses, the uncertainty decreases to approximately ±12 %. For LWC8 the maximum uncertainty in the MVD range from 20 to 60 µm is ±11 %. The uncertainty in LWC12 at small MVDs is inevitably large and reaches up to ±29 % at an MVD of 12 µm and U=40 m s−1. However, the uncertainty rapidly decreases to ±19 % at an MVD of 15 µm and to ±14 % at an MVD of 22 µm. Uncertainties in the convective heat losses of the 12 mm cone are small compared with the other uncertainty sources; therefore changes in airspeed or temperature should only cause minor differences in the stated uncertainties.

Figure A1Convective heat losses of the Nevzorov sensors per volume of air. The volume of air that a sensor is exposed to is computed from the sample area and the airspeed. Turbulence and blockage effects that may occur around the sensors are not considered for this plot.
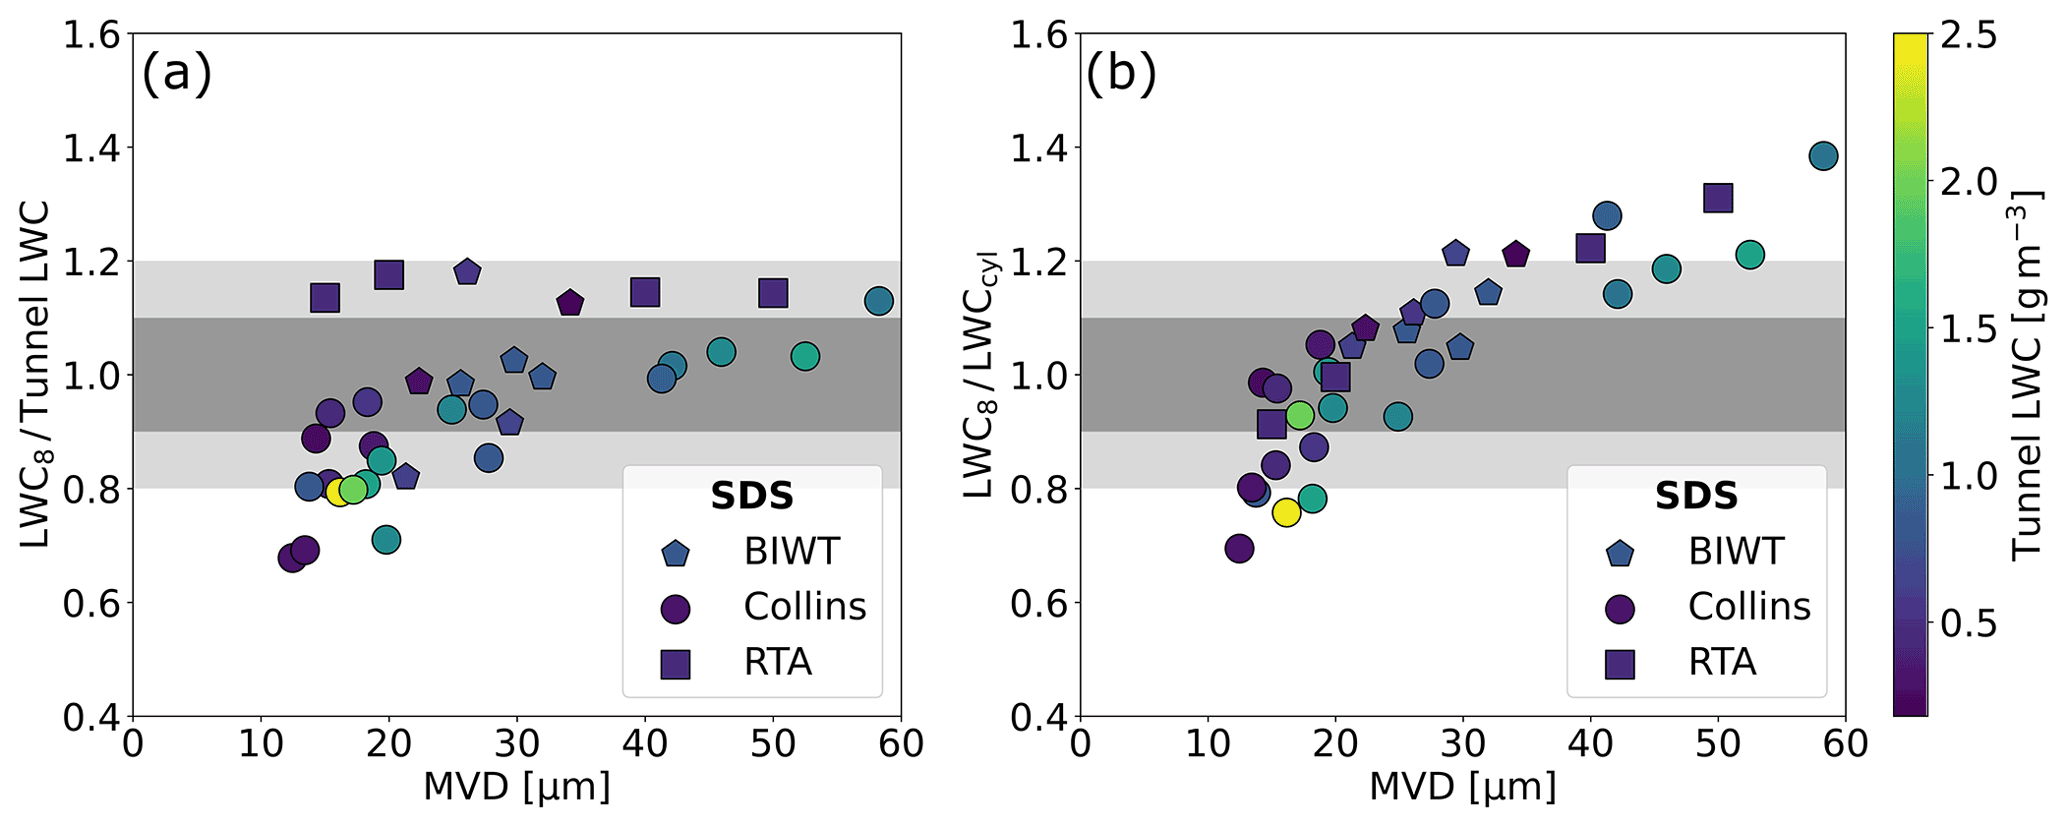
Figure A2Comparison of the collision-efficiency corrected 8 mm cone measurements to the tunnel LWC (a) and to the collision-efficiency corrected LWC sensor measurements (b).
In SLD conditions, further measurement uncertainties are introduced due to the possibility of droplet splashing. However, the Nevzorov sensors were designed to mitigate splashing effects. On the basis of high-speed camera images, Korolev et al. (2013) claim that the number of ice particles that bounce from the 8 mm cone is small. The design of the new 12 mm cone is even better than that of the 8 mm cone for retaining ice particles and droplets. This suggests that the influence of droplet splashing effects is rather small, but at this point we cannot quantify the exact magnitude. A second source of uncertainty in SLD conditions is caused by high-frequency flutter of the sensor head around its axis of rotation, which was observed to be significantly stronger during SLD conditions with high LWC than in SDS conditions. This flutter led to (very short-term) deflections of the sensor head of up to ±20∘. The change in the sample area caused by the flutter is however just a few percent. We note that the previously mentioned uncertainty sources, which affect the Nevzorov probe in general, are not increased in SLD conditions compared to SDS conditions. In fact, the uncertainty of the collision efficiency in SLD conditions is very close to zero, because the collision efficiency of SLDs is essentially 100 %.
Section 5 mentions that droplet coincidence in the CDP was present for some of the high LWC test points. Droplet coincidence occurs when two or more droplets are measured by the instrument at the same time (Baumgardner et al., 1985). These coincident droplets are counted as a single and often larger droplet. Coincidence can be detected through an analysis of particle transit times, which increase if coincidence is present (Lance, 2012). Figure B1 shows the average path length during which the CDP sizer was above the detection threshold, plotted versus the number concentration. The average path length is the average transit time multiplied with the airspeed. This was done in order to compare test points with different airspeeds. Test points with larger MVDs produce longer average path lengths, which is to be expected simply due to the larger particle size. However, Fig. B1 shows that longer average path lengths are also observed for test points with high number concentrations. Since we know that coincident droplets cause longer transit times, we deduce that coincidence occurred for these test points.
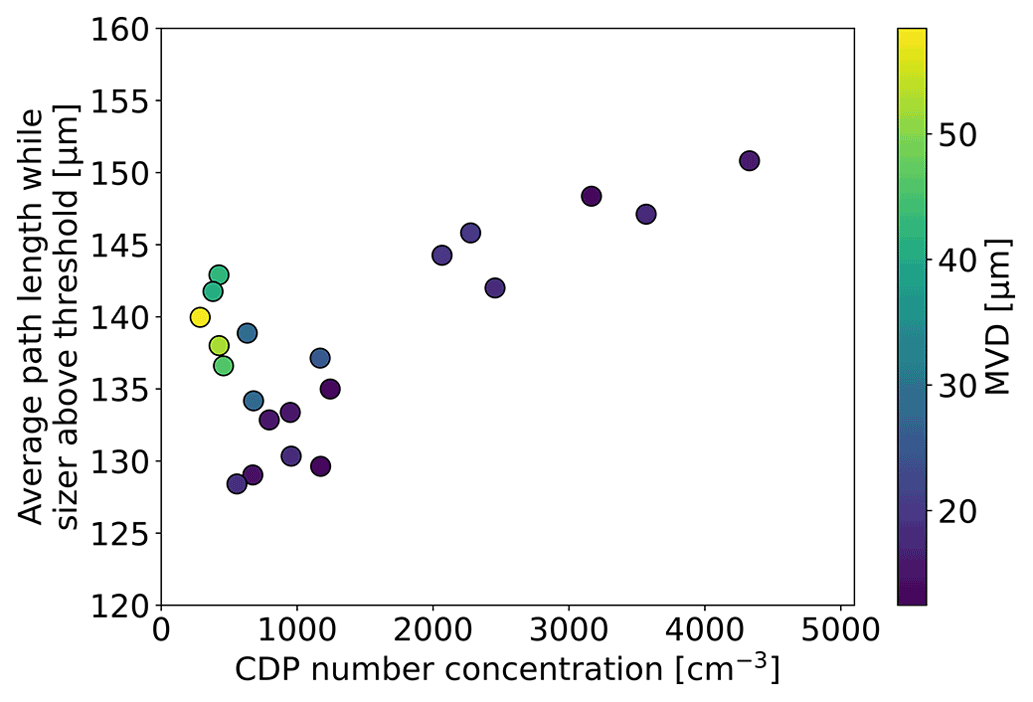
Figure B1Average path length while sizer above threshold plotted against the number concentration for the SDS test points measured at Collins. The average path length is a measure similar to the average transit time but multiplied with the airspeed in order to make test points with different airspeeds comparable.
The complete data sets from the BIWT and RTA are available at https://doi.org/10.5281/zenodo.6817112 (Lucke et al., 2022). Collins IWT considers raw measurements from its tunnel as confidential information; therefore the data cannot be made public.
JL prepared the manuscript, operated the DLR probes at Collins and in the BIWT and was responsible for the overall data analysis. TJW assisted in developing the concept for the manuscript, the discussion of the data evaluation, and the planning and execution of the IWT campaigns. MH, WB and VRB conducted the measurements at Collins, RTA and the BIWT respectively and provided the wind tunnel data. RH and VH operated the DLR probes during the measurements at RTA. MM assisted with the analysis of the CIP data. TJW and CV designed the experiment. All authors commented on the manuscript.
The contact author has declared that none of the authors has any competing interests.
Publisher’s note: Copernicus Publications remains neutral with regard to jurisdictional claims in published maps and institutional affiliations.
We thank Galdemir Botura and the technical staff at Collins Aerospace for supporting icing innovation and for the constructive and inspiring collaboration within the SENS4ICE project. We thank Embraer for providing their Cloud Combination Probe and Matt Freer for his support in the measurement campaign at the Collins IWT. We also appreciate the help and expertise of Stephan Sattler during the wind tunnel measurements at the BIWT and the support of Inken Knop in the data evaluation. We furthermore thank Alexei Korolev and one anonymous reviewer for their helpful and constructive reviews.
This project has received funding from the European Union’s Horizon 2020 research and innovation programme under grant agreement no. 824253 (SENS4ICE). This project has received funding from the European
Union’s Horizon 2020 research and innovation programme under grant agreement no. 824310 (ICE GENESIS). Furthermore, research performed as part of this worked has received funding from the German Research
Foundation (DFG, Deutsche Forschungsgemeinschaft) under the Priority Program SPP PROM Vo1504/5-1.
The article processing charges for this open-access publication were covered by the German Aerospace Center (DLR).
This paper was edited by Wiebke Frey and reviewed by Alexei Korolev and one anonymous referee.
AC-9C Aircraft Icing Technology Committee: Calibration and Acceptance of Icing Wind Tunnels, SAE International, ARP5905, https://doi.org/10.4271/ARP5905, 2015. a, b, c
AGARD-AR-304: Quality assessment for wind tunnel testing, Advisory Group for Aerospace Research & Development, AGARD-AR-304, 96 pp., ISBN 92-835-0753-3, 1994. a
Bansemer, A.: SODA2, GitHub [code], https://github.com/abansemer/soda2 (last access: 14 January 2022), 2013. a
Bansmer, S. E., Baumert, A., Sattler, S., Knop, I., Leroy, D., Schwarzenboeck, A., Jurkat-Witschas, T., Voigt, C., Pervier, H., and Esposito, B.: Design, construction and commissioning of the Braunschweig Icing Wind Tunnel, Atmos. Meas. Tech., 11, 3221–3249, https://doi.org/10.5194/amt-11-3221-2018, 2018. a
Baumgardner, D., Strapp, W., and Dye, J. E.: Evaluation of the Forward Scattering Spectrometer Probe. Part II: Corrections for coincidence and dead-time losses, J. Atmos. Ocean. Tech., 2, 626–632, 1985. a
Baumgardner, D., Jonsson, H., Dawson, W., O'Connor, D., and Newton, R.: The cloud, aerosol and precipitation spectrometer: a new instrument for cloud investigations, Atmos. Res., 59-60, 251–264, https://doi.org/10.1016/s0169-8095(01)00119-3, 2001. a
Baumgardner, D., Abel, S. J., Axisa, D., Cotton, R., Crosier, J., Field, P., Gurganus, C., Heymsfield, A., Korolev, A., Krämer, M., Lawson, P., McFarquhar, G., Ulanowski, Z., and Um, J.: Cloud Ice Properties: In Situ Measurement Challenges, Meteor. Mon., 58, 9.1–9.23, https://doi.org/10.1175/amsmonographs-d-16-0011.1, 2017. a, b, c, d, e
Bernstein, B., DiVito, S., Riley, J. T., Landolt, S., Haggerty, J., Thompson, G., Adriaansen, D., Serke, D., Kessinger, C., Tessendorf, S., Wolde, M., Korolev, A., Brown, A., Nichman, L., Sims, D., and Dumont, C.: The In-Cloud Icing and Large-Drop Experiment Science and Operations Plan, United States, Department of Transportation, Federal Aviation Administration, Tech. Report, DOT/FAA/TC-21/29, https://doi.org/10.21949/1524472, 2021. a
Braga, R. C., Rosenfeld, D., Weigel, R., Jurkat, T., Andreae, M. O., Wendisch, M., Pöhlker, M. L., Klimach, T., Pöschl, U., Pöhlker, C., Voigt, C., Mahnke, C., Borrmann, S., Albrecht, R. I., Molleker, S., Vila, D. A., Machado, L. A. T., and Artaxo, P.: Comparing parameterized versus measured microphysical properties of tropical convective cloud bases during the ACRIDICON–CHUVA campaign, Atmos. Chem. Phys., 17, 7365–7386, https://doi.org/10.5194/acp-17-7365-2017, 2017a. a
Braga, R. C., Rosenfeld, D., Weigel, R., Jurkat, T., Andreae, M. O., Wendisch, M., Pöschl, U., Voigt, C., Mahnke, C., Borrmann, S., Albrecht, R. I., Molleker, S., Vila, D. A., Machado, L. A. T., and Grulich, L.: Further evidence for CCN aerosol concentrations determining the height of warm rain and ice initiation in convective clouds over the Amazon basin, Atmos. Chem. Phys., 17, 14433–14456, https://doi.org/10.5194/acp-17-14433-2017, 2017b. a
Breitfuß, W., Wannemacher, M., Knöbl, F., and Ferschitz, H.: Aerodynamic Comparison of Freezing Rain and Freezing Drizzle Conditions at the RTA Icing Wind Tunnel, SAE International, https://doi.org/10.4271/2019-01-2023, 2019. a, b, c
Cober, S., Bernstein, B., Jeck, R., Hill, E., Isaac, G., Riley, J., and Shah, A.: Data and Analysis for the Development of an Engineering Standard for Supercooled Large Drop Conditions, FAA, Tech. Report, DOT/FAA/AR-09/10, 89 pp., 2009. a
Cober, S. G. and Isaac, G. A.: Characterization of Aircraft Icing Environments with Supercooled Large Drops for Application to Commercial Aircraft Certification, J. Appl. Meteorol. Clim., 51, 265–284, https://doi.org/10.1175/jamc-d-11-022.1, 2012. a, b, c, d, e, f
Collins Aerospace: Goodrich Icing Wind Tunnel, http://www.goodrichdeicing.com/services/icing-wind-tunnel, last access: 8 September 2021. a, b
Davison, C., Rutke, T., Strapp, J., Ratvasky, T., and Emery, E.: Naturally Aspirating Isokinetic Total Water Content Probe: Pre-flight Wind Tunnel Testing and Design Modifications, in: 4th AIAA Atmospheric and Space Environments Conference, New Orleans, Louisiana, 25–28 June 2012, American Institute of Aeronautics and Astronautics, AIAA 2012-3040, https://doi.org/10.2514/6.2012-3040, 2012. a
Deiler, C.: Flying with Ice – An Overview of DLR Research in Flight Mechanics with Icing Influence during the Last Decade, Deutsche Gesellschaft für Luft- und Raumfahrt, https://doi.org/10.25967/550008, 2021. a
EASA (European Aviation Safety Agency): Certification Specifications and Acceptable Means of Compliance for Large Aeroplanes, EASA, https://www.easa.europa.eu/downloads/134259/en, 2021. a
Emery, E., Miller, D., Plaskon, S., Strapp, W., and Lillie, L.: Ice particle impact on cloud water content instrumentation, in: 42nd AIAA Aerospace Sciences Meeting and Exhibit, Reno, Nevada, 5–8 January 2004, p. 731, 2004. a
Esposito, B. M., Bachalo, W. D., Leroy, D., Schwarzenboeck, A., Jurkat, T., Voigt, C., and Bansmer, S.: Wind Tunnel Measurements of Simulated Glaciated Cloud Conditions to Evaluate Newly Developed 2D Imaging Probes, in: SAE Technical Paper Series, SAE International, https://doi.org/10.4271/2019-01-1981, 2019. a
FAA (Federal Aviation Administration): Advisory Circular 25-28 – Compliance of Transport Category Airplanes with Certification Requirements for Flight in Icing Conditions, FAA, https://www.faa.gov/regulations_policies/advisory_circulars/index.cfm/go/document.information/documentid/1019691 (last access: 24 March 2021), 2014. a
Ferschitz, H., Wannemacher, M., Bucek, O., Knöbel, F., and Breitfuß, W.: Development of SLD Capabilities in the RTA Icing Wind Tunnel, SAE International Journal of Aerospace, 10, 12–21, https://doi.org/10.4271/2017-01-9001, 2017. a, b, c
Field, P. R., Heymsfield, A. J., and Bansemer, A.: Shattering and Particle Interarrival Times Measured by Optical Array Probes in Ice Clouds, J. Atmos. Ocean. Tech., 23, 1357–1371, https://doi.org/10.1175/jtech1922.1, 2006. a
Finstad, K. J., Lozowski, E. P., and Gates, E. M.: A Computational Investigation of Water Droplet Trajectories, J. Atmos. Ocean. Tech., 5, 160–170, https://doi.org/10.1175/1520-0426(1988)005<0160:ACIOWD>2.0.CO;2, 1988a. a, b, c
Finstad, K. J., Lozowski, E. P., and Makkonen, L.: On the Median Volume Diameter Approximation for Droplet Collision Efficiency, J. Atmos. Sci., 45, 4008–4012, https://doi.org/10.1175/1520-0469(1988)045<4008:OTMVDA>2.0.CO;2, 1988b. a
Glienke, S. and Mei, F.: Fast Cloud Droplet Probe (FCDP) Instrument Handbook, OSTI.GOV, Technical Report, DOE/SC-ARM-TR-238, https://doi.org/10.2172/1597469, 2020. a
Haller, G.: Klimatests an Schienenfahrzeugen, ETR – Eisenbahntechnische Rundschau, Heft 9/2005, 546–551, 2005. a
Heinrich, A., Ross, R., Zumwalt, G., Provorse, J., Padmanabhan, V., Thompson, J., and Riley, J.: Aircraft Icing Handbook, Vol. 1, U.S. Department of Transportation, FAA, Report No. DOT/FAA/CT-88/8-I, 386 pp., 1991. a, b
Herman, E.: Goodrich Icing Wind Tunnel Overview, Improvements and Capabilities, in: 44th AIAA Aerospace Sciences Meeting and Exhibit, Reno, Nevada, 9–12 January 2006, p. 862, 2006. a
ICE GENESIS: https://www.ice-genesis.eu/, last access: 17 November 2021. a
Ide, R. F.: Liquid Water Content and Droplet Size Calibration of the NASA Lewis Icing Research Tunnel, in: 28th Aerospace Sciences Meeting sponsored by the American Institute of Aeronautics and Astronautics, Reno, Nevada, 8–11 January 1990, Document ID: 19900004481, 1990. a
Jeck, R. K.: Icing Design Envelopes (14 CFR Parts 25 and 29, Appendix C) Converted to a Distance-Based Format, FAA, DOT/FAA/AR-00/30, 55 pp., 2002. a
Jurkat-Witschas, T., Voigt, C., Braga, R., Rosenfeld, D., and Mahnke, C.: Impact of aerosol on droplet number at cloud baseand on the altitude of freezing in convective clouds, in: SAE International Conference on Icing of Aircraft, Engines, and Structures 2019, Minneapolis, Minnesota, 17–21 June 2019, https://elib.dlr.de/134763/1/ICE19_0104-Jurkat_Witschas_et_al_2019_final.pdf (last access: 9 December 2022), 2019. a
King, W. D., Parkin, D. A., and Handsworth, R. J.: A Hot-Wire Liquid Water Device Having Fully Calculable Response Characteristics, J. Appl. Meteorol. Clim., 17, 1809–1813, https://doi.org/10.1175/1520-0450(1978)017<1809:AHWLWD>2.0.CO;2, 1978. a
King-Steen, L.-C., Lilie, L. E., and Bouley, D.: An Examination of Causes of Multi-Wire Bias During SLD Instrumentation Testing in the IRT, in: AIAA AVIATION 2021 FORUM, 2–6 August 2021, American Institute of Aeronautics and Astronautics, AIAA 2021-2653, https://doi.org/10.2514/6.2021-2653, 2021a. a
King-Steen, L.-C., Strapp, J. W., Orchard, D., Zante, J. F. V., Korolev, A., Heckman, I., and Esposito, B.: A Preliminary Study of Inter-Facility LWC Differences in Appendix C and Supercooled Large Droplet Conditions due to Calibration Instruments, in: AIAA AVIATION 2021 FORUM, 2–6 August 2021, American Institute of Aeronautics and Astronautics, AIAA 2021-2652, https://doi.org/10.2514/6.2021-2652, 2021b. a
Kirschler, S., Voigt, C., Anderson, B., Campos Braga, R., Chen, G., Corral, A. F., Crosbie, E., Dadashazar, H., Ferrare, R. A., Hahn, V., Hendricks, J., Kaufmann, S., Moore, R., Pöhlker, M. L., Robinson, C., Scarino, A. J., Schollmayer, D., Shook, M. A., Thornhill, K. L., Winstead, E., Ziemba, L. D., and Sorooshian, A.: Seasonal updraft speeds change cloud droplet number concentrations in low-level clouds over the western North Atlantic, Atmos. Chem. Phys., 22, 8299–8319, https://doi.org/10.5194/acp-22-8299-2022, 2022. a
Knop, I., Bansmer, S. E., Hahn, V., and Voigt, C.: Comparison of different droplet measurement techniques in the Braunschweig Icing Wind Tunnel, Atmos. Meas. Tech., 14, 1761–1781, https://doi.org/10.5194/amt-14-1761-2021, 2021. a, b
Korolev, A.: Reconstruction of the Sizes of Spherical Particles from Their Shadow Images. Part I: Theoretical Considerations, J. Atmos. Ocean. Tech., 24, 376–389, https://doi.org/10.1175/jtech1980.1, 2007. a
Korolev, A., Strapp, J. W., Isaac, G. A., and Emery, E.: Improved Airborne Hot-Wire Measurements of Ice Water Content in Clouds, J. Atmos. Ocean. Tech., 30, 2121–2131, https://doi.org/10.1175/jtech-d-13-00007.1, 2013. a, b, c
Korolev, A. V., Strapp, J. W., Isaac, G. A., and Nevzorov, A. N.: The Nevzorov Airborne Hot-Wire LWC–TWC Probe: Principle of Operation and Performance Characteristics, J. Atmos. Ocean. Tech., 15, 1495–1510, https://doi.org/10.1175/1520-0426(1998)015<1495:tnahwl>2.0.co;2, 1998. a, b, c, d, e, f, g, h, i, j
Korolev, A. V., Isaac, G. A., Strapp, J. W., Cober, S. G., and Barker, H. W.: In situ measurements of liquid water content profiles in midlatitude stratiform clouds, Q. J. Roy. Meteor. Soc., 133, 1693–1699, https://doi.org/10.1002/qj.147, 2007. a
Lance, S.: Coincidence Errors in a Cloud Droplet Probe (CDP) and a Cloud and Aerosol Spectrometer (CAS), and the Improved Performance of a Modified CDP, J. Atmos. Ocean. Tech., 29, 1532–1541, https://doi.org/10.1175/jtech-d-11-00208.1, 2012. a, b
Lance, S., Brock, C. A., Rogers, D., and Gordon, J. A.: Water droplet calibration of the Cloud Droplet Probe (CDP) and in-flight performance in liquid, ice and mixed-phase clouds during ARCPAC, Atmos. Meas. Tech., 3, 1683–1706, https://doi.org/10.5194/amt-3-1683-2010, 2010. a, b
Lang, B., Breitfuss, W., Schweighart, S., Breitegger, P., Pervier, H., Tramposch, A., Klug, A., Hassler, W., and Bergmann, A.: Photoacoustic hygrometer for icing wind tunnel water content measurement: design, analysis, and intercomparison, Atmos. Meas. Tech., 14, 2477–2500, https://doi.org/10.5194/amt-14-2477-2021, 2021. a
Langmuir, I. and Blodgett, K.: A mathematical investigation of water droplet trajectories, Office of the Publication Board, Dept. of Commerce, 1946. a, b, c
Lawson, R. P., O'Connor, D., Zmarzly, P., Weaver, K., Baker, B., Mo, Q., and Jonsson, H.: The 2D-S (Stereo) Probe: Design and Preliminary Tests of a New Airborne, High-Speed, High-Resolution Particle Imaging Probe, J. Atmos. Ocean. Tech., 23, 1462–1477, https://doi.org/10.1175/jtech1927.1, 2006. a
Lozowski, E. P., Stallabrass, J. R., and Hearty, P. F.: The Icing of an Unheated, Nonrotating Cylinder. Part I: A Simulation Model, J. Appl. Meteorol. Clim., 22, 2053–2062, https://doi.org/10.1175/1520-0450(1983)022<2053:TIOAUN>2.0.CO;2, 1983. a
Lucke, J., Jurkat-Witschas, T., Heller, R., Hahn, V., Hamman, M., Breitfuss, W., Bora, V. R., Moser, M., and Voigt, C.: Icing Wind Tunnel Measurements of Supercooled Large Droplets Using the 12 mm Total Water Content Cone of the Nevzorov Probe: Measurement Data, Version 1.0.0, Zenodo [data set], https://doi.org/10.5281/zenodo.6817112, 2022. a
Makkonen, L.: Modeling of Ice Accretion on Wires, J. Appl. Meteorol. Clim., 23, 929–939, https://doi.org/10.1175/1520-0450(1984)023<0929:MOIAOW>2.0.CO;2, 1984. a
Marwitz, J., Politovich, M., Bernstein, B., Ralph, F., Neiman, P., Ashenden, R., and Bresch, J.: Meteorological Conditions Associated with the ATR72 Aircraft Accident near Roselawn, Indiana, on 31 October 1994, B. Am. Meteorol. Soc., 78, 41–52, https://doi.org/10.1175/1520-0477(1997)078<0041:MCAWTA>2.0.CO;2, 1997. a
McComber, P. and Touzot, G.: Calculation of the Impingement of Cloud Droplets in a Cylinder by the Finite-Element Method, J. Atmos. Sci., 38, 1027–1036, https://doi.org/10.1175/1520-0469(1981)038<1027:COTIOC>2.0.CO;2, 1981. a
National Transportation Safety Board (NTSB): In-Flight Icing Encounter and Loss of Control Simmons Airlines, d.b.a. American Eagle Flight 4184 Avions de Transport Regional (ATR) Model 72-212, N401AM Roselawn, Indiana October 31, 1994, NTSB, USA, Report No. NTSB/AAR-96/01, 340 pp., 1996. a
Office of the Federal Register (OFR): 14 CFR, Appendix O to Part 25 – Supercooled Large Drop Icing Conditions, National Archives and Records Administration (NARA), https://www.govinfo.gov/app/details/CFR-2016-title14-vol1/CFR-2016-title14-vol1-part25-appO (last access: 9 December 2022), 2016. a
Oleskiw, M., Hyde, F., and Penna, P.: In-flight icing simulation capabilities of NRC's altitude icing wind tunnel, in: 39th AIAA Aerospace Sciences Meeting and Exhibit, Reno, Nevada, 8–11 January 2001, AIAA 2001-0094, p. 94, https://doi.org/10.2514/6.2001-94, 2001. a
Orchard, D. M., Szilder, K., and Davison, C. R.: Design of an Icing Wind Tunnel Contraction for Supercooled Large Drop Conditions, in: 2018 Atmospheric and Space Environments Conference, Atlanta, Georgia, 25–29 June 2018, American Institute of Aeronautics and Astronautics, AIAA 2018-3185, https://doi.org/10.2514/6.2018-3185, 2018. a, b, c
Orchard, D. M., Clark, C., and Chevrette, G.: Measurement of Liquid Water Content for Supercooled Large Drop Conditions in the NRC’s Altitude Icing Wind Tunnel, Technical Paper, SAE International, https://doi.org/10.4271/2019-01-2007, 2019. a, b, c
Rail Tec Arsenal: Climatic Wind Tunnel Vienna, https://www.rta.eu/anlage/kundenbereich/icing-wind-tunnel-iwt, last access: 28 November 2022. a
Ratvasky, T. P., Strapp, J. W., and Lilie, L. E.: Isokinetic Probe Total Water Content Measurements in the NASA Icing Research Tunnel with Supercooled Large Drop Conditions, in: AIAA AVIATION 2021 FORUM, 2–6 August 2021, American Institute of Aeronautics and Astronautics, AIAA 2021-2649, https://doi.org/10.2514/6.2021-2649, 2021. a
Rosenberg, P. D., Dean, A. R., Williams, P. I., Dorsey, J. R., Minikin, A., Pickering, M. A., and Petzold, A.: Particle sizing calibration with refractive index correction for light scattering optical particle counters and impacts upon PCASP and CDP data collected during the Fennec campaign, Atmos. Meas. Tech., 5, 1147–1163, https://doi.org/10.5194/amt-5-1147-2012, 2012. a
Schwarz, C., Ohme, P., and Deiler, C.: The SENS4ICE EU project – SENSors and certifiable hybrid architectures for safer aviation in ICing Environment, in: SAE International Conference on Icing of Aircraft, Engines, and Structures 2019, Minneapolis, Minnesota, 17–21 June 2019, https://elib.dlr.de/128096/ (last access: 9 December 2022), 2019. a
Schwarz, C. W.: The SENS4ICE EU project – SENSors and certifiable hybrid architectures for safer aviation in ICing Environment – A project midterm overview, in: 6th International Conference Prospects of Civil Avionics Development, Moscow, Russia, 22 July 2021, https://elib.dlr.de/144361/ (last access: 9 December 2022), 2021. a
Schwarzenboeck, A., Mioche, G., Armetta, A., Herber, A., and Gayet, J.-F.: Response of the Nevzorov hot wire probe in clouds dominated by droplet conditions in the drizzle size range, Atmos. Meas. Tech., 2, 779–788, https://doi.org/10.5194/amt-2-779-2009, 2009. a, b
Science Engineering Associates: WCM-2000, Tech. rep., 77 pp., 2016. a
SENS4ICE: https://www.sens4ice-project.eu/, last access: 13 September 2021. a
SkyPhysTech Inc.: Operating Manual – Nevzorov Hotwire LWC/TWC Probe, CWCM-U4.1, 47 pp., 2020. a
Sokolov, P. and Virk, M. S.: Droplet distribution spectrum effects on dry ice growth on cylinders, Cold Reg. Sci. Technol., 160, 80–88, https://doi.org/10.1016/j.coldregions.2019.01.002, 2019. a
Stallabrass, J.: An Appraisal of the Single Rotating Cylinder Method of Liquid Water Content Measurement, National Research Council Canada, Tech. rep., 36 pp., OCLC number: 70459774, 1978. a, b, c
Steen, L.-C. E., Ide, R. F., and Van Zante, J. F.: An Assessment of the Icing Blade and the SEA Multi-Element Sensor for Liquid Water Content Calibration of the NASA GRC Icing Research Tunnel, in: 8th AIAA Atmospheric and Space Environments Conference, Washington, D.C., 13–17 June 2016, American Institute of Aeronautics and Astronautics, AIAA 2016-4051, https://doi.org/10.2514/6.2016-4051, 2016. a, b, c
Strapp, J. W., Oldenburg, J., Ide, R., Lilie, L., Bacic, S., Vukovic, Z., Oleskiw, M., Miller, D., Emery, E., and Leone, G.: Wind Tunnel Measurements of the Response of Hot-Wire Liquid Water Content Instruments to Large Droplets, J. Atmos. Ocean. Tech., 20, 791–806, https://doi.org/10.1175/1520-0426(2003)020<0791:WTMOTR>2.0.CO;2, 2003. a, b, c, d, e, f, g
Strapp, J. W., Lilie, L. E., Ratvasky, T. P., Davison, C. R., and Dumont, C.: Isokinetic TWC evaporator probe: Development of the IKP2 and performance testing for the HAIC-HIWC Darwin 2014 and Cayenne Field Campaigns, in: 8th AIAA Atmospheric and Space Environments Conference, Washington, D.C., 13–17 June 2016, American Institute of Aeronautics and Astronautics, AIAA 2016-4059, https://doi.org/10.2514/6.2016-4059, 2016. a
Van Zante, J. F., Strapp, J. W., Esposito, B., Orchard, D., Korolev, A., Ratvasky, T. P., and Riley, J. T.: SLD Instrumentation in Icing Wind Tunnels – Investigation Overview, in: AIAA AVIATION 2021 FORUM, 2–6 August 2021, American Institute of Aeronautics and Astronautics, AIAA 2021-2647, https://doi.org/10.2514/6.2021-2647, 2021. a
Voigt, C., Schumann, U., Minikin, A., Abdelmonem, A., Afchine, A., Borrmann, S., Boettcher, M., Buchholz, B., Bugliaro, L., Costa, A., Curtius, J., Dollner, M., Dörnbrack, A., Dreiling, V., Ebert, V., Ehrlich, A., Fix, A., Forster, L., Frank, F., Fütterer, D., Giez, A., Graf, K., Grooß, J.-U., Groß, S., Heimerl, K., Heinold, B., Hüneke, T., Järvinen, E., Jurkat, T., Kaufmann, S., Kenntner, M., Klingebiel, M., Klimach, T., Kohl, R., Krämer, M., Krisna, T. C., Luebke, A., Mayer, B., Mertes, S., Molleker, S., Petzold, A., Pfeilsticker, K., Port, M., Rapp, M., Reutter, P., Rolf, C., Rose, D., Sauer, D., Schäfler, A., Schlage, R., Schnaiter, M., Schneider, J., Spelten, N., Spichtinger, P., Stock, P., Walser, A., Weigel, R., Weinzierl, B., Wendisch, M., Werner, F., Wernli, H., Wirth, M., Zahn, A., Ziereis, H., and Zöger, M.: ML-CIRRUS: The Airborne Experiment on Natural Cirrus and Contrail Cirrus with the High-Altitude Long-Range Research Aircraft HALO, B. Am. Meteorol. Soc., 98, 271–288, https://doi.org/10.1175/BAMS-D-15-00213.1, 2017. a
Voigt, C., Lelieveld, J., Schlager, H., Schneider, J., Curtius, J., Meerkötter, R., Sauer, D., Bugliaro, L., Bohn, B., Crowley, J. N., Erbertseder, T., Groß, S., Hahn, V., Li, Q., Mertens, M., Pöhlker, M. L., Pozzer, A., Schumann, U., Tomsche, L., Williams, J., Zahn, A., Andreae, M., Borrmann, S., Bräuer, T., Dörich, R., Dörnbrack, A., Edtbauer, A., Ernle, L., Fischer, H., Giez, A., Granzin, M., Grewe, V., Harder, H., Heinritzi, M., Holanda, B. A., Jöckel, P., Kaiser, K., Krüger, O. O., Lucke, J., Marsing, A., Martin, A., Matthes, S., Pöhlker, C., Pöschl, U., Reifenberg, S., Ringsdorf, A., Scheibe, M., Tadic, I., Zauner-Wieczorek, M., Henke, R., and Rapp, M.: Cleaner Skies during the COVID-19 Lockdown, B. Am. Meteorol. Soc., 103, E1796–E1827, https://doi.org/10.1175/BAMS-D-21-0012.1, 2022. a
- Abstract
- Introduction
- The SENS4ICE and ICE GENESIS research projects
- The Nevzorov probe's principle of operation
- IWT conditions and instrumentation
- Derivation of collision efficiencies
- Nevzorov probe measurements in unimodal SLD conditions
- Application of collision efficiencies in bimodal SLD conditions
- Conclusions
- Appendix A: Uncertainties of the Nevzorov probe measurements
- Appendix B: Droplet coincidence in the CDP measurements
- Data availability
- Author contributions
- Competing interests
- Disclaimer
- Acknowledgements
- Financial support
- Review statement
- References