the Creative Commons Attribution 4.0 License.
the Creative Commons Attribution 4.0 License.
 | 28 Feb 2023
First assessment of Aeolus Standard Correct Algorithm particle backscatter coefficient retrievals in the eastern Mediterranean
Anna Gialitaki
Ioannis Binietoglou
Eleni Marinou
Maria Tsichla
Nikolaos Siomos
Peristera Paschou
Anna Kampouri
Kalliopi Artemis Voudouri
Emmanouil Proestakis
Maria Mylonaki
Christina-Anna Papanikolaou
Konstantinos Michailidis
Holger Baars
Anne Grete Straume
Dimitris Balis
Alexandros Papayannis
Tomasso Parrinello
Vassilis Amiridis
Since 2018, the Aeolus satellite of the European Space Agency (ESA) has acquired wind HLOS (horizontal line-of-sight) profiles throughout the troposphere and up to the lower stratosphere, filling a critical gap in the Global Observing System (GOS). Aeolus, carrying ALADIN (Atmospheric LAser Doppler INstrument), the first UV HSRL (High Spectral Resolution Lidar) Doppler lidar ever placed in space, provides also vertically resolved optical properties of particulates (aerosols and clouds). The present study focuses on the assessment of Aeolus L2A particulate backscatter coefficient (baseline 2A11), retrieved by the Standard Correct Algorithm (SCA), in the eastern Mediterranean, a region hosting a variety of aerosol species. Ground-based retrievals acquired by lidar instruments operating in Athens (central Greece), Thessaloniki (northern Greece) and Antikythera (southwestern Greece) serve as reference. All lidar stations provide routine measurements to the PANACEA (PANhellenic infrastructure for Atmospheric Composition and climatE chAnge) network. A set of ancillary data, including sun-photometric observations (AERONET), reanalysis products (CAMS and MERRA-2), satellite observations (MSG-SEVIRI and MODIS Aqua) and backward-trajectories modelling (FLEXPART), is utilized towards an optimum characterization of the probed atmospheric conditions under the absence of a classification scheme in Aeolus SCA profiles. First, emphasis is given on the assessment of Aeolus SCA backscatter coefficient under specific aerosol scenarios over Antikythera island. Due to the misdetection of the cross-polar component of the backscattered lidar signal, Aeolus underestimates the aerosol backscatter coefficient by up to 33 % when non-spherical mineral particles are recorded (10 July 2019). A good performance is revealed on 3 July 2019, when horizontally homogeneous loads of fine spherical particles are confined below 4 km. For other two cases (8 July 2020 and 5 August 2020), due to noise issues, the SCA performance degrades in terms of depicting the stratification of aerosol layers composed of particles of different origin. According to the statistical assessment analysis of 43 identified cases, a poor-to-moderate performance is revealed for the unfiltered (aerosols plus clouds) SCA profiles, which improves substantially when cloud-contaminated profiles are excluded from the collocated sample. This improvement is evident at both Aeolus vertical scales (regular scales have 24 bins and mid-bin scales have 23 bins), and it is justified by the drastic reduction in the bias (from 0.45 to 0.27 Mm−1 sr−1 for SCA and from 0.69 to 0.37 Mm−1 sr−1 for SCA mid-bin) and root mean square error (from 2.00 to 1.65 Mm−1 sr−1 for SCA and from 1.88 to 1.00 Mm−1 sr−1 for SCA mid-bin) scores. In the vertical, the SCA performance degrades at the lowermost bins due to either the contamination from surface signals or the increased noise levels for the aerosol retrievals. Among the three PANACEA stations, the best agreement is found at the remote site of Antikythera with respect to the urban sites of Athens and Thessaloniki. Finally, all key Cal/Val (calibration and validation) aspects necessary for future relevant studies, the recommendations for a possible Aeolus follow-on mission and an overview of the ongoing related activities are thoroughly discussed.
- Article
(11894 KB) - Full-text XML
-
Supplement
(3769 KB) - BibTeX
- EndNote


Atmospheric aerosols constitute a critical component of the Earth system by acting as a major climatic driver (Charlson et al., 1992; Boucher et al., 2013; Li et al., 2022), whereas, upon deposition, they can affect terrestrial (Okin et al., 2004) and marine ecosystems (Jickells et al., 2005; Li et al., 2018). It is also well documented that they affect several anthropogenic activities with concomitant economic impacts (Middleton et al., 2018; Kosmopoulos et al., 2018). In addition, aerosol accumulation at large concentrations cause an air quality degradation (Kanakidou et al., 2011), with adverse health effects (Pöschl, 2005; Lelieveld et al., 2015) that increase the mortality rates (Health Effects Institute, 2019; Pye et al., 2021). Therefore, their multifaceted role in multidisciplinary research fields highlights the growing scientific concern in terms of understanding and describing the emission, removal, and transport mechanisms governing the life cycle of airborne particles. Due to their pronounced heterogeneity, aerosol burden exhibits a remarkable spatiotemporal variability, thus imposing deficiencies in adequately depicting its features and constraints towards a robust assessment of the induced impacts.
Passive satellite sensors, providing columnar retrievals of aerosol optical depth (AOD), have been able to adequately reproduce aerosol loads across various spatiotemporal scales. This has been justified via the assessment of AOD versus the corresponding sun-photometric measurements (e.g. Wei et al., 2019). Nevertheless, the main drawback arises from the inability of the sensors to provide information in the vertical. Therefore, this deficiency hampers a reliable quantification of the load of the suspended particles within the planetary boundary layer (PBL), which is related to health impacts. Moreover, it is not feasible to depict the three-dimensional structure of transported loads in the free troposphere, which is linked to aerosol–cloud–radiation interactions and the associated impacts on atmospheric dynamics (Pérez et al., 2006; Gkikas et al., 2018; Haywood et al., 2021). Likewise, passive aerosol observations are not suitable for monitoring stratospheric long-lived plumes that affect aerosol–chemistry interactions and perturb the radiation fields (Solomon et al., 2022). On the contrary, ground-based lidars, relying on active remote sensing techniques, obtain vertical profiles of aerosol optical properties at a high vertical and temporal resolution through multiwavelength and polarization measurements. Such observations are performed either at networks distributed across Europe (EARLINET, see Papalardo et al., 2014; PollyNET, see Baars et al., 2016; Engelmann et al., 2016), the United States (MPLNET, see Campbell et al., 2002), Asia (AD-NET, see Sugimoto et al., 2014) and South America (LALINET, see Antuña-Marrero et al., 2016) or at dedicated experimental campaigns (Ansmann et al., 2011; Weinzierl et al., 2016) or even at open seas (Bohlmann et al., 2018). The reproduction of the vertical structure of aerosols at global (Liu et al., 2008) and regional (Marinou et al., 2017; Proestakis et al., 2018) scales has been realized through the utilization of measurements acquired by the Cloud-Aerosol Lidar with Orthogonal Polarization (CALIOP; Winker et al., 2009) and the Cloud-Aerosol Transport System (CATS; McGill et al., 2015; Lee et al., 2019) mounted on the CALIPSO (Cloud-Aerosol Lidar and Infrared Pathfinder Satellite Observations) satellite and the International Space Station (ISS), respectively.
On 22 August 2018, the European Space Agency (ESA) launched its Earth Explorer wind mission, Aeolus, which was a major step forward for Earth Observations (EO) and atmospheric sciences. The Aeolus satellite carries ALADIN (Atmospheric LAser Doppler INstrument), the first space-based High Spectral Resolution Lidar (HSRL) Doppler wind lidar worldwide. ALADIN emits a linear polarized beam, which, after going through a quarter-wave plate, is transmitted with a circular polarization (at 355 nm) and receives the co-polarized backscatter from molecules and particles or hydrometeors in two separate channels (Ansmann et al., 2007; Flamant et al., 2008). The main mission product is profiles of the horizontally projected line-of-sight winds, and spin-off products are the backscatter and extinction coefficient profiles from particles and hydrometeors. The key scientific objective of Aeolus is to improve numerical weather forecasts and our understanding of atmospheric dynamics and their impacts on climate (Stoffelen et al., 2005; Isaksen and Rennie, 2019; Rennie and Isaksen, 2019). After about 1.5 years of instrument and algorithm improvements, the Aeolus L2B wind product was of such good quality (e.g. Witschas et al., 2020; Lux et al., 2020; Martin et al., 2021) that the European Centre for Medium-Range Forecasts (ECMWF) could start operational assimilation (January 2020). In May 2020, three further European weather forecast institutes (DWD, Météo-France and the UK Met Office) started the operational assimilation of Aeolus winds. All meteorological institutes reported that Aeolus winds had a significant positive impact on the short- and medium-term forecasts. The most beneficial impact is found in remote areas (tropics, Southern Hemisphere and polar regions) that are less covered by other direct wind observations (e.g. ECMWF, 2020; Rennie et al., 2021).
A series of errors induced by the instrument, by the retrieval algorithm or by the type of scatterers probed by ALADIN can affect the product quality. It is therefore necessary to perform extensive calibration and validation (Cal/Val) studies utilizing independent reference measurements (e.g. ground based and aircraft). This task has been performed by the Aeolus Cal/Val community, responding to the Aeolus Announcement of Opportunity, with the calibration and validation of the product. Such critical tasks are prerequisites for the acceptance of the mission as being fit for purpose, as outlined in the Aeolus CAL/VAL Implementation Plan. In contrast to Aeolus wind retrievals, a limited number of studies are focused on the quality of the L2A Standard Correct Algorithm (SCA) optical properties. Abril-Gago et al. (2022) performed a statistical validation versus ground-based observations from three Iberian ACTRIS/EARLINET (Aerosol, Clouds and Trace Gases Research Infrastructure/European Aerosol Research Lidar NETwork) lidar stations affected mainly by dust and continental/anthropogenic aerosols. In their Cal/Val study, they processed AERONET (AErosol RObotic NETwork) optical properties related to the particle size and nature, along with HYSPLIT (Hybrid Single-Particle Lagrangian Integrated Trajectory) air mass back-trajectories towards characterizing the prevailing aerosol conditions. Baars et al. (2021) reported an excellent agreement between SCA and PollyXT particle backscatter profiles and the adequate agreement of extinction and lidar ratio profiles, between 4 and 12 km, for a case of long-range transport of wildfire smoke particles from California (USA) to Leipzig (Germany).
Here we focus on the comparison of Aeolus SCA particle backscatter coefficient profiles against ground-based profile observations acquired at three lidar stations (Antikythera, Athens and Thessaloniki) contributing to the Greek National Research Infrastructure (RI) PANACEA (PANhellenic infrastructure for Atmospheric Composition and climatE chAnge), an ACTRIS component (https://www.actris.eu/, last access: 20 February 2023). All stations are located in the eastern Mediterranean, which is a crossroad of air masses (Lelieveld et al., 2002) carrying particles of different natures. The broader Greek area encompasses a variety of aerosol species consisting of (i) pollutants from industrialized European regions (Gerasopoulos et al., 2003, 2011), (ii) dust aerosols from nearby deserts (Balis et al., 2004; Papayannis et al., 2005; Gkikas et al., 2016; Marinou et al., 2017), (iii) anthropogenic aerosols from urban areas and megacities (Kanakidou et al., 2011), (iv) biomass burning particles originating in eastern Europe and the Black Sea (Amiridis et al., 2009, 2010, 2012), (v) smoke aerosols subjected to transport at the planetary scale (Baars et al., 2019; Gialitaki et al., 2020), (vi) sea salt particles produced by bursting bubbles during whitecap formation attributed to wind–wave interactions (e.g. Varlas et al., 2021), (vii) biogenic particles, such as airborne fungi and pollen grains (Richardson et al., 2019), and (viii) volcanic ash mixed with sulfate aerosols ejected at high altitudes from explosive Etna eruptions (Zerefos et al., 2006; Kampouri et al., 2021).
The paper is structured as follows. In Sect. 2, a brief overview of the Aeolus satellite and the ALADIN instrument is given. The key elements of the SCA are summarized in Sect. 3. The technical information of the ground-based lidars and the description of aerosols' regime in the surrounding area of the PANACEA stations are presented in Sect. 4. The collocation criteria between ground-based and spaceborne profiles are described in Sect. 5. The assessment of the Aeolus SCA product under various aerosol scenarios and for the whole collocated sample is discussed in Sect. 6. The Cal/Val aspects, the recommendations for future relevant studies and the necessary upgrades on ALADIN observational capabilities and Aeolus L2A data content are highlighted in Sect. 7. Finally, the main findings and the conclusions are drawn in Sect. 8.
A brief description of Aeolus orbital features and ALADIN's observational geometry and measurement configuration is given in the current section. This short introduction serves as the starting point for the reader to be familiar with Aeolus nomenclature. Further details and a more comprehensive overview of the Aeolus satellite mission can be found at ESA technical reports (ESA, 1999, 2008, 2016) and at recently published studies (e.g. Lux et al., 2020; Witschas et al., 2022; Lux et al., 2022).
The ESA's Aeolus satellite, named after the keeper of winds, according to the Greek mythology, flies in a polar sun-synchronous orbit, circling the Earth at an altitude of 320 km with a repeat cycle of 7 d (Kanitz et al., 2019; Straume et al., 2019). The orbital plane forms an angle of 97∘ with the equatorial plane, the ground track velocity is about 7.7 km s−1 and a complete circle around the Earth takes about 90 min for each orbit (Lux et al., 2020; Witschas et al., 2020; Straume et al., 2020). Aeolus is flying over the terminator between day and night (dawn/dusk orbits), with its telescope pointing to the right of the flight direction (aiming into the night hemisphere) to minimize the solar background illumination (Kanitz et al., 2019).
ALADIN, the single payload on the Aeolus satellite platform, is an HSRL (Shipley et al., 1983) equipped with an Nd:YAG laser that emits short laser pulses (∼40 to 70 mJ; Witschas et al., 2020) of a circular polarized light at ∼355 nm, with a 50.5 Hz repetition frequency. The photons that are backscattered from molecules and particulates (aerosols, cloud droplets and ice crystals) at atmospheric altitudes lower than 30 km are collected by a Cassegrain telescope with 1.5 m diameter. The collected photons are directed to the Mie optical channel (Fizeau interferometer) for the analysis of the Doppler shift induced by particulates, while the molecular return signals (Rayleigh) are analysed in two sequentially coupled Fabry–Pérot interferometers (Witschas et al., 2020).
ALADIN provides wind and particulate vertically resolved retrievals along the line-of-sight (LOS) by pointing at the Earth at a slant angle of 35∘ off-nadir (see Fig. 1 in Flament et al., 2021), which corresponds to an angle of about 37.6∘ with the Earth surface, due to its curvature. In contrast to CALIOP and CATS, ALADIN can retrieve particulate optical products without requiring an a priori assumption of the lidar ratio (S), which is characterized by a remarkable variability among aerosol types due to its dependency on the particle shape, composition and size distribution (Müller et al., 2007). However, ALADIN only measures the co-polar part of the atmospheric backscatter and at a single wavelength. Therefore, the discrimination between aerosols and clouds and their respective subtypes is challenging.
The instrument detector design allows the sampling of the atmospheric backscatter in 24 vertical bins, with a varying resolution from 0.25 (near-surface) to 2 km (upper atmosphere). The laser pulses are integrated on board the satellite, along the flight direction, to yield measurements of ∼3 km resolution (integration of ∼20 laser pulses). During the on-ground data processing, the measurements are accumulated further to yield an “observation” (also called a basic repeat cycle, BRC), which corresponds to a distance of ∼90 km. The SCA optical properties are part of the L2A product which will be described in the next section and are derived by the so-called SCA (Flament et al., 2021). They are provided at the observation scale (on a horizontal resolution of ∼90 km) and are available through the Aeolus Online Dissemination System (https://aeolus-ds.eo.esa.int, last access: 20 February 2023).
In the current Cal/Val study, we are assessing the performance of the Aeolus L2A particulate products derived by the SCA. Here, we are providing a short overview of the SCA, whereas its complete description is available in the Algorithm Theoretical Baseline Document (ATBD; Flamant et al., 2021). The SCA product is derived from the measured signals in the Mie and Rayleigh channels, which are dependent on the instrument calibration constants (Kray and Kmie), the channel cross-talk coefficients C1, C2, C3 and C4, the laser pulse energy (E0) and the contributions from the pure molecular (X) and particulate (Y) signals (see Eqs. 1 and 2 in Flament et al., 2021). The latter signals, at each bin, result from the vertical integration of the backscatter (either molecular or particulate), where the squared one-way transmission through the atmosphere is taken into account (see Eqs. 3 and 4 in Flament et al., 2021).
The separation of the molecular and particle signals on each channel is imperfect, due to the HSRL instrument design, which makes a cross-talk correction necessary. The channel cross-talk corresponding to the transmission of the Rayleigh–Brillouin spectrum (depending on the temperature, pressure and the Doppler shift) through the Rayleigh and Mie channels is expressed by the calibration coefficients C1 and C4, respectively (Flament et al., 2021). The other two coefficients, C2 and C3, refer to the transmission of a Mie spectrum (depending on the Doppler shift) through the Mie and Rayleigh channels, respectively. Along with the cross-talk coefficients, the instrument calibration constants (Kray and Kmie; see Flament et al., 2021) are included in the AUX_CAL files.
Finally, the cross-talk-corrected signals, normalized with the range bin thickness and corrected by the range between the satellite and the observed target, are utilized for the retrieval of the vertically resolved backscatter (β) and extinction (α) coefficients. The former, at each bin, is derived by the ratio multiplied with the molecular backscatter coefficient (see Eqs. 9 and 10 in Flament et al., 2021) computed from the simulated ECMWF pressure and temperature fields (Collis and Russel, 1976). For the SCA extinction retrievals, derived via an iterative process from top to bottom, the normalized integrated two-way transmission (NITWT) is applied, using measured and simulated pure molecular signals, under the assumption that the particle extinction at the topmost bin is zero (see Eqs. 11–14 in Flament et al., 2021). This consideration makes the downwards solution of the integral equations quite sensitive to the noise within the topmost bin (at altitudes ∼ 20–25 km), which is used as reference for the normalization, particularly under low signal-to-noise ratio (SNR) conditions due to the low molecular density. This is a challenge frequently faced by the SCA observations, due to the weaker measured signals than those of the pre-launch expectations (Reitebuch et al., 2020) and due to the possible presence of stratospheric aerosols within the topmost range bin or above. In principle, the extinction is retrieved recursively taking into account the attenuation from the overlying bins and by contrasting observed and simulated molecular signals. By differentiating two consecutive bins, unrealistically high positive or negative extinctions can be retrieved (see Fig. 10 in Flament et al., 2021) resulting from fluctuations between strong and weak attenuation.
In the case of negative extinction values, the SCA algorithm regularizes the solution by resetting it to zero (Flament et al., 2021), which can lead to an underestimation of the partial column transmission. In order to compensate for the impacts of the aforementioned issues, it has been shown by error propagation calculations (see Eqs. 18 and 19 in Flament et al., 2021) that, when averaging two consecutive bins, the retrieved extinction becomes more reliable at the expense of the vertical resolution (23 bins; mid-bin vertical scale). In contrast to SCA, in the SCA mid-bin, negative extinction values can be found since the zero-flooring constraint is not implemented. For consistency reasons, the averaging between two neighbouring bins is also applied in the backscatter coefficient, thus allowing the derivation of the lidar ratio.
The inherent weaknesses of the SCA algorithm have been mitigated in the Maximum Likelihood Estimation (MLE) algorithm (Ehlers et al., 2022). Its main principle relies on the exploitation of all available information and the definition of constraints on the positivity of the retrieved optical properties and on the expected range of the lidar ratio. Under these restrictions, the particle extinction is derived when the particle backscatter is available, and vice versa. According to the evaluation versus ground-based observations and SCA end-to-end simulated optical products, it revealed a remarkable improvement (up to 1 order of magnitude) on the precision of the extinction and the lidar ratio due to effective noise dampening. Moreover, there is also a beneficial impact on the co-polar backscatter coefficient. Another new algorithm that outperforms SCA is the AEL (Algorithm Enunciation Language; adjusted from the EarthCARE-ATLID algorithms) that provides a feature mask (AEL-FM) at the highest available resolution and aerosol–cloud extinction and lidar ratios via a multiscale optimal estimation method (AEL-PRO). Both MLE and AEL retrievals have been released at a more recent baseline (2A14) than those used in the current study (2A11) and, for this reason, are omitted from our Cal/Val analysis.
The ground-based observational datasets used herein are taken from stations contributing to the PANhellenic infrastructure for Atmospheric Composition and climatE chAnge (PANACEA) initiative. Within PANACEA, different measurement techniques and sensors are utilized in a synergistic way to monitor the atmospheric composition and climate-change-related parameters in Greece.
The locations of the stations providing routine measurements to the PANACEA network are shown in Fig. 1-i. For the assessment analysis of Aeolus SCA optical properties, we utilize available measurements from PANACEA stations, namely Antikythera (ANT), Athens (ATH) and Thessaloniki (THE), equipped with multiwavelength polarization lidar systems. All stations comply with the quality-assurance criteria established within EARLINET (e.g. see Freudenthaler et al., 2016) so as to ensure the provision of high-quality aerosol-related products. Consequently, the derived datasets can be considered for any validation purpose. To ensure the homogeneity and the consistency of the optical property profiles derived from the adverse lidar systems operating at each station, the Single Calculus Chain algorithm (SCC; D'Amico et al., 2016; Mattis et al., 2016) was used; this is an automatic processing chain for lidar data that has been developed within EARLINET. All systems employ multiple detectors, operating either in the photon-counting or analogue mode. Herein, elastically and inelastically backscattered signals at 355 and 387 nm were used to evaluate Aeolus products. The optical property profiles were derived using the Raman and Klett–Fernald–Sassano inversion methods (Ansmann et al., 1992; Fernald, 1984; Klett, 1981; Sasano and Nakame, 1984) during nighttime and daytime measurements, respectively.
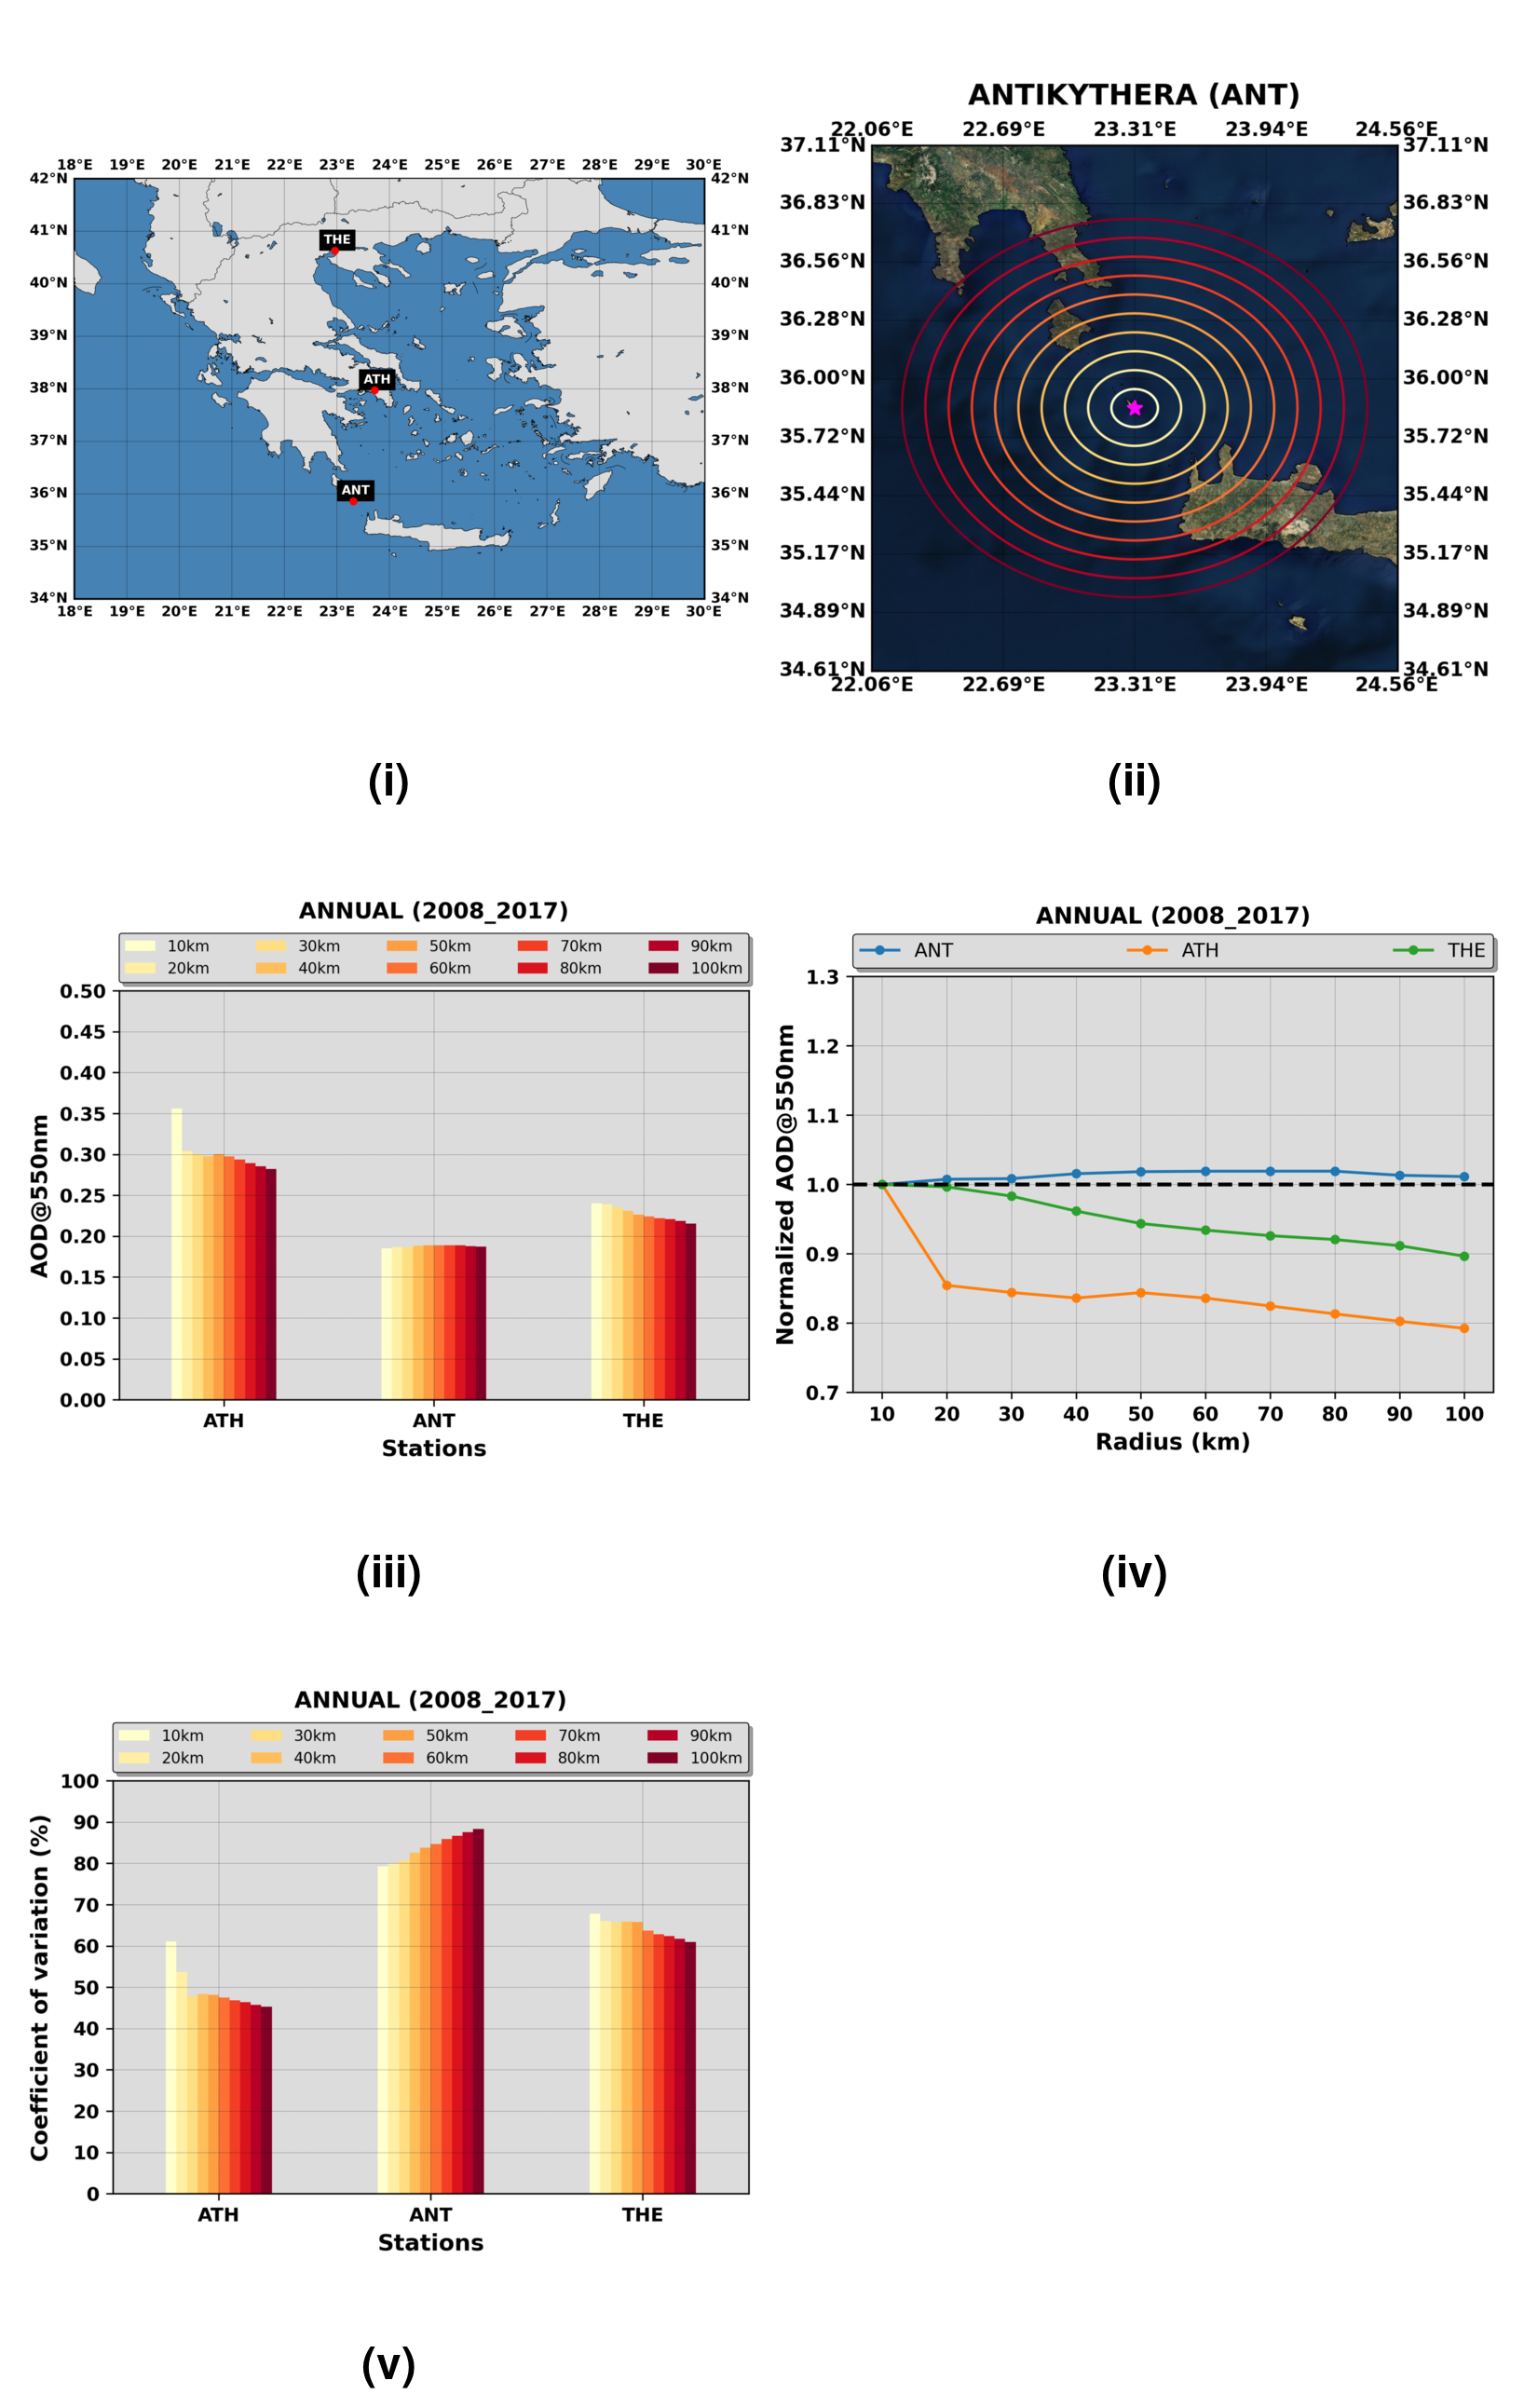
Figure 1(i) Locations of the three Greek PANACEA sites, namely Athens (ATH), Antikythera (ANT) and Thessaloniki (THE). (ii) Concentric circles, around Antikythera island, of radii from 10 to 100 km, with an incremental step of 10 km. (iii) Climatological MODIS Aqua AOD levels, representative of the period 2008–2017, for each circle area centred at each PANACEA site. (iv) Normalized climatological AODs for each circle area with respect to the corresponding levels of the inner circle. (v) Coefficient of variation (CV; expressed in percentage) of MODIS Aqua AOD, representative of the period 2008–2017, for each circle area centred at each PANACEA site.
4.1 Antikythera
Regular lidar measurements have been performed at the PANGEA observatory (PANhellenic GEophysical observatory of Antikythera; lat =35.86∘ N, long =23.31∘ E and alt =193 m a.s.l. – above sea level) contributing to this study. The lidar system deployed at PANGEA is operated by the National Observatory of Athens (NOA). It is a PollyXT system (Engelmann et al., 2016), which is a multiwavelength polarization Raman lidar for water vapour, designed for unattended, continuous operation. PollyXT deploys an Nd:YAG laser, which emits linearly polarized light at 355, 532 and 1064 nm. The radiation, elastically and inelastically backscattered from aerosol, cloud particles, nitrogen (at 387 and 607 nm) and water vapour (at 407 nm) molecules, is collected using a near-range (spherical mirror of 50 mm diameter; focal length f=250 mm and 2.2 mrad field of view, FOV) and a far-range receiver (Newtonian telescope with a 300 mm diameter primary mirror; f=900 m and FOV =1 mrad) at a raw vertical resolution of 7.5 m. The combined use of the near-range and far-range receivers allows for the retrieval of the aerosol optical properties from 500 m up to ∼ 12–14 km above the ground. A detailed description of the technical characteristics of PollyXT can be found in Engelmann et al. (2016).
4.2 Athens
The Laser Remote Sensing Unit (LRSU) of the National and Technical University of Athens, Greece (NTUA; lat =37.96∘ N, long =23.78∘ E and alt =200 m a.s.l.), has been part of EARLINET since May 2000. Currently, the Athens lidar station performs simultaneous measurements with two different lidar systems, EOLE and DEPOLE. The EOLE lidar is an advanced six-wavelength elastic backscatter and Raman lidar system able to provide the aerosol backscatter coefficient at 355, 532 and 1064 nm, the aerosol extinction coefficient at 355 and 532 nm and water vapour mixing ratio profiles in the troposphere. EOLE is based on a pulsed Nd:YAG laser system and a 300 mm diameter receiving Cassegrain telescope (f=600 mm; FOV =1.5 mrad), which collects all elastically backscattered lidar signals (355–532–1064 nm) and those generated by the vibrational Raman effect (by atmospheric N2 at 387–607 nm and by H2O at 407 nm). The full overlap (i.e. the altitude upwards of which the whole lidar beam is within the telescope FOV) of EOLE is reached at, approximately, 812 m a.s.l. EOLE has been validated within EARLINET at the hardware level by two intercomparison campaigns (Matthias et al., 2004), in order to fulfil the standardized criteria.
The DEPOLE lidar is a depolarization lidar that is able to provide profiles of the aerosol backscatter coefficient and the linear particle volume depolarization ratio at 355 nm. DEPOLE is based on a pulsed Nd:YAG laser system which emits linearly polarized light at 355 nm. The elastically backscattered lidar signals at 355 nm are collected by a 200 m diameter Dall-Kirkham/Cassegrain telescope (f=600 mm; FOV =3.13 mrad), and the full overlap is reached at, approximately, 500 m a.s.l.
4.3 Thessaloniki
Thessaloniki's multiwavelength polarization Raman lidar system (Thessaloniki Lidar System – THELISYS) belongs to the Laboratory of Atmospheric Physics of the Physics Department at the Aristotle University of Thessaloniki (lat =40.63∘ N, long =22.96∘ E and alt =50 m a.s.l.). Thessaloniki has been a member station of EARLINET since 2000, providing almost continuous measurements, according to the network schedule (every Monday morning, ideally close to 12:00 UTC, and every Monday and Thursday evening), and during extreme events (e.g. Saharan dust outbreaks, smoke transport from biomass burning and volcanic eruptions) and satellite overpasses. THELISYS has been validated within EARLINET at the hardware level by two intercomparison campaigns (Matthias et al., 2004), in order to fulfil the standardized criteria. The system is based on the first (1064 nm), second (532 nm) and third harmonic (355 nm) frequency of a compact, pulsed Nd:YAG laser emitted with a 10 Hz repetition rate. The THELISYS set up includes three elastic backscatter channels at 355, 532 and 1064 nm, two nitrogen Raman channels at 387 and 607 nm and two polarization-sensitive channels at 532 nm. The acquisition system is based on a Licel transient digitizer working in both the analogue and photon-counting (250 MHz) mode. The vertical resolution of the elastic raw signal at 355 nm is equal to 3.75 m and is recorded in both analogue and photon-counting mode. The full overlap height is almost 800 m a.s.l. A detailed description of THELISYS can be found in Siomos et al. (2018) and Voudouri et al. (2020).
4.4 Aerosol load variability in the vicinity of the PANACEA sites
The variability in the atmospheric aerosol load in the vicinity of the three PANACEA stations (Fig. 1-i) is discussed in this section. The aim of this introductory analysis is to investigate the horizontal homogeneity of the aerosol optical depth (AOD) in the respective broader areas, which plays a key role in the comparison of ground-based and spaceborne profiles, which are not spatially coincident, as will be shown in Sect. 5. For the purposes of this analysis, we have processed the mid-visible (550 nm) columnar AOD retrievals, over the period 2008–2017, as acquired by the MODIS sensor that is mounted on the Aqua polar-orbiting satellite. More specifically, we have analysed the Level-2 (L2; swaths; 5 min segments) MODIS Aqua AODs obtained by the latest version (Collection 6.1) of the operational retrieval algorithms (Remer et al., 2008; Levy et al., 2013; Sayer et al., 2013). The aforementioned data are accessible via the Level-1 and Atmosphere Archive and Distribution System (LAADS) Distributed Active Archive Centers (DAAC; https://ladsweb.modaps.eosdis.nasa.gov/, last access: 23 January 2023).
For each station, we have calculated the arithmetic mean of the AODs within progressively larger circular areas, with radii spanning from 10 to 100 km and with an incremental step of 10 km (Fig. 1-ii). Figure 1-iii illustrates the resulting AODs for each station (x-axis labels) and at each radius (coloured bars). In order to ensure the reliability of the obtained results, only the best (quality assurance =3) MODIS Aqua AOD L2 retrievals are considered, whereas the spatial averages (computed individually for each circle) are calculated only when the satellite observations are simultaneously available at all circles. In the urban areas of Athens (ATH) and Thessaloniki (THE), the contribution of anthropogenic aerosols to the columnar load fades for increasing radii. On the contrary, at Antikythera (ANT), the spatial AOD means remain almost constant, revealing a horizontal homogeneity of the aerosol load in the broader area. An alternative way to compare the differences in the AOD spatial representativeness between the urban (ATH and THE) and the remote (ANT) sites has been performed. Figure 1-iv illustrates the normalized values for each radius with respect to the AOD levels of the inner circle (i.e. up to 10 km distance from the station). In both urban sites, the values are lower than one (dashed line), decreasing steadily in THE and smoothly in ATH after an abrupt reduction from 10 to 20 km. In ANT, the blue curve resides almost on top of the dashed line throughout the radii of the circles (i.e. range of distances), indicating the absence of significant horizontal variation in the aerosol load suspended in the surrounding area.
A key aspect which has not been adequately addressed in Fig. 1-iii is the temporal variability in aerosol loads, since the spatiotemporally averaged AODs hide such information. A useful measure for this purpose is the coefficient of variation (CV), defined as the ratio of the standard deviation and the arithmetic mean of AOD (Anderson et al., 2003; Shinozuka and Redemann, 2011), which are both calculated in temporal terms. Figure 1-v displays the CV values (expressed as percentages) computed for each circle at each station. The highest levels (up to 90 %) are recorded in ANT, whereas lower values (up to 70 %) are recorded in THE and the lowest ones are found in ATH (up to 60 %). This discrepancy is mainly attributed to the higher frequency of dust outbreaks affecting the southern parts of Greece, which is in contrast to the central and northern sectors of the country (Gkikas et al., 2013, 2016). It is noted that all the PANACEA sites are also under the impact of advected loads composed by anthropogenic or biomass particles originating at distant areas. Nevertheless, their frequency of occurrence and their concentration is rarer and weaker, respectively, than those of the advected Saharan dust. Between the remote (ANT) and urban (ATH and THE) sites, there is a clear difference in the CV dependence with respect to the circle radius. In ANT, the CV values increase steadily from the inner to the outer circle, while an opposite tendency is found in THE and ATH. The increasing trend in ANT is mainly regulated by the range of the Saharan plumes transported towards southwestern Greece. On the contrary, the declining trend revealed in the two main Greek cities indicates that the temporal variability in the local sources (i.e. two first circles) is more pronounced. For completeness, we have also computed the spatial autocorrelation (Anderson et al., 2003; Shinozuka and Redemann, 2011) among the averaged AODs of each circle area. The correlation matrices for each station are presented in Fig. S1 in the Supplement. Among the three PANACEA sites, the R values in ATH (Fig. S1-i) drop rapidly with respect to the first circle (10 km radius), highlighting the strong spatial contrast of AODs between the city and the surrounding areas. For the outer domains, this transition becomes significantly smoother, and the R values are higher than 0.90 in most of the combinations, indicating a spatial coherence. In THE (Fig. S1-iii), the pattern of the R values on the correlation matrix is similar to that of ATH, but the high R values (>0.89) indicate a better spatial AOD homogeneity, according to Anderson et al. (2003). Finally, under the absence of local sources in ANT, and strong AOD spatial homogeneity in the vicinity, the computed R value between the inner (10 km radius) and the outer (100 km radius) circle is higher than 0.94 and increases at shorter distances.
The assessment of Aeolus SCA backscatter profiles has been performed against the corresponding measurements acquired at the three EARLINET/PANACEA lidar stations. In Fig. 2, three examples of the collocation between ground-based and spaceborne retrievals are illustrated in order to describe our approach and to clarify points needed in the discussion of the results evaluation (Sect. 6). At each station, we identify the observations (BRCs), considering their coordinates at the beginning of the ALADIN scan, falling within a circle of 120 km radius (dashed black circle) and centred at the station coordinates (black dot). Following this approach, there is a possibility of including BRCs for which more than half of their length fall outside of the defined circle. This might affect the evaluation outcomes because we are not considering the BRC centre in the collocation. Nevertheless, we are expecting a negligible impact on the statistical analysis, since 77 % of the BRCs would have been selected using, alternatively, the coordinates at their centre. Based on the defined spatial criterion, the number of BRCs residing within the 120 km circle should be at least one and cannot be more than three. We denote each one of them, along the ALADIN measurement track (white stripe), with different colours (red, blue and magenta) in Fig. 2. The green arrow shows the flight direction of the satellite for the dusk (ascending) or dawn (descending) orbits. For the ground-based observations, the aerosol backscatter profiles are derived considering a time window of ±1 h around the satellite overpass. Nevertheless, this temporal collocation criterion has been relaxed or shifted in a few cases to improve the quality of the ground-based retrievals (i.e. by increasing the signal-to-noise ratio) and to increase the matched pairs with Aeolus SCA profiles. Both compromises are applied, since the weather conditions favouring the development of persistent clouds may eliminate the number of simultaneous cases. It is noted, however, that when the temporal window is shifted or relaxed we are taking into account the homogeneity of the atmospheric scene (probed by the ground lidar). For the ANT station, we did not deviate from the predefined temporal criterion, apart from one case study. In THE and ATH, the time departure between Aeolus and ground-based profiles can vary from 1.5 to 2.5 h. Overall, 43 cases are analysed, out of which 15 have been identified over ANT, 12 in ATH and the remaining 16 in THE.
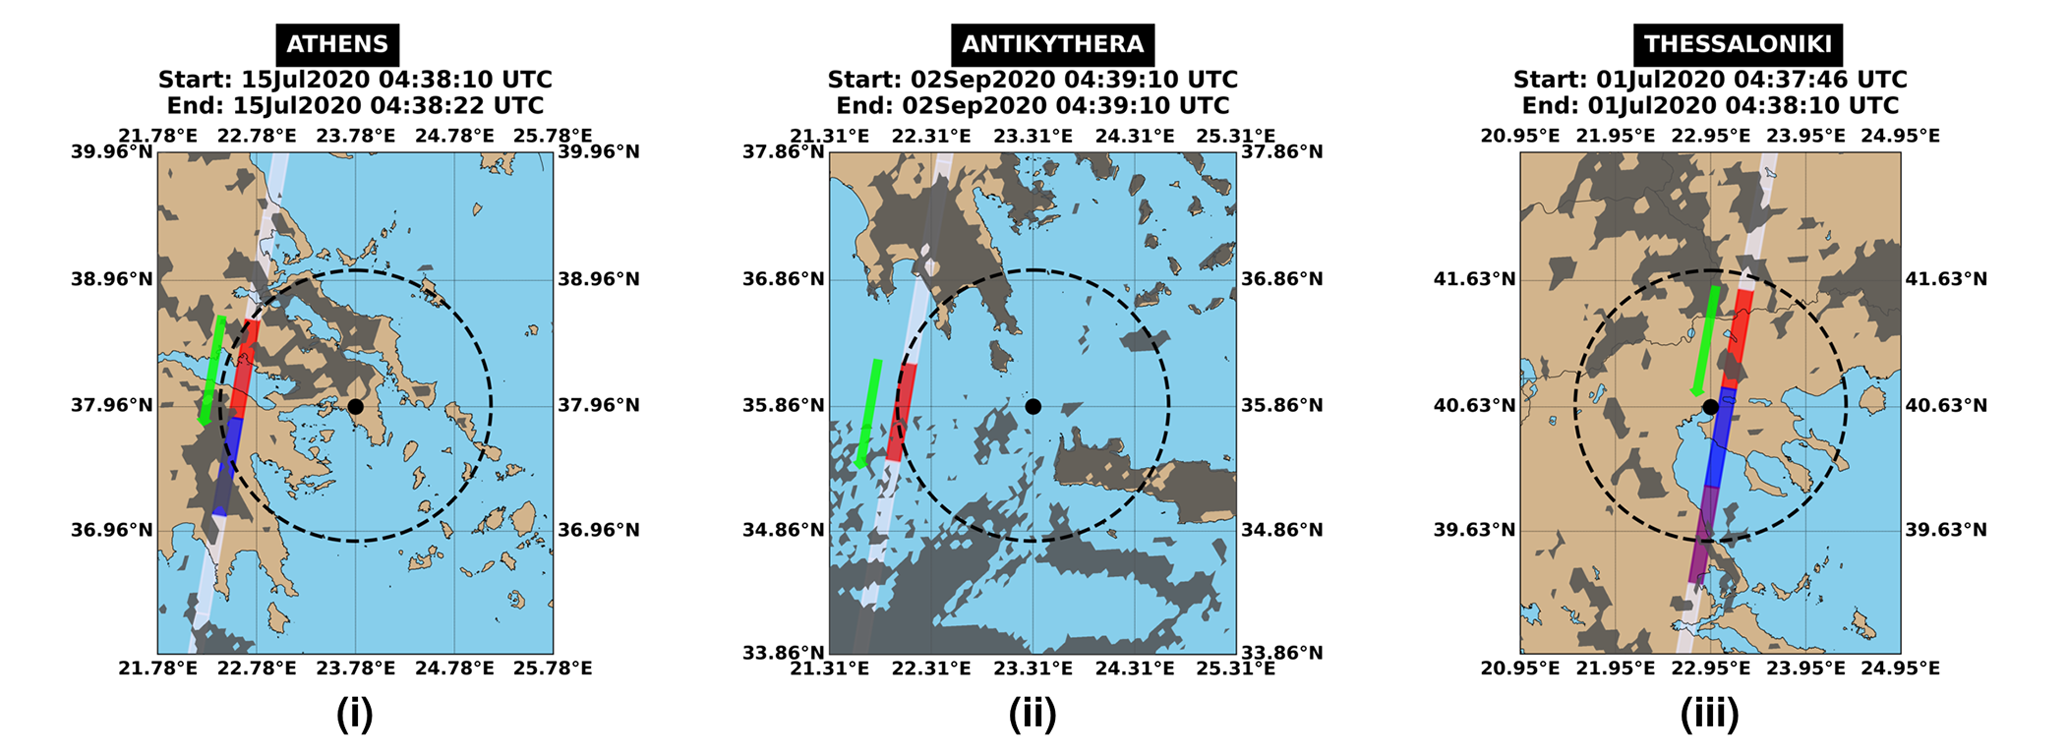
Figure 2The white stripe indicates ALADIN's measurement track, and the coloured rectangles correspond to the Aeolus observations (∼90 km along-track-averaged measurements) falling within a radius of 120 km (dashed black line) of the PANACEA stations (black dot). The green arrows show the Aeolus flight directions (descending orbits for these examples). Dark grey shaded areas show the MSG-SEVIRI cloud mask product (CLM) at the nearest time to the Aeolus overpass. The start and end times (in UTC) of the ALADIN observations are given in the title of each plot.
The ground-based profiles are derived under cloud-free conditions, which is in contrast to Aeolus SCA backscatter profiles providing aerosol and/or cloud backscatter. Therefore, a cloud screening of the SCA data using auxiliary cloud information was applied. In the framework of the present study, the exclusion of cloud-contaminated SCA profiles relies on the joint processing of the cloud mask product (CLM; https://www.eumetsat.int/media/38993, last access: 20 February 2023; cloud mask product generation) derived from radiances acquired by the SEVIRI (Spinning Enhanced Visible and Infrared Imager) instrument mounted on the Meteosat Second Generation (MSG) geostationary satellite (Schmetz et al., 2002). It should be noted, however, that the CLM product serves as an indication of cloud presence but without providing information about their macrophysical properties (i.e. cloud coverage), their phase (i.e. ice, water or mixed) or their categories (i.e. low, middle or high). According to the product user guide (https://www-cdn.eumetsat.int/files/2020-04/pdf_clm_pg.pdf, 20 February 2023; Sect. 3.4), artificial straight lines can be found because the ECMWF temperature–humidity fields are not interpolated in time and space. Moreover, due to the limited number of levels of ECMWF temperature profiles required for the atmospheric correction, the cloud detection in the lower troposphere is affected. Finally, broken clouds with limited spatial extension and thin cirrus are likely misdetected by MSG. In the illustrated examples in Fig. 2, the grey shaded areas represent the CLM spatial coverage at each PANACEA site. Based on the filtering procedures, the Aeolus SCA backscatter retrievals, throughout the probed atmosphere by ALADIN, are removed from the analysis when the grey shaded areas overlap with a BRC.
6.1 Assessment of Aeolus SCA backscatter under different aerosol scenarios
In the first part of the analysis, we assess the quality of the Aeolus SCA backscatter under various aerosol regimes aiming to (i) investigate the capabilities of the ALADIN spaceborne lidar to detect aerosol layers, (ii) investigate how the horizontal homogeneity and vertical structure of the aerosol layers can affect the level of agreement between spaceborne and ground-based retrievals and (iii) demonstrate the synergistic use of various datasets for a better characterization of the prevailing aerosol conditions. All of these aspects are necessary for a comprehensive Cal/Val study to facilitate the interpretation of our findings and to identify possible upgrades on SCA retrievals. Overall, four cases over the ANT island (southwestern Greece) are analysed for the Aeolus SCA aerosol backscatter retrievals (Baseline 2A11). The obtained results are depicted in Fig. 3. The identified cases have been selected because they are representing some of the most typical aerosol conditions in the eastern Mediterranean. Note that, for each case, we are selecting the nearest Aeolus BRC to station coordinates that fall entirely within the circle area.
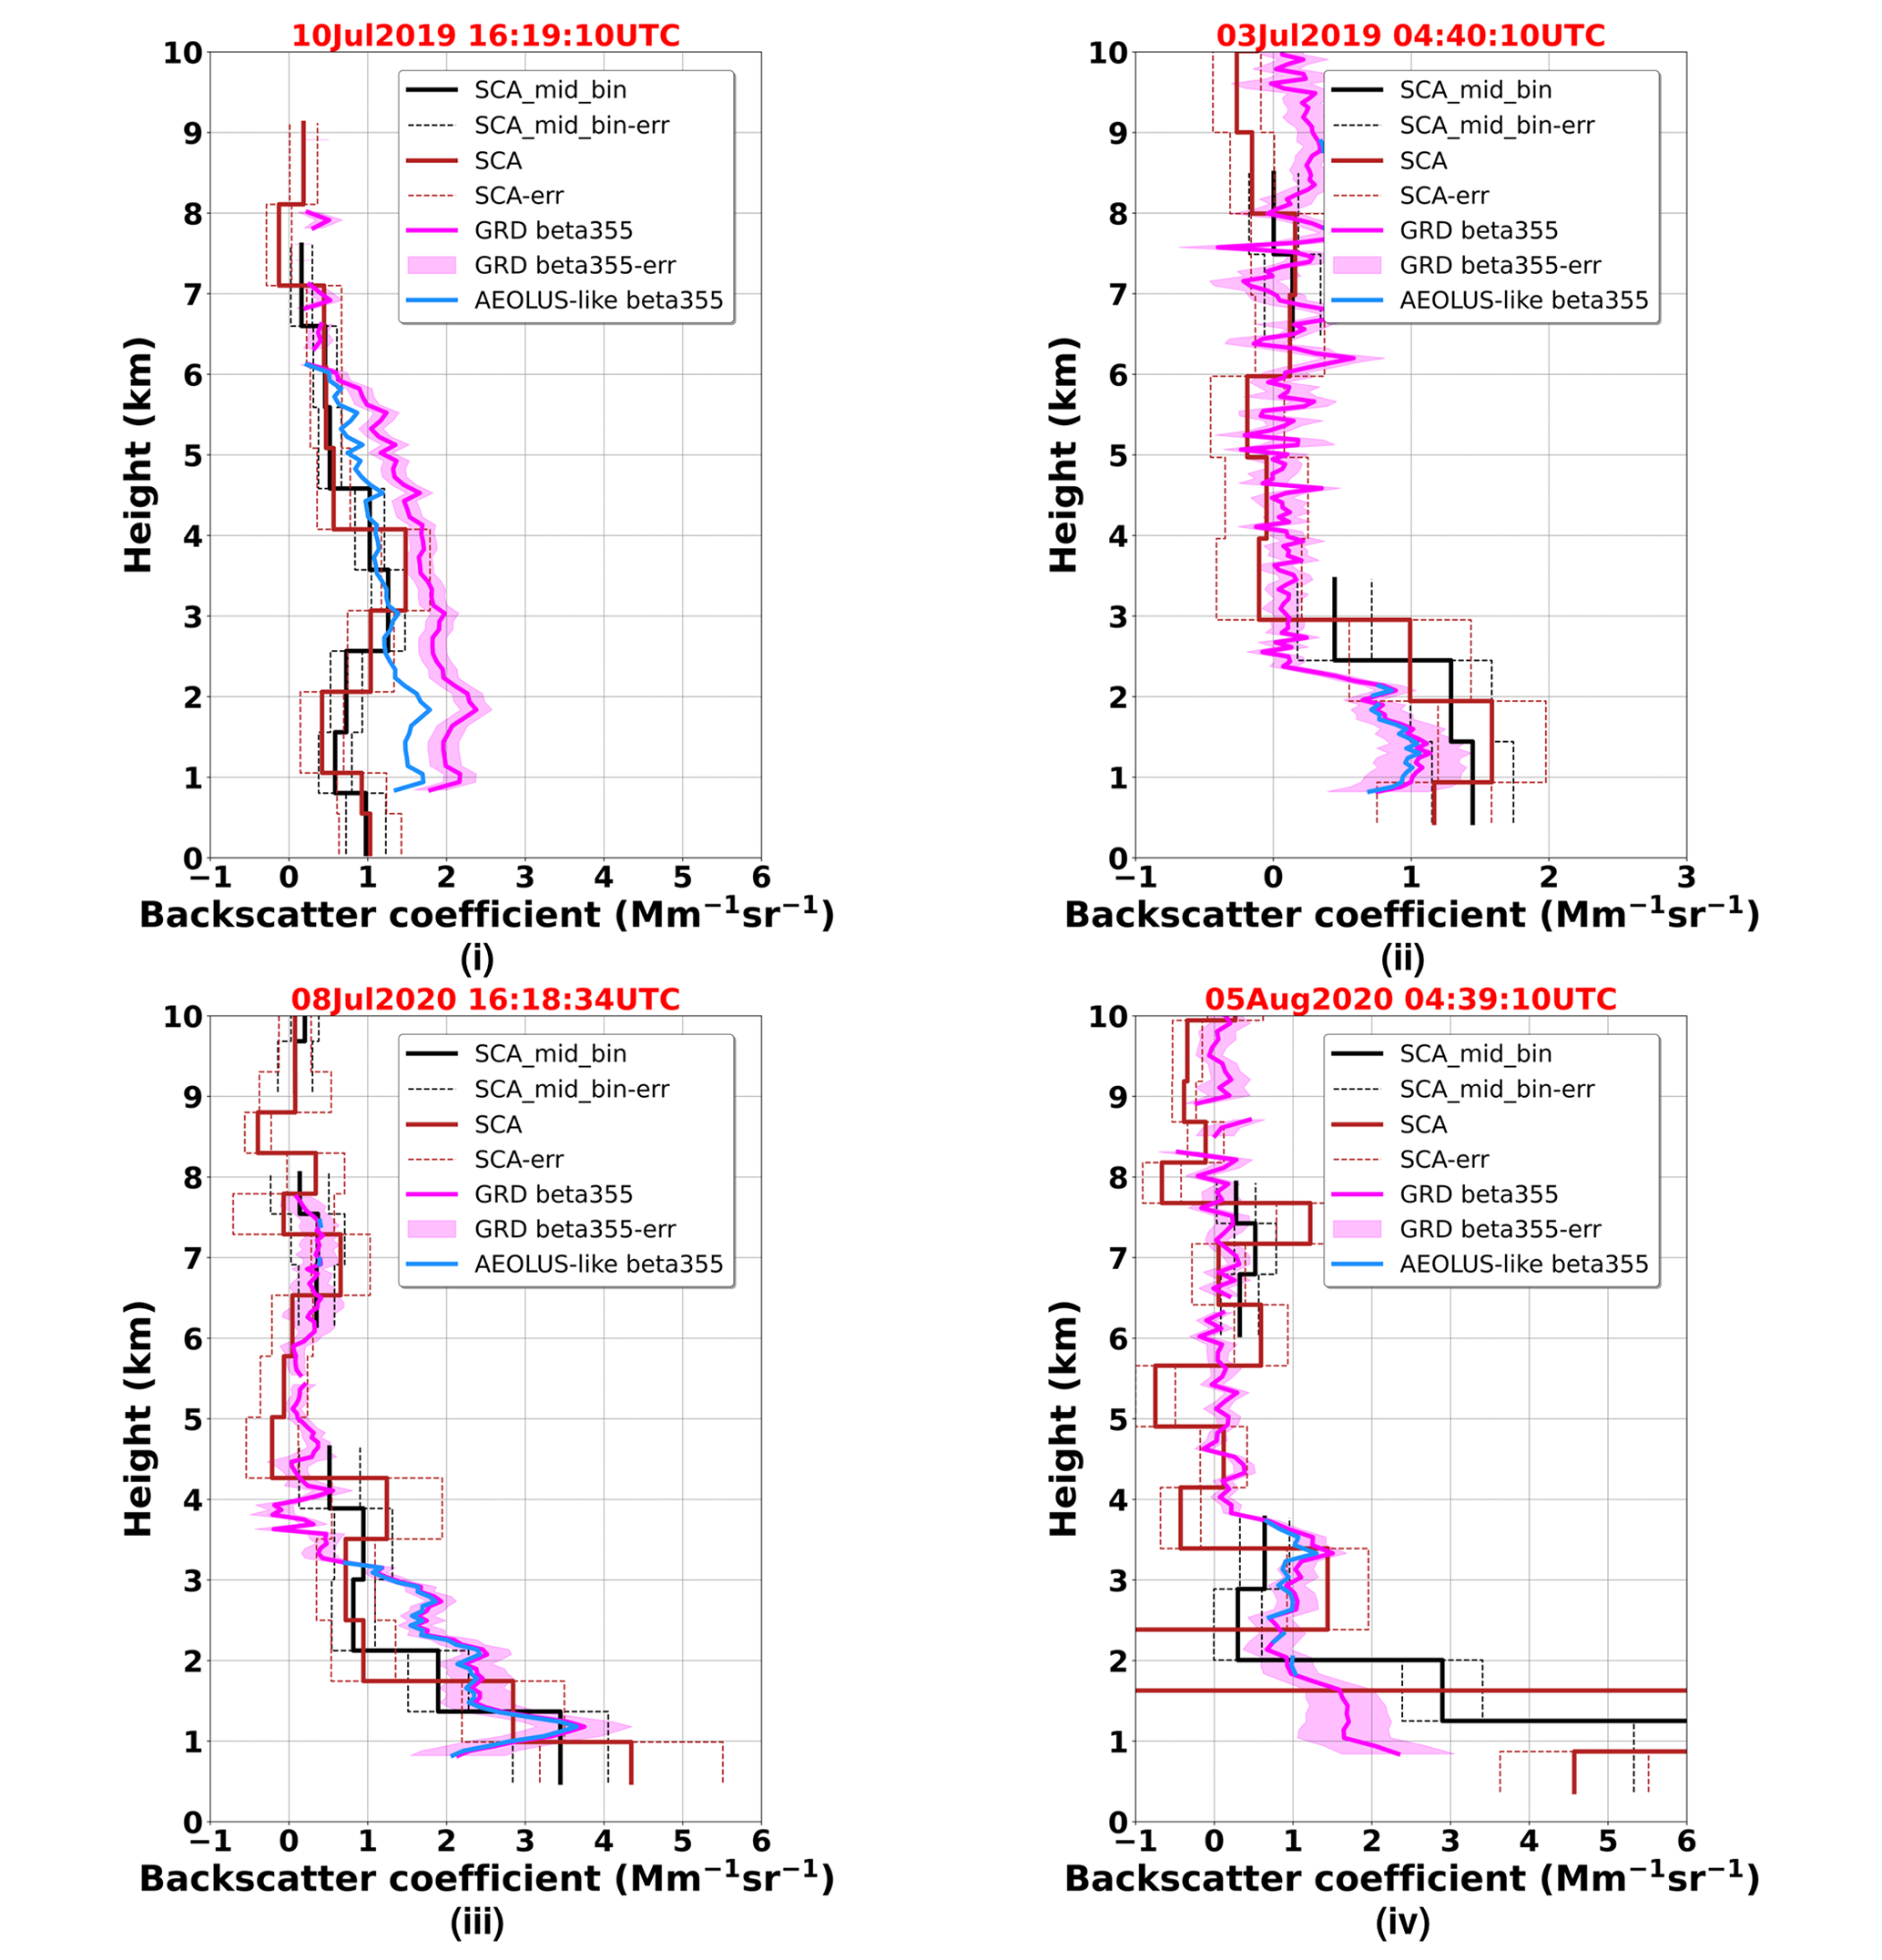
Figure 3Vertical profiles of backscatter coefficient at 355 nm acquired by ALADIN for the Level-2A SCA (regular vertical observation grid; brown solid curve) and SCA mid-bin (reduced vertical observation grid; solid black curve) products. The dashed lines correspond to the estimated SCA backscatter coefficient errors (brown) and SCA mid-bin backscatter coefficient errors (black). A vertical profile of PollyXT backscatter coefficient (solid pink curve) at the UV wavelength (355 nm) and associated errors (shaded pink area) is shown. The PollyXT Aeolus-like backscatter coefficient (solid light blue curve) after converting the linear-derived products to circular co-polar, according to Paschou et al. (2022), is shown. The ground-based profiles have been acquired at the ANT station (southwestern Greece) on (i) 10 July 2019, (ii) 3 July 2019, (iii) 8 July 2020 and (iv) 5 August 2020. The red coloured font denotes which Aeolus BRC (along with the overpass time) has been selected, based on the defined collocation criteria.
As already mentioned, SCA retrievals are provided at a coarse spatial (BRC level; ∼90 km) and vertical (minimum 250 m) resolution, while currently there is no scene classification scheme. In order to overcome this inherent limitation, as much as possible, several ancillary data sources and products are utilized in parallel with those of the MSG-SEVIRI CLM product. Based on the FLEXPART v10.4 (FLEXible PARTicle dispersion model) Lagrangian transport model (Stohl et al., 2005; Pisso et al., 2019; Brioude et al., 2013), we have reproduced the 5 d air mass back-trajectories prior to their arrival at seven altitudes above the ground station. FLEXPART was driven with meteorological data, every 3 h, from the National Centers for Environmental Prediction (NCEP) Global Forecast System (GFS) analyses, provided at resolution and for 41 model sigma pressure levels (https://nomads.ncep.noaa.gov/txt_descriptions/GFS_half_degree_doc.shtml, last access: 20 February 2023). To depict the spatial patterns of the mid-visible (550 nm) total and speciated AOD, we are relying on the MERRA-2 (Modern-Era Retrospective analysis for Research and Applications, Version 2; Buchard et al., 2017; Randles et al., 2017; Gelaro et al., 2017) and CAMS (Copernicus Atmosphere Monitoring Service; Inness et al., 2019) reanalysis datasets, both providing AODs of high quality (Gueymard and Yang, 2020; Errera et al., 2021). Finally, AERONET sun-direct measurements (Level 2.0, Version 3; Giles et al., 2019; Sinyuk et al., 2020) of the spectral AODs and Ångström exponent, in addition to the fine mode fraction (FMF at 500 nm) derived from the spectral deconvolution algorithm (O'Neill et al., 2003) are also used for the characterization of the aerosol load and size over the station.
6.1.1 Dust advection on 10 July 2019
The first case refers to the advection of dust aerosols from northwestern Africa towards ANT with dust-laden air masses crossing southern Italy prior to their arrival from northwesterly directions (Fig. S2). This route of the air masses, driven by the prevailing atmospheric circulation (Gkikas et al., 2015), is typical during summer when Saharan aerosols are advected towards the eastern Mediterranean (Balis et al., 2006). MERRA-2 (Fig. S3-i) and CAMS (Fig. S3-ii) show a reduction in AODs (at 550 nm) from west to east, whereas the large contribution (>80 %) of dust aerosols to the total aerosol load is evident in both reanalysis products (results not shown here). The moderate-to-high AOD values are confirmed by the ground-based sun-photometric measurements (Fig. S4), which are associated with a low Ångström exponent (calculated between 440 and 870 nm) values (0.2–0.4) and FMF (Fig. S5) lower than 0.35, thus indicating the prevalence of coarse mineral particles (Dubovik et al., 2002). This is further supported by PollyXT measurements (Fig. S6) revealing persistent dust layers associated with volume linear depolarization ratio (VLDR) values of 5 %–10 % at 355 nm, stretched from altitudes close to the ground and up to almost 6 km.
This case is suitable for evaluating SCA backscatter retrievals since non-spherical mineral particles are probed by ALADIN, which does not detect the cross-polar component of the backscattered lidar signal. Therefore, a degradation of ALADIN's performance is expected (i.e. underestimation of the backscatter coefficient and overestimation of the lidar ratio) when aspherical particles (e.g. dust, volcanic ash and cirrus ice crystals) are probed. In Fig. 3, the SCA backscatter coefficient step-like vertical profiles at the regular (brown) and mid-bin (black) vertical scales are compared against those acquired by the PollyXT (pink) at 355 nm. The coloured dashed lines (Aeolus) and the pink shaded area (PollyXT) correspond to the statistical uncertainty margins of the spaceborne (see Sect. 2.3.1 in Flament et al., 2021) and the ground-based (D'Amico et al., 2016) retrievals, respectively. Both refer to the photo-counting noise following a Poisson distribution. At a first glance, it is evident that the geometrical structure of the dust layer, extending from 1 to 6 km, is generally well captured by ALADIN (except at altitude ranges from 1 to 2.5 km), but the backscatter magnitude is constantly lower. A fairer comparison requires the conversion of the backscatter retrievals, assuming that PollyXT emits circularly polarized radiation (instead of linearly polarized), thus resembling ALADIN. Under the assumption of randomly oriented particles and negligible multiple scattering effects, this transformation is made based on theoretical formulas (Mishchenko and Hovenier, 1995; Roy and Roy, 2008), as shown in Paschou et al. (2022). Following this approach, the Aeolus-like backscatter (i.e. circular co-polar component; blue curve in Fig. 3) is reproduced for the ground-based profiles at altitudes where UV depolarization measurements are available. Thanks to this conversion, the Aeolus–PollyXT departures diminish, and the Aeolus-like curve resides closer to those of SCA (brown) and SCA mid-bin (black) backscatter levels. The difference between pink and blue backscatter profiles, ranging from 13 % to 33 % in this specific case, reflects the under-determination of the particle backscatter coefficient in case of depolarizing aerosols being probed, due to the missing cross-polar backscatter component.
6.1.2 Long-range transport of fine aerosols on 3 July 2019
Under the prevalence of the etesian winds (Tyrlis and Lelieveld, 2013), anthropogenic aerosols from megacities (Kanakidou et al., 2011) and biomass burning particles originating in eastern Europe (van der Werf et al., 2017) are transported southwards. Based on the FLEXPART simulations (Fig. S7), the air masses carrying fine particles gradually descend until their arrival over ANT from north–northeastern directions. During early morning hours, when ALADIN probes the atmosphere at a distance of ∼90 km westwards of the ground station (dawn orbit; descending), moderate AODs (up to 0.15 at 340 nm), very high Ångström exponent values (>1.2) and FMFs varying from 0.6 to 0.7 are measured with the Cimel sun photometer (Figs. S8 and S9). The aerosol load is confined below 2.5 km, consisting of spherical particles, as revealed from the PollyXT volume linear depolarization ratio (VLDR) values, which do not exceed 5 % at 355 nm (Fig. S10). In the vicinity of the PANGEA observatory, MERRA-2 (Fig. S11-i) and CAMS (Fig. S11-ii) AODs, mainly attributed to organic carbon, sulfate and sea salt aerosols, do not exceed 0.2, and they are coherent in spatial terms (i.e. horizontal homogeneity). In this case, the PollyXT particle backscatter coefficient profiles coincide with the corresponding Aeolus-like profiles (pink and blue curves are almost overlaid in Fig. 3-ii) since the depolarization values are negligible. Under these conditions, ALADIN is capable of satisfactorily reproducing the layer's structure, whereas it slightly overestimates The intensity with respect to the ground truth retrievals.
6.1.3 Long-range transport of fine aerosols on 8 July 2020
On 8 July 2020, the broader area of ANT island was under the impact of moderate-to-high aerosol loads, mainly consisting of organic and sulfate particles, in the western and southern sector of the station, based on CAMS-simulated AODs (up to 0.5; Fig. S12-ii). AERONET measurements yield UV AODs up to 0.5 and an Ångström exponent higher than 1.5 during the early afternoon (Fig. S13), whereas the FMF is higher than 0.75 throughout the day (Fig. S14). MERRA-2 AOD patterns (Fig. S12-i) and speciation (strong contribution from marine and sulfate aerosols to the total aerosol load) are different from those of CAMS, without being very consistent with respect to the ground-based sun photometer observations (Figs. S13, S14). Air masses originating in the northern Balkans and the Black Sea, after crossing metropolitan areas (i.e. Istanbul and Athens), are advected over ANT at altitudes up to 4 km above surface. A second cluster aloft (>5 km) indicates the convergence of air masses from northwest (Fig. S15). In vertical terms, aerosol layers with local backscatter maxima, gradually reducing from 3.5 to 1.5 Mm−1 sr−1, are observed up to 4 km based on PollyXT backscatter coefficient profiles (pink curve; Fig. 3-iii), whereas almost identical values are recorded for the Aeolus-like retrievals (blue curve; Fig. 3-iii) under low VLDR levels (Fig. S16). For this specific case, SCA performance reveals an altitude dependency according to the comparison versus PollyXT. From top to bottom, the weak layer extending from 6 to 8 km, as observed in the ground-based lidar profiles, is partially evident in the SCA retrievals. SCA fails to reproduce the aerosol layer (in terms of structure and backscatter magnitude) seen from the ground-based lidar between 2 and 4 km. Below 2 km, the agreement between ALADIN and PollyXT becomes better, particularly for SCA mid-bin, even though the narrow peak recorded at ∼1.2 km by PollyXT cannot be reproduced by ALADIN. This might be attributed either to the adjusted BRCs in the lowermost bin (1 km thickness) or to the lower accuracy of SCA retrievals near the ground due to the attenuation from the overlying layers (Flament et al., 2021).
6.1.4 Stratification of spherical and non-spherical particles on 5 August 2020
In the last case that took place on 5 August 2020, we are investigating the ability of SCA to adequately reproduce the vertical structure of an aerosol layer detected up to 4 km, based on PollyXT (Fig. 3-iv; pink curve). The peculiarity of this study case, as revealed by the PollyXT time–height plots of VLDR (Fig. S17), is that spherical fine particles dominate below 2.5 km, whereas the presence of non-spherical coarse aerosols above this layer is evident. This stratification results from the convergence of air masses either originating in central Europe or suspending most of their travel above northwestern Africa (Fig. S18). According to MERRA-2 (Fig. S19-i) and CAMS (Fig. S19-ii) reanalysis datasets, AODs fade from west to east, while both numerical products indicate the coexistence of carbonaceous, sulfate and mineral particles over the area where ALADIN samples the atmosphere (∼100 km westwards of ANT). During the Aeolus overpass (∼ 04:40 UTC), sun photometer columnar observations are not available (Figs. S20, S21). However, 1 h later, UV AODs up to 0.4 are recorded and remain relatively constant during sunlight hours. At the same time, intermediate Ångström (0.7–1) and FMF (∼0.5) values, exhibiting weak temporal variation, indicate a mixing state of fine and coarse aerosols.
The SCA backscatter retrievals at the regular (i.e. SCA; brown curve; Fig. 3-iv) and the mid-bin (i.e. SCA mid-bin; black curve; Fig. 3-iv) vertical scales suffer from noise and retrieval gaps. As a result, Aeolus possibly (acknowledging the weak signals and the underestimated errors) incorrectly detects an aerosol layer between 5.5 and 8 km under the assumption that clear-sky conditions are appropriately represented in the MSG-SEVIRI imagery and remain constant within the time interval (∼6 min) of MSG and Aeolus observations. At lower altitudes (2.5–4 km), due to the suspension of depolarizing mineral particles, a departure is marked between the pink (linear-derived) and blue (Aeolus-like) PollyXT profiles. Both SCA and SCA mid-bin fail to reproduce the backscatter levels of this aerosol layer captured from the ground. In the lowest troposphere (<2 km), SCA significantly overestimates the backscatter coefficient but satisfactorily reproduces the aerosol layer structure at the mid-bin vertical scale (i.e. SCA mid-bin; black curve; Fig. 3-iv), in contrast to the regular scale (i.e. SCA; brown curve; Fig. 3-iv).
A general remark that should be made is that, for the cases analysed, there is an inconsistency in the vertical representativeness within the lowermost Aeolus bin between the ground-based and spaceborne profiles. Under the absence of the near-field receivers (not considered in our study) PollyXT profiles are reported above ∼800 m, where the overlap between the laser beam and the receiver telescope field of view is expected to be full. However, the base altitude of the near-surface Aeolus bin is at ∼200 m. This can interpret, to some degree, the large positive ALADIN-PollyXT departures at altitudes below 1 km, which are possibly further strengthened by an inappropriate BRC (i.e. low SNR) in the SCA retrievals.
6.2 Overall assessment and dependencies
In the second part of the analysis, an overall assessment of the Aeolus SCA retrievals is performed by processing all the identified cases (43 in total; see Sect. 5). Due to the very limited availability of ground-based extinction profiles, only the Aeolus SCA backscatter observations are evaluated. It must be clarified that the evaluation of the Aeolus satellite (SAT) backscatter coefficient is conducted without any conversion (i.e. from total linear to circular co-polar) of the ground-based lidar (GRD) profiles. This has been decided, since many of the SAT-GRD collocated samples are derived from the THE station. Due to technical issues (related to the polarization purity of the emitted laser beam and the performance of the telescope lenses), no calibrated depolarizing measurements, necessary to derive the Aeolus-like products (Paschou et al., 2022), are available for the study period. Nevertheless, we are not expecting that this consideration, acknowledging that it is imperfect, will substantially affect the robustness of our findings since, in most of the study cases, the contribution of depolarizing particles is quite low, based on the ancillary datasets/products. It is also clarified that the Aeolus quality assurance flags are not taken into account in the current study, since their validity is not yet reliable (Reitebuch et al., 2020), as demonstrated in Abril-Gago et al. (2022). The discussion in the current section is divided in two parts. First, the vertically resolved evaluation metrics are presented separately for the two Aeolus vertical scales, both for the unfiltered and the filtered (cloud-free) profiles (Sect. 6.2.1). The same analysis format (i.e. SCA vs. SCA mid-bin and unfiltered vs. filtered) is kept in the second sub-section (Sect. 6.2.2), where the evaluation results are presented as a function of various dependencies.
6.2.1 Vertically resolved evaluation metrics
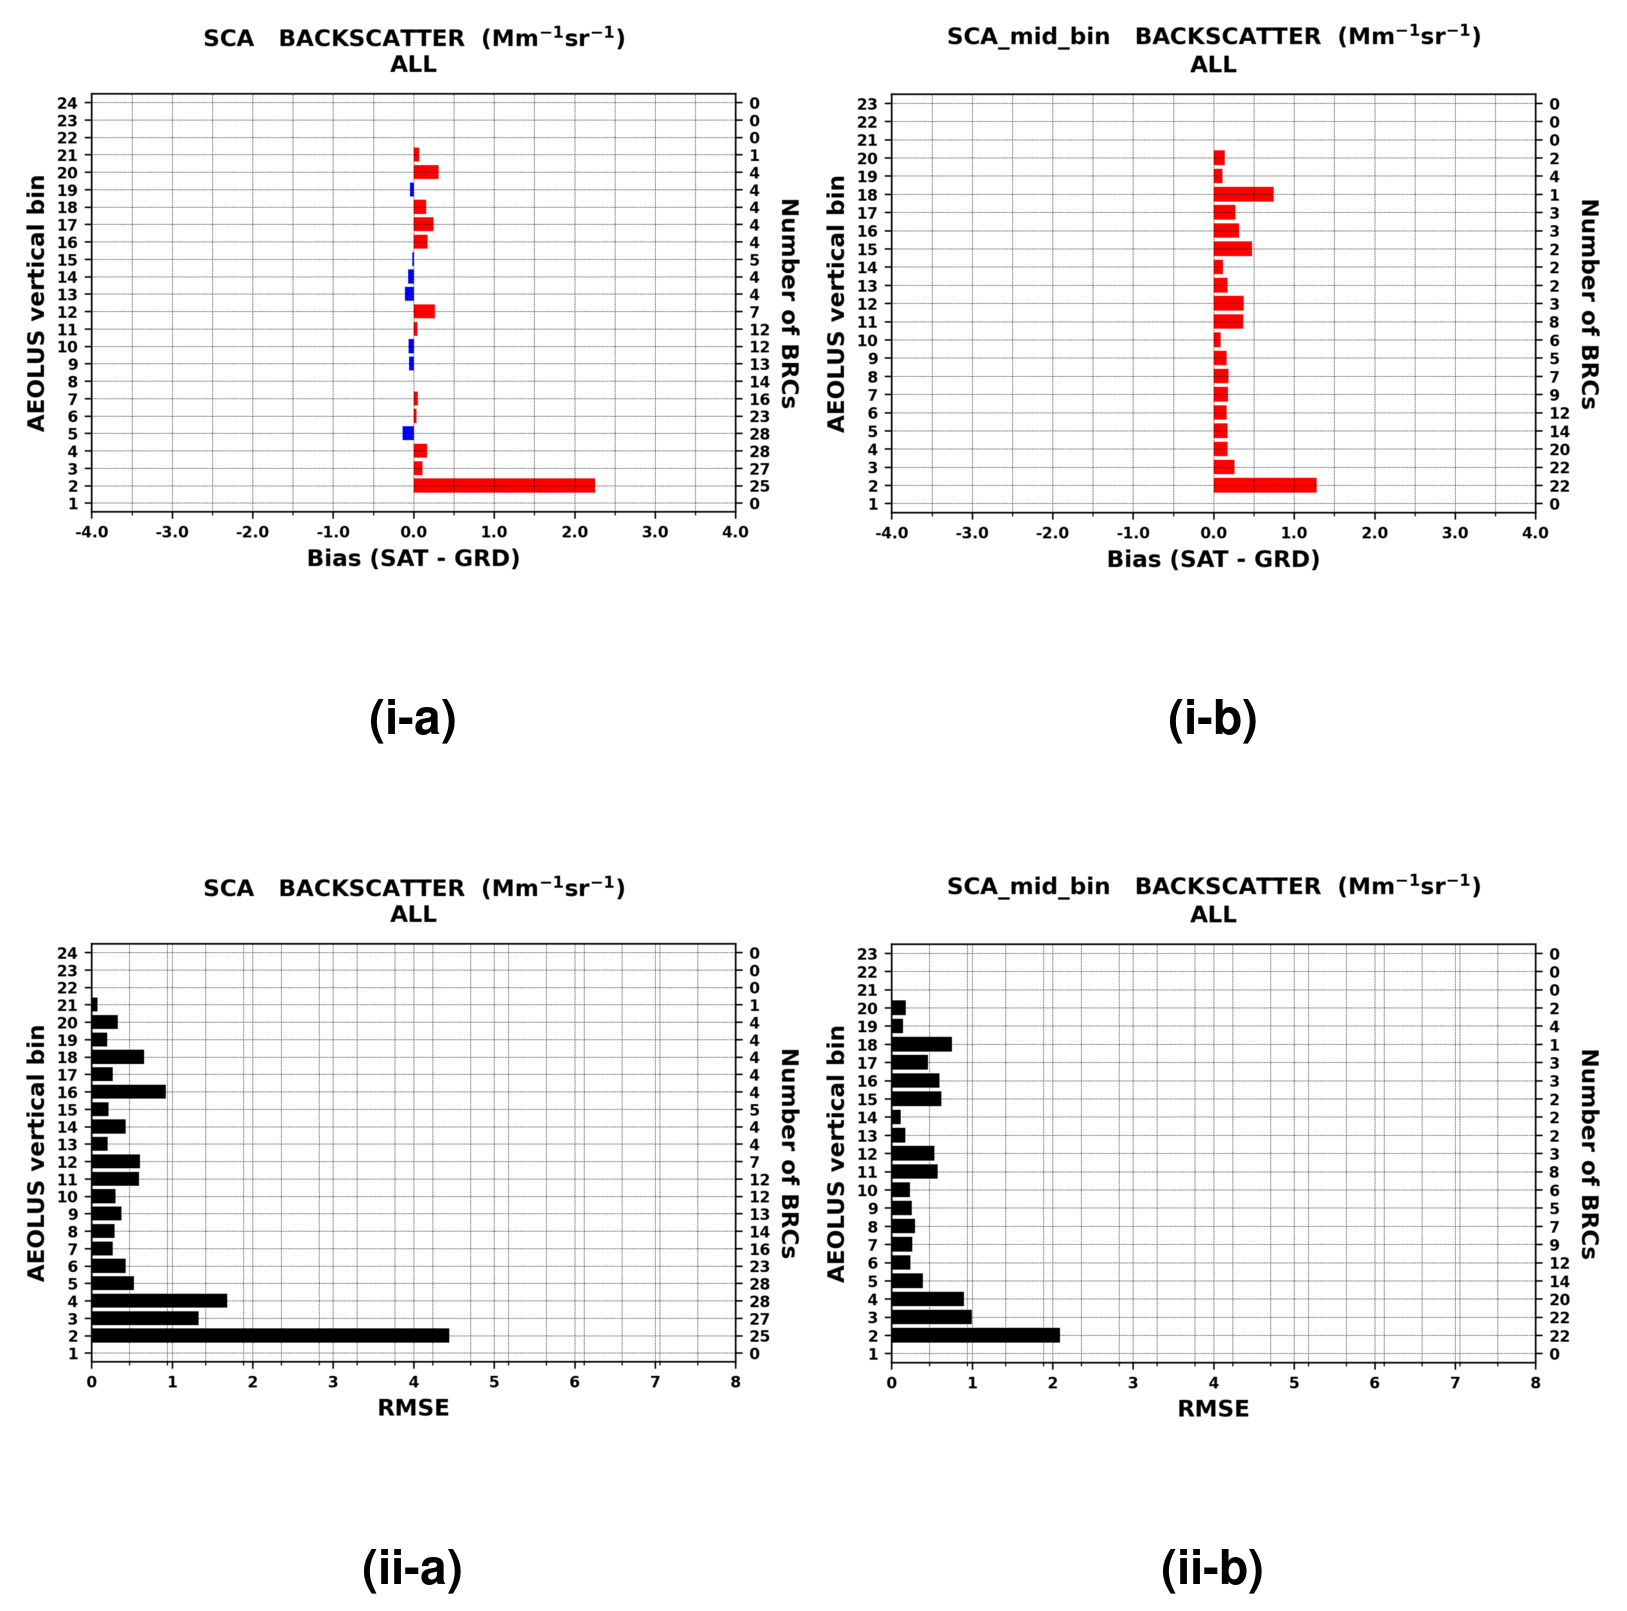
In Fig. 4, the vertically resolved bias (SAT-GRD; upper panel) and root mean square error (RMSE; bottom panel) metrics are depicted for the unfiltered (cloud and aerosol backscatter) Aeolus SCA backscatter retrievals, reported at the regular (left column) and the mid-bin (right column) vertical scales. Bias and RMSE metrics (Wilks, 2019) are used in a complementary way in order to avoid any misleading interpretation of the former score attributed to counterbalancing negative and positive SAT-GRD deviations. For the calculation of the evaluation scores, the GRD profiles have been rescaled to match Aeolus vertical product resolution. Note that we are calculating the averaged values of the ground-based retrievals residing within the altitude margins of each Aeolus BRC. Moreover, in the SAT-GRD pairs, all BRCs from all cases are included (right y axis in Fig. 4), satisfying the defined collocation criteria (see Sect. 5), and they are treated individually. It is worth remembering that Aeolus L2A data are provided vertically at a constant number of range bins (i.e. 24 for SCA and 23 for SCA mid-bin), but their base altitude and their thickness vary along the orbit and from orbit-to-orbit, and they are defined dynamically (depending on the optimum SNR). Therefore, since the GRD and SAT profiles are not interpolated in a common predefined grid, we are using the reverse index as a reference (with respect to those considered in the SCA retrieval algorithm in which 1 corresponds to the topmost bin) of Aeolus SCA (from 1 to 24; left y axis in Fig. 4i-a and ii-a) and SCA mid-bin (from 1 to 23; left y axis in Fig. 4i-b and ii-b) vertical scales.
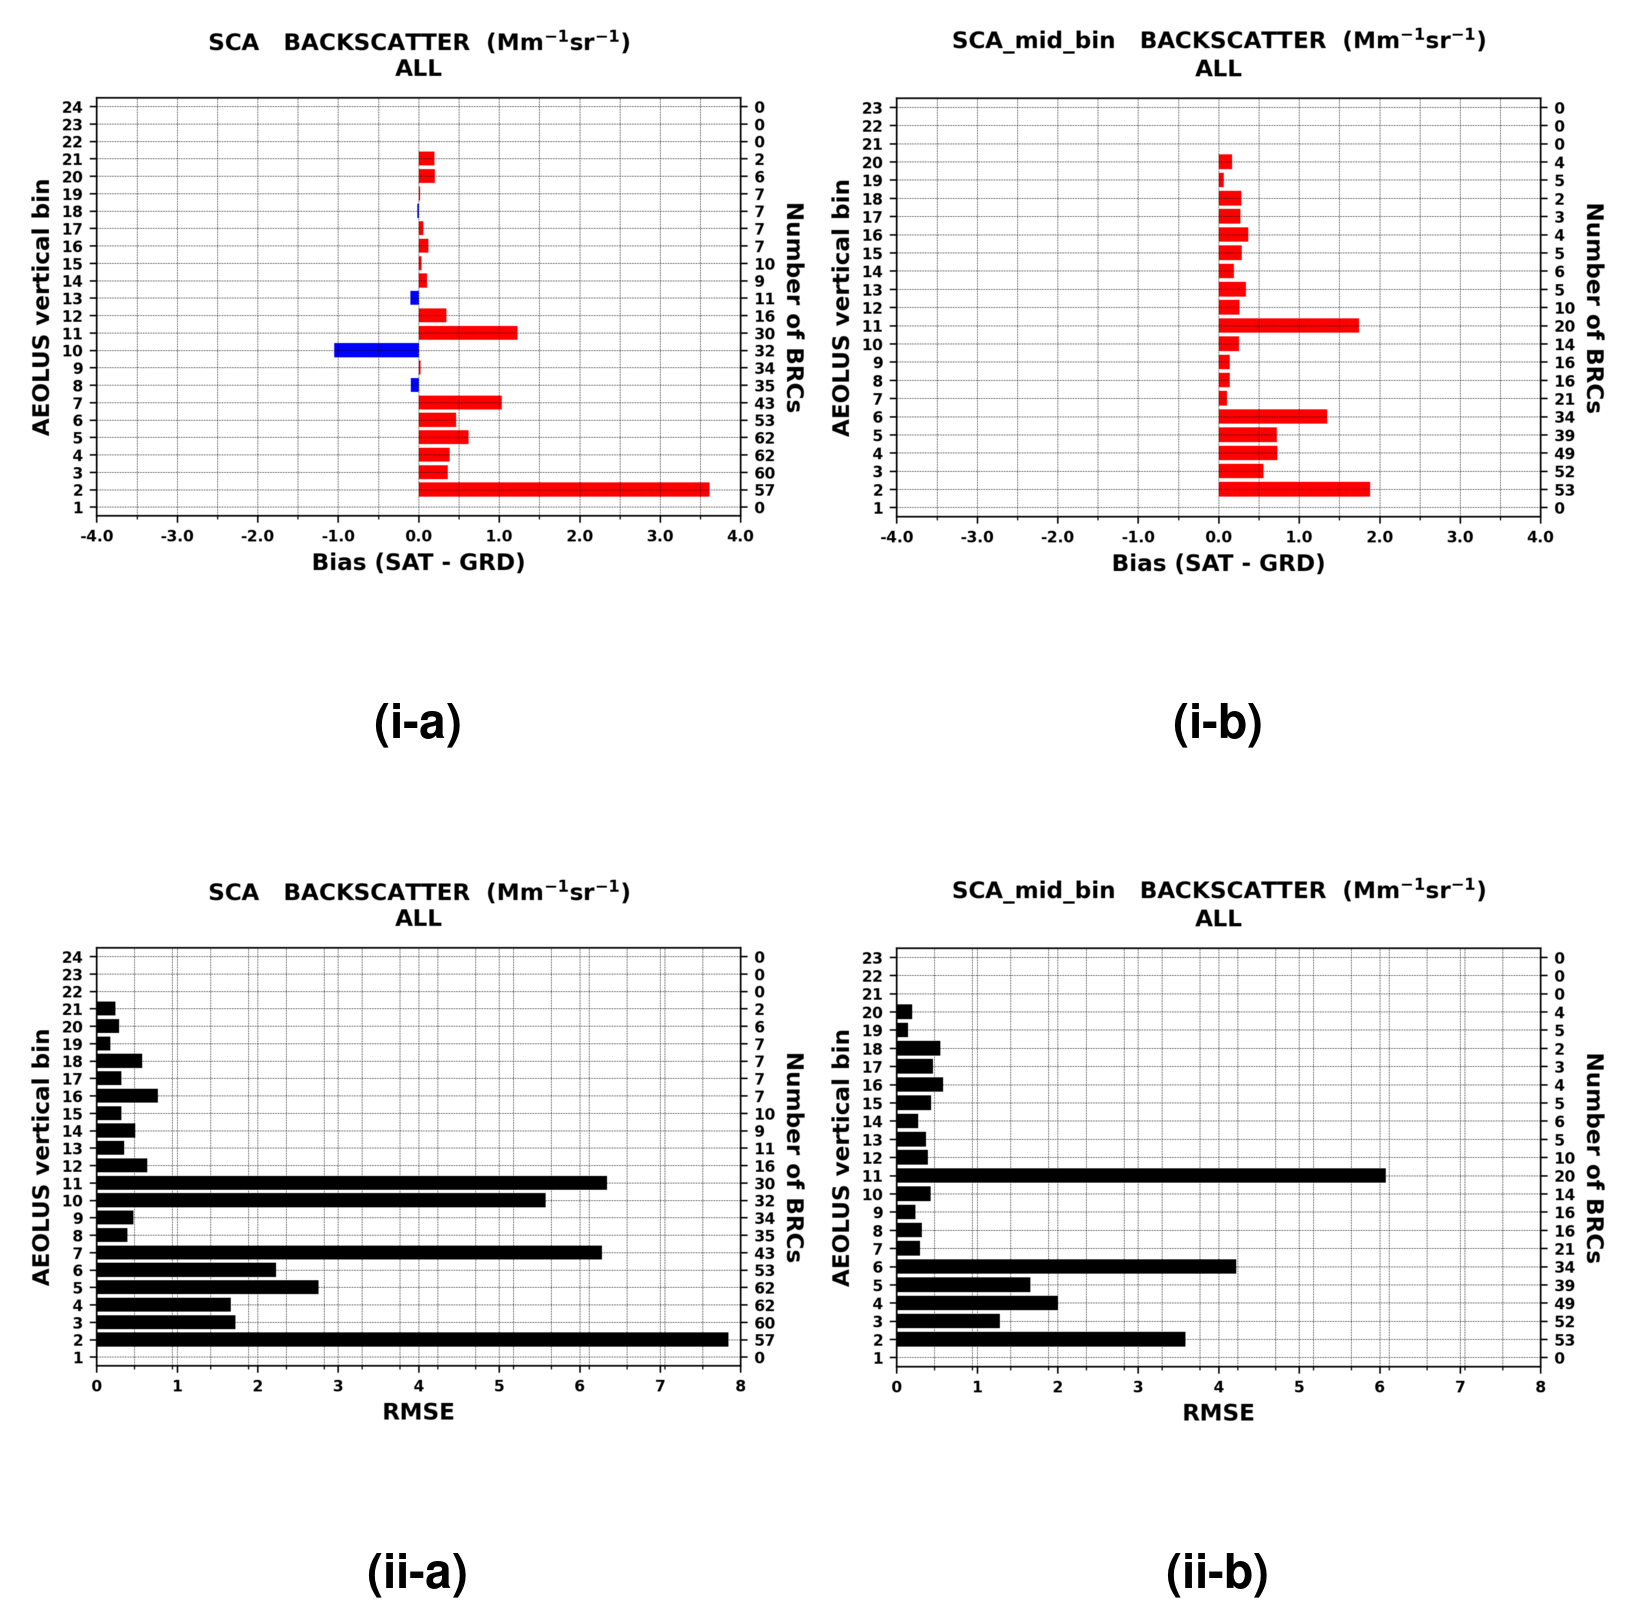
Figure 4Bias (i) and root mean square error (ii) metrics for the unfiltered Aeolus L2A backscatter retrievals reported at the regular (a) and mid-bin (b) vertical scales. The biases are defined as SAT-GRD, and the positive/negative departures are depicted with red or blue bars. The statistical metrics are vertically resolved based on Aeolus bin indices (left y axis). The number of BRCs participating in the metrics calculations at each bin are given on the right y axis.
According to our results for the unfiltered SCA backscatter profiles (Fig. 4), positive biases (up to 3.5 Mm−1 sr−1; red bars) are evident, at both vertical scales, at the first three bins (below 2 km). For altitude ranges spanning from 2 to 8 km (bins 4–12), mainly positive SAT-GRD biases (up to ∼1.5 Mm−1 sr−1) are recorded for the SCA mid-bin, whereas SCA reach up to ∼1 Mm−1 sr−1 in absolute terms. Similar tendencies are evident at the highest altitudes (>8 km), but the magnitude of the SAT-GRD offsets becomes lower (<0.5 Mm−1 sr−1). Between the two Aeolus vertical scales, SCA mid-bin RMSE metrics are better than those of SCA up to ∼8 km (bin 12) and are similar aloft (bottom panel in Fig. 4). Nevertheless, the most important finding is that SCA is not capable of satisfactorily reproducing the backscatter profiles as revealed by the RMSE levels, which are maximized near the ground (∼8 Mm−1 sr−1), are considerably high (up to 6 Mm−1 sr−1) in the free troposphere and are minimized (<1 Mm−1 sr−1) at the uppermost bins. Our findings are highly consistent with those presented in Abril-Gago et al. (2022), who performed a validation of Aeolus SCA particle backscatter coefficient against reference measurements obtained at three ACTRIS/EARLINET sites in the Iberian Peninsula. Several factors contribute to the obtained height-dependent SAT-GRD discrepancies. Near the ground, the observed maximum overestimations are mainly attributed to the (i) contamination of the ALADIN lidar signal by surface reflectance, (ii) increased noise in the lowermost bins (caused by the nonlinear approach for retrieving the backscatter coefficient), as also pointed out in the atmospheric simulation cases I and II in Ehlers et al. (2022), and (iii) limited vertical representativeness of the GRD profiles below 1 km. On the contrary, in the free troposphere, the cloud contamination on spaceborne retrievals plays a dominant role in the occurrence of ALADIN backscatter overestimations with respect to the cloud-free ground-based retrievals. From a statistical point of view, it must also be mentioned that the robustness of the bias and RMSE metrics decreases with increasing altitudes due to the reduction in the number of the SAT-GRD match-ups (right y axis in Fig. 4) participating in the calculations.
The assessment analysis has been repeated after removing SCA profiles when clouds are detected by MSG-SEVIRI (grey shaded areas in Fig. 1) within a BRC (coloured rectangles in Fig. 1). By contrasting Figs. 4 and 5 (evaluation metrics for the filtered profiles), an expected improvement in the level of agreement between SAT and GRD is visible. This translates into a drastic reduction in bias and RMSE levels at altitude ranges up to 5–6 km (∼ bin 10). Between bins 2 and 5, slight underestimations (blue bars) and overestimations (red bars) are found for SCA (Fig. 5i-a). On the contrary, for the SCA mid-bin (Fig. 5i-b), low positive SAT-GRD offsets are recorded due to the omitted negative backscatter values, as will be shown in the next section. Above bin 5, SAT-GRD deviations are low in absolute terms, oscillating around zero, for SCA, whereas only positive SAT-GRD biases are recorded for SCA mid-bin, which are maximized (∼0.7 Mm−1 sr−1) at the highest bins and are associated with limited SAT-GRD match-ups (right x axis in Fig. 5i-b). The obtained improvements on bias scores become more confident since they are associated with similar strong reductive tendencies on RMSE levels. More specifically, the RMSE spikes of extremely high values recorded in the unfiltered profiles either disappear or weaken in the case of the Aeolus filtered SCA (Fig. 5ii-a) and SCA mid-bin (Fig. 5ii-b) backscatter profiles. However, even though the RMSE values at the lowermost bins (close to the ground) are decreased when cloud contaminated Aeolus profiles are eliminated, still the corresponding levels for the filtered profiles are considerably high and attributed to the lower SNR and the possible impact of surface returns.
6.2.2 Scatterplots
An alternative approach to assessing the performance of Aeolus SCA backscatter is attempted here by reproducing two-dimensional histograms for the entire SAT-GRD collocated sample and scatterplots resolved based on various dependencies. More specifically, the dependencies under investigation are those of the (i) station locations, (ii) BRCs and (iii) orbits (dawn vs. dusk). The evaluation metrics have been calculated for all possible combinations of vertical scales (SCA vs. SCA mid-bin) and SCA profiles (unfiltered vs. filtered).
Figure 6 depicts the two-dimensional histograms between the GRD (x axis) and SAT (y axis) backscatter coefficient for the raw (upper panel) and filtered (bottom panel) SCA profiles reported at the SCA (left column) and SCA mid-bin (right column) vertical scales. Note that we have removed SAT-GRD pairs in which the SCA backscatter exceeds 20 Mm−1 sr−1 in order to avoid the contamination of extreme outliers in the calculated metrics that can possibly be attributed to the presence of clouds (Proestakis et al., 2019).
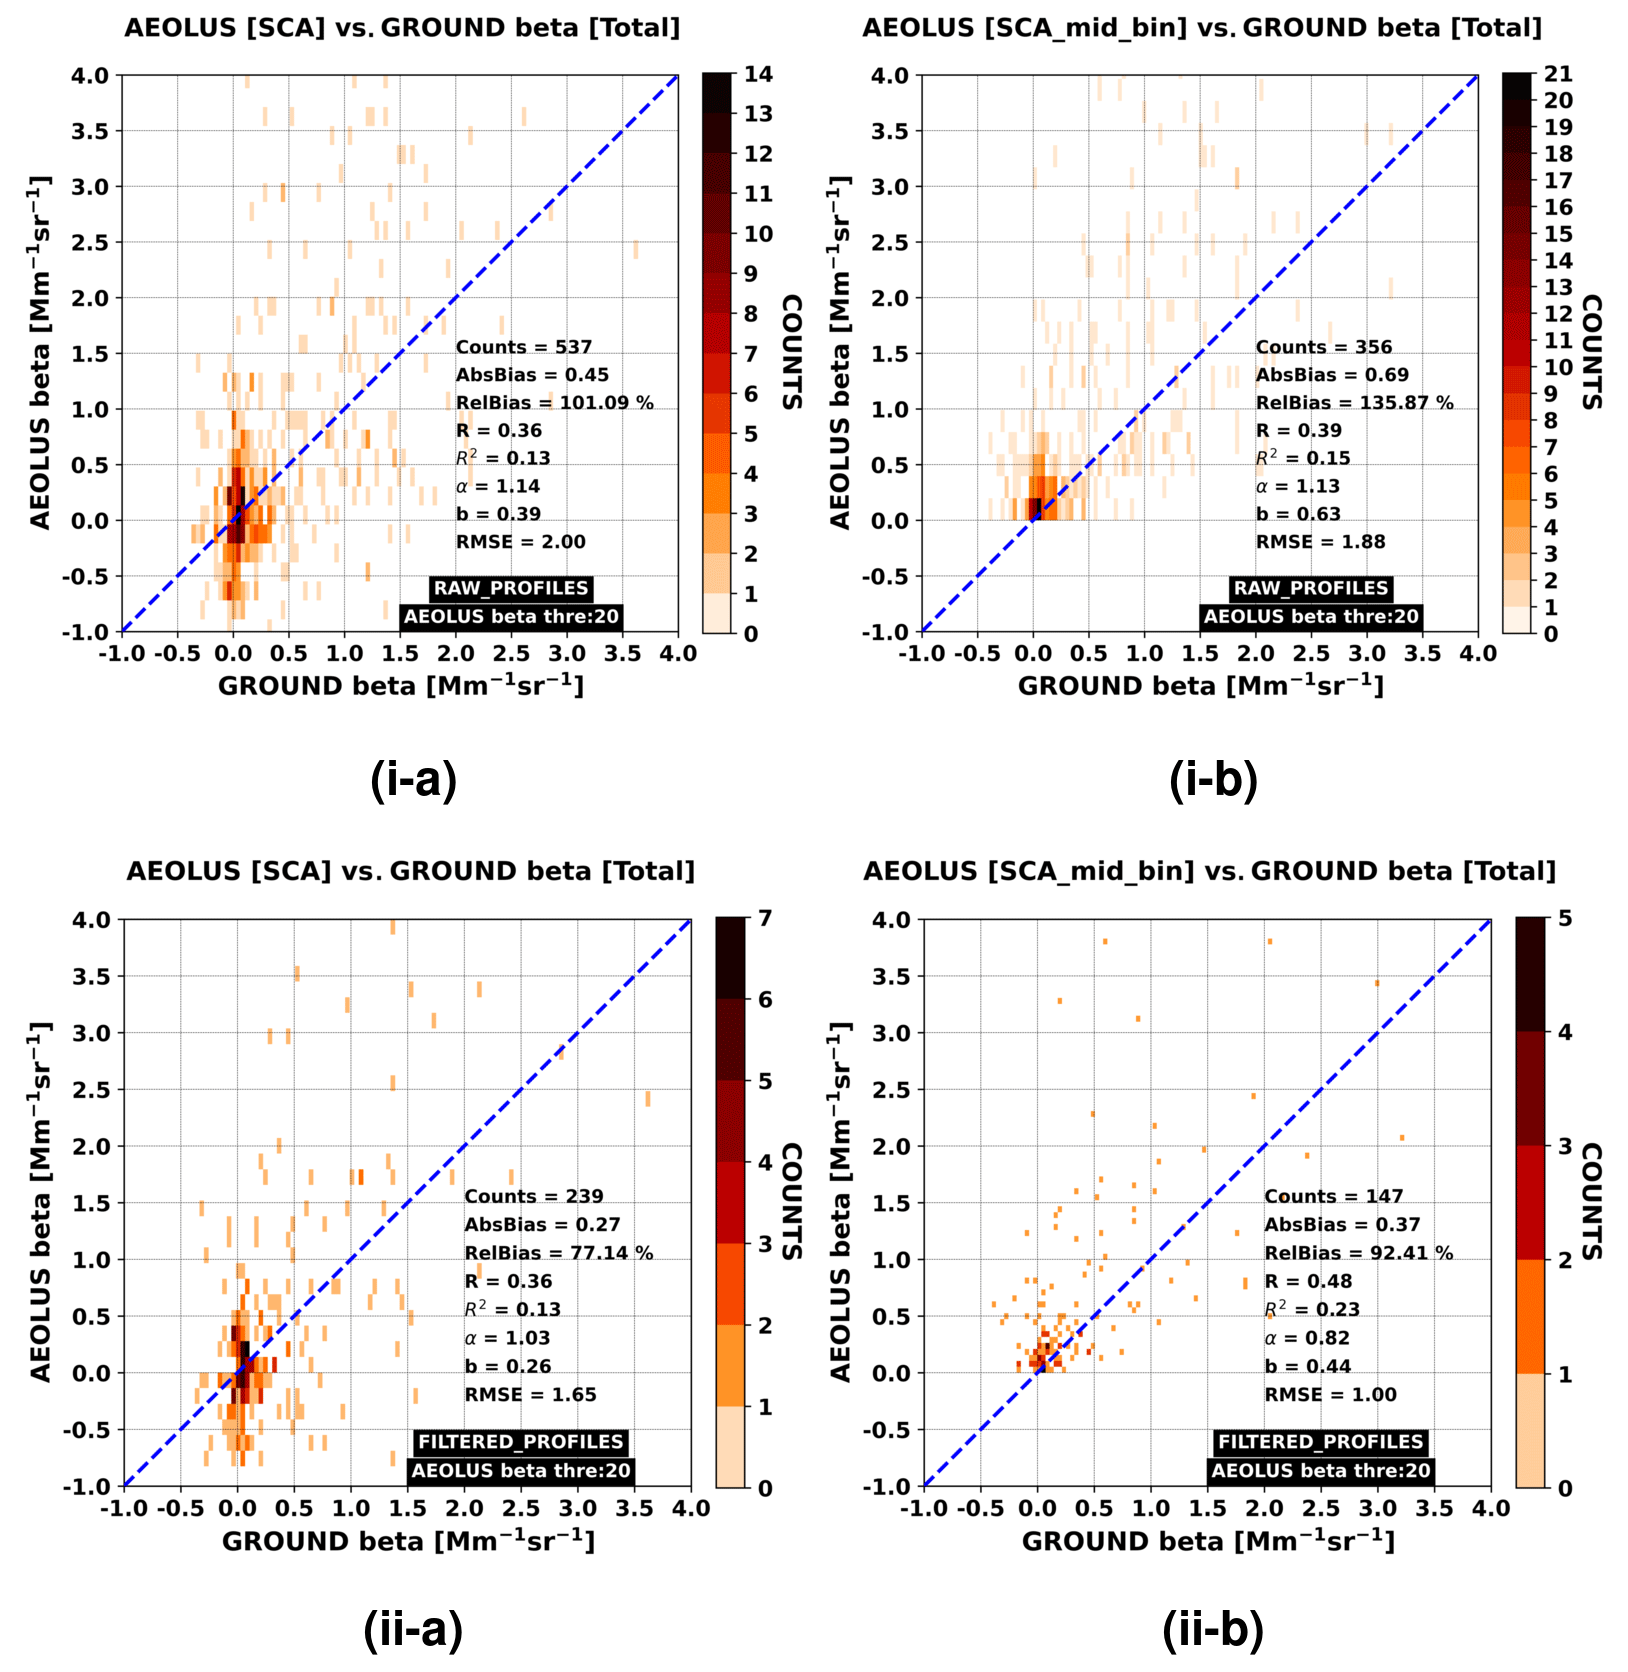
Figure 6The 2D histograms between Aeolus (y axis) and ground-based (x axis) backscatter coefficient retrievals. In the upper (i) and lower (ii) panels, the results for the cloud plus aerosol backscatter (unfiltered) and cloud-cleared backscatter (filtered) Aeolus profiles are depicted, respectively. In the left and right columns, the results corresponding to Aeolus regular (24 bins) and mid-bin (23 bins) vertical scales are illustrated, respectively. Aeolus backscatter values larger than 20 Mm−1 sr−1 are masked out from the collocated sample.
Between the SCA and SCA mid-bin unfiltered retrievals, it is found that the correlation coefficients (0.36 and 0.39, respectively) and RMSEs (2.00 and 1.88, respectively) are similar, whereas there is an evident difference in the biases (0.45 and 0.69 Mm−1 sr−1, respectively). Nevertheless, it is noted that less SAT-GRD pairs are recorded for the SCA mid-bin due to the inherent flagging of negative values. After removing cloud-contaminated SCA profiles, the number of the SAT-GRD match-ups is reduced by about 55 % and 59 % for SCA (from 537 to 239) and SCA mid-bin (from 356 to 147), respectively. Nevertheless, thanks to this filtering procedure, the initially observed overestimations for SCA and SCA mid-bin are reduced by ∼25 % and ∼43 %, respectively, whereas the RMSE values drop down to 1.65 (SCA) and 1.00 (SCA mid-bin). The better agreement between SAT and GRD, for the filtered SCA profiles, is further justified by the increase in the R values (from 0.39 to 0.48) for the SCA mid-bin, whereas, for SCA, there is no positive or negative tendency (R=0.36). The spread of the points in the two-dimensional space reveals many similarities with the corresponding scatterplots presented in Abril-Gago et al. (2022) for the Iberian ACTRIS/EARLINET stations.
A common feature in all scatterplots, shown in Fig. 6, is that most of the positive outliers are found at the lowermost bins (see Figs. 4 and 5). SAT beta can reach up to 20 Mm−1 sr−1, in contrast to the corresponding GRD levels, which are mainly lower than 2 Mm−1 sr−1. For SCA (Fig. 6i-a, ii-a), the majority of the negative SAT-GRD pairs are recorded at the highest bins in which, however, both spaceborne and ground-based backscatter coefficients are noisy. Another cluster of SAT-GRD pairs is that for which slightly negative SCA backscatter values are grouped together with low positive backscatter values retrieved from the ground. At the mid-bin vertical scale, for the unfiltered SCA profiles (Fig. 6i-b), the negative SAT backscatter values are masked out, resulting in better evaluation metrics (except the increase in bias due to the removal of the negative SCA backscatter) with respect to the regular vertical scale. Among the four scatterplots, the best agreement between SCA and ground-based retrievals is revealed for the SCA mid-bin filtered profiles (Fig. 6ii-b) attributed to the coincident elimination of the negative and the extremely positive SCA backscatter coefficient.
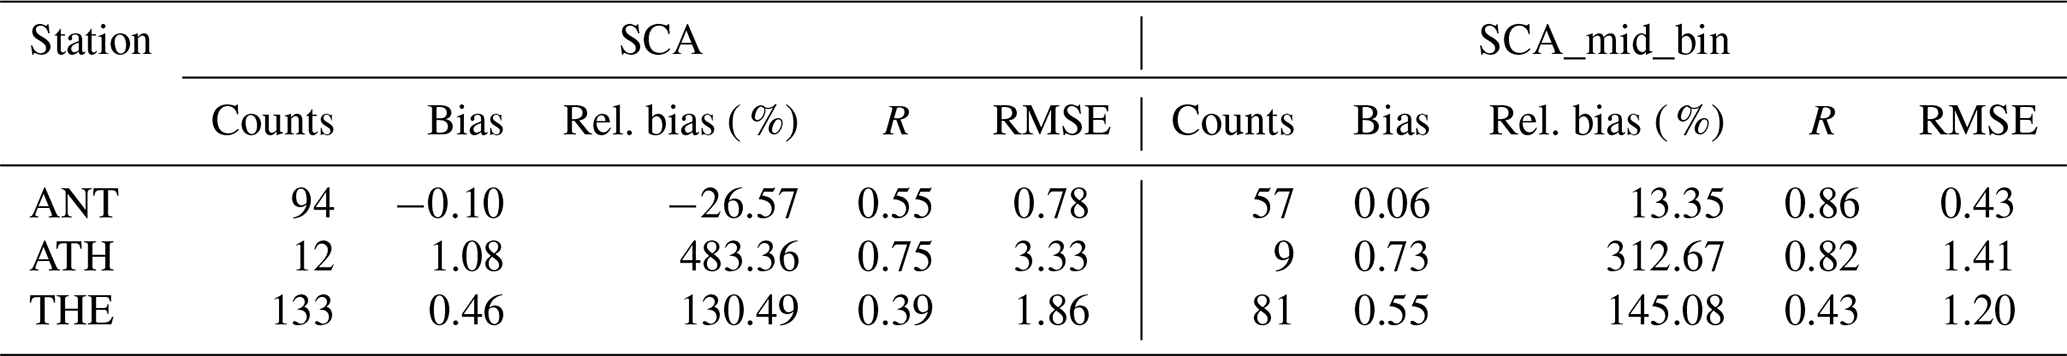
Figure 7 depicts the overall scatterplot between ground-based and spaceborne retrievals as a function of the three PANACEA sites (coloured categories). The associated evaluation scores are summarized in Tables 1 and 2 for the unfiltered and filtered SCA profiles, respectively. The majority of the extreme positive outliers of unfiltered SCA retrievals (Fig. 7i-a) are recorded in THE and ATH. According to our results, for SCA, significant biases (0.73 Mm−1 sr−1 for ATH and 0.83 Mm−1 sr−1 for THE) and high RMSE values (2.26 Mm−1 sr−1 for ATH and 2.60 Mm−1 sr−1 for THE) are found. At ANT island, the biases are quite low and equal to 0.06 Mm−1 sr−1 and 13.6 % in absolute and relative terms, respectively (Table 1). At all stations, for the unfiltered SCA mid-bin retrievals, the absolute SAT-GRD departures become larger, whereas the RMSE decreases for ANT and THE and increases for ATH. Regarding the temporal covariation between SAT and GRD retrievals, a noticeable improvement is evident for ANT (i.e. R increases from 0.49 to 0.57). For the quality-assured SCA profiles (Table 2), all evaluation metrics converge towards the ideal scores for SCA mid-bin, whereas mainly positive tendencies (i.e. better agreement) are evident for SCA. Overall, among the three stations, the best performance of the SCA retrievals is recorded at ANT island.
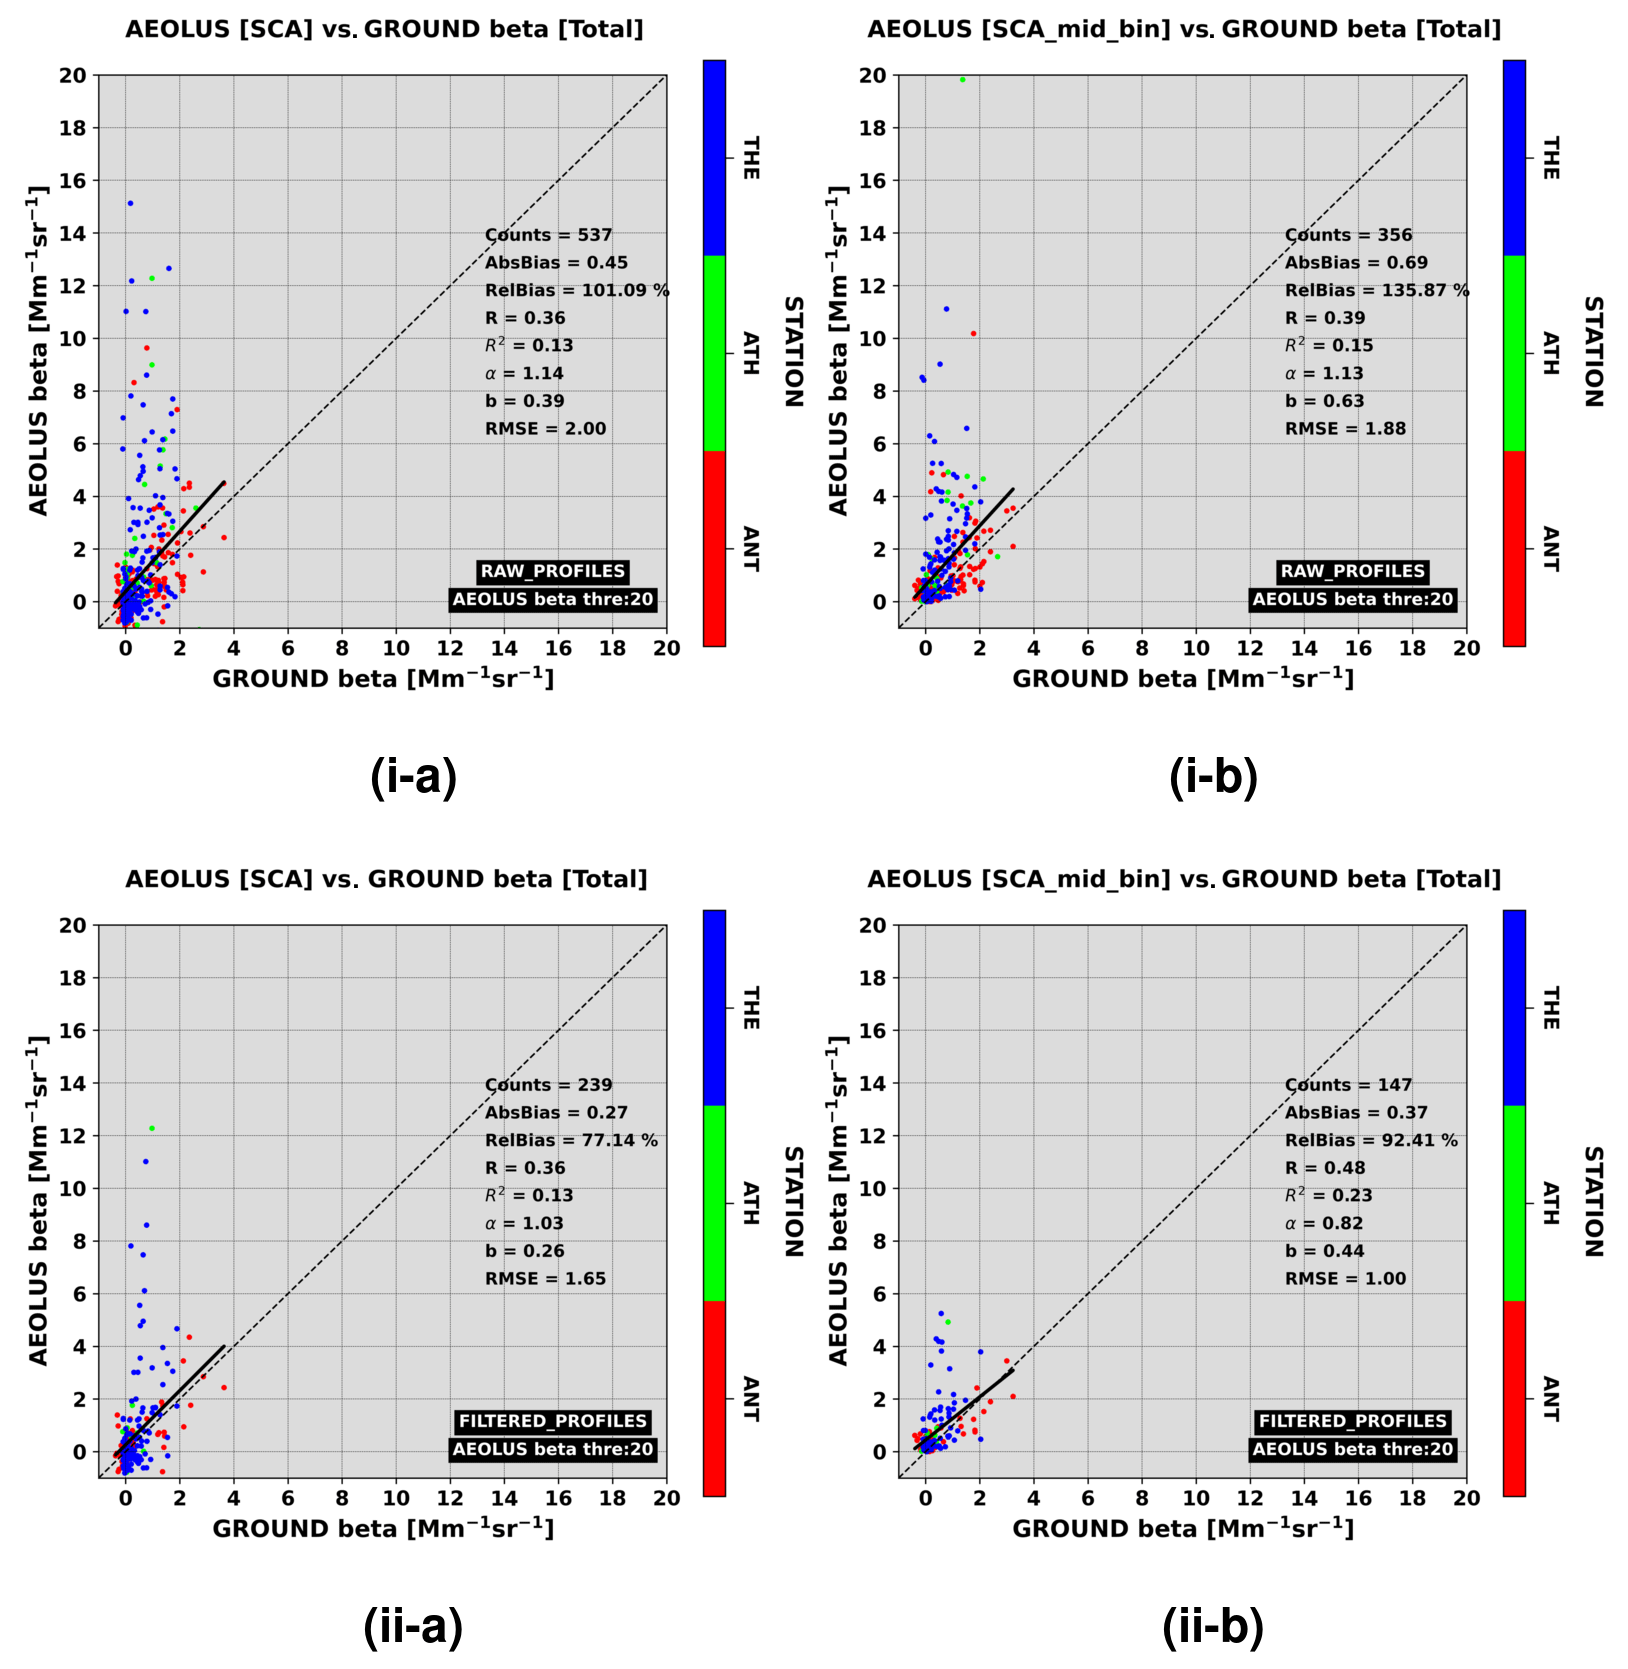
Figure 7Scatterplots between Aeolus (y axis) and ground-based (x axis) backscatter coefficient retrievals resolved based on the indices of Aeolus vertical bins (coloured circles). In the upper (i) and lower (ii) panels, the results for the unfiltered and filtered Aeolus profiles are depicted, respectively. In the left and right columns, the results corresponding to Aeolus regular (24 bins) and mid-bin (23 bins) vertical scales are illustrated, respectively. Aeolus backscatter values larger than 20 Mm−1 sr−1 are masked out from the collocated sample.
Table 1Statistical metrics for the unfiltered (cloud plus aerosol) Aeolus L2A SCA and SCA mid-bin backscatter (in Mm−1 sr−1) profiles at each PANACEA site.
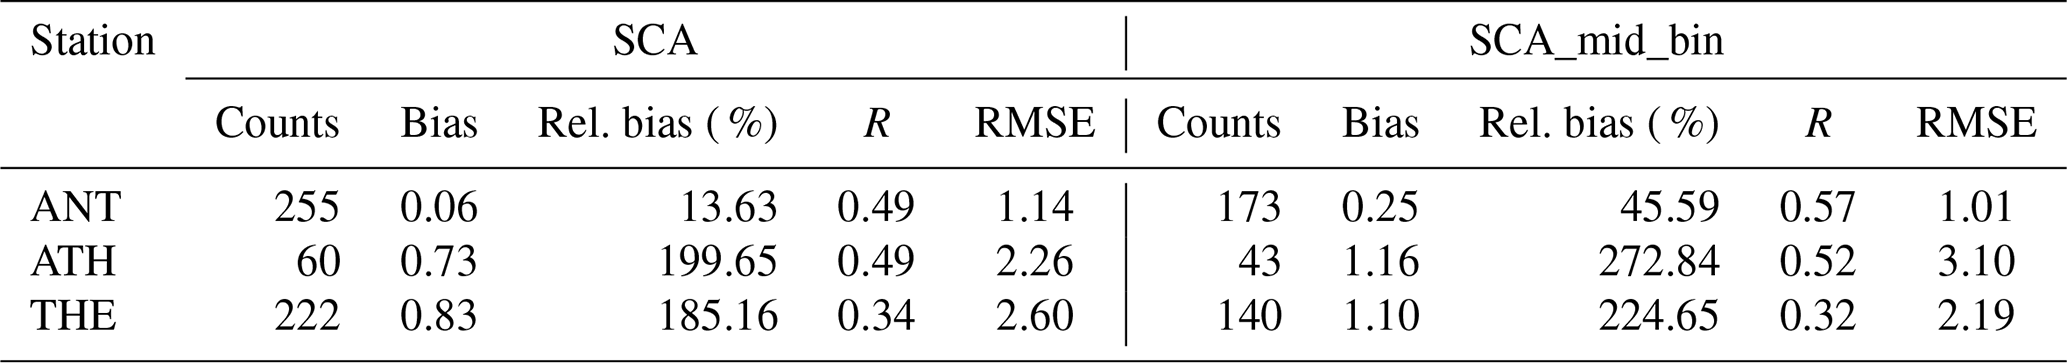
Table 2As in Table 1 but for the filtered (only aerosols) Aeolus backscatter retrievals (in Mm−1 sr−1).
Between dawn (descending) and dusk (ascending) orbits, better bias and RMSE scores are computed when Aeolus is flying during the early morning hours, while better R values are found during early afternoon satellite overpasses. However, our orbit-wise results are not robust, since the number of Aeolus overpasses is not evenly distributed (about 85 % of the SAT-GRD match-ups are acquired during dawn orbits). Among the three BRCs (red, blue or magenta) which can satisfy the defined SAT-GRD spatial criterion (see Sect. 5), the best metrics are found for the red BRC residing, in most of the cases, closer to the station site.
Throughout this assessment analysis, several critical points have been identified and highlighted that should be addressed adequately towards a comprehensive Cal/Val study of the Aeolus SCA products. These aspects can (i) serve as guidelines for future relevant studies, (ii) improve our understanding about the advantages and limitations of Aeolus data in terms of their usefulness and applicability in aerosol-related studies and (iii) suggest possible upgrades regarding ALADIN's observational capabilities, the considerations of the applied retrieval algorithms and the content of information in Aeolus SCA data.
A fair comparison of Aeolus SCA backscatter versus linear-derived retrievals acquired from ground-based lidars, when depolarizing particles are recorded, requires the conversion of the latter ones to circular co-polar (Aeolus-like) particles, following Paschou et al. (2022). Nevertheless, it should be acknowledged that the theoretical assumptions can be invalid either due to the orientation of the suspended particles (e.g. mineral dust; Ulanowski et al., 2007; Daskalopoulou et al., 2021; Mallios et al., 2021) or due to multiple scattering effects within optically thick aerosol layers (Wandinger et al., 2010). The lack of aerosol–cloud discrimination in Aeolus SCA data forces the synergistic implementation of ancillary data in order to remove cloud-contaminated Aeolus profiles from the collocated sample with the cloud-free, ground-based profiles. Nevertheless, it should be noted that the cloud removal itself is not perfect. In our case, we are relying on MSG-SEVIRI cloud observations, which are available at high temporal frequency (every 15 min), thus allowing a very good temporal collocation with Aeolus. The indirect cloud mask filtering applied to our analysis leads to a substantial improvement of the level of agreement between spaceborne and ground-based retrievals. Despite its success, our proposed approach provides a sufficient and acceptable solution but undoubtedly cannot be superior to the utility of a descriptive classification scheme for Aeolus retrieval algorithms similarly done in CALIOP-CALIPSO (Liu et al., 2019; Zeng et al., 2019).
Aeolus retrievals are available in a coarse along-track resolution (∼90 km). This imposes limitations on their evaluation against point measurements, which are further exacerbated at sites where the heterogeneity of aerosol loads in the surrounding area of the station is pronounced, taking into account that the spatial collocation between spaceborne and ground-based retrievals is not exact. Numerical outputs from reanalysis datasets (e.g. MERRA-2 and CAMS) can be utilized as an indicator of the burden of the horizontal variation of the aerosols, taking advantage of their complete spatial coverage, their availability at high temporal frequency and their reliability in terms of total AOD (Innes et al., 2019; Gueymard and Yang, 2020). Nevertheless, such data are better utilized in a qualitative rather than a quantitative way, particularly in terms of aerosol species, since they cannot be superior to actual aerosol observations. Over areas with a complex terrain, vertical inconsistencies between ground-based and satellite profiles (reported aboveground, where its height is defined with respect to the World Geodetic System (WGS) 84 ellipsoid; not physically explained) can be recorded. For the derivation of the evaluation scores, it is required a rescaling of the ground-based profiles, acquired at a finer vertical resolution, in order to match the dynamically defined Aeolus range bin settings. Nevertheless, due to this transformation, the shape of the raw ground-based profile can be distorted, and the magnitude of the retrieved optical properties can be modified substantially, thus affecting the evaluation metrics. This artefact is evident in cases where the vertical structure of the aerosol layers is highly variable, thus hindering the capability of Aeolus to accurately reproduce their geometrical features. Finally, the consideration of backward trajectories can assist the characterization of the probed atmospheric scene by Aeolus. Potentially, they can be also used as an additional criterion for the optimum selection of Aeolus BRC for the collocation with the ground-based measurements. However, possible limitations may arise due to temporal deviations among the FLEXPART run, the Aeolus overpass and ground-based retrievals, which might be critical when taking into account the strong spatiotemporal variability in aerosol loads across various scales.
The limited availability of vertically resolved aerosol products from space constitutes a major deficiency of the Global Observing System (GOS). The launch of the Aeolus ESA satellite was a major step in this direction, whereas the forthcoming EarthCARE satellite mission (Illingworth et al., 2015) will accelerate further these efforts. ALADIN, the single payload of the Aeolus satellite, constitutes the first UV HSRL Doppler lidar ever placed in space, and it is optimized to acquire HLOS (horizontal line-of-sight) wind profiles towards advancing numerical weather prediction (Rennie et al., 2021). ALADIN also independently retrieves the extinction and backscatter coefficients of aerosols and clouds (grouped as particulates according to Aeolus nomenclature) via the implementation of various retrieval algorithms (SCA, MLE and AEL-PRO).
The current work focuses on the assessment of the SCA backscatter coefficients versus ground-based retrievals acquired routinely by lidar systems operating in Athens, Thessaloniki and Antikythera. The aforementioned stations contribute to the PANACEA Greek National Research Infrastructure (Greek ACTRIS component) and to the European Aerosol Research Lidar Network (EARLINET; Pappalardo et al., 2014). Overall, 43 cases are analysed, out of which 12 have been identified in the urban site of Athens, 16 in Thessaloniki and 15 in the remote site of Antikythera island.
In the first part of the analysis, the focus was on the assessment of the Aeolus SCA particle backscatter coefficient, under specific aerosol scenarios, versus the corresponding measurements obtained at Antikythera island (southwestern Greece). The misdetection of the cross-polarized lidar return signals can cause lower Aeolus SCA backscatter values (ranging from 13 % to 33 %) with respect to ground-based retrievals when depolarizing mineral particles are probed (case of 10 July 2019). For the case of 3 July 2019, when aerosol loads of moderate intensity, consisting mainly of spherical particles, are confined below 4 km, and they are homogeneous in the surrounding area of the station, then the Aeolus SCA backscatter product is capable of reproducing the ground-based profile quite well in terms of shape and magnitude. For the cases of 8 July 2020 and 5 August 2020, the SCA performance, in terms of depicting complex stratified aerosol layers (composed of particles of different origin), as these are observed from ground, degrades due to noise in the cross-talk-corrected molecular and particulate signals.
Our statistical assessment analysis reveals that the removal of cloud-contaminated spaceborne profiles, achieved via the synergy with MSG-SEVIRI cloud observations, results in a significant improvement in the product performance. Unfortunately, the poor evaluation metrics at the lowermost bins (attributed to either the surface reflectance or the increased noise levels for the Aeolus retrievals and to the overlap issues for the ground-based profiles) are still evident after the cloud filtering procedure. Between the two Aeolus vertical scales, the computed evaluation metrics do not provide strong evidence of which of them performs better. Among the three stations (ATH, ANT and THE) considered here, the best agreement was found in the remote site of ANT island, in contrast to the urban sites of ATH and THE. All key Cal/Val aspects, serving as guidelines and potential recommendations for future studies, have been discussed thoroughly.
In the current work, we only emphasized the particle backscatter coefficient due to the limited number of ground-based extinction profiles. A wider assessment analysis is ongoing in the framework of the Aeolus L2A Cal/Val study performed within EARLINET. Finally, the best assessment of the Aeolus L2A products is expected versus the purpose-built eVe lidar (Paschou et al., 2022). Thanks to its configuration, eVe can mimic the Aeolus observational geometry and test the validity of the theoretical formulas applied for the derivation of the Aeolus-like backscatter from the linearly polarized emission ground-based systems. The first correlative Aeolus-eVe measurements have been performed in the framework of the Joint Aeolus Tropical Atlantic Campaign (JATAC) that took place in Cabo Verde in September 2021. Correlative measurements are also acquired during the ESA-ASKOS experimental campaign (Mindelo, Cabo Verde). The geographical location of Cabo Verde, situated on the corridor of the Saharan transatlantic transport (Gkikas et al., 2022), is ideal for assessing Aeolus performance when non-spherical mineral particles from the nearby deserts are advected westwards.
Aeolus Baseline 11 L2A data were obtained from the ESA Aeolus Online Dissemination System, which is available at https://aeolus-ds.eo.esa.int/oads/access/ (last access: 20 February 2023).
The supplement related to this article is available online at: https://doi.org/10.5194/amt-16-1017-2023-supplement.
AnGk performed the analysis and prepared the paper. AnGi, EM and MT provided the lidar data from Antikythera. KAV, KM and DB provided the lidar data from Thessaloniki. MM, CAP and AP provided the lidar data from Athens. AnGi, IB, NS, PP, KAV, EP, HB, AGS, DB, AP, TP and VA contributed to the scientific discussion. AK performed the FLEXPART simulations. VA supervised the analysis.
Publisher’s note: Copernicus Publications remains neutral with regard to jurisdictional claims in published maps and institutional affiliations.
This article is part of the special issue “Aeolus data and their application (AMT/ACP/WCD inter-journal SI)”. It is not associated with a conference.
Antonis Gkikas has been supported by the Hellenic Foundation for Research and Innovation (HFRI) under the “2nd Call for HFRI Research Projects to support Post-Doctoral Researchers” (project ATLANTAS; project no. 544). Vassilis Amiridis acknowledges support from the European Research Council (D-TECT; grant no. 725698). National Observatory of Athens (NOA) members acknowledge support from the Stavros Niarchos Foundation (SNF). We acknowledge support for this work by the project “PANhellenic infrastructure for Atmospheric Composition and climatE change” (grant no. MIS 5021516), which is implemented under the action “Reinforcement of the Research and Innovation Infrastructure”, funded by the Operational Programme “Competitiveness, Entrepreneurship and Innovation” (grant no. NSRF 2014-2020) and co-financed by Greece and the European Union (European Regional Development Fund). We thank the ACTRIS-2 and ACTRIS preparatory-phase projects that have received funding from the European Union's Horizon 2020 Framework Programme for Research and Innovation (grant no. 654109) and from the European Union's Horizon 2020 Coordination and Support Action (grant no. 739530), respectively. This research has also been supported by data and services obtained from the PANhellenic Geophysical Observatory of Antikythera (PANGEA) of the National Observatory of Athens (NOA). We acknowledge support by ESA, in the framework of the AEOLUS+ INNOVATION (Aeolus+I) call (contract no. 4000133130/20/I-BG//).
This research has been supported by the European Research Council, H2020 European Research Council (D-TECT; grant no. 725698).
This paper was edited by Oliver Lux and reviewed by four anonymous referees.
Abril-Gago, J., Guerrero-Rascado, J. L., Costa, M. J., Bravo-Aranda, J. A., Sicard, M., Bermejo-Pantaleón, D., Bortoli, D., Granados-Muñoz, M. J., Rodríguez-Gómez, A., Muñoz-Porcar, C., Comerón, A., Ortiz-Amezcua, P., Salgueiro, V., Jiménez-Martín, M. M., and Alados-Arboledas, L.: Statistical validation of Aeolus L2A particle backscatter coefficient retrievals over ACTRIS/EARLINET stations on the Iberian Peninsula, Atmos. Chem. Phys., 22, 1425–1451, https://doi.org/10.5194/acp-22-1425-2022, 2022.
Amiridis, V., Balis, D. S., Giannakaki, E., Stohl, A., Kazadzis, S., Koukouli, M. E., and Zanis, P.: Optical characteristics of biomass burning aerosols over Southeastern Europe determined from UV-Raman lidar measurements, Atmos. Chem. Phys., 9, 2431–2440, https://doi.org/10.5194/acp-9-2431-2009, 2009.
Amiridis, V., Giannakaki, E., Balis, D. S., Gerasopoulos, E., Pytharoulis, I., Zanis, P., Kazadzis, S., Melas, D., and Zerefos, C.: Smoke injection heights from agricultural burning in Eastern Europe as seen by CALIPSO, Atmos. Chem. Phys., 10, 11567–11576, https://doi.org/10.5194/acp-10-11567-2010, 2010.
Amiridis, V., Zerefos, C., Kazadzis, S., Gerasopoulos, E., Eleftheratos, K., Vrekoussis, M., Stohl, A., Mamouri, R. E., Kokkalis, P., Papayannis, A., Eleftheriadis, K., Diapouli, E., Keramitsoglou, I., Kontoes, C., Kotroni, V., Lagouvardos, K., Marinou, E., Giannakaki, E., Kostopoulou, E., Giannakopoulos, C., Richter, A., Burrows, J. P., and Mihalopoulos, N.: Impact of the 2009 Attica wildfires on the air quality in urban Athens, Atmos. Environ., 46, 536–544, https://doi.org/10.1016/j.atmosenv.2011.07.056, 2012.
Anderson, T. L., Charlson, R. J., Winker, D. M., Ogren, J. A., and Holmén, K.: Mesoscale Variations of Tropospheric Aerosols, J. Atmos. Sci., 60, 119–136, https://doi.org/10.1175/1520-0469(2003)060<0119:MVOTA>2.0.CO;2, 2003.
Ansmann, A., Wandinger, U., Riebesell, M., Weitkamp, C., and Michaelis, W.: Independent measurement of extinction and backscatter profiles in cirrus clouds by using a combined raman elastic-backscatter lidar, Appl. Optics, 31, 7113–7131, https://doi.org/10.1364/AO.31.007113, 1992.
Ansmann, A., Wandinger, U., Rille, O. L., Lajas, D., and Straume, A. G.: Particle backscatter and extinction profiling with the spaceborne high-spectral-resolution Doppler lidar ALADIN: methodology and simulations, Appl. Optics, 46, 6606–6622, https://doi.org/10.1364/AO.46.006606, 2007.
Ansmann, A., Petzold, A., Kandler, K., Tegen, I., Wendisch, M., Müller, D., Weinzierl, B., Müller, T., and Heintzenberg, J.: Saharan Mineral Dust Experiments SAMUM–1 and SAMUM–2: what have we learned?, Tellus B, 63, 403–429, https://doi.org/10.1111/j.1600-0889.2011.00555.x, 2011.
Antuña-Marrero, J. C., Landulfo, E., Estevan, R., Barja, B., Robock, A., Wolfram, E., Ristori, P., Clemesha, B., Zaratti, F., Forno, R., Armandillo, E., Bastidas, Á. E., de Frutos Baraja, Á. M., Whiteman, D. N., Quel, E., Barbosa, H. M. J., Lopes, F., Montilla-Rosero, E., and Guerrero-Rascado, J. L.: LALINET: The First Latin American–Born Regional Atmospheric Observational Network, B. Am. Meteorol. Soc., 98, 1255–1275, https://doi.org/10.1175/BAMS-D-15-00228.1, 2017.
Baars, H., Kanitz, T., Engelmann, R., Althausen, D., Heese, B., Komppula, M., Preißler, J., Tesche, M., Ansmann, A., Wandinger, U., Lim, J.-H., Ahn, J. Y., Stachlewska, I. S., Amiridis, V., Marinou, E., Seifert, P., Hofer, J., Skupin, A., Schneider, F., Bohlmann, S., Foth, A., Bley, S., Pfüller, A., Giannakaki, E., Lihavainen, H., Viisanen, Y., Hooda, R. K., Pereira, S. N., Bortoli, D., Wagner, F., Mattis, I., Janicka, L., Markowicz, K. M., Achtert, P., Artaxo, P., Pauliquevis, T., Souza, R. A. F., Sharma, V. P., van Zyl, P. G., Beukes, J. P., Sun, J., Rohwer, E. G., Deng, R., Mamouri, R.-E., and Zamorano, F.: An overview of the first decade of PollyNET: an emerging network of automated Raman-polarization lidars for continuous aerosol profiling, Atmos. Chem. Phys., 16, 5111–5137, https://doi.org/10.5194/acp-16-5111-2016, 2016.
Baars, H., Ansmann, A., Ohneiser, K., Haarig, M., Engelmann, R., Althausen, D., Hanssen, I., Gausa, M., Pietruczuk, A., Szkop, A., Stachlewska, I. S., Wang, D., Reichardt, J., Skupin, A., Mattis, I., Trickl, T., Vogelmann, H., Navas-Guzmán, F., Haefele, A., Acheson, K., Ruth, A. A., Tatarov, B., Müller, D., Hu, Q., Podvin, T., Goloub, P., Veselovskii, I., Pietras, C., Haeffelin, M., Fréville, P., Sicard, M., Comerón, A., Fernández García, A. J., Molero Menéndez, F., Córdoba-Jabonero, C., Guerrero-Rascado, J. L., Alados-Arboledas, L., Bortoli, D., Costa, M. J., Dionisi, D., Liberti, G. L., Wang, X., Sannino, A., Papagiannopoulos, N., Boselli, A., Mona, L., D'Amico, G., Romano, S., Perrone, M. R., Belegante, L., Nicolae, D., Grigorov, I., Gialitaki, A., Amiridis, V., Soupiona, O., Papayannis, A., Mamouri, R.-E., Nisantzi, A., Heese, B., Hofer, J., Schechner, Y. Y., Wandinger, U., and Pappalardo, G.: The unprecedented 2017–2018 stratospheric smoke event: decay phase and aerosol properties observed with the EARLINET, Atmos. Chem. Phys., 19, 15183–15198, https://doi.org/10.5194/acp-19-15183-2019, 2019.
Baars, H., Radenz, M., Floutsi, A. A., Engelmann, R., Althausen, D., Heese, B., Ansmann, A., Flament, T., Dabas, A., Trapon, D., Reitebuch, O., Bley, S., and Wandinger, U.: Californian wildfire smoke over Europe: A first example of the aerosol observing capabilities of Aeolus compared to ground-based lidar, Geophys. Res. Lett., 48, e2020GL092194, https://doi.org/10.1029/2020GL092194, 2021.
Balis, D., Amiridis, V., Nickovic, S., Papayannis, A., and Zerefos, C.: Optical properties of Saharan dust layers as detected by a Raman lidar at Thesaloniki, Greece, Geophys. Res. Lett., 31, L13104, https://doi.org/10.1029/2004GL019881, 2004.
Balis, D., Amiridis, V., Kazadzis, S., Papayannis, A., Tsaknakis, G., Tzortzakis, S., Kalivitis, N., Vrekoussis, M., Kanakidou, M., Mihalopoulos, N., Chourdakis, G., Nickovic, S., Pérez, C., Baldasano, J., and Drakakis, M.: Optical characteristics of desert dust over the East Mediterranean during summer: a case study, Ann. Geophys., 24, 807–821, https://doi.org/10.5194/angeo-24-807-2006, 2006.
Bohlmann, S., Baars, H., Radenz, M., Engelmann, R., and Macke, A.: Ship-borne aerosol profiling with lidar over the Atlantic Ocean: from pure marine conditions to complex dust–smoke mixtures, Atmos. Chem. Phys., 18, 9661–9679, https://doi.org/10.5194/acp-18-9661-2018, 2018.
Boucher, O., Randall, D., Artaxo, P., Bretherton, C., Feingold, G., Forster, P., Kerminen, V.-M., Kondo, Y., Liao, H., Lohmann, U., Rasch, P., Satheesh, S., Sherwood, S., Stevens, B., and Zhang, X.: Clouds and Aerosols, in: Climate Change 2013: The Physical Science Basis. Contribution of Working Group I to the Fifth Assessment Report of the Intergovernmental Panel on Climate Change, edited by: Stocker, T., Qin, D., Plattner, G.-K., Tignor, M., Allen, S., Boschung, J., Nauels, A., Xia, Y., Bex, V., and Midgley, P., Cambridge University Press, Cambridge, United Kingdom and New York, NY, USA, chap. 7, 571–658, https://doi.org/10.1017/CBO9781107415324.016, 2013.
Brioude, J., Arnold, D., Stohl, A., Cassiani, M., Morton, D., Seibert, P., Angevine, W., Evan, S., Dingwell, A., Fast, J. D., Easter, R. C., Pisso, I., Burkhart, J., and Wotawa, G.: The Lagrangian particle dispersion model FLEXPART-WRF version 3.1, Geosci. Model Dev., 6, 1889–1904, https://doi.org/10.5194/gmd-6-1889-2013, 2013.
Buchard, V., Randles, C. A., da Silva, A. M., Darmenov, A., Colarco, P. R., Govindaraju, R., Ferrare, R., Hair, J., Beyersdorf, A. J., Ziemba, L. D., and Yu, H.: The MERRA-2 aerosol reanalysis, 1980 onward. Part II: Evaluation and case studies, J. Climate, 30, 6851–6872, https://doi.org/10.1175/JCLI-D-16-0613.1, 2017.
Campbell, J. R., Hlavka, D. L., Welton, E. J., Flynn, C. J., Turner, D. D., Spinhirne, J. D., Scott, V. S., and Hwang, I. H.: Full-time eye-safe cloud and aerosol lidar observation at Atmospheric Radiation Measurement program sites: Instruments and data processing, J. Atmos. Ocean. Tech., 19, 431–442, 2002.
Charlson, R. J., Schwartz, S. E., Hales, J. M., Cess, R. D., Coakley, J. A., Hansen, J. E., and Hofmann, D. J.: Climate Forcing by Anthropogenic Aerosols, Science, 255, 423–430, https://doi.org/10.1126/science.255.5043.423, 1992.
Collis, R. and Russell, P.: Lidar measurement of particles and gases by elastic backscattering and differential absorption, in: Laser Monitoring of the Atmosphere. Topics in Applied Physics, edited by: Hinkley, E. D., Springer, Berlin, Heidelberg, 14, 71–151, https://doi.org/10.1007/3-540-07743-X_18, 1976.
D'Amico, G., Amodeo, A., Mattis, I., Freudenthaler, V., and Pappalardo, G.: EARLINET Single Calculus Chain – technical – Part 1: Pre-processing of raw lidar data, Atmos. Meas. Tech., 9, 491–507, https://doi.org/10.5194/amt-9-491-2016, 2016.
Daskalopoulou, V., Raptis, I. P., Tsekeri, A., Amiridis, V., Kazadzis, S., Ulanowski, Z., Metallinos, S., Tassis, K., and Martin, W.: Monitoring dust particle orientation with measurements of sunlight dichroic extinction, 15th International Conference on Meteorology, Climatology and Atmospheric Physics (COMECAP 2021), Ioannina, Greece, 26–29 September 2021, Zenodo [conference paper], https://doi.org/10.5281/zenodo.5075998, 2021.
Dubovik, O., Holben, B. N., Eck, T. F., Smirnov, A., Kaufman, Y. J., King, M. D., Tanré, D., and Slutsker, I.: Variability of Absorption and Optical Properties of Key Aerosol Types Observed in Worldwide Locations, J. Atmos. Sci., 59, 590–608, 2002.
ECMWF: ECMWF starts assimilating Aeolus wind data, ECMWF, https://www.ecmwf.int/en/about/media-centre/news/2020/ecmwf-starts-assimilating-aeolus-wind-data, last access: 12 June 2020.
Ehlers, F., Flament, T., Dabas, A., Trapon, D., Lacour, A., Baars, H., and Straume-Lindner, A. G.: Optimization of Aeolus' aerosol optical properties by maximum-likelihood estimation, Atmos. Meas. Tech., 15, 185–203, https://doi.org/10.5194/amt-15-185-2022, 2022.
Engelmann, R., Kanitz, T., Baars, H., Heese, B., Althausen, D., Skupin, A., Wandinger, U., Komppula, M., Stachlewska, I. S., Amiridis, V., Marinou, E., Mattis, I., Linné, H., and Ansmann, A.: The automated multiwavelength Raman polarization and water-vapor lidar PollyXT: the neXT generation, Atmos. Meas. Tech., 9, 1767–1784, https://doi.org/10.5194/amt-9-1767-2016, 2016.
Errera, Q., Bennouna, Y., Schulz, M., Eskes, H. J., Basart, S., Benedictow, A., Blechschmidt, A.-M., Chabrillat, S., Clark, H., Cuevas, E., Flentje, H., Hansen, K. M., Im, U., Kapsomenakis, J., Langerock, B., Petersen, K., Richter, A., Sudarchikova, N., Thouret, V., Wagner, A., Wang, Y., Warneke, T., and Zerefos, C.: Validation report of the CAMS global Reanalysis of aerosols and reactive gases, years 2003–2020, Copernicus Atmosphere Monitoring Service (CAMS) report, CAMS84_2018SC3_D5.1.1-2020, 2021, https://doi.org/10.24380/8gf9-k005, 2021.
ESA (European Space Agency): The four candidate Earth explorer core missions: Atmospheric dynamics mission, ESA Report for Mission Selection ESA SP, 1233, 145 pp., 1999.
ESA (European Space Agency): ADM-Aeolus Science Report, ESA SP-1311, 121 pp., https://earth.esa.int/documents/10174/1590943/AEOL002.pdf (last access: 24 February 2023), 2008.
ESA (European Space Agency): ADM-Aeolus Mission Requirements Document, ESA EOP-SM/2047, 57 pp., http://esamultimedia.esa.int/docs/EarthObservation/ADM-Aeolus_MRD.pdf (last access: 2 November 2019), 2016.
ESA Aeolus Online Dissemination System: https://aeolus-ds.eo.esa.int/oads/access/, last access: 20 February 2023.
Fernald, F. G.: Analysis of atmospheric lidar observations: some comments, Appl. Optics, 23, 652–653, https://doi.org/10.1364/AO.23.000652, 1984.
Flamant, P., Cuesta, J., Denneulin, M.-L., Dabas, A., and Huber, D.: ADM-Aeolus retrieval algorithms for aerosol and cloud products, Tellus A, 60, 273–288, https://doi.org/10.1111/j.1600-0870.2007.00287.x, 2008.
Flamant, P., Dabas, A., Martinet, P., Lever, V., Flament, T., Trapon, D., Olivier, M., Cuesta, J., and Huber, D.: Aeolus L2A Algorithm Theoretical Baseline Document, Particle optical properties product, version 5.7, https://earth.esa.int/eogateway/catalog/aeolus-l2a-aerosol-cloud-optical-product, last access: 14 December 2021.
Flament, T., Trapon, D., Lacour, A., Dabas, A., Ehlers, F., and Huber, D.: Aeolus L2A aerosol optical properties product: standard correct algorithm and Mie correct algorithm, Atmos. Meas. Tech., 14, 7851–7871, https://doi.org/10.5194/amt-14-7851-2021, 2021.
Freudenthaler, V.: About the effects of polarising optics on lidar signals and the Δ90 calibration, Atmos. Meas. Tech., 9, 4181–4255, https://doi.org/10.5194/amt-9-4181-2016, 2016.
Gelaro, R, McCarty, W., Suárez, M. J., Todling, R., Molod, A., Takacs, L., Randles, C. A., Darmenov, A., Bosilovich, M. G., Reichle, R., Wargan, K., Coy, L., Cullather, R., Draper, C., Akella, S., Buchard, V., Conaty, A., da Silva, A. M., Gu, W., Kim, G., Koster, R., Lucchesi, R., Merkova, D., Nielsen, J. E., Partyka, G., Pawson, S., Putman, W., Rienecker, M., Schubert, S. D., Sienkiewicz, M., and Zhao, B.: The Modern-Era Retrospective Analysis for Research and Applications, Version 2 (MERRA-2), J. Climate, 30, 5419–5454, https://doi.org/10.1175/JCLI-D-16-0758.1, 2017.
Gerasopoulos, E., Andreae, M. O., Zerefos, C. S., Andreae, T. W., Balis, D., Formenti, P., Merlet, P., Amiridis, V., and Papastefanou, C.: Climatological aspects of aerosol optical properties in Northern Greece, Atmos. Chem. Phys., 3, 2025–2041, https://doi.org/10.5194/acp-3-2025-2003, 2003.
Gerasopoulos, E., Amiridis, V., Kazadzis, S., Kokkalis, P., Eleftheratos, K., Andreae, M. O., Andreae, T. W., El-Askary, H., and Zerefos, C. S.: Three-year ground based measurements of aerosol optical depth over the Eastern Mediterranean: the urban environment of Athens, Atmos. Chem. Phys., 11, 2145–2159, https://doi.org/10.5194/acp-11-2145-2011, 2011.
Gialitaki, A., Tsekeri, A., Amiridis, V., Ceolato, R., Paulien, L., Kampouri, A., Gkikas, A., Solomos, S., Marinou, E., Haarig, M., Baars, H., Ansmann, A., Lapyonok, T., Lopatin, A., Dubovik, O., Groß, S., Wirth, M., Tsichla, M., Tsikoudi, I., and Balis, D.: Is the near-spherical shape the “new black” for smoke?, Atmos. Chem. Phys., 20, 14005–14021, https://doi.org/10.5194/acp-20-14005-2020, 2020.
Giles, D. M., Sinyuk, A., Sorokin, M. G., Schafer, J. S., Smirnov, A., Slutsker, I., Eck, T. F., Holben, B. N., Lewis, J. R., Campbell, J. R., Welton, E. J., Korkin, S. V., and Lyapustin, A. I.: Advancements in the Aerosol Robotic Network (AERONET) Version 3 database – automated near-real-time quality control algorithm with improved cloud screening for Sun photometer aerosol optical depth (AOD) measurements, Atmos. Meas. Tech., 12, 169–209, https://doi.org/10.5194/amt-12-169-2019, 2019.
Gkikas, A., Hatzianastassiou, N., Mihalopoulos, N., Katsoulis, V., Kazadzis, S., Pey, J., Querol, X., and Torres, O.: The regime of intense desert dust episodes in the Mediterranean based on contemporary satellite observations and ground measurements, Atmos. Chem. Phys., 13, 12135–12154, https://doi.org/10.5194/acp-13-12135-2013, 2013.
Gkikas, A., Houssos, E. E., Lolis, C. J., Bartzokas, A., Mihalopoulos, N., and Hatzianastassiou, N.: Atmospheric circulation evolution related to desert-dust episodes over the Mediterranean, Q. J. Roy. Meteor. Soc., 141, 1634–1645, https://doi.org/10.1002/qj.2466, 2015.
Gkikas, A., Basart, S., Hatzianastassiou, N., Marinou, E., Amiridis, V., Kazadzis, S., Pey, J., Querol, X., Jorba, O., Gassó, S., and Baldasano, J. M.: Mediterranean intense desert dust outbreaks and their vertical structure based on remote sensing data, Atmos. Chem. Phys., 16, 8609–8642, https://doi.org/10.5194/acp-16-8609-2016, 2016.
Gkikas, A., Obiso, V., Pérez García-Pando, C., Jorba, O., Hatzianastassiou, N., Vendrell, L., Basart, S., Solomos, S., Gassó, S., and Baldasano, J. M.: Direct radiative effects during intense Mediterranean desert dust outbreaks, Atmos. Chem. Phys., 18, 8757–8787, https://doi.org/10.5194/acp-18-8757-2018, 2018.
Gkikas, A., Proestakis, E., Amiridis, V., Kazadzis, S., Di Tomaso, E., Marinou, E., Hatzianastassiou, N., Kok, J. F., and García-Pando, C. P.: Quantification of the dust optical depth across spatiotemporal scales with the MIDAS global dataset (2003–2017), Atmos. Chem. Phys., 22, 3553–3578, https://doi.org/10.5194/acp-22-3553-2022, 2022.
Gueymard, C. A. and Yang, D.: Worldwide validation of CAMS and MERRA-2 reanalysis aerosol optical depth products using 15 years of AERONET observations, Atmos. Environ., 225, 117216, https://doi.org/10.1016/j.atmosenv.2019.117216, 2020.
Haywood, J. M., Abel, S. J., Barrett, P. A., Bellouin, N., Blyth, A., Bower, K. N., Brooks, M., Carslaw, K., Che, H., Coe, H., Cotterell, M. I., Crawford, I., Cui, Z., Davies, N., Dingley, B., Field, P., Formenti, P., Gordon, H., de Graaf, M., Herbert, R., Johnson, B., Jones, A. C., Langridge, J. M., Malavelle, F., Partridge, D. G., Peers, F., Redemann, J., Stier, P., Szpek, K., Taylor, J. W., Watson-Parris, D., Wood, R., Wu, H., and Zuidema, P.: The CLoud–Aerosol–Radiation Interaction and Forcing: Year 2017 (CLARIFY-2017) measurement campaign, Atmos. Chem. Phys., 21, 1049–1084, https://doi.org/10.5194/acp-21-1049-2021, 2021.
Health Effects Institute: State of Global Air 2019, Special Report, Health Effects Institute, Boston, MA, ISSN 2578-6873, https://www.stateofglobalair.org/sites/default/files/soga_2019_report.pdf (last access: 20 February 2023), 2019.
Illingworth, A. J., Barker, H. W., Beljaars, A., Ceccaldi, M., Chepfer, H., Clerbaux, N., Cole, J., Delanoë, J., Domenech, C., Donovan, D. P., Fukuda, S., Hirakata, M., Hogan, R. J., Huenerbein, A., Kollias, P., Kubota, T., Nakajima, T., Nakajima, T. Y., Nishizawa, T., Ohno, Y., Okamoto, H., Oki, R., Sato, K., Satoh, M., Shephard, M. W., Velázquez-Blázquez, A., Wandinger, U., Wehr, T., and van Zadelhoff, G.-J.: The EarthCARE Satellite: The Next Step Forward in Global Measurements of Clouds, Aerosols, Precipitation, and Radiation, B. Am. Meteorol. Soc., 96, 1311–1332, https://doi.org/10.1175/BAMS-D-12-00227.1, 2015.
Inness, A., Ades, M., Agustí-Panareda, A., Barré, J., Benedictow, A., Blechschmidt, A.-M., Dominguez, J. J., Engelen, R., Eskes, H., Flemming, J., Huijnen, V., Jones, L., Kipling, Z., Massart, S., Parrington, M., Peuch, V.-H., Razinger, M., Remy, S., Schulz, M., and Suttie, M.: The CAMS reanalysis of atmospheric composition, Atmos. Chem. Phys., 19, 3515–3556, https://doi.org/10.5194/acp-19-3515-2019, 2019.
Isaksen, L. and Rennie, M.: A preliminary evaluation of using Aeolus L2B Winds in ECMWF's NWP system, with focus on the tropical region, in: ESA Living Planet Symposium 2019, Milan, Italy, 13–17 May 2019, https://lps19.esa.int/NikalWebsitePortal/living-planet-symposium-2019/lps19/Agenda/AgendaItemDetail?id=64570099-bea7-4b8f-a54b-5b6ad81fa342 (last access: 8 May 2020), 2019.
Jickells, T. D., An, Z. S., Andersen, K. K., Baker, A. R., Bergametti, G., Brooks, N., Cao, J. J., Boyd, P. W., Duce, R. A., Hunter, K. A., Kawahata, H., Kubilay, N., laRoche, J., Liss, P. S., Mahowald, N., Prospero, J. M., Ridgwell, A. J., Tegen, I., and Torres, R.: Global Iron Connections Between Desert Dust, Ocean Biogeochemistry, and Climate, Science, 308, 67–71, https://doi.org/10.1126/science.1105959, 2005.
Kampouri, A., Amiridis, V., Solomos, S., Gialitaki, A., Marinou, E., Spyrou, C., Georgoulias, A. K., Akritidis, D., Papagiannopoulos, N., Mona, L., Scollo, S., Tsichla, M., Tsikoudi, I., Pytharoulis, I., Karacostas, T., and Zanis, P.: Investigation of Volcanic Emissions in the Mediterranean: “The Etna–Antikythera Connection”, Atmosphere, 12, 40, https://doi.org/10.3390/atmos12010040, 2021.
Kanakidou, M., Mihalopoulos, N., Kindap, T., Im, U., Vrekoussis, M., Gerasopoulos, E., Dermitzaki, E., Unal, A., Kocak, M., Markakis, K., Melas, D., Kouvarakis, G., Youssef, A. F., Richter, A., Hatzianastassiou, N., Hilboll, A., Ebojie, F., Wittrock, F., von Savigny, C., Burrows, J. P., Ladstaetter-Weissenmayer, A., and Moubasher, H.: Megacities as hot spots of air pollution in the East Mediterranean, Atmos. Environ., 45, 1223–1235, https://doi.org/10.1016/j.atmosenv.2010.11.048, 2011.
Kanitz, T., Lochard, J., Marshall, J., McGoldrick, P., Lecrenier, O., Bravetti, P., Reitebuch, O., Rennie, M., Wernham, D., and Elfving, A.: Aeolus first light: first glimpse, in: International Conference on Space Optics – ICSO 2018, Chania, Greece, 9–12 October 2018, SPIE, 11180, 659–664, https://doi.org/10.1117/12.2535982, 2019.
Klett, J. D.: Stable analytical inversion solution for processing lidar returns, Appl. Optics, 20, 211–220, https://doi.org/10.1364/AO.20.000211, 1981.
Kosmopoulos, P. G., Kazadzis, S., El-Askary, H., Taylor, M., Gkikas, A., Proestakis, E., Kontoes, C., and El-Khayat, M. M.: Earth-Observation-Based Estimation and Forecasting of Particulate Matter Impact on Solar Energy in Egypt, Remote Sens., 10, 1870, https://doi.org/10.3390/rs10121870, 2018.
Lee, L., Zhang, J., Reid, J. S., and Yorks, J. E.: Investigation of CATS aerosol products and application toward global diurnal variation of aerosols, Atmos. Chem. Phys., 19, 12687–12707, https://doi.org/10.5194/acp-19-12687-2019, 2019.
Lelieveld, J., Berresheim, H., Borrmann, S., Crutzen, P. J., Dentener, F. J., Fischer, H., Feichter, J., Flatau, P. J., Heland, J., Holzinger, R., Korrmann, R., Lawrence, M. G., Levin, Z., Markowicz, K. M., Mihalopoulos, N., Minikin, A., Ramanathan, V., de Reus, M., Roelofs, G. J., Scheeren, H. A., Sciare, J., Schlager, H., Schultz, M., Siegmund, P., Steil, B., Stephanou, E. G., Stier, P., Traub, M., Warneke, C., Williams, J., and Ziereis, H.: Global Air Pollution Crossroads over the Mediterranean, Science, 298, 794–799, https://doi.org/10.1126/science.1075457, 2002.
Lelieveld, J., Evans, J. S., Fnais, M., Giannadaki, D., and Pozzer, A.: The contribution of outdoor air pollution sources to premature mortality on a global scale, Nature, 525, 367–371, https://doi.org/10.1038/nature15371, 2015.
Levy, R. C., Mattoo, S., Munchak, L. A., Remer, L. A., Sayer, A. M., Patadia, F., and Hsu, N. C.: The Collection 6 MODIS aerosol products over land and ocean, Atmos. Meas. Tech., 6, 2989–3034, https://doi.org/10.5194/amt-6-2989-2013, 2013.
Li, J., Carlson, B. E., Yung, Y. L., Lv, D., Hansen, J., Penner, J. E., Liao, H., Ramaswamy, V., Kahn, R. A., Zhang, P., Dubovik, O., Ding, A., Lacis, A. A., Zhang, L., and Dong, Y.: Scattering and absorbing aerosols in the climate system, Nature Reviews Earth & Environment, 3, 363–379, https://doi.org/10.1038/s43017-022-00296-7, 2022.
Li, W., El-Askary, H., Qurban, M. A., Proestakis, E., Garay, M. J., Kalashnikova, O. V., Amiridis, V., Gkikas, A., Marinou, E., Piechota, T., and Manikandan, K. P.: An Assessment of Atmospheric and Meteorological Factors Regulating Red Sea Phytoplankton Growth, Remote Sens., 10, 673, https://doi.org/10.3390/rs10050673, 2018.
Liu, D., Wang, Z., Liu, Z., Winker, D., and Trepte, C.: A height resolved global view of dust aerosols from the first year CALIPSO lidar measurements, J. Geophys. Res.-Atmos., 113, D16214, https://doi.org/10.1029/2007JD009776, 2008.
Liu, Z., Kar, J., Zeng, S., Tackett, J., Vaughan, M., Avery, M., Pelon, J., Getzewich, B., Lee, K.-P., Magill, B., Omar, A., Lucker, P., Trepte, C., and Winker, D.: Discriminating between clouds and aerosols in the CALIOP version 4.1 data products, Atmos. Meas. Tech., 12, 703–734, https://doi.org/10.5194/amt-12-703-2019, 2019.
Lux, O., Lemmerz, C., Weiler, F., Marksteiner, U., Witschas, B., Rahm, S., Geiß, A., and Reitebuch, O.: Intercomparison of wind observations from the European Space Agency's Aeolus satellite mission and the ALADIN Airborne Demonstrator, Atmos. Meas. Tech., 13, 2075–2097, https://doi.org/10.5194/amt-13-2075-2020, 2020.
Lux, O., Lemmerz, C., Weiler, F., Marksteiner, U., Witschas, B., Rahm, S., Geiß, A., Schäfler, A., and Reitebuch, O.: Retrieval improvements for the ALADIN Airborne Demonstrator in support of the Aeolus wind product validation, Atmos. Meas. Tech., 15, 1303–1331, https://doi.org/10.5194/amt-15-1303-2022, 2022.
Mallios, S. A., Daskalopoulou, V., and Amiridis, V.: Orientation of non spherical prolate dust particles moving vertically in the Earth's atmosphere, J. Aerosol Sci., 151, 105657, https://doi.org/10.1016/j.jaerosci.2020.105657, 2021.
Marinou, E., Amiridis, V., Binietoglou, I., Tsikerdekis, A., Solomos, S., Proestakis, E., Konsta, D., Papagiannopoulos, N., Tsekeri, A., Vlastou, G., Zanis, P., Balis, D., Wandinger, U., and Ansmann, A.: Three-dimensional evolution of Saharan dust transport towards Europe based on a 9-year EARLINET-optimized CALIPSO dataset, Atmos. Chem. Phys., 17, 5893–5919, https://doi.org/10.5194/acp-17-5893-2017, 2017.
Martin, A., Weissmann, M., Reitebuch, O., Rennie, M., Geiß, A., and Cress, A.: Validation of Aeolus winds using radiosonde observations and numerical weather prediction model equivalents, Atmos. Meas. Tech., 14, 2167–2183, https://doi.org/10.5194/amt-14-2167-2021, 2021.
Matthias, V., Freudenthaler, V., Amodeo, A., Balin, I., Balis, D., Bösenberg, J., Chaikovsky, A., Chourdakis, G., Comeron, A., Delaval, A., De Tomasi, F., Eixmann, R., Hågård, A., Komguem, L., Kreipl, S., Matthey, R., Rizi, V., Rodrigues, J., Wandinger, U., and Wang, X.: Aerosol lidar intercomparison in the framework of the EARLINET project. 1. Instruments, Appl. Optics, 43, 961–976, https://doi.org/10.1364/AO.43.000961, 2004.
Mattis, I., D'Amico, G., Baars, H., Amodeo, A., Madonna, F., and Iarlori, M.: EARLINET Single Calculus Chain – technical – Part 2: Calculation of optical products, Atmos. Meas. Tech., 9, 3009–3029, https://doi.org/10.5194/amt-9-3009-2016, 2016.
McGill, M. J., Yorks, J. E., Scott, V. S., Kupchock, A. W., and Selmer, P. A.: The Cloud-Aerosol Transport System (CATS): a technology demonstration on the International Space Station, in: Proc. SPIE 9612, Lidar Remote Sensing for Environmental Monitoring XV, San Diego, California, United States, 9–13 August 2015, SPIE, 96120A, https://doi.org/10.1117/12.2190841, 2015.
Middleton, N., Tozer, P., and Tozer, B.: Sand and dust storms: underrated natural hazards, Disasters, 43, 390–409, https://doi.org/10.1111/disa.12320, 2018.
Mishchenko, M. I. and Hovenier, J. W.: Depolarization of light backscattered by randomly oriented nonspherical particles, Opt. Lett., 20, 1356–1358, https://doi.org/10.1364/OL.20.001356, 1995.
Müller, D., Ansmann, A., Mattis, I., Tesche, M., Wandinger, U., Althausen, D., and Pisani, G.: Aerosol-type-dependent lidar ratios observed with raman lidar, J. Geophys. Res., 112, D16202, https://doi.org/10.1029/2006JD008292, 2007.
Okin, G. S., Mahowald, N., Chadwick, O. A. and Artaxo, P.: Impact of desert dust on the biogeochemistry of phosphorus in terrestrial ecosystems, Global Biogeochem. Cy., 18, GB2005, https://doi.org/10.1029/2003GB002145, 2004.
O'Neill, N. T., Eck, T. F., Smirnov, A., Holben, B. N., and Thulasiraman, S.: Spectral discrimination of coarse and fine mode optical depth, J. Geophys. Res., 108, 4559–4573, https://doi.org/10.1029/2002JD002975, 2003.
Papagiannopoulos, N., D'Amico, G., Gialitaki, A., Ajtai, N., Alados-Arboledas, L., Amodeo, A., Amiridis, V., Baars, H., Balis, D., Binietoglou, I., Comerón, A., Dionisi, D., Falconieri, A., Fréville, P., Kampouri, A., Mattis, I., Mijić, Z., Molero, F., Papayannis, A., Pappalardo, G., Rodríguez-Gómez, A., Solomos, S., and Mona, L.: An EARLINET early warning system for atmospheric aerosol aviation hazards, Atmos. Chem. Phys., 20, 10775–10789, https://doi.org/10.5194/acp-20-10775-2020, 2020.
Papayannis, A., Balis, D., Amiridis, V., Chourdakis, G., Tsaknakis, G., Zerefos, C., Castanho, A. D. A., Nickovic, S., Kazadzis, S., and Grabowski, J.: Measurements of Saharan dust aerosols over the Eastern Mediterranean using elastic backscatter-Raman lidar, spectrophotometric and satellite observations in the frame of the EARLINET project, Atmos. Chem. Phys., 5, 2065–2079, https://doi.org/10.5194/acp-5-2065-2005, 2005.
Pappalardo, G., Wandinger, U., Mona, L., Hiebsch, A., Mattis, I., Amodeo, A., Ansmann, A., Seifert, P., Linne, H., Apituley, A., Alados Arboledas, L., Balis, D., Chaikovsky, A., D'Amico, G., De Tomasi, F., Freudenthaler, V., Giannakaki, E., Giunta, A., Grigorov, I., Iarlori, M., Madonna, F., Mamouri, R.-E., Nasti, L., Papayannis, A., Pietruczuk, A., Pujadas, M., Rizi, V., Rocadenbosch, F., Russo, F., Schnell, F., Spinelli, N., Wang, X., and Wiegner, M.: EARLINET correlative measurements for CALIPSO: First intercomparison results, J. Geophys. Res., 115, D00H19, https://doi.org/10.1029/2009JD012147, 2010.
Pappalardo, G., Amodeo, A., Apituley, A., Comeron, A., Freudenthaler, V., Linné, H., Ansmann, A., Bösenberg, J., D'Amico, G., Mattis, I., Mona, L., Wandinger, U., Amiridis, V., Alados-Arboledas, L., Nicolae, D., and Wiegner, M.: EARLINET: towards an advanced sustainable European aerosol lidar network, Atmos. Meas. Tech., 7, 2389–2409, https://doi.org/10.5194/amt-7-2389-2014, 2014.
Paschou, P., Siomos, N., Tsekeri, A., Louridas, A., Georgoussis, G., Freudenthaler, V., Binietoglou, I., Tsaknakis, G., Tavernarakis, A., Evangelatos, C., von Bismarck, J., Kanitz, T., Meleti, C., Marinou, E., and Amiridis, V.: The eVe reference polarisation lidar system for the calibration and validation of the Aeolus L2A product, Atmos. Meas. Tech., 15, 2299–2323, https://doi.org/10.5194/amt-15-2299-2022, 2022.
Pérez, C., Nickovic, S., Pejanovic, G., Baldasano, J. M., and Özsoy, E.: Interactive dust-radiation modeling: A step to improve weather forecasts, J. Geophys. Res., 111, D16206, https://doi.org/10.1029/2005JD006717, 2006.
Pisso, I., Sollum, E., Grythe, H., Kristiansen, N. I., Cassiani, M., Eckhardt, S., Arnold, D., Morton, D., Thompson, R. L., Groot Zwaaftink, C. D., Evangeliou, N., Sodemann, H., Haimberger, L., Henne, S., Brunner, D., Burkhart, J. F., Fouilloux, A., Brioude, J., Philipp, A., Seibert, P., and Stohl, A.: FLEXPART 10.4, Version 10.4, Geosci. Model Dev. Discuss., Zenodo [code], https://doi.org/10.5281/zenodo.3542278, 2019.
Pöschl, U.: Atmospheric Aerosols: Composition, Transformation, Climate and Health Effects, Angew. Chem. Int. Edit., 44, 7520–7540, https://doi.org/10.1002/anie.200501122, 2005.
Proestakis, E., Amiridis, V., Marinou, E., Georgoulias, A. K., Solomos, S., Kazadzis, S., Chimot, J., Che, H., Alexandri, G., Binietoglou, I., Daskalopoulou, V., Kourtidis, K. A., de Leeuw, G., and van der A, R. J.: Nine-year spatial and temporal evolution of desert dust aerosols over South and East Asia as revealed by CALIOP, Atmos. Chem. Phys., 18, 1337–1362, https://doi.org/10.5194/acp-18-1337-2018, 2018.
Proestakis, E., Amiridis, V., Marinou, E., Binietoglou, I., Ansmann, A., Wandinger, U., Hofer, J., Yorks, J., Nowottnick, E., Makhmudov, A., Papayannis, A., Pietruczuk, A., Gialitaki, A., Apituley, A., Szkop, A., Muñoz Porcar, C., Bortoli, D., Dionisi, D., Althausen, D., Mamali, D., Balis, D., Nicolae, D., Tetoni, E., Liberti, G. L., Baars, H., Mattis, I., Stachlewska, I. S., Voudouri, K. A., Mona, L., Mylonaki, M., Perrone, M. R., Costa, M. J., Sicard, M., Papagiannopoulos, N., Siomos, N., Burlizzi, P., Pauly, R., Engelmann, R., Abdullaev, S., and Pappalardo, G.: EARLINET evaluation of the CATS Level 2 aerosol backscatter coefficient product, Atmos. Chem. Phys., 19, 11743–11764, https://doi.org/10.5194/acp-19-11743-2019, 2019.
Pye, H. O. T., Ward-Caviness, C. K., Murphy, B. N., Appel, K. W., and Seltzer, K. M.: Secondary organic aerosol association with cardiorespiratory disease mortality in the United States, Nat. Commun., 12, 7215, https://doi.org/10.1038/s41467-021-27484-1, 2021.
Randles, C. A., da Silva, A. M., Buchard, V., Colarco, P. R., Darmenov, A., Govindaraju, R., Smirnov, A., Holben, B., Ferrare, R., Hair, J., Shinozuka, Y., Flynn, C. J., Randles, C. A., Silva, A. M. da, Buchard, V., Colarco, P. R., Darmenov, A., Govindaraju, R., Smirnov, A., Holben, B., Ferrare, R., Hair, J., Shinozuka, Y., and Flynn, C. J.: The MERRA-2 Aerosol Reanalysis, 1980 Onward. Part I: System Description and Data Assimilation Evaluation, J. Climate, 30, 6823–6850, https://doi.org/10.1175/JCLI-D-16-0609.1, 2017.
Reitebuch, O., Lemmerz, C., Lux, O., Marksteiner, U., Rahm, S., Weiler, F., Witschas, B., Meringer, M., Schmidt, K., Huber, D., Nikolaus, I., Geiss, A., Vaughan, M., Dabas, A., Flament, T., Stieglitz, H., Isaksen, L., Rennie, M., de Kloe, J., Marseille, G.-J., Stoffelen, A., Wernham, D., Kanitz, T., Straume, A.-G., Fehr, T., von Bismarck, J., Floberghagen, R., and Parrinello, T.: Initial Assessment of the Performance of the First Wind Lidar in Space on Aeolus, EPJ Web Conf., 237, 01010, https://doi.org/10.1051/epjconf/202023701010, 2020.
Remer, L. A., Kleidman, R. G., Levy, R. C., Kaufman, Y. J., Tanré, D., Mattoo, S., Martins, J. V., Ichoku, C., Koren, I., Yu, H., and Holben, B. N.: Global aerosol climatology from the MODIS satellite sensors, J. Geophys. Res.-Atmos., 113, D14S07, https://doi.org/10.1029/2007JD009661, 2008.
Rennie, M. P. and Isaksen, L.: Investigations Into the Quality of Aeolus L2B Winds Using the ECMWF Model and Initial NWP Impact Assessment, in: ESA Living Planet Symposium 2019, Milan, Italy, 13–17 May 2019, https://lps19.esa.int/NikalWebsitePortal/living-planet-symposium-2019/lps19/Agenda/AgendaItemDetail?id=1a3d272c-f7d1-4847-b1c4-08c452f9405f (last access: 8 May 2020), 2019.
Rennie, M. P., Isaksen, L., Weiler, F., de Kloe, J., Kanitz, T., and Reitebuch, O.: The impact of Aeolus wind retrievals on ECMWF global weather forecasts, Q. J. Roy. Meteor. Soc., 147, 3555–3586, https://doi.org/10.1002/qj.4142, 2021.
Richardson, S. C., Mytilinaios, M., Foskinis, R., Kyrou, C., Papayannis, A., Pyrri, I., Giannoutsou, E., and Adamakis, I. D. S.: Bioaerosol detection over Athens, Greece using the laser induced fluorescence technique, Sci. Total Environ., 696, 133906, https://doi.org/10.1016/j.scitotenv.2019.133906, 2019.
Roy, G. and Roy, N.: Relation between circular and linear depolarization ratios under multiple-scattering conditions, Appl. Optics, 47, 6563–6579, https://doi.org/10.1364/ao.47.006563, 2008.
Sasano, Y. and Nakane, H.: Significance of the extinction/backscatter ratio and the boundary value term in the solution for the two-component lidar equation, Appl. Optics, 23, 11_1–13, https://doi.org/10.1364/AO.23.0011_1, 1984.
Sayer, A. M., Hsu, N. C., Bettenhausen, C., and Jeong, M.-J.: Validation and uncertainty estimates for MODIS Collection 6 “Deep Blue” aerosol data, J. Geophys. Res., 118, 7864–7873, https://doi.org/10.1002/jgrd.50600, 2013.
Schmetz, J., Pili, P., Tjemkes, S., Just, D., Kerkmann, J., Rota, S., and Ratier, A.: An introduction to Meteosat Second Generation (MSG), B. Am. Meteorol. Soc., 83, 977–992, https://doi.org/10.1175/1520-0477(2002)083<0977:AITMSG>2.3.CO;2, 2002.
Shinozuka, Y. and Redemann, J.: Horizontal variability of aerosol optical depth observed during the ARCTAS airborne experiment, Atmos. Chem. Phys., 11, 8489–8495, https://doi.org/10.5194/acp-11-8489-2011, 2011.
Shipley, S. T., Tracy, D. H., Eloranta, E. W., Trauger, J. T., Sroga, J. T., Roesler, F. L., and Weinman, J. A.: High spectral resolution lidar to measure optical scattering properties of atmospheric aerosols. 1: Theory and instrumentation, Appl. Optics, 22, 3716–3724, https://doi.org/10.1364/AO.22.003716, 1983.
Sinyuk, A., Holben, B. N., Eck, T. F., Giles, D. M., Slutsker, I., Korkin, S., Schafer, J. S., Smirnov, A., Sorokin, M., and Lyapustin, A.: The AERONET Version 3 aerosol retrieval algorithm, associated uncertainties and comparisons to Version 2, Atmos. Meas. Tech., 13, 3375–3411, https://doi.org/10.5194/amt-13-3375-2020, 2020.
Siomos, N., Balis, D. S., Voudouri, K. A., Giannakaki, E., Filioglou, M., Amiridis, V., Papayannis, A., and Fragkos, K.: Are EARLINET and AERONET climatologies consistent? The case of Thessaloniki, Greece, Atmos. Chem. Phys., 18, 11885–11903, https://doi.org/10.5194/acp-18-11885-2018 2018.
Solomon, S., Dube, K., Stone, K., Yu, P., Kinnison, D., Toon, O. B., Strahan, S. E., Rosenlof, K. H., Portmann, R., Davis, S., Randel, W., Bernath, P., Boone, C., Bardeen, C. G., Bourassa, A., Zawada, D., and Degenstein, D.: On the stratospheric chemistry of midlatitude wildfire smoke, P. Natl. Acad. Sci. USA, 119, e2117325119 https://doi.org/10.1073/pnas.2117325119, 2022.
Stoffelen, A., Pailleux, J., Källén, E., Vaughan, J. M., Isaksen, L., Flamant, P., Wergen, W., Andersson, E., Schyberg, H., Culoma, A., Meynart, R., Endemann, M., and Ingmann, P.: The atmospheric dynamics mission for global wind field measurement, B. Am. Meteorol. Soc., 86, 73–87, https://doi.org/10.1175/BAMS-86-1-73, 2005.
Stohl, A., Forster, C., Frank, A., Seibert, P., and Wotawa, G.: Technical note: The Lagrangian particle dispersion model FLEXPART version 6.2, Atmos. Chem. Phys., 5, 2461–2474, https://doi.org/10.5194/acp-5-2461-2005, 2005.
Straume, A. G., Schuettemeyer, D., von Bismarck, J., Kanitz, T., and Fehr, T.: EOP-SM/2945/AGS-ags, PL-Plan, European Space Agency (ESA), https://earth.esa.int/eogateway/documents/20142/1564626/Aeolus-Scientific-CAL-VAL-Implementation-Plan.pdf (last access: 20 February 2023), 2019.
Straume, A. G., Rennie, M., Isaksen, L., de Kloe, J., Marseille, G.-J., Stoffelen, A., Flament, T., Stieglitz, H., Dabas, A., Huber, D., Reitebuch, O., Lemmerz, C., Lux, O., Marksteiner, U., Weiler, F., Witschas, B., Meringer, M., Schmidt, K., Nikolaus, I., Geiß, A., Flamant, P., Kanitz, T., Wernham, D., von Bismarck, J., Bley, S., Fehr, T., Floberghagen, R., and Parrinello, T.: ESA's space-based Doppler wind lidar mission Aeolus – First wind and aerosol product assessment results, EPJ Web Conf., 237, 01007, https://doi.org/10.1051/epjconf/202023701007, 2020.
Sugimoto, N., Nishizawa, T., Shimizu, A., Matsui, I., and Jin, Y.: Characterization of aerosols in East Asia with the Asian Dust and Aerosol Lidar Observation Network (AD-Net), in: Proc. SPIE 9262, Lidar Remote Sensing for Environmental Monitoring XIV, 92620K, https://doi.org/10.1117/12.2069892, 2014.
Tyrlis, E. and Lelieveld, J.: Climatology and Dynamics of the Summer Etesian Winds over the Eastern Mediterranean, J. Atmos. Sci., 70, 3374–3396, 2013.
Ulanowski, Z., Bailey, J., Lucas, P. W., Hough, J. H., and Hirst, E.: Alignment of atmospheric mineral dust due to electric field, Atmos. Chem. Phys., 7, 6161–6173, https://doi.org/10.5194/acp-7-6161-2007, 2007.
van der Werf, G. R., Randerson, J. T., Giglio, L., van Leeuwen, T. T., Chen, Y., Rogers, B. M., Mu, M., van Marle, M. J. E., Morton, D. C., Collatz, G. J., Yokelson, R. J., and Kasibhatla, P. S.: Global fire emissions estimates during 1997–2016, Earth Syst. Sci. Data, 9, 697–720, https://doi.org/10.5194/essd-9-697-2017, 2017.
Varlas, G., Marinou, E., Gialitaki, A., Siomos, N., Tsarpalis, K., Kalivitis, N., Solomos, S., Tsekeri, A., Spyrou, C., Tsichla, M., Kampouri, A., Vervatis, V., Giannakaki, E., Amiridis, V., Mihalopoulos, N., Papadopoulos, A., and Katsafados, P.: Assessing Sea-State Effects on Sea-Salt Aerosol Modeling in the Lower Atmosphere Using Lidar and In-Situ Measurements, Remote Sens., 13, 614, https://doi.org/10.3390/rs13040614, 2021.
Voudouri, K. A., Siomos, N., Michailidis, K., D'Amico, G., Mattis, I., and Balis, D.: Consistency of the Single Calculus Chain optical products with archived measurements from an EARLINET lidar station, Remote Sensing, 12, 3969, https://doi.org/10.3390/rs12233969, 2020.
Wandinger, U., Tesche, M., Seifert, P., Ansmann, A., Muller, D., and Althausen, D.: Size matters: Influence of multiple scattering on CALIPSO light-extinction profiling in dessert dust, Geophys. Res. Lett., 37, L10801, https://doi.org/10.1029/2010GL042815, 2010.
Wei, J., Li, Z., Peng, Y., and Sun, L.: MODIS Collection 6.1 aerosol optical depth products over land and ocean: validation and comparison, Atmos. Environ., 201, 428–440, 2019.
Weinzierl, B., Ansmann, A., Prospero, J. M., Althausen, D., Benker, N., Chouza, F., Dollner, M., Farrell, D., Fomba, W. K., Freudenthaler, V., Gasteiger, J., Groß, S., Haarig, M., Heinold, B., Kandler, K., Kristensen, T. B., Mayol-Bracero, O. L., Müller, T., Reitebuch, O., Sauer, D., Schäfler, A., Schepanski, K., Spanu, A., Tegen, I., Toledano, C., and Walser, A.: The Saharan Aerosol Long-Range Transport and Aerosol–Cloud-Interaction Experiment: Overview and Selected Highlights, B. Am. Meteorol. Soc., 98, 1427–1451, https://doi.org/10.1175/BAMS-D-15-00142.1, 2016.
Wilks, D. S.: Statistical Methods in the Atmospheric Sciences, 4th edn., Elsevier, Cambridge, MA, USA, ISBN: 9780128158234, 2019.
Winker, D. M., Vaughan, M. A., Omar, A., Hu, Y., Powell, K. A., Liu, Z., Hunt, W. H., and Young, S. A.: Overview of the CALIPSO Mission and CALIOP Data Processing Algorithms, J. Atmos. Ocean. Tech., 26, 2310–2323, https://doi.org/10.1175/2009JTECHA1281.1, 2009.
Witschas, B., Lemmerz, C., Geiß, A., Lux, O., Marksteiner, U., Rahm, S., Reitebuch, O., and Weiler, F.: First validation of Aeolus wind observations by airborne Doppler wind lidar measurements, Atmos. Meas. Tech., 13, 2381–2396, https://doi.org/10.5194/amt-13-2381-2020, 2020.
Witschas, B., Lemmerz, C., Lux, O., Marksteiner, U., Reitebuch, O., Weiler, F., Fabre, F., Dabas, A., Flament, T., Huber, D., and Vaughan, M.: Spectral performance analysis of the Aeolus Fabry–Pérot and Fizeau interferometers during the first years of operation, Atmos. Meas. Tech., 15, 1465–1489, https://doi.org/10.5194/amt-15-1465-2022, 2022.
Zeng, S., Vaughan, M., Liu, Z., Trepte, C., Kar, J., Omar, A., Winker, D., Lucker, P., Hu, Y., Getzewich, B., and Avery, M.: Application of high-dimensional fuzzy k-means cluster analysis to CALIOP/CALIPSO version 4.1 cloud–aerosol discrimination, Atmos. Meas. Tech., 12, 2261–2285, https://doi.org/10.5194/amt-12-2261-2019, 2019.
Zerefos, C., Nastos, P., Balis, D., Papayannis, A., Kelepertsis, A., Kannelopoulou, E., Nikolakis, D., Eleftheratos, C., Thomas, W., and Varotsos, C.: A complex study of Etna's volcanic plume from ground-based, in situ and space-borne observations, Int. J. Remote Sens., 27, 1855–1864, https://doi.org/10.1080/01431160500462154, 2006.
- Abstract
- Introduction
- AEOLUS – ALADIN
- Standard Correct Algorithm (SCA)
- Ground-based lidars (PANACEA)
- Collocation between Aeolus and ground-based lidars
- Results
- Discussion on Cal/Val aspects and recommendations
- Conclusions
- Data availability
- Author contributions
- Disclaimer
- Special issue statement
- Acknowledgements
- Financial support
- Review statement
- References
- Supplement