the Creative Commons Attribution 4.0 License.
the Creative Commons Attribution 4.0 License.
 | 16 Mar 2023
Near-global distributions of overshooting tops derived from Terra and Aqua MODIS observations
Stephen W. Nesbitt
Robert J. Trapp
Larry Di Girolamo
Overshooting cloud tops (OTs) form in deep convective storms when strong updrafts overshoot the tropopause. An OT is a well-known indicator of convective updrafts and severe weather conditions. Here, we develop an OT detection algorithm using thermal infrared (IR) channels and apply this algorithm to about 20 years' worth of MODIS data from both Terra and Aqua satellites to form an extensive, near-global climatology of OT occurrences. The algorithm is based on a logistic model which is trained using A-Train observations. We demonstrate that the overall accuracy of our approach is about 0.9 when the probability of the OT candidates is larger than 0.9. The OT climatology reveals a pattern that follows the climatology of deep convection and shallow convection over the midlatitude oceans during winter cold-air outbreaks. OTs appear most frequently over the Intertropical Convergence Zone (ITCZ), central and southeastern North America, tropical and subtropical South America, southeastern and southern Asia, tropical and subtropical Africa, and northern middle–high latitudes. OT spatial distributions show strong seasonal and diurnal variabilities. Seasonal OT variations shift with large-scale climate systems such as the ITCZ and local monsoonal systems, including the South Asian monsoon, North American monsoon, and West African monsoon. OT diurnal variations agree with the known diurnal cycle of convection. Maximum OT occurrences are in the afternoon over most land areas and around midnight over ocean, and the OT diurnal cycle is stronger and more varied over land than over ocean. OTs over land are usually colder than over ocean, except at around 10:30 LT (Equator-crossing time). The top 10 coldest OTs from both Terra and Aqua mostly occur over land and at night. This study provides OT climatology for the first time, as derived from 2 decades of MODIS data, that represents the longest and stable satellite records.
- Article
(6489 KB) - Full-text XML
-
Supplement
(1028 KB) - BibTeX
- EndNote


An overshooting cloud top (OT) forms when a convective storm updraft penetrates the level of neutral buoyancy and thus extends into the upper troposphere and lower stratosphere (UTLS). OTs and their associated strong updrafts have been found to be an important transport mechanism for water vapor and other atmospheric constituents into the stratosphere, thus impacting the chemical composition and radiation budget of the UTLS (e.g., Gettelman et al., 2002, 2004). They are often used as indicators of hazardous weather conditions such as strong winds, large hail, flooding, and tornadoes at the Earth's surface (Bedka et al., 2018; Dworak et al., 2012; Marion et al., 2019). More generally, the characteristics of OTs express information about the characteristics of the related updrafts well below cloud top, including the convective mass flux through the troposphere, which is an important parameterized quantity used in global climate models.
In addition to the expectation of a connection between updraft strength and OT depth (Heymsfield et al., 2010), Trapp et al. (2017) have shown a strong link between updraft core area and OT area (OTA), indicating that a relatively intense and wide mid-tropospheric updraft core area will tend to have a large OTA. Given that the direct measurements of updrafts within intense convective environments are either from a few ground-based radars or several field campaigns, these studies suggest a pathway for characterizing global updraft and updraft size distributions by quantifying the global OT distributions and characteristics from space.
To this end, the first step is to detect OTs. Geostationary satellite imagery provides the opportunity to study OT occurrence over a wide region with fine spatial and temporal resolutions. A series of OT detection algorithms have been developed based on geostationary satellite observations. A commonly used OT detection method utilizes the brightness temperature (Tb) difference (BTD) between infrared (IR) water vapor (WV) and IR window (IRW) channels (Schmetz et al., 1997). The WV-IRW BTD method is based on the fact that water vapor transported into the lower stratosphere absorbs and emits more radiation at a water vapor channel (such as 6.7 µm) compared to a window channel (such as 11 µm). Thus, positive BTD is usually observed in the OT regions. However, in convective anvils (e.g., Hong and Di Girolamo, 2020; Setvák et al., 2013) or in polar winter conditions, when strong radiation inversions exist near the surface (Ackerman, 1996), positive BTDs are also observed, which pose challenges for differentiating OTs from these cases.
Another commonly used OT detection method is the IRW texture approach (Bedka et al., 2010). This method uses a threshold of 215 K Tb at the IRW channel to first select OT candidates. These candidates are also colder than the tropopause temperatures. In the second step, the surrounding anvil is sampled at a ∼8 km radius in 16 directions. At each direction, pixels with Tb11 colder than 225 K are included in the calculation of the cirrus mean Tb11. The selected candidate is considered to be an OT if the Tb11 difference between the pixel and its surrounding cirrus is larger than a threshold of 6.5 K. The IRW texture approach has been widely applied for OT detections observed from space, such as geostationary satellite imagery and the Moderate Resolution Imaging Spectroradiometer (MODIS; Bedka, 2011; Dworak et al., 2012; Griffin, 2017; Griffin et al., 2016; Monette et al., 2012; Proud, 2015). However, the strictly fixed thresholds of the IRW texture method limit its ability to detect warm OTs that commonly occur in the midlatitude regions, leading to seasonal and regional biases (Bedka and Khlopenkov, 2016). Based on the visible (VIS) and IR imagery, Bedka and Khlopenkov (2016) developed a new probabilistic OT detection algorithm to minimize the dependence of the IRW texture method on thresholds. Khlopenkov et al. (2021) further updated this algorithm by incorporating the normalized tropopause temperature, surrounding anvil area, and spatial uniformity. An improved accuracy is achieved with this probabilistic OT detection algorithm compared to the IRW texture method.
Observations from spaceborne active sensors have also been used for exploring OT detections. For instance, the cloud-profiling radar (CPR) on CloudSat (Stephens et al., 2008) was used for validating the passive satellite-based OT detection methods (Bedka et al., 2010; Dworak et al., 2012; Rysman et al., 2017), calculating the heights of OTs (Griffin et al., 2016), and understanding WV-IRW BTD variability in OT regions (Setvák et al., 2013). The combined CloudSat–CALIPSO (Cloud–Aerosol Lidar and Infrared Pathfinder Satellite Observation) data were also used for detecting OTs, which led to the creation of a 12-year OT database (Li et al., 2022). As demonstrated by these studies, the CloudSat–CALIPSO observations are powerful in detecting OTs and gauging OT depths, but they are only available in a narrow swath that leads to a lack of knowledge of three-dimensional (3-D) OT structures and large uncertainties in their coverage (Astin et al., 2001). The precipitation radar on the Tropical Rainfall Measuring Mission (TRMM) or Global Precipitation Measurement (GPM) mission can provide 3-D depictions of storm structures. The precipitation radar observations have been used to investigate OT climatology, including their geodistributions, area, and diurnal cycles, in the tropical regions (20∘ S–20∘ N; Alcala and Dessler, 2002; Liu and Zipser, 2005) and over broader areas (60∘ S–60∘ N; Hourngir et al., 2021; Liu et al., 2020; Liu and Liu, 2016).
In addition, using three water vapor channels of the Advanced Microwave Sounding Unit-B (AMSU-B), the convective overshooting detection method was developed through the microwave technique (Hong et al., 2005). A 7-year OT climatology based on AMSU-B was derived in the tropical and subtropical areas that shows OT diurnal and interannual variations (Hong et al., 2008).
While many OT detection algorithms have been developed using either passive or active remote sensing techniques, their use toward quantifying OT occurrences and attributes from space is mostly from datasets with coarse spatial resolutions, e.g., ≥2 km for geostationary satellites, 4–5 km for TRMM precipitation radar, 5 km for GPM Ku radar, and 15 km for AMSU-B. The spatial resolution of observations significantly influences the variations in WV-IRW BTD (Setvák et al., 2007) and thus influences the choice of Tb and BTD thresholds. A large spatial resolution also poses challenge in identifying OTs of a small size and affects the accuracy of computing OT attributes such as OT area. Therefore, measurements from space with a higher spatial resolution will support a better characterization of OT climatology globally, which has not been derived so far.
The MODIS instrument (King et al., 1992) acquires data at a high spatial resolution (≤1 km) that allow the detection of small OTs. This sensor has a wide view swath of 2330 km, which is able to take a whole picture of a mesoscale system. It is operating on both Terra and Aqua satellites and overpassing the same latitude at four different times each day, i.e., the Equator-crossing time (ECT) around 01:30 and 13:30 for Aqua and 10:30 and 22:30 LT (hereafter, all times are in local time, unless specified otherwise) for Terra. In the last 20 years, both Aqua and Terra satellites have had a consistent Equator-crossing time, making the MODIS data the longest stable climate record from space.
To utilize these climate records, the main objective of this study is to show a near-global climatology of OT occurrence derived from about 20 years of Aqua and Terra MODIS data. Owing to the relatively high spatial resolution of MODIS, this climatology includes OTs in a small size that are missed by GPM radar. It includes both the tropical and midlatitude regions and thus complements the climatology by Liu and Zipser (2005) that was only focused on tropical and subtropical regions. It also provides OT diurnal information at four observation times. To achieve these objectives, we first develop an OT detection algorithm that is specifically designed for MODIS, works for both daytime and nighttime data, and is more flexible to thresholds compared to those used in Bedka et al. (2010) and Li et al. (2022). In Sect. 2, we will present the details of data and methods used for developing the OT detection algorithm. Validation of the algorithm will be discussed in Sect. 3. Section 4 discusses the results produced from our OT detection algorithm. Finally, in Sect. 5, we conclude with the findings of this study.
In order to develop a method that can detect OTs during both daytime and nighttime, this study uses observations from multiple sensors on board multiple platforms in addition to a machine learning method called logistic regression. The OT detection algorithm is developed in two main steps. First, we manually identified a number of OT candidates from the combined CloudSat–CALIPSO data. The infrared radiative characteristics of these OTs extracted from the combined Aqua MODIS infrared data serve as inputs to train the logistic regression. Second, we applied the regressed model to the Terra and Aqua MODIS data for automatic OT detection. We call this method an IR algorithm.
2.1 Satellite and reanalysis datasets
2.1.1 CloudSat and CALIPSO
The CloudSat and CALIPSO satellites are two members of the afternoon constellation in a sun-synchronous orbit with an Equator-crossing time at 01:30 and 13:30. The cloud-profiling radar (CPR) on board CloudSat is a near-nadir-view radar operated at 94 GHz (∼3.3 mm). Measuring the radar reflectivity factor, the CPR probes the vertical structure of hydrometeors with a minimum sensitivity of about −30 dBZ (Stephens et al., 2002, 2008). The radar's footprint is 1.8 km along the track and 1.4 km across the track. Its vertical resolution is 480 m, with a resampled resolution of 240 m. The radar is able to penetrate thick clouds and is therefore suitable for OT identification, as demonstrated by previous studies (Chung et al., 2008; Rysman et al., 2017; Setvák et al., 2013). The radar reflectivity factor from the 2B-GEOPROF (version P1) product (Marchand et al., 2008) that shows time–height cross sections (curtains) of clouds and precipitation was used for manual OT identification.
The CALIPSO flew about 15 s after CloudSat during the time period of observations used in this work. The lidar on board CALIPSO operates at 532 nm, having a vertical resolution of 30 m below 8.2 km and 60 m above 8.2 km (Winker et al., 2003). The lidar is sensitive to optically thin clouds and aerosols. The 2B-CLDCLASS-LIDAR product, provided by the CloudSat Data Processing Center, reports cloud-top and cloud-base heights for up to five layers (Wang et al., 2012). This product utilizes the complementary features of the CloudSat radar and the CALIPSO lidar and thus includes thin cirrus clouds. The cloud-top height of the topmost layer was used to aid in the identification of OTs. A total of 2 years of 2B-GEOPROF and 2B-CLDCLASS-LIDAR data (2007–2008) were used in this study.
2.1.2 MODIS
MODIS, on board both the Aqua and Terra platforms, has 36 discrete spectral bands between 0.415 and 14.235 µm, with spectral-dependent spatial resolutions varying between 250 m and 1 km at nadir (Barnes et al., 1998; King et al., 1992). The Aqua satellite, launched in May 2002, is a member of the A-Train satellite constellation. Terra was launched in December 1999 in a sun-synchronous orbit, with an Equator-crossing time at 10:30 and 22:30 LT (Platnick et al., 2003).
To obtain OT radiative characteristics, the MODIS Collection 6.1 Level-1B calibrated radiance data, with MYD021KM from Aqua and MOD021KM from Terra, were used. In this study, the bands selected have a center wavelength at 6.715 and 11.03 µm for OT detection that is used for deriving brightness temperature. The uncertainties associated with these two bands are within 1 % for both Terra and Aqua MODIS (Xiong et al., 2005, 2018). Navigation files with 1 km resolution (MYD03 and MOD03) were used for the geolocation information. The Aqua MODIS data from 2007–2008 were colocated with the CloudSat–CALIPSO data to select OT cases as a training dataset for the logistic regression model (Sect. 2.2). The Terra MODIS data from February 2000–2021 and the Aqua MODIS data from July 2002–2021 were used for deriving the OT climatology presented in Sect. 4.
2.1.3 GPM
The Global Precipitation Measurement (GPM) Core Observatory, launched in February 2014, carries the first space-borne Dual-frequency Precipitation Radar (DPR) that includes a Ka-band (35.5 GHz) radar (KaPR) and a Ku-band (13.6 GHz) radar (KuPR; Hou et al., 2014). The KuPR measures 3-D structures of convective systems, with a vertical resolution of 250 m and a footprint of 5 km over a swath of 245 km. The GPM KuPR echoes have been demonstrated to be effective in the study of deep convection reaching to the tropopause (Liu et al., 2020; Liu and Liu, 2016). To utilize the GPM as an independent detection of OTs, we colocated the Ku-band echoes with the linear structure the OT candidates identified from Terra MODIS as a validation of our IR algorithm (Sect. 2.2). About 6 years (March 2014–December 2020) of GPM data (2A.GPM.DPR.V8) were used.
2.1.4 Reanalysis data
Tropopause temperature is needed for our IR algorithm. We used the tropopause information output from the Modern-Era Retrospective analysis for Research and Applications, Version 2 (MERRA-2), instantaneous, two-dimensional collection, hourly, and single-level diagnostics (MERRA2_400.inst1_2d_asm_Nx) product (Bosilovich et al., 2016). The MERRA-2 parameter of TROPT is a blended estimate of tropopause temperature (Tp) based on a combination of the World Meteorological Organization (WMO) definition of the primary lapse rate tropopause (Grise et al., 2010) and equivalent potential vorticity. The tropopause data have a spatial resolution of 0.625∘ × 0.5∘ longitude–latitude. The closest MERRA-2 grid in space and time was assigned to each MODIS observation.
2.2 OT identification algorithm
2.2.1 OT selections from A-Train observations
The first step in the IR algorithm is to generate an OT training dataset. We manually selected OT candidates from around the world between 2007 and 2008 by visualizing the CPR reflectivity factor from 2B-GEOPROF, topmost cloud-top height from 2B-CLDCLASS-LIDAR, tropopause information from MERRA-2, and the colocated Tb11 from Aqua MODIS. For the CloudSat–MODIS colocation, the nearest Aqua MODIS pixels were assigned to the CloudSat track. The distance of the collocated CPR–MODIS pixels is usually less than 700 m, allowing these two sensors to observe nearly the same cloud within 1 min (Hong and Di Girolamo, 2020).
Parallax correction was examined but not employed in this work. We found that a parallax correction produced Tb11 values nearly identical to those without parallax correction. This is consistent with Wang et al. (2011), who stated that the effect of parallax correction will be small if the cloud object occupies a large enough area and is relatively homogeneous over the range comparable to the parallax correction, which is certainly the case for the OTs being studied here. Additionally, the parallax correction introduces a small amount of noise in the along-track Tb11 values due to noise in the cloud-top height used in the parallax correction. The noise is sufficient at times to create artifacts in our OT algorithm.
OTs were selected by visually inspecting the visualization rather than using a fix criterion. The OT selection basically followed four principles, namely Tb11 colder than Tp, cloud-top height above tropopause height, Tb11 smaller than Tb6.7, and an obvious convective core. For instance, Fig. 1 shows an example of how we manually select OTs from this visualization. Figure 1a shows that CloudSat overpassed a strong convective system with Tb11 as low as 180 K. Figure 1b shows the curtain of the radar reflectivity factor from CloudSat for this convective system, along with Tb11 divided by 10 (orange solid line), cloud-top height (black solid line), and tropopause information (orange dashed line for tropopause temperature (Tp) divided by 10 and black dashed line for tropopause height) along the transect. As Fig. 1b shows, in the convective core, cloud-top height is above the tropopause height, and the Tb11 is colder than tropopause temperature (Tp). This case is identified as an OT. In total, we have selected 209 OTs from A-Train observations. Additionally, 78 non-OTs (NOTs) were also selected for model training. The NOTs share very similar characteristics with OTs, i.e., Tb11 is cold (close to or colder than Tp) and has a local minimum, but no obvious convective core is observed from the visualization. In the Supplement, File S1 displays four OT and three NOT cases. Figure 2 shows very similar OT and NOT Tb11 distributions.
The total of 287 samples were randomly distributed over four seasons and in different locations on Earth. The data are available in the Supplement (File S2).
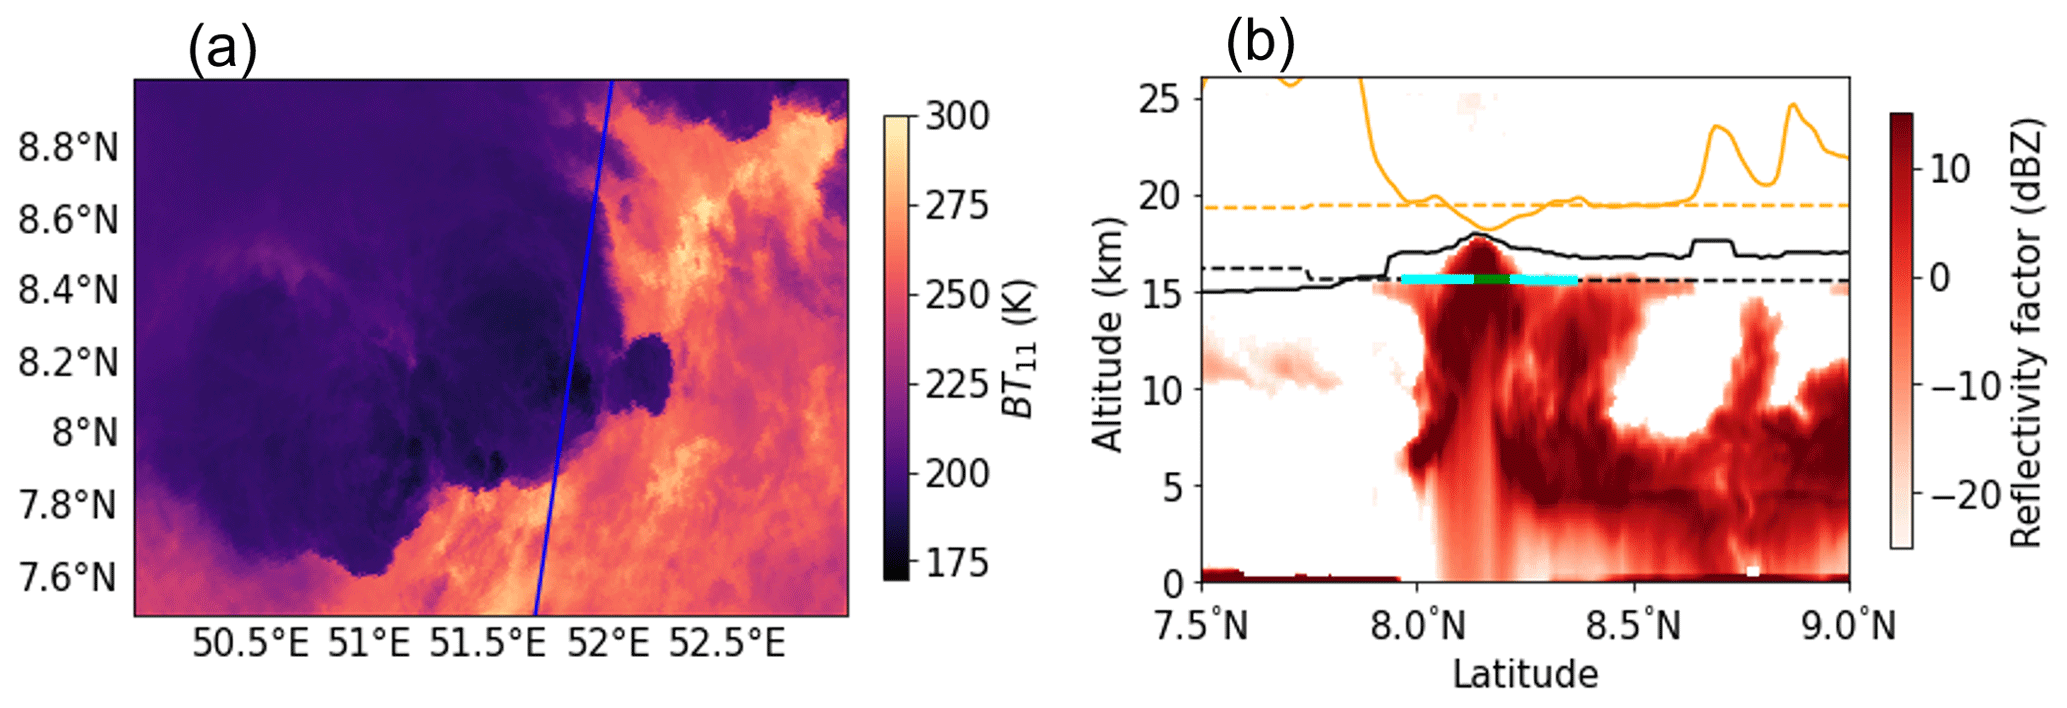
Figure 1An OT case occurring at night over the Indian Ocean on 1 June 2007. (a) Brightness temperature at 11 µm from Aqua MODIS, with a blue line indicating the CloudSat track. (b) Vertical cross section of CloudSat radar reflectivity factor overlapped with MERRA-2 tropopause temperature divided by 10 (orange dashed line), tropopause height (black dashed line), topmost cloud-top height from 2B-CLDCLASS-LIDAR (black solid line), and Tb11 divided by 10 (orange solid line). The green line in panel (b) indicates the OT region along the CloudSat track, as determined by the method from Marion et al. (2019), and the cyan line indicates the surrounding cirrus anvil.
2.2.2 OT edge and cirrus anvil
Once an OT was manually selected from the A-Train data, OT edges were determined using the method described in Marion et al. (2019). Briefly, the local minimum Tb11 along the CloudSat track was set as the OT center. The 1-D second derivative along two radii along the CloudSat track ( was computed using a three-point Lagrangian interpolation after a Gaussian filter was applied to smooth the Tb11 field. The OT edges along the two radii are defined as the first point where . With the OT edges determined, the diameter of the OT candidate can be obtained. As an example, Fig. 1b shows the OT diameter in green, indicating that this method catches the overshooting area well.
The cirrus (Ci) anvil in this work was searched within 20 pixels around the OT center but with the OT area excluded. Pixels starting from the OT edge and having Tb11<260 K contribute to the surrounding cirrus. A value of 260 K was used to screen cold clouds. This threshold has been commonly adopted for screening high clouds associated with deep convection (Chung et al., 2007; Tian et al., 2004). Figure 1b indicates the cirrus anvil in cyan. Once two edges of an OT and its cirrus anvil were determined, the OT center Tb11, the mean brightness temperature for the OT region ( and , the mean brightness temperature ( for the surrounding cirrus averaged over two radii, and the tropopause temperature (Tp) for the OT case were recorded to construct the training dataset. Note that the cirrus anvil is only defined in a small area, within 20 km from the OT center, which is sufficient to check the Tb difference between the OT and its surrounding region because the OT's size is usually smaller than 15 km (Bedka and Khlopenkov, 2016). Pixels outside the 20 km radii can also contain cirrus but do not contribute to our calculation of cirrus Tb.
For the 209 OT candidates, all of them have diameters of less than 25 km, 180 OTs (86 %) have diameters of less than 15 km, and the peak in the OT diameter distribution is about 10 km (Fig. 2a), which is in agreement with Bedka and Khlopenkov (2016), who stated that OTs are typically less than 15 km in diameter. The Tb11 of the OT center along the CloudSat track is shown in Fig. 2b, which displays an asymmetric U-shape distribution along latitudes. Tropical OTs tend to have their center Tb11 at less than 200 K, while midlatitude OTs tend to have the center Tb11 colder than 230 K. The NOT candidates share a very similar Tb11 distribution with OTs. We rarely found OTs outside the latitude range. The selected OTs and NOTs are available in the Supplement (File S2). In addition, WV-IRW BTD and Tp are two important variables used for our IR algorithm.

Figure 2(a) OT diameter distribution of the 209 OT candidates selected from 2007 and 2008 A-Train data. (b) Brightness temperature at 11 µm of the OT (gray) and NOT (red) center along the CloudSat track.
2.2.3 Logistic regression
Similar to Bedka and Khlopenkov (2016), a probability was generated for an OT candidate. The 209 OTs and 78 NOTs selected from A-Train observations served as inputs for the logistic model. The logistic regression is a statistical model that is used to model a certain event through assigning a probability between 0 and 1, such as for the classification of OT and NOT. The logistic model depends on several variables or predictors, which are shown as follows:
where P is the probability of an OT candidate, b0 is the constant, xi is the variable, and bi represents the regressed coefficient.
Three MODIS-based variables were settled on after a series of tests to optimize the accuracy. They are x1, which is the difference between the Ci anvil mean Tb11 and OT center Tb11, x2, which is the difference in Tp and OT center Tb11, and x3, which is the difference in mean Tb6.7 and mean Tb11 of OT. In total, 156 OTs and 48 NOTs were used to train the model, and the regressed results are summarized in Table 1. The total accuracy is about 84 % when a probability >0.6 is predicted to be an OT. Furthermore, 53 OTs and 30 NOTs were used to validate the regressed model, with a total accuracy of about 82 %. We have tested the accuracy as a function of sample size and found a stable model accuracy of ∼84 % when the total sample size is larger than about 150, indicating that a total of 287 samples should be sufficient for training a robust model in our study.
Table 1A summary of the regressed coefficients for the variables selected for OT detection used in Eq. (1).
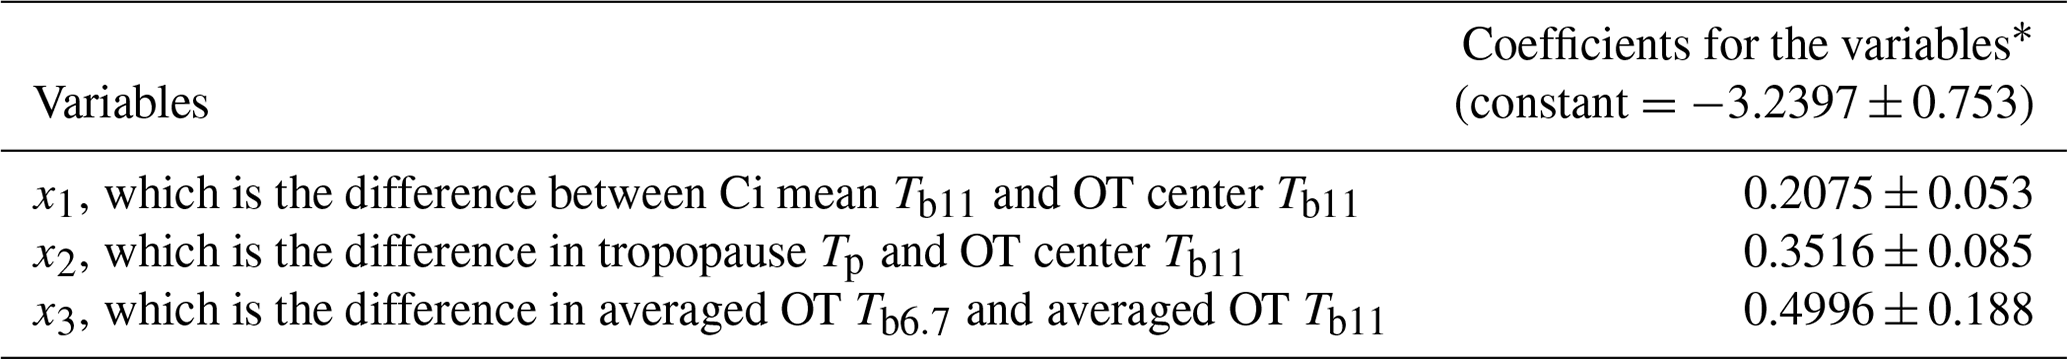
* The logistic regression is based on Python module statsmodels. The p values for the regressed coefficients are smaller than 0.008, based on the z test. The uncertainties for each coefficient are represented by standard errors.
2.2.4 Application of IR algorithm to MODIS
The logistic regression in Sect. 2.2.3 forms the basis of our IR algorithm, which aims to automatically identify OTs from Terra and Aqua MODIS in the daytime and at nighttime. The application of the IR algorithm starts from the pixel search, with Tb11 colder than Tp and Tb11 less than 200 K in the tropics (within 25∘ latitude) or less than 230 K in the midlatitudes (outside 25∘ latitude). These Tb11 thresholds are selected to ensure that all OTs identified in Fig. 2b would pass this first OT candidate selection criteria. If the pixel passed these thresholds and is a local minimum in Tb11 field in a 41 km × 41 km window, then we continued to find the OT edges in eight directions using the method by Marion et al. (2019), as mentioned in Sect. 2.2.2. and of the OT area are further computed over the pixels along eight radii once OT edges have been determined. of the surrounding cirrus is also computed in eight directions in the cirrus area, as defined in Sect. 2.2.2. When the surrounding cirrus is warmer than the OT center Tb11, and this OT case shows positive WV-IRW BTD (i.e., –, then the OT probability is calculated according to the logistic regression from Sect. 2.2.3. If one of the mentioned conditions does not satisfy the requirements, then the algorithm will search for the next pixel. The flowchart of the IR algorithm application is summarized in Fig. 3.
A window size of 41 km was adopted, considering that 98 % of the OTs (Fig. 2) have diameters of less than 20 km, according to A-Train observations (Sect. 2.2.2). This window makes sure that two OT centers are at least 20 km apart and that enough pixels contribute to the cirrus anvils. If multiple OTs occurred in the same window, then the one with the coldest Tb11 was selected.
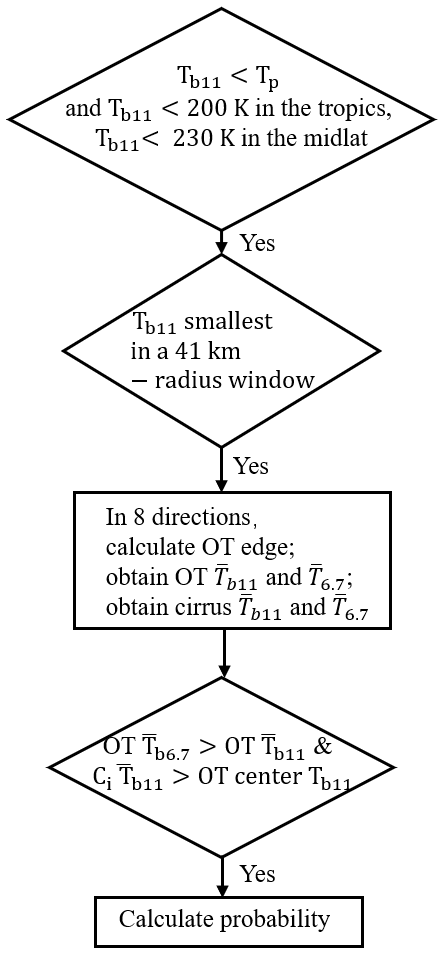
Figure 3Flowchart for the application of IR algorithm to MODIS data. The represents the mean of brightness temperature.
3.1 Comparison with GPM
GPM has been demonstrated to be an effective tool in studying intense storms and overshooting top events (Hourngir et al., 2021; Liu et al., 2020; Liu and Liu, 2016). Here, we used the GPM observations for two purposes, namely to compare the performance of OT detection between GPM KuPR and Terra MODIS and to investigate the cloud structure of detected OTs. The colocation between GPM KuPR and MODIS data was achieved when the time difference between them was within 5 min and the spatial difference between them was less than 10 km. A 5 min time window was used because the life cycle of OTs can be as small as several minutes (Setvák et al., 2013). The colocating process was performed only when OT candidates were identified from Terra MODIS. We obtained 6949 colocations for the period of March 2014–December 2020.
Ku-band radar, with reflectivity factor (Ze) in an area with a radius of less than 40 km around the colocated radar pixel, was collected to construct the contoured frequency by altitude diagram (CFAD; Yuter and Houze, 1995). The parallax error between KuPR and MODIS could be more than 20 km, according to the method described in Wang et al. (2011). Also, the OT diameter is likely less than 20 km. An area with a 40 km radius for the colocated KuPR data is likely able to encompass the OT event identified by MODIS. Figure 4 shows the CFADs contributed by all (6949) colocated OT cases. The CFADs were segregated into five OT probability intervals for the tropical and midlatitude areas. As shown, the largest frequency occurs above 5 km in tropical areas (Fig. 4a1–a5). As the OT probability increases, the frequency increases for large Ze (>30 dBZ) below 5 km. In the midlatitudes (Fig. 4b1–b5), a higher frequency of the Ze occurs below 5 km when the OT probability is less than 0.85. For those OT cases with P>0.85, a large frequency is mostly above 5 km, and a large Ze (>30 dBZ) occurs more frequently below 5 km. With an analysis of the DPR rain-type product, we noticed that the large Ze (e.g., >30 dBZ) below 5 km tends to be associated with convective rain in both the tropics and midlatitudes. An increase in convective rain in the CFADs with larger OT probability indicates a more likely OT occurrence. These CFADs demonstrate that the probability generated from our IR algorithm indicates storm intensity and a confidence level of OT detection.
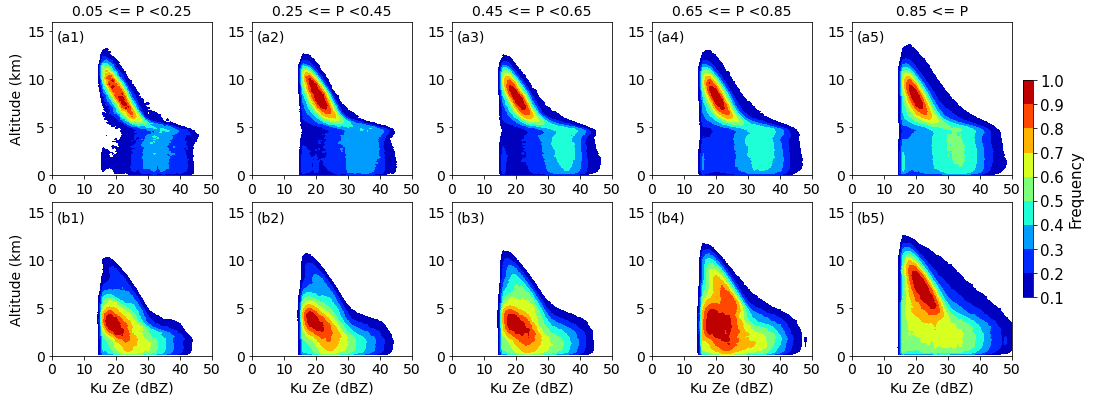
Figure 4Contoured frequency by altitude diagram, showing the frequency normalized by the maximum bin of radar reflectivity. Data were binned at 1 dBZ intervals at each level. The upper panels are for the tropics (within 25∘ latitude), and the lower panels are for the midlatitudes (between 25 and 60∘ latitude).
To compare the performance of OT detection between GPM and MODIS, we need to determine when GPM detects an OT. If the maximum altitude of 15 dBZ in the 40 km radius area was higher than 2 km below the MERRA-2 tropopause, an OT flag was assigned to the colocated GPM pixel. Previous studies also adopted a level below the tropopause as the OT reference, considering the tropopause height variability (Sun et al., 2019; Zhuge et al., 2015), such as the noted double tropopause observed in deep convection (Vergados et al., 2014). Here, 2 km was selected due to an agreement of 67 % between MERRA-2 and ERA5 tropopause height (from ECMWF-AUX; Partain, 2007) for the 287 OT and NOT cases used in Sect. 2. Once OT flags were assigned to the colocated GPM cases, an agreement of OT detection between MODIS and GPM was calculated for a wide range of OT probability generated by the IR algorithm. The agreement is expressed as follows:
where H is the maximum altitude (in km) of 15 dBZ in the 40 km radius area, Hp is the tropopause height from MERRA-2, and N is the OT number, with OT probability between P1 and P2.
Figure 5 shows the agreement in the OT detection between MODIS and GPM, which increases with OT probability. In the tropics, the agreement is about 70 % when P>90 % with enough samples, while in the midlatitudes, the agreement is larger than 80 % when P>0.90.
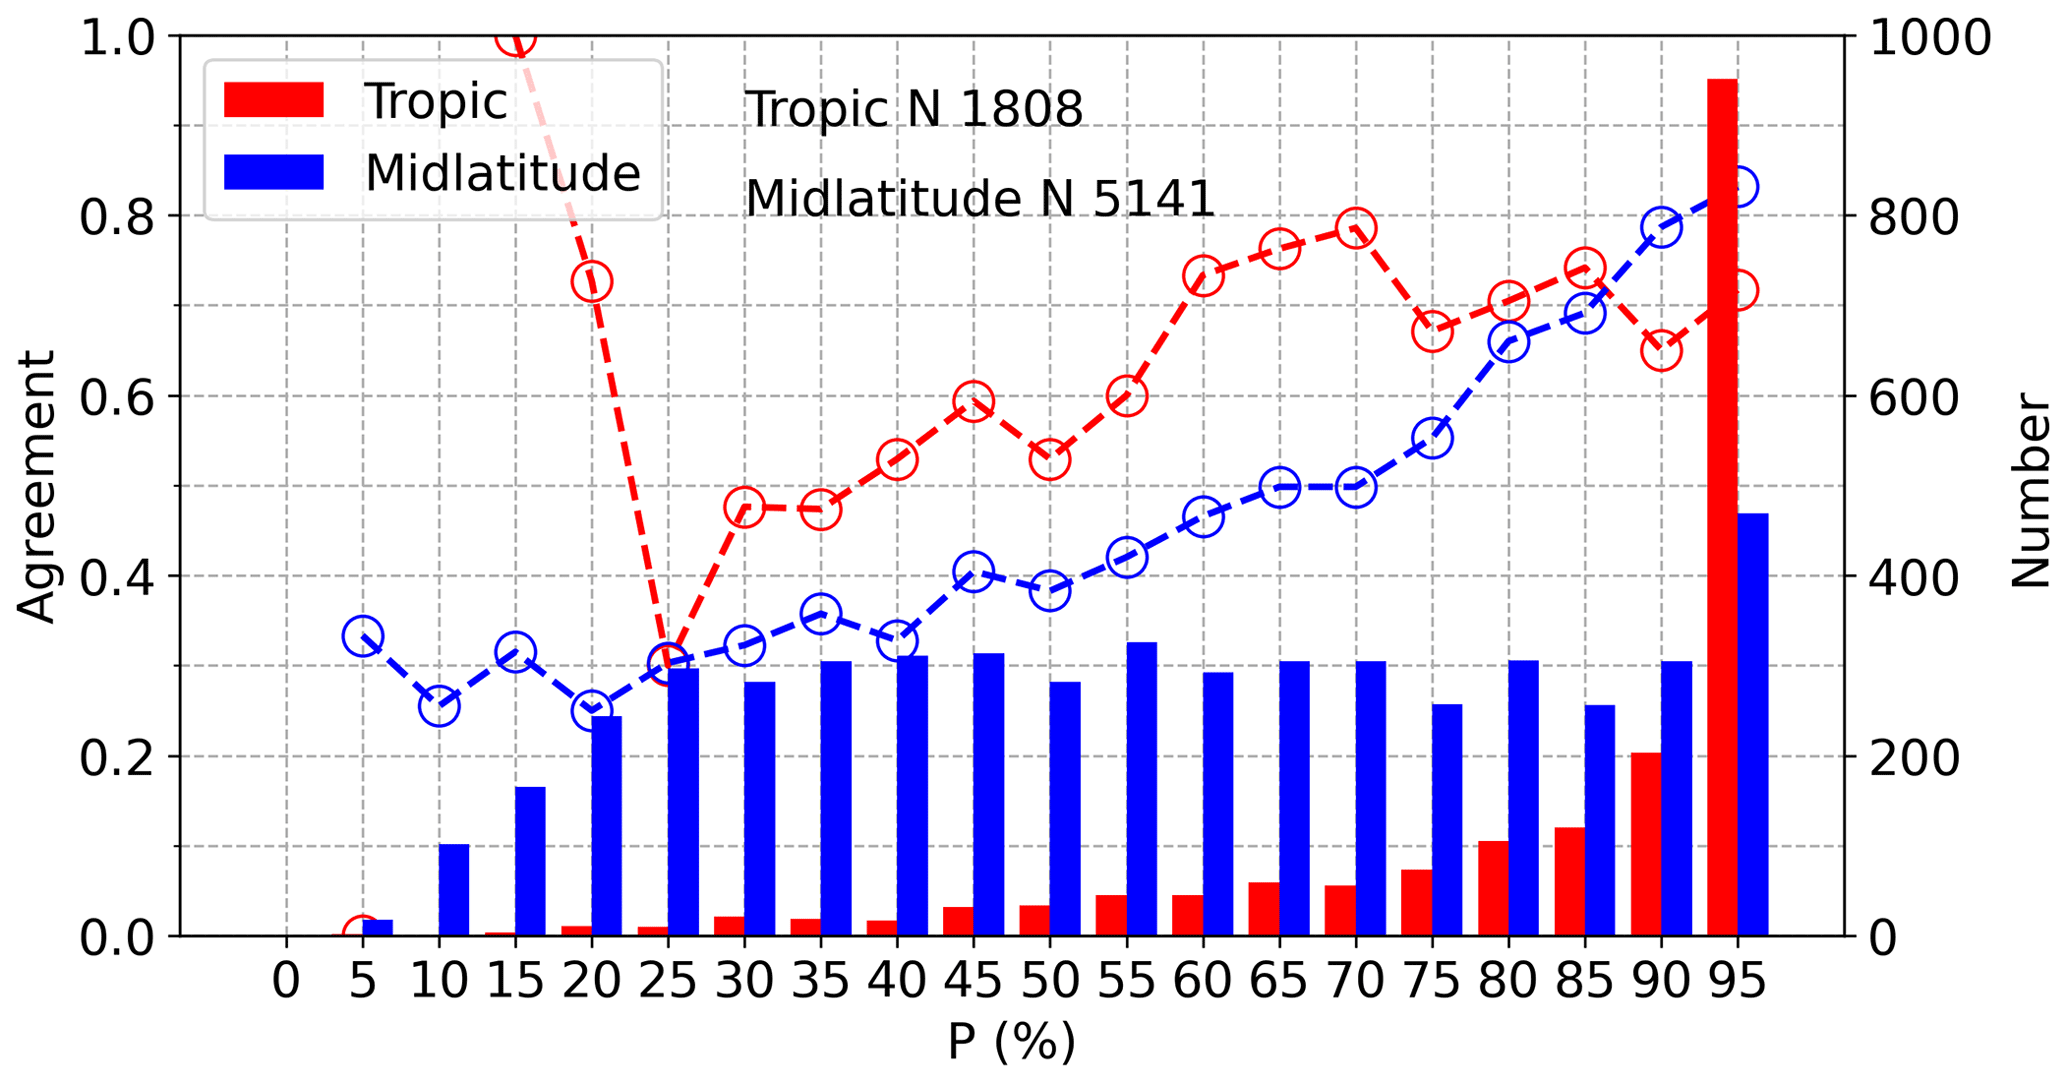
Figure 5Comparison of OT detection between GPM and Terra MODIS. Curves represent the agreement of OT detection between MODIS and GPM in various probability intervals (red for the tropics and blue for the midlatitudes). The numbers of the potential OT candidates are shown in bars. N stands for sample number.
3.2 Manual check
As a complement to the GPM-MODIS comparison for assessing IR algorithm accuracy, we manually checked 1158 daytime OT candidates (selected randomly across the year) from Terra MODIS from 2018–2020 (data are available in the Supplement in File S3). These OT candidates have a wide range of probability. OT and NOT flags were assigned to the candidates by visually inspecting the IR and visible images from the NASA Worldview website (https://worldview.earthdata.nasa.gov, last access: 21 September 2021). The fraction of OT and NOT segregated at a 0.1 probability (generated from the IR algorithm) interval was calculated (Fig. 6). As displayed, the fraction of OT substantially increases when the probability is greater than 0.8 in both the tropics and midlatitudes. In the tropics, the fraction of NOT is about 30 % when P is between 0.8 and 0.9, and it decreases to about 10 % when P≥0.9. In the midlatitudes, when the P is small (e.g., <0.8), the NOT fraction is higher than the OT fraction. Only when P≥0.9 does NOT fraction drop to about 10 %. With a manual check of about 900 OT candidates selected from the July 2018 Aqua MODIS, a similar accuracy was obtained (∼90 % when P≥0.9). This manual check is consistent with the OT comparison with GPM as discussed in Sect. 3.1 (i.e., higher OT probability gives higher confidence in our IR algorithm for OT detection).
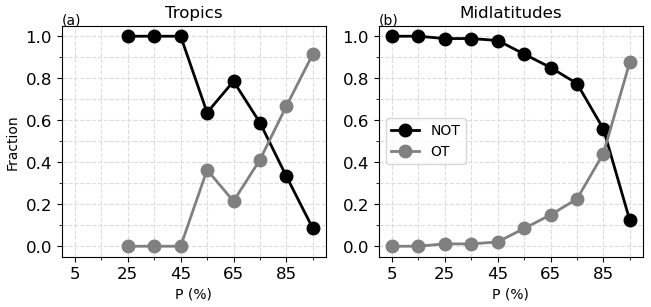
Figure 6Fraction of OT candidates with a wide range of probability in the tropics (a) and midlatitudes (b). The x axis shows a probability interval of 0.1.
Overall, we choose a P threshold of 0.9 in both the tropical and midlatitude regions to isolate OTs, which ensures a total detection accuracy of ∼0.9 (better than 0.9 in the tropics and slightly lower than 0.9 in the midlatitudes), as demonstrated in Sect. 3.2. For the Terra MODIS data from February 2000 to December 2021 and Aqua MODIS data from July 2002 to December 2021, OT candidates that pass the probability threshold of 0.9 account for about 30 % and 35 %, respectively, of all candidates over regions within 60∘ S–60∘ N. In the tropics, 58 % (62 %) of the candidates from Terra (Aqua) MODIS have P>0.9, while in the midlatitudes, only 13 % (16 %) of the candidates were retained. Note that we do not consider polar regions because our manually selected OTs in Sect. 2.2 rarely occur outside 60∘ latitude.
In this section, we show an OT climatology of those OT candidates with P≥0.9. Candidates with P<0.9 were excluded due to a high fraction of NOTs, as discussed in Sect. 3.
4.1 Case analysis
Before showing the climatology, we first show four cases, including all OT candidates with a variety of probabilities, for a detailed view of the performance of our IR algorithm in different storm environments.
Figure 7 shows the visible reflectance overlapped with OT centers, which are colored by OT probability. Tb11 for each case is also shown to be overlapped with the pixels colder than tropopause and having positive WV-IRW BTD (marked in white). The rain type and precipitation rate, averaged between 2 and 4 km from GPM, are shown in the third and fourth columns.
Overshooting tops in tropical cyclones (TCs) are common. They are found to be closely linked to intense convection and rapid intensification in TCs (Griffin, 2017; Monette et al., 2012; Tao and Jiang, 2013). Figure 7a1–a4 display a tropical cyclone over the northern Indian Ocean on 8 November 2019. OTs are detected in the area, with very cold Tb11 associated with strong convection and precipitation, as GPM identifies convective rain type near OT areas. Our algorithm usually generated a high probability for OT candidates detected in TCs.
In the mesoscale convective system case (Fig. 7b1–b4), OTs are detected in the clusters that are associated with cold Tb11 and positive WV-IRW BTD. Strong precipitation is indicated by GPM. Our algorithm also usually produces high probability for OTs detected in mesoscale convective systems.
Cold-air outbreaks can produce shallow convection when cold air blows from frozen surfaces to the warmer ocean. The Cold-Air Outbreaks in the Marine Boundary Layer Experiment (COMBLE) found that these convective clouds are commonly lower than 5 km associated with updrafts of 4–5 m s−1 (Geerts et al., 2022). In the cold-air outbreaks, the tropopause is low, which is often at a level below 500 hPa (Papritz et al., 2019; Terpstra et al., 2021), compared to the midlatitude tropopause climatology of 200–300 hPa (Wilcox et al., 2012). Thus, updrafts in these shallow convective clouds are able to penetrate the tropopause and produce overshooting cloud tops. In the third case (Fig. 7c1–c4), the overshooting tops from convective turrets over the North Atlantic within a cold-air outbreak occur with high OT probability. GPM identifies convective precipitation surrounded by stratiform precipitation in these shallow convective clouds. Our method allows for the detection of these OTs that can occur in unstable conditions with shallow tropopauses.
Midlatitude winter cyclones are associated with mostly stratiform cloud systems (Stewart et al., 1998), as also demonstrated by the GPM rain type that shows mostly stratiform precipitation (Fig. 7d1–d4). The tops of the stratiform clouds associated with the fronts usually reach the tropopause without strong convective cores. However, they can be associated with lightning and heavy precipitation when fueled by potential instability, with updrafts of 6–8 m s−1 (Murphy et al., 2017; Rauber et al., 2014, 2015). Our algorithm detects OT candidates in this cloud system, usually with a low probability, which will be excluded from our OT climatology analysis, except for some rare situations with high OT probability.
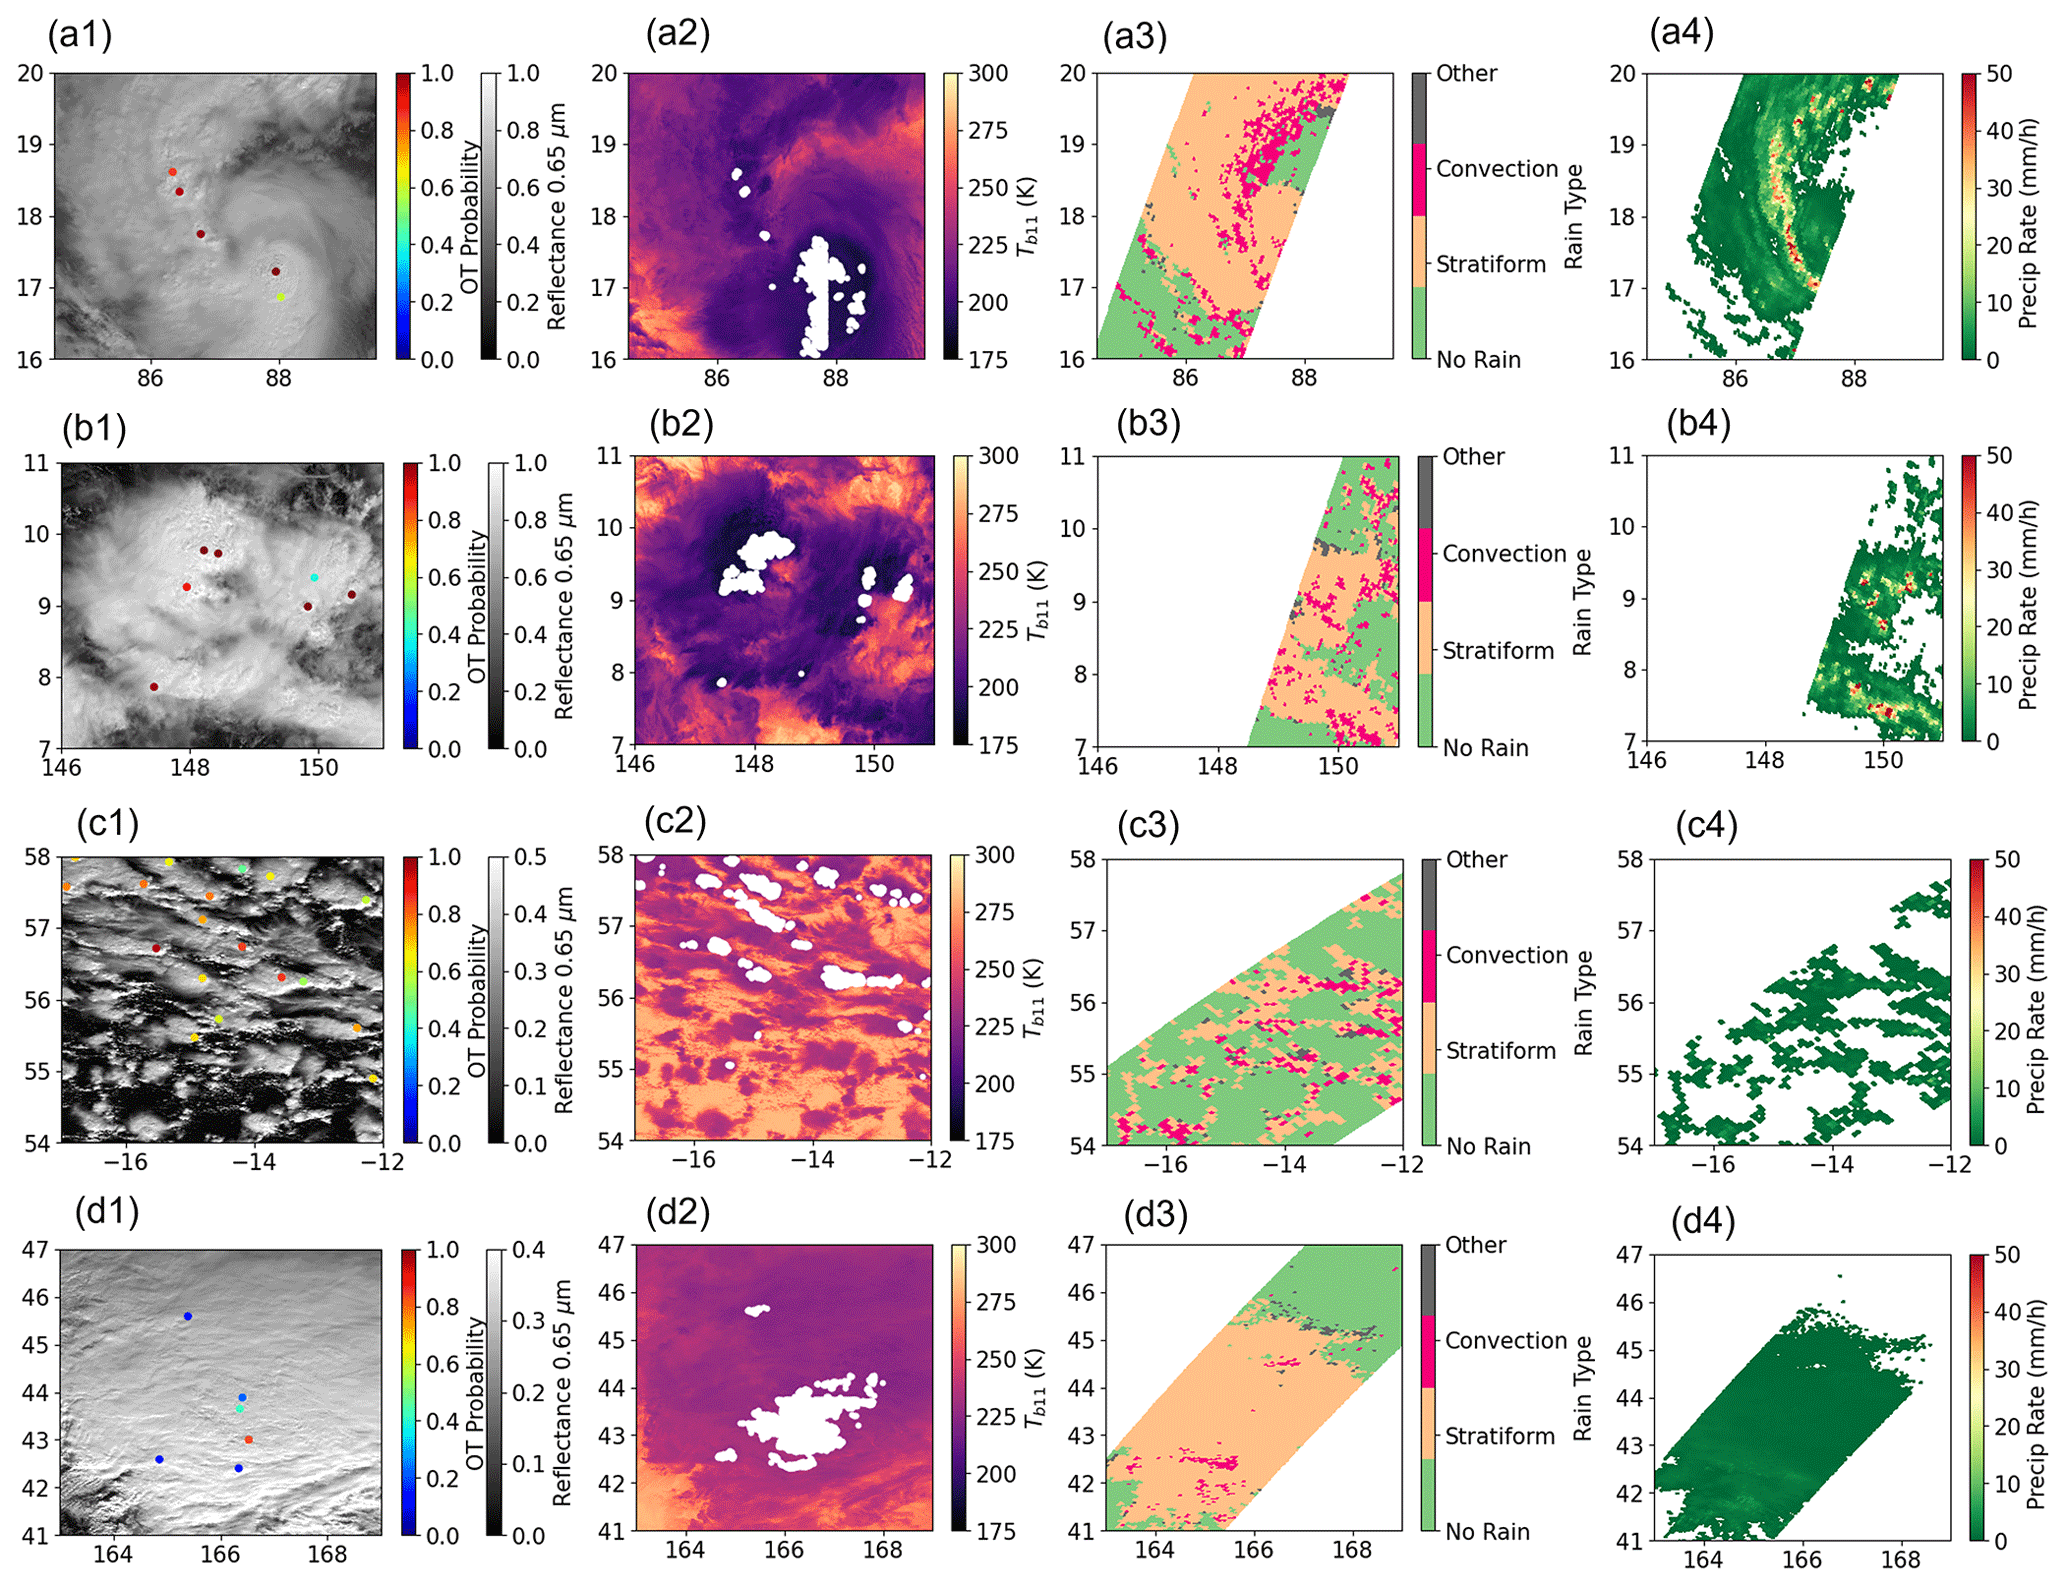
Figure 7Four selected cloud systems with OTs detected by our IR algorithm. The first column shows the reflectance at 0.65 µm (dots indicate OT probability), and the second column shows the brightness temperature at 11 µm (white dots indicate pixels colder than tropopause temperature and having positive WV-IRW-BTD). Columns 3 and 4 represent the rain type and precipitation rate from GPM, respectively. Case 1 (a1–a4) is for the tropical cyclone over the Bay of Bengal on 8 December 2019, case 2 (b1–b4) is for a mesoscale convective system over the east of the Philippines on 3 December 2019, case 3 (c1–c4; 10 March 2019 over the North Atlantic Ocean) is for a shallow post-frontal convection, and case 4 (d1–d4; 15 December 2018 over the North Pacific Ocean) is for the cloud system in the midlatitude cyclone.
4.2 Near-global OT distributions
Figure 8 shows the seasonal distributions of OT occurrences contributed by those OT candidates with P≥0.9, as derived from Terra (February 2000–2021) and Aqua (July 2002–2021) MODIS. As displayed, OT distributions and their seasonal variations follow the expected pattern based on the known climatology of convection (Alcala and Dessler, 2002; Funk et al., 2015). In June–August (JJA; Fig. 8b), as revealed by both Aqua and Terra MODIS, OTs primarily distribute over the north of the Equator in the Intertropical Convergence Zone (ITCZ). A large population of OTs over India, the Bay of Bengal, and Southeast Asia are associated with the summer South Asian monsoonal system. Our algorithm also detects considerable OTs in Asia between 45–60∘ latitudes and in Europe, where severe storms occur in local summer (Groenemeijer et al., 2017; Shikhov et al., 2021). These profound OTs agree with what GPM has found in the northern middle and high latitudes (Liu et al., 2020). However, a Tb11 threshold of 215 K usually filters out these OTs (e.g., Li et al., 2022). Another hot spot of OTs occurs in central North America. In addition, we observe a narrow belt of large OT occurrences over the western Atlantic Ocean, which are associated with the location of tropical cyclones.
Aqua MODIS also shows frequent OT occurrences over the southeastern United States, which is associated with the afternoon convection. In regions over the southwestern USA and northwestern Mexico, OTs are detected, which are associated with the summer North American monsoon (Adams and Comrie, 1997).
During December–February (DJF; Fig. 8d), OT occurrences are about 44 % at 10:30 LT (Terra Equator-crossing time) and 36 % at 01:30 LT (Aqua Equator-crossing time) less than that in JJA. OTs are primarily located over the Southern Hemisphere as the ITCZ moves to the south of the Equator. A large number of OTs are detected by Aqua MODIS over tropical and subtropical South America and Africa. In the Northern Hemisphere, OTs become infrequent over land. Note that ice clouds have an occurrence frequency of about 70 % over middle- and high-latitude Asia during winter (e.g., Hong and Liu, 2015), which often poses challenges for OT identification. These cold ice clouds are rarely classified as OTs in our analysis, demonstrating the ability of our IR method to avoid the misclassification of cold ice clouds as OTs. In contrast, over the midlatitude ocean in winter, we see some OT occurrences. These OTs are associated with isolated convective clouds occurring in the cold-air outbreaks, as discussed in Sect. 4.1. These OTs are also observed over Southern Ocean during JJA (austral winter). We also notice a small number of OTs extending from northwestern to southeastern North America in DJF. These OTs are associated with the convection in winter midlatitude cyclones, as discussed in Sect. 4.1.
Convective activity over land is weak at the Terra overpass time in the morning (∼10:30), and it becomes more frequent and intense in the afternoon when the Aqua satellite overpasses. This is revealed by the differences in OT occurrences between Terra and Aqua, indicating the variability in OT diurnal cycles.
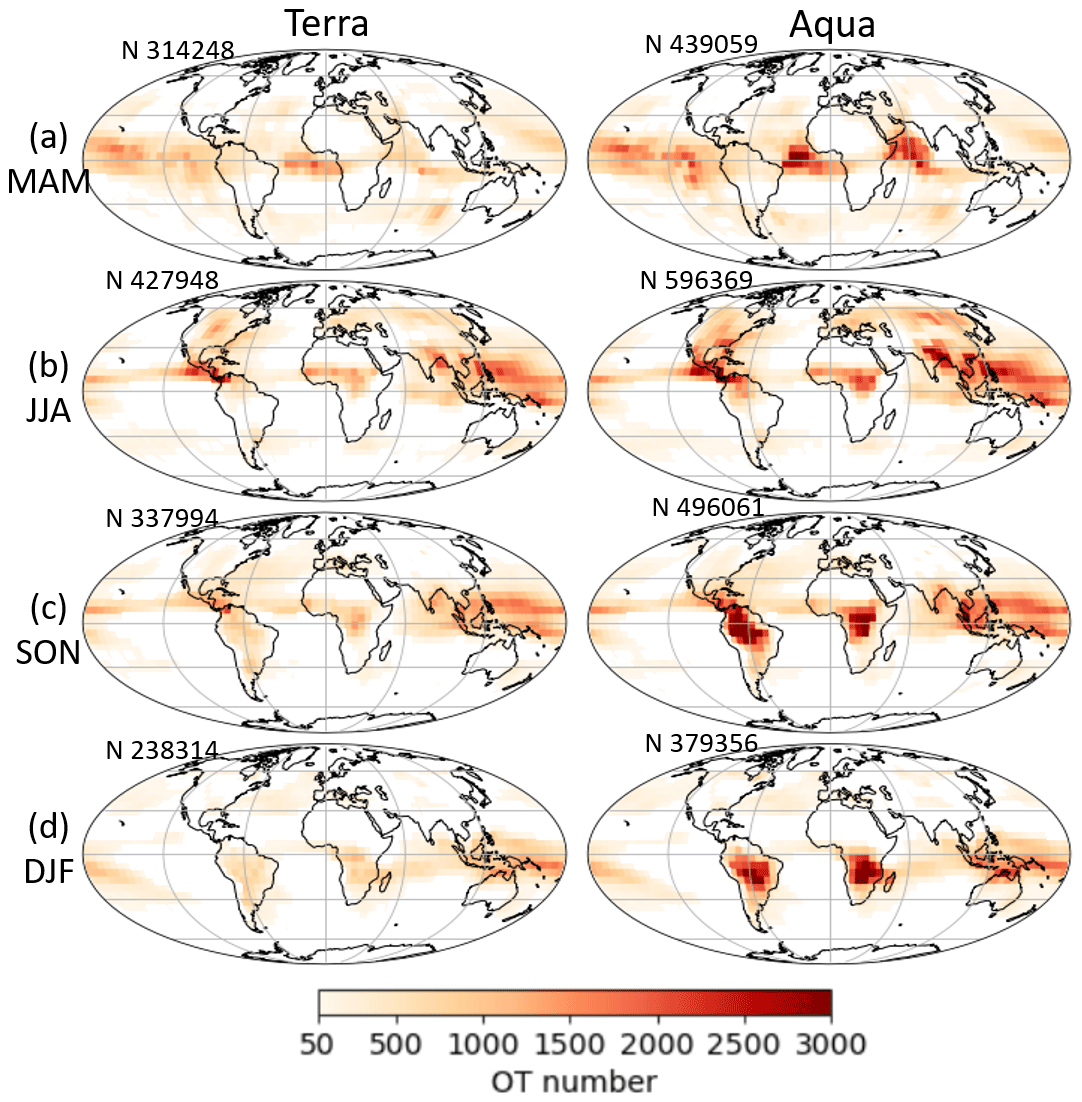
Figure 8The global distributions of OT occurrences derived from Terra and Aqua MODIS in four seasons. (a) March–April–May (MAM), (b) June–July–August (JJA), (c) September–October–November (SON), and (d) December–January–February (DJF). Grid resolution is 5∘ longitude by 5∘ latitude. Samples in grids of fewer than 50 pixels are shown in white. N in the upper right corner of each panel stands for sample number.
4.3 OT diurnal cycle
This section discusses OT diurnal cycles based on the four observation times by Aqua and Terra MODIS. The OT occurrences in the daytime (∼ 10:30 and ∼ 13:30) and at night (∼ 22:30 and ∼ 01:30) are displayed in Fig. 9. According to previous studies on the diurnal cycle of convection (Alcala and Dessler, 2002; Nesbitt and Zipser, 2003), convective activity over land is generally more frequent and intense in the afternoon and evening compared with early morning. Over oceans near the coastlines, morning convection is more intense (Johnson, 2011). In agreement with previous studies, we observe the most OT occurrences at about 13:30 from Aqua MODIS, primarily contributed by land areas including tropical South America, tropical Africa, the Maritime Continent, and the southern foothills of the Himalayas. Over the Bay of Bengal, South China Sea, Gulf of Guinea, Gulf of Mexico, Panama, and its surrounding regions, OTs have been observed away from coastlines, commencing in the morning (∼ 10:30) and continuing into the afternoon (∼ 13:30). Over the western Pacific Ocean, OTs occur the most around midnight at ∼ 01:30.
To better view the OT diurnal cycles, Fig. 10 shows when maximum and minimum OT occurrences occur within the four observation times. The diurnal cycle intensity, defined by the difference in maximum and minimum OT numbers normalized by the mean, is shown in Fig. 10e and f. As expected (Fig. 10a and b), the largest OT occurrences over land occur at about ∼ 13:30, except for central North America and West Africa, where there is a midnight maximum in the convection during JJA (Janiga and Thorncroft, 2014; Nesbitt and Zipser, 2003; Tian et al., 2005). Ocean areas consistently have a maximum OT occurrence at ∼ 01:30 (Fig. 10a and b). The minimum OT occurrence over land usually occurs at ∼ 10:30, except for some regions over North America and Asia, where the minimum OT occurrence is at ∼ 01:30 during JJA (Fig. 10c). The time for the minimum OT occurrence over ocean has a large variability.
The diurnal cycles of OT occurrences over ocean are generally weak (Fig. 10e and f) and are consistent with previous convection diurnal cycle analysis (Alcala and Dessler, 2002; Liu and Zipser, 2005; Nesbitt and Zipser, 2003). In contrast, the OT diurnal cycles over land are much stronger than over ocean. Strong regional variations are also discovered over land areas. Relatively strong OT diurnal cycles are found during JJA over southwestern North America, southeastern United States, Tibetan Plateau, and tropical South America and during DJF over southeast Australia, tropical and subtropical South America, and subtropical Africa. Relatively weak diurnal cycles over land are observed in central North America and West Africa in JJA. Strong regional variations in the OT diurnal cycle over land are consistent with previous studies based on convection and precipitation that demonstrate that the diurnal cycles are complicatedly modulated by the land–sea contrast, topography, coastline curvature, and response to solar heating to surface (Janiga and Thorncroft, 2014; Tian et al., 2005).
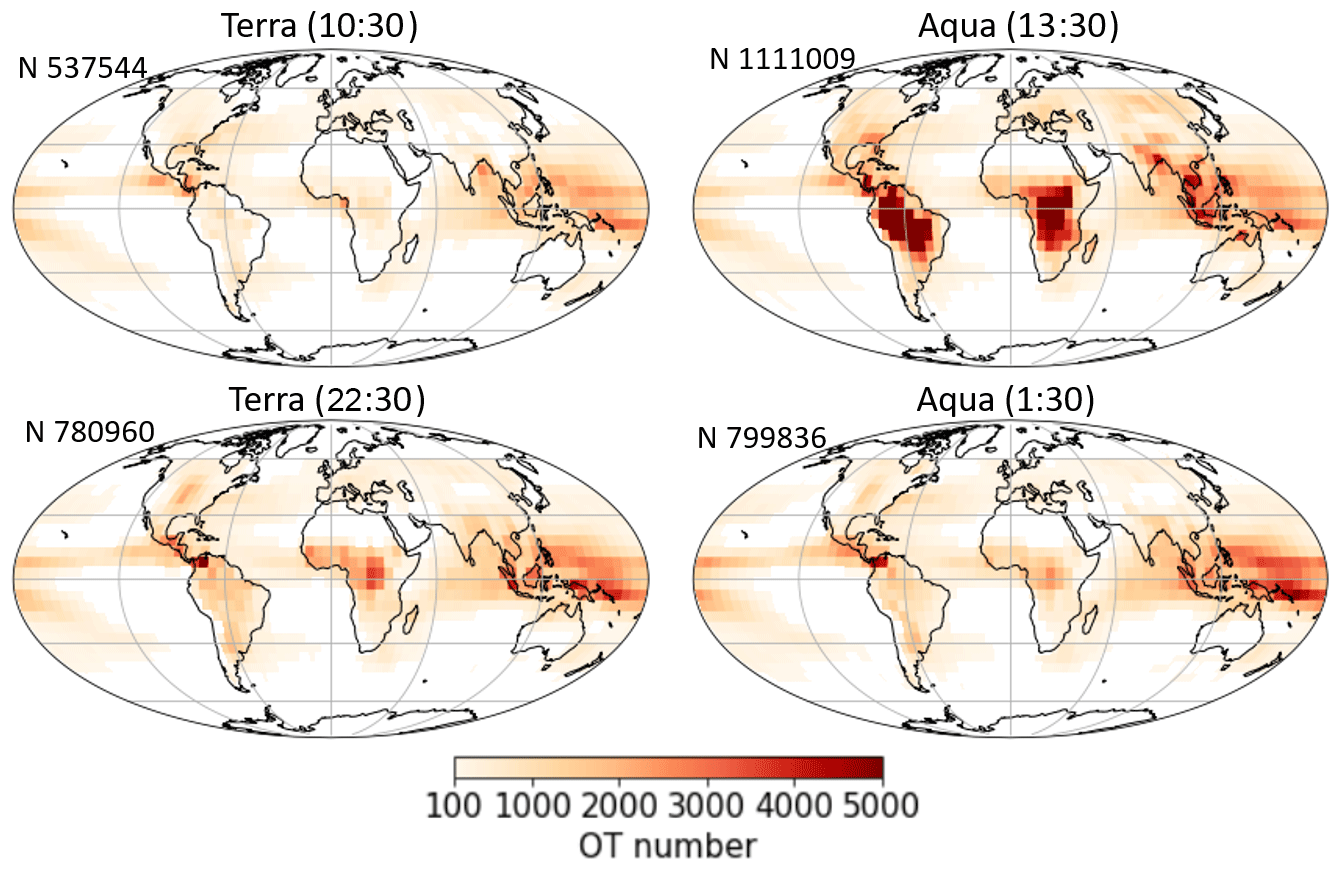
Figure 9The global distributions of OTs at four observation times. Grids with the OT number <100 are shown in white. N stands for sample number.
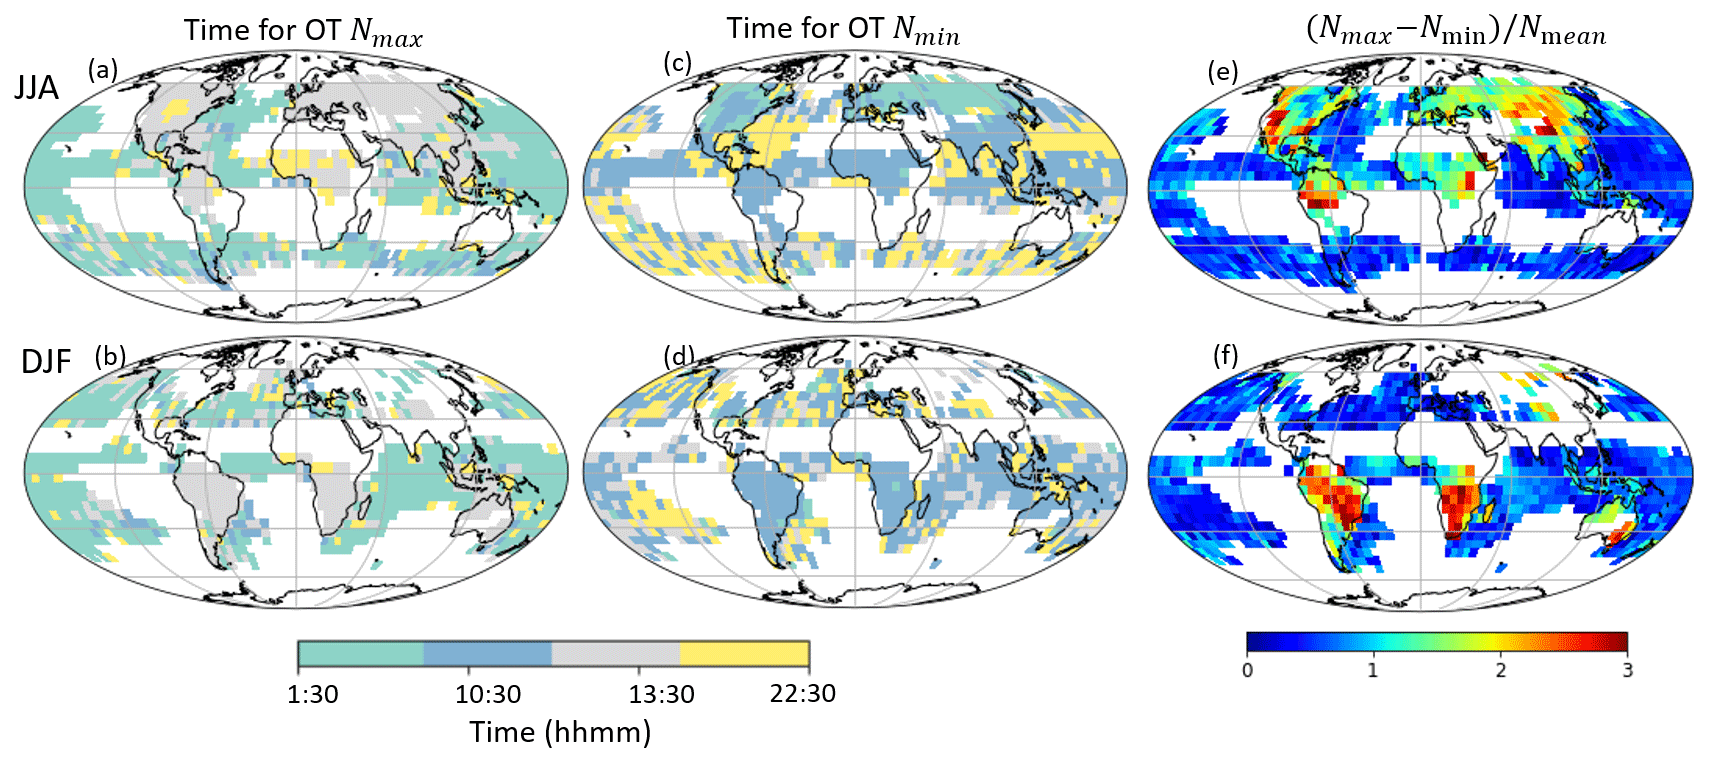
Figure 10Panels (a)–(d) are for the times when maximum and minimum OT occurrences occur across the four observation times. Panels (e)–(f) are for the diurnal intensity of OT occurrences, which are defined as the difference in the maximum and minimum OT occurrences that is normalized by the mean. Only when the minimum OT occurrences >10 in each 5∘ × 5∘ grid are the data shown.
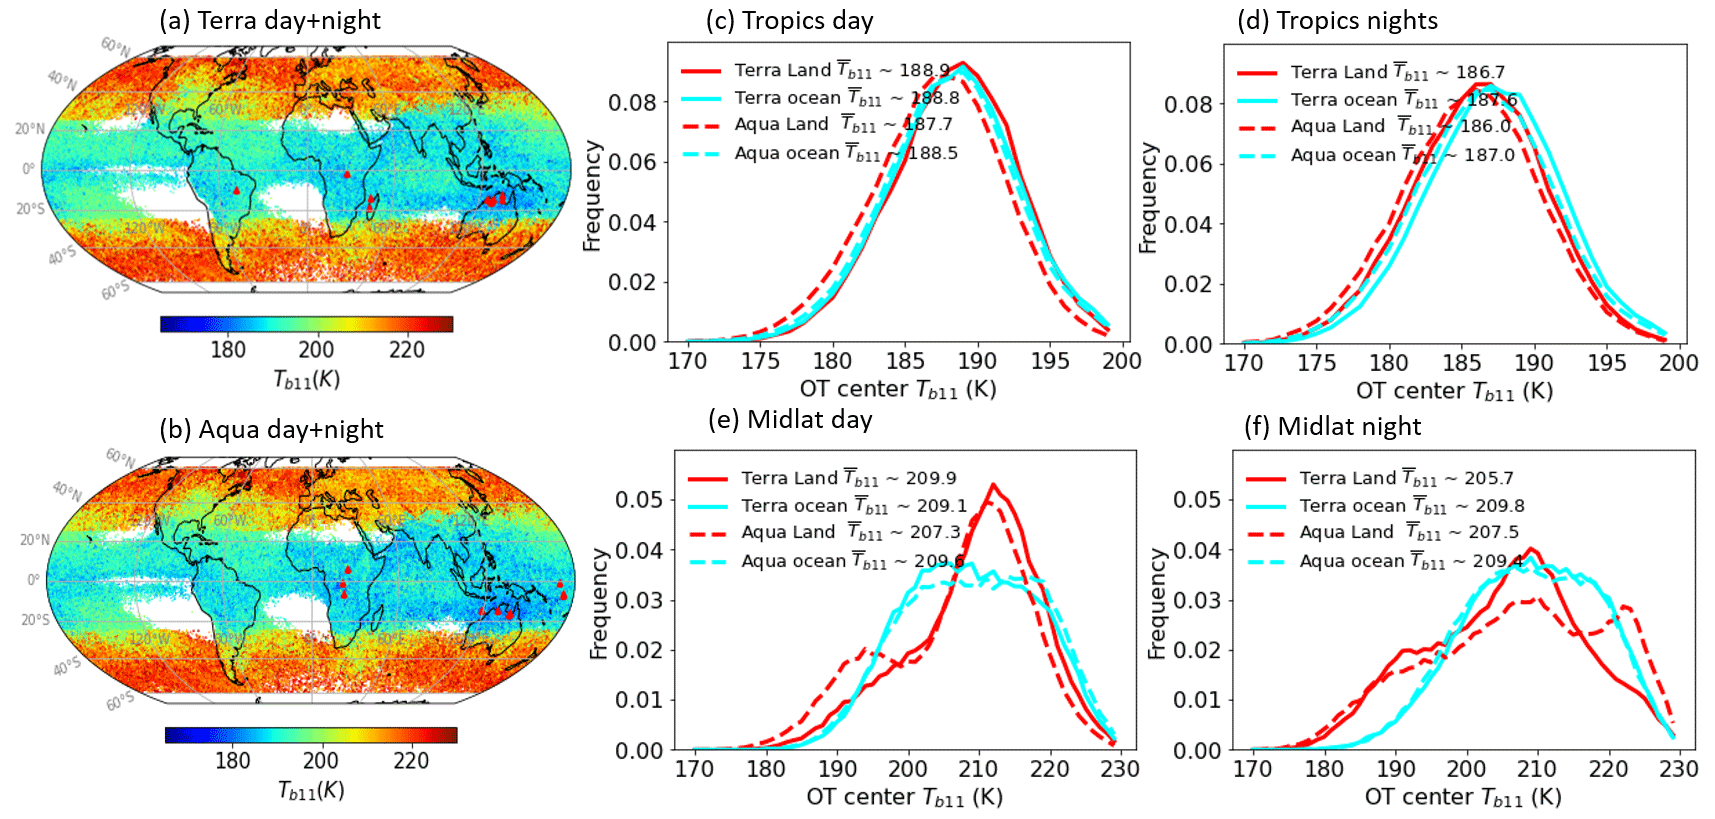
Figure 11Panels (a) and (b) are for spatial distributions of the OT center Tb11. Red triangles indicate the locations of top 10 coldest OTs. Panels (c)–(f) are for the OT center Tb11 probability density distributions (PDFs) in the tropics and midlatitudes and are segregated into daytime and nighttime values.
Table 2Summary of the top 10 coldest OTs from Terra and Aqua, respectively.
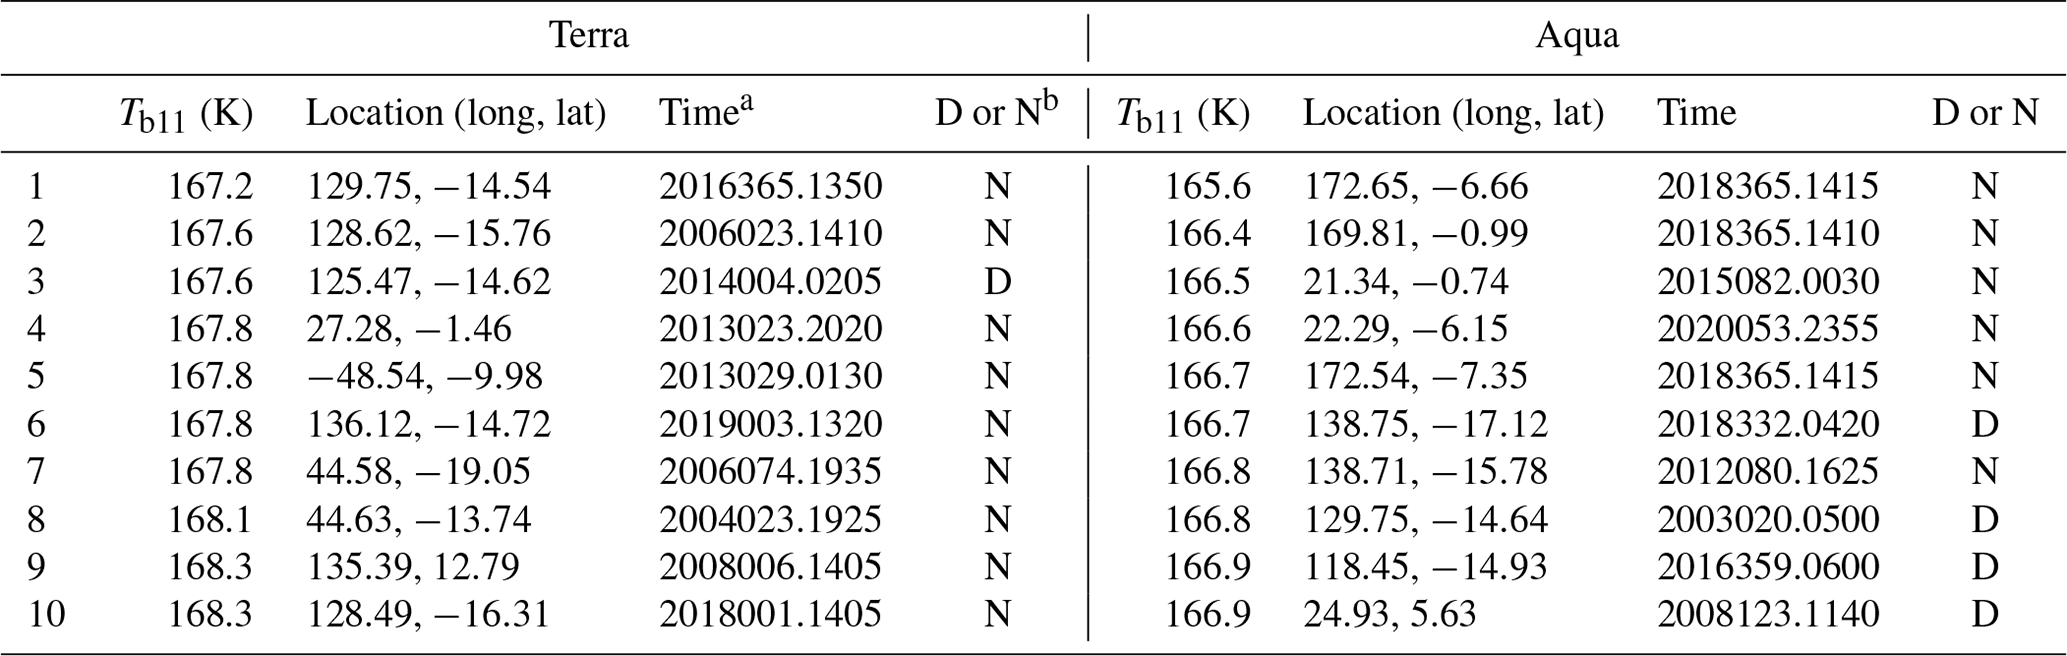
a Time in the format of yyyyddd.hhmm (e.g., 2016365.1350). b D for day and N for night.
4.4 Land–sea contrast
From the diurnal cycle analysis in Sect. 4.3, we have noticed some land–sea contrast in OT characteristics. For instance, OTs occur more frequently in the afternoon over land, whereas they are more frequent at midnight over ocean, and the OT occurrence diurnal cycle is stronger over land than over ocean. In this section, attention is given to the OT center Tb11, which indicates storm intensity. By checking the geospatial distributions of the OT center Tb11, we observe extremely cold OT center Tb11 (e.g., <180 K) appearing over the tropical regions, including regions near northern Australia, east of Papua New Guinea, India and the nearby Arabian Sea, tropical and subtropical Africa, and tropical and subtropical South America, as derived from both Aqua and Terra MODIS (Fig. 11a and b). The locations of cold OTs are also aligned with the places where intense convection occurs, based on TRMM (Zipser et al., 2006).
Particularly, the first 10 coldest OTs (marked with red triangles in Fig. 11 and summarized in Table 2) from Aqua and Terra MODIS nearly occur in the Southern Hemisphere, with more cases over land than over ocean. The top 10 coldest OTs from Aqua are colder than 167 K, with the coldest OT of 165.6 K over the east of Papua New Guinea, whereas Terra shows the coldest OT of 167.2 K occurring in northern Australia. This finding agrees with the cold OT distributions discussed in Proud and Bachmeier (2021), who state that an extremely cold tropopause coupled to an energetic overshooting top produced such a cloud-top temperature.
Additionally, Fig. 11a and b reveal colder OTs over land than over ocean at the same latitudes. By checking the probability density distributions (PDFs) of the OT center Tb11, we find that the land–sea contrast in OT Tb11 also relies on diurnal cycle. In the morning (∼10:30), when convection over land is weak, Tb11 over land is slightly warmer than over ocean in both the tropics and midlatitudes (Fig. 11c and e). Land–sea contrast in Tb11 is small at this time. At ∼13:30, as convection becomes stronger over land, Tb11 over land is on average 0.8 and 2.3 K colder than over ocean in the tropics and midlatitudes, respectively (Fig. 11c and e). In the nighttime (Fig. 11d and f), the land–sea contrast in Tb11 becomes stronger than in the daytime. In the tropics, Tb11 over land is about 1 K on average colder than that over ocean, whereas in the midlatitudes, it is about 2 K colder over land than over ocean.
Our findings indicate that OTs over land are more intense than over ocean, except for the early morning (∼10:30) when convection over the land is weak. These findings agree with previous studies that have shown more intense convection over land area that is associated with stronger updrafts than the oceanic counterpart (Jeyaratnam et al., 2021; Liu and Zipser, 2005).
To utilize about 2 decades' worth of MODIS records in the study of convective overshooting tops, we developed an IR algorithm to detect OTs from MODIS. The resultant OT climatology was used to understand OT regional and seasonal distributions, OT diurnal cycles, and OT land–sea contrast.
The approach to detect OTs uses IR radiances from MODIS water vapor (6.7 µm) and window (11 µm) channels. This approach was built upon the logistic regression, which was trained and validated with ∼287 OT candidates identified from the combined CloudSat–CALIPSO–MODIS (CCM) data. As demonstrated by 6 years of colocated GPM observations, the OT probability generated by the IR algorithm indicates storm intensity and represents a confidence level of OT detection. When OT probability is higher than 0.9, the accuracy for OT detection is better than about 0.9, as validated by a manual check.
The global and seasonal distributions of OT occurrences follow the expected pattern, based on the known climatology of deep convection and precipitation, which shifts with the ITCZ and monsoonal systems. Frequent OTs are also observed over central North American, Europe, northern Asia, and the northwestern Atlantic Ocean in summer. Our OT climatology also includes those OTs observed in the shallow convection over the midlatitude ocean during spring–winter cold-air outbreaks.
MODIS observations at four different times were used to derive part of the OT diurnal cycle. The diurnal cycle follows the known diurnal cycle of convection. The most OT occurrences are observed at about 13:30 over most land areas, including tropical and subtropical South America, tropical and subtropical Africa, southeastern North America, the foot of Himalayas, and the Maritime Continent. Over ocean, maximum OT occurrences are usually at around midnight (∼ 01:30), except for offshore ocean. OT occurrences in the morning (∼ 10:30) over the coastal ocean are apparent, which continue to the afternoon at ∼ 13:30. Minimum OT occurrences are usually at ∼ 10:30 over land. Over ocean, however, minimum occurrences can be at any time, except 01:30. Also, the OT diurnal cycle is stronger and more varied over land than over ocean.
Jeyaratnam et al. (2021) indicated that tropical convection is deeper than midlatitude convection. This is also revealed by the midlatitude tropic contrast in OT center Tb11 shown in this study (i.e., tropical OTs are colder than midlatitude OTs). In the tropics, the OT center Tb11 tends to be colder over land than over ocean, except at ∼ 10:30, when convection over land is weak. Also, the top 10 coldest OTs from either Terra or Aqua mostly occur over land. These results agree with previous studies that have confirmed that tropical land areas exhibit more intense overshooting convection than the tropical oceans (Alcala and Dessler, 2002; Liu and Zipser, 2005). Midlatitude OTs have stronger land–sea contrast in Tb11 than in the tropics, with OTs over land being 2.3, 4.1, and 1.9 K colder than that over ocean at about 13:30, 22:30, and 01:30, respectively.
This study has displayed a comprehensive analysis of OT occurrences over the globe for the first time, using MODIS data. As MODIS has a fine spatial resolution (1 km) and provides about 2 decades of stable climate records, results in this study are an important complement to the current OT climatology in the literature derived from GPM, the Geostationary Operational Environmental Satellite, and AMSU-B (Bedka et al., 2018; Hong et al., 2008; Liu et al., 2020). This study also lays a foundation for understanding near-global climatological distributions of hazardous thunderstorms, leading to valuable insights into intense updraft size distributions in deep convection over the globe.
CloudSat data, including 2B-GEOPROF, 2B-CLDLASS-LIDAR, and ECMWF-AUX, were downloaded from https://www.cloudsat.cira.colostate.edu/ (last access: 26 November 2021; CloudSat, 2023). GPM radar data are available at https://doi.org/10.5067/GPM/DPR/GPM/2A/07 (Iguchi and Meneghini, 2021). MODIS data are available at https://ladsweb.modaps.eosdis.nasa.gov/ (last access: 8 February 2022; EarthData, 2023). MERRA-2 data can be downloaded from https://goldsmr4.gesdisc.eosdis.nasa.gov/data/MERRA2/M2I1NXASM.5.12.4/ (last access: 12 May 2022; NASA, 2023). The dataset used for training and cross-validating the logistic regression is available in the Supplement (File S2). The dataset used for manually validating the logistic regression is available in the Supplement (File S3).
The supplement related to this article is available online at: https://doi.org/10.5194/amt-16-1391-2023-supplement.
YH, JT, SN, and LDL conceived this study. YH performed the analysis, collected data, and wrote the paper. SN collected the data, helped with the data analysis, and edited the paper. JT helped with interpretation of the results and edited the paper. LD joined in with result discussions and edited the paper.
The contact author has declared that none of the authors has any competing interests.
Publisher's note: Copernicus Publications remains neutral with regard to jurisdictional claims in published maps and institutional affiliations.
This work has mainly been supported by NASA (grant no. 80NSSC20K0902). The authors would like to acknowledge Guangyu Zhao for his help in downloading the Terra MODIS data. We thank the CloudSat Data Processing Center for providing CloudSat products, including 2B-GEOPROF, 2B-CLDCLASS-LIDAR, and ECMWF-AUX. We thank the Level-1 and Atmosphere Archive and Distribution System (LAADS) Distributed Active Archive Center (DAAC) for offering MODIS data (LAADS DAAC, 2022). We also acknowledge NASA's Goddard Earth Sciences Data and Information Services Center (GES DISC) for archiving MERRA-2 data and GPM data (Iguchi and Meneghini, 2021).
This research has been supported by the National Aeronautics and Space Administration (grant no. 80NSSC20K0902).
This paper was edited by Pawan K. Bhartia and reviewed by two anonymous referees.
Ackerman, S. A.: Global satellite observations of negative brightness temperature differences between 11 and 6.7 µm, J. Atmos. Sci., 53, 2803–2812, https://doi.org/10.1175/1520-0469(1996)053<2803:GSOONB>2.0.CO;2, 1996.
Adams, D. K. and Comrie, A. C.: The North American Monsoon, B. Am. Meteorol. Soc., 78, 2197–2213, https://doi.org/10.1175/1520-0477(1997)078<2197:TNAM>2.0.CO;2, 1997.
Alcala, C. M. and Dessler, A. E.: Observations of deep convection in the tropics using the Tropical Rainfall Measuring Mission (TRMM) precipitation radar, J. Geophys. Res.-Atmos., 107, 4792, https://doi.org/10.1029/2002JD002457, 2002.
Astin, I., Di Girolamo, L., and Van De Poll, H. M.: Bayesian confidence intervals for true fractional coverage from finite transect measurements: Implications for cloud studies from space, J. Geophys. Res.-Atmos., 106, 17303–17310, https://doi.org/10.1029/2001JD900168, 2001.
Barnes, W. L., Pagano, T. S., and Salomonson, V. V.: Prelaunch characteristics of the moderate resolution, IEEE Trans. Geosci. Remote Sens., 36, 1088–1100, 1998.
Bedka, K., Brunner, J., Dworak, R., Feltz, W., Otkin, J., and Greenwald, T.: Objective satellite-based detection of overshooting tops using infrared window channel brightness temperature gradients, J. Appl. Meteorol. Climatol., 49, 181–202, https://doi.org/10.1175/2009JAMC2286.1, 2010.
Bedka, K. M.: Overshooting cloud top detections using MSG SEVIRI Infrared brightness temperatures and their relationship to severe weather over Europe, Atmos. Res., 99, 175–189, https://doi.org/10.1016/j.atmosres.2010.10.001, 2011.
Bedka, K. M. and Khlopenkov, K.: A probabilistic multispectral pattern recognition method for detection of overshooting cloud tops using passive satellite imager observations, J. Appl. Meteorol. Climatol., 55, 1983–2005, https://doi.org/10.1175/JAMC-D-15-0249.1, 2016.
Bedka, K. M., Allen, J. T., Punge, H. J., Kunz, M., and Simanovic, D.: A long-term overshooting convective cloud-top detection database over Australia derived from MTSAT Japanese Advanced Meteorological Imager Observations, J. Appl. Meteorol. Climatol., 57, 937–951, https://doi.org/10.1175/JAMC-D-17-0056.1, 2018.
Bosilovich, M. G., Lucchesi, R., and Suarez, M.: MERRA-2: File Specification, Earth, 9, 73, http://gmao.gsfc.nasa.gov/pubs/office_notes (last access: 12 May 2022), 2016.
Chung, E. S., Sohn, B. J., Schmetz, J., and Koenig, M.: Diurnal variation of upper tropospheric humidity and its relations to convective activities over tropical Africa, Atmos. Chem. Phys., 7, 2489–2502, https://doi.org/10.5194/acp-7-2489-2007, 2007.
Chung, E. S., Sohn, B. J., and Schmetz, J.: CloudSat shedding new light on high-reaching tropical deep convection observed with Meteosat, Geophys. Res. Lett., 35, 1–5, https://doi.org/10.1029/2007GL032516, 2008.
Cloudsat: CloudSat DPC, CloudSat [data set], https://www.cloudsat.cira.colostate.edu/ (last access: 26 November 2021), 2023.
Dworak, R., Bedka, K., Brunner, J., and Feltz, W.: Comparison between GOES-12 overshooting-top detections, WSR-88D radar reflectivity, and severe storm reports, Weather Forecast., 27, 684–699, https://doi.org/10.1175/WAF-D-11-00070.1, 2012.
EarthData: Your Source for Level-1 and Atmospheric Data, EarthData [data set], https://ladsweb.modaps.eosdis.nasa.gov/ (last access: 8 February 2022), 2023.
Funk, C., Verdin, A., Michaelsen, J., Peterson, P., Pedreros, D., and Husak, G.: A global satellite-assisted precipitation climatology, Earth Syst. Sci. Data, 7, 275–287, https://doi.org/10.5194/essd-7-275-2015, 2015.
Geerts, B., Giangrande, S. E., McFarquhar, G. M., Xue, L., Abel, S. J., Comstock, J. M., Crewell, S., DeMott, P. J., Ebell, K., Field, P., Hill, T. C. J., Hunzinger, A., Jensen, M. P., Johnson, K. L., Juliano, T. W., Kollias, P., Kosovic, B., Lackner, C., Luke, E., Lüpkes, C., Matthews, A. A., Neggers, R., Ovchinnikov, M., Powers, H., Shupe, M. D., Spengler, T., Swanson, B. E., Tjernström, M., Theisen, A. K., Wales, N. A., Wang, Y., Wendisch, M., and Wu, P.: The COMBLE Campaign: A Study of Marine Boundary Layer Clouds in Arctic Cold-Air Outbreaks, B. Am. Meteorol. Soc., 103, E1371–E1389, https://doi.org/10.1175/bams-d-21-0044.1, 2022.
Gettelman, A., Salby, M. L., and Sassi, F.: Distribution and influence of convection in the tropical tropopause region, J. Geophys. Res.-Atmos., 107, 9–10, https://doi.org/10.1029/2001jd001048, 2002.
Gettelman, A., Forster, P. M. de F., Fujiwara, M., Fu, Q., Voömel, H., Gohar, L. K., Johanson, C., and Ammerman, M.: Radiation balance of the tropical tropopause layer, J. Geophys. Res., 109, D07103, https://doi.org/10.1029/2003JD004190, 2004.
Griffin, S. M.: Climatology of tropical overshooting tops in North Atlantic tropical cyclones, J. Appl. Meteorol. Climatol., 56, 1783–1796, https://doi.org/10.1175/JAMC-D-16-0413.1, 2017.
Griffin, S. M., Bedka, K. M., and Velden, C. S.: A method for calculating the height of overshooting convective cloud tops using satellite-based IR imager and CloudSat cloud profiling radar observations, J. Appl. Meteorol. Climatol., 55, 479–491, https://doi.org/10.1175/JAMC-D-15-0170.1, 2016.
Grise, K. M., Thompson, D. W. J., and Birner, T.: A global survey of static stability in the stratosphere and upper troposphere, J. Climate, 23, 2275–2292, https://doi.org/10.1175/2009JCLI3369.1, 2010.
Groenemeijer, P., Púcik, T., Holzer, A. M., Antonescu, B., Riemann-Campe, K., Schultz, D. M., Kühne, T., Feuerstein, B., Brooks, H. E., Doswell, C. A., Koppert, H. J., and Sausen, R.: Severe convective storms in Europe: Ten years of research and education at the European Severe Storms Laboratory, B. Am. Meteorol. Soc., 98, 2641–2651, https://doi.org/10.1175/BAMS-D-16-0067.1, 2017.
Heymsfield, G. M., Tian, L., Heymsfield, A. J., Li, L., and Guimond, S.: Characteristics of deep tropical and subtropical convection from nadir-viewing high-altitude airborne doppler radar, J. Atmos. Sci., 67, 285–308, https://doi.org/10.1175/2009JAS3132.1, 2010.
Hong, G., Heygster, G., Miao, J., and Kunzi, K.: Detection of tropical deep convective clouds from AMSU-B water vapor channels measurements, J. Geophys. Res.-Atmos., 110, 1–15, https://doi.org/10.1029/2004JD004949, 2005.
Hong, G., Heygster, G., Notholt, J., and Buehler, S. A.: Interannual to diurnal variations in tropical and subtropical deep convective clouds and convective overshooting from seven years of AMSU-B measurements, J. Climate, 21, 4168–4189, https://doi.org/10.1175/2008JCLI1911.1, 2008.
Hong, Y. and Liu, G.: The characteristics of ice cloud prop- erties derived from CloudSat and CALIPSO measurements, J. Climate, 28, 3880–3901, https://doi.org/10.1175/JCLI-D-14-00666.1, 2015.
Hong, Y. and Di Girolamo, L.: Cloud phase characteristics over Southeast Asia from A-Train satellite observations, Atmos. Chem. Phys., 20, 8267–8291, https://doi.org/10.5194/acp-20-8267-2020, 2020.
Hou, A. Y., Kakar, R. K., Neeck, S., Azarbarzin, A. A., Kummerow, C. D., Kojima, M., Oki, R., Nakamura, K., and Iguchi, T.: The global precipitation measurement mission, B. Am. Meteorol. Soc., 95, 701–722, https://doi.org/10.1175/BAMS-D-13-00164.1, 2014.
Hourngir, D., Panegrossi, G., Casella, D., Sanò, P., D'adderio, L. P., and Liu, C.: A 4-year climatological analysis based on gpm observations of deep convective events in the mediterranean region, Remote Sens., 13, 1–21, https://doi.org/10.3390/rs13091685, 2021.
Iguchi, T. and Meneghini, R.: GPM DPR Precipitation Profile L2A 1.5 hours 5 km V07, Greenbelt, MD, Goddard Earth Sciences Data and Information Services Center (GES DISC), NASA [data set], https://doi.org/10.5067/GPM/DPR/GPM/2A/07, 2021.
Janiga, M. A. and Thorncroft, C. D.: Convection over tropical Africa and the East Atlantic during the West African monsoon: Regional and diurnal variability, J. Climate, 27, 4189–4208, https://doi.org/10.1175/JCLI-D-13-00449.1, 2014.
Jeyaratnam, J., Luo, Z. J., Giangrande, S. E., Wang, D., and Masunaga, H.: A Satellite-Based Estimate of Convective Vertical Velocity and Convective Mass Flux: Global Survey and Comparison With Radar Wind Profiler Observations, Geophys. Res. Lett., 48, 1–11, https://doi.org/10.1029/2020GL090675, 2021.
Johnson, R. H.: Diurnal cycle of monsoon convection, The Global Monsoon System: Research and Forecast, edited by: Chang, C.-P., World Scientific Series on Asia-Pacific Weather and Climate, Vol. 5, World Scientific Publishing Company, 257–276, https://doi.org/10.1142/9789814343411_0015, 2011.
Khlopenkov, K. V., Bedka, K. M., Cooney, J. W., and Itterly, K.: Recent Advances in Detection of Overshooting Cloud Tops From Longwave Infrared Satellite Imagery, J. Geophys. Res.-Atmos., 126, 1–25, https://doi.org/10.1029/2020jd034359, 2021.
King, M. D., Kaufman, Y. J., Menzel, W. P., and Tanré, D.: Remote sensing of cloud, aerosol, and water vapor properties from the Moderate Resolution Imaging Spectrometer (MODIS), IEEE Trans. Geosci. Remote Sens., 30, 2–27, https://doi.org/10.1109/36.124212, 1992.
Li, H., Wei, X., Min, M., Li, B., Nong, Z., and Chen, L.: A Dataset of Overshooting Cloud Top from 12-Year CloudSat/CALIOP Joint Observations, Remote Sens., 14, 2417, https://doi.org/10.3390/rs14102417, 2022.
Liu, C. and Zipser, E. J.: Global distribution of convection penetrating the tropical tropopause, J. Geophys. Res.-Atmos., 110, 1–12, https://doi.org/10.1029/2005JD006063, 2005.
Liu, N. and Liu, C.: Global distribution of deep convection reaching tropopause in 1 year GPM observations, J. Geophys. Res.-Atmos., 121, 3924–3842, https://doi.org/10.1002/ 2015JD024430, 2016.
Liu, N., Liu, C., and Hayden, L.: Climatology and Detection of Overshooting Convection From 4 Years of GPM Precipitation Radar and Passive Microwave Observations, J. Geophys. Res.-Atmos., 125, 1–14, https://doi.org/10.1029/2019JD032003, 2020.
Marchand, R., Mace, G. G., Ackerman, T., and Stephens, G.: Hydrometeor detection using Cloudsat - An earth-orbiting 94-GHz cloud radar, J. Atmos. Ocean. Technol., 25, 519–533, https://doi.org/10.1175/2007JTECHA1006.1, 2008.
Marion, G. R., Trapp, R. J., and Nesbitt, S. W.: Using overshooting top area to discriminate potential for large, intense tornadoes, Geophys. Res. Lett., 46, 12520–12526, https://doi.org/10.1029/2019GL084099, 2019.
Monette, S. A., Velden, C. S., Griffin, K. S., and Rozoff, C. M.: Examining trends in satellite-detected tropical overshooting tops as a potential predictor of tropical cyclone rapid intensification, J. Appl. Meteorol. Climatol., 51, 1917–1930, https://doi.org/10.1175/JAMC-D-11-0230.1, 2012.
Murphy, A. M., Rauber, R. M., McFarquhar, G. M., Finlon, J. A., Plummer, D. M., Rosenow, A. A., and Jewett, B. F.: A microphysical analysis of elevated convection in the comma head region of continental winter cyclones, J. Atmos. Sci., 74, 69–91, https://doi.org/10.1175/JAS-D-16-0204.1, 2017.
NASA: goldsmr4.gesdisc.eosdis.nasa.gov, NASA [data set], https://goldsmr4.gesdisc.eosdis.nasa.gov/data/MERRA2/M2I1NXASM.5.12.4/ (last access: 12 May 2022), 2023.
Nesbitt, S. W. and Zipser, E. J.: The diurnal cycle of rainfall and convective intensity according to three years of TRMM measurements, J. Climate, 16, 1456–1475, https://doi.org/10.1175/1520-0442(2003)016<1456:TDCORA>2.0.CO;2, 2003.
Papritz, L., Rouges, E., Aemisegger, F., and Wernli, H.: On the Thermodynamic Preconditioning of Arctic Air Masses and the Role of Tropopause Polar Vortices for Cold Air Outbreaks From Fram Strait, J. Geophys. Res.-Atmos., 124, 11033–11050, https://doi.org/10.1029/2019JD030570, 2019.
Partain, P.: Cloudsat ECMWF-AUX auxiliary data process description and interface control document, Coop. Inst. Res. Atmos. Color. State Univ., http://129.82.109.192/ICD/ECMWF-AUX/ECMWF-AUX_PDICD_3.0.pdf (last access: 26 November 2021), 2007.
Platnick, S., King, M. D., Ackerman, S. A., Menzel, W. P., Baum, B. A., Riédi, J. C., and Frey, R. A.: The MODIS cloud products: Algorithms and examples from Terra, IEEE Trans. Geosci. Remote Sens., 41, 459–473, https://doi.org/10.1109/TGRS.2002.808301, 2003.
Proud, S. R.: Analysis of overshooting top detections by Meteosat Second Generation: A 5-year dataset, Q. J. Roy. Meteorol. Soc., 141, 909–915, https://doi.org/10.1002/qj.2410, 2015.
Proud, S. R. and Bachmeier, S.: Record-low cloud temperatures associated with a tropical deep convective event, Geophys. Res. Lett., 48, e2020GL092261, https://doi.org/10.1029/2020GL092261, 2021.
Rauber, R. M., Wegman, J., Plummer, D. M., Rosenow, A. A., Peterson, M., McFarquhar, G. M., Jewett, B. F., Leon, D., Market, P. S., Knupp, K. R., Keeler, J. M., and Battaglia, S. M.: Stability and charging characteristics of the comma head region of continental winter cyclones, J. Atmos. Sci., 71, 1559–1582, https://doi.org/10.1175/JAS-D-13-0253.1, 2014.
Rauber, R. M., Plummer, D. M., Macomber, M. K., Rosenow, A. A., McFarquhar, G. M., Jewett, B. F., Leon, D., Owens, N., and Keeler, J. M.: The role of cloud-top generating cells and boundary layer circulations in the finescale radar structure of a winter cyclone over the great lakes, Mon. Weather Rev., 143, 2291–2318, https://doi.org/10.1175/MWR-D-14-00350.1, 2015.
Rysman, J. F., Claud, C., and Delanoe, J.: Monitoring Deep Convection and Convective Overshooting from 60∘ S to 60∘ N Using MHS: A Cloudsat/CALIPSO-Based Assessment, IEEE Geosci. Remote Sens. Lett., 14, 159–163, https://doi.org/10.1109/LGRS.2016.2631725, 2017.
Schmetz, J., Tjemkes, S. A., Gube, M., and Van De Berg, L.: Monitoring deep convection and convective overshooting with METEOSAT, Adv. Sp. Res., 19, 433–441, https://doi.org/10.1016/S0273-1177(97)00051-3, 1997.
Setvák, M., Rabin, R. M., and Wang, P. K.: Contribution of the MODIS instrument to observations of deep convective storms and stratospheric moisture detection in GOES and MSG imagery, Atmos. Res., 83, 505–518, https://doi.org/10.1016/j.atmosres.2005.09.015, 2007.
Setvák, M., Bedka, K., Lindsey, D. T., Sokol, A., Charvát, Z., Šťástka, J., and Wang, P. K.: A-Train observations of deep convective storm tops, Atmos. Res., 123, 229–248, https://doi.org/10.1016/j.atmosres.2012.06.020, 2013.
Shikhov, A., Chernokulsky, A., Kalinin, N., Bykov, A., and Pischalnikova, E.: Climatology and Formation Environments of Severe Convective Windstorms and Tornadoes in the Perm Region (Russia) in 1984–2020, Atmosphere (Basel), (12), 1407, https://doi.org/10.3390/atmos12111407, 2021.
Stephens, G. L., Vane, D. G., Boain, R. J., Mace, G. G., Sassen, K., Wang, Z., Illingworth, A. J., O'Connor, E. J., Rossow, W. B., Durden, S. L., Miller, S. D., Austin, R. T., Benedetti, A., and Mitrescu, C.: The cloudsat mission and the A-Train: A new dimension of space-based observations of clouds and precipitation, B. Am. Meteorol. Soc., 83, 1771–1790, https://doi.org/10.1175/BAMS-83-12-1771, 2002.
Stephens, G. L., Vane, D. G., Tanelli, S., Im, E., Durden, S., Rokey, M., Reinke, D., Partain, P., Mace, G. G., Austin, R., L'Ecuyer, T., Haynes, J., Lebsock, M., Suzuki, K., Waliser, D., Wu, D., Kay, J., Gettelman, A., Wang, Z., and Marchand, R.: CloudSat mission: Performance and early science after the first year of operation, J. Geophys. Res., 113, D00A18, https://doi.org/10.1029/2008JD009982, 2008.
Stewart, R. E., Szeto, K. K., Reinking, R. F., Clough, S. A., and Ballard, S. P.: Midlatitude cyclonic cloud systems and their features affecting large scales and climate, Rev. Geophys., 36, 245–273, https://doi.org/10.1029/97RG03573, 1998.
Sun, L. X., Zhuge, X. Y., and Wang, Y.: A Contour-Based Algorithm for Automated Detection of Overshooting Tops Using Satellite Infrared Imagery, IEEE Trans. Geosci. Remote Sens., 57, 497–508, https://doi.org/10.1109/TGRS.2018.2857486, 2019.
Tao, C. and Jiang, H.: Global distribution of hot towers in tropical cyclones based on 11-Yr TRMM data, J. Climate, 26, 1371–1386, https://doi.org/10.1175/JCLI-D-12-00291.1, 2013.
Terpstra, A., Renfrew, I. A., and Sergeev, D. E.: Characteristics of cold-air outbreak events and associated polar mesoscale cyclogenesis over the north Atlantic region, J. Climate, 34, 4567–4584, https://doi.org/10.1175/JCLI-D-20-0595.1, 2021.
Tian, B., Soden, B. J., and Wu, X.: Diurnal cycle of convection, clouds, and water vapor in the tropical upper troposphere: Satellites versus a general circulation model, J. Geophys. Res.-Atmos., 109, 1–16, https://doi.org/10.1029/2003JD004117, 2004.
Tian, B., Held, I. M., Lau, N. C., and Soden, B. J.: Diurnal cycle of summertime deep convection over North America: A satellite perspective, J. Geophys. Res.-Atmos., 110, 1–10, https://doi.org/10.1029/2004JD005275, 2005.
Trapp, R. J., Marion, G. R., and Nesbitt, S. W.: The regulation of tornado intensity by updraft width, J. Atmos. Sci., 74, 4199–4211, https://doi.org/10.1175/JAS-D-16-0331.1, 2017.
Vergados, P., Luo, Z. J., Emanuel, K., and Mannucci, A. J.: Observational tests of hurricane intensity estimations using GPS radio occultations, J. Geophys. Res.-Atmos., 119, 1936–1948, https://doi.org/10.1002/2013JD020934, 2014.
Wang, C., Luo, Z. J., and Huang, X.: Parallax correction in collocating CloudSat and Moderate Resolution Imaging Spectroradiometer (MODIS) observations: Method and application to convection study, J. Geophys. Res.-Atmos., 116, 1–9, https://doi.org/10.1029/2011JD016097, 2011.
Wang, Z., Vane, D., and Staphens, G.: Level 2 Combined Radar and Lidar Cloud Scenario Classification Product Process Description and Interface Control document, http://scholar.google.com/scholar?hl=en&btnG=Search&q=intitle:Level+2+Combined+Radar+and+Lidar+Cloud+Scenario+Classification+Product+Process+Description+and+Interface+Control+Document#1 (last access: 26 November 2021), 2012.
Wilcox, L. J., Hoskins, B. J., and Shine, K. P.: A global blended tropopause based on ERA data. Part I: Climatology, Q. J. Roy. Meteorol. Soc., 138, 561–575, https://doi.org/10.1002/qj.951, 2012.
Winker, D. M., Pelon, J. R., and McCormick, M. P.: The CALIPSO mission: Spaceborne lidar for observation of aerosols and clouds, Lidar Remote Sens. Ind. Environ. Monit. III, 4893, 1–11, https://doi.org/10.1117/12.466539, 2003.
Xiong, X., Sun, J., Wu, A., Chiang, K.-F., Esposito, J., and Barnes, W.: Terra and Aqua MODIS calibration algorithms and uncertainty analysis, Sensors, Syst. Next-Generation Satell. IX, 5978, 59780V, https://doi.org/10.1117/12.627631, 2005.
Xiong, X., Angal, A., Barnes, W. L., Chen, H., Chiang, V., Geng, X., Li, Y., Twedt, K., Wang, Z., Wilson, T., and Wu, A.: Updates of Moderate Resolution Imaging Spectroradiometer on-orbit calibration uncertainty assessments, J. Appl. Remote Sens., 12, 1, https://doi.org/10.1117/1.jrs.12.034001, 2018.
Yuter, S. E. and Houze, R. A.: Three-dimensional kinematic and microphysical evolution of Florida cumulonimbus. Part II: Frequency distributions of vertical velocity, reflectivity, and differential reflectivity, Mon. Weather Rev., 123, https://doi.org/10.1175/1520-0493(1995)123<1941:TDKAME>2.0.CO;2, 1995.
Zhuge, X. Y., Ming, J., and Wang, Y.: Reassessing the use of inner-core hot towers to predict tropical cyclone rapid intensification, Weather Forecast., 30, 1265–1279, https://doi.org/10.1175/WAF-D-15-0024.1, 2015.
Zipser, E. J., Cecil, D. J., Liu, C., Nesbitt, S. W., and Yorty, D. P.: Where are the most intense thunderstorms on Earth?, B. Am. Meteorol. Soc., 87, 1057–1071, https://doi.org/10.1175/BAMS-87-8-1057, 2006.