the Creative Commons Attribution 4.0 License.
the Creative Commons Attribution 4.0 License.
 | 17 Mar 2023
Intercomparison of commercial analyzers for atmospheric ethane and methane observations
Andrew Hallward-Driemeier
Lee T. Murray
Methane (CH4) is a strong greenhouse gas that has become the focus of climate mitigation policies in recent years. Ethane/methane ratios can be used to identify and partition the different sources of methane, especially in areas with natural gas mixed with biogenic methane emissions, such as cities. We assessed the precision, accuracy, and selectivity of three commercially available laser-based analyzers that have been marketed as measuring instantaneous dry-mole fractions of methane and ethane in ambient air. The Aerodyne SuperDUAL instrument performed the best out of the three instruments, but it is large and requires expertise to operate. The Aeris Mira Ultra LDS analyzer also performed well for the price point and small size, but it required characterization of the water vapor dependence of reported concentrations and careful set-up for use. The Picarro G2210-i precisely measured methane, but it did not detect the 10 ppbv (part-per-billion by volume) increases in ambient ethane detected by the other two instruments when sampling a plume of incompletely combusted natural gas. For long-term tower deployments or those with large mobile laboratories, the Aerodyne SuperDUAL provides the best precision for methane and ethane. The more compact Aeris MIRA can, with careful use, quantify thermogenic methane sources to sufficient precision for mobile and short-term deployments in urban or oil and gas areas. We weighed the advantages of each instrument, including size, power requirement, ease of use on mobile platforms, and expertise needed to operate the instrument. We recommend the Aerodyne SuperDUAL or the Aeris MIRA Ultra LDS depending on the situation.
- Article
(1891 KB) - Full-text XML
-
Supplement
(55303 KB) - BibTeX
- EndNote


The atmospheric concentrations of methane (CH4), a strong greenhouse gas, have been rising at an unprecedented rate in recent years, with record-breaking growth rates since 2020 (https://gml.noaa.gov/ccgg/trends_ch4/, last access: 31 January 2023). Methane has an atmospheric lifetime of ∼ 10 years compared to ∼ 100 years for carbon dioxide (CO2) and absorbs over 80 times more heat than CO2 over 20 years (Szopa et al., 2021). Both of these characteristics make the reduction of methane emissions a priority target for short-term reductions in anthropogenic global warming. In recent years, methane has become the target of climate mitigation policies at many levels of government, including international (e.g., founding of the International Methane Emissions Observatory (IMEO) in 2022, funded by the United Nations Environment Programme), national (e.g., Inflation Reduction Act, 2022, USA), and local (e.g., New York's Climate Leadership and Community Protection Act (CLCPA), with over 50 cities in the US banning natural gas new construction).
Methane sources are categorized as thermogenic (e.g., oil, natural gas, and coal mining) or biogenic, which can be both natural (e.g., wetlands) or anthropogenic (e.g., agriculture, landfills, and sewage) in origin (Saunois et al., 2020). Each of these methane sources co-emits different trace gas species, which we can be used to identify the source of methane. Thermogenic sources of methane, such as natural gas, also contain ethane (C2H6) and other hydrocarbons. The incomplete combustion of liquid (e.g., natural gas) or solid (e.g., coal or wood) fuels can co-emit high concentrations of carbon monoxide (CO) and other volatile organic compounds (VOCs). Biogenic sources of methane do not co-emit ethane but can emit carbon dioxide (CO2) and more odorous trace gases such as hydrogen sulfide (H2S). Therefore, ethane can be used to distinguish between thermogenic (methane and/or ethane co-emitted) and biogenic (no ethane emitted) sources of methane. Many studies have used methane/ethane ratios to identify natural gas leaks in the natural-gas production and distribution networks (Smith et al., 2015; Wunch et al., 2016; Gvakharia et al., 2017; Floerchinger et al., 2019). Methane and ethane observations have also been used for mobile and stationary sampling in urban areas across many countries to identify natural gas leaks separately from biogenically produced methane (McKain et al., 2015; Lamb et al., 2016; Maazallahi et al., 2020; Defratyka et al., 2021).
Methane-monitoring networks are being developed for city, state, and national scales with the goal of evaluating the efficacy of methane reduction policies (Karion et al., 2020; Sargent et al., 2021; He et al., 2019; Mueller et al., 2021). Many of these networks will need to partition the contribution of methane between thermogenic and biogenic sources. In recent years, commercial analyzers have been developed to measure methane and ethane at ambient concentrations, and many of these analyzers are marketed as allowing users to identify the sources of methane. As far as we can tell, there has not yet been a systematic assessment and characterization of these newly available laser-based ethane spectrometers. There is also little guidance available to those now charged with instrumenting networks and mobile platforms for methane source apportionment.
Here, we evaluated three laser-based spectrometers that are marketed as measuring ambient dry-mole fractions of ethane and methane: (i) a cavity-enhanced infrared (IR) absorption spectrometer (Aerodyne Research Inc. SuperDUAL QCl/ICL), (ii) a mid-IR absorption spectrometer (Aeris Technologies Mira Ultra LDS), and (iii) a cavity ring down spectrometer (CRDS) (Picarro G2210-i). The precision and accuracy of each instrument was evaluated and compared to the advertised performance. We tested the water vapor response and assessed the long-term operation needs of each instrument. Finally, we evaluated the performance of each instrument while sampling urban air at a rooftop site with large natural gas and biogenic emissions in the urban core of New York City in February 2022. We examine the requirements for the long-term operation of each analyzer and make recommendations for operation.
2.1 Description of analyzers
Each of the analyzers described below reports the dry-mole fraction of methane and ethane in air using units of ppbv, parts-per-billion by volume, which is the equivalent of nmol mol−1 for an ideal gas.
2.1.1 Aerodyne Research Inc. SuperDUAL
Various configurations of Aerodyne laser spectrometers have been used to measure methane and ethane in stationary (McKain et al., 2015), ground-based mobile (Yacovitch et al., 2014) and airborne (Kostinek et al., 2019; Plant et al., 2019) platforms. These spectrometers use a continuous-wave interband cascade laser (ICL)-based spectrometer to measure methane, ethane, and water vapor. ICLs are often used in a two-laser system alongside a continuous-wave quantum cascade laser (QCL) to measure dry-mole fractions of carbon dioxide (CO2), carbon monoxide (CO), and nitrous oxide (N2O). Here, we use a SuperDUAL configuration of a two-laser system with a 2 L astigmatic Herriott cell (path length 210 m) at 50 Torr pressure. The instrument was manufactured in 2015 and refurbished with new lasers in 2020. We use the provided TDLWintel software to fit the absorption spectra and to quantify five target gases and water vapor. The ICL (Laser 1) sweeps from 2988.520 to 2990.625 cm−1 to detect CH4, C2H6, and H2O. The edge of the ethane absorption feature (2990.081 cm−1) includes a small methane peak (2989.98 cm−1) that is fixed to the value determined from the main fit at 2989.003 cm−1. The QCL (Laser 2) sweeps from 2227.550 to 2228.000 cm−1 and includes absorption features for 13CO2 (2227.605 cm−1), CO (2227.639 cm−1), N2O (2227.843 cm−1), and H2O. We use the default water-broadening coefficient (WBC) for all species (WBC = 2) except CO (WBC = 1.45). The analyzer is large and heavy (56 cm × 77 cm × 64 cm; 75 kg) and requires an external pump and chiller (to maintain laser temperature stability) that require a stable power source. The instrument has been used extensively and successfully for long-term ground site observations and mobile-laboratory deployments, but it is not suitable for smaller or car-based mobile sampling. As part of our regular ambient sampling, the Aerodyne SuperDUAL samples nitrogen gas each hour to account for instrument drift, which is especially evident in lower-concentration species such as ethane. A smooth spline is fitted to the reported zero for each gas species and subtracted from the 1 Hz data.
2.1.2 Aeris Technologies MIRA Ultra LDS
The Aeris Technologies MIRA Ultra LDS (product no. 100209, manufactured July 2021) uses a mid-IR ICL (∼ 3000 cm−1 range) with a multi-pass cell. There are few descriptions of the Aeris MIRA, but (Travis et al., 2020) described a similar, portable version of the instrument with an onboard battery (MIRA Pico, not evaluated here). The multi-pass cell (60 cm3) has a path length of 13 m, and an internal pump maintains the cell pressure at 180 Torr with a ∼ 380 sccm flow rate. The small footprint of the rackmount configured analyzer (43 cm× 28 cm × 13 cm; 5 kg) makes it ideal for car-based mobile sampling. The current configuration using a small internal pump is not suitable for sampling below ambient pressure, and care should be taken when configuring the system when sampling through long lines on towers.
2.1.3 Picarro G2210-i
The Picarro G2210-i (product no. 3441-RFIDS2010, manufactured August 2019) is a cavity ring down spectrometer that measures CH4, CO2, C2H6, and δ13C-CH4. The instrument uses an external pump to reach a cell pressure of 148 Torr and a flow rate of 24 sccm through a cavity of 35 cm3 with a path length of up to 30 km (https://www.picarro.com/support/library/documents/g2210i_analyzer_datasheet, last access: 31 January 2023). The measurement and reporting cycle of the Picarro G2210-i are 1 Hz. But the low flow rate reduces the instrument response time considerably. We have corrected for the delay and report methane at 1 Hz, and we have averaged the ethane to 10 s and 5 min. Methane data from the instrument have been used on mobile (O'Connell et al., 2019) and stationary (Lebel et al., 2020) platforms and are also mentioned in Defratyka et al. (2021), but none of these studies have discussed or shown the observed ethane concentrations. The datasheet indicates that the instrument is designed to sample ambient air but may have interferences from elevated concentrations of gas species such as hydrogen sulfide (H2S) or volatile organic compounds (VOCs).
2.2 Instrument evaluation setup
2.2.1 Humidity
The humidity of the sample line for the instruments was varied using a Perma Pure Nafion (™) dryer. Nafion dryers have a semi-permeable membrane separating an internal sample gas stream from a counterflow purge gas stream contained within a stainless-steel outer shell. If the partial pressure of water vapor is higher in the purge gas stream, then water is added to the sample gas stream. A counter flow of air was drawn through the Nafion at ∼ 2000 sccm using a vacuum pump. The inlet to the counter flow alternatively sampled the top of a container of water or dry air-conditioned air in the observatory. To achieve the lowest humidity, dry nitrogen was pushed through the Nafion. The flow rate through the Nafion was controlled using a ball valve and allowed for different rates of changes in the humidity. No liquid water was introduced to the sample lines for the instruments. A range of water vapor from 3 % to 0.05 % was used for all instruments except for the Aeris Mira Ultra LDS ethane data, which was cut off at 1.05 % water vapor (for reasons discussed below).
2.2.2 Calibrations against NOAA standards
Each of the instruments sampled two ambient-range cylinders calibrated by the Central Calibration Laboratory (CCL) at the National Oceanographic and Atmospheric Administration (NOAA) Global Monitoring Laboratory (GML) in Boulder, CO. CCL maintains the World Meteorological Organization (WMO) methane scale (WMO X2004A) and an internal CCL standard for ethane (C2H6-2012). A cylinder of dry, compressed air was used to test multi-hour instrument stability.
2.2.3 Instrument precision
We evaluated the instrument precision by running a calibrated compressed-air cylinder for a 4 h period and calculating Allan–Werle variance and precision (also called continuous measurement repeatability – CMR (Defratyka et al., 2021; Yver Kwok et al., 2015)). During this time, the regular zero for the Aerodyne SuperDUAL was not performed to allow for direct comparison of all instruments. The Aeris MIRA and Picarro G2210-i were humidified (1.7 % H2O–1.9 % H2O) to allow the Aeris MIRA to report ethane (see Sect. 3.1). The Aerodyne SuperDUAL was not humidified and reported less than 0.054 % H2O for the same tests.
2.2.4 Nitrogen tests
During regular ambient operation, the Aerodyne SuperDUAL samples nitrogen gas each hour to account for instrument drift. We use the boil off from a large liquid nitrogen dewar, which can be refilled on site and which contains a variable mole fraction of carbon monoxide (∼ 250 ppbv) and may contain trace levels of oxygen and argon. Regular nitrogen sampling is not required for the long-term operation of either the Picarro G2210-i or the Aeris MIRA. We evaluated the short-term repeatability of the Aeris MIRA and Picarro G2210-i when sampling dry and humidified nitrogen.
2.3 Site description and sampling of ambient urban air
The City University of New York (CUNY) Next Generation Environmental Sensor (NGENS) Observatory is on the rooftop of the 56 m building in Hamilton Heights in Harlem. The sampling point is ∼ 93 m above sea level on a tower at the south end of the building. The Aerodyne SuperDUAL has been operated at the site over a number of years and was running from early January–June 2022. The site samples urban air that has been influenced by natural gas emissions (both pre- and post-combustion), wastewater treatment plants (North River to the northwest, Ward Island to the east), and street-level emissions from sewers. During the long-term operation of the Aerodyne SuperDUAL, nitrogen (liquid nitrogen boil off, N2) is added as a test of the zero drift in the instrument. For the experiments described here, N2 was used hourly during ambient sampling and prior to and after the compressed-air tank test runs. When the Aerodyne SuperDUAL is operated independently, air is drawn through ∼ 10 m of 0.5 in. Synflex tubing at 20 L min−1 using a diaphragm pump before being sub-sampled by the Aerodyne SuperDUAL (flow rate 1.7 L min−1). The use of a separate pump to increase the total flow rate and to reduce instrument response times is common for ground operation with longer tubing (e.g., towers). However, the pump also reduces the pressure within the tubing to below ambient pressure, which was a problem when sampling with the smaller pump capacity of the Aeris MIRA. For the work described here, the external pump was removed, and the response time through the tubing was reduced to 30 s. Each instrument sampled from a Swagelok cross fitting using ∼ 1 m of 0.25 in. Synflex tubing.
We sampled air from the roof in February 2022 when ambient air temperatures ranged from below freezing (−9.3 ∘C) to a warm spring day (19 ∘C). The lowest temperatures were also associated with low humidity, which caused problems that were also detected during the humidity testing, so the sample lines of the Picarro G2210-i and Aeris MIRA were humidified to >1 % water vapor as a workaround for these problems.
We characterized the laboratory performance of each analyzer with respect to humidity corrections, precision assessment, calibration to NOAA standards, and long-term stability before sampling ambient air in New York City. We used these tests to recommend the best instrument for use in different circumstances.
3.1 Characterization of water sensitivity
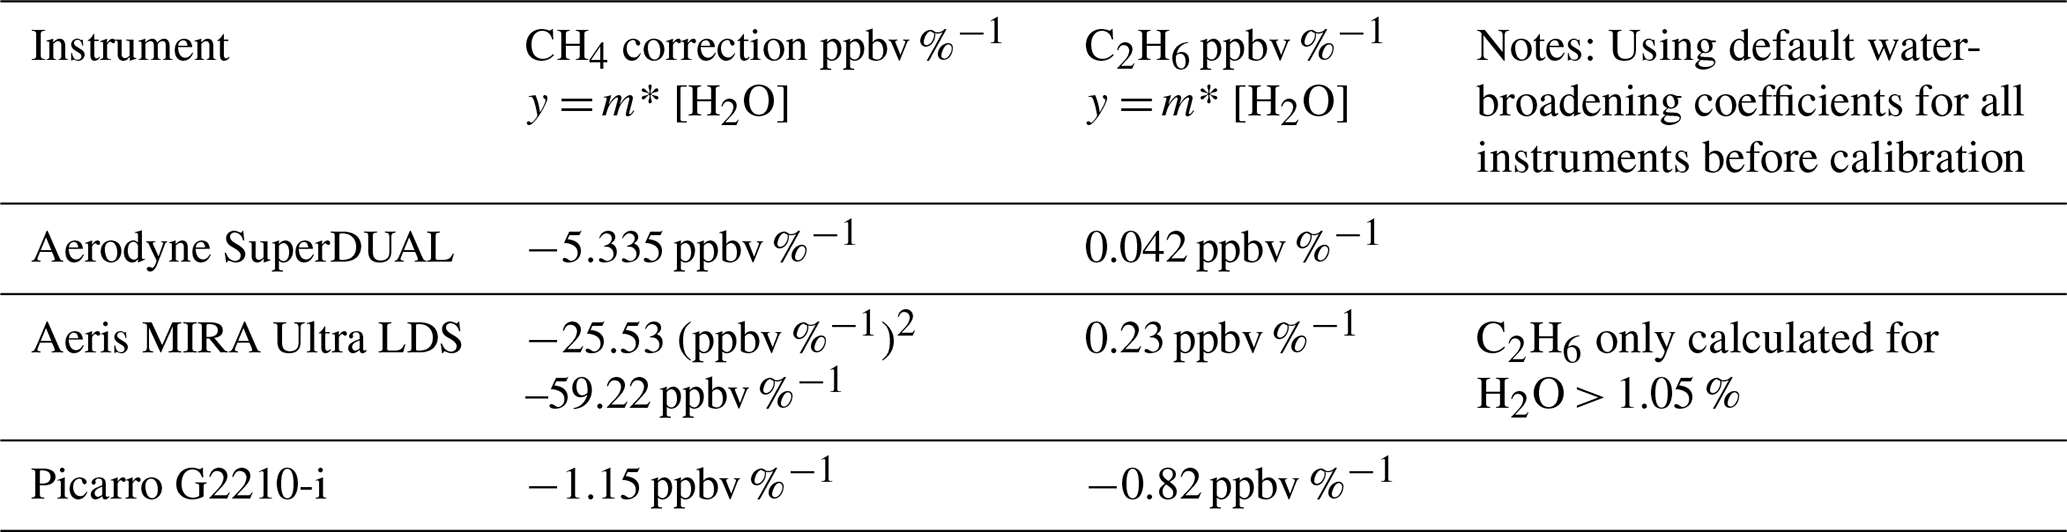
All three instruments showed a dependency of methane on water vapor that was statistically significant. Figure 1 shows the dependence of the retrieved methane and ethane on the water vapor reported by each instrument for a compressed-air cylinder with variable humidity. A linear correction was calculated for methane and ethane for both the Aerodyne SuperDUAL and the Picarro G2210-i, but a quadratic dependence was observed for the Aeris MIRA methane (Fig. S1 in the Supplement). The values of each water vapor correction are shown in Table 1. The Picarro G2210-i needed the smallest absolute correction for methane, and the Aerodyne SuperDUAL reported the smallest correction for ethane. The SuperDUAL was operated with the default water-vapor-broadening coefficient for methane and ethane of 2.0. This correction is likely too large for methane, and moving closer to the value of 1.05 recommended by Kostinek et al. (2019) would reduce the water vapor correction. Here we have applied a linear correction of the water vapor to the observed data that results in a 10 ppbv change in methane but a ∼ 0.08 ppbv change in ethane for 0 %–2 % water vapor.
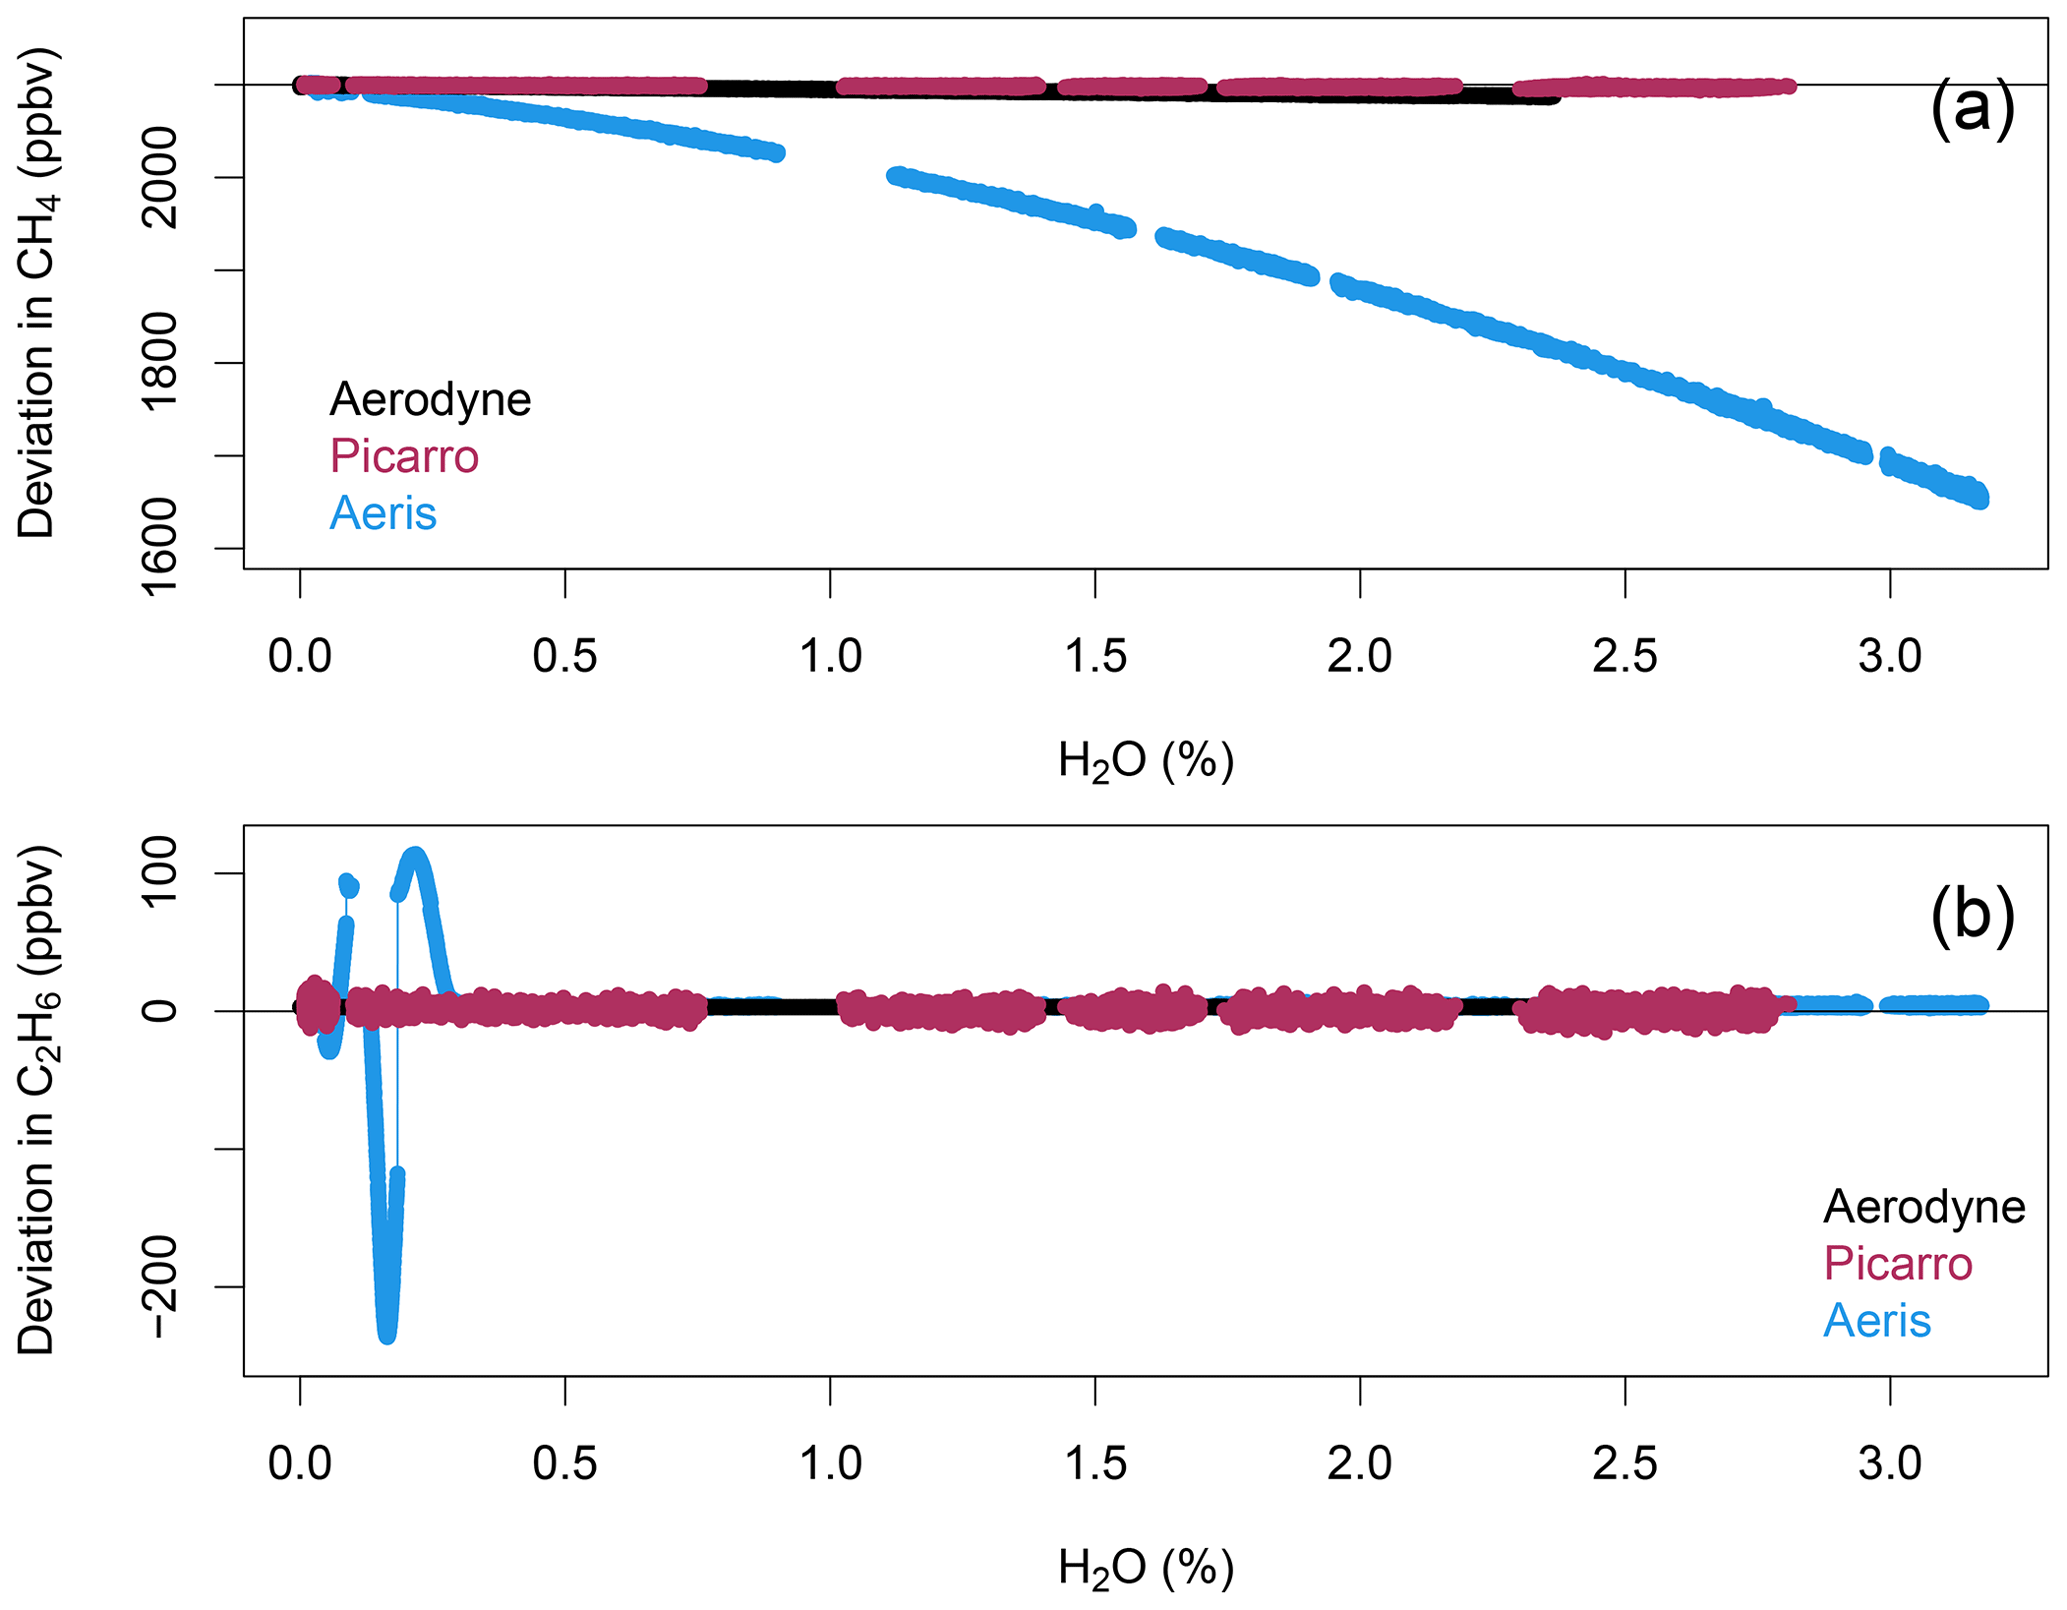
Figure 1Uncorrected (a) methane (ppbv) and (b) ethane (ppbv) vs. water vapor (%) for the Aerodyne SuperDUAL (black), Picarro G2210-i (red), and Aeris MIRA Ultra LDS (blue).
Table 1Summary of water vapor corrections derived for each instrument.
We identified two separate, but related, situations with the Aeris MIRA that could prove to be a problem if not accounted for in operation in certain environments and configurations.
The wavelength of the laser is tied to the water vapor absorption peak. When running a dry-calibration tank, the instrument loses frequency lock, and the laser wavelength can drift to the point that the ethane peak can no longer be resolved. The reported ethane concentrations vary between 200 and −100 ppbv during this dry-air sampling, possibly driven by laser wavelength drift. When the water vapor increases again after a calibration, the ethane fit is not immediately recaptured. Noise in the reported ethane and methane concentrations increases significantly below 1.05 % water vapor, and below 0.5 % the ethane fit is completely lost. After discussion with engineers at Aeris Technologies, we learned that there are two water vapor peaks in the spectral window. This problem could be mitigated when sampling dry cylinders by locking to the stronger water vapor absorption peak, which is often saturated during normal operation, or to the methane line directly. Note that locking to the methane line would prevent running methane-free samples, as discussed in Sect. 3.4 below. Either change can be implemented upon request when ordering new analyzers.
For most environments, water vapor in the atmosphere absorbs some of the mid-IR laser power, and the laser power of the Aeris MIRA is optimized to achieve maximum sensitivity. However, New York City in February is cold and dry, with very low concentrations of ambient water vapor. Without enough water vapor to attenuate the laser power, the detector can be saturated, leading to no ethane being detected and a noisy methane retrieval. This problem can be fixed by reducing the laser power slightly (using the procedure recommended by Aeris Technologies via personal communication, Jerome Thiebaud, 2022) or by humidifying the sample line slightly. We opted for the latter fix for this study. At the other extreme, water vapor closer to 3 % can also lead to increased noise in the fitted methane and ethane.
After losing the ethane peak during either of these circumstances, the Aeris MIRA analyzer will often fail to find the peak again until manually re-connected to the internet. We have not identified a cause for this behavior, but it was more likely during (ii) and was not a problem after we humidified the sample flow. Using the GPS receiver provided by Aeris also seemed to mitigate the problem.
3.2 Instrument calibration
Each instrument was calibrated against two NOAA calibration standards after accounting for the water vapor correction described in Sect. 3.1. A linear fit (OLS, ordinary least squares) was calculated for each species, and the span (slope) and zero corrections (intercept) and 95 % confidence intervals were calculated (Table 2). The span and offset were then applied to each species. As described above, the Aeris MIRA could not report ethane concentrations when sampling a dry tank, so the sample lines of both the Aeris MIRA and Picarro G2210-i were humidified to water vapor mole fractions between 1.7 % H2O–1.9 % H2O. For methane, all three instruments reported a span correction less than 3 % and zero corrections between 3 and 14 ppbv. All three instruments report very similar methane mole fractions for a compressed-air tank after all calibration steps were applied. For ethane, the Aeris MIRA and Aerodyne SuperDUAL reported a span of less than 7 % and an offset of less than 2 ppbv. However, the slope and intercept for the Picarro G2210-i were not successfully resolved for the reported 1 Hz data, and a two-point linear fit was calculated for the average values reported over the sampling period (slope 0.427; intercept 4.275). The resulting correction successfully resolved the target gas mole fractions but with a large standard deviation in the 1 Hz data (Fig. S2).
Table 2Calibration span (slope) and zero (intercept) calculated for each instrument reporting at 1 Hz when sampling the NOAA calibration standards. The 95 % confidence intervals (CI) for the slope and intercept of an ordinary-least-squares (OLS) fit are also shown.
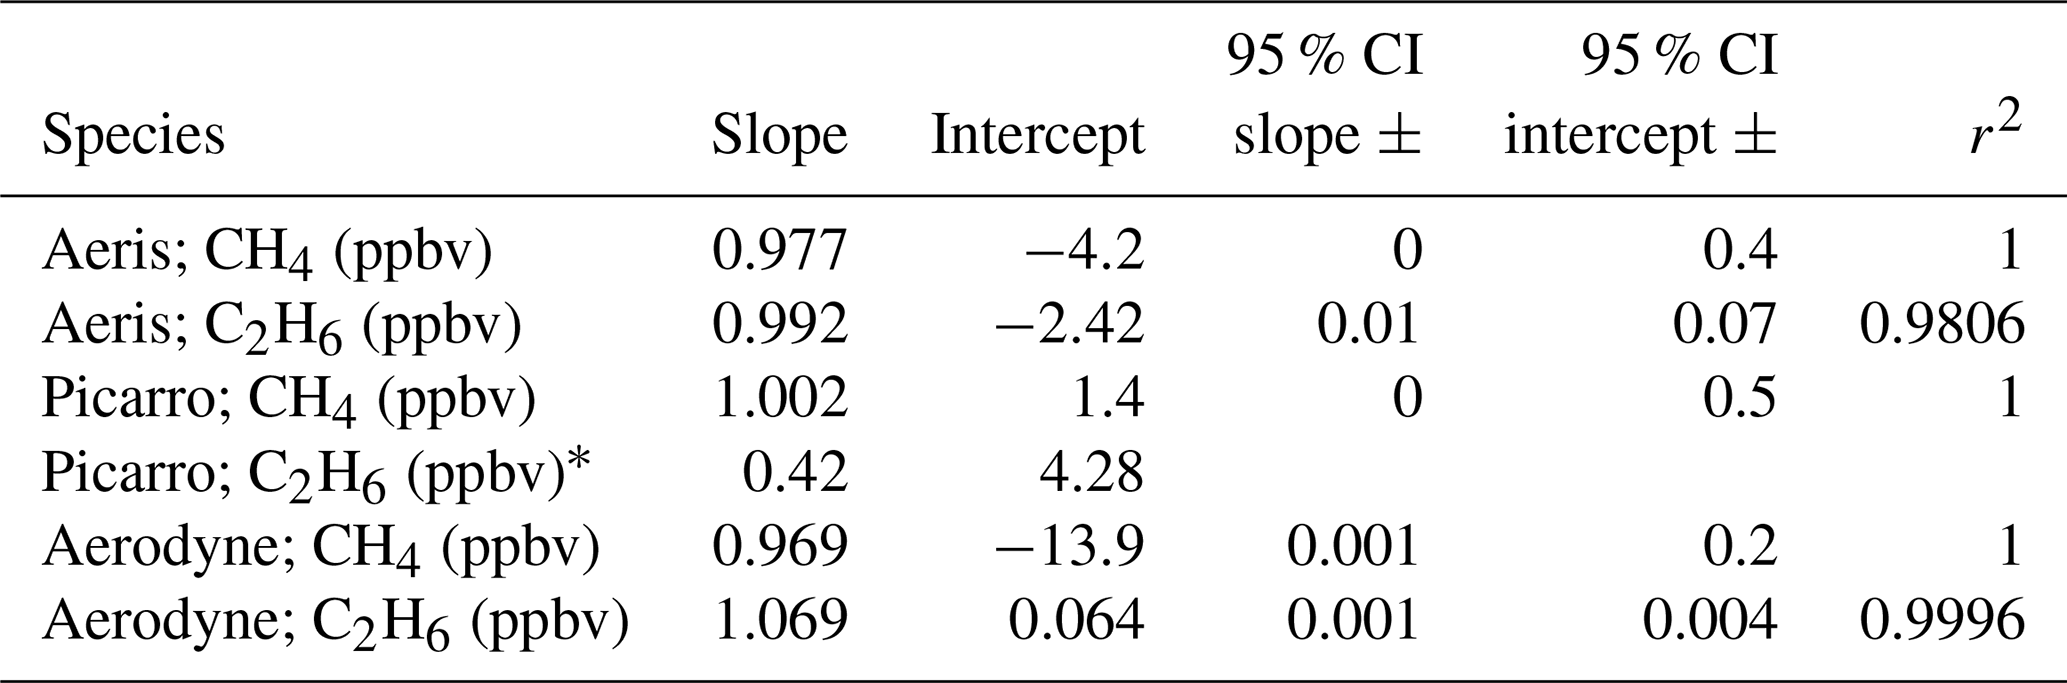
∗ The ethane Picarro G2210-i calibration was calculated from the mean of each cylinder measurement (two-point calibration).
We evaluated the linearity of the instruments outside our range of calibration standards by comparing the instrument responses of the Aerodyne SuperDUAL and Aeris MIRA during the high plumes (as discussed in Sect. 3.5 below). Figure S3 shows the linearity of 1 s methane and 10 s ethane for 20–21 February 2022 with the Aeris MIRA and Aerodyne SuperDUAL. The methane fit (slope 1.002) is slightly closer to 1 than the ethane fit (slope: 1.048±0.002). The slow response of the Picarro G2210-i meant that it could not represent plumes of ethane at sufficient resolution to allow for valid comparison. While this does not directly test linearity, the strong correlations between reported concentrations from the instruments likely indicate that they retain linear behavior well beyond the range of our calibration standards.
3.3 Instrument precision
The precision of each analyzer was evaluated by sampling a calibrated compressed-air cylinder for 4 h. We calculated an Allan–Werle variance (Fig. 2) and the observed precision for methane and ethane for each instrument (Table 3; Figs. S4–S7).

Figure 2Allan–Werle variance for (a) methane and (b) ethane for all three instruments when sampling a compressed-air cylinder on 17 February 2022 at 11:00 am–03:00 pm EDT. Each of the tanks was calibrated to NOAA cylinders after water vapor correction. The reported water vapor for the Aerodyne SuperDUAL (black) was below 0.054 %. The Aeris MIRA (blue) and Picarro G2210-i (red) were humidified to water vapor 1.7 %–1.9 %.
Table 3Summary of various instrument performance metrics. The quoted precisions are from the Product Datasheet for each analyzer.

∗ The quoted precision of the Aerodyne SuperDUAL is from Kostinek et al. (2019).
For methane, the Aerodyne SuperDUAL had the best 1 Hz (0.227 ppbv) and 10 s (0.072 ppbv) precision, with a minimum of 0.021 ppbv at 3.2 min, but the variance increased slightly again (but still remained below 1 ppbv) after about 15 min. There were no zeros performed for the SuperDUAL during the precision experiment, so this increase in variance was not unexpected. The Aerodyne SuperDUAL matched the 100 s precision of Kostinek et al. (2019) at 0.024 ppbv. At 100 s, the Aeris LDS precision was 0.14 ppbv, and the Picarro G2210-i precision was 0.08 ppbv, both of which exceeded their quoted precision of 0.5 ppbv (at 1 s) and 0.1 ppbv (at 5 min).
For ethane, the Aerodyne SuperDUAL had the best 1 Hz (0.027 ppbv) and 10 s (0.008 ppbv) precision, with a minimum of 0.002 ppbv at 2.2 min, but the variance increased slightly again (but still remained below 0.03 ppbv) after about 15 min. The Aerodyne SuperDUAL matched the 100 s precision of Kostinek et al. (2019) at 0.003 ppbv. At 100 s, the Aeris MIRA precision was 0.02 ppbv, and the Picarro G2210-i precision was 0.48 ppbv, both of which exceeded their quoted precision of 1 ppbv.
3.4 Long-term instrument stability
We evaluated the stability of frequent additions of nitrogen (liquid nitrogen boil-off free of methane, ethane, CO2, etc.) for all three analyzers. Figure 3 shows the instrument response when sampling dry and humidified nitrogen (methane and ethane free). The Aerodyne SuperDUAL was not humidified for the second period (Fig. 3c–d), and the noise was not significantly different for the two periods (C2H6<0.01 ppbv; CH4<0.95 ppbv; 1σ s.d.).
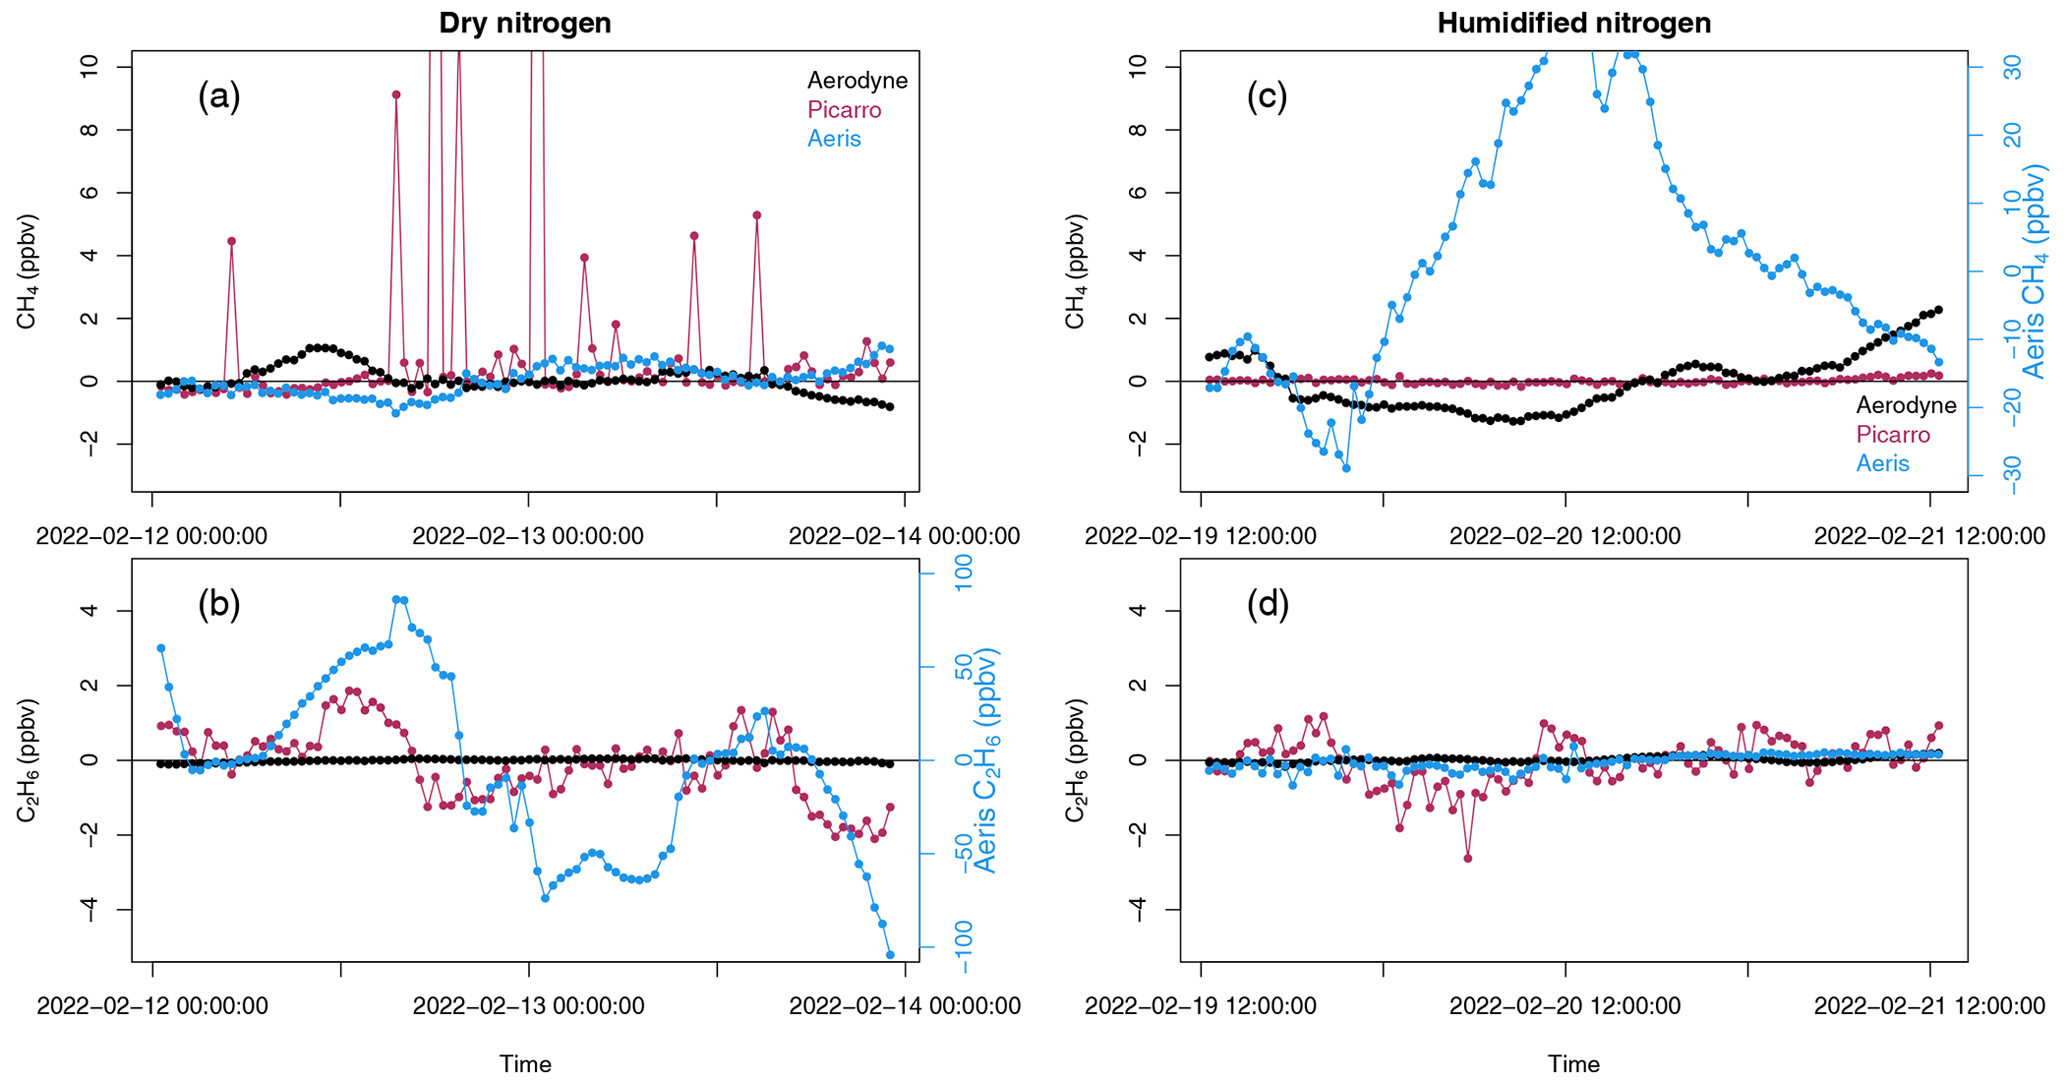
Figure 3Instrument response when sampling (a–b) dry and (c–d) humidified methane (a, c) and ethane (b, d) in nitrogen. Picarro G2210-i (red) and Aeris MIRA (blue). Note the separate right y axis for the Aeris (b) ethane and (c) methane. Also note that the Aerodyne SuperDUAL (black) did not sample humidified nitrogen in (c)–(d).
The Aeris MIRA instrument response is statistically different when sampling dry or humidified nitrogen (Fig. 3). The reported ethane goes from varying between −100 and 100 ppbv (with a mean of ppbv; 1σ s.d.) when sampling dry nitrogen to ppbv (1σ s.d.) when the nitrogen is humidified to ∼ 1 %. This result is consistent with the humidity test with compressed air in Fig. 1. However, humidifying the nitrogen also affects the reported methane, which goes from 0.02±0.5 ppbv (1σ s.d.) when dry to 2.5±17.5 ppbv (1σ s.d.) when humidified.
The Picarro G2210-i instrument noise is reduced when sampling humidified nitrogen over dry nitrogen (Fig. 3), especially for outliers in the reported methane (Fig. 3a). The reported ethane goes from ppbv (1σ s.d.) when sampling dry nitrogen to ppbv (1σ s.d.) when the nitrogen is humidified to ∼ 1 %. The reported methane goes from 1.35±6 ppbv (1σ s.d.) when dry to 0.007±0.08 ppbv (1σ s.d.) when humidified.
Using a Picarro G1301, Nara et al. (2012) observed a pressure-broadening effect when sampling gas with a range of oxygen and argon that resulted in a ∼ 2 ppb bias in methane. We would expect to see a larger pressure-broadening effect when sampling dry nitrogen free of oxygen and argon, which may explain some of the variability in Fig. 3a. Indeed, there is no increased variability in methane observed by the Picarro G2210-i when sampling from a compressed-air cylinder at low humidity (Fig. 1a). For the Aeris MIRA, we see different behavior for the methane and ethane. The ethane results are consistent for both compressed air and nitrogen, with more ethane variability at low humidity. The methane variability is much larger when sampling humidified nitrogen and dry compressed air than is seen when sampling dry nitrogen and humidified compressed air (see Figs. 1 and S1). In our tests here, the G2210-i stability for methane is the best of the three analyzers when sampling humidified nitrogen boil-off, which indicates that the addition of nitrogen from a dewar is possible as a long-term zero only if the flow is humidified. However, for the Aeris MIRA, we observe much more methane variability in humidified nitrogen and lots of ethane variability in dry nitrogen, so we do not recommend using nitrogen as a long-term zero.
3.5 Ambient sampling
In order to test the suitability of each analyzer to reporting accurate methane and ethane mole fractions in ambient air, we ran all instruments sampling ambient air from the CUNY Observatory in Harlem, NY, for 3–4 weeks in February 2022. In general, air is cold and very dry in New York City in winter, and it took some time to learn that we had to humidify the Aeris MIRA and Picarro G2210-i sample flows in order to record valid data (see instrument characterization experiments described above). The Picarro G2210-i often reported negative ethane and negative correlations of ethane with methane for the first 2 weeks of observations. We then requested that Picarro engineers check the instrument, and they assured us it was performing as expected. So we have focused on 17–22 February 2022 (see Fig. S8), when the G2210-i was confirmed to be performing to specification. Figure 4 shows typical examples of the ambient methane and ethane mole fractions observed by all the analyzers when sampling ambient air in February 2022.
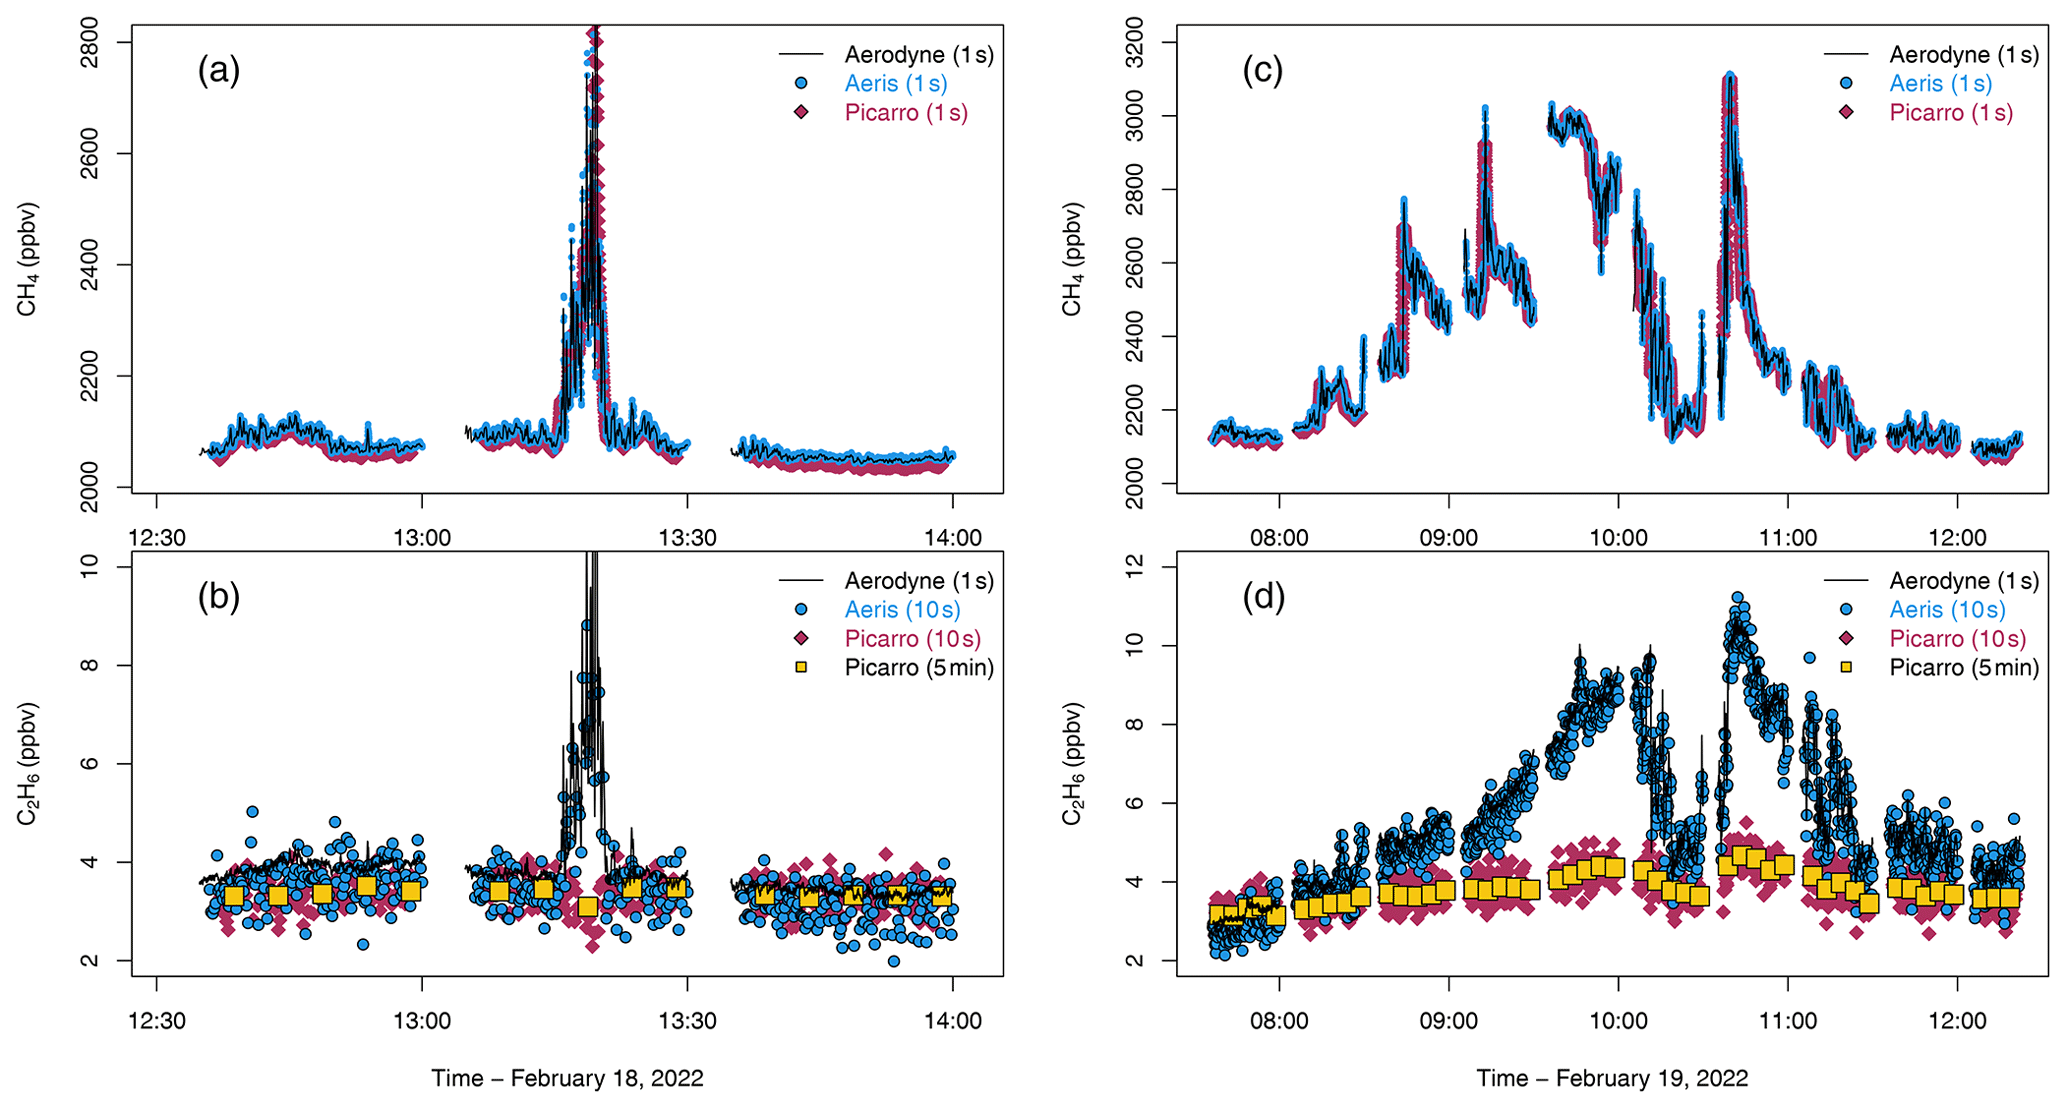
Figure 4Ambient sampling for methane (ppbv, top row) and ethane (ppbv, bottom row) for (a–b) a short natural gas plume on 18 February 2022 and (c–d) a large-scale change in methane and ethane overnight and into the early morning of 19 February 2022. Times in UTC. Aerodyne SuperDUAL (black line), Aeris MIRA (blue circle), Picarro G2210-i (red diamond), and Picarro G2210-i averaged to 5 min in yellow square. All instruments were corrected for humidity and calibrated to NOAA calibration scales.
On 18 February, a large-scale change in air mass resulted in a drop in ambient air temperature from 15 to 7 ∘C (Fig. 4a and b); residential heating increased, and a plume of high methane and ethane was intercepted at the observatory for about 10 min. The Aerodyne SuperDUAL and Aeris MIRA both responded very similarly, reporting large coincident increases in methane (up to ∼ 2800 ppbv) and ethane (∼ 10 ppbv). The Aerodyne SuperDUAL also reported a large increase in carbon monoxide (CO) of up to ∼ 1500 ppbv for the same plume, possibly indicating an incomplete combustion source. The methane reported by the Picarro G2210-i also increased but with a longer peak duration due to the much slower sampling flow rate (sampling time lags were corrected for previously). However, the ethane surprisingly decreased while sampling the plume.
On 19 February, ambient air temperatures ranged from −3.7 ∘C at night to −1.2 ∘C in the early morning, and wind speeds were low (2–4 m s−1), leading to a build-up of methane and ethane in the atmosphere overnight (Fig. 4c and d). The prolonged elevated methane (to ∼ 3000 ppbv) and ethane (to ∼ 11 ppbv) was easily observed by the Aerodyne SuperDUAL and the Aeris MIRA. The CO also increased (∼ 700 ppbv) to about half of that seen on 18 February. The methane reported by the Picarro G2210-i also increased in line with the other reported methane, but again, the Picarro G2210-i was not able to resolve the large increase in ethane, this time indicating an increase in ethane of 1–2 ppbv instead of the 7–8 ppbv seen by the other instruments.
The trace gases measured by the Aerodyne SuperDUAL indicate that Fig. 4a and b show a post-meter plume of incompletely combusted natural gas, likely emitted close to the observatory. The overnight boundary build-up observed in Fig. 4c and d was coincident with a large increase in other combustion pollutants such as CO. As mentioned in the datasheet for this instrument, it is possible that the co-emitted species of natural gas combustion (such as CO or other volatile organic compounds, VOCs) act as an interferent for the Picarro G2210-i ethane retrieval. Our results indicate that the Picarro G2210-i should not be used to selectively measure ethane near combustion sources such as flares or natural gas power plants or in urban areas that combust natural gas on a large scale. Indeed, care should be taken to ensure that thermogenic sources are not erroneously attributed to biogenic sources with the Picarro G2210-i in urban areas.
We evaluated the performance of three commercially available laser-based ethane analyzers: Aerodyne Inc. SuperDUAL, Aeris Technologies MIRA LDS, and Picarro Inc. G2210-i. We assessed the precision, accuracy, and interferences of each analyzer. We measured ambient air in a cold urban environment with each analyzer and have made recommendations of analyzers based on performance, ease of use, and reliability.
Across the month, the Aerodyne SuperDUAL reported with the highest precision of all three instruments but requires regular zero air and nitrogen to maintain accuracy. The large size of the instrument and the external chiller and large pump mean that it is more suitable for tower- and ground-based or large mobile-laboratory operations and is not suitable for car-based sampling. There is a smaller sized instrument from Aerodyne – the Aerodyne “mini” – which has a methane and ethane precision between that of the SuperDUAL and the Aeris MIRA, but this also requires an external chiller and large pump (see https://www.aerodyne.com/wp-content/uploads/2021/11/Ethane.pdf, last access: 31 January 2023; 60s precision of 0.05 ppbv CH4 and 0.015 ppbv C2H6). The Aerodyne SuperDUAL also requires expertise to operate and maintain but is the best-performing analyzer if the space and expertise are available.
The Aeris MIRA was close to the Aerodyne SuperDUAL in terms of precision for methane but was less precise for ethane. The Aeris MIRA pump is small, so the analyzer cannot draw against pressures much below ambient pressures, such as those from long sampling lines. Methane required a large water vapor correction. Ethane could only be reported for humidified samples, which affects the calibration protocol most often used in long-term operation. The Aeris MIRA also had some software problems when not connected to the internet, so it requires regular attention. However, overall, the Aeris MIRA performed well when sampling plumes of incompletely combusted natural gas and in large-scale ethane build-up overnight in the urban atmosphere. The small size and internal pump also make the analyzer ideal for sampling from small mobile platforms such as cars and bikes (especially the Aeris MIRA LDS Pico, which is the battery-powered version of the analyzer tested here).
While the Picarro G2210-i reported precise methane mole fractions, with the analyzer performing adequately in many of the tests, it could not detect ambient ethane enhancements of over 5 ppbv observed by the other instruments in the polluted urban atmosphere. When sampling an incompletely combusted natural gas plume, it also reported a reduction in ethane when the other analyzers reported a plume of ∼ 10 ppbv.
Overall, we recommend the Aerodyne SuperDUAL or the Aeris MIRA Ultra LDS, depending on the situation. For long-term tower deployments or those with large mobile laboratories, the Aerodyne SuperDUAL provides the best precision for methane and ethane. The other reported trace gases in the Aerodyne SuperDUAL, including CO, carbon dioxide (CO2), and nitrous oxide (N2O) alongside ethane, also provide a way to more accurately identify the methane sources. For smaller mobile platforms, the Aeris MIRA is a more compact analyzer, and with careful use, it can quantify thermogenic methane sources to sufficient precision for short-term deployments in urban or oil and gas areas.
The data and analysis codes are archived together at https://doi.org/10.5061/dryad.7wm37pvxv (Commane and Hallward-Driemeier, 2023).
The supplement related to this article is available online at: https://doi.org/10.5194/amt-16-1431-2023-supplement.
RC, AHD, and LTM designed the study. RC and AHD operated the instruments, AHD conducted the tests, and RC and AHD analyzed the data. RC prepared the paper with input from AHD and LTM.
The contact author has declared that none of the authors has any competing interests.
Publisher’s note: Copernicus Publications remains neutral with regard to jurisdictional claims in published maps and institutional affiliations.
We thank Ricardo Toledo-Crow and the Next Generation Environmental Sciences Observatory of the Advanced Sciences Research Center, City University of New York, for observatory space while conducting the instrument evaluations.
This research has been supported by the National Oceanic and Atmospheric Administration (grant no. NA21OAR4310235) and the New York State Energy Research and Development Authority (contract nos. 100413, 137484, 160536, and 183865).
This paper was edited by Glenn Wolfe and reviewed by two anonymous referees.
Commane, R. and Hallward-Driemeier, A.: Data to support Intercomparison of commercial analyzers for atmospheric ethane and methane observations, Dryad [data set], https://doi.org/10.5061/dryad.7wm37pvxv, 2023.
Defratyka, S. M., Paris, J.-D., Yver-Kwok, C., Loeb, D., France, J., Helmore, J., Yarrow, N., Gros, V., and Bousquet, P.: Ethane measurement by Picarro CRDS G2201-i in laboratory and field conditions: potential and limitations, Atmos. Meas. Tech., 14, 5049–5069, https://doi.org/10.5194/amt-14-5049-2021, 2021.
Floerchinger, C., McKain, K., Bonin, T., Peischl, J., Biraud, S. C., Miller, C., Ryerson, T. B., Wofsy, S. C., and Sweeney, C.: Methane emissions from oil and gas production on the North Slope of Alaska, Atmos. Environ., 218, 116985, https://doi.org/10.1016/j.atmosenv.2019.116985, 2019.
Gvakharia, A., Kort, E. A., Brandt, A., Peischl, J., Ryerson, T. B., Schwarz, J. P., Smith, M. L., and Sweeney, C.: Methane, Black Carbon, and Ethane Emissions from Natural Gas Flares in the Bakken Shale, North Dakota, Environ. Sci. Technol., 51, 5317–5325, https://doi.org/10.1021/acs.est.6b05183, 2017.
He, L., Zeng, Z., Pongetti, T. J., Wong, C., Liang, J., Gurney, K. R., Newman, S., Yadav, V., Verhulst, K., Miller, C. E., Duren, R., Frankenberg, C., Wennberg, P. O., Shia, R., Yung, Y. L., and Sander, S. P.: Atmospheric Methane Emissions Correlate With Natural Gas Consumption From Residential and Commercial Sectors in Los Angeles, Geophys. Res. Lett., 46, 8563–8571, https://doi.org/10.1029/2019GL083400, 2019.
Karion, A., Callahan, W., Stock, M., Prinzivalli, S., Verhulst, K. R., Kim, J., Salameh, P. K., Lopez-Coto, I., and Whetstone, J.: Greenhouse gas observations from the Northeast Corridor tower network, Earth Syst. Sci. Data, 12, 699–717, https://doi.org/10.5194/essd-12-699-2020, 2020.
Kostinek, J., Roiger, A., Davis, K. J., Sweeney, C., DiGangi, J. P., Choi, Y., Baier, B., Hase, F., Groß, J., Eckl, M., Klausner, T., and Butz, A.: Adaptation and performance assessment of a quantum and interband cascade laser spectrometer for simultaneous airborne in situ observation of CH4, C2H6, CO2, CO and N2O, Atmos. Meas. Tech., 12, 1767–1783, https://doi.org/10.5194/amt-12-1767-2019, 2019.
Lamb, B. K., Cambaliza, M. O. L., Davis, K. J., Edburg, S. L., Ferrara, T. W., Floerchinger, C., Heimburger, A. M. F., Herndon, S., Lauvaux, T., Lavoie, T., Lyon, D. R., Miles, N., Prasad, K. R., Richardson, S., Roscioli, J. R., Salmon, O. E., Shepson, P. B., Stirm, B. H., and Whetstone, J.: Direct and Indirect Measurements and Modeling of Methane Emissions in Indianapolis, Indiana, Environ. Sci. Technol., 50, 8910–8917, https://doi.org/10.1021/acs.est.6b01198, 2016.
Lebel, E. D., Lu, H. S., Speizer, S. A., Finnegan, C. J., and Jackson, R. B.: Quantifying Methane Emissions from Natural Gas Water Heaters, Environ. Sci. Technol., 54, 5737–5745, https://doi.org/10.1021/acs.est.9b07189, 2020.
Maazallahi, H., Fernandez, J. M., Menoud, M., Zavala-Araiza, D., Weller, Z. D., Schwietzke, S., von Fischer, J. C., Denier van der Gon, H., and Röckmann, T.: Methane mapping, emission quantification, and attribution in two European cities: Utrecht (NL) and Hamburg (DE), Atmos. Chem. Phys., 20, 14717–14740, https://doi.org/10.5194/acp-20-14717-2020, 2020.
McKain, K., Down, A., Raciti, S. M., Budney, J., Hutyra, L. R., Floerchinger, C., Herndon, S. C., Nehrkorn, T., Zahniser, M. S., Jackson, R. B., Phillips, N., and Wofsy, S. C.: Methane emissions from natural gas infrastructure and use in the urban region of Boston, Massachusetts, P. Natl. Acad. Sci. USA, 112, 1941–1946, 2015.
Mueller, K. L., Lauvaux, T., Gurney, K. R., Roest, G., Ghosh, S., Gourdji, S. M., Karion, A., DeCola, P., and Whetstone, J.: An emerging GHG estimation approach can help cities achieve their climate and sustainability goals, Environ. Res. Lett., 16, 084003, https://doi.org/10.1088/1748-9326/ac0f25, 2021.
Nara, H., Tanimoto, H., Tohjima, Y., Mukai, H., Nojiri, Y., Katsumata, K., and Rella, C. W.: Effect of air composition (N2, O2, Ar, and H2O) on CO2 and CH4 measurement by wavelength-scanned cavity ring-down spectroscopy: calibration and measurement strategy, Atmos. Meas. Tech., 5, 2689–2701, https://doi.org/10.5194/amt-5-2689-2012, 2012.
O'Connell, E., Risk, D., Atherton, E., Bourlon, E., Fougère, C., Baillie, J., Lowry, D., and Johnson, J.: Methane emissions from contrasting production regions within Alberta, Canada: Implications under incoming federal methane regulations, Elementa: Science of the Anthropocene, 7, 3, https://doi.org/10.1525/elementa.341, 2019.
Plant, G., Kort, E. A., Floerchinger, C., Gvakharia, A., Vimont, I., and Sweeney, C.: Large Fugitive Methane Emissions From Urban Centers Along the U.S. East Coast, Geophys. Res. Lett., 46, 8500–8507, https://doi.org/10.1029/2019GL082635, 2019.
Sargent, M. R., Floerchinger, C., McKain, K., Budney, J., Gottlieb, E. W., Hutyra, L. R., Rudek, J., and Wofsy, S. C.: Majority of US urban natural gas emissions unaccounted for in inventories, P. Natl. Acad. Sci. USA, 118, e2105804118, https://doi.org/10.1073/pnas.2105804118, 2021.
Saunois, M., Stavert, A. R., Poulter, B., Bousquet, P., Canadell, J. G., Jackson, R. B., Raymond, P. A., Dlugokencky, E. J., Houweling, S., Patra, P. K., Ciais, P., Arora, V. K., Bastviken, D., Bergamaschi, P., Blake, D. R., Brailsford, G., Bruhwiler, L., Carlson, K. M., Carrol, M., Castaldi, S., Chandra, N., Crevoisier, C., Crill, P. M., Covey, K., Curry, C. L., Etiope, G., Frankenberg, C., Gedney, N., Hegglin, M. I., Höglund-Isaksson, L., Hugelius, G., Ishizawa, M., Ito, A., Janssens-Maenhout, G., Jensen, K. M., Joos, F., Kleinen, T., Krummel, P. B., Langenfelds, R. L., Laruelle, G. G., Liu, L., Machida, T., Maksyutov, S., McDonald, K. C., McNorton, J., Miller, P. A., Melton, J. R., Morino, I., Müller, J., Murguia-Flores, F., Naik, V., Niwa, Y., Noce, S., O'Doherty, S., Parker, R. J., Peng, C., Peng, S., Peters, G. P., Prigent, C., Prinn, R., Ramonet, M., Regnier, P., Riley, W. J., Rosentreter, J. A., Segers, A., Simpson, I. J., Shi, H., Smith, S. J., Steele, L. P., Thornton, B. F., Tian, H., Tohjima, Y., Tubiello, F. N., Tsuruta, A., Viovy, N., Voulgarakis, A., Weber, T. S., van Weele, M., van der Werf, G. R., Weiss, R. F., Worthy, D., Wunch, D., Yin, Y., Yoshida, Y., Zhang, W., Zhang, Z., Zhao, Y., Zheng, B., Zhu, Q., Zhu, Q., and Zhuang, Q.: The Global Methane Budget 2000–2017, Earth Syst. Sci. Data, 12, 1561–1623, https://doi.org/10.5194/essd-12-1561-2020, 2020.
Smith, M. L., Kort, E. A., Karion, A., Sweeney, C., Herndon, S. C., and Yacovitch, T. I.: Airborne Ethane Observations in the Barnett Shale: Quantification of Ethane Flux and Attribution of Methane Emissions, Environ. Sci. Technol., 49, 8158–8166, https://doi.org/10.1021/acs.est.5b00219, 2015.
Szopa, S., Naik, V., Adhikary, B., Artaxo, P., Berntsen, T., Collins, W., Fuzzi, S., Gallardo, L., Kiendler-Scharr, A., Klimont, Z., Liao, P., Unger, N., and Zanis, H.: Chapter 6: Short-lived Climate Forcers, Climate Change 2021: The Physical Science Basis. Contribution of Working Group I to the Sixth Assessment Report of the Intergovernmental Panel on Climate Change, 817–922, https://www.ipcc.ch/report/ar6/wg1/downloads/report/IPCC_AR6_WGI_Chapter06.pdf (last access: 31 January 2023), 2021.
Travis, B., Dubey, M., and Sauer, J.: Neural networks to locate and quantify fugitive natural gas leaks for a MIR detection system, Atmos. Environ. X, 8, 100092, https://doi.org/10.1016/j.aeaoa.2020.100092, 2020.
Wunch, D., Toon, G. C., Hedelius, J. K., Vizenor, N., Roehl, C. M., Saad, K. M., Blavier, J.-F. L., Blake, D. R., and Wennberg, P. O.: Quantifying the loss of processed natural gas within California's South Coast Air Basin using long-term measurements of ethane and methane, Atmos. Chem. Phys., 16, 14091–14105, https://doi.org/10.5194/acp-16-14091-2016, 2016.
Yacovitch, T. I., Herndon, S. C., Roscioli, J. R., Floerchinger, C., McGovern, R. M., Agnese, M., Pétron, G., Kofler, J., Sweeney, C., Karion, A., Conley, S. A., Kort, E. A., Nähle, L., Fischer, M., Hildebrandt, L., Koeth, J., McManus, J. B., Nelson, D. D., Zahniser, M. S., and Kolb, C. E.: Demonstration of an Ethane Spectrometer for Methane Source Identification, Environ. Sci. Technol., 48, 8028–8034, https://doi.org/10.1021/es501475q, 2014.
Yver Kwok, C., Laurent, O., Guemri, A., Philippon, C., Wastine, B., Rella, C. W., Vuillemin, C., Truong, F., Delmotte, M., Kazan, V., Darding, M., Lebègue, B., Kaiser, C., Xueref-Rémy, I., and Ramonet, M.: Comprehensive laboratory and field testing of cavity ring-down spectroscopy analyzers measuring H2O, CO2, CH4 and CO, Atmos. Meas. Tech., 8, 3867–3892, https://doi.org/10.5194/amt-8-3867-2015, 2015.