the Creative Commons Attribution 4.0 License.
the Creative Commons Attribution 4.0 License.
 | 17 Mar 2023
Version 8 IMK–IAA MIPAS ozone profiles: nominal observation mode
Michael Kiefer
Thomas von Clarmann
Bernd Funke
Maya García-Comas
Norbert Glatthor
Udo Grabowski
Michael Höpfner
Sylvia Kellmann
Alexandra Laeng
Andrea Linden
Manuel López-Puertas
Gabriele P. Stiller
A new global O3 data product retrieved from the Michelson Interferometer for Passive Atmospheric Sounding (MIPAS) spectra with the IMK–IAA MIPAS data processor has been released. These data are based on ESA version 8 recalibrated radiance spectra with improved temporal stability. Changes in the level-2 processing with respect to previous data versions include the following: (1) the retrievals use improved temperature data and thus suffer less from the propagation of related errors. (2) The background continuum is now considered up to 58 km. (3) A priori information is now used to constrain the retrieval of the radiance offset. (4) Water vapour is fitted jointly with ozone to minimize the impact of interfering water lines. (5) A more adequate regularization has been chosen. (6) Ozone absorption lines in the MIPAS A band (685–980 cm−1) are used almost exclusively because of inconsistencies in spectroscopic data in the MIPAS AB band (1010–1180 cm−1). Only at altitudes above 50 km, where A-band ozone lines do not provide sufficient information, are ozone lines in the MIPAS AB band used. (7) Temperature-adjusted climatologies of vibrational temperatures of O3 and CO2 are considered to account for non-local thermodynamic equilibrium radiation. Ozone errors are estimated to be less than 10 % in the altitude range 20–50 km. The error budget is dominated by the spectroscopic errors, followed by the uncertainty of the instrumental line shape function, the gain calibration error, and the spectral noise. The error contribution of interfering gases is almost negligible. The vertical resolution depends on altitude and atmospheric conditions. In 2002–2004 it varies between 2.5 km at the lowest altitudes and 6 km at 70 km, while in 2005–2012 it covers 2 to 5.5 km in the same altitude range. The horizontal smearing in terms of the full width at half maximum of the horizontal component of the two-dimensional averaging kernel matrix is smaller than, or approximately equal to, the distance between two subsequent limb scans at all altitudes. This implies that the horizontal resolution is sampling-limited or optimal, respectively. An additional data version is made available that is free of the formal a priori information and thus more user-friendly for certain applications. Version 8 ozone results show a better consistency between the two MIPAS measurement periods. They seem to be more realistic than preceding data versions in terms of long-term stability, as at least a part of the drift is corrected. Further, the representation of elevated stratopause situations is improved.
- Article
(10025 KB) - Full-text XML
-
Supplement
(2995 KB) - BibTeX
- EndNote


The limb-viewing Michelson Interferometer for Passive Atmospheric Sounding (MIPAS) was operational from June 2002 to April 2012. The mid-infrared Fourier transform spectrometer recorded atmospheric emission spectra with a spectral coverage of 4.1 to 14.7 µm (685–2410 cm−1). The polar sun-synchronous orbit allowed global coverage of measurements (Fischer et al., 2008). This paper describes the retrieval of ozone with a data processor developed and operated by the Karlsruhe Institute of Technology - Institute of Meteorology and Climate Research (KIT-IMK) in cooperation with the Instituto de Astrofísica de Andalucía - Consejo Superior de Investigaciones Científicas (IAA-CSIC), based on the most recent level-1b data version provided by the European Space Agency (ESA version 8.03). The characteristics of these radiance spectra are discussed in Kiefer et al. (2021).
The retrievals presented here include measurements recorded during two operational phases. In the first phase MIPAS measured with full spectral resolution (full resolution, FR) of 0.025 cm−1 (unapodized). After a defect of the interferometer slide, in the second phase of the mission MIPAS measured with reduced spectral resolution of 0.0625 cm−1 (reduced resolution, RR). The respective ozone data versions are V8_O3_61 for FR nominal mode (NOM) observations, V8_O3_261 for RR NOM observations, and V8_O3_161 for measurements in the observation mode dedicated to upper troposphere and lower stratosphere measurements (UTLS-1).
The IMK–IAA MIPAS data processor has been designed to retrieve global temperature and composition distributions from the level-1b data. In this paper we first summarize the effects of the improved calibration (Sect. 3) and then present improvements in the retrieval setup of ozone compared to earlier data versions. Finally we discuss the impact of these retrieval settings on the resulting ozone distributions (Sect. 4).
The fact that a formal constraint is implemented with the retrieval adds complications to the correct use of the data. It implies that the best use of the data can only be made by the correct application of averaging kernels in order to not misinterpret the data. Further, the variable vertical resolution of the ozone profiles can make applications, like trend assessment, problematic. To avoid these problems, for the first time a maximum-likelihood representation is provided along with the regular representation of the data in order to provide an alternative to users who prefer data free of formal prior information (von Clarmann et al., 2015, and references therein). The characteristics of this representation are summarized in Sect. 7.
In Sect. 8 we assess to which degree the changes inherent in the new data version were successful. We review which of the known drawbacks of previous data versions have been reduced or even removed.
Previous MIPAS data versions proved to be a useful and reliable data set and were widely used by the scientific community (Funke et al., 2011; Tegtmeier et al., 2013; Sofieva et al., 2013, 2017; Funke et al., 2017). Still, several issues with these data versions were detected. These are summarized in the following because to remedy them was the chief motivation to provide still another data version.
Eckert et al. (2014) found ozone drifts in MIPAS version 5 ozone data of up to 0.3 ppmv per decade, depending on latitude and altitude. These were mainly negative and were attributed to an inadequate treatment of the detector non-linearity. Laeng et al. (2018) provided evidence that the negative drift was reduced in data version 7.
MIPAS IMK–IAA data version 5 had a positive bias in the upper troposphere and lowermost stratosphere (Laeng et al., 2014, 2015). This bias was significantly reduced in version 7. It was found that the use of microwindows in the MIPAS AB band (1010–1180 cm−1 in level 1b version 8; 1020–1170 cm−1 in older versions) in data version V5R_O3_222 caused a positive bias in the ozone maximum and slightly displaced the peak (Laeng et al., 2014). Inconsistencies between spectroscopic ozone data at different mid-infrared wavelengths were already suspected by Glatthor et al. (2006), but no final conclusion could be drawn then because MIPAS inter-band calibration inconsistencies were another candidate explanation for the positive bias. A more recent study (Glatthor et al., 2018) has corroborated the idea of inconsistent spectroscopic data. Beyond this spectroscopic inconsistency problem, the AB-band microwindows were more susceptible to the non-linearity/drift issue discussed above. In V5R_O3_222, the AB-band microwindows were thus discarded. To compensate for the loss of information implied by dropping the AB microwindows at heights below 50 km, three times more microwindows were used in the A band in this height range. This improved the previously poor vertical resolution around the ozone volume mixing ratio (vmr) maximum. However, without the AB-band microwindows, less information about ozone in mesospheric altitudes (above about 50 km) is obtained. In V5R_O3_224, the AB-band microwindows were included again, but at altitudes above 50 km only. The rationale behind this decision was that at these altitudes the gain in precision by the inclusion of these AB microwindows outweighed the induced bias.
The goal of the version 8 processing is to combine the most recent developments in the retrieval strategy with the best available, namely version 8, set of calibrated level-1b spectra in order to provide the best possible ozone data set.
MIPAS time series of ozone data retrieved with the IMK–IAA research processor were shown to be affected by drifts (Eckert et al., 2014). Also, drifts were detected for the ESA operational ozone product (Hubert et al., 2020). An inadequate non-linearity correction in the gain calibration of previous level-1b data versions was identified to be the cause of these drifts. The preflight measurements of detector non-linearity used for the calibration of MIPAS spectra up to version 5 were no longer applicable, since the non-linearity of the detector response was found to be time-dependent. Due to ageing, the detector response became more linear with time (Birk and Wagner, 2010). Birk and Wagner (2010) have developed a correction scheme that considers the age dependence of the detector non-linearity. It has been shown for version 7 that this new calibration tool removes at least a major part of the drift in the ozone time series of version 5 (Laeng et al., 2018). The in-flight characterization of the detector non-linearity has been further improved in version 8 spectra (Kleinert et al., 2018). The calibration-related changes since previous data versions are described in Kiefer et al. (2021).
In this paper, the most recent ozone retrievals performed with the IMK–IAA MIPAS data processor are discussed. This data processor uses a constrained multi-parameter non-linear least squares fitting scheme (von Clarmann et al., 2003). It has been extended to allow retrievals including non-local thermodynamic equilibrium emissions (Funke et al., 2001). The study by von Clarmann et al. (2009b) describes its application to MIPAS RR measurements. The underlying mathematics of the retrieval of MIPAS version 8 ozone data are discussed at length in Kiefer et al. (2021). The retrieval of ozone mixing ratio profiles follows the retrieval of temperature and precedes the retrieval of water vapour mixing ratios.
The profile of ozone volume mixing ratios retrieved from FR and RR measurements is represented on a discrete retrieval grid with the lowest point at 0 km. Then there is a grid width of 1 km between 4 and 55 km and further grid points at 56.5, 58, 60, 62, 64, 66, 68, 70, 72.5, 75, 77.5, 80, 85, 90, 95, 100, 105, 110, and 120 km.
Here we report only the retrieval settings and their changes since the last data version, which are specific to the ozone retrieval. These are (a) the use of version 8 temperatures and tangent altitude information (Sect. 4.1), (b) the retrieval of a background continuum up to 58 km (Sect. 4.2.1), (c) the use of prior information for the radiance offset retrieval (Sect. 4.2.2), (d) the joint retrieval of water vapour mixing ratios (Sect. 4.2.3), (e) a more adequate regularization (Sect. 4.3), (f) the use of additional microwindows (Sect. 4.4), (g) the use of carefully selected spectroscopic data (Sect. 4.5), and (h) the operation of the radiative transfer model at higher numerical accuracy (Sect. 4.6).
4.1 The preceding temperature retrieval
For the ozone retrieval, MIPAS temperatures and tangent altitude information are used, which are provided by preceding retrievals presented by Kiefer et al. (2021). Apart from using the version 8 level-1b data, the improvements of the temperature retrieval consist of a more adequate regularization, the treatment of interfering species, the assumptions on CO2 mixing ratios, the consideration of the horizontal structure of the atmosphere, the selection of microwindows, the treatment of the background continuum and the radiance offset, updated spectroscopic data, numerical issues, and the choice of the temperature a priori assumptions at altitudes where MIPAS does not vertically resolve the temperature profile.
Particularly, the new a priori temperatures at high altitudes have led to major improvements in elevated stratopause situations. The previous data version relied on climatological profiles that did not represent these situations well. Related temperature errors in the upper part of the temperature profile propagated to lower layers and further onto the ozone profiles. This problem could be remedied by the use of bias-corrected temperature profiles from a specified dynamics run (García et al., 2017) of the Whole Atmosphere Community Climate Model (WACCM; Marsh, 2011; Marsh et al., 2013) Version 4 (WACCM4). This new treatment of temperatures above the highest MIPAS tangent altitude has major implications for the ozone retrievals. In particular, the hitherto existing bias between nominal measurements and those taken with the middle atmosphere measurement mode (MA) has disappeared. The cause of the inconsistence was that the MA measurements reached higher up in the atmosphere and resolved the temperature profile there, while the NOM measurements did not.
The temperatures entering the forward calculations in the course of the ozone retrieval are the three-dimensional temperature field discussed in Sect. 3.5 of Kiefer et al. (2021). This means that the horizontal temperature structure is based on ECMWF ERA-Interim data, extended by NRLMSISE-00 data above 60 km, and that the vertical structure is based on the result of the temperature retrieval (local scaling).
4.2 The unknowns of the retrieval
The target quantities of the retrieval are ozone volume mixing ratio, water vapour mixing ratio, background continuum, and radiance offset. The latter two are retrieved independently per microwindow.
Tests were performed to include the horizontal gradient of ozone as a further unknown. However, the resulting vertical profiles of the gradients did not bear much resemblance to the horizontal gradient calculated directly from adjacent ozone vmr profiles, and there was no improvement in the χ2 values of the retrieval. Therefore, this option was not pursued any further and was not used in the final retrieval setup.
4.2.1 Background continuum
In order to account for all weakly wavenumber-dependent radiance contributions, which result neither from line-by-line calculations of absorption cross-sections nor from the consideration of interpolated pre-tabulated cross-section spectra of heavy molecules, a background continuum is fitted to minimize the residual between measured and modelled spectra (von Clarmann et al., 2003). The continuum is described by an absorption cross-section which is constant within a microwindow but can vary between microwindows and with altitude. For the reasons discussed in Kiefer et al. (2021), the background continuum has now been considered at altitudes up to 58 km, as opposed to 48 km in version 5.
4.2.2 Radiance offset
The radiance offset is an additive term included to correct the radiance zero-level calibration. It is constant within a microwindow. A priori information on the offset was taken from Kleinert et al. (2018) and was necessary to be included because at higher altitudes, where radiative transfer is linear, the background continuum and the radiance offset would form a null space in the retrieval.
4.2.3 Water vapour
Ozone spectral lines used for the retrieval are appreciably interfered with by water vapour spectral lines. The retrieval of ozone mixing ratio profiles follows the retrieval of temperature and in the retrieval chain precedes the retrieval of water vapour. Therefore, at the time of the ozone retrievals, there is no version 8 level-1b-based water vapour information available. Version 5 water vapour profiles suffer from the known drift issues and hence might induce e.g. an undesirable time dependency in the retrieval results through interfering lines. Another aspect is that spectroscopic data of these interfering water vapour lines in the ozone microwindows may be inconsistent with the spectroscopic data used for the water vapour retrieval in the respective water vapour microwindows. Thus, the spectral signal caused by the interfering water vapour lines in the ozone microwindows would not be accurately accounted for if water vapour concentrations from water vapour retrievals were used. In order to avoid propagation of these two types of errors onto the ozone data product, water vapour is fitted jointly with ozone. Since the resulting water vapour profiles are inferior to the regular MIPAS H2O product, the water vapour information resulting from the ozone retrievals is discarded after the ozone retrieval.
4.3 Regularization
Regularization of the version 8 ozone retrieval uses a smoothing term based on a squared first-order difference-based cost function (see e.g. Tikhonov, 1963; Twomey, 1963; Phillips, 1962). The a priori profile is a constant profile (a zero profile). Additionally, a diagonal term is used, which pushes the result towards the a priori profile, similarly to optimal estimation or maximum a posteriori retrievals (Rodgers, 2000). This diagonal term is employed only at the two uppermost altitudes of the retrieval grid. Values are pushed towards zero vmr there. The purpose is to avoid unphysical large negative mixing ratios at these altitudes, which are occasionally retrieved otherwise. This modification allowed us to weaken the Tikhonov-type smoothing regularization at all altitudes by approximately 20 %. This, in turn, improved the vertical resolution of the resulting ozone profiles. The approach to control the altitude dependence of the smoothing constraint as described by Kiefer et al. (2021, their Eq. 3) supersedes the old approach by Steck and von Clarmann (2001) which was previously used.
4.4 Microwindows
In a former MIPAS data version (V5R_O3_224) a positive bias in MIPAS ozone profiles in the upper troposphere and lowermost stratosphere was detected (Laeng et al., 2014, 2015). This problem could be attributed to the use of microwindows in the MIPAS AB band (1010–1180 cm−1). Glatthor et al. (2018) showed that ozone spectroscopic data in the MIPAS A band (685–980 cm−1) and the AB band were inconsistent. While removal of the AB-band microwindows removed the ozone bias, insufficient measurement information was available at higher altitudes, leading to increased retrieval noise and less-than-optimal vertical resolution. For ozone version 8 some AB-band microwindows were re-included but only at altitudes above 50 km, where the gain in precision and vertical resolution outweighs the bias caused by the microwindows. The version 8 microwindow selection is shown in Table 1. The microwindow 720.7500 to 723.6875 cm−1, which was still included in ozone data version 7, to which the evaluation by Laeng et al. (2018) refers, has been removed because of systematic fit residuals that could not be removed.
Table 1Microwindows used in the MIPAS NOM O3 retrieval.
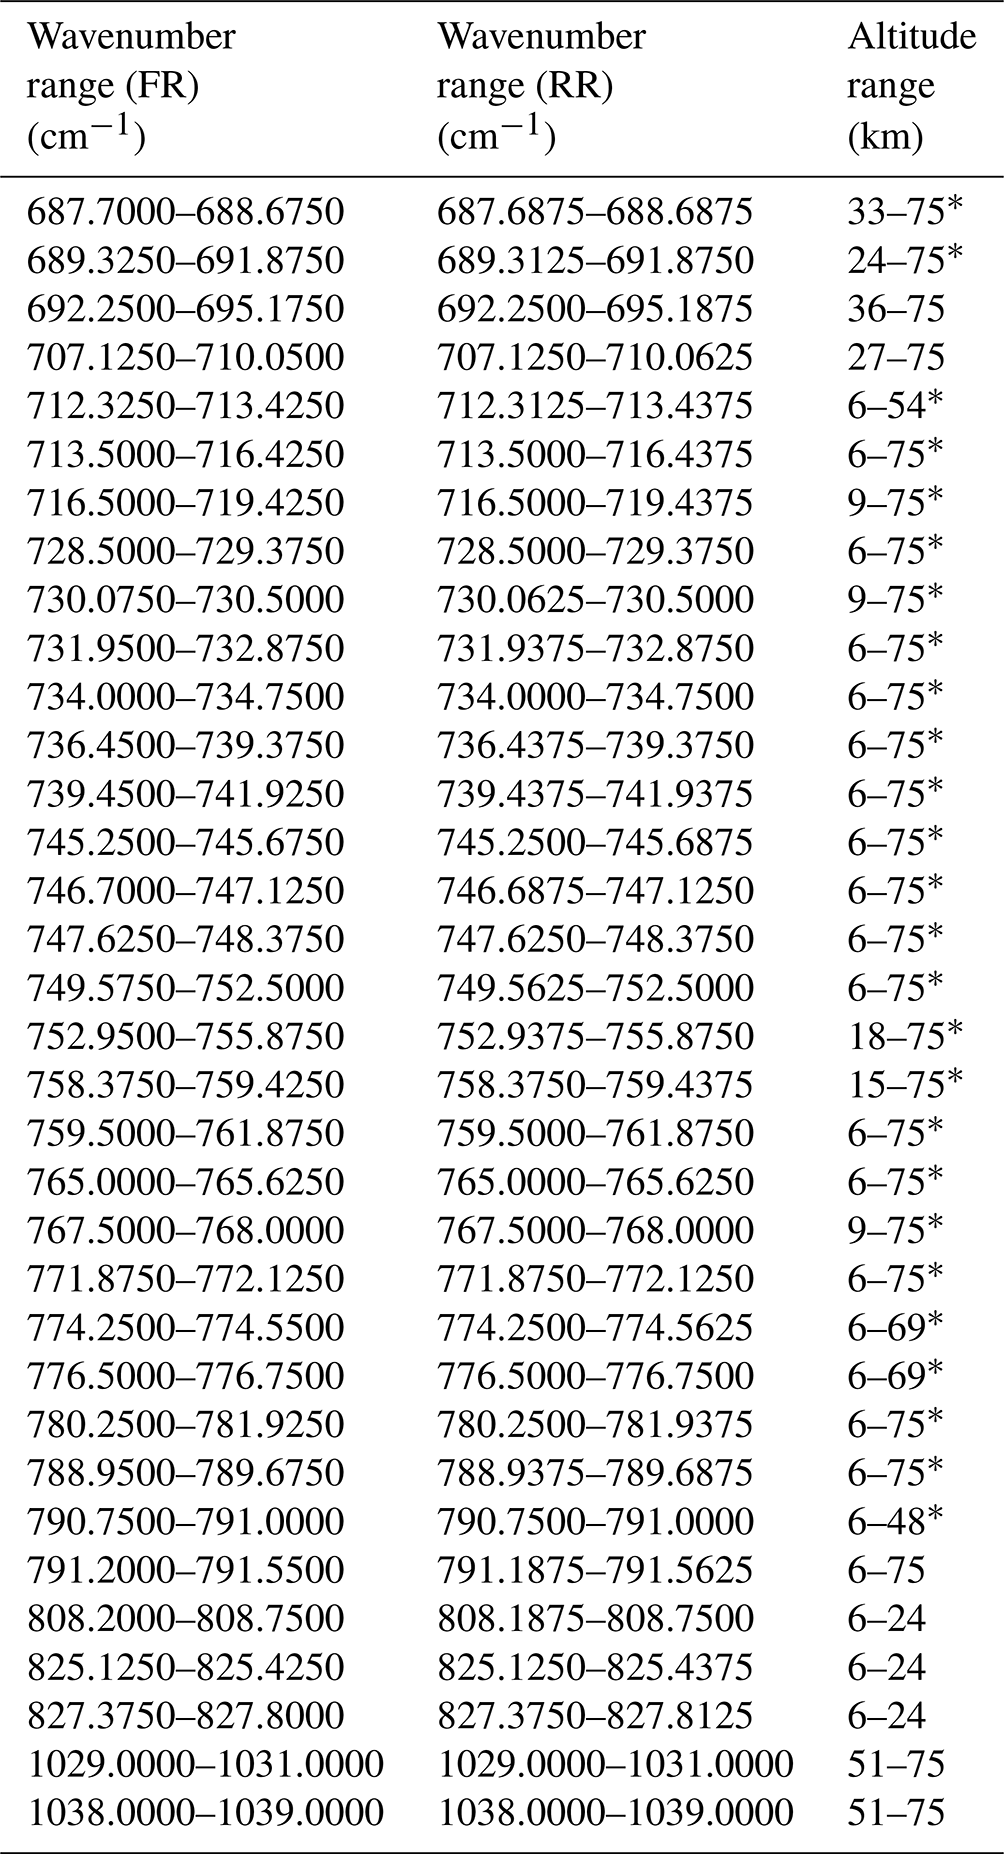
∗ The altitude range of this microwindow is the envelope range; i.e. the microwindow is not used in the entire altitude range reported, but there are certain altitudes where it is disregarded to avoid the signal of interfering species of uncertain concentration.
4.5 Spectroscopic data
For O3 and HNO3, the MIPAS spectroscopy data sets pf3.2 and pf4.45 (Flaud et al., 2003a, b) are used, respectively. For the other interfering species HITRAN2016 (Gordon et al., 2017) is used. CO2 line-mixing coefficients have been re-calculated for the new spectroscopic data. The choice of the MIPAS spectroscopic ozone database was motivated by the fact that the inconsistencies between the MIPAS A and AB bands are smaller than with the HITRAN data and because in HITRAN2016 there is an implausible jump in the air-broadening coefficients at 797 cm−1 (Glatthor et al., 2018).
4.6 Numerical issues
The radiative transfer model KOPRA (Stiller, 2000), used to provide the modelled spectra and the Jacobians, was operated at higher numerical accuracy than in previous versions. In particular, the monochromatic grid on which the absorption cross-sections are calculated was set to a spacing of 0.0009765625 cm−1 instead of 0.00125 cm−1, and the apodization of calculated spectra used a wider frequency range. In the retrieval code an “oscillation detection” has been activated which identifies failure of convergence in the sense that the iteration flips back and forth between two minima of the cost function according to and . In this case xi+1 is set to , and further iteration steps are performed. A total of 2 393 767 ozone profiles were obtained (506 262 for FR and 1 887 033 for the RR mode). The convergence rate was 99.96 %.
4.7 Non-LTE
In the upper part of the altitude range under consideration (above 60 km), the assumption of local thermodynamic equilibrium (LTE) is not valid in the 10 µm spectral region (López-Puertas and Taylor, 2001). To avoid propagation of related effects on the retrieved ozone mixing ratios, deviations of the populations of vibrationally excited molecules from a Boltzmann distribution at the local kinetic temperature are considered in the radiative transfer calculations for the 010, 001, and 100 bands of the ozone main isotopologue. The relatively small magnitude of these non-LTE effects in the altitude range covered by the NOM observations does not justify the effort to employ computationally expensive non-LTE population models during each step of the retrieval, as done previously in retrievals from observations taken in the middle- and upper-atmospheric observation mode (López-Puertas et al., 2018).
Instead we use a parameterized non-LTE approach that accounts for the temperature dependence of the vibrational non-LTE populations. It is based on a seasonal and latitudinal climatology for the local times of MIPAS-ascending and MIPAS-descending overpasses which has been computed with an updated version of the Generic RAdiative traNsfer AnD non-LTE population algorithm (GRANADA, Funke et al., 2012). More details on this approach can be found in Sect. 3.11 of Kiefer et al. (2021).
Since thorough error calculations are computationally expensive, the estimation for the error contributions of measurement and instrument characterization errors, as well as for parameter errors and model errors, is performed for a set of 34 representative atmospheres (defined in Tables A1 and A2 of von Clarmann et al., 2022). For each of these 34 atmospheres a set of approximately 30 geolocations are selected, and the error calculations are performed. Means are then calculated from the respective geolocations and the diverse error components. These means are regarded as error component estimates for the specific representative atmosphere. The only exception to this approach is the noise error estimate, which is available for every single ozone profile, since it is calculated from the spectral noise Sy during the retrieval. Every single measurement geolocation can be uniquely associated with one of those representative atmospheres. Hence, the respective error estimates, except for the noise error, are assigned to this geolocation, with the relative errors being scaled to the actual ozone profile. Technical details of the error estimation of MIPAS trace gas retrievals are reported by von Clarmann et al. (2022).
The following error sources are considered: measurement errors including spectral noise, uncertain gain calibration, instrument line shape uncertainty, uncertainties in the frequency calibration, and pointing errors; parameter errors including temperature and mixing ratios of interfering species; and uncertainties in spectroscopic data.
As justified in detail by von Clarmann (2014) the error budget does not comprise the smoothing error: our retrieval should be considered an estimate of the smoothed true profile rather than a smoothed estimate of the true profile (see Rodgers, 2000, Sect. 3.2.1, for a discussion of this issue).
The measurement noise is typically 30–33 nW (cm2 sr cm−1)−1 in the MIPAS A band and 5.4–9.6 nW (cm2 sr cm−1)−1 in the AB band; both values refer to apodized spectra. The response of the ozone retrieval to measurement noise is shown for Envisat orbits 4577 (FR) and 35800 (RR) in Fig. 1a and b, respectively. The region of increased noise around altitudes of approximately 40 km and around 60∘ N in Fig. 1b is caused by very low temperatures (less than 200 K), which lead to reduced atmospheric signal in the corresponding IR spectra, while the spectral noise contributions are unchanged. The noise error can roughly be considered additive. That is to say, the relative contribution of noise is larger for smaller mixing ratios. Further, the signal-to-noise ratio is smaller for colder atmospheres.
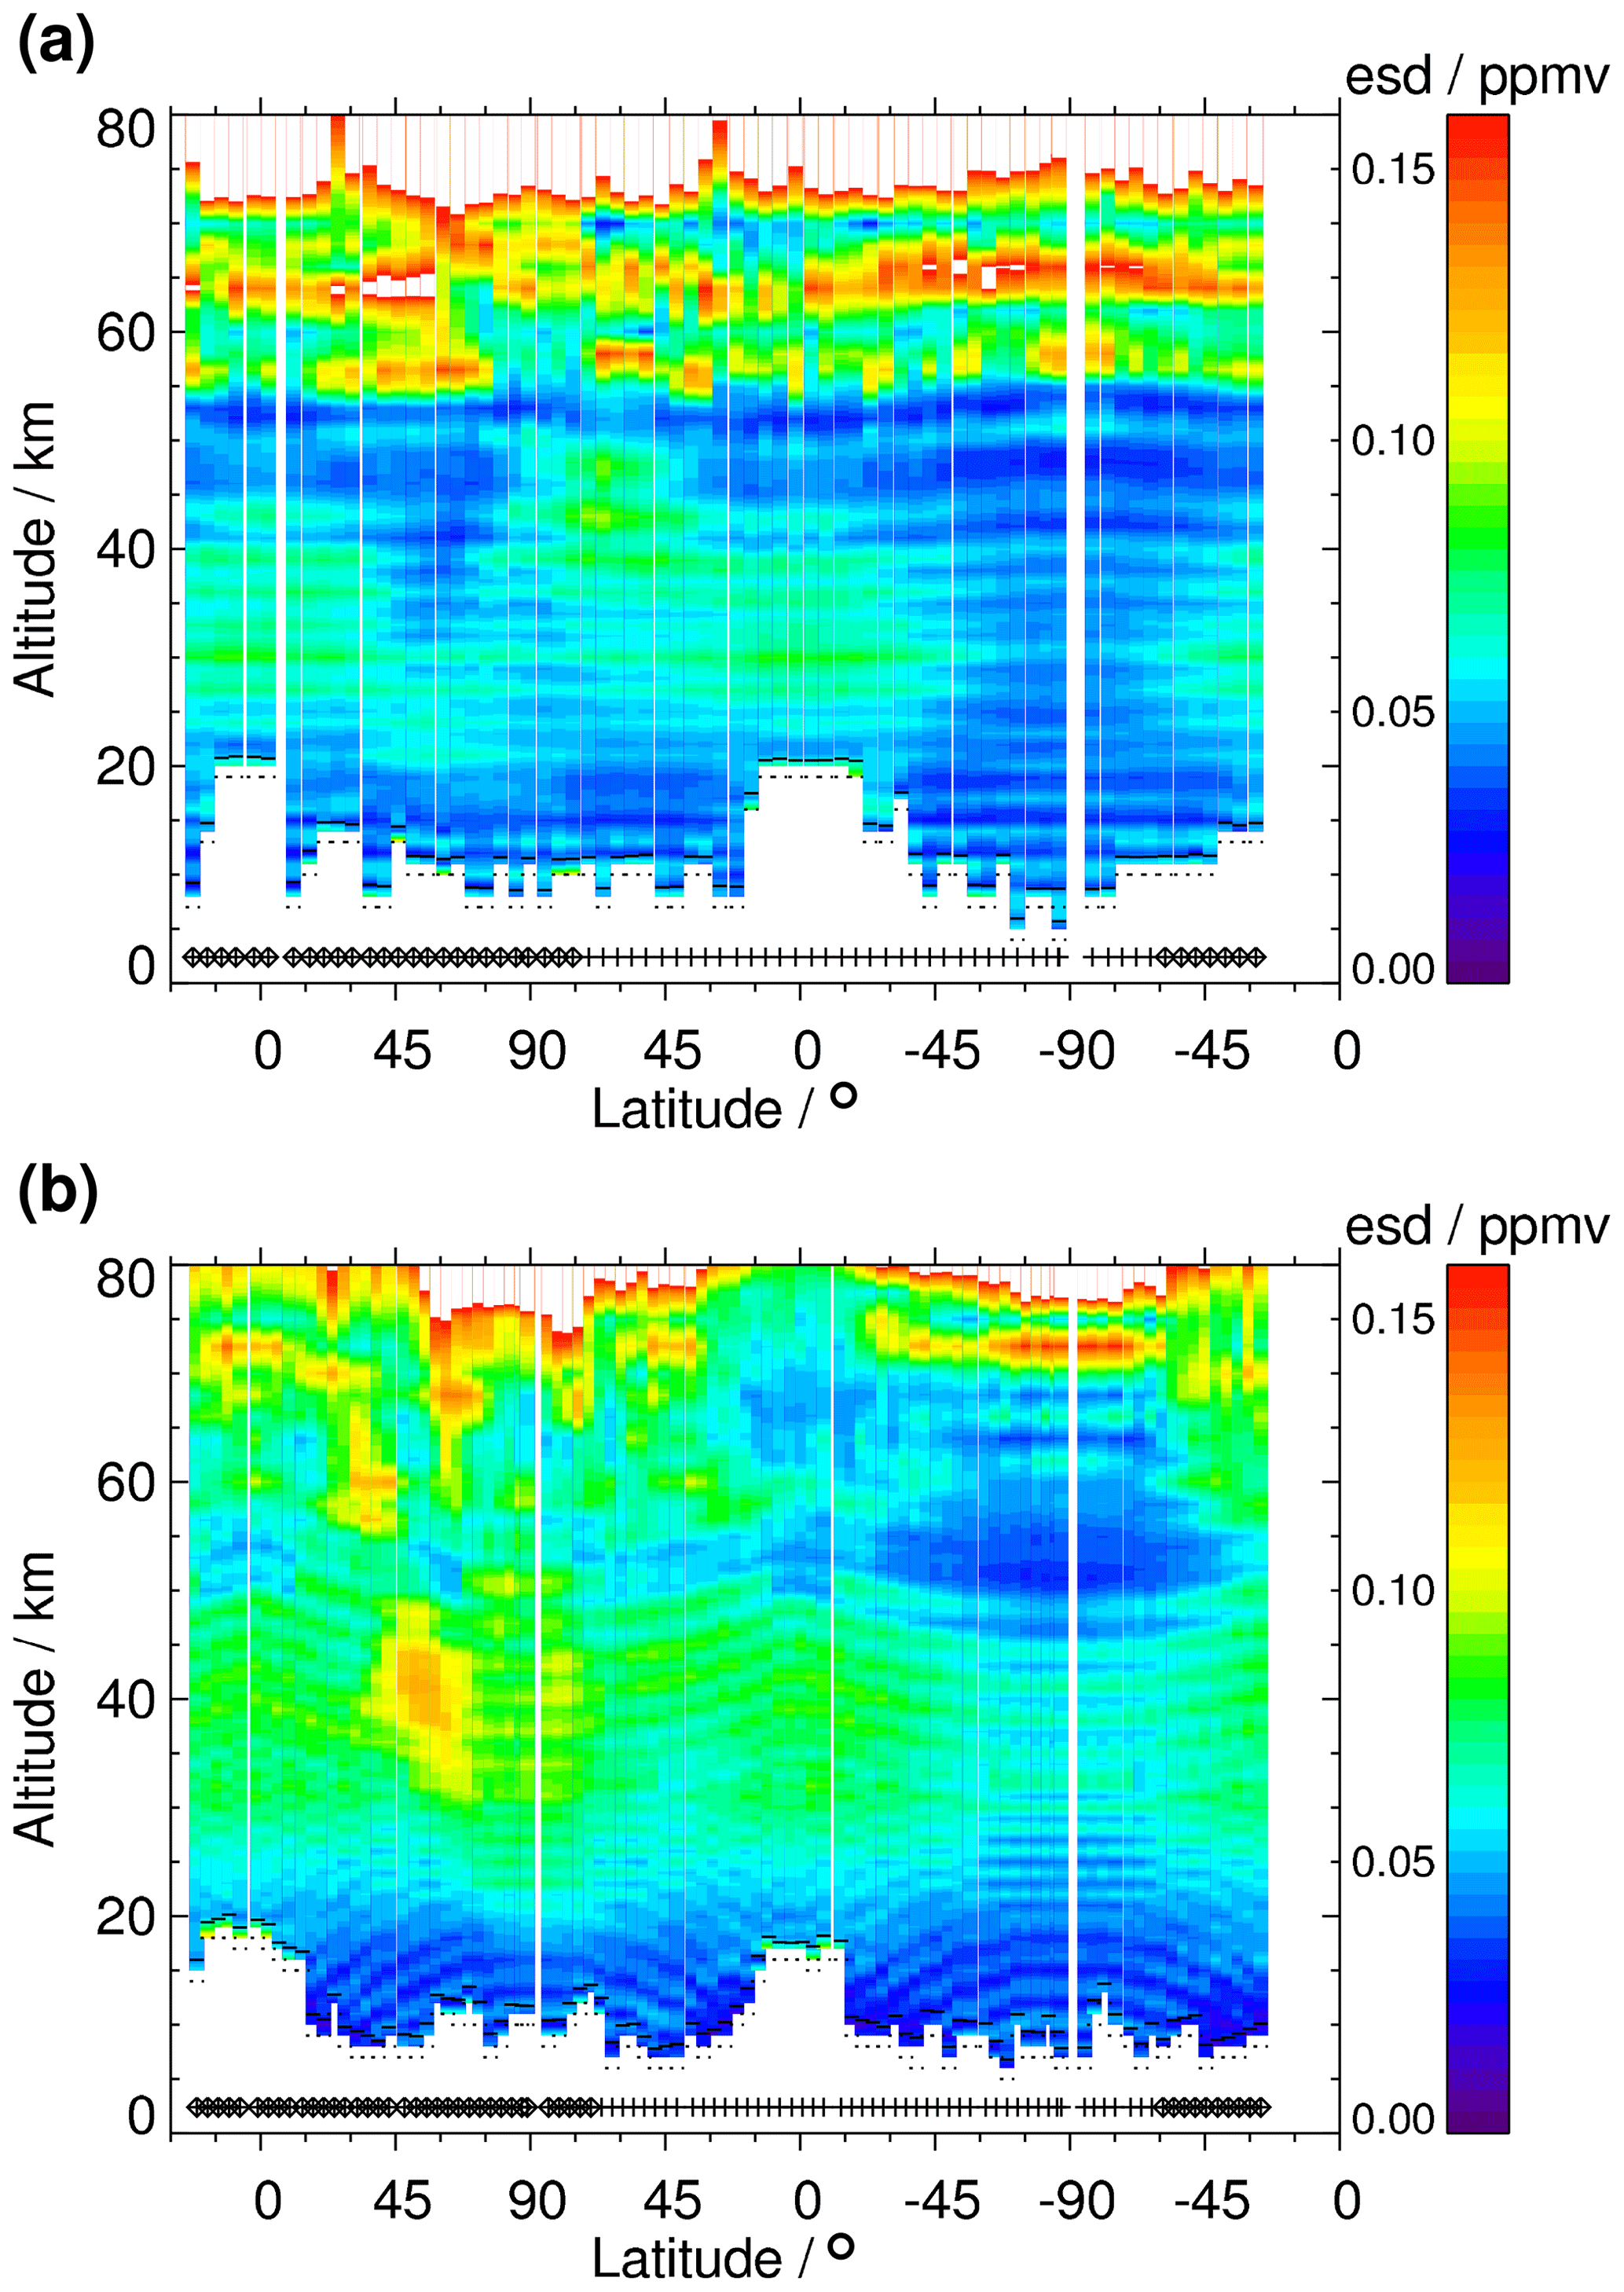
Figure 1The noise component of the ozone uncertainty in terms of estimated standard deviations for sample orbits 4577 (a) and 35800 (b) as a function of latitude and altitude. Data are shown along one orbit starting at approx. 30∘ S on the ascending orbit part. The symbols just above the latitude axis show the position of the measurement and indicate the illumination conditions (diamond: nighttime; plus: daytime).
Gain uncertainties were estimated at 1.4 % during the FR period and 1.1 % during the RR period for the A band; for the AB band we used 0.9 % for the FR period and 0.8 % for the RR period (Kleinert et al., 2018). The response of retrieved ozone abundances to the gain calibration error is roughly multiplicative. In MIPAS band A the gain uncertainties of the ozone retrieval interact in a systematic, mostly compensating, way with gain uncertainty components of the temperature and tangent altitude errors.
Instrument line shape (ILS) errors and spectral shift residual error are treated as described in Kiefer et al. (2021). The uncertainty of the spectral shift is 0.00029 cm−1. ILS uncertainties are based on the estimates of modulation loss through self-apodization and its uncertainties (Hase, 2003).
For the ozone retrieval, information from the preceding temperature and tangent altitude retrieval is used. The temperature uncertainties can reach up to 2.5 K in a few cases but are mostly below 1 K in the altitude range 20–50 km (Kiefer et al., 2021). Tangent altitude uncertainties are in the range of 200–250 m for the systematic and 30–80 m for the random component. The latter is propagated onto the ozone product using the corresponding error covariance matrices of the temperature and line-of-sight retrieval. The resulting ozone uncertainties roughly scale with the ozone mixing ratio and should thus be treated as multiplicative errors. The gain, ILS, spectral shift, and spectroscopic data components of the temperature and tangent altitude errors are treated separately in order to allow for the correct treatment of the systematic interaction with the gain, ILS, and spectral shift components of the ozone retrieval errors and to disentangle their random and systematic components.
For some of the interfering species that are not jointly fitted we use retrievals of previous MIPAS data versions (V5) in the radiative transfer forward calculations and hence can make use of their respective random error covariance matrices. They can be considered better representative for the actual conditions of the measurement than climatological mean values. For interfering species which are not available from previous data versions, perturbation spectra are calculated based on climatological data and on an assumption of the 1σ errors. In total, the contribution of interfering species to the ozone error budget is close to negligible due to the availability of many sufficiently strong ozone lines (see discussion in Sect. 5).
H2O uncertainties are not classified as parameter errors, since H2O mixing ratios are jointly fitted along with O3.
Radiative transfer model errors are notoriously hard to quantify. Since no relevant malfunction of the radiative transfer model in use, KOPRA (Stiller, 2000; Stiller et al., 2002), is known and the numerical accuracy parameters have been adjusted (Höpfner and Kellmann, 2000), we concentrate on the analysis of uncertainties in spectroscopic data. As already stated in Kiefer et al. (2021), uncertainties in spectroscopic data are not as clearly characterized as the retrieval scientist would like them to be. Band- and transition-dependent uncertainty estimates are usually available and used in our error analysis. However, it is often unclear what these uncertainty estimates represent, and information about error correlation is mostly missing. Since we use multiple ozone lines, it would be of utmost importance to know if the errors are fully random between the transitions and thus tend to cancel out or if they are systematic and thus affect the retrieval in full, regardless how many lines are used.
Table 21σ uncertainties of spectroscopic O3 data as used for this work. J and K are the upper-state rotational quantum numbers.

For our error estimates we have made the following assumptions. Uncertainties in line intensities are parameterized according to a list by Jean-Marie Flaud and Chiara Piccolo (unpublished document, 2002), which roughly correspond to those of the HITRAN16 database (Gordon et al., 2017), and are reported as a function of band and rotational quantum number. For the stronger ozone lines the uncertainties are in the range of 2 %–4 % (Table 2). For the broadening coefficients we use a parameterization which roughly represents the uncertainties reported in HITRAN16. We use uncertainties of 3.5 %, 7.5 %, 15 %, and 20 %, depending on the respective ozone band; see Table 2.
We take all uncertainties to be characterizing 1σ uncertainties and make the most possible conservative assumption that the spectroscopic errors are fully correlated among the lines. We do not consider spectroscopic uncertainties of the interfering species. The reason is as follows. We use MIPAS-retrieved mixing ratios for these species which are affected by the spectroscopic errors in a way that the resulting signal (e.g. line intensity that is too high and accordingly a mixing ratio that is too low) produces roughly the correct radiance signal. That is to say, the spectroscopic errors in interfering species and related errors in the mixing ratios cancel out and thus need no consideration in the ozone error budget.
As a rough guideline, spectroscopic uncertainties can be considered relative errors. That is to say, to a first order they scale with the ozone mixing ratio.
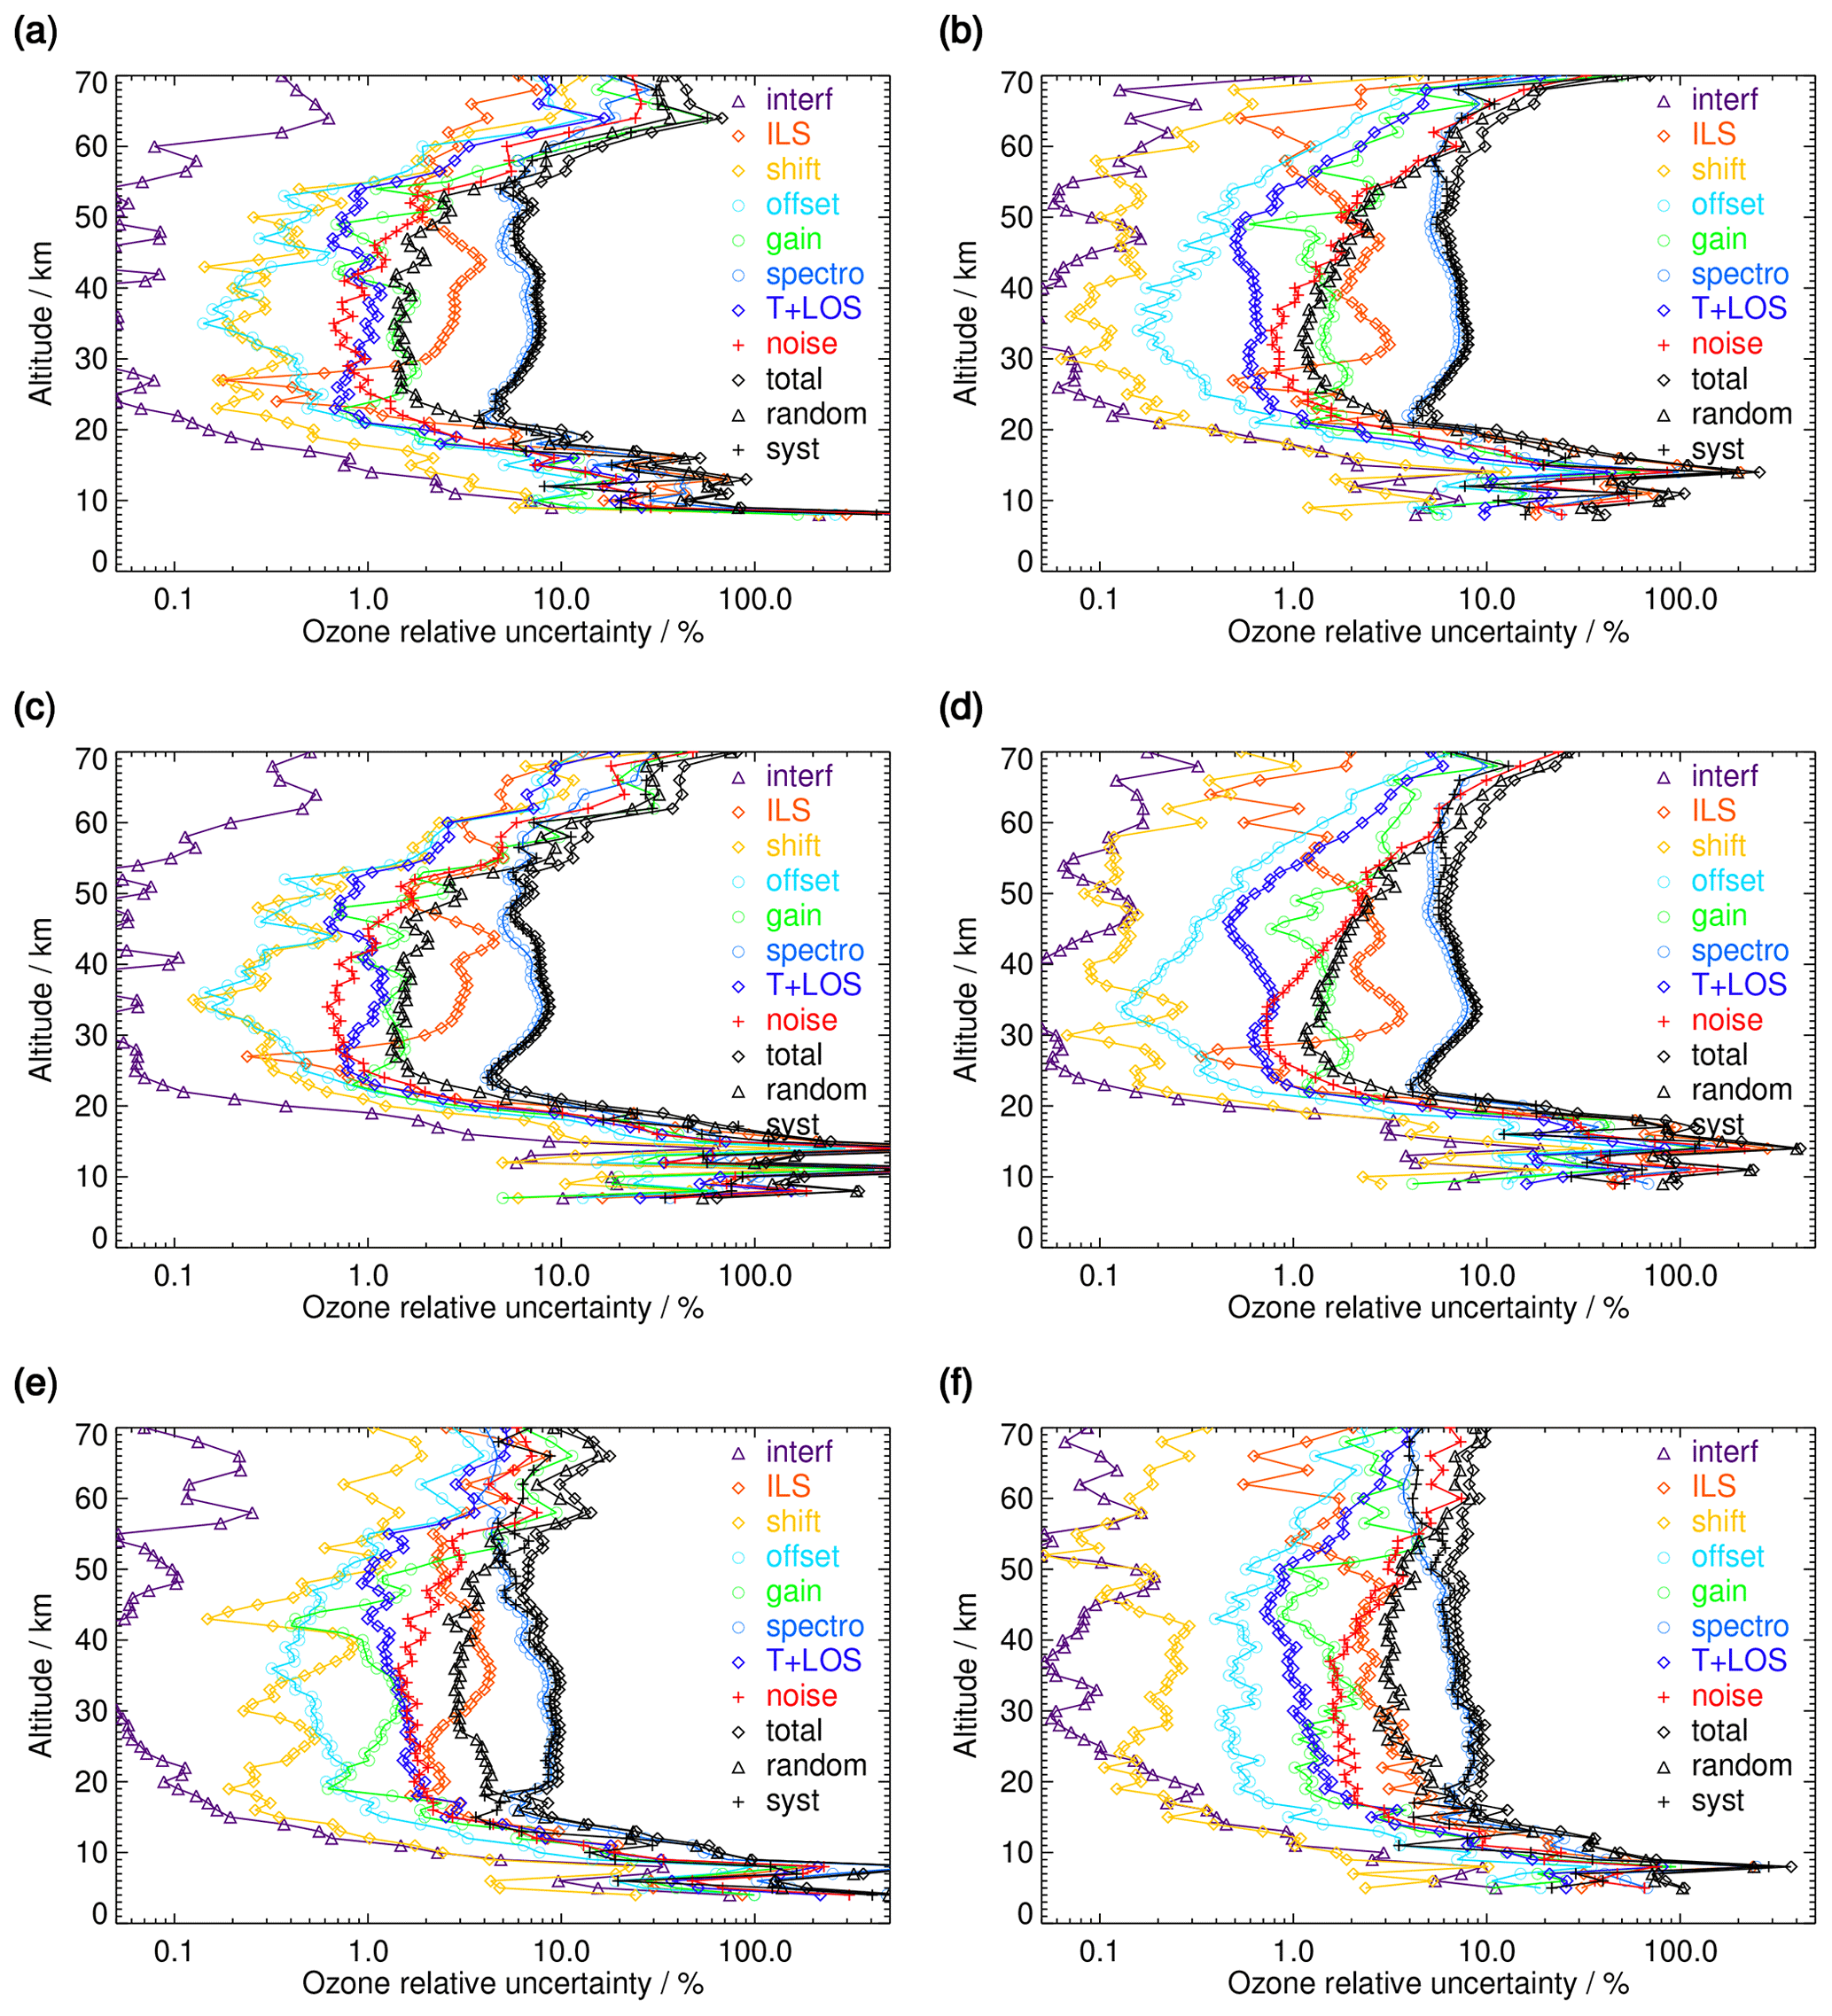
Figure 2Ozone error budget for FR (a, c, e) and RR (b, d, f) data. Additive and multiplicative errors are shown as relative errors of the respective ozone profiles. All error estimates are 1σ uncertainties. Error contributions are marked “T+LOS” for the propagated error from the T+LOS retrieval, “noise” for error due to spectral noise, “spectro” for spectroscopic error, “gain” for gain calibration error (MIPAS band A and AB; see text), “shift” for spectral shift error (see text), “ILS” for instrument line shape error (see text), “offset” for error due to spectral offset (see text), and “interf” for the error due to interfering gases. (a, b) Northern midlatitude summer day, (c, d) tropical day, and (e, f) southern polar winter night.
Figure 2 shows the error budget for three selected atmospheric conditions, namely northern midlatitude summer day, tropical day, and southern polar winter night, for ozone retrievals from the FR (left column) and RR (right) measurement period. Tables and figures showing the error budgets of the remaining 31 representative atmospheres can be found in the Supplement.
The gain, instrument line shape (ILS), spectral shift, and spectroscopic data components of the temperature and tangent altitude errors are treated separately in order to allow the correct treatment of the systematic interaction with the gain, ILS, and spectral shift components of the ozone retrieval errors and to disentangle their random and systematic components. However, for the plot the respective error pairs are quadratically added up and represented by one curve. That means that e.g. the orange lines in Fig. 2 represent the ozone retrieval errors that come directly from the ILS uncertainty and those which are propagated via the T and LOS retrieval errors due to the ILS uncertainty.
It is evident that the spectroscopic error (open blue circle) is by far the single most important contributor to the total error in the altitude range of 20–55 km for all three atmospheres. The noise error becomes large at altitudes where the ozone vmr is low and above 60 km begins to dominate the error budget of the RR ozone profiles. The impact of the low temperatures in the southern polar winter night stratosphere is well discernible, as the values increase to about 2 % at 25–30 km, while in the tropics and at northern midlatitudes they are at the 1 % level. We included 21 interfering species in the calculation of the error budget. However, according to Fig. 2, where the total of all of these (calculated as the square root of the sum of the respective variances) is shown with triangle symbols, the contribution in most altitudes is among the smallest ones. This is because ozone has strong lines in MIPAS A and AB bands, and it is rather easy to select enough microwindows with a low to negligible signal of other gases.
As can already be seen from Fig. 2, there is no major inconsistency between the total errors (black diamonds) of FR and RR measurements for the three cases shown. A more detailed analysis shows that FR and RR total errors are quite close for most of the representative atmospheres in the altitude range of 20–50 km. Above and below the FR data exhibit total errors which are a factor of 2 (at 65 km) and 2–3 (at 10 km) greater than in the respective RR data. However, single error contributions can show quite a different behaviour. The error due to uncertainty in the spectral shift is 2–3 times larger in FR compared to RR at virtually all altitudes, although its contribution to the error budget is rather small. The ratio of FR to RR for the instrument ILS-induced errors is about 1 from 20–35 km, has a peak of 1.6 at 40 km, decreases towards 1 again at 50 km, and increases to values exceeding 3 above 60 km and below 15 km. A possible explanation is the difference in the spectral resolution: the influence on the exact shape of a spectral line is expected to be stronger for better spectral resolution. Since the ILS error has a significant contribution to the total error, the differences in FR and RR below 20 and above 50 km correspondingly contribute to the respective differences in the total error budget. The noise error of FR data is comparable to that of RR data at 20 km and decreases to only two-thirds of the latter at 45 km, while above 50 km and below 20 km it is 1.5–2 times larger. Propagated errors from the preceding T+LOS retrieval, in general, are greater in FR than in RR data by a factor of approximately 1.5 above 20 km and 2–3 below. The ratio of the FR and RR errors due to uncertainties in spectroscopy, which have already been identified above as the main contributor to the total error, is close to unity between 20 and 50 km. It reaches values of about 1.2 above and 2–3 below, and hence it is the main contributor to the differences in the total errors between FR and RR data below 20 km.
In the next sections we discuss the relevant measurement, parameter, and model error sources, following the recommendations of Towards Unified Error Reporting (TUNER; von Clarmann et al., 2020). We categorize each error source either as chiefly random (Sect. 5.1) or as chiefly systematic (Sect. 5.2), depending on whether it causes mainly scatter or a bias. For mixed errors that cause both bias and scatter (“headache errors”), both components are reported separately. We aggregate the resulting random and systematic error components separately. All estimated errors are reported in terms of standard deviations (1σ). Averaging kernels are provided as additional information (Sect. 6.1).
5.1 Random errors
Following the recommendation of TUNER (von Clarmann et al., 2020), we define random errors as errors that explain the standard deviation of the differences between collocated measurements by two instruments measuring the same state variable. The main contributors to the total random error in the altitude range of 20–50 km are roughly ordered by their magnitude: measurement noise (0.8 %–3 %); tangent altitude uncertainties (0.6 %–2 %); the random component of gain calibration uncertainty (however, sometimes being greater than the LOS uncertainty); uncertainty in offset calibration; spectral shift uncertainty; and the uncertainties in those interfering species' abundances that are not varied in the retrieval, with the latter two components contributing usually far less than 1 % each in this altitude range.
The state of the atmosphere can exert an influence on the size of the contribution of a specific error component to the budget. The contribution of e.g. noise is larger for colder and smaller for warmer atmospheres, as is illustrated in Fig. 2 and discussed in Sect. 5. Error correlation matrices for the measurement noise error (not shown here) can be made available to data users on request.
5.2 Systematic errors
All errors that cause a long-term bias between measurements by different instruments are categorized as systematic errors. Since systematic errors are often modulated by the atmospheric state, the categorization of random versus systematic errors can only be approximative.
Chief contributors to the MIPAS systematic error budget are uncertainties in spectroscopic data with respect to the intensities and broadening coefficients of the spectral lines used; uncertainties in the MIPAS modulation efficiency that leads to uncertainties in the ILS; and the persistent part of the gain calibration uncertainty, which is by far dominated by detector non-linearity issues (see Table 3 of Kleinert et al., 2018).
6.1 Averaging kernels and vertical resolution
Figure 3 shows examples of averaging kernel rows and vertical-resolution profiles of the MIPAS ozone retrievals for sample geolocations of FR (Fig. 3a) and RR (Fig. 3b) measurements. The vertical resolution of the ozone profiles is estimated as the full width at half maximum of the respective row of the averaging kernel matrix. All altitudes show higher peak values of the kernel rows for RR compared to FR, and, since the norm of the kernel rows is one, this already hints at a better vertical resolution for RR ozone profiles.
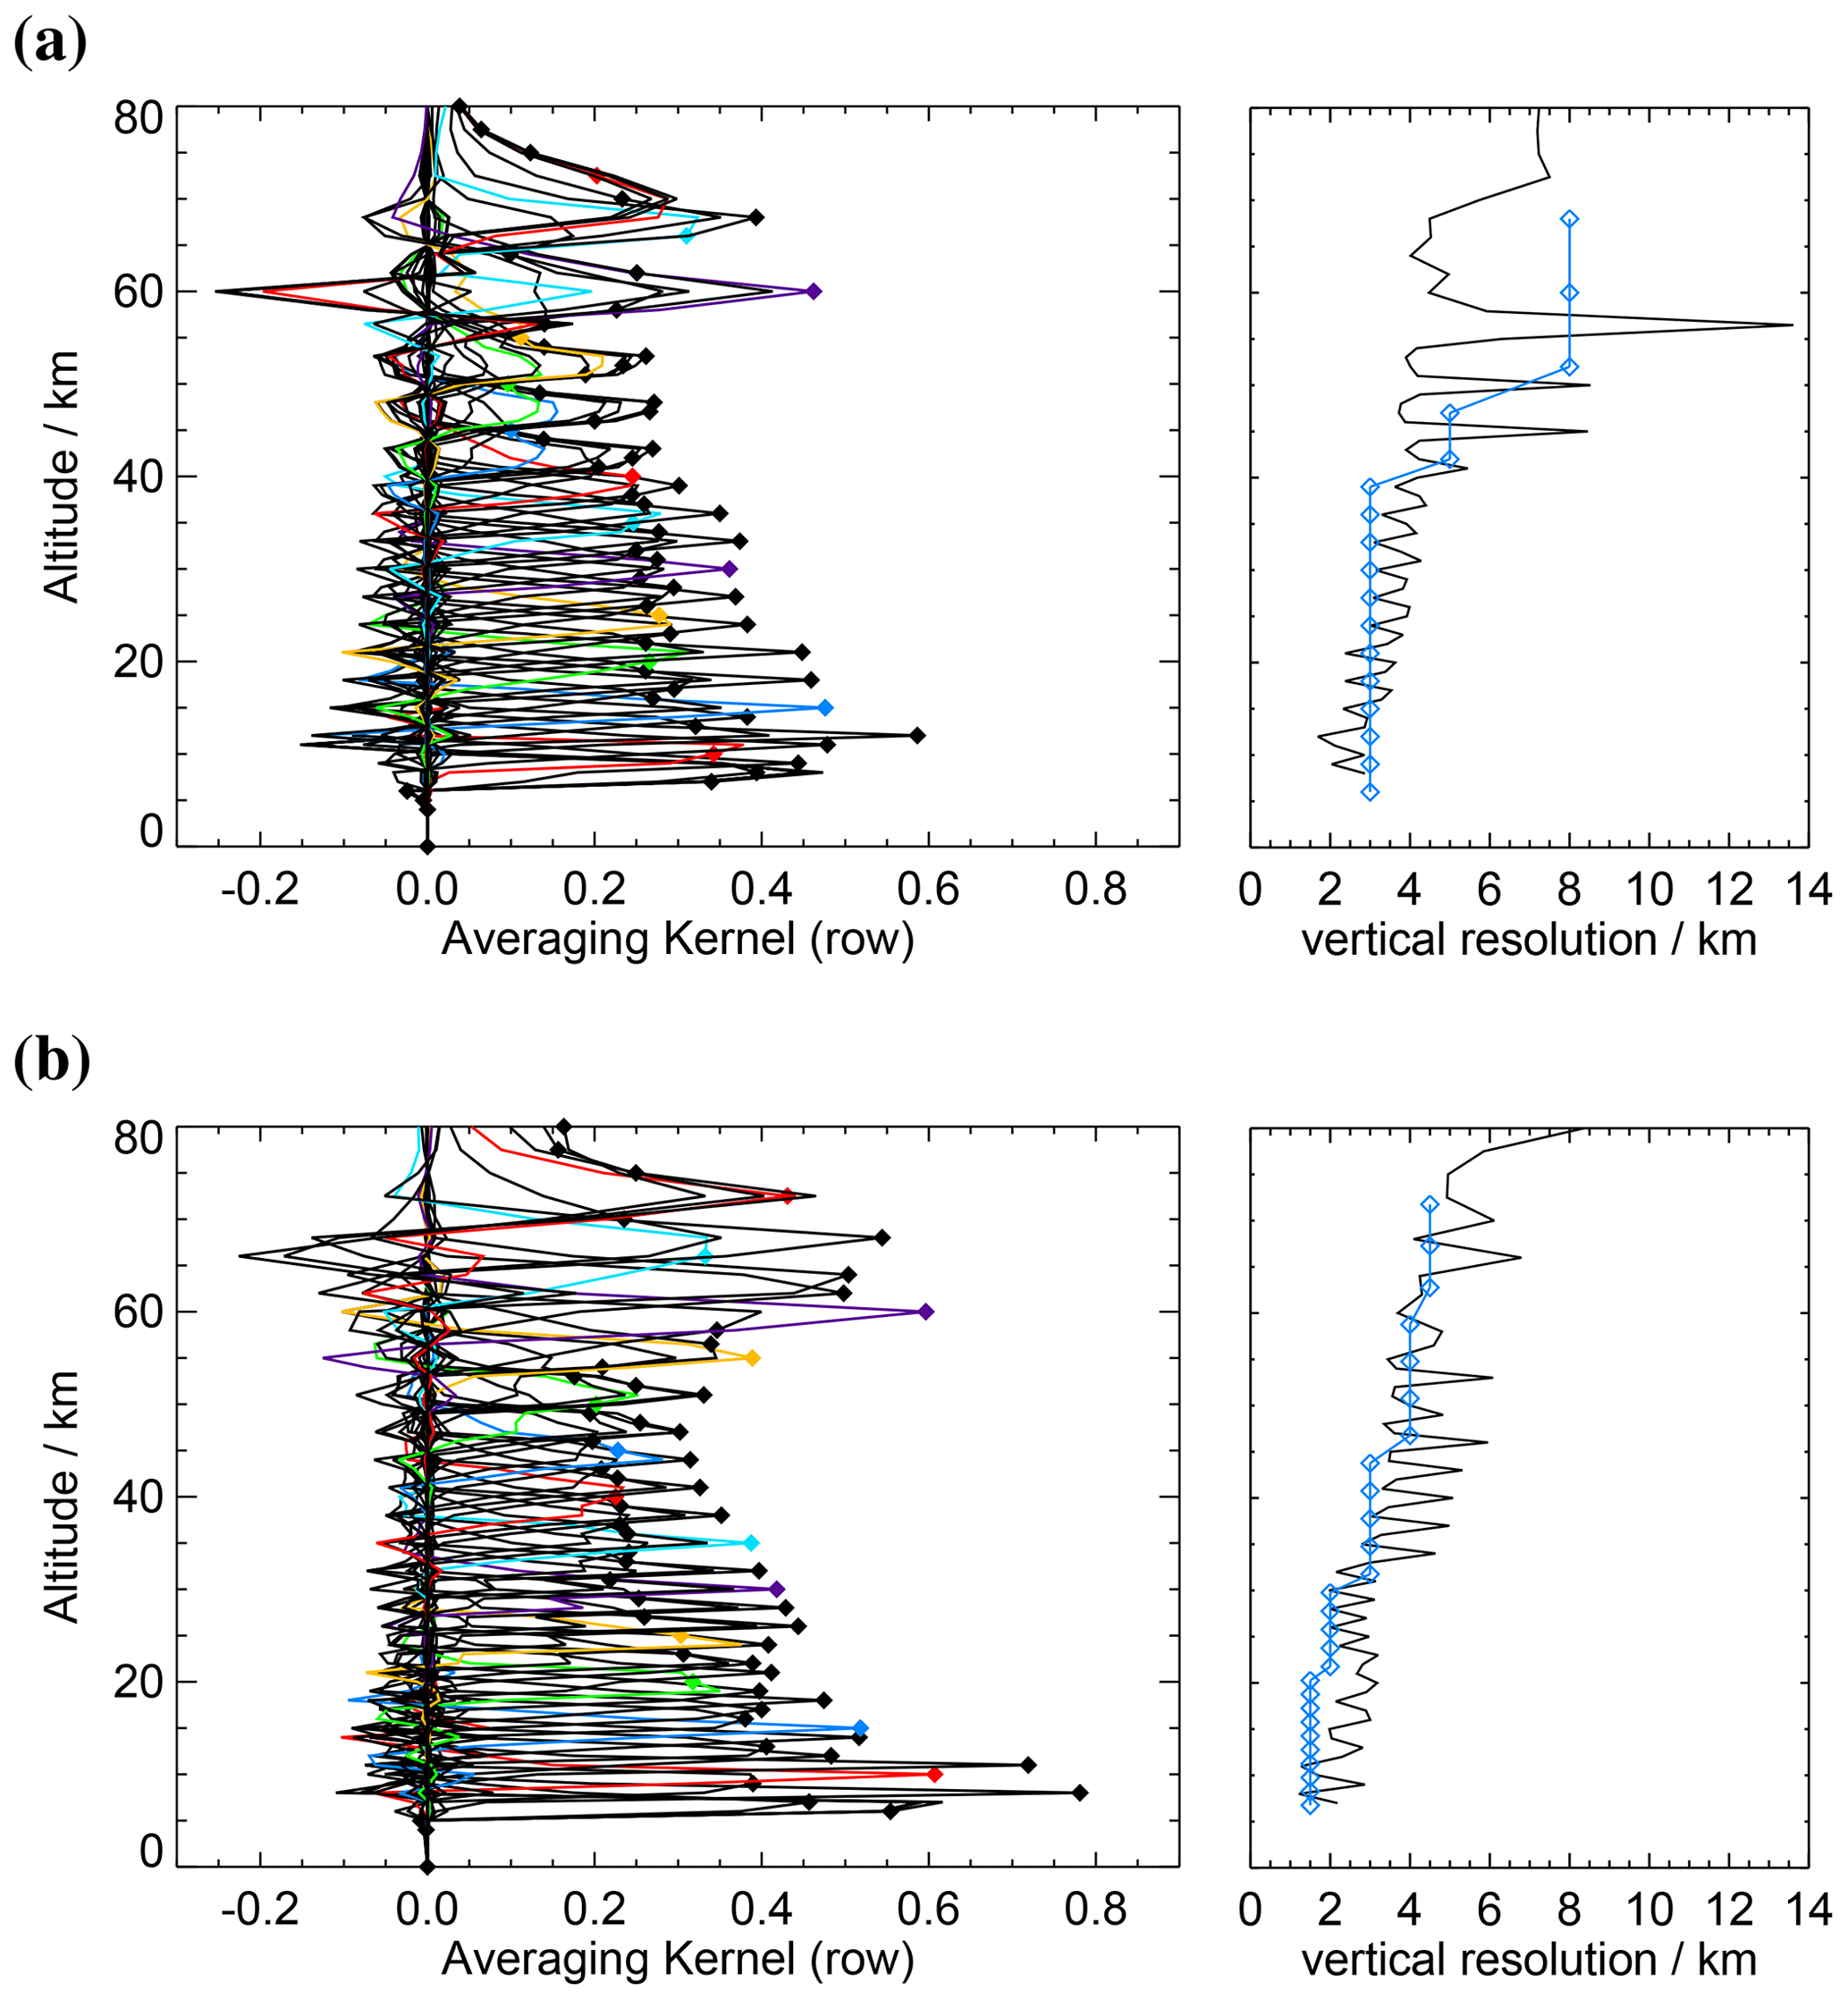
Figure 3Rows of the averaging kernel matrix for ozone profiles recorded during the FR and RR measurement period (left panels) and the corresponding vertical resolution, as calculated from the full half-width of the kernel rows (right panels, black curves). Kernel rows are coloured every 5 km up to 60 km. FR data (a) are taken from 14 January 2003 (Envisat orbit 4577) at 46.1∘ N, 155.1∘ W and at solar elevation 17.6∘; RR data (b) are from 4 January 2009 (orbit 35800) at 48.4∘ N, 116.4∘ E and at solar elevation 14.6∘. In the right panels the measurement grid widths are shown as blue curves with diamond symbols.
Figure 4 depicts the vertical resolution over altitude along the orbit for orbits 4577 (FR, Fig. 4a) and 35800 (RR, Fig. 4b): indeed, the resolution is better for the RR data in all altitudes. The vertical resolution varies with the vertical scan pattern and, in the case of RR measurements, with its latitudinal variation. The vertical fine structure of the data is caused by the fact that the retrieval grid is finer than the scan/measurement grid. Local minima of the vertical resolution are reached when a retrieval grid point lies close to or on a measurement grid point. However, we shall not look into the details of this fine structure in what follows but rather discuss the properties of the vertical resolution in the sense of altitude-smoothed profiles averaged over time (e.g. over April 2003 for FR and 2009 for RR).
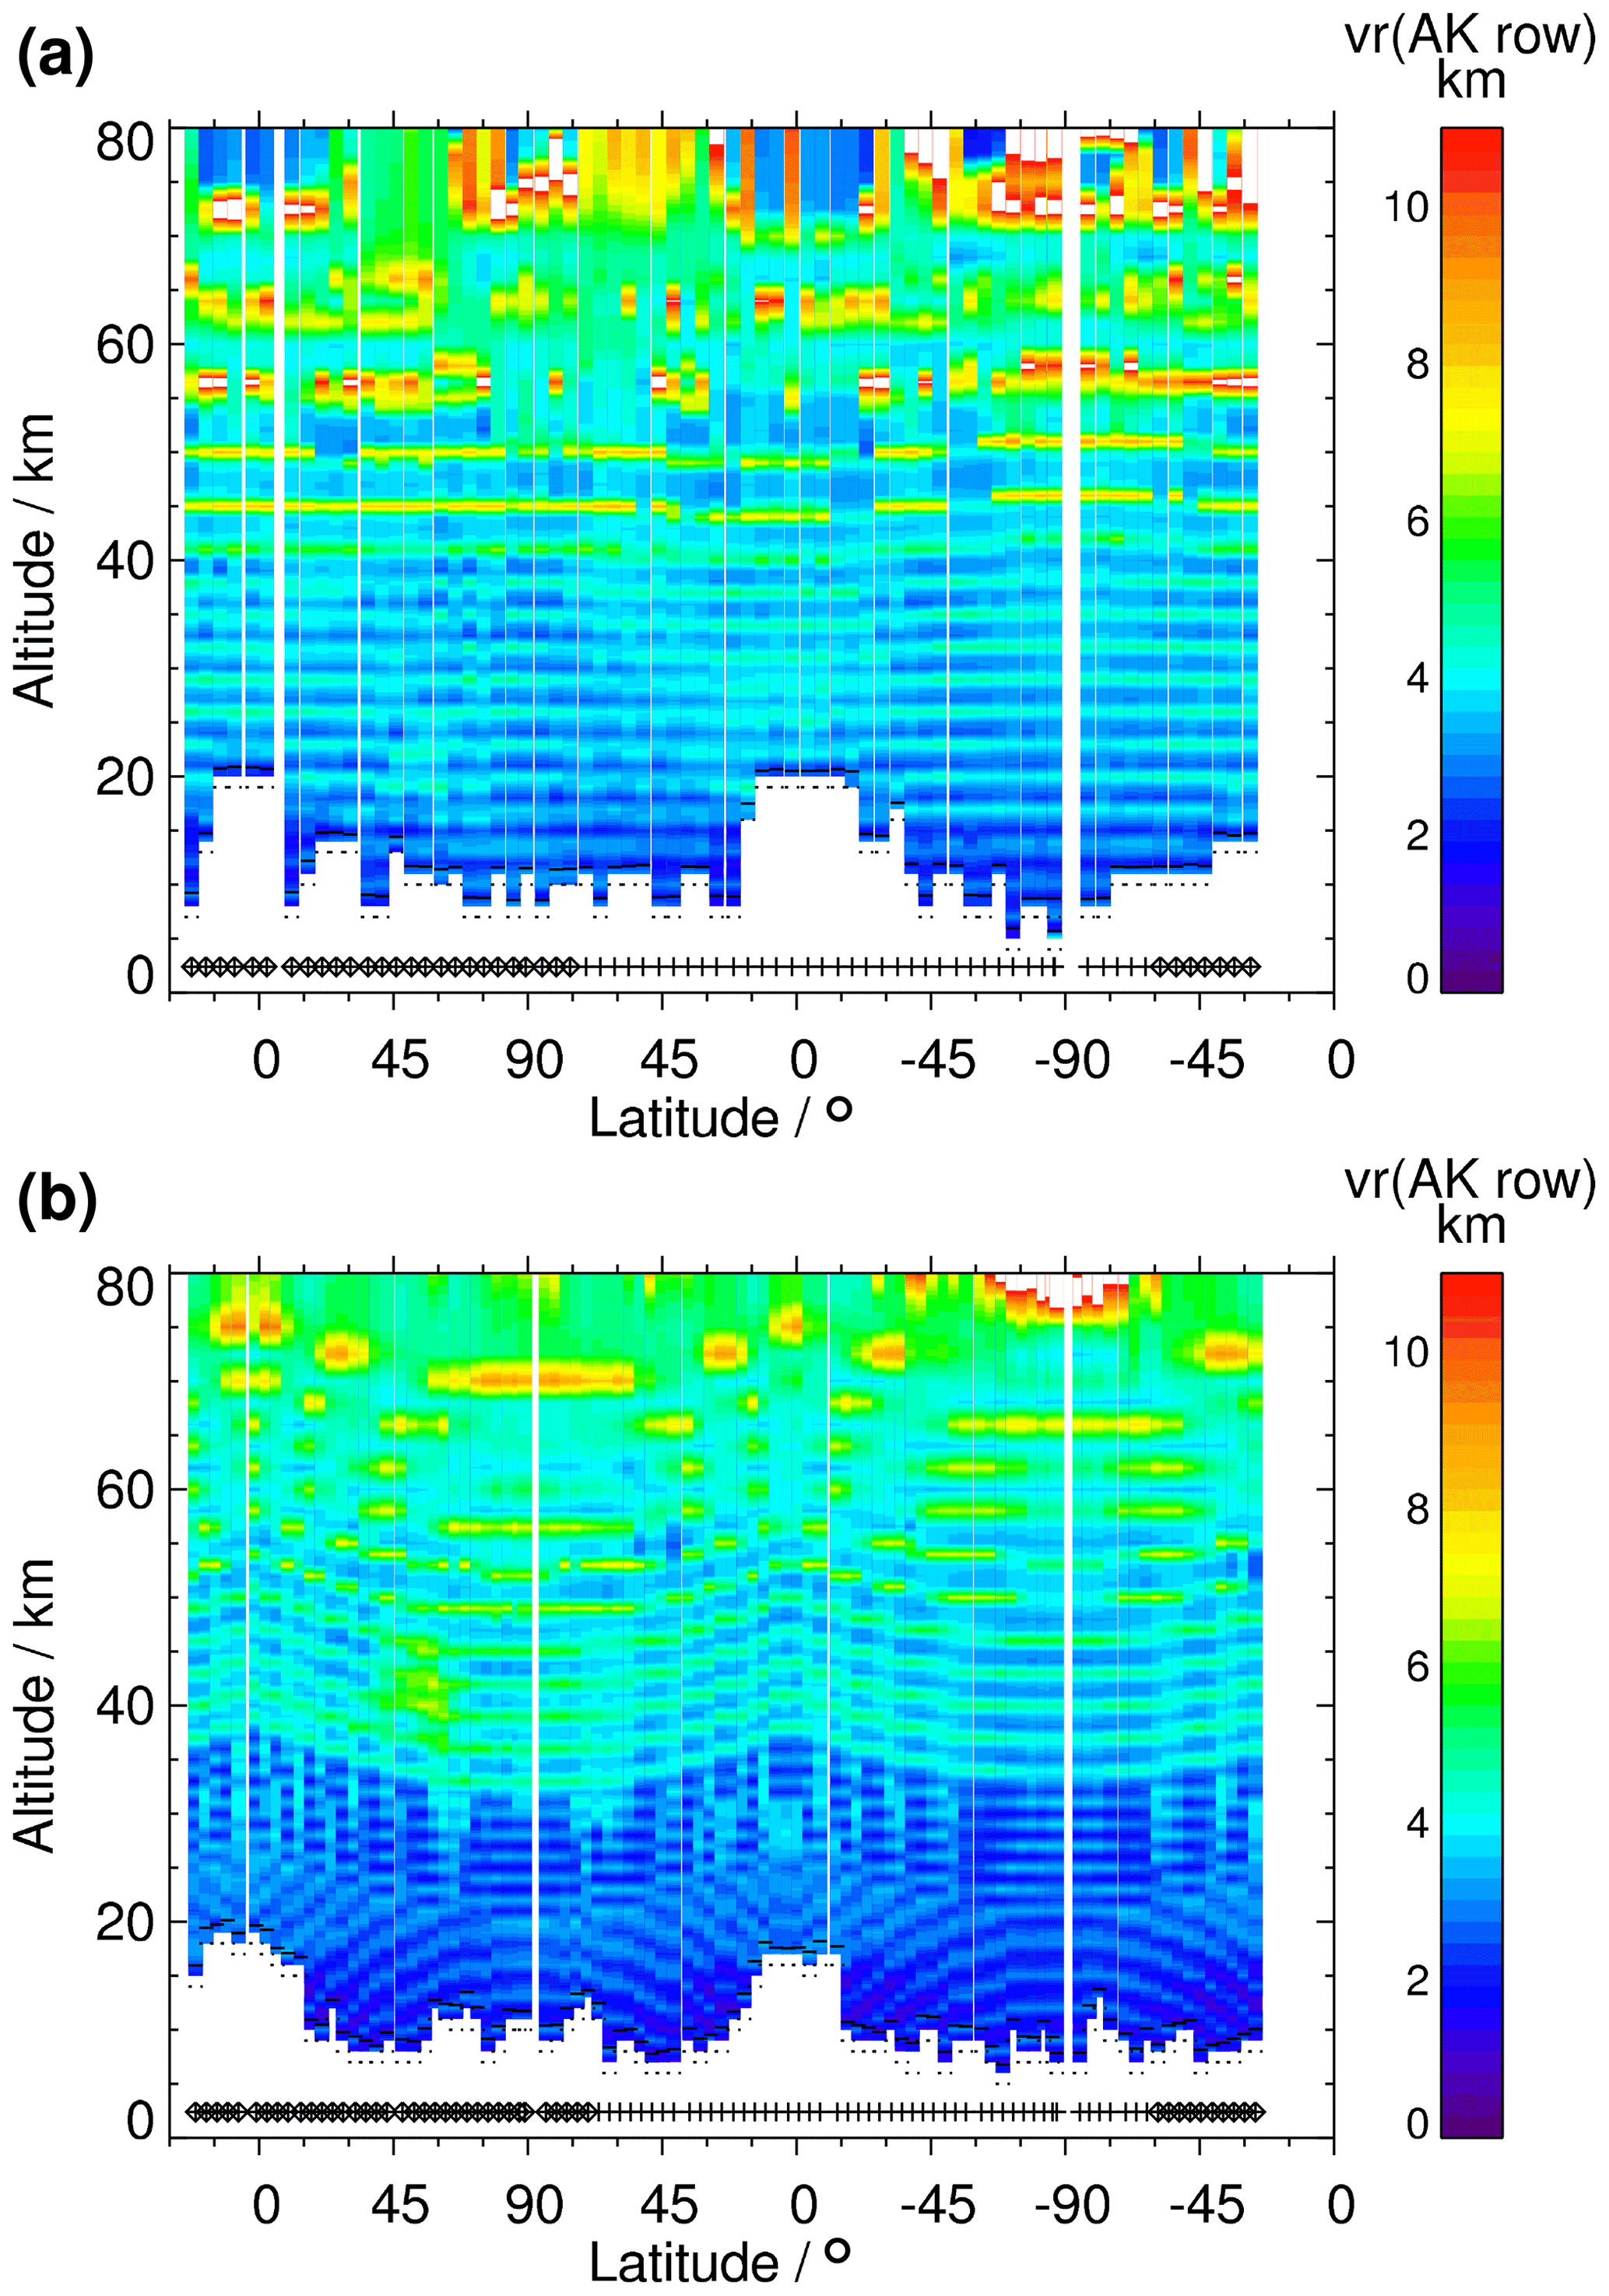
Figure 4Vertical resolution calculated from the rows of the averaging kernel matrix for ozone profiles recorded during the FR (a) and RR (b) measurement period. Data for orbits 4577 (a) and 35800 (b) are shown. The symbols just above the latitude axis indicate the position of the measurement and give the illumination conditions (diamond: night; plus: day).
The vertical resolution for FR measurements starts at values of 2.5 km at the lowest altitudes and increases almost linearly to 6 km at a 70 km altitude. RR measurements show values of 2 km at the lowest altitudes, which increase to 3 km at 20 km and stay constant up to 27 km. The vertical resolution increases linearly from 27 to 37 km up to a value of 4.2 km and stays constant further up to 50 km. Above, an increase to 5.5 km at 70 km is featured. However, it has to be noted that there is a latitude dependence of the RR scan grid (see Fig. 4b) which shifts these values in altitude. The region of reduced vertical resolution discernible at around 40 km and 60∘ N in Fig. 4b is caused by the very low temperatures (less than 200 K) which reduce atmospheric signal in the corresponding IR spectra.
The weakened regularization (see Sect. 4.3) leads to an improvement of the vertical resolution. However, the impact on FR and RR data is different: for the FR ozone profiles the gain in vertical resolution is greater than 5 % below 20 km, greater than 3 % at 20–40 km, and below 1 % above 45 km. RR vertical resolution shows an improvement of 5 %–6 % between 20 and 45 km, 3 % or more at 10–20 km, and 1 %–2 % above 50 km.
The actual values of the vertical resolution of MIPAS O3 are provided for each limb scan along with the result data set.
6.2 Horizontal averaging kernels and resolution
The horizontal resolution and information displacement were analysed using the method of von Clarmann et al. (2009a). This method exploits the information contained in the two-dimensional averaging kernels. The relevant dimensions are altitude and the horizontal along-line-of-sight dimension. The horizontal smearing rhor,z at altitude z is calculated as
where dz is the information displacement (see below) at altitude z, and hz;l is the element of the horizontal information matrix at altitude z that characterizes the horizontal grid point l. The latter is derived from the two-dimensional averaging kernel matrix by vertical integration of the absolute values of its entries. For horizontal averaging kernels resembling a Gaussian function, this measure of the horizontal smearing is equivalent to the full width at half maximum, but it is by far more robust in the case of horizontal averaging kernels with two pronounced maxima. We report this quantity as “horizontal smearing”, not as “horizontal resolution”, because in cases of horizontal undersampling, where the horizontal smearing is smaller than the distance between two subsequent limb scans, the horizontal resolution is limited by the sampling, not by the horizontal information smearing. The horizontal information distribution has been analysed for a limb scan at 47.9∘ S, 39.8∘ W, and 22∘ solar elevation, recorded during Envisat orbit 6075 on 29 April 2003 for FR measurements, and a limb scan at 57.1∘ S, 176.1∘ W, and −32.5∘ solar elevation, recorded during Envisat orbit 39483 on 18 September 2009 for RR measurements.
For the FR measurements, the horizontal resolution is essentially sampling-limited. At 45 km and above 55 km altitude the horizontal smearing occasionally slightly exceeds the horizontal sampling of MIPAS, i.e. the ground-track distance of two subsequent limb scans, which is about 500 km. However, at most altitudes, the horizontal smearing is even considerably narrower (third column of Table 3). Also for the RR nominal measurement mode, the horizontal resolution is sampling-limited or of the same order of magnitude as the horizontal sampling of about 410 km for most altitudes. In our example only at 40, 66, and 70 km did the RR smearing slightly exceed the sampling (fifth column of Table 3).
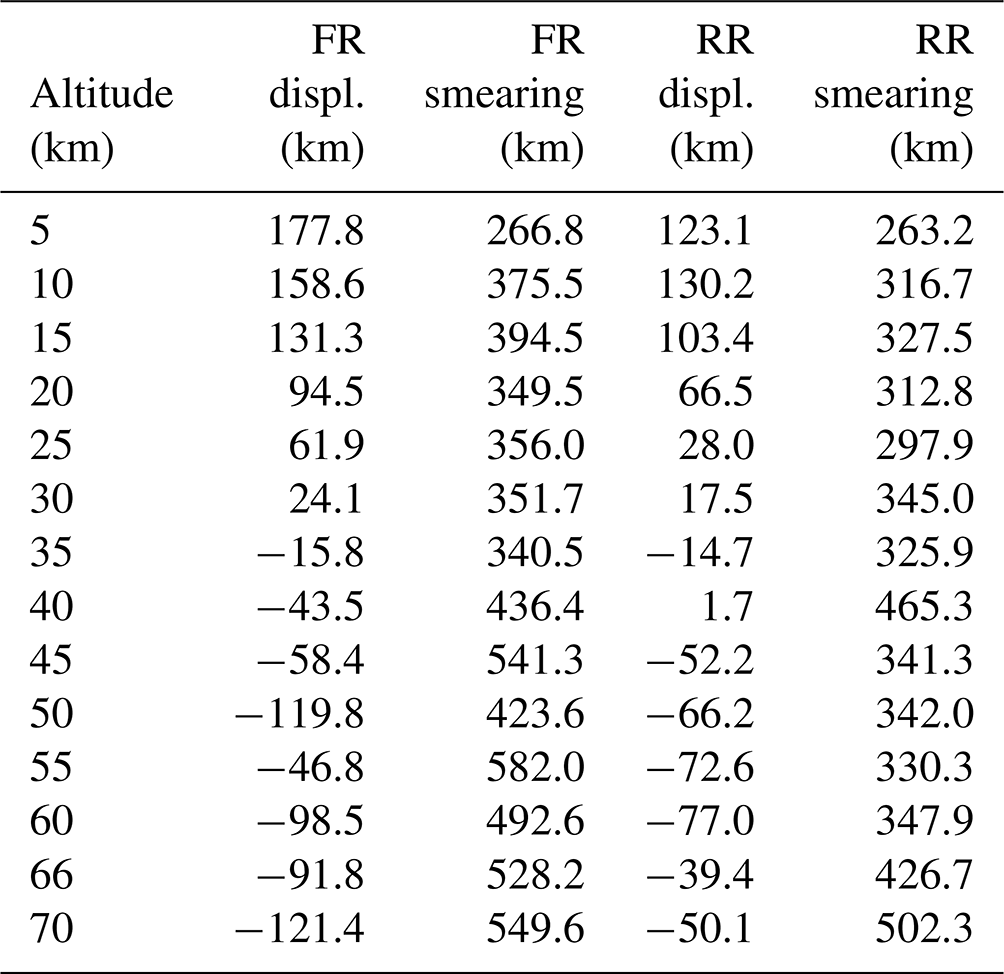
The information displacement is the horizontal distance between the nominal geolocation of the measurement and the point where most information comes from. The latter is calculated as the averaging-kernel-weighted mean horizontal coordinate. Our sign convention is such that displacements towards the satellite are associated with positive displacements. For both the FR and the RR measurements, the information displacement is considerably smaller than the horizontal sampling at all altitudes (second and fourth column of Table 3, respectively). Thus, we see no risk that the data are misinterpreted in terms of the geolocation they refer to. For FR and RR measurements, the information displacement is, broadly speaking, positive for altitudes below 35 km and negative above.
6.3 Ozone differences with respect to previous data versions
A comparison of daily means of ozone version 8 versus version 5 results for 20 February 2009 is shown in Fig. 5. The most pronounced differences are seen over the North Pole. While MIPAS retrievals are fairly independent of a priori information within the altitude range covered by observations, they do depend on assumptions on the atmospheric state above the uppermost tangent altitude. In version 5 the temperature retrieval depended on climatological upper-stratospheric and upper-mesospheric temperature that did not represent the actual elevated stratopause on that day. The resulting version 5 temperature errors propagated on the ozone data product. In contrast, version 8 ozone relies on a temperature retrieval that used a priori data for the actual day (see Sect. 4.1) and is thus more adequate at altitudes where the measurement does not resolve the vertical temperature distribution. At an altitude of 55 km, resulting ozone differences reach 1 ppmv.
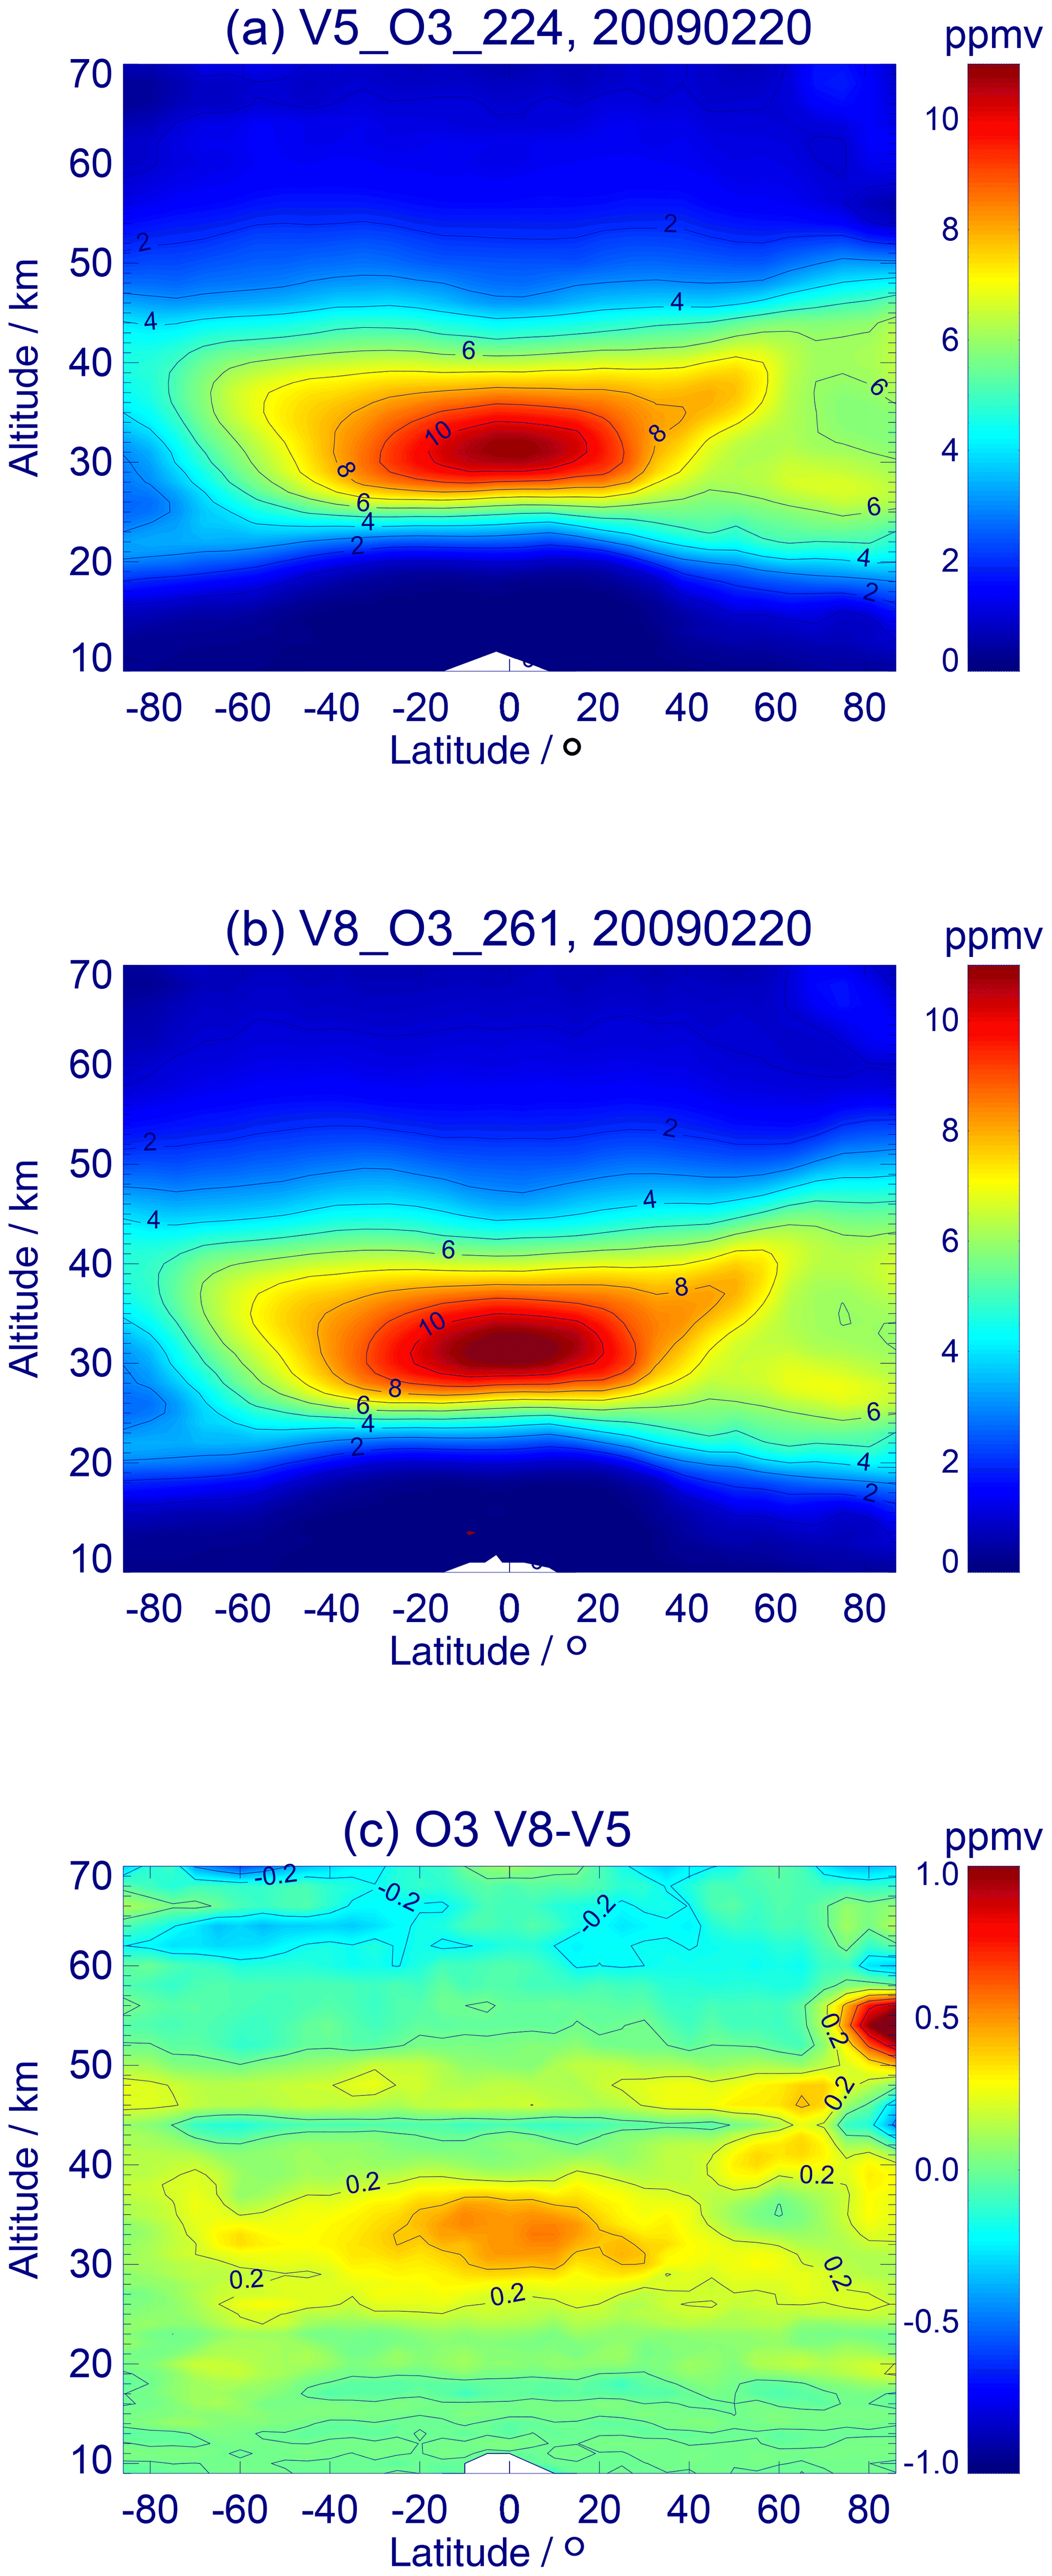
Figure 5Global ozone distributions on 20 February 2009, MIPAS version V5_O3_224 (a) and version V8_O3_261 (b). Panel (c) shows the differences.
6.3.1 Consistency between full-resolution and reduced-resolution results
To assess the consistency of the results between the two measurement periods, the difference between RR and FR monthly mean data was calculated for data versions 5 and 8 in 10∘ latitude bins. The monthly means are based on all available data. For example, September means for the second measurement period data of each September in 2005–2012 were used. Figure 6 shows the respective differences (RR minus FR) for version 5 data (top panel) and version 8 data (bottom panel) for September. In the altitude range of 0–70 km the structure of the differences is roughly the same. However, version 8 differences between reduced- and full-resolution data seem to be more positive compared to the version 5 differences. Above 70 km the patterns differ considerably, with the negative values in version 5 indicating that at these altitudes there is a conspicuous inconsistency between reduced- and full-resolution results, which has disappeared in version 8.

Figure 6Differences between the means of all September data for RR and FR data. Panel (a) shows difference V5R_O3_224 minus V5H_O3_21, panel (b) V8R_O3_261 minus V8H_O3_61. See text for details.
As a measure for the degree of consistency we use altitude–latitude means over the difference per month and the corresponding standard deviation. All available latitudes and three different sets of altitude ranges are used. The respective data are shown in Fig. 7 for all months and the different altitude ranges. In the altitude range of 20–50 km version 5 and version 8 data show essentially the same course of mean values, apart from a roughly constant bias. However, the majority of mean values of version 8 differences data are closer to zero than in the corresponding version 5 data, which show purely negative values. This could be interpreted as both a reduced step in ozone values between the full- and reduced-resolution periods and a reduced (negative) drift in the data. The latter interpretation is supported by Eckert et al. (2014), who state for version 7 data that “Drifts at 2-sigma significance level were mainly negative for ozone relative to Aura MLS and Odin OSIRIS and negative or near zero for most of the comparisons to lidar measurements”. While there are some changes between the non-linearity correction for version 7 and version 8 data, the general impact with respect to data drift should be rather similar in both versions. In the altitude range of 0–70 km (essentially the entire measurement range of MIPAS nominal mode measurements) the version 5 data still exhibit purely negative values. Finally, mean values for the altitude range of 0–80 km are more negative again for version 5 data compared to the 0–70 km range, indicating that above 70 km the differences between reduced- and full-resolution values become strongly negative. This latter behaviour might well be attributed to the improved temperature retrieval (see Sect. 3.4 of Kiefer et al., 2021). The overall picture, namely that the version 8 curves are closer together compared to the version 5 curves, together with the fact that the version 8 curves are closer to zero than the corresponding version 5 curves, shows that the consistency between RR and FR data is better for version 8 data. Since there is no hard proof, the final judgement has to be left to the ozone data validation. However, the curves of the means indicate a behaviour that is consistent with what is expected as the impact of several measures and improvements, and we value this as a hint that there is not only an improvement in general but also that there are two known reasons for this, namely the improved upper-atmosphere version 8 temperature data and the improved non-linearity correction.
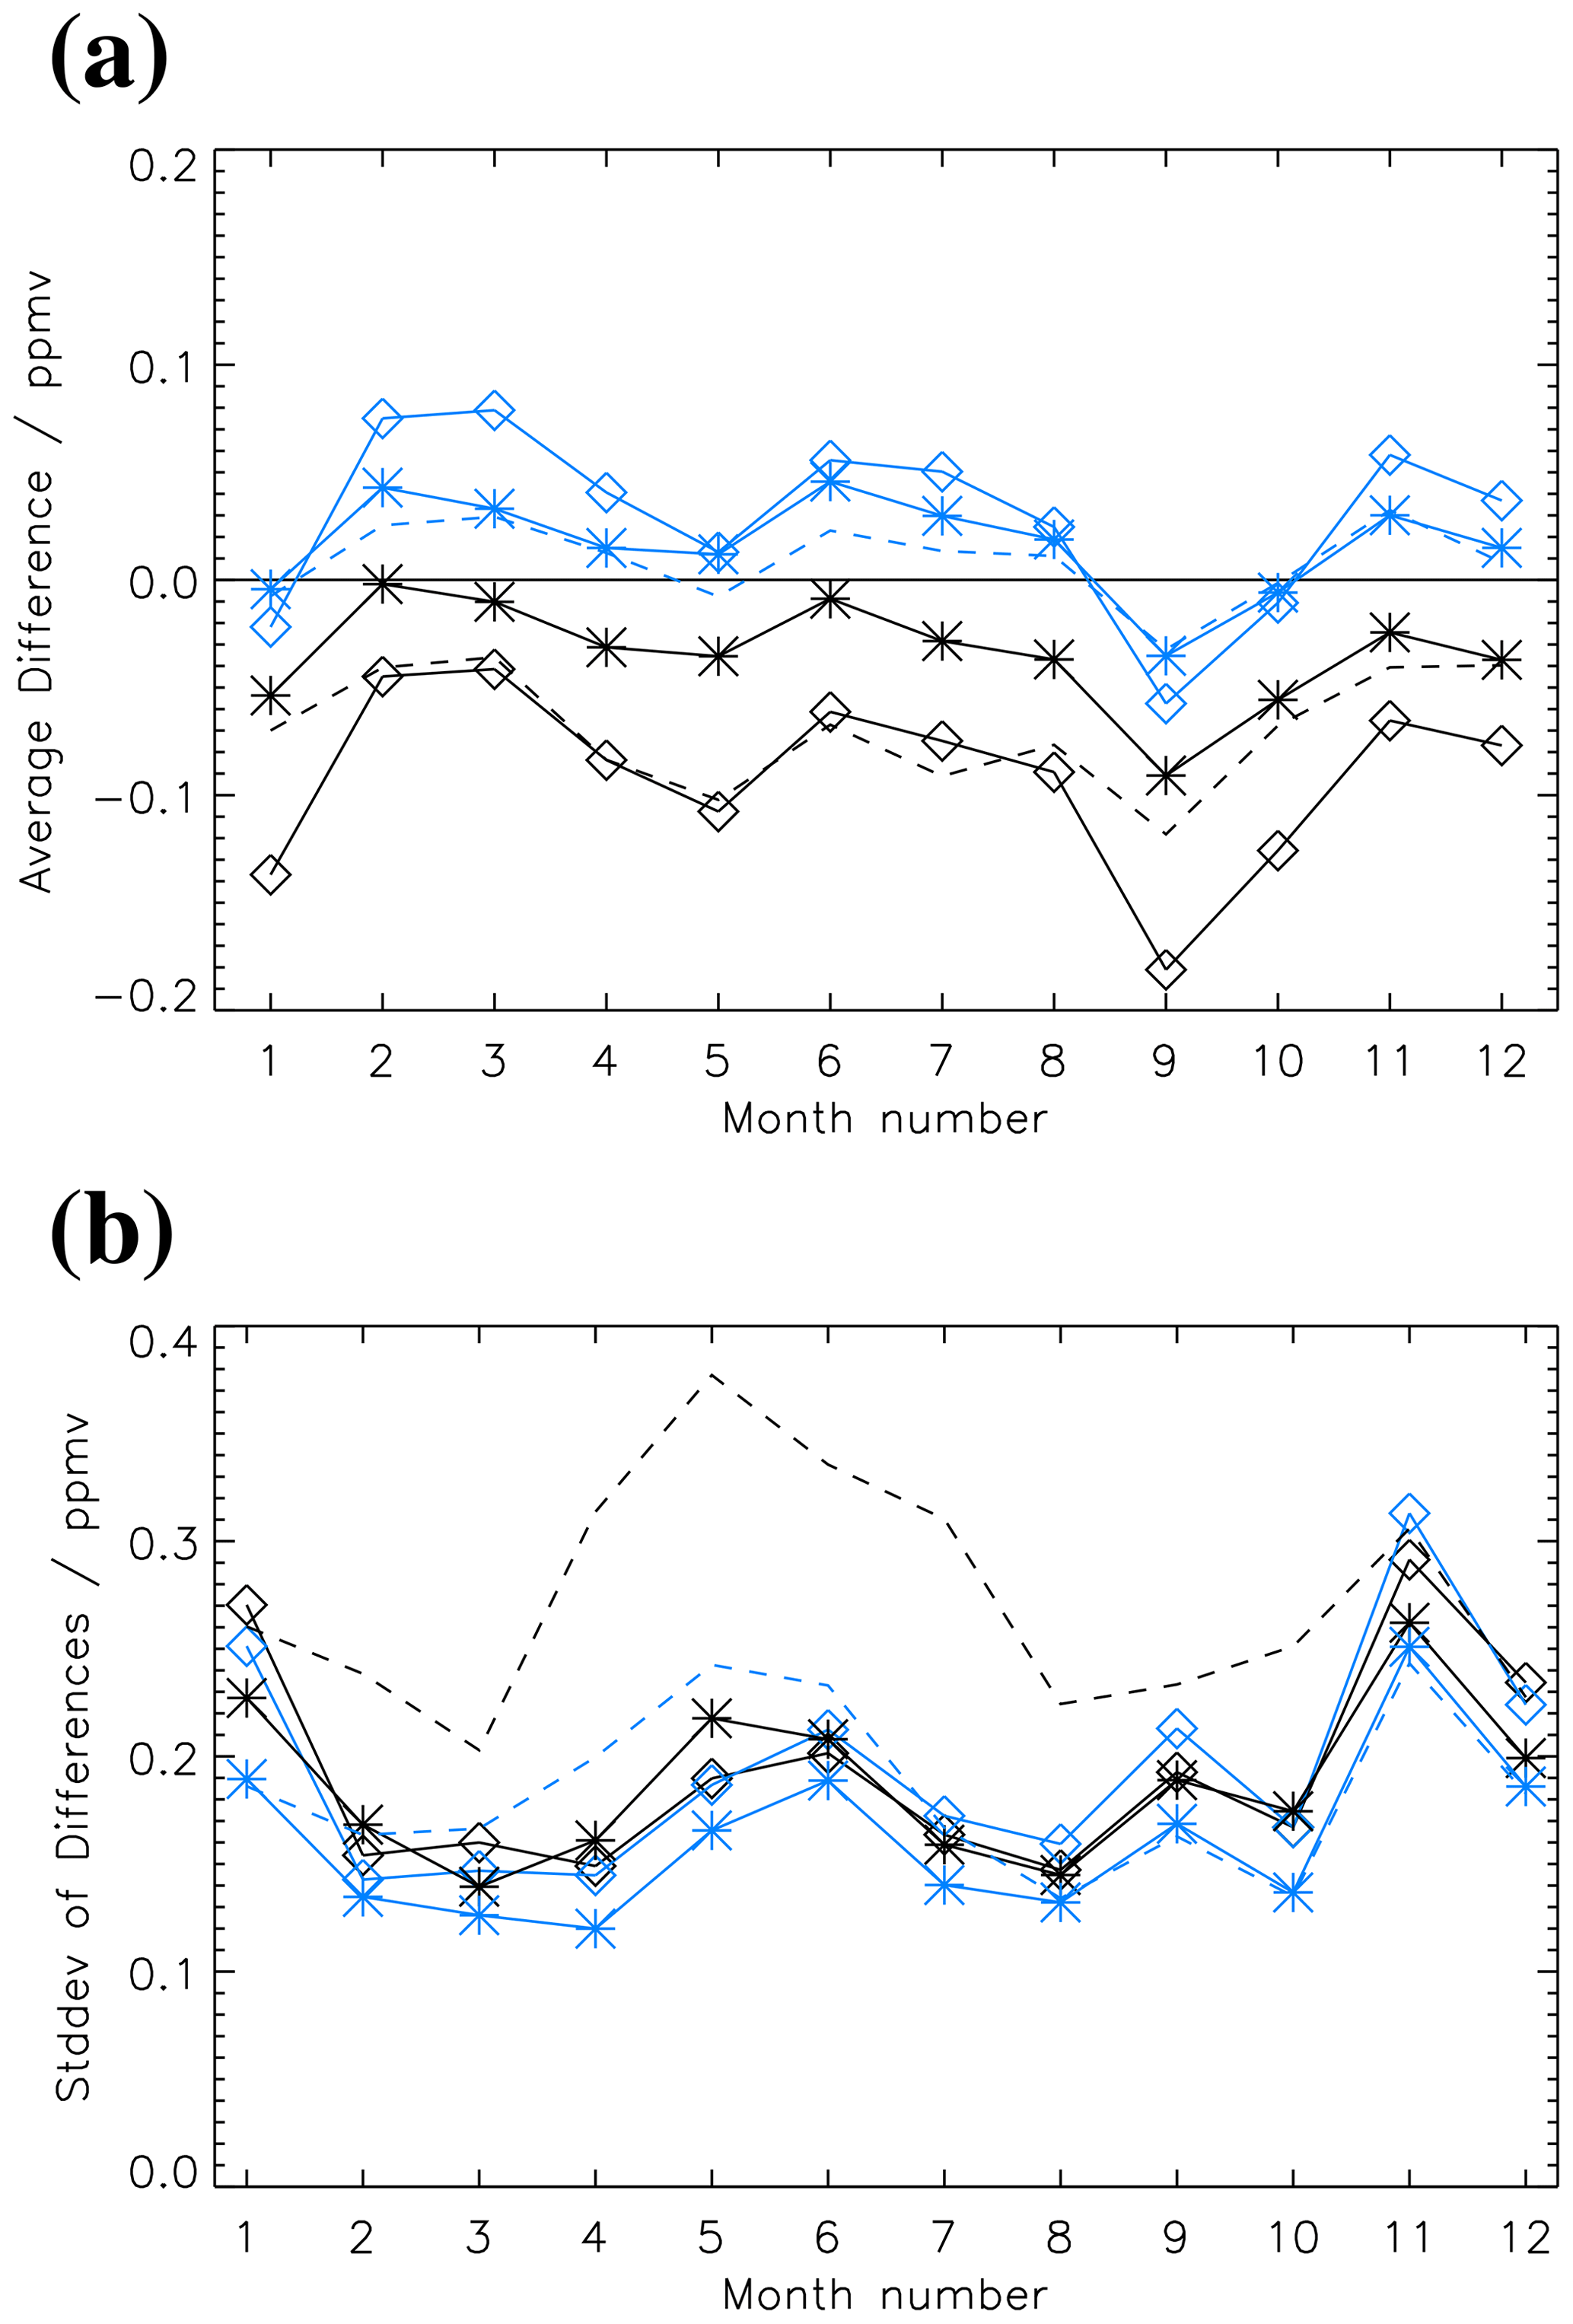
Figure 7(a) Monthly mean differences between RR and FR ozone data. (b) Standard deviation of these differences. Differences and standard deviations are averaged over all latitudes and over altitude ranges of 20–50 km (solid lines with diamonds), 0–70 km (solid lines with asterisk), and 0–80 km (broken lines). Version 5 data are shown with black and version 8 data with blue curves. See text for more details.
The standard deviations presented in the lower panel of Fig. 7 show that in the 20–50 km altitude range (diamonds) there is virtually no difference between version 5 and version 8. For 0–70 km the version 8 data (asterisk) for all months exhibit slightly smaller values than version 5. For the 0–80 km range (broken lines) there are considerable differences, with standard deviations of version 8 differences being quite consistent with those of the other altitude ranges, which does not hold for version 5 data. Again, this can be understood as an impact of the more realistic temperature at higher altitudes.
6.3.2 Temporal behaviour
Two aspects of the changes in temporal behaviour between MIPAS ozone data of versions 5 and 8 are in what follows: the first is the step in ozone volume mixing ratio, which shows up in time series between FR and RR data, and the second is the drift with respect to data from satellites, lidar, and ozonesondes, which has been analysed by Eckert et al. (2014) and Laeng et al. (2018) for preceding ozone data versions. To assess these two quantities a suitable function is fitted to each time series at the retrieval altitudes and within a latitude bin of 10∘. This function consists of a sum of terms for average, linear trend, and yearly harmonics and sub-harmonics up to a period of 2 months. Additionally, a step between data before/after June 2004 is implemented (the exact separation date is not important, as long as it is between the FR and RR measurement periods). Two of the fit parameters are used to characterize the changes between version 5 and version 8 data: linear trend and step between FR and RR data. It has to be noted, however, that the fit parameter linear trend is not intended to give a reliable value of the ozone trend at the specific altitude and latitude band. If in the following we use the term linear trend we solely refer to our fit parameter. Ozone trends will be called (linear) ozone trends. We employ neither QBO terms, like Eckert et al. (2014) (see their Eq. 1), nor sophisticated statistics, since the only goal is to characterize the differences between version 5 and version 8. Detailed trend/drift analyses are beyond the scope of this work. Figure 8 illustrates the method for an altitude of 30 km and at the latitude bin 40–50∘ S.
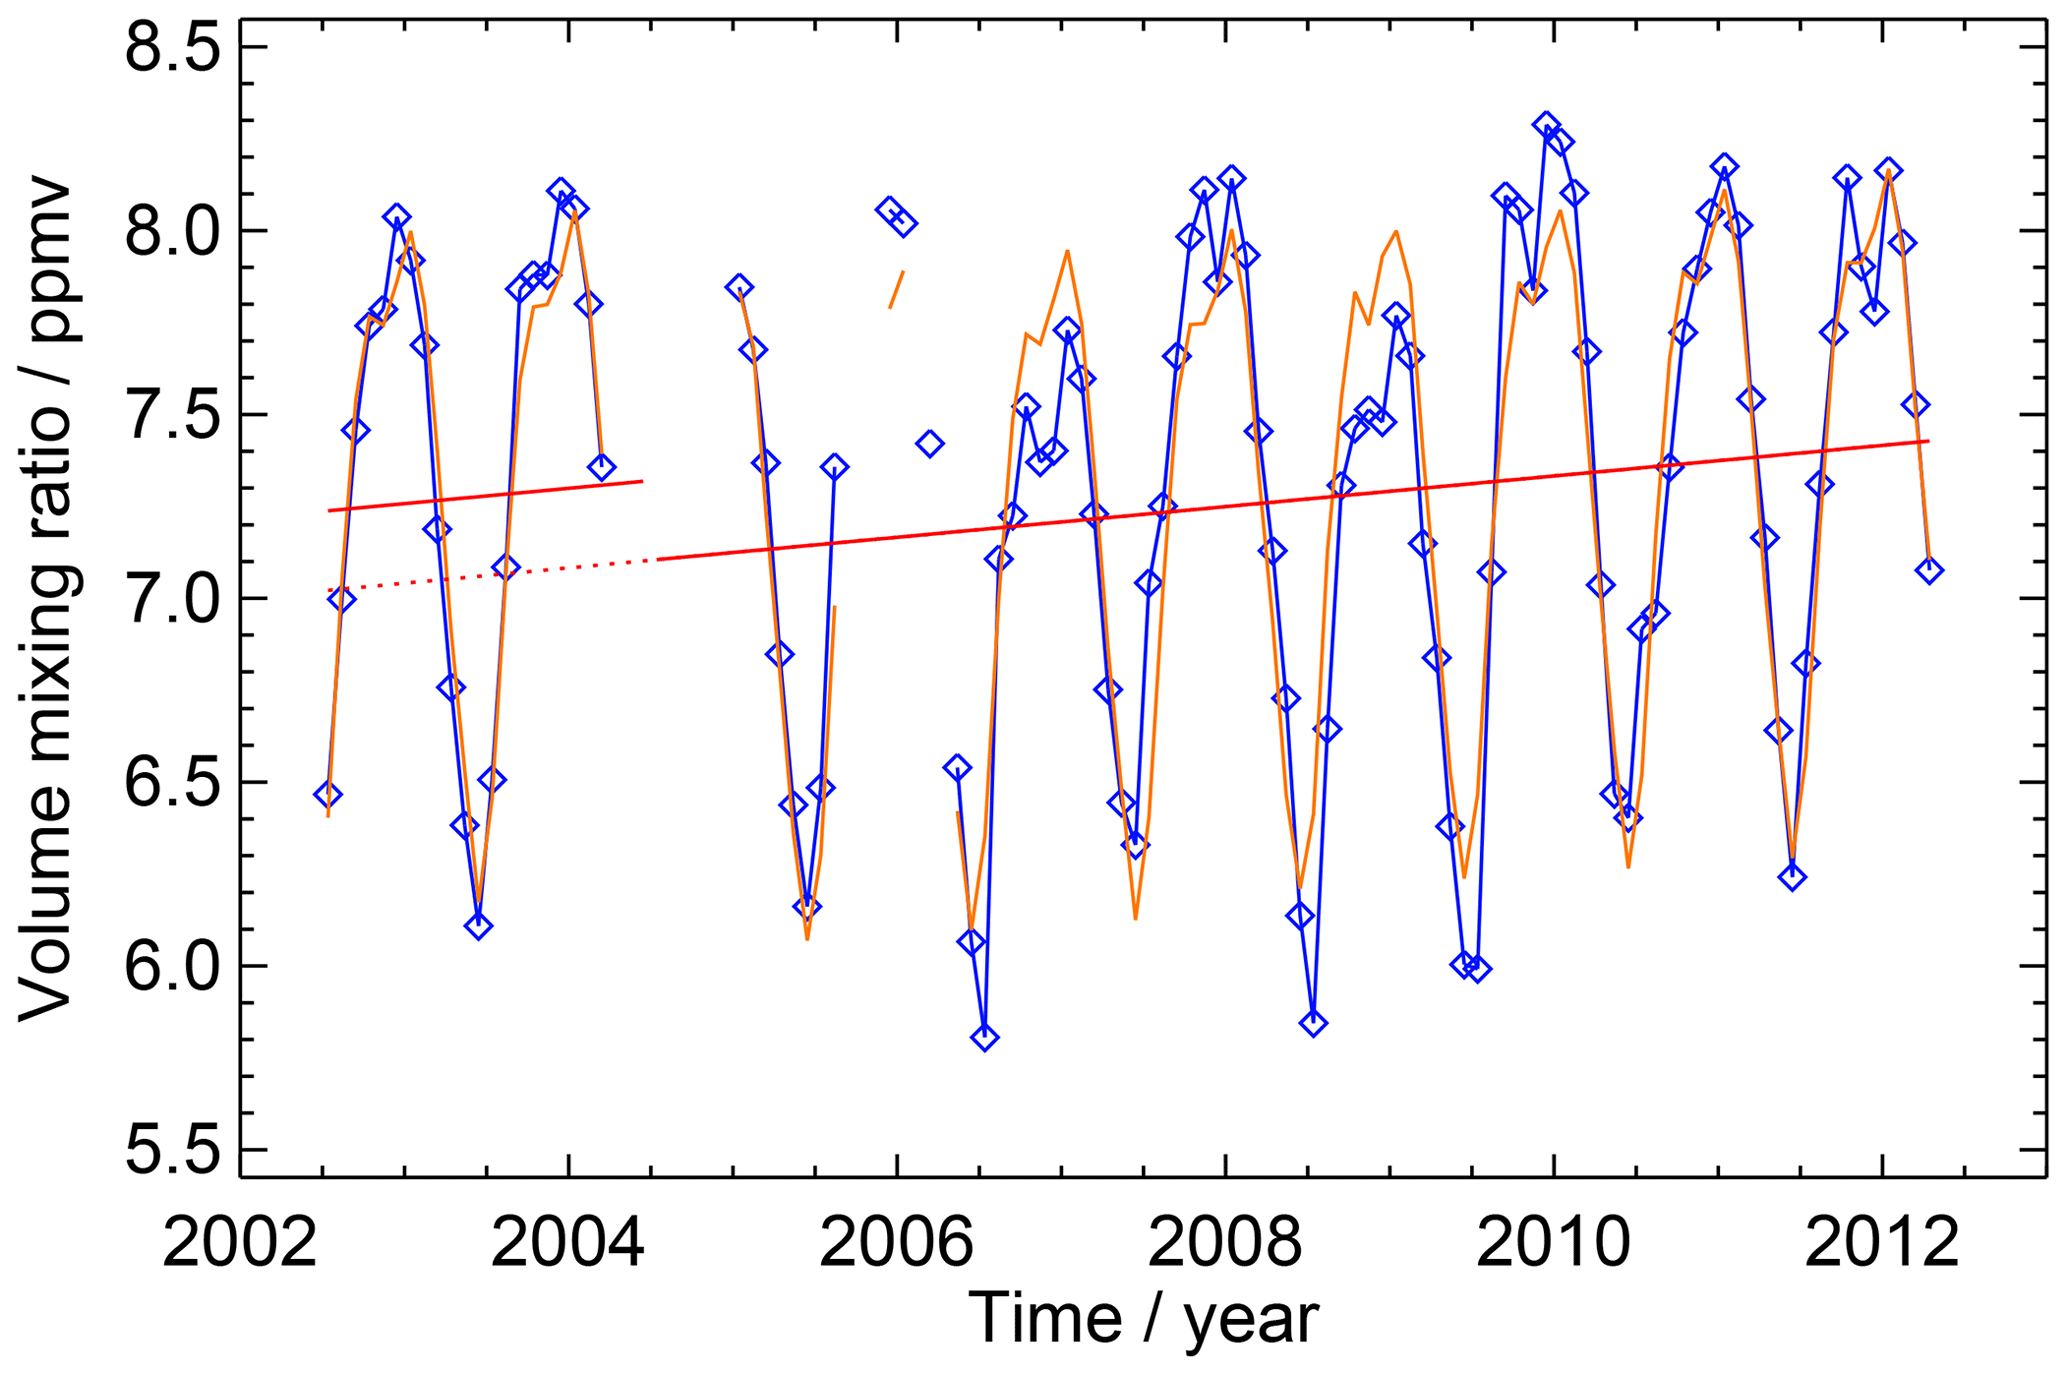
Figure 8Fit of linear trend, yearly harmonics up to a 2-month period, and step (arbitrarily assumed to occur in July 2004) to an ozone monthly means time series. Version 8 monthly means at 30 km and in a latitude range of 40–50∘ S are blue with symbols, while the fit is orange. Linear trend lines are solid red; the trend for the second period is extended into the first period as a red dotted line to better illustrate the step between FR and RR measurement periods. In this example the fitted linear trend is 0.42 ppmv per decade, and the fitted step is −0.22 ppmv.
Table 4Mean values of the fit parameter step between FR and RR measurements and of the fit parameter linear trend (see text for details). The step in vmr is given in parts per million by volume (ppmv), the linear trend values in ppmv per year, and the decadal drift (linear trend in version 8 minus linear trend in version 5) in ppmv per decade. Values for the decadal drift MIPAS version 5 minus MLS (v2.2 data) are calculated from the data which were used for Fig. 4 of Eckert et al. (2014) and which rely on more sophisticated methods for trend estimation than used in this work. Errors are standard errors of the mean.

We selected the altitude range of 35–45 km, where MIPAS version 5 ozone shows, on average, a clear negative drift compared to both Aura MLS and OSIRIS (cf. Figs. 4 and 6 of Eckert et al., 2014). This gives us 11 × 18 (altitude steps times latitude bins) time series and hence 191 values for each fitted parameter of the function. A second calculation was carried out for altitudes between 20 and 50 km to get an impression of how robust the results are if essentially all of the stratospheric data enter the procedure. From this procedure 558 single time series, and hence values per parameter, result. Mean values and standard errors of the mean are calculated from these two altitude ranges for the two parameters characterizing the vmr step and the linear trend. The results are shown in Table 4. Clearly there is a significant reduction in the magnitude of the step in vmr between the two measurement periods for both altitude ranges. The decadal drift, i.e. the difference between the respective linear trends of version 8 and version 5 data in the altitude range of 35–45 km, is estimated to 0.1347 ± 0.0150 ppmv per decade. This average drift can be compared with e.g. the average drift value for MIPAS minus MLS version 2.2 of −0.1626 ± 0.0048 ppmv per decade calculated from the data used as a basis for Fig. 4 of Eckert et al. (2014). However, it has to be considered that the latter data rely on more sophisticated methods for trend estimation than used in this work. Still, we think that comparing differences of only linear ozone trends with differences of our fitted linear trends is justified. There still is a discrepancy (note that the sign of either has to be reversed for direct comparison), but it is reduced by a large amount; roughly 80 % of the initial drift between MIPAS and MLS would disappear changing from version 5 to version 8 retrieval results. In the altitude range of 20–50 km the agreement between the decadal drifts calculated from the Eckert et al. (2014) data and our data is virtually perfect; i.e. 100 % of the initial drift between MIPAS and MLS would disappear. Actually, these results appear to be too good and not quite consistent with the data shown in Fig. 6 of Kiefer et al. (2021), where a conspicuous residual drift of the version 8 temperature data compared to microwave sounders seems to still remain. One caveat, which might contribute to explaining the good ozone drift reduction (with respect to MLS v.2.2), is that we use full monthly mean data, while Eckert et al. (2014) work with collocated data. Still, we see our results, based on preliminary estimations as presented above, as a strong indication that substantial progress with respect to the drift problems found in version 5 data has been achieved. However, a thorough quantification of the ozone drift of MIPAS version 8 ozone data still has to be performed.
The ill-posedness of the inverse problem on the fine grid (see Sect. 4.2) requires regularization as described in Sect. 4.3. As a consequence, the averaging kernels deviate from unity. The averaging kernels, which characterize the content of a priori information in the retrieval, depend on the atmospheric state and thus vary with time. For some applications, particularly the analysis of time series, the resulting time dependence of the vertical resolution poses non-trivial problems to the data user. Trend analysis (e.g. Yoon et al., 2013) and the analysis of annual cycles (e.g. Hegglin et al., 2013) belong to this category. Due to these problems, and since every statistics toolbox offers solutions to deal with varying errors, it appears desirable to offer an alternative representation of the data which is user-friendly in a sense that the data user does not need to care about averaging kernels.
To that regard, our new data product includes both O3 profiles retrieved with the original retrieval scheme, where the numerical constraint causes, via regularization, some content of a priori information in the product, and an alternative data set which is free of formal prior information (von Clarmann et al., 2015). The latter product is not meant to replace the regular product but is provided in parallel to offer the data user the choice between otherwise identical products. This additional data set is henceforth called the “maximum-likelihood product” (ML product) even though this terminology is not fully appropriate because, depending on the constraint chosen, the product obtained with the regularized retrieval can also still have the epistemological nature of a maximum-likelihood estimate, unless the regularization complies with the maximum a posteriori estimation scheme in a strong sense; i.e. a probability distribution can be assigned to the a priori distribution. In order to avoid unnecessary complication and to stay intuitive, we still use this simplified terminology.
Figure 9 shows results from Envisat orbit 36319 on 20 February 2009 from the retrieval on the fine grid, where the non-unity averaging kernel has to be considered (upper panel), and the coarse grid, the so-called maximum-likelihood representation, where the altitude resolution is entirely defined by the vertical grid. For the convenience of modellers, a pressure grid has been chosen, whose grid points are commonly used in the modelling community, and thus avoids some unnecessary interpolation. The ozone data are provided as layer means and not as level values; i.e. the profile is transferred into a stepwise constant profile while abundances integrated over the respective altitude range are retained. In particular, for the analysis of time series, this representation is advantageous because there is no obvious, straightforward method to calculate meaningful time series of data of varying vertical resolution.
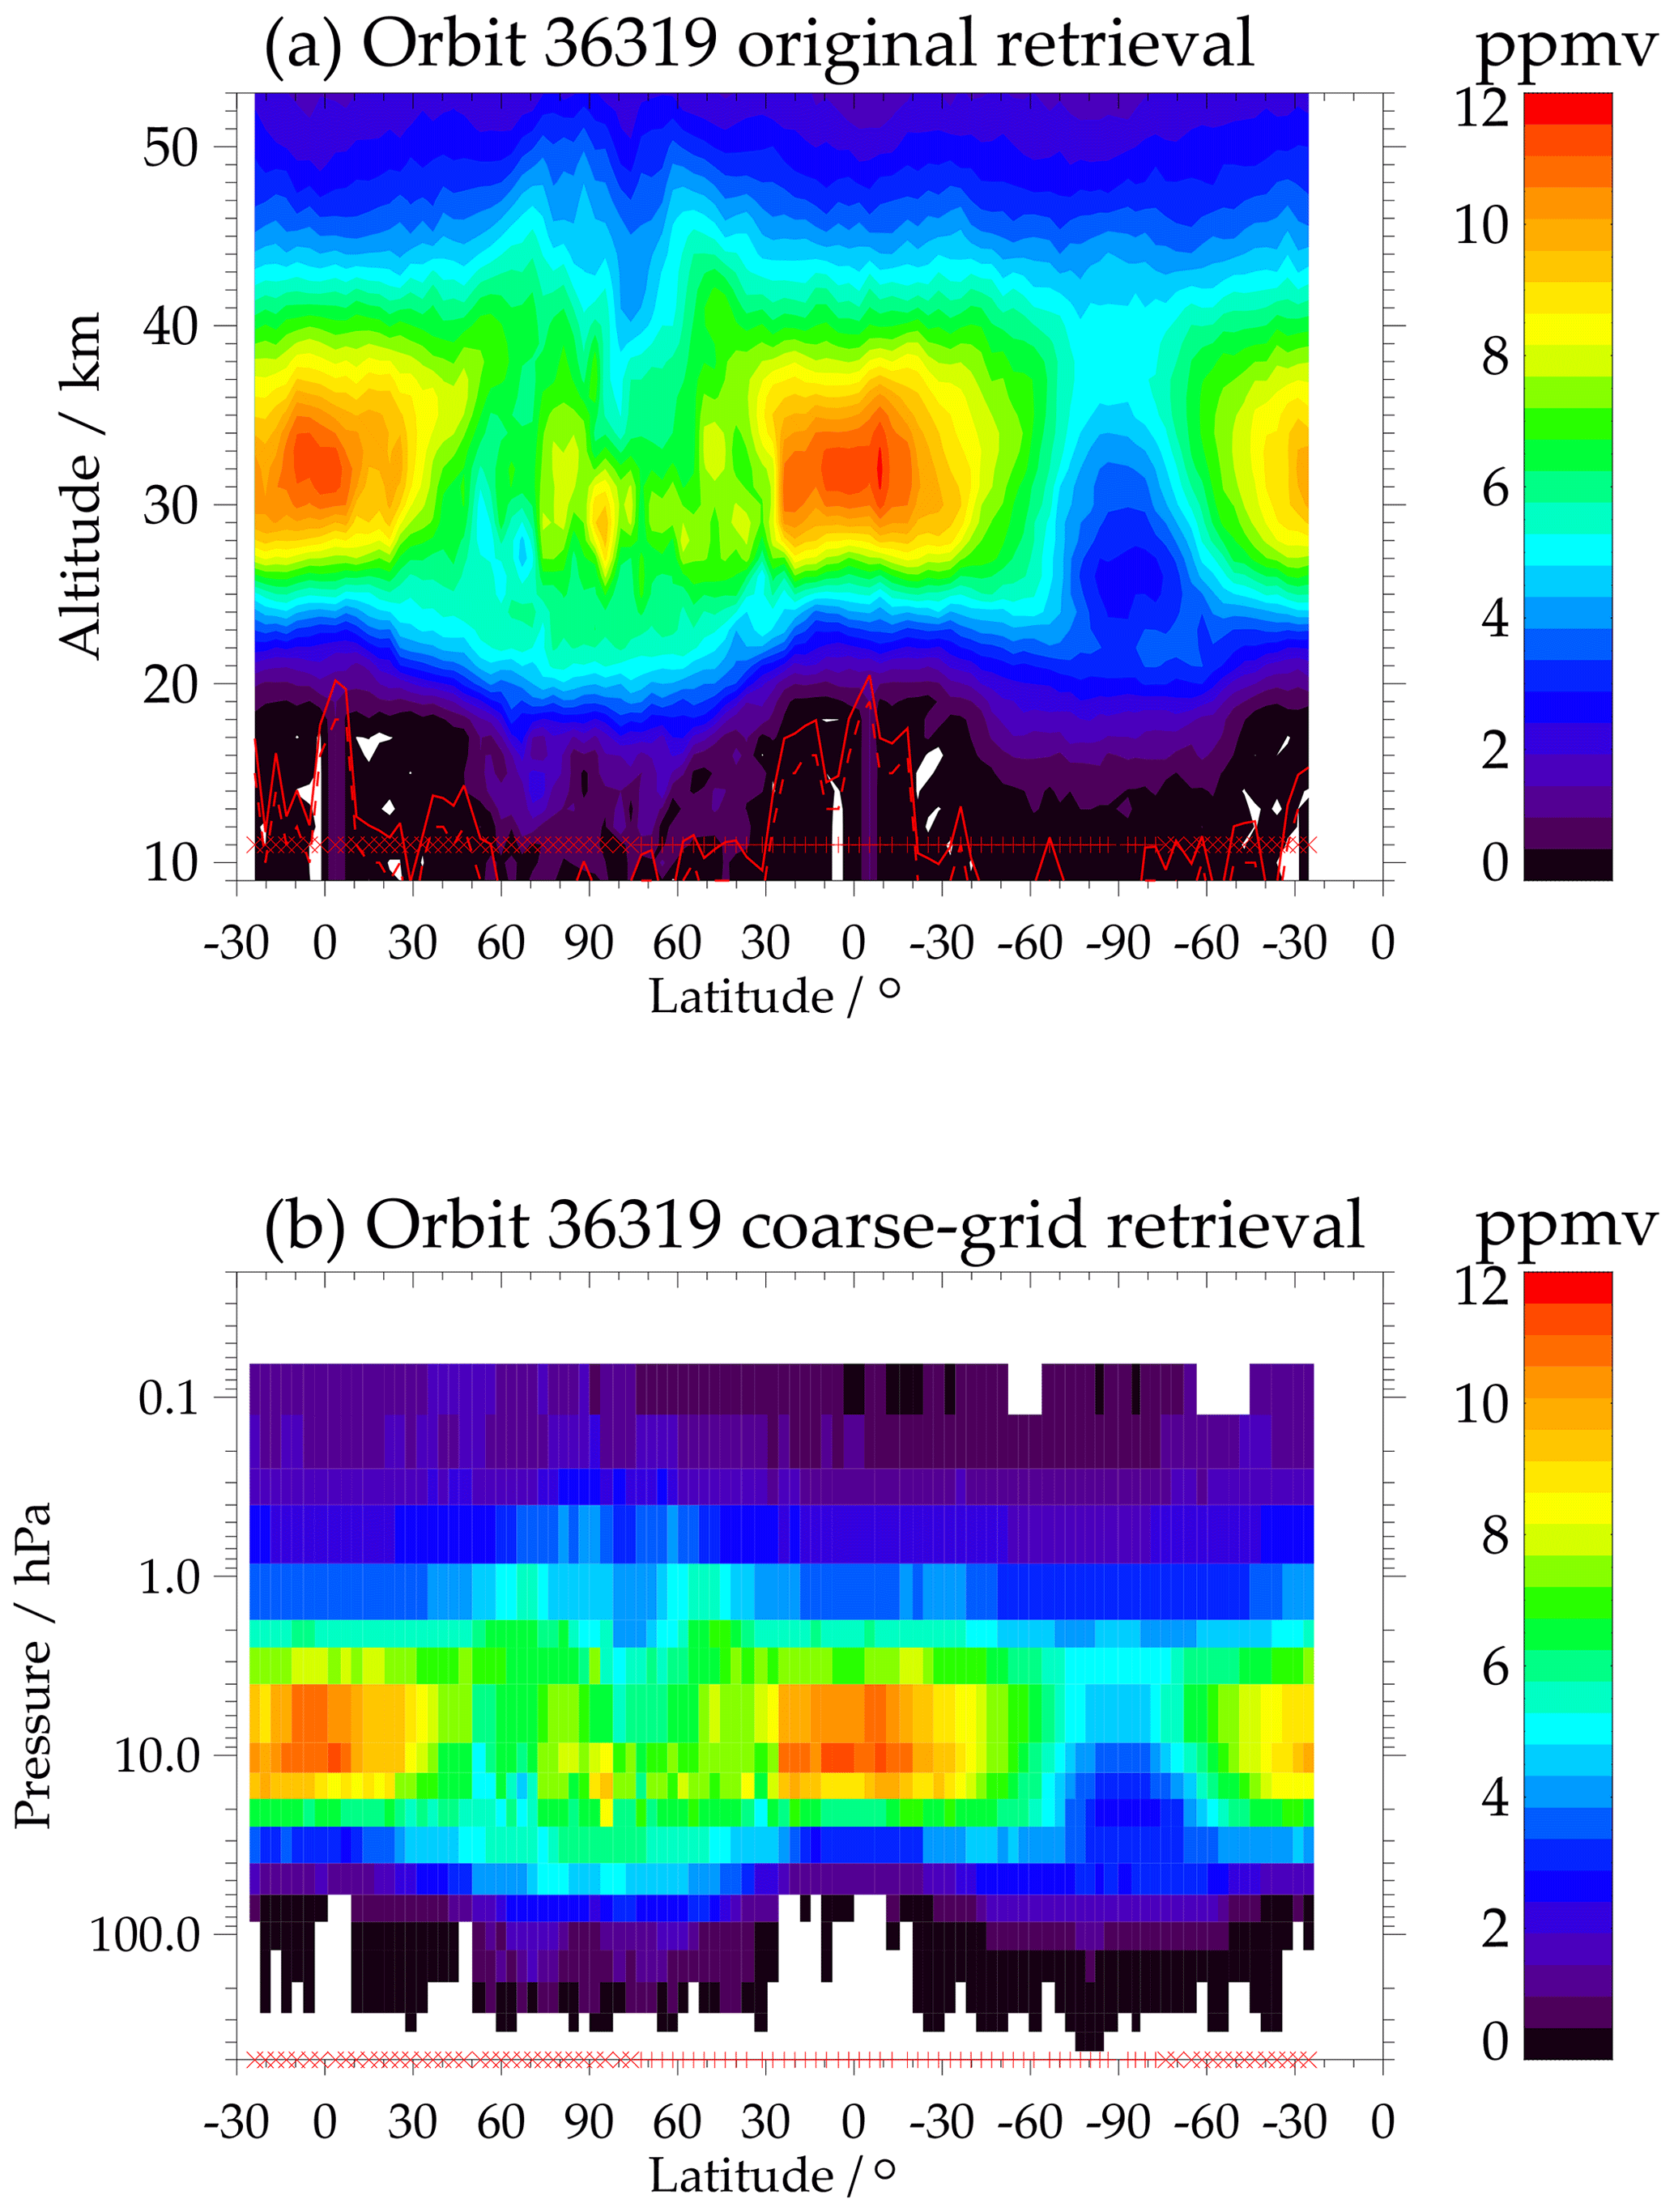
Figure 9Ozone distribution for orbit 36319 on 20 February 2009 in the standard representation on the fine retrieval grid, where the vertical resolution is state- and thus time-dependent (a) and on the coarse retrieval grid (b), where the vertical resolution is defined by the vertical grid.
MIPAS IMK–IAA ozone data presented in this work are based on the most recent version 8 level-1b spectra and were processed using a retrieval approach improved over previous versions with respect to the temperature distributions used for the retrieval, the microwindow selection, the altitude dependence of the regularization, the information on interfering species, the treatment of the radiance offset correction and background continuum, numerical issues, and the consideration of non-local thermodynamic equilibrium emission.
A TUNER-compliant uncertainty assessment is presented. In the altitude range of 20–50 km the total error is below 10 %. Spectroscopic errors of ozone and carbon dioxide (propagated via the use of previously calculated T and LOS results) are the dominant components of the error budget. Errors from uncertainties of instrumental line shape function, gain calibration, and spectral noise also show significant contributions, while the error due to interfering gases is almost negligible. For most of the cases the random error ranges between 2 % and 5 % in the altitude range of 20–50 km, while the systematic error dominates the total error and is of the order of 6 % to less than 10 %.
The improved consistency of ozone data between the FR and RR measurement periods is demonstrated. A preliminary analysis of the drift issue indicates that a significant reduction of the drift found in version 5 data has been achieved.
As an alternative to the standard data product, a coarse-grid representation of the data is introduced and will be made publicly available. In this additional data set, the altitude resolution is defined solely by the vertical grid and thus is constant in time and invariant with respect to the atmospheric state.
While some of the known problems of preceding data versions have been solved by improvements of the level-1b data and the retrieval strategy, the use of version 8 level-1b data seems to have counteracted our effort to reduce the slight positive bias in the upper stratosphere. Only recently has it become known to us that self-inconsistency between ozone bands has been corrected in the HITRAN2020 data set (Gordon et al., 2022). This suggests that the spectroscopic data used in our study might contain line intensities too low by 1.8 % to 2.8 %, explaining a corresponding high bias in our ozone mixing ratios. A confirmation of the drift reduction, as indicated by our analyses, requires comparisons with independent data. The quantitative analyses of both these issues are deferred to a dedicated validation study.
The MIPAS data can be obtained from the KITopen repository (https://doi.org/10.5445/IR/1000156431, Kiefer et al., 2023).
The supplement related to this article is available online at: https://doi.org/10.5194/amt-16-1443-2023-supplement.
MK developed the retrieval setup, coordinated and partly performed related test calculations and error estimation, and had the final editorial responsibility for this paper. TvC wrote large parts of the text, organized related discussions, and ensured the TUNER compliance of error estimates. BF provided the parameterized non-LTE approach based on preceding work by MLP, MGC, and himself. BF, MGC, and MLP took care that the retrieval setup was developed in a consistent way for nominal and middle- and upper-atmospheric measurement modes. NG was responsible for spectroscopy issues, developed parts of the error estimation software, carried out some of the retrieval tests, and developed the coarse-grid retrieval setup. UG provided and maintained the retrieval software and developed parts of the error estimation software. SK and ALi ran the retrievals. BF, SK, and MH provided the horizontal averaging kernels. MH developed parts of the error estimation software. ALa contributed to quality control. GPS evaluated the preceding data versions for deficiencies to be removed in version 8, organized the interfacing between IMK and IAA, and took care of the quality control. All authors contributed to the development of the retrieval setup, discussed the results, and contributed to the final text.
At least one of the (co-)authors is a member of the editorial board of Atmospheric Measurement Techniques. The peer-review process was guided by an independent editor, and the authors also have no other competing interests to declare.
Publisher's note: Copernicus Publications remains neutral with regard to jurisdictional claims in published maps and institutional affiliations.
This article is part of the special issue “IMK–IAA MIPAS version 8 data: retrieval, validation, and application (ACP/AMT inter-journal SI)”. It is not associated with a conference.
Spectra used for this work were provided by the European Space Agency. We would like to thank the MIPAS Quality Working Group for enlightening discussions, Claus Zehner for invaluable support, and Guido Levrini for motivating us to develop an independent MIPAS data processor. The computations were done in the framework of a Bundesprojekt (grant MIPAS_V7) on the Cray XC40 Hazel Hen of the High-Performance Computing Center Stuttgart (HLRS) of the University of Stuttgart.
This study was partly funded by the Deutsches Zentrum für Luft- und Raumfahrt (DLR) (SEREMISA; contract no. 50EE1547). The IAA team was supported by the Ministerio de Ciencia, Innovación y Universidades (MCIU) (project no. PID2019-110689RB-100/AEI/10.13039/501100011033).
The article processing charges for this open-access publication were covered by the Karlsruhe Institute of Technology (KIT).
This paper was edited by Andre Butz and reviewed by two anonymous referees.
Birk, M. and Wagner, G.: Complete in-flight detector non-linearity characterisation of MIPAS/Envisat, European Space Agency – ESRIN, https://earth.esa.int/eogateway/documents/20142/37627/MIPAS non linearity (last access: 10 March 2023), 2010. a, b
Eckert, E., von Clarmann, T., Kiefer, M., Stiller, G. P., Lossow, S., Glatthor, N., Degenstein, D. A., Froidevaux, L., Godin-Beekmann, S., Leblanc, T., McDermid, S., Pastel, M., Steinbrecht, W., Swart, D. P. J., Walker, K. A., and Bernath, P. F.: Drift-corrected trends and periodic variations in MIPAS IMK/IAA ozone measurements, Atmos. Chem. Phys., 14, 2571–2589, https://doi.org/10.5194/acp-14-2571-2014, 2014. a, b, c, d, e, f, g, h, i, j
Fischer, H., Birk, M., Blom, C., Carli, B., Carlotti, M., von Clarmann, T., Delbouille, L., Dudhia, A., Ehhalt, D., Endemann, M., Flaud, J. M., Gessner, R., Kleinert, A., Koopman, R., Langen, J., López-Puertas, M., Mosner, P., Nett, H., Oelhaf, H., Perron, G., Remedios, J., Ridolfi, M., Stiller, G., and Zander, R.: MIPAS: an instrument for atmospheric and climate research, Atmos. Chem. Phys., 8, 2151–2188, https://doi.org/10.5194/acp-8-2151-2008, 2008. a
Flaud, J.-M., Piccolo, C., Carli, B., Perrin, A., Coudert, L. H., Teffo, J.-L., and Brown, L. R.: Molecular line parameters for the MIPAS (Michelson Interferometer for Passive Atmospheric Sounding) experiment, Atmos. Oceanic Opt., 16, 172–182, 2003a. a
Flaud, J. M., Wagner, G., Birk, M., Camy-Peyret, C., Claveau, C., De Backer-Barilly, M. R., Barbe, A., and Piccolo, C.: Ozone absorption around 10 µm, J. Geophys. Res., 108, 4269, https://doi.org/10.1029/2002JD002755, 2003b. a
Funke, B., López-Puertas, M., Stiller, G. P., von Clarmann, T., and Höpfner, M.: A new non–LTE Retrieval Method for Atmospheric Parameters From MIPAS–ENVISAT Emission Spectra, Adv. Space Res., 27, 1099–1104, 2001. a
Funke, B., Baumgaertner, A., Calisto, M., Egorova, T., Jackman, C. H., Kieser, J., Krivolutsky, A., López-Puertas, M., Marsh, D. R., Reddmann, T., Rozanov, E., Salmi, S.-M., Sinnhuber, M., Stiller, G. P., Verronen, P. T., Versick, S., von Clarmann, T., Vyushkova, T. Y., Wieters, N., and Wissing, J. M.: Composition changes after the ”Halloween” solar proton event: the High Energy Particle Precipitation in the Atmosphere (HEPPA) model versus MIPAS data intercomparison study, Atmos. Chem. Phys., 11, 9089–9139, https://doi.org/10.5194/acp-11-9089-2011, 2011. a
Funke, B., López-Puertas, M., García-Comas, M., Kaufmann, M., Höpfner, M., and Stiller, G. P.: GRANADA: A Generic RAdiative traNsfer AnD non-LTE population algorithm, J. Quant. Spectrosc. Ra., 113, 1771–1817, https://doi.org/10.1016/j.jqsrt.2012.05.001, 2012. a
Funke, B., Ball, W., Bender, S., Gardini, A., Harvey, V. L., Lambert, A., López-Puertas, M., Marsh, D. R., Meraner, K., Nieder, H., Päivärinta, S.-M., Pérot, K., Randall, C. E., Reddmann, T., Rozanov, E., Schmidt, H., Seppälä, A., Sinnhuber, M., Sukhodolov, T., Stiller, G. P., Tsvetkova, N. D., Verronen, P. T., Versick, S., von Clarmann, T., Walker, K. A., and Yushkov, V.: HEPPA-II model–measurement intercomparison project: EPP indirect effects during the dynamically perturbed NH winter 2008–2009, Atmos. Chem. Phys., 17, 3573–3604, https://doi.org/10.5194/acp-17-3573-2017, 2017. a
García, R. R., Smith, A. K., Kinnison, D. E., de la Cámara, Á., and Murphy, D.: Modification of the Gravity Wave Parameterization in the Whole Atmosphere Community Climate Model: Motivation and Results, J. Atmos. Sci., 74, 275–291, https://doi.org/10.1175/JAS-D-16-0104.1, 2017. a
Glatthor, N., von Clarmann, T., Fischer, H., Funke, B., Gil-López, S., Grabowski, U., Höpfner, M., Kellmann, S., Linden, A., López-Puertas, M., Mengistu Tsidu, G., Milz, M., Steck, T., Stiller, G. P., and Wang, D.-Y.: Retrieval of stratospheric ozone profiles from MIPAS/ENVISAT limb emission spectra: a sensitivity study, Atmos. Chem. Phys., 6, 2767–2781, https://doi.org/10.5194/acp-6-2767-2006, 2006. a
Glatthor, N., von Clarmann, T., Stiller, G. P., Kiefer, M., Laeng, A., Dinelli, B. M., Wetzel, G., and Orphal, J.: Differences in ozone retrieval in MIPAS channels A and AB: a spectroscopic issue, Atmos. Meas. Tech., 11, 4707–4723, https://doi.org/10.5194/amt-11-4707-2018, 2018. a, b, c
Gordon, I. E., Rothman, L. S., Hill, C., Kochanov, R. V., Tan, Y., Bernath, P. F., Birk, M., Boudon, V., Campargue, A., Chance, K. V., Drouin, B. J., Flaud, J.-M., Gamache, R. R., Hodges, J. T., Jacquemart, D., Perevalov, V. I., Perrin, A., Shine, K. P., Smith, M.-A. H., Tennyson, J., Toon, G. C., Tran, H., Tyuterev, V. G., Barbe, A., Császár, A. G., Devi, V. M., Furtenbacher, T., Harrison, J. J., Hartmann, J.-M., Jolly, A., Johnson, T. J., Karman, T., Kleiner, I., Kyuberis, A. A., Loos, J., Lyulin, O. M., Massie, S. T., Mikhailenko, S. N., Moazzen-Ahmadi, N., Müller, H. S. P., Naumenko, O. V., Nikitin, A. V., Polyansky, O. L., Rey, M., Rotger, M., Sharpe, S. W., Sung, K., Starikova, E., Tashkun, S. A., Vander Auwera, J., Wagner, G., Wilzewski, J., Wcisło, P., Yu, S., and Zak, E. J.: The HITRAN2016 molecular spectroscopic database, J. Quant. Spectrosc. Ra., 203, 3–69, https://doi.org/10.1016/j.jqsrt.2017.06.038, 2017. a, b
Gordon, I. E., Rothman, L. S., Hargreaves, R. J., Hashemi, R., Karlovets, E. V., Skinner, F. M., Conway, E. K., Hill, C., Kochanov, R. V., Tan, Y., Wcisło, P., Finenko, A. A., Nelson, K., Bernath, P. F., Birk, M., Boudon, V., Campargue, A., Chance, K. V., Coustenis, A., Drouin, B. J., Flaud, J.-M., Gamache, R. R., Hodges, J. T., Jacquemart, D., Mlawer, E. J., Nikitin, A. V., Perevalov, V. I., Rotger, M., Tennyson, J., Toon, G. C., Tran, H., Tyuterev, V. G., Adkins, E. M., Baker, A., Barbe, A., Canè, E., Császár, A. G., Dudaryonok, A., Egorov, O., Fleisher, A. J., Fleurbaey, H., Foltynowicz, A., Furtenbacher, T., Harrison, J. J., Hartmann, J.-M., Horneman, V.-M., Huang, X., Karman, T., Karns, J., Kassi, S., Kleiner, I., Kofman, V., Kwabia-Tchana, F., Lavrentieva, N. N., Lee, T. J., Long, D. A., Lukashevskaya, A. A., Lyulin, O. M., Makhnev, V. Y., Matt, W., Massie, S. T., Melosso, M., Mikhailenko, S. N., Mondelain, D., Müller, H. S. P., Naumenko, O. V., Perrin, A., Polyansky, O. L., Raddaoui, E., Raston, P. L., Reed, Z. D., Rey, M., Richard, C., Tóbiás, R., Sadiek, I., Schwenke, D. W., Starikova, E., Sung, K., Tamassia, F., Tashkun, S. A., Vander Auwera, J., Vasilenko, I. A., Vigasin, A. A., Villanueva, G. L., Vispoel, B., Wagner, G., Yachmenev, A., Yurchenko, S. N.: The HITRAN2020 molecular spectroscopic database, J. Quant. Spectrosc. Ra., 277, 107949, https://doi.org/10.1016/j.jqsrt.2021.107949, 2022. a
Hase, F.: The instrument line shape of MIPAS, Oral presentation at the 2nd MIPAS Quality Working Group Meeting, Florence, Italy, 3 December 2003, 2003. a
Hegglin, M. I., Tegtmeier, S., Anderson, J., Froidevaux, L., Fuller, R., Funke, B., Jones, A., Lingenfelser, G., Lumpe, J., Pendlebury, D., Remsberg, E., Rozanov, A., Toohey, M., Urban, J., von Clarmann, T., Walker, K. A., Wang, R., and Weigel, K.: SPARC Data Initiative: Comparison of water vapor climatologies from international satellite limb sounders, J. Geophys. Res.-Atmos., 118, 11824–11846, https://doi.org/10.1002/jgrd.50752, 2013. a
Höpfner, M. and Kellmann, S.: Optimization of model accuracy parameters, in: The Karlsruhe optimized and precise radiative transfer algorithm, edited by: Stiller, G. P., Wissenschaftliche Berichte FZKA 6487, Forschungszentrum Karlsruhe, Karlsruhe, 145–482, https://doi.org/10.5445/IR/270048971, 2000. a
Hubert, D., Keppens, A., Granville, J., and Lambert, J.-C.: Multi-TASTE Phase F Validation Report/Ground-based validation of MIPAS ESA operational products, European Space Agency – ESRIN, https://earth.esa.int/eogateway/documents/20142/37627/TN-BIRA-IASB-MultiTASTE-Phase-F-MIPAS-ORM8-Iss1-RevB.pdf (last access: 10 March 2023), 2020. a
Kiefer, M., von Clarmann, T., Funke, B., García-Comas, M., Glatthor, N., Grabowski, U., Kellmann, S., Kleinert, A., Laeng, A., Linden, A., López-Puertas, M., Marsh, D. R., and Stiller, G. P.: IMK/IAA MIPAS temperature retrieval version 8: nominal measurements, Atmos. Meas. Tech., 14, 4111–4138, https://doi.org/10.5194/amt-14-4111-2021, 2021. a, b, c, d, e, f, g, h, i, j, k, l, m
Kiefer, M., von Clarmann, T., Funke, B., García-Comas, M., Glatthor, N., Grabowski, U., Höpfner, M., Kellmann, S., Laeng, A., Linden, A., and Stiller, G. P.: Version 8 IMK/IAA MIPAS ozone profiles: nominal observation mode, KITopen [data set], https://doi.org/10.5445/IR/1000156431, 2023. a
Kleinert, A., Birk, M., Perron, G., and Wagner, G.: Level 1b error budget for MIPAS on ENVISAT, Atmos. Meas. Tech., 11, 5657–5672, https://doi.org/10.5194/amt-11-5657-2018, 2018. a, b, c, d
Laeng, A., Grabowski, U., von Clarmann, T., Stiller, G., Glatthor, N., Höpfner, M., Kellmann, S., Kiefer, M., Linden, A., Lossow, S., Sofieva, V., Petropavlovskikh, I., Hubert, D., Bathgate, T., Bernath, P., Boone, C. D., Clerbaux, C., Coheur, P., Damadeo, R., Degenstein, D., Frith, S., Froidevaux, L., Gille, J., Hoppel, K., McHugh, M., Kasai, Y., Lumpe, J., Rahpoe, N., Toon, G., Sano, T., Suzuki, M., Tamminen, J., Urban, J., Walker, K., Weber, M., and Zawodny, J.: Validation of MIPAS IMK/IAA V5R_O3_224 ozone profiles, Atmos. Meas. Tech., 7, 3971–3987, https://doi.org/10.5194/amt-7-3971-2014, 2014. a, b, c
Laeng, A., Hubert, D., Verhoelst, T., von Clarmann, T., Dinelli, B. M., Dudhia, A., Raspollini, P., Stiller, G., Grabowski, U., Keppens, A., Kiefer, M., Sofieva, V., Froidevaux, L., Walker, K. A., Lambert, J.-C., and Zehner, C.: The Ozone Climate Change Initiative: Comparison of four Level-2 Processors for the Michelson Interferometer for Passive Atmospheric Sounding (MIPAS), Remote Sens. Environ., 162, 316–343, https://doi.org/10.1016/j.rse.2014.12.013, 2015. a, b
Laeng, A., Eckert, E., von Clarmann, T., Kiefer, M., Hubert, D., Stiller, G., Glatthor, N., López-Puertas, M., Funke, B., Grabowski, U., Plieninger, J., Kellmann, S., Linden, A., Lossow, S., Babenhauserheide, A., Froidevaux, L., and Walker, K.: On the improved stability of the version 7 MIPAS ozone record, Atmos. Meas. Tech., 11, 4693–4705, https://doi.org/10.5194/amt-11-4693-2018, 2018. a, b, c, d
López-Puertas, M. and Taylor, F. W.: Non-LTE radiative transfer in the Atmosphere, World Scientific Pub., Singapore, https://doi.org/10.1142/4650, 2001. a
López-Puertas, M., García-Comas, M., Funke, B., Gardini, A., Stiller, G. P., von Clarmann, T., Glatthor, N., Laeng, A., Kaufmann, M., Sofieva, V. F., Froidevaux, L., Walker, K. A., and Shiotani, M.: MIPAS observations of ozone in the middle atmosphere, Atmos. Meas. Tech., 11, 2187–2212, https://doi.org/10.5194/amt-11-2187-2018, 2018. a
Marsh, D. R.: Chemical-dynamical coupling in the mesosphere and lower thermosphere, in: Aeronomy of the Earth's atmosphere and ionosphere, 1st edn., edited by: Abdu, M. and Pancheva, D., vol. 2 of IAGA Special Sopron Book, Springer, Dordrecht, 3–17, ISBN 978-94-007-0325-4, 2011. a
Marsh, D. R., Mills, M. J., Kinnison, D. E., Lamarque, J.-F., Calvo, N., and Polvani, L. M.: Climate change from 1850 to 2005 simulated in CESM1(WACCM), J. Climate, 26, 7372–7391, https://doi.org/10.1175/JCLI-D-12-00558.1, 2013. a
Phillips, D.: A Technique for the numerical solution of certain integral equations of first kind, J. Ass. Comput. Mat., 9, 84–97, 1962. a
Rodgers, C. D.: Inverse Methods for Atmospheric Sounding: Theory and Practice, vol. 2 of Series on Atmospheric, Oceanic and Planetary Physics, edited by: Taylor, F. W., World Scientific, Singapore, New Jersey, London, Hong Kong, https://doi.org/10.1142/3171, 2000. a, b
Sofieva, V. F., Rahpoe, N., Tamminen, J., Kyrölä, E., Kalakoski, N., Weber, M., Rozanov, A., von Savigny, C., Laeng, A., von Clarmann, T., Stiller, G., Lossow, S., Degenstein, D., Bourassa, A., Adams, C., Roth, C., Lloyd, N., Bernath, P., Hargreaves, R. J., Urban, J., Murtagh, D., Hauchecorne, A., Dalaudier, F., van Roozendael, M., Kalb, N., and Zehner, C.: Harmonized dataset of ozone profiles from satellite limb and occultation measurements, Earth Syst. Sci. Data, 5, 349–363, https://doi.org/10.5194/essd-5-349-2013, 2013. a
Sofieva, V. F., Kyrölä, E., Laine, M., Tamminen, J., Degenstein, D., Bourassa, A., Roth, C., Zawada, D., Weber, M., Rozanov, A., Rahpoe, N., Stiller, G., Laeng, A., von Clarmann, T., Walker, K. A., Sheese, P., Hubert, D., van Roozendael, M., Zehner, C., Damadeo, R., Zawodny, J., Kramarova, N., and Bhartia, P. K.: Merged SAGE II, Ozone_cci and OMPS ozone profile dataset and evaluation of ozone trends in the stratosphere, Atmos. Chem. Phys., 17, 12533–12552, https://doi.org/10.5194/acp-17-12533-2017, 2017. a
Steck, T. and von Clarmann, T.: Constrained profile retrieval applied to the observation mode of the Michelson Interferometer for Passive Atmospheric Sounding, Appl. Optics, 40, 3559–3571, 2001. a
Stiller, G. P. (Ed.): The Karlsruhe optimized and precise radiative transfer algorithm, Wissenschaftliche Berichte, FZKA-6487, Forschungszentrum Karlsruhe, Karlsruhe, https://doi.org/10.5445/IR/270048971, 2000. a, b
Stiller, G. P., von Clarmann, T., Funke, B., Glatthor, N., Hase, F., Höpfner, M., and Linden, A.: Sensitivity of trace gas abundances retrievals from infrared limb emission spectra to simplifying approximations in radiative transfer modelling, J. Quant. Spectrosc. Ra., 72, 249–280, https://doi.org/10.1016/s0022-4073(01)00123-6, 2002. a
Tegtmeier, S., Hegglin, M. I., Anderson, J., Bourassa, A., Brohede, S., Degenstein, D., Froidevaux, L., Fuller, R., Funke, B., Gille, J., Jones, A., Krüger, Y. K. K., Kyrölä, E., Lingenfelser, G., Lumpe, J., Nardi, B., Neu, J., Pendlebury, D., Remsberg, E., Rozanov, A., Smith, L., Toohey, M., Urban, J., von Clarmann, T., Walker, K. A., and Wang, R. H. J.: SPARC Data Initiative: A comparison of ozone climatologies from international satellite limb sounders, J. Geophys. Res.-Atmos., 118, 12229–12247, https://doi.org/10.1002/2013JD019877, 2013. a
Tikhonov, A.: On the solution of incorrectly stated problems and method of regularization, Dokl. Akad. Nauk. SSSR, 151, 501–504, 1963. a
Twomey, S.: On the Numerical Solution of Fredholm Integral Equations of the First Kind by the Inversion of the Linear System Produced by Quadrature, J. ACM, 10, 97–101, 1963. a
von Clarmann, T.: Smoothing error pitfalls, Atmos. Meas. Tech., 7, 3023–3034, https://doi.org/10.5194/amt-7-3023-2014, 2014. a
von Clarmann, T., Glatthor, N., Grabowski, U., Höpfner, M., Kellmann, S., Kiefer, M., Linden, A., Mengistu Tsidu, G., Milz, M., Steck, T., Stiller, G. P., Wang, D. Y., Fischer, H., Funke, B., Gil-López, S., and López-Puertas, M.: Retrieval of temperature and tangent altitude pointing from limb emission spectra recorded from space by the Michelson Interferometer for Passive Atmospheric Sounding (MIPAS), J. Geophys. Res., 108, 4736, https://doi.org/10.1029/2003JD003602, 2003. a, b
von Clarmann, T., De Clercq, C., Ridolfi, M., Höpfner, M., and Lambert, J.-C.: The horizontal resolution of MIPAS, Atmos. Meas. Tech., 2, 47–54, https://doi.org/10.5194/amt-2-47-2009, 2009a. a
von Clarmann, T., Höpfner, M., Kellmann, S., Linden, A., Chauhan, S., Funke, B., Grabowski, U., Glatthor, N., Kiefer, M., Schieferdecker, T., Stiller, G. P., and Versick, S.: Retrieval of temperature, H2O, O3, HNO3, CH4, N2O, ClONO2 and ClO from MIPAS reduced resolution nominal mode limb emission measurements, Atmos. Meas. Tech., 2, 159–175, https://doi.org/10.5194/amt-2-159-2009, 2009b. a
von Clarmann, T., Glatthor, N., and Plieninger, J.: Maximum likelihood representation of MIPAS profiles, Atmos. Meas. Tech., 8, 2749–2757, https://doi.org/10.5194/amt-8-2749-2015, 2015. a, b
von Clarmann, T., Degenstein, D. A., Livesey, N. J., Bender, S., Braverman, A., Butz, A., Compernolle, S., Damadeo, R., Dueck, S., Eriksson, P., Funke, B., Johnson, M. C., Kasai, Y., Keppens, A., Kleinert, A., Kramarova, N. A., Laeng, A., Langerock, B., Payne, V. H., Rozanov, A., Sato, T. O., Schneider, M., Sheese, P., Sofieva, V., Stiller, G. P., von Savigny, C., and Zawada, D.: Overview: Estimating and reporting uncertainties in remotely sensed atmospheric composition and temperature, Atmos. Meas. Tech., 13, 4393–4436, https://doi.org/10.5194/amt-13-4393-2020, 2020. a, b
von Clarmann, T., Glatthor, N., Grabowski, U., Funke, B., Kiefer, M., Kleinert, A., Stiller, G. P., Linden, A., and Kellmann, S.: TUNER-compliant error estimation for MIPAS: methodology, Atmos. Meas. Tech., 15, 6991–7018, https://doi.org/10.5194/amt-15-6991-2022, 2022. a, b
Yoon, J., Pozzer, A., Hoor, P., Chang, D. Y., Beirle, S., Wagner, T., Schloegl, S., Lelieveld, J., and Worden, H. M.: Technical Note: Temporal change in averaging kernels as a source of uncertainty in trend estimates of carbon monoxide retrieved from MOPITT, Atmos. Chem. Phys., 13, 11307–11316, https://doi.org/10.5194/acp-13-11307-2013, 2013. a
- Abstract
- Introduction
- Lessons learned from previous studies
- Calibration
- Retrieval
- Error budget
- Results
- Maximum-likelihood representation
- Conclusions
- Data availability
- Author contributions
- Competing interests
- Disclaimer
- Special issue statement
- Acknowledgements
- Financial support
- Review statement
- References
- Supplement