the Creative Commons Attribution 4.0 License.
the Creative Commons Attribution 4.0 License.
 | 28 Mar 2023
Accounting for surface reflectance spectral features in TROPOMI methane retrievals
Tobias Borsdorff
Mari C. Martinez-Velarte
Jochen Landgraf
Satellite remote sensing of methane (CH4) using the TROPOspheric Monitoring Instrument (TROPOMI) aboard the Copernicus Sentinel-5 Precursor (S5-P) satellite is key to monitor and quantify emissions globally. Overall, the S5-P methane data are of satisfying quality, demonstrated by the product validation with ground-based measurements from the Total Carbon Column Observing Network (TCCON). However, analysis of TROPOMI dry-air column mixing ratio (XCH4) data has pointed to a few false methane anomalies up to 20–40 ppb that can potentially be misinterpreted as enhancements due to strong emission sources. These artefacts are caused by spectral features of the underlying surfaces of specific materials (e.g. carbonate rocks), which are not well represented in the forward model of the retrieval algorithm. In this study we show that the observed anomalies are due to the surface model which describes the spectral dependence of the Lambertian albedo by a second-order polynomial in wavelength. By analysing the ECOSTRESS library that contains laboratory spectra for different types of surfaces, we find that a quadratic function might not be the most optimal representation of the surface reflectance spectral dependencies in the short-wave infrared (SWIR) range. Already the use of a third-order polynomial improves the methane data such that the anomalies disappear at several locations (e.g. Siberia, Australia and Algeria) without affecting the data quality elsewhere, and the quality of the fit significantly improves. We also found that the known bias in retrieved methane for low-albedo scenes slightly improves, but still, a posterior correction needs to be applied, leaving open the question about the root cause of the albedo bias. After applying the adjusted surface model globally, we perform the routine validation with TCCON and Greenhouse gases Observing SATellite (GOSAT) data. GOSAT comparison does not significantly improve, while TCCON validation results show a small improvement in some stations of 2–4 ppb, up to a factor of 10 smaller than the artificial XCH4 enhancements. This reflects that TCCON stations are not close to any of the corrected artefacts, hinting at a limitation of the current validation approach of the S5-P XCH4 data product.
Please read the corrigendum first before continuing.
-
Notice on corrigendum
The requested paper has a corresponding corrigendum published. Please read the corrigendum first before downloading the article.
-
Article
(10441 KB)
-
The requested paper has a corresponding corrigendum published. Please read the corrigendum first before downloading the article.
- Article
(10441 KB) - Full-text XML
- Corrigendum
- BibTeX
- EndNote


Methane (CH4) obtained from TROPOspheric Monitoring Instrument (TROPOMI) measurements has been crucial to monitor and quantify greenhouse gas emissions worldwide at global, regional and local scales (e.g. Qu et al., 2021; Chen et al., 2022; Sadavarte et al., 2021) and from multiple sources (e.g. Maasakkers et al., 2022; Shen et al., 2022; Lunt et al., 2019). The methane operational retrieval algorithm has provided data with high quality since the satellite instrument was launched in 2017 (Sha et al., 2021). The algorithm has been improved in the last few years to better correct for biases from low-albedo scenes, update the spectroscopy and the regularization in the inversion, and retrieve methane from measurements over the ocean under sun-glint geometry (Lorente et al., 2021, 2022a).
However, intercomparison between different scientific retrieval algorithms (Lorente et al., 2022b) and the systematic analysis of TROPOMI methane data have pointed to biases linked to surface features that lead to false methane anomalies or artefacts (e.g. Barré et al., 2021). These artefacts can be misinterpreted as atmospheric signatures due to emissions by strong methane super-emitters if they are found in e.g. active oil and gas areas or due to processes related to global warming (e.g. Froitzheim et al., 2021). In order to understand and to have an accurate quantification of methane emissions, it is important to correct for these artefacts on an algorithm level. Recently, Jongaramrungruang et al. (2021) analysed the impact of spectrally complex features on retrieved methane abundances and how they could be mitigated by the choices related to instrument and retrieval parameters. Based on the fact that surface materials have specific spectral dependencies of their surface albedo, they showed that using larger-order polynomials could reduce the retrieval biases related to surface features.
In this study, we show that increasing the order of the polynomial that models the surface reflectance spectral dependence in the TROPOMI methane retrieval algorithm removes large localized methane artefacts and improves the resulting spectral fit. We analyse the impact on global methane abundances and assess the quality of the dataset after applying the improved scheme to 4 years of TROPOMI measurements. Applying the improved surface model globally, we perform the routine validation with Total Carbon Column Observing Network (TCCON) and Greenhouse gases Observing SATellite (GOSAT) observations.
The methane total column-averaged dry-air mole fraction (XCH4) is retrieved from TROPOMI measurements (y) of sunlight backscattered by the earth's surface and the atmosphere in the near-infrared (NIR, 757–774 nm) and short-wave infrared (SWIR, 2305–2385 nm) spectral bands. We use the RemoTeC full-physics algorithm (described in detail by Hu et al., 2016, and Lorente et al., 2021) that simultaneously retrieves the amount of atmospheric methane and the physical scattering properties of the atmosphere. The forward model (F) employs the LINTRAN V2.0 radiative transfer model in its scalar approximation to simulate atmospheric light scattering and absorption in a plane-parallel atmosphere (Schepers et al., 2014; Landgraf et al., 2001).
The retrieval algorithm aims to find the state vector x that contains CH4 partial sub-column number densities by solving the minimization problem:
where ∥⋅∥ describes the Euclidian norm, Sy is the measurement error covariance matrix that contains the noise estimate, γ is the regularization parameter, W is a diagonal unity weighting matrix, and xa is the a priori state vector (Hu et al., 2016). The retrieval state vector contains CH4 partial sub-column number densities at 12 equidistant pressure layers, the total columns of the interfering absorbers CO and H2O, the effective aerosol total column, size and height parameter of the aerosol power law distribution, and the spectral shift and fluorescence in the NIR band. A Lambertian surface albedo in both the NIR and SWIR spectral ranges and their spectral dependence as a polynomial are also retrieved.
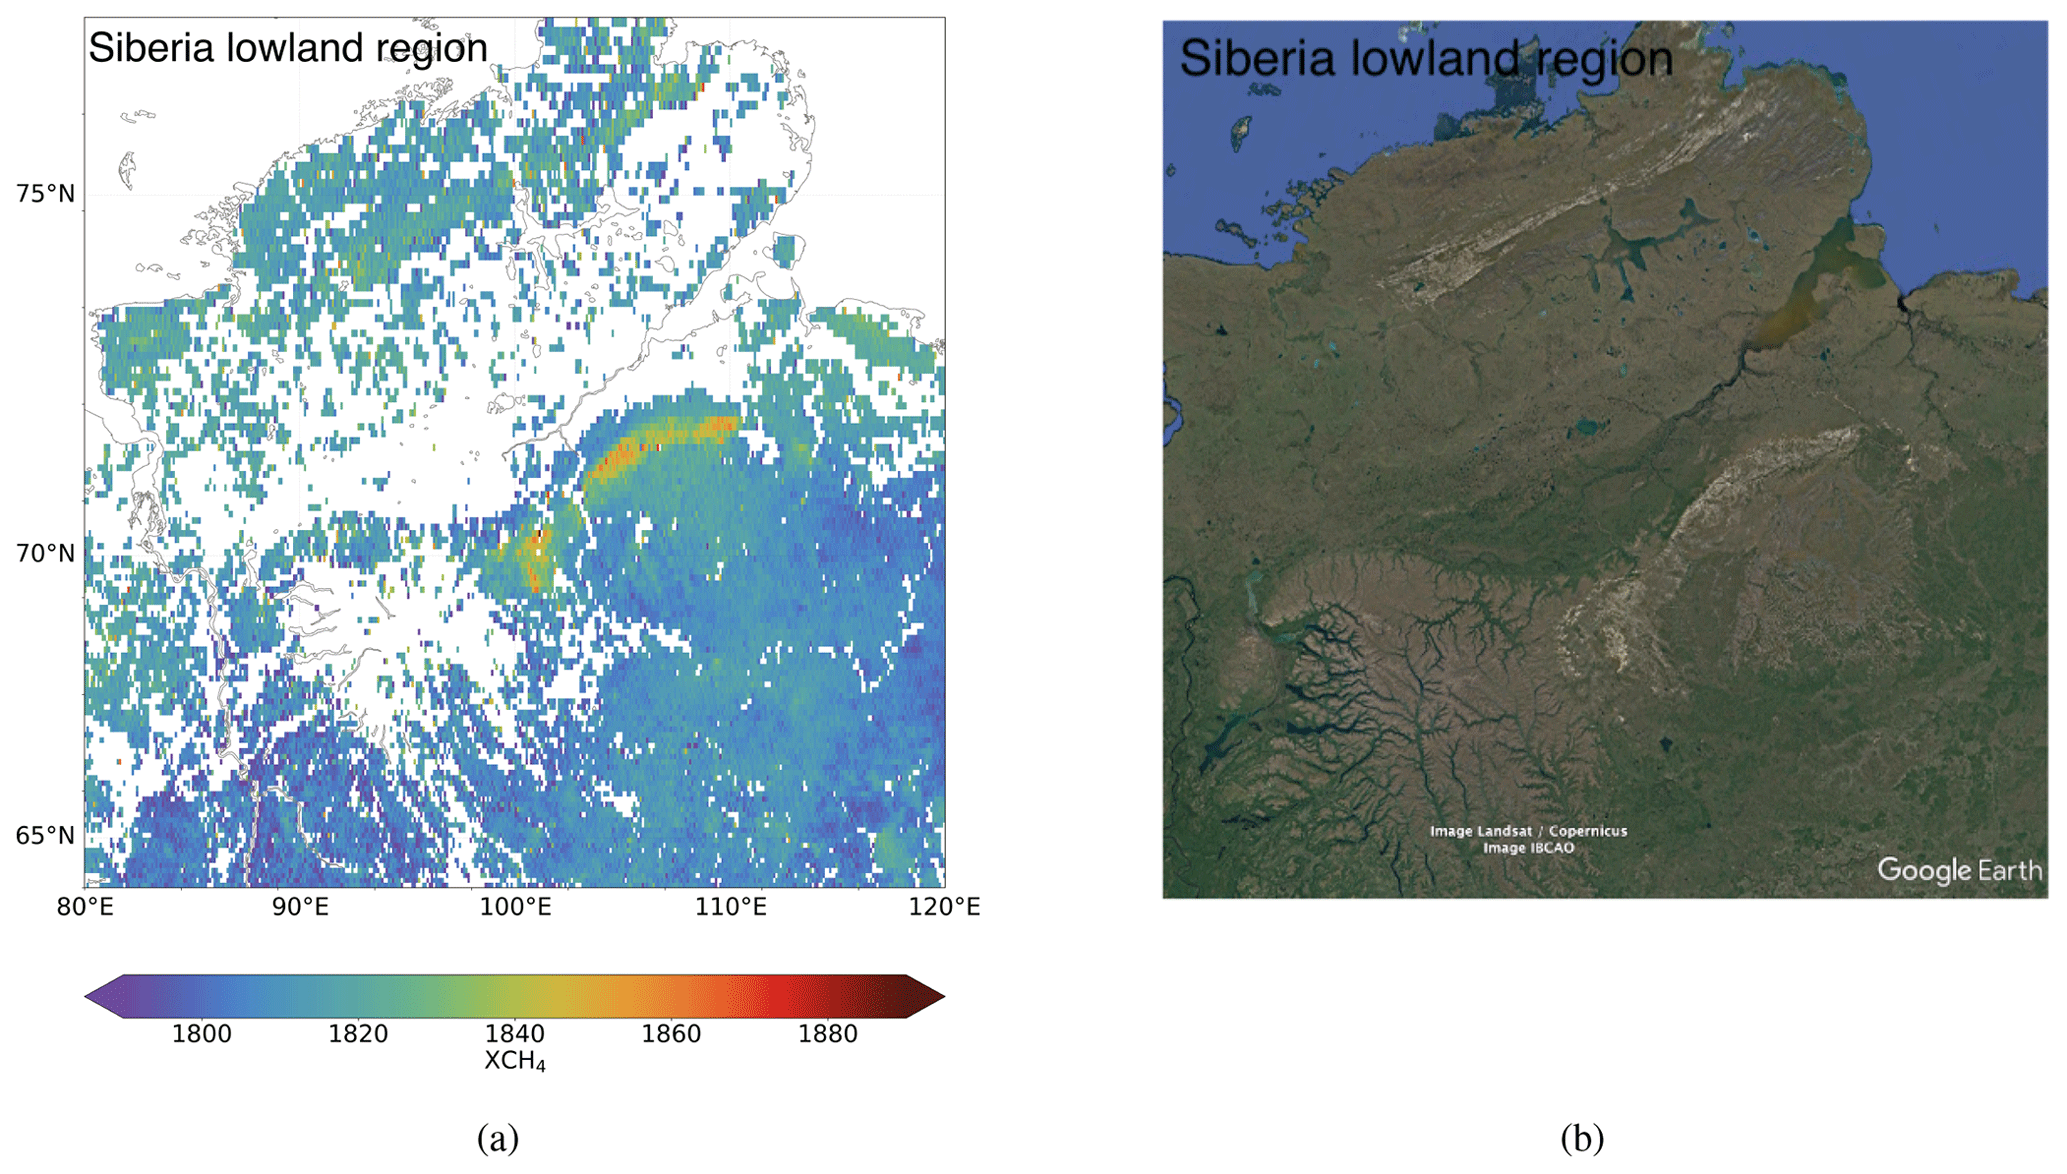
Figure 1(a) TROPOMI XCH4 retrieved over the North Siberian Lowland region (64–77∘ N, 80–120∘ E) averaged from March 2019–March 2020 to a 0.1∘ × 0.1∘ grid and (b) Landsat imagery provided by Google Earth © Google, 2022.
Surface reflectance spectral dependence in RemoTeC is modelled using a low-order polynomial in wavelength. The coefficients of the polynomial are elements of the atmospheric state vector to be inferred in the inversion (Eq. 1). The operational retrieval algorithm (up to version 02.03.01) uses a second-order polynomial (Hu et al., 2016), but for specific surfaces this representation is not optimal, and retrieved XCH4 shows enhancements that can be up to 20–40 ppb and that are strongly correlated with surface features. Figure 1 shows an example of an artificial XCH4 enhancement over Siberia where high XCH4 values coincide with a feature of outcrops of Paleozoic carbonate rocks (Froitzheim et al., 2021), recognizable in the Landsat imagery provided by Google Earth. Here, the surface is a type of carbonate rock for which the reflectance has a characteristic spectral feature. Even though this artefact can be mistaken by enhancements produced by underlying methane emissions (Froitzheim et al., 2021), the fact that these enhancements are constant in time and with a shape that does not change with meteorological (e.g. wind) conditions supports the hypothesis that it is an artefact, as reported by Barré et al. (2021).
To improve the characterization of the surface reflectance dependency with wavelength in RemoTeC, following Jongaramrungruang et al. (2021), we look at the ECOSTRESS spectral library (Meerdink et al., 2019), which contains laboratory spectra of minerals, rocks and man-made materials. Analysing the spectral information for different types of surfaces, particularly for rock and concrete, we find that a quadratic function might not be the most optimal representation of the surface reflectance spectral dependencies in the SWIR range. We thus increase the order of the polynomial and analyse the modelled radiance and residuals for the artefact over Siberia. We find that using a third-order polynomial is enough to capture the specific spectral features that cause the localized enhancements and so improves the spectral quality fit. However, outside of this area the fit does not improve, reflecting that a second-order polynomial is optimal to capture the spectral dependencies of most surfaces. Increasing the order of the polynomial to degrees higher than 3 does not further improve the retrieval in any of the cases, producing artificial signals in some of the retrieved parameters and worsening the quality of the fit outside of the specific areas. These findings are also confirmed for other areas with artificial XCH4 enhancements.
2.1 Results
Based on our findings, we retrieve 4 years of XCH4 from TROPOMI measurements using a cubic function for the spectral dependence of the Lambertian albedo in the 2.3 µm spectral range to better characterize the surface reflectance spectral features. The updated retrieval algorithm used to retrieve this TROPOMI XCH4 scientific data product was implemented in the operational processing algorithm in July 2022 under version 02.04.00. This version of the algorithm has been used for the full mission reprocessing performed by ESA that will be completed before the end of the first quarter of 2023. In this section, we show that with the updated treatment of surface reflectance several artificial XCH4 features are removed, and we analyse the quality of the dataset on the local, regional and global scale.
2.1.1 Localized features
Figure 2a shows the fitted SWIR radiance modelled with the forward model using a quadratic and a cubic function to characterize the spectral features of the surface reflectance for one of the pixels that show strong XCH4 enhancement over Siberia (Fig. 1). For this specific pixel, the residuals (i.e. difference between modelled and measured radiance) using a quadratic function show a strong dependency with wavelength (Fig. 2b), while for a pixel outside the enhancement the dependency is not significant (not shown). If we increase the order of the polynomial from second to third order, the dependency with wavelength of the residuals is significantly reduced (Fig. 2c). For this specific pixel, retrieved XCH4 is reduced from 1885 to 1847 ppb, and the χ2 value for the fit is reduced from 53 to 19 when going from second- to third-order polynomial.
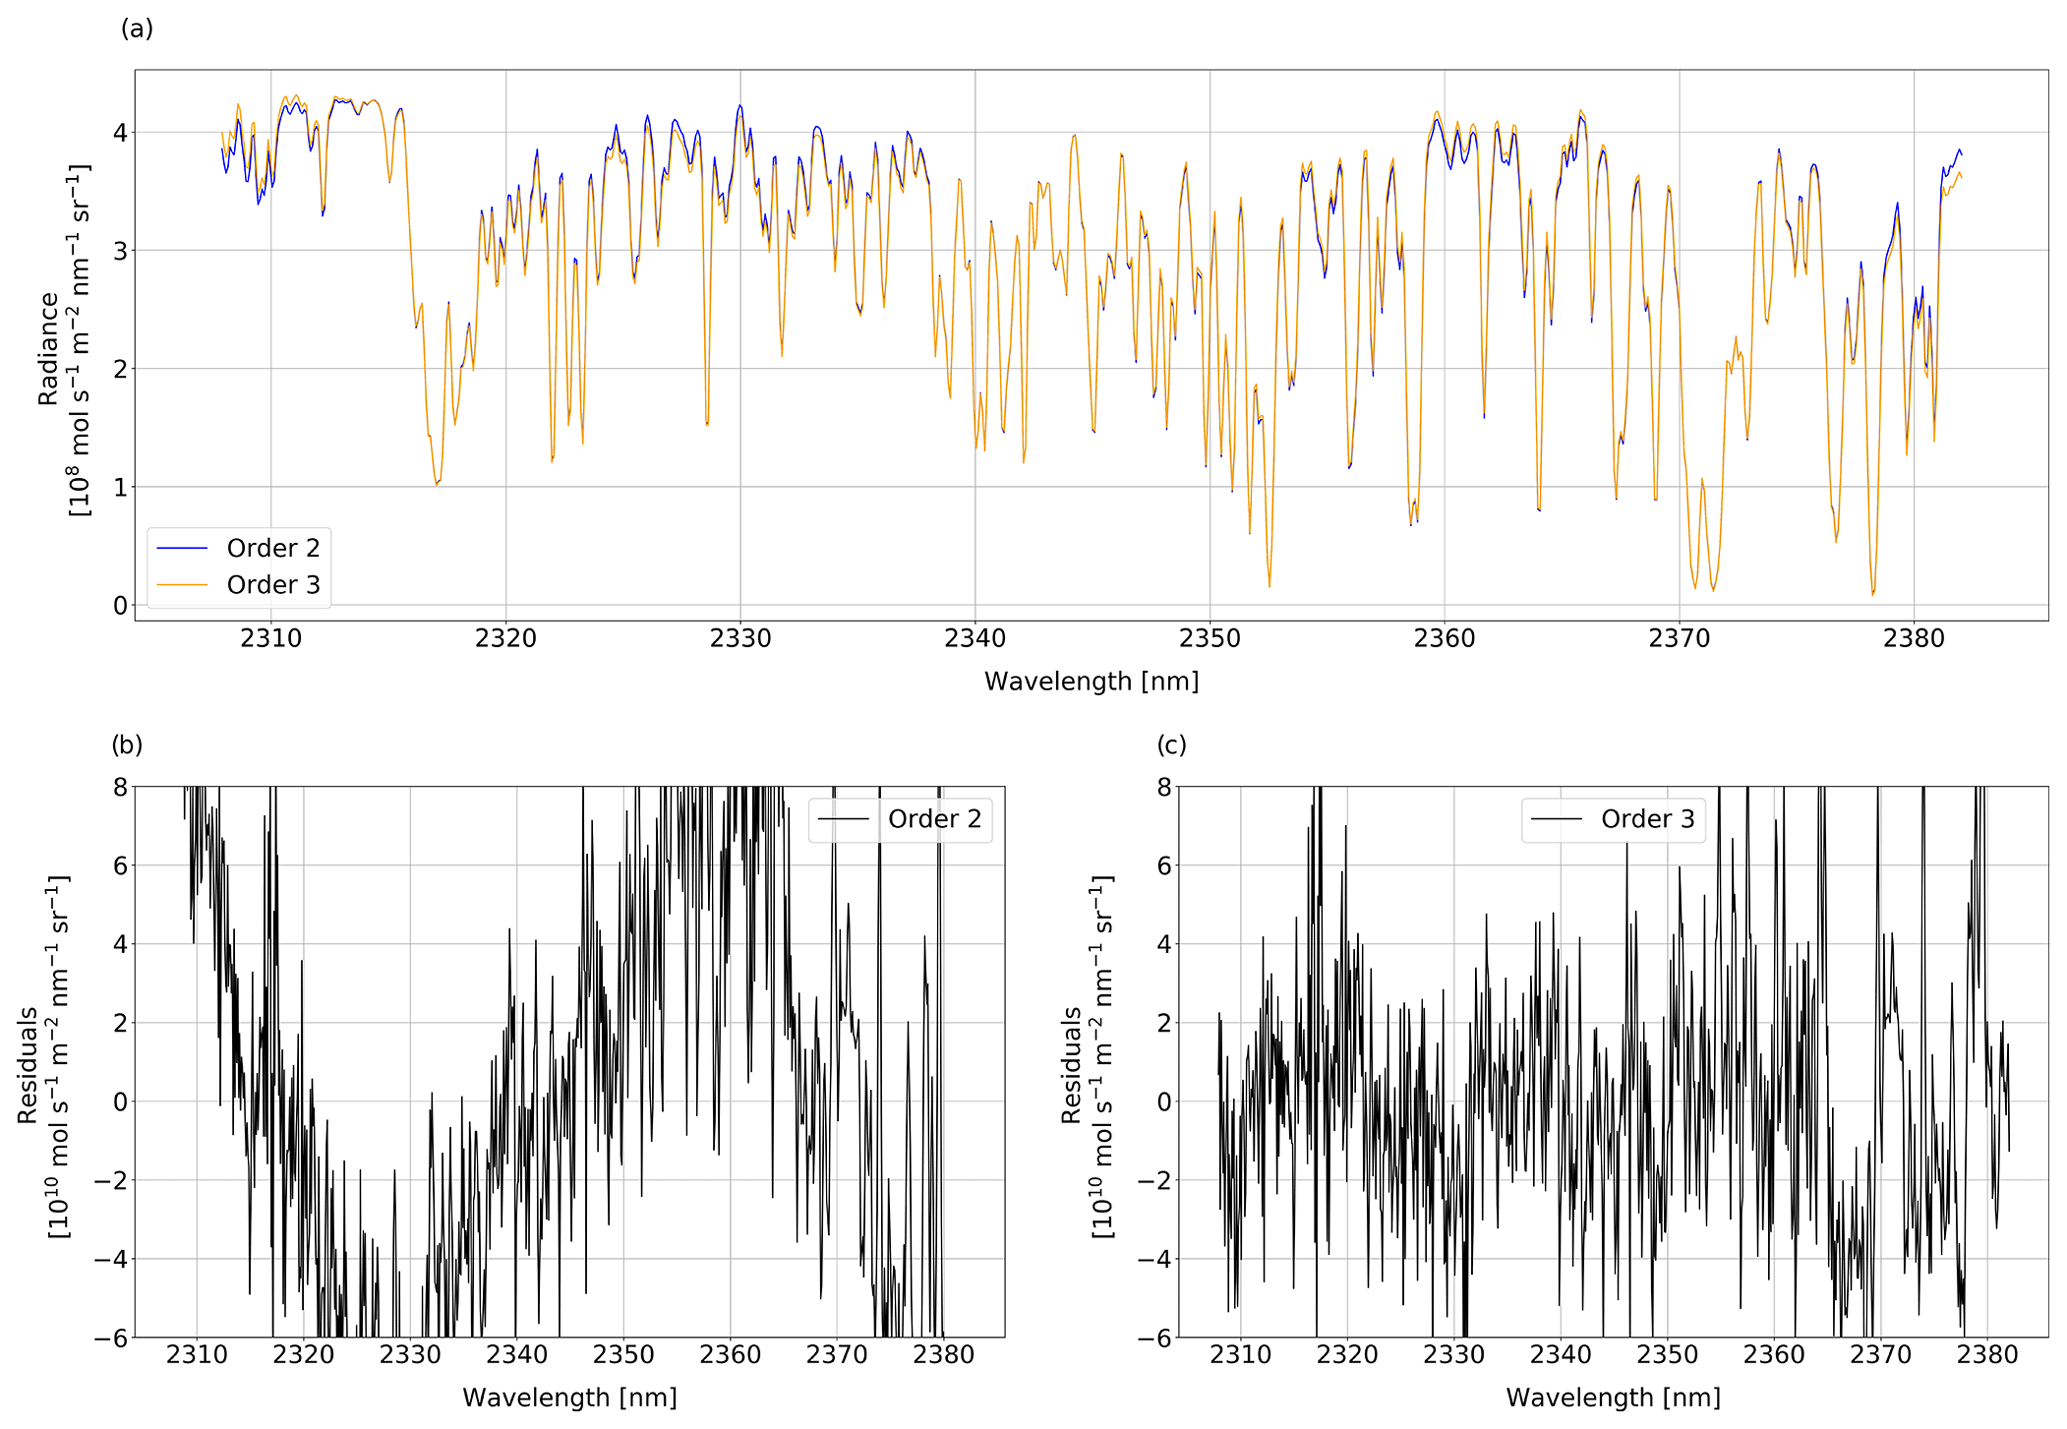
Figure 2(a) Radiance modelled with RemoTeC with a second- and third-order polynomial to characterize the surface reflectance spectral features and (b, c) the respective residuals (modelled minus measured radiance) for a pixel (523 369) in orbit 9147 over Siberia.

Figure 3(a, d, g) TROPOMI XCH4 retrieved with the third-order polynomial to characterize the surface spectral features; (b, e, h) XCH4 difference that shows XCH4 retrieved with second-order polynomial minus XCH4 retrieved with third-order polynomial; and (c, f, i) difference between χ2 value for the fit with second- minus third-order polynomial over (first row) the Siberian lowland region (64–77∘ N, 80–120∘ E), (second row) north-western Australia (11–23∘ S, 129–148∘ E), and (third row) north-western Algeria and eastern Tunisia (29–35∘ N, 3–10∘ E), averaged from March 2019–March 2020 to a 0.1∘ × 0.1∘ grid.
Figure 3 shows three examples of a regional TROPOMI XCH4 distribution for which the modified surface model using the third-order polynomial removes artificial XCH4 enhancements. For the Siberia case (first row) TROPOMI XCH4 shows a strong decrease over the outcrop of carbonate rocks (Fig. 3a, b). The average difference in XCH4 is greater than 1 % over the artefact. The fit significantly improves over the specific feature (Fig. 3c), implying that a third-order polynomial can better capture the surface reflectance spectral dependence of the underlying surface. The fact that the fit does not show an improvement outside the distinguishing feature means that a second-order polynomial is a good representation elsewhere.
The second example in Fig. 3 shows a region in north-western Australia. Again, artificial enhancements are removed when using the cubic function (Fig. 3d, e). Over this particular region, the underlying soil is composed of sedimentary carbonate (Petheram et al., 2018), and the XCH4 enhancement is also strongly correlated with the retrieved aerosol optical depth (not shown), which points to an interference between the surface spectral features and the representation of scattering processes in the forward model. An erroneous description of the surface reflectance is compensated by enhanced aerosol load, which enhances the atmospheric light path, leading to an overestimation in XCH4. This XCH4 enhancement could be misinterpreted as caused by emissions due to coal mining in the area. However, applying a third-order polynomial removes the localized XCH4 enhancement, and the fit significantly improves over the distinct feature.
The third example of Fig. 3 shows multiple artefacts over north-western Algeria and eastern Tunisia that are removed when using the third-order polynomial. Over this region, land cover is mostly bare rock and soil with some sparse grassland in the north. XCH4 artefacts are correlated with different types of surfaces, some of them being rock and soil composed mostly of carbonate and limestone minerals (Jones et al., 2013). Methane emissions from the oil and gas sector have been actively monitored over these regions using TROPOMI data, so removing the artefacts is extremely relevant to correctly pinpoint CH4 emitters. The Hassi R'Mel oil and gas field is just on the edge of one of the artefacts that has been removed with the new retrieval scheme (ΔXCH4 plot in Fig. 3h). XCH4 signals from plumes that blow towards the false enhancement because of specific wind conditions might get diffused within the enhancement and are therefore most probably classified as artefacts by plume-detection algorithms due to the high correlation with albedo. Hassi Messaoud is another major oil and gas field from which plumes are detected. It is located in areas where the change in XCH4 by the updated retrieval is not significant; therefore emission estimates from the field should not be affected. In the case of area emission estimation, the effect of the updated retrieval will depend on how the artefacts and uncertainty on the observations are characterized on the inversion schemes. As overall retrieved XCH4 is lower for the country of Algeria, estimated regional emissions with the new retrieval scheme may also be lower.
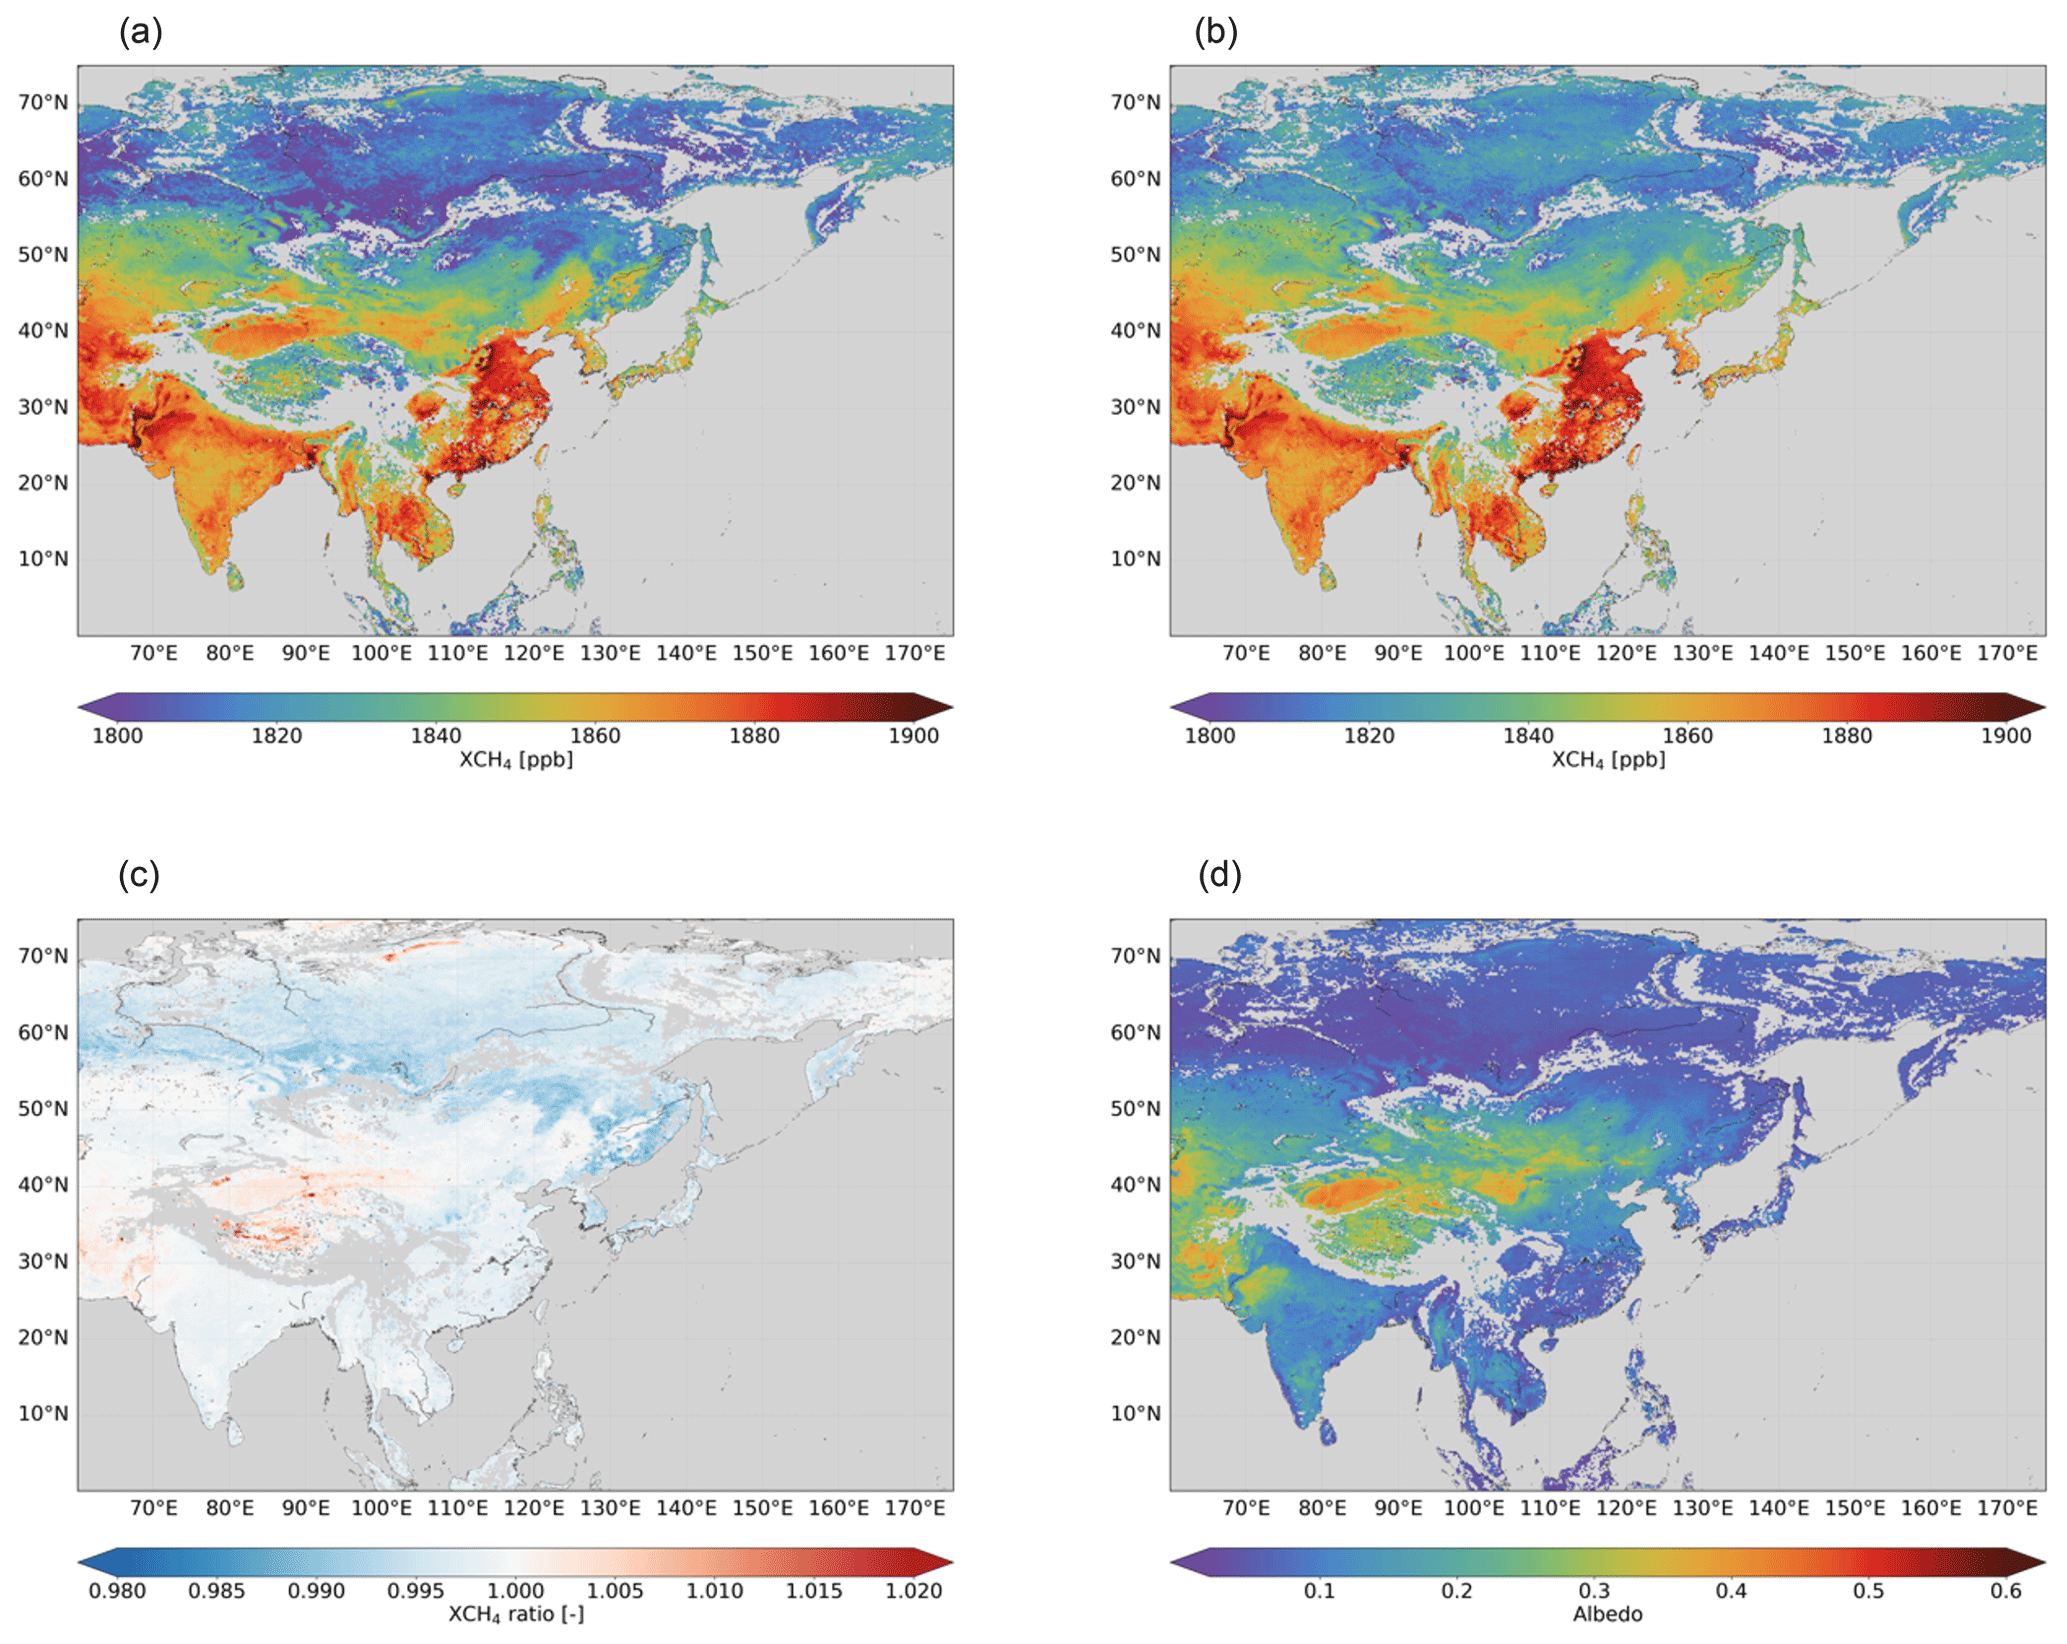
Figure 4TROPOMI XCH4 retrieved with (a) second- and (b) third-order polynomial to characterize the surface spectral features, (c) the ratio between XCH4 retrieved with second- and third-order polynomial, and (d) the retrieved surface albedo in the SWIR. Daily means in a 0.2∘ × 0.2∘ grid are averaged from September 2018–September 2020.
2.1.2 Regional and global effect
Next we analyse at regional and global scales the effect of the adjusted surface model to characterize surface spectral features. Figure 4 shows XCH4 over Asia retrieved with a second- and third-order polynomial, their ratio, and the SWIR surface albedo. The ratio shows clearly localized artefacts that are removed, for example, in several points in the Tibetan Plateau, and also over Siberia, as discussed in the previous section. Overall, the retrieved XCH4 is more homogeneous, particularly over high latitudes. Over the low-surface-albedo band around the 60∘ N latitude region, retrieved XCH4 is higher using a third-order polynomial function.
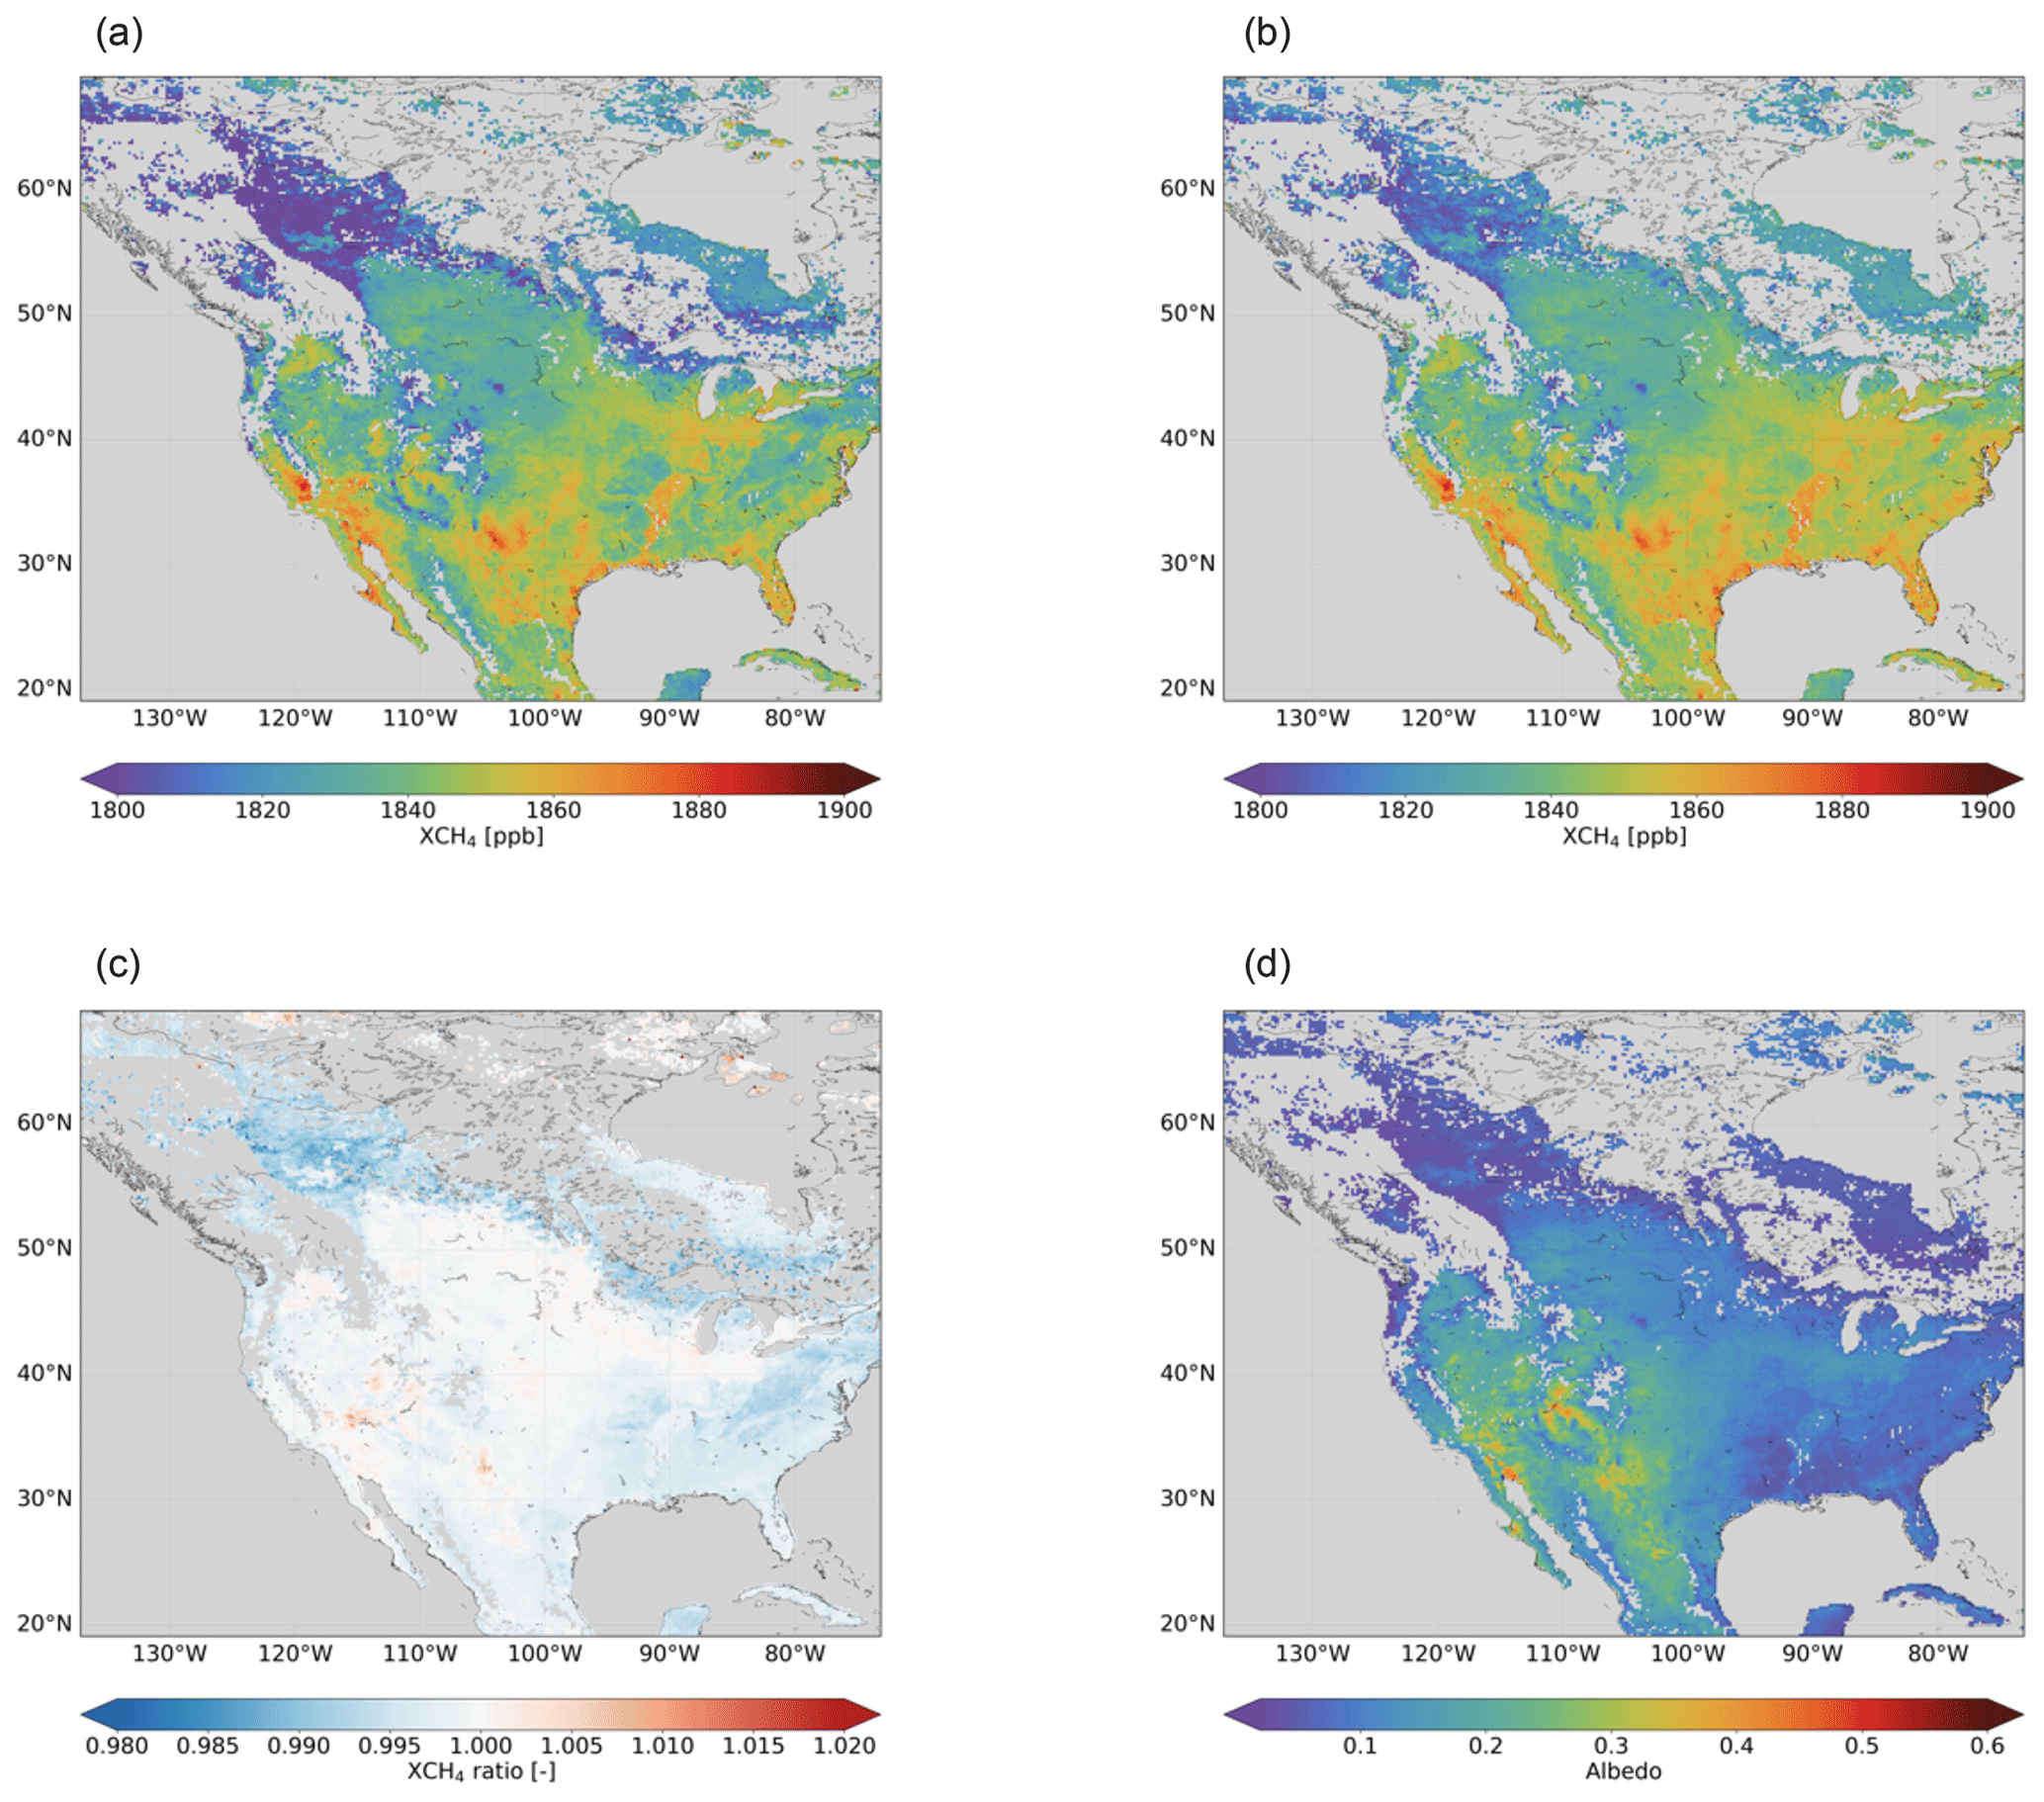
Figure 5TROPOMI XCH4 retrieved with (a) second- and (b) third-order polynomial to characterize the surface spectral features, (c) the ratio between XCH4 retrieved with second- and third-order polynomial, and (d) the retrieved surface albedo in the SWIR. Daily means in a 0.2∘ × 0.2∘ grid are averaged from September 2018–September 2020.
Similar effects can be seen over North America (Fig. 5). Localized artefacts on the northern part of the Delaware Basin are removed: this is relevant in order to attribute sources to individual locations in such large basins as the Permian using TROPOMI observations. Over the Interior Plains of Canada and the area surrounding the Grand Lakes, which are characterized by low surface albedo in the SWIR spectral band, retrieved XCH4 is higher in the new data product, as well as in the western part of the United States.
TROPOMI XCH4 shows an underestimation in areas with low surface albedo retrieved in the SWIR spectral range, for which we apply a posterior correction based on the “small-area approximation” (Lorente et al., 2021). When using the third-order polynomial to characterize surface spectral features in the forward model, the increase in retrieved XCH4 over the low-albedo regions reduces the low XCH4 bias. We define the bias as the ratio of a reference XCH4 value estimated for albedo values around 0.2 and the retrieved XCH4, following the approach in Lorente et al. (2021). Figure 6 shows the XCH4 bias as a function of surface albedo for XCH4 retrieved using the second- and third-order polynomial. The reduction of the XCH4 bias is significant for albedos below 0.1, up to 1 % for the lowest albedo values of 0.02. However, there is still a dependence of the retrieved XCH4 on albedo that we correct for. This implies that there is an additional error source which causes the albedo biases that needs to be further investigated.
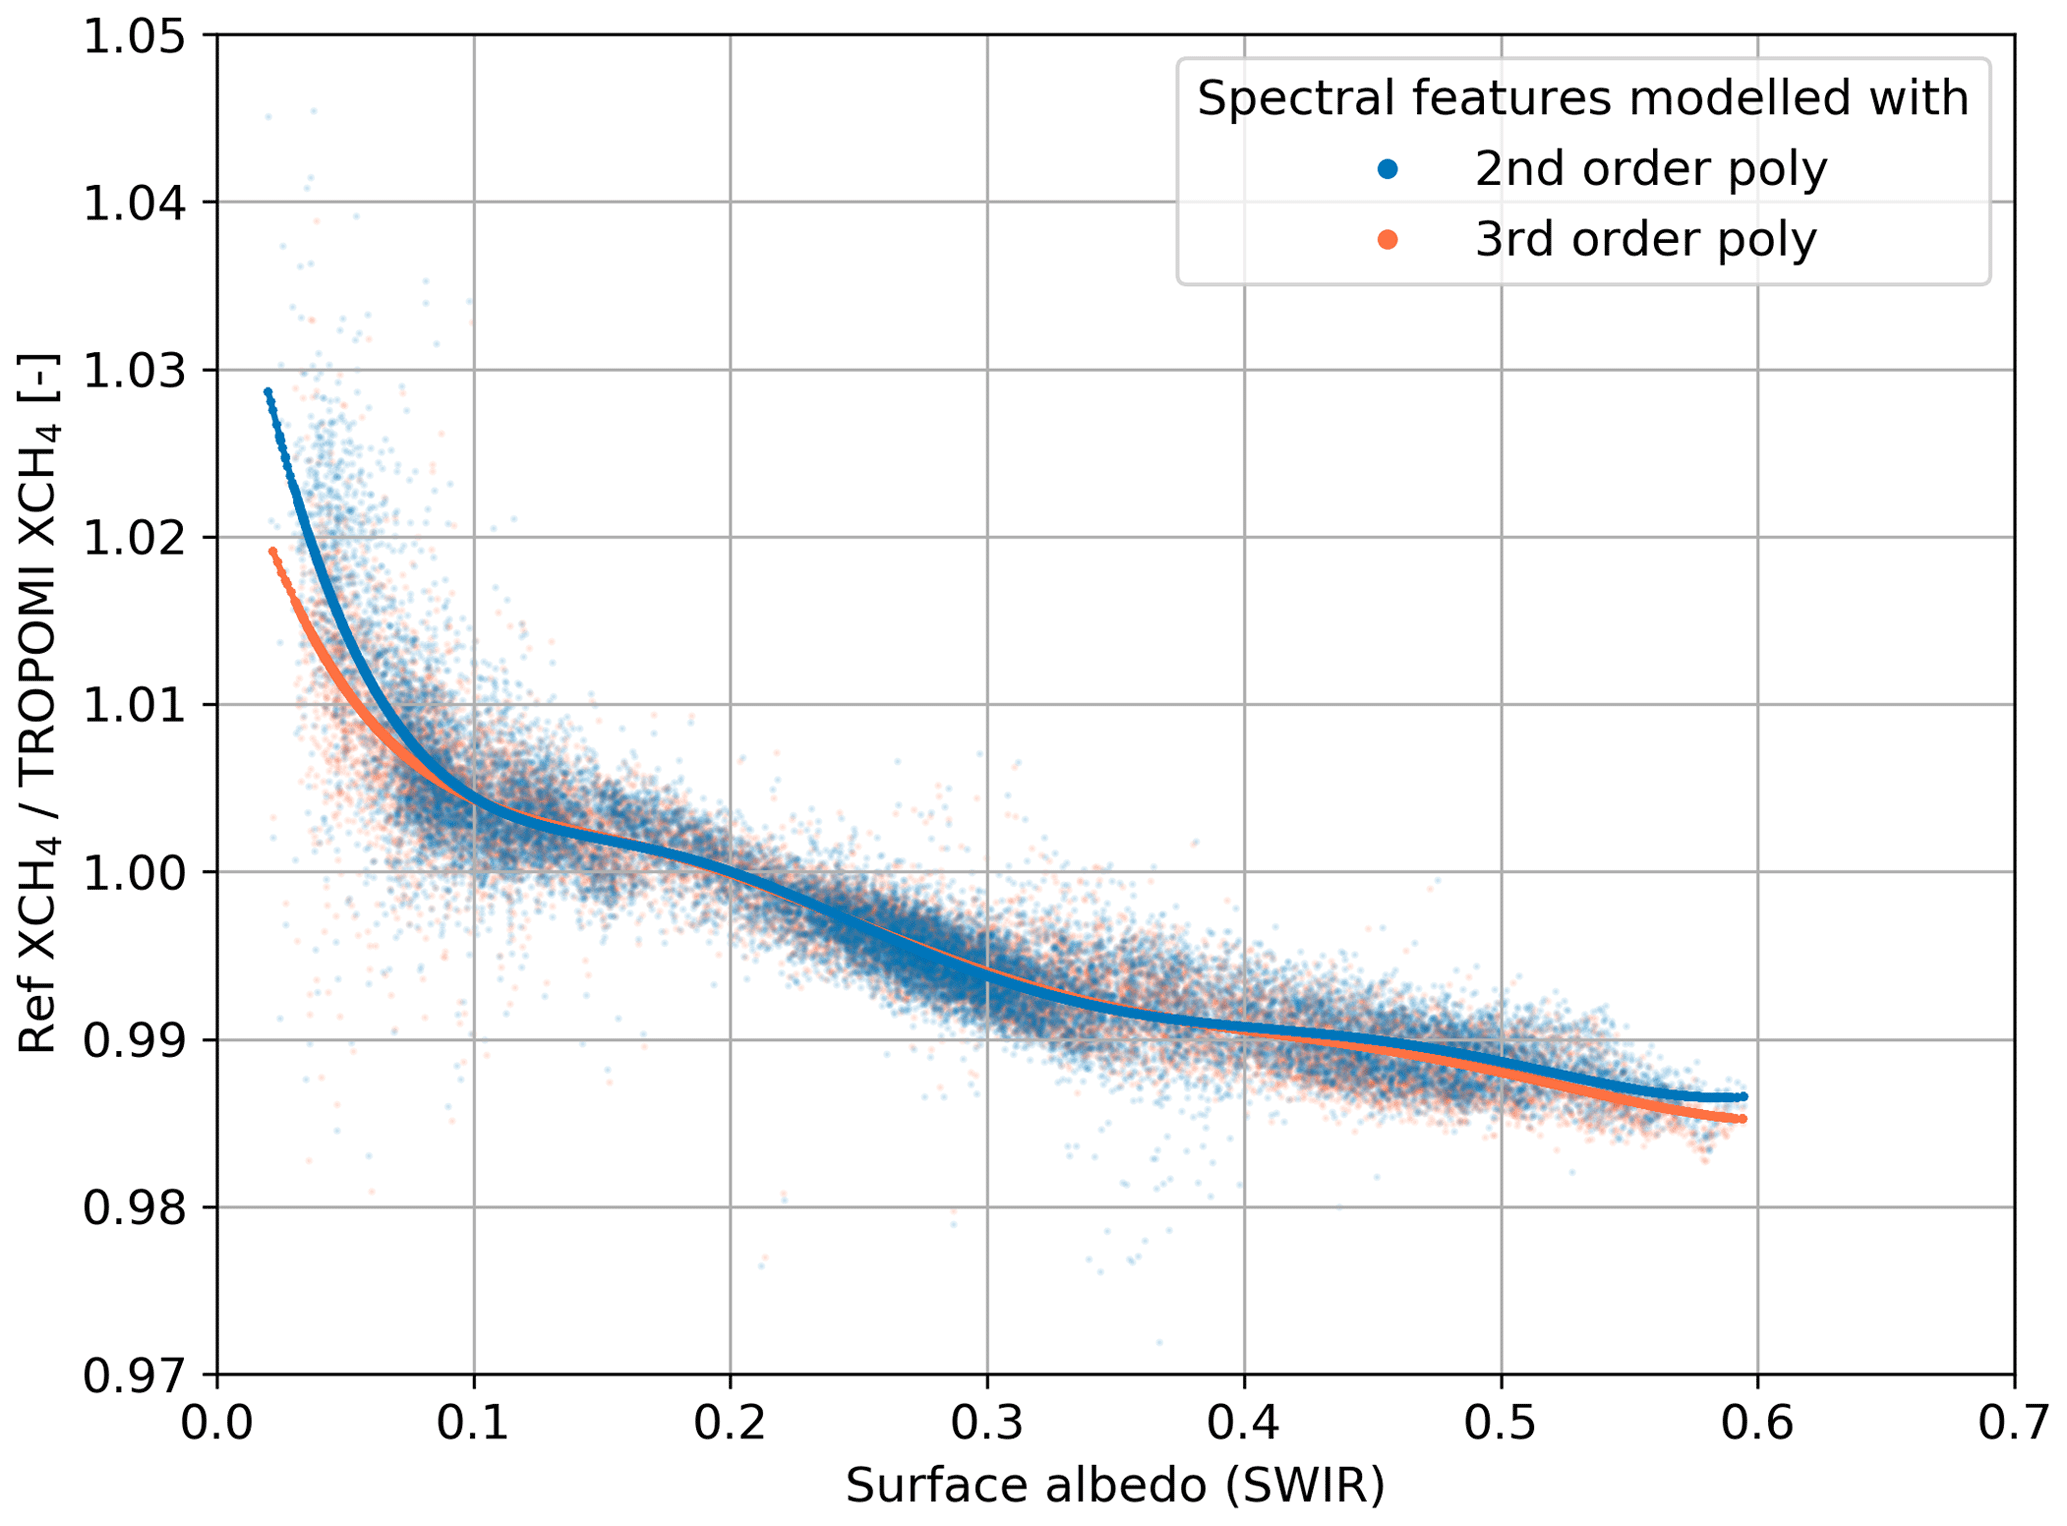
Figure 6Ratio of reference XCH4 to TROPOMI XCH4 as a function of the retrieved surface albedo for TROPOMI XCH4 retrieved using a second- (blue) and third-order (orange) polynomial to model the spectral surface features.
2.2 Validation
To assess the overall quality of the dataset, we perform the routine validation following Lorente et al. (2021, 2022a) using ground-based measurements from the TCCON and measurements from the GOSAT satellite.
2.2.1 TCCON
We validate the TROPOMI XCH4 dataset with ground-based measurements from the Total Carbon Column Observing Network (TCCON) (Wunch et al., 2011) (data version GGG2014, downloaded on 15 December 2021). TROPOMI XCH4 is collocated with a spatial radius of 300 km around each station and a temporal overlap of 2 h for the ground-based measurement and the satellite overpass. We average TROPOMI XCH4 and compare it to the TCCON XCH4, and for all individual paired collocations the mean bias of TROPOMI–TCCON XCH4 differences and its standard deviation is estimated. Then, we compute the average of the biases of all stations and its standard deviation as a measure of the station-to-station variability as a diagnostic parameter for the regional bias, following the approach in Lorente et al. (2021).
Table 1Overview of the validation results of TROPOMI XCH4 land measurements with measurements from the TCCON at selected stations. The table shows the number of collocations, mean bias and standard deviation for each station, and the mean bias for all stations, as well as the station-to-station variability. Results are shown for TROPOMI XCH4 with and without the albedo bias correction applied.
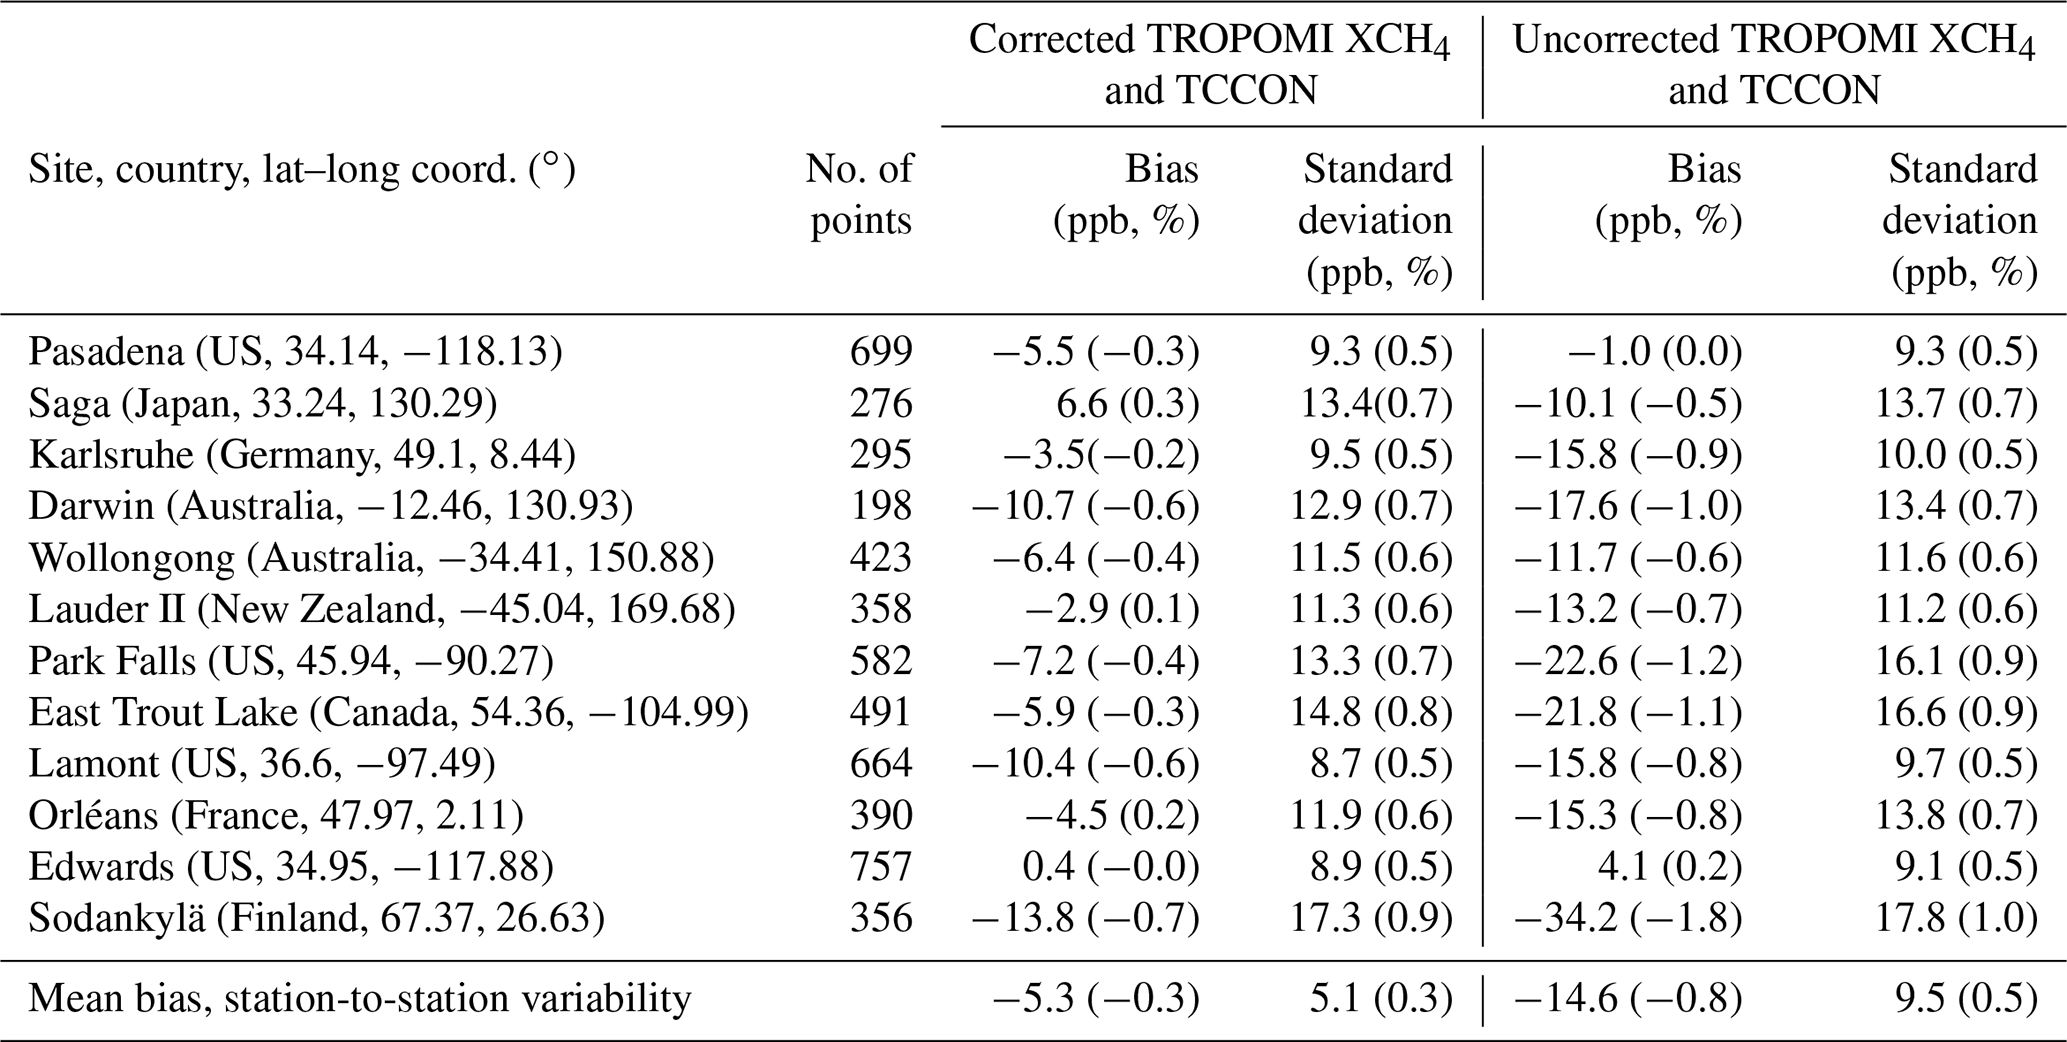
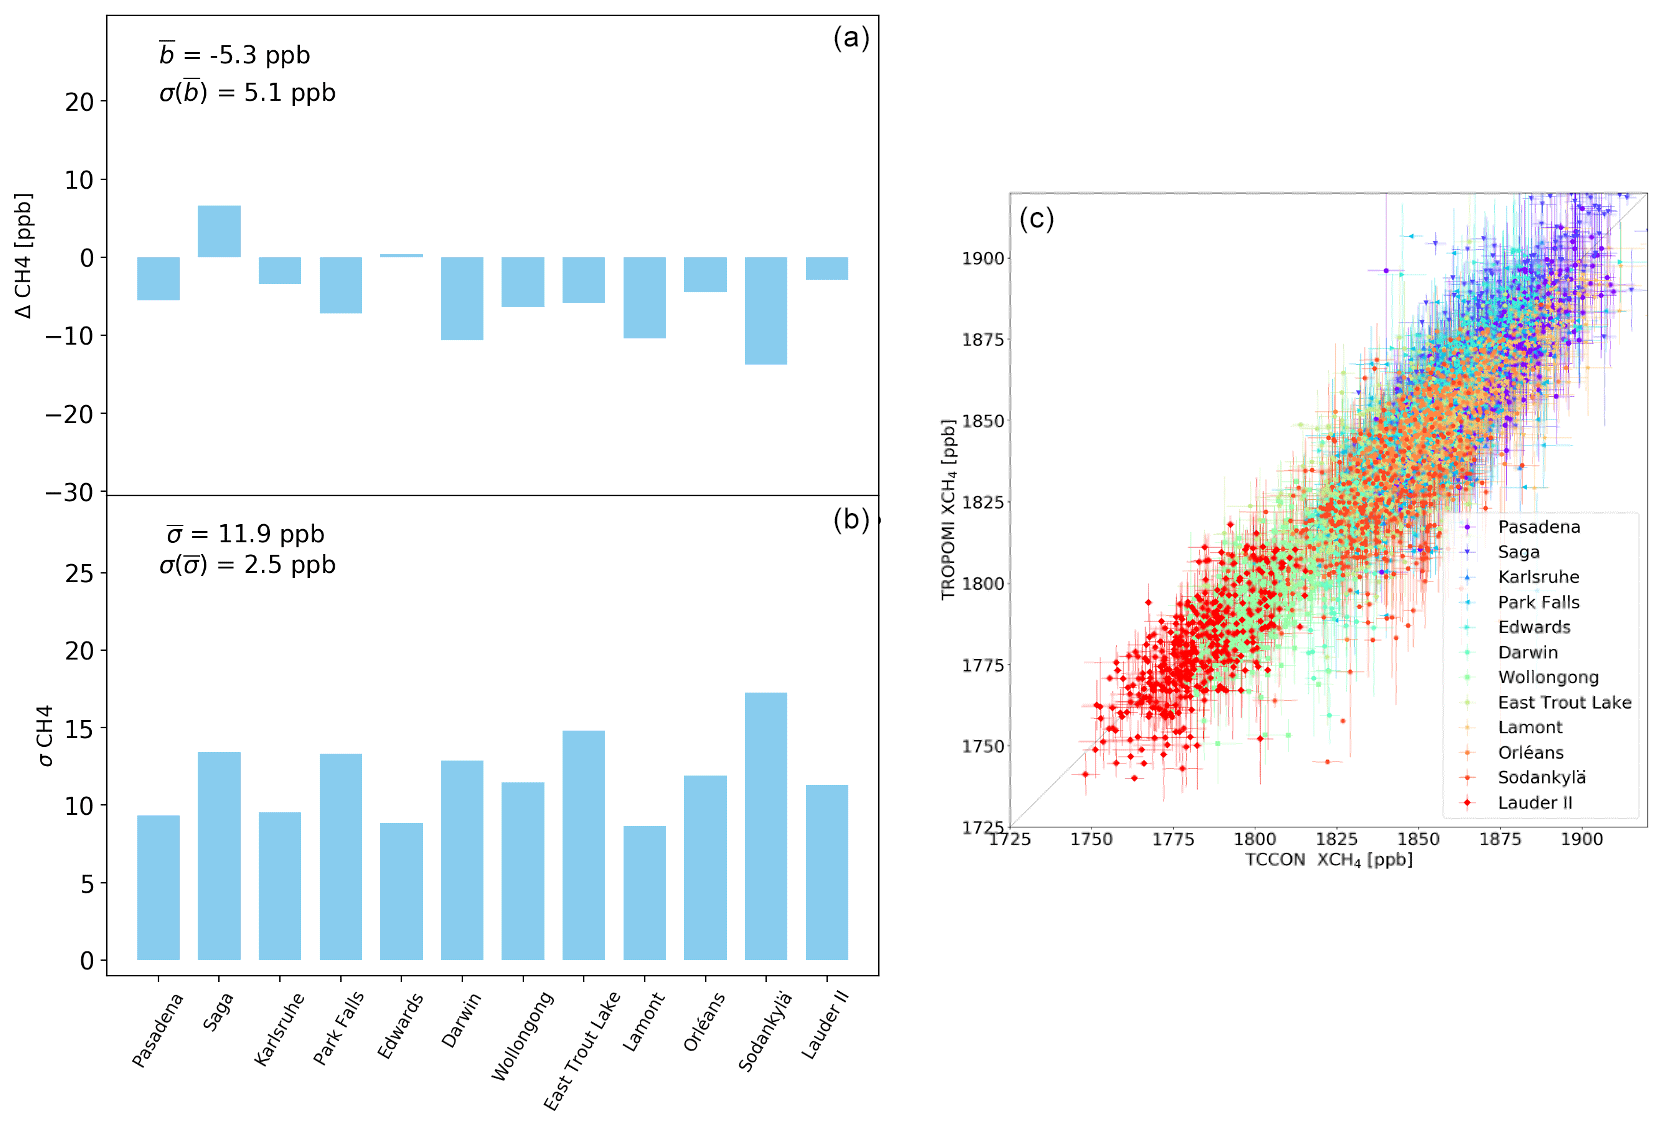
Figure 7(a) Mean differences between TROPOMI and TCCON XCH4 (ΔXCH4) and the standard deviation of the differences () for each of the stations selected for the validation. (b) Correlation of daily average XCH4 measured by TROPOMI and TCCON for all the stations. TROPOMI XCH4 with the albedo bias correction applied is shown.
The mean bias is below 1 % for all stations; the validation results are summarized in Table 1. The average bias for all stations is −0.3 % (−5.3 ppb), and the station-to-station variability is 0.3 % (5.1 ppb); both parameters are below the mission requirements of precision and accuracy below 1 % for TROPOMI XCH4 retrievals. Compared to the uncorrected TROPOMI XCH4 (e.g. without the albedo bias correction applied), the mean bias is reduced from −0.8 % to −0.3 %. Figure 7a shows the mean bias and the standard deviation for each of the stations, and Fig. 7b shows the correlation plot.
These validation results are of similar magnitude to the validation of TROPOMI XCH4 retrieved using a second-order polynomial (e.g. average bias of −5.4 ppb (−0.3 %) and station-to-station variability of 5.1 ppb (0.3 %); Lorente et al., 2022a). TCCON suggests an improvement of around 2–4 ppb in the bias and station-to-station variability when increasing to a third-order polynomial in the surface model. As the biggest changes with the new configuration occur at very localized scales, the improvement in the validation is small compared to the XCH4 decrease over the enhancements. TCCON stations are typically located over homogeneous and spectrally smooth surfaces, and none of the stations are close to any of the detected artefacts and, therefore, cannot capture the most significant changes in retrieved XCH4. This deficit of the TCCON representativeness adds to the lack of coverage for high-albedo regions and over the tropics, already pointed out by Guerlet et al. (2013) and Reuter et al. (2013) when trying to estimate regional uncertainty in satellite-retrieved CO2 concentrations.
2.2.2 GOSAT
In this section, we use XCH4 measurements by the Thermal And Near infrared Sensor for carbon Observation – Fourier Transform Spectrometer (TANSO–FTS) on board the Greenhouse gases Observing SATellite (GOSAT) satellite for the validation of TROPOMI XCH4 data. We use the GOSAT proxy XCH4 data product produced at the Netherlands Institute for Space Research (SRON) in the context of the ESA GreenHouse Gas Climate Change Initiative (GHG-CCI) project (Buchwitz et al., 2019, 2017). This XCH4 product is retrieved using the RemoTeC proxy retrieval algorithm.
We compare XCH4 retrieved from TROPOMI and GOSAT measurements for the period of March 2018–December 2020, and we compute the average of daily biases and its standard deviation between TROPOMI and GOSAT measurements gridded in a 2∘ × 2∘ grid. Globally on average, TROPOMI XCH4 is lower than GOSAT XCH4. The comparison leads to a bias after correction of −14.4 ± 15.9 ppb (−0.7 ± 0.8 %) and a Pearson's correlation coefficient of 0.87.
Similarly to the TCCON validation results, the comparison results for GOSAT are of similar magnitude to the comparison of TROPOMI XCH4 retrieved using a second-order polynomial (e.g. −13.8 ± 16.1 ppb (−0.7 ± 0.8 %); Lorente et al., 2022a). This again reflects the fact that the biggest changes in retrieved TROPOMI XCH4 using the adapted surface model in the retrieval happen at localized scales. Due to the GOSAT-reduced coverage compared to that of TROPOMI and the coarse grid used in the comparison, the effect on retrieved TROPOMI XCH4 is not reflected in the TROPOMI to GOSAT comparison.
The aim of the study was to improve the characterization of the surface reflectance spectral features in the forward model of the TROPOMI XCH4 retrieval algorithm. In the last few years, studies that analysed TROPOMI methane data, as well as an intercomparison between different scientific retrieval algorithms, pointed to a few false methane anomalies linked to features of the underlying surfaces. These anomalies can be misinterpreted as caused by emission sources (e.g. Froitzheim et al., 2021). We have shown that increasing the order of the polynomial that models the surface reflectance spectral dependence in the TROPOMI methane retrieval algorithm removes large localized methane artefacts and improves the resulting spectral fit.
Surface reflectance spectral dependence in the full-physics RemoTeC retrieval algorithm is modelled using a low-order polynomial in wavelength. Analysing the spectral information of distinct materials from the ECOSTRESS spectral library, we found that a quadratic function (i.e. second-order polynomial) was not optimal to represent the surface reflectance spectral dependencies of surface materials such as rock and concrete in the SWIR spectral range. In the particular case of the artefact over Siberia, where the underlying surface is composed mainly of carbonate rock, we find that the residuals for specific pixels over the strong XCH4 artefact have a strong dependency with wavelength. When increasing the order of the polynomial that characterizes the surface reflectance spectral dependency in the forward model from second to third, this dependency of the residuals was significantly reduced.
With the improved forward model, we showed that the artificial localized XCH4 enhancements found in several locations like Siberia, Australia and Algeria were caused by surface reflectance spectral features. Some of the artefacts were located close to regions with known emissions due to oil, gas and coal extraction activities, so they could be easily misinterpreted as caused by “real” methane sources. The use of a third-order polynomial removed these artificial XCH4 enhancements and significantly improved the fit over these specific features. Outside the specific features, the spectral fit did not show such substantial improvements, reflecting the fact that a second-order polynomial is sufficient to capture the spectral dependencies of most surfaces, given the characteristics of TROPOMI. We also tested increasing the order of the polynomial to higher degrees, but the retrieved parameters showed undesired behaviour outside the specific areas where the XCH4 artefacts were found, including a worsening of the spectral fit. Based on these results, we apply the third-order polynomial for the surface reflectance spectral dependency globally.
The analysis at regional and global scales of the effect of using the improved characterization of the surface spectral features shows that over low-surface-albedo areas (e.g. regions around the 60∘ N latitude on the Asian continent) retrieved XCH4 is higher. As a consequence, the known bias in retrieved XCH4 for low-albedo scenes slightly improves, but still, a posterior correction needs to be applied. This implies that even if the bias for scenes with low albedo becomes weaker, there is still an error source which causes systematic albedo biases that needs to be further investigated.
Finally, we assess the quality of the dataset after applying the third-order polynomial, performing the routine validation with TCCON and GOSAT. GOSAT comparison does not significantly improve, while TCCON validation results show an improvement in some stations of 2–4 ppb, significantly smaller than the artefacts that can be as high as 20–40 ppb. The reason is that TCCON stations are typically located around spectrally smooth surfaces, not close to any of the locations where the improved effect has the biggest impacts. This reflects the limitations of the TCCON stations as a validation network, as it does not represent the heterogeneous conditions found by global observing systems like TROPOMI. Given the rapid development of Earth observation technologies, and with several global missions going to be launched in the next decade, validation approaches need to be reassessed to have a reliable system.
The TROPOMI CH4 dataset retrieved with the third-order polynomial to account for the surface reflectance spectral features corresponds to version 19_446 of the SRON scientific algorithm and is available for download at https://doi.org/10.5281/zenodo.7766558 (data also available at: https://ftp.sron.nl/open-access-data-2/TROPOMI/tropomi/ch4/19_446/, last access: 24 March 2023; Lorente et al., 2023) version 19_446. This improved algorithm was implemented in the operational retrieval algorithm with the processor version 02.04.00 in July 2022.
AL, TB, MCMV and JL provided the TROPOMI CH4 retrieval and data analysis. AL wrote the original draft, and all authors discussed the results and reviewed and edited the paper.
The contact author has declared that none of the authors has any competing interests.
The presented work has been performed in the frame of Sentinel-5 Precursor Validation Team (S5PVT) or Level 1/Level 2 Product Working Group activities. Results are based on preliminary (not fully calibrated or validated) Sentinel-5 Precursor data that will still change. The results are based on S5P L1B version 1 data. Plots and data contain modified Copernicus Sentinel data, processed by SRON.
Publisher’s note: Copernicus Publications remains neutral with regard to jurisdictional claims in published maps and institutional affiliations.
The TROPOMI data processing was carried out on the Dutch National e-Infrastructure with the support of the SURF cooperative.
This research has been supported through the TROPOMI national programme by funding from the Netherlands Space Office (NSO) and the European Space Agency's (ESA) Methane+ project.
This paper was edited by Sandip Dhomse and reviewed by two anonymous referees.
Barré, J., Aben, I., Agustí-Panareda, A., Balsamo, G., Bousserez, N., Dueben, P., Engelen, R., Inness, A., Lorente, A., McNorton, J., Peuch, V.-H., Radnoti, G., and Ribas, R.: Systematic detection of local CH4 anomalies by combining satellite measurements with high-resolution forecasts, Atmos. Chem. Phys., 21, 5117–5136, https://doi.org/10.5194/acp-21-5117-2021, 2021. a, b
Buchwitz, M., Reuter, M., Schneising, O., Hewson, W., Detmers, R. G., Boesch, H., Hasekamp, O., Aben, I., Bovensmann, H., Burrows, J., Butz, A., Chevallier, F., Dils, B., Frankenberg, C., Heymann, J., Lichtenberg, G., De Mazière, M., Notholt, J., Parker, R., Warneke, T., Zehner, C., Griffith, D. W. T., Deutscher, N., Kuze, A., Suto, H., and Wunch, D.: Global satellite observations of column-averaged carbon dioxide and methane: The GHG-CCI XCO2 and XCH4 CRDP3 data set, Remote Sens. Environ., 203, 276–295, https://doi.org/10.1016/j.rse.2016.12.027, 2017. a
Buchwitz, M., Aben, I., Armante, R., Boesch, H., Crevoisier, C., Di Noia, A., Hasekamp, O. P., Reuter, M., Schneising-Weigel, O., and Wu, L.: Algorithm Theoretical Basis Document (ATBD) – Main document for Greenhouse Gas (GHG: CO2 and CH4) data set CDR 3 (2003–2018), C3S project, Copernicus Climate Change Service, Project number: C3S_D312b_Lot2.1.3.2-v1.0_ATBD-GHG_MAIN_v3.1, 43 pp., https://www.iup.uni-bremen.de/carbon_ghg/docs/C3S/CDR3_2003-2018/ATBD/C3S_D312b_Lot2.1.3.2-v1.0_ATBD-GHG_MAIN_v3.1.pdf (last access: 27 March 2023), 2019. a
Chen, Z., Jacob, D. J., Nesser, H., Sulprizio, M. P., Lorente, A., Varon, D. J., Lu, X., Shen, L., Qu, Z., Penn, E., and Yu, X.: Methane emissions from China: a high-resolution inversion of TROPOMI satellite observations, Atmos. Chem. Phys., 22, 10809–10826, https://doi.org/10.5194/acp-22-10809-2022, 2022. a
Froitzheim, N., Majka, J., and Zastrozhnov, D.: Methane release from carbonate rock formations in the Siberian permafrost area during and after the 2020 heat wave, P. Natl. Acad. Sci. USA, 118, e2107632118, https://doi.org/10.1073/pnas.2107632118, 2021. a, b, c, d
Guerlet, S., Butz, A., Schepers, D., Basu, S., Hasekamp, O. P., Kuze, A., Yokota, T., Blavier, J., Deutscher, N. M., Griffith, D. W., Hase, F., Kyro, E., Morino, I., Sherlock, V., Sussmann, R., Galli, A., and Aben, I.: Impact of aerosol and thin cirrus on retrieving and validating XCO2 from GOSAT shortwave infrared measurements, J. Geophys. Res.-Atmos., 118, 4887–4905, https://doi.org/10.1002/jgrd.50332, 2013. a
Hu, H., Hasekamp, O., Butz, A., Galli, A., Landgraf, J., Aan de Brugh, J., Borsdorff, T., Scheepmaker, R., and Aben, I.: The operational methane retrieval algorithm for TROPOMI, Atmos. Meas. Tech., 9, 5423–5440, https://doi.org/10.5194/amt-9-5423-2016, 2016. a, b, c
Jones, A., Breuning-Madsen, H., Brossard, M., Dampha, A., Deckers, J., Dewitte, O., Gallali, T., Hallett, S., Jones, R., Kilasara, M.and Le Roux, P., Micheli, E., Montanarella, L., Spaargaren, O., Thiombiano, L., Van Ranst, E., Yemefack, M., and Zougmore, R.: Soil Atlas of Africa, Publications Office of the European Union, 176 pp., https://doi.org/10.2788/52319, 2013. a
Jongaramrungruang, S., Matheou, G., Thorpe, A. K., Zeng, Z.-C., and Frankenberg, C.: Remote sensing of methane plumes: instrument tradeoff analysis for detecting and quantifying local sources at global scale, Atmos. Meas. Tech., 14, 7999–8017, https://doi.org/10.5194/amt-14-7999-2021, 2021. a, b
Landgraf, J., Hasekamp, O. P., Box, M. A., and Trautmann, T.: A linearized radiative transfer model for ozone profile retrieval using the analytical forward-adjoint perturbation theory approach, J. Geophys. Res.-Atmos., 106, 27291–27305, https://doi.org/10.1029/2001JD000636, 2001. a
Lorente, A., Borsdorff, T., Butz, A., Hasekamp, O., aan de Brugh, J., Schneider, A., Wu, L., Hase, F., Kivi, R., Wunch, D., Pollard, D. F., Shiomi, K., Deutscher, N. M., Velazco, V. A., Roehl, C. M., Wennberg, P. O., Warneke, T., and Landgraf, J.: Methane retrieved from TROPOMI: improvement of the data product and validation of the first 2 years of measurements, Atmos. Meas. Tech., 14, 665–684, https://doi.org/10.5194/amt-14-665-2021, 2021. a, b, c, d, e, f
Lorente, A., Borsdorff, T., Martinez-Velarte, M. C., Butz, A., Hasekamp, O. P., Wu, L., and Landgraf, J.: Evaluation of the methane full-physics retrieval applied to TROPOMI ocean sun glint measurements, Atmos. Meas. Tech., 15, 6585–6603, https://doi.org/10.5194/amt-15-6585-2022, 2022a. a, b, c, d
Lorente, A., Buchwitz, M., Borsdorff, T., and Schneising, O.: Validation Report – SWIR, https://methaneplus.eu/#docs (last access: 14 March 2023), 2022b. a
Lorente, A., Borsdorff, T., Martinez Velarte, M. C., and Landgraf, J.: SRON S5P – RemoTeC scientific TROPOMI XCH4 dataset v19_446, Zenodo [data set], https://doi.org/10.5281/zenodo.7766558, 2023. a
Lunt, M. F., Palmer, P. I., Feng, L., Taylor, C. M., Boesch, H., and Parker, R. J.: An increase in methane emissions from tropical Africa between 2010 and 2016 inferred from satellite data, Atmos. Chem. Phys., 19, 14721–14740, https://doi.org/10.5194/acp-19-14721-2019, 2019. a
Maasakkers, J. D., Varon, D. J., Elfarsdóttir, A., McKeever, J., Jervis, D., Mahapatra, G., Pandey, S., Lorente, A., Borsdorff, T., Foorthuis, L. R., Schuit, B. J., Tol, P., van Kempen, T. A., van Hees, R., and Aben, I.: Using satellites to uncover large methane emissions from landfills, Sci. Adv., 8, eabn9683, https://doi.org/10.1126/sciadv.abn9683, 2022. a
Meerdink, S. K., Hook, S. J., Roberts, D. A., and Abbott, E. A.: The ECOSTRESS spectral library version 1.0, Remote Sens. Environ., 230, 111196, https://doi.org/10.1016/j.rse.2019.05.015, 2019. a
Petheram, C., Gallant, J., Stone, P., Wilson, P., and Read, A.: Rapid assessment of potential for development of large dams and irrigation across continental areas: application to northern Australia, Rangeland J., 40, 431–449, https://doi.org/10.1071/RJ18012, 2018. a
Qu, Z., Jacob, D. J., Shen, L., Lu, X., Zhang, Y., Scarpelli, T. R., Nesser, H., Sulprizio, M. P., Maasakkers, J. D., Bloom, A. A., Worden, J. R., Parker, R. J., and Delgado, A. L.: Global distribution of methane emissions: a comparative inverse analysis of observations from the TROPOMI and GOSAT satellite instruments, Atmos. Chem. Phys., 21, 14159–14175, https://doi.org/10.5194/acp-21-14159-2021, 2021. a
Reuter, M., Bösch, H., Bovensmann, H., Bril, A., Buchwitz, M., Butz, A., Burrows, J. P., O'Dell, C. W., Guerlet, S., Hasekamp, O., Heymann, J., Kikuchi, N., Oshchepkov, S., Parker, R., Pfeifer, S., Schneising, O., Yokota, T., and Yoshida, Y.: A joint effort to deliver satellite retrieved atmospheric CO2 concentrations for surface flux inversions: the ensemble median algorithm EMMA, Atmos. Chem. Phys., 13, 1771–1780, https://doi.org/10.5194/acp-13-1771-2013, 2013. a
Sadavarte, P., Pandey, S., Maasakkers, J. D., Lorente, A., Borsdorff, T., Denier van der Gon, H., Houweling, S., and Aben, I.: Methane Emissions from Superemitting Coal Mines in Australia Quantified Using TROPOMI Satellite Observations, Environ. Sci. Technol., 55, 16573–16580, https://doi.org/10.1021/acs.est.1c03976, 2021. a
Schepers, D., aan de Brugh, J., Hahne, P., Butz, A., Hasekamp, O., and Landgraf, J.: LINTRAN v2.0: A linearised vector radiative transfer model for efficient simulation of satellite-born nadir-viewing reflection measurements of cloudy atmospheres, J. Quant. Spectrosc. Ra., 149, 347–359, 2014. a
Sha, M. K., Langerock, B., Blavier, J.-F. L., Blumenstock, T., Borsdorff, T., Buschmann, M., Dehn, A., De Mazière, M., Deutscher, N. M., Feist, D. G., García, O. E., Griffith, D. W. T., Grutter, M., Hannigan, J. W., Hase, F., Heikkinen, P., Hermans, C., Iraci, L. T., Jeseck, P., Jones, N., Kivi, R., Kumps, N., Landgraf, J., Lorente, A., Mahieu, E., Makarova, M. V., Mellqvist, J., Metzger, J.-M., Morino, I., Nagahama, T., Notholt, J., Ohyama, H., Ortega, I., Palm, M., Petri, C., Pollard, D. F., Rettinger, M., Robinson, J., Roche, S., Roehl, C. M., Röhling, A. N., Rousogenous, C., Schneider, M., Shiomi, K., Smale, D., Stremme, W., Strong, K., Sussmann, R., Té, Y., Uchino, O., Velazco, V. A., Vigouroux, C., Vrekoussis, M., Wang, P., Warneke, T., Wizenberg, T., Wunch, D., Yamanouchi, S., Yang, Y., and Zhou, M.: Validation of methane and carbon monoxide from Sentinel-5 Precursor using TCCON and NDACC-IRWG stations, Atmos. Meas. Tech., 14, 6249–6304, https://doi.org/10.5194/amt-14-6249-2021, 2021. a
Shen, L., Gautam, R., Omara, M., Zavala-Araiza, D., Maasakkers, J. D., Scarpelli, T. R., Lorente, A., Lyon, D., Sheng, J., Varon, D. J., Nesser, H., Qu, Z., Lu, X., Sulprizio, M. P., Hamburg, S. P., and Jacob, D. J.: Satellite quantification of oil and natural gas methane emissions in the US and Canada including contributions from individual basins, Atmos. Chem. Phys., 22, 11203–11215, https://doi.org/10.5194/acp-22-11203-2022, 2022. a
Wunch, D., Toon, G. C., Blavier, J.-F. L., Washenfelder, R. A., Notholt, J., Connor, B. J., Griffith, D. W. T., Sherlock, V., and Wennberg, P. O.: The Total Carbon Column Observing Network, Philos. T. Roy. Soc. A, 369, 2087–2112, https://doi.org/10.1098/rsta.2010.0240, 2011. a
The requested paper has a corresponding corrigendum published. Please read the corrigendum first before downloading the article.
- Article
(10441 KB) - Full-text XML