the Creative Commons Attribution 4.0 License.
the Creative Commons Attribution 4.0 License.
 | 30 Mar 2023
Online measurement of highly oxygenated compounds from organic aerosol
Jian Zhao
Frans Graeffe
Nicolas Fauré
Jordan E. Krechmer
Douglas Worsnop
Hilkka Timonen
Mikael Ehn
Juha Kangasluoma
Highly oxygenated compounds are important contributors to the formation and growth of atmospheric organic aerosol and thus have an impact on Earth’s radiation balance and global climate. However, knowledge of the contribution of highly oxygenated compounds to organic aerosol and their fate after condensing into the particle phase has been limited by the lack of suitable detection techniques. Here, we present a new online method for measuring highly oxygenated compounds from organic aerosol. The method includes thermal evaporation of particles in a new inlet, the vaporization inlet for aerosols (VIA), followed by identification of the evaporated highly oxygenated compounds by a nitrate chemical ionization mass spectrometer (NO3-CIMS). The method does not require sample collection, enabling highly time-resolved measurements of particulate compounds. We evaluate the performance of the method by measuring the detection limit and performing background measurements. We estimate a detection limit of below 1 ng m−3 for a single compound and below 1 µg m−3 for SOA with the sampling setup used here. These detection limits can be improved upon by optimizing the flow setup. Furthermore, we detect hundreds of particulate highly oxygenated compounds from organic aerosol generated from different precursors. Our results are consistent with previous studies showing that the volatility of organic compounds decreases with increasing ratio and level of oxygenation and that organic aerosol consists of monomers and oligomeric compounds. By comparing the gas- and particle-phase compounds, we found indications of potential particle-phase reactions occurring in organic aerosol. Future work will focus both on further improving the sampling design and on better understanding the evaporation dynamics of the system, but already these initial tests show that the VIA coupled to the NO3-CIMS is a promising method for investigating the transformations and fate of the compounds after condensing into the particle phase.
- Article
(5125 KB) - Full-text XML
- BibTeX
- EndNote


Atmospheric aerosol particles influence Earth's climate by scattering or absorbing solar radiation and by altering cloud properties (Carslaw et al., 2013). Secondary organic aerosol (SOA), formed in the atmosphere from gas-to-particle conversions, contributes a large fraction to the submicron tropospheric aerosol (Jimenez et al., 2009). SOA is produced by the oxidation of volatile organic compounds (VOCs), and it is a complex system consisting of many individual organic compounds partitioning between the gas and the particle phase. Only a small fraction of the compounds within SOA are identified, leading to large uncertainties in estimating the climate impacts of SOA (Hallquist et al., 2009; Glasius and Goldstein, 2016).
Recently, it was discovered that some VOCs form highly oxygenated organic molecules (HOMs) via a process called autoxidation (Crounse et al., 2013). These molecules are estimated to explain a large fraction of SOA formation due to their low volatilities (Ehn et al., 2014; Kirkby et al., 2016). While HOMs are extensively studied and observed in the gas phase, their fate after condensing into the particle phase is poorly characterized due to limitations in the measurement techniques. Simply studying the condensing compounds is not enough, owing to potential chemical reactions taking place within the particles. These reactions can lead to changes in the chemical composition and properties of SOA, thus affecting its formation and evolution in the atmosphere. It has been suggested that after condensation, HOMs either remain in the particle phase without structural changes, undergo fragmentation reactions, or undergo accretion reactions (Mutzel et al., 2015; Bianchi et al., 2019). To improve our understanding of the aerosol formation and growth processes that influence Earth’s radiation balance and global climate, a suitable method for measuring the highly oxygenated compounds from organic aerosol is needed.
Chemical ionization mass spectrometry is the main tool for the detection of gas-phase oxygenated organic compounds (Lee et al., 2014; Ehn et al., 2014; Riva et al., 2019b). In order to make the particle-phase molecules detectable with a mass spectrometer, they need to be converted to gas-phase ions. Offline or semi-online thermal desorption methods are commonly used to measure particle-phase compounds. Smith et al. (2004) presented the thermal desorption chemical ionization mass spectrometer (TDCIMS) for measuring the composition of sub-20 nm aerosol. They use an aerosol charger to collect ambient particles on a wire in an electrostatic precipitator, which is then heated, and the evaporated compounds are analyzed with a chemical ionization mass spectrometer. Another instrument utilizing particle collection, the filter inlet for gases and aerosol (FIGAERO) (Lopez-Hilfiker et al., 2014), is used to analyze the aerosol composition by collecting sample aerosol on a PTFE filter and desorbing the collected sample with heated N2 flow. In addition to these, thermal desorption is also utilized in the chemical analysis of the aerosol online (CHARON) inlet (Eichler et al., 2015). It consists of a gas-phase denuder for removal of the gas-phase compounds, an aerodynamic lens for particle collimation, and a thermodesorption unit for particle evaporation. The evaporated compounds can be analyzed with low-pressure gas analyzers. The recently developed extractive electrospray ionization time-of-flight mass spectrometer (EESI-TOF) (Lopez-Hilfiker et al., 2019) is an online method for aerosol analysis without thermal desorption. In the EESI-TOF, the sample particles collide with charged electrospray droplets, and the soluble compounds are extracted and ionized as the electrospray solvent evaporates.
Here, we present an online thermal evaporation method for measuring highly oxygenated compounds from organic aerosol. The method includes a new inlet, the vaporization inlet for aerosols (VIA), for particle evaporation and a nitrate chemical ionization mass spectrometer (NO3-CIMS) to detect the evaporated highly oxygenated compounds. The method does not require sample collection, enabling highly time-resolved measurements of particulate compounds. Furthermore, the VIA can be coupled to different gas-phase analyzers and aerosol instruments. In this study we first evaluate the performance of the method, and then we demonstrate the detection of particulate highly oxygenated compounds by applying the method to laboratory-generated organic aerosol.
2.1 Experimental setup
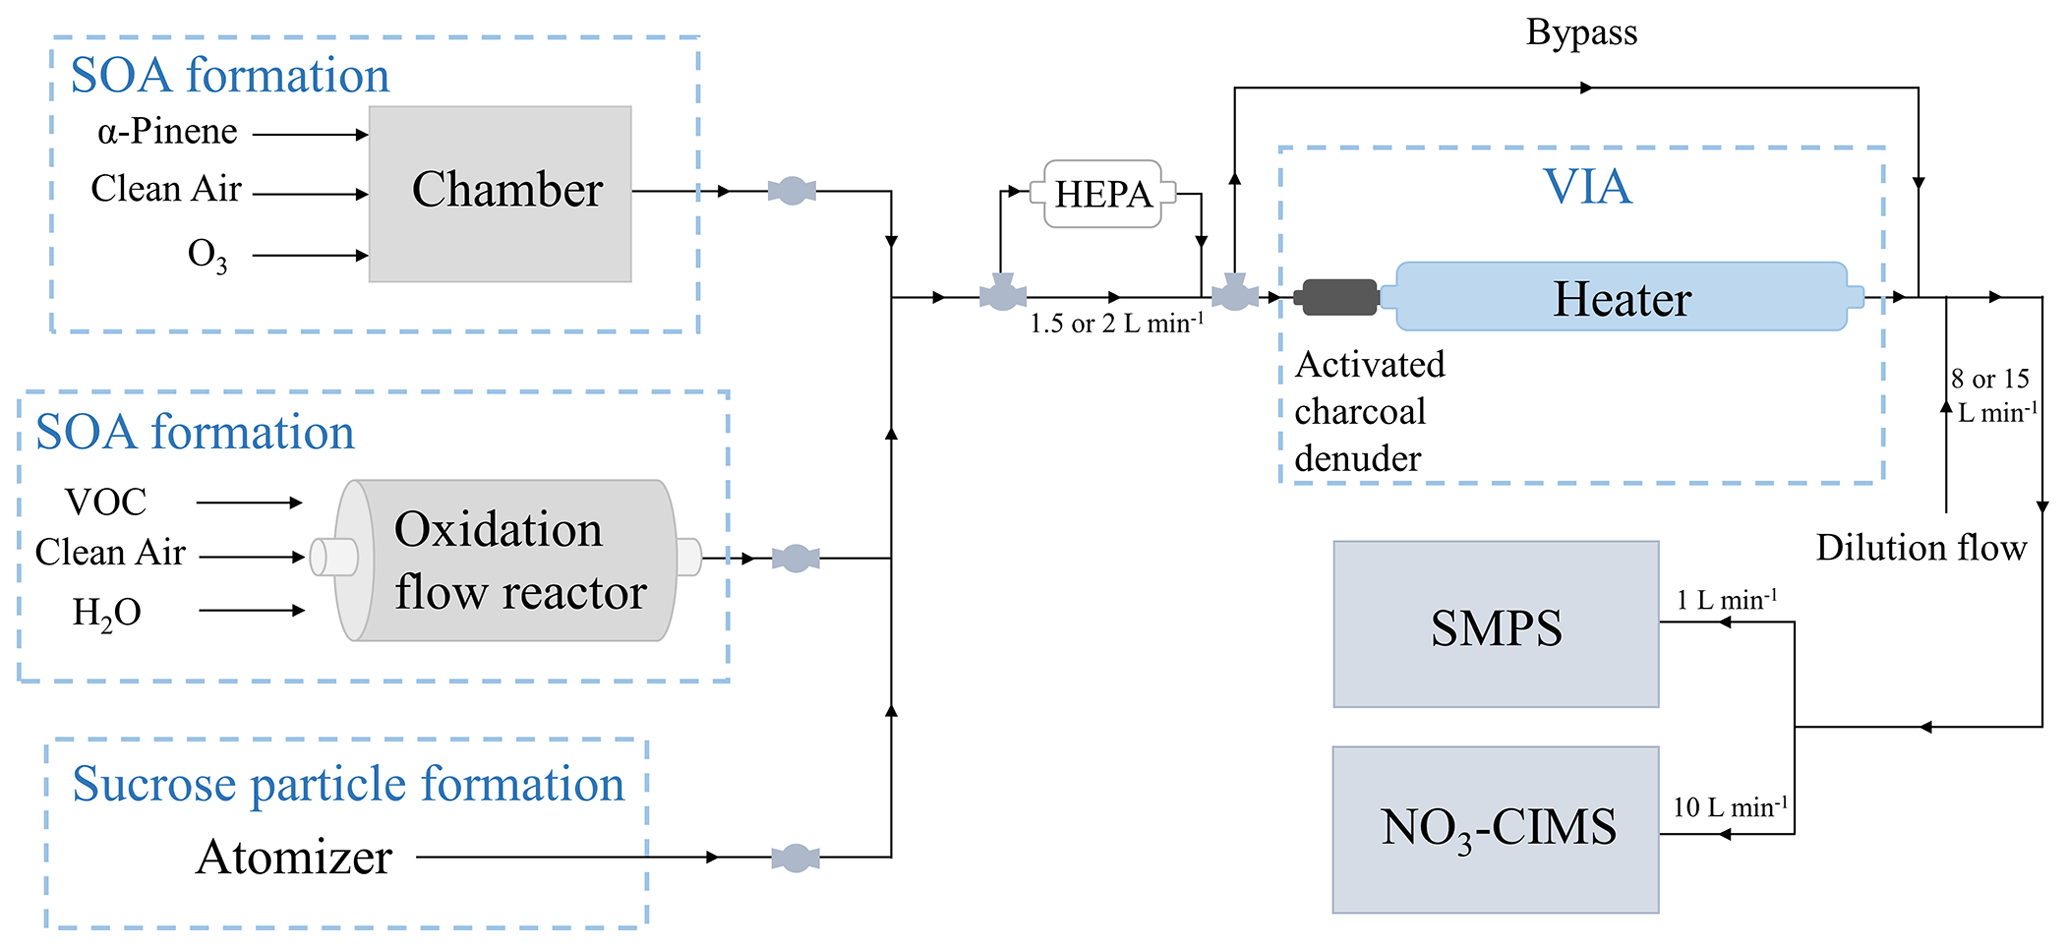
We performed a series of laboratory experiments to test the performance of the new method with an experimental setup shown in Fig. 1. In order to produce aerosol, either an environmental chamber, an oxidation flow reactor, or an atomizer was used. The chamber experiments were performed using α-pinene as a SOA precursor, whereas the flow reactor experiments were performed with different SOA precursors by injecting a specific VOC into the reactor. As SOA precursors we used two monoterpenes (C10H16), α-pinene and β-pinene; a sesquiterpene, β-caryophyllene (C15H24); and an alkane, n-decane (C10H22). The atomizer was used to produce sucrose particles from sucrose water solution. We used sucrose (C12H22O11) to produce more chemically simplified aerosol than SOA. The generated aerosol particles were directed through the VIA, a new inlet that is discussed in detail in Sect. 2.1.3, in which the gas-phase compounds were removed from the sample air, and the thermal evaporation took place. The evaporated highly oxygenated compounds were detected by a NO3-CIMS, and the particle size distribution was measured by a scanning mobility particle sizer (SMPS). A high-efficiency particulate air (HEPA) filter in front of the VIA was used to remove particles from the sample air for background measurements. The bypass line was used to bypass the VIA and measure the non-heated sample air directly by the instruments.
2.1.1 Oxidation flow reactor
We used a potential aerosol mass (PAM) oxidation flow reactor (OFR) (Kang et al., 2007; Lambe et al., 2011) in order to oxidize VOCs into low-volatility vapors that form SOA. The aim was to generate aerosol for characterization of the VIA–NO3-CIMS system, not to investigate the aerosol aging inside the flow reactor. The oxidation flow reactor is made of stainless steel and has a volume of approximately 13 L. The UV lamps inside the reactor operate at wavelengths of 185 and 254 nm, producing O3 from O2 and OH and HO2 from H2O. This highly oxidizing environment allows simulations of atmospheric oxidation processes at accelerated rates (Kang et al., 2007). We used dry air purified with a clean air generator (AADCO, series 737-14, Ohio, USA) as a carrier gas and to produce O3 in the flow reactor. In some of the experiments we injected water vapor (RH 22 % to 33 %) into the flow reactor to produce OH. The total flow through the flow reactor was 10 L min−1, resulting in a ∼ 1 min residence time. The voltage of the UV lamps, controlling the intensity of the lamps, was varied between 100 and 130 V. We generated different types of SOA by injecting four different VOCs (α-pinene, β-caryophyllene, β-pinene, and n-decane) separately into the flow reactor. The VOCs were injected continuously into the flow reactor using a syringe pump at a constant rate.
2.1.2 Environmental chamber
In addition to the oxidation flow reactor, we used an environmental chamber to generate SOA to define the detection limit of the VIA–NO3-CIMS system and to investigate the differences between the gas- and the particle-phase compounds. The chamber is made of Teflon, and it is 2 m3 in volume. Detailed information about the chamber is given in Riva et al. (2019a) and Peräkylä et al. (2020). We injected clean air, ozone generated by an ozone generator (Dasibi 1008-PC), and α-pinene continuously into the chamber with a total flow of 40 L min−1. The residence time in the chamber was ∼ 50 min. To increase the SOA mass loading in the chamber, we used inorganic seed particles to provide a surface for the gas-phase compounds to condense on. We used sodium chloride seed particles instead of commonly used ammonium sulfate to minimize evaporation from the seed particles in the VIA. The seed particles were generated by atomizing sodium chloride water solution and selecting 80 nm particles with a differential mobility analyzer. We measured the α-pinene ozonolysis gas-phase compounds by sampling directly from the chamber without dilution and the particle-phase compounds with the VIA according to Fig. 1.
2.1.3 VIA
The VIA consists of an activated charcoal gas denuder and a thermal desorption unit. The denuder (Eichler et al., 2015) removes the gas-phase compounds from the sample air, and the thermal desorption unit initiates aerosol evaporation. The desorption unit is 40 cm in length, and it is made of in. Sulfinert coated stainless steel tubing. The VIA is an inlet originally designed for a Vocus proton-transfer-reaction time-of-flight mass spectrometer (PTR-TOF) for online analysis of aerosol composition (Aerodyne Research Inc.). However, in this work we adapted the VIA to interface with a NO3-CIMS. In our experiments, the temperature of the thermal desorption unit was set between 25–300 ∘C. To maintain the performance of the activated charcoal denuder, we regenerated it with heated clean air after each laboratory experiment. The total flow through the VIA was 1.5 L min−1 in the oxidation flow reactor experiments and 2 L min−1 in the chamber experiments, resulting in residence times of 0.5 and 0.38 s inside the thermal desorption unit of the VIA when not accounting thermal expansion effects. After the VIA, a dilution flow of 8 or 15 L min−1 of clean air was added to cool down the sample flow before entering the instruments and to provide sufficient flow for the instruments.
2.2 Instrumentation
2.2.1 NO3-CIMS
The nitrate-ion-based chemical ionization mass spectrometer (NO3-CIMS) is selective towards low-volatility, highly oxygenated compounds, and therefore we chose to use it in this study to detect the evaporated compounds from the particle phase. Importantly, the term “HOMs” (highly oxygenated organic molecules) has been used in many studies to describe the group of compounds measured by the NO3-CIMS, and the recommended definition for this term, as proposed by Bianchi et al. (2019), is based on gas-phase measurements. While many of the compounds we detect with the VIA are similar to the HOMs, there are enough differences that we opted to not use the term “HOM” to describe the compounds detected here. In particular, the criteria relating to compounds having been formed via autoxidation in the gas phase and typically containing six or more oxygen atoms are not valid (or it cannot be verified) for all observed compounds in our study, as is shown later. We still describe the compounds as highly oxygenated, but in practice we refer to all compounds that we were able to detect with this new setup. The NO3-CIMS consists of an inlet for chemical ionization (CI) and an atmospheric pressure interface time-of-flight (APi-TOF) high-resolution mass spectrometer (Junninen et al., 2010; Jokinen et al., 2012). The sheath flow of the chemical ionization inlet containing nitric acid (HNO3) is guided through an X-ray source, where HNO3 molecules are ionized to nitrate ions. The nitrate ions are directed into the sample flow, where they ionize the sample molecules either via proton transfer reaction or via clustering of the sample molecule to the nitrate ion (Jokinen et al., 2012; Hyttinen et al., 2015). Highly oxygenated compounds are primarily detected as clusters with according to Eq. (1).
After ionization, sample ions are guided into the APi-TOF, where their signals and mass-to-charge () ratios are determined. The signal intensity of highly oxygenated compound X can be converted to a concentration by normalizing the measured signal intensity (ions per second) with the total measured reagent ion signal (ions per second), which cancels out the unit. Then the normalized value is multiplied by the calibration factor (cm−3), yielding the concentration of X in cm−3, which describes the number of molecules of X in a cubic centimeter of gas (Eq. 2; Jokinen et al., 2012).
where [X] is the concentration of the measured compound, the numerator describes the signal of compound X clustered with the nitrate ion, and the denominator describes the sum of reagent ion signals. Cx is a calibration factor, which is determined in Sect. 3.2.
The instrument was sampling after the VIA with a flow rate of 10 L min−1, through a ∼ 1 m long tube. Data were recorded with a time resolution of 10 s. We processed the NO3-CIMS data using the tofTools software package (Junninen et al., 2010).
2.2.2 SMPS
We used a scanning mobility particle sizer (SMPS) to measure the particle size distribution before and after the particles were heated in the VIA. SMPS consists of a radioactive charger (Ni-63) to charge the particles, a differential mobility analyzer (DMA) to classify the particles according to their electrical mobility diameter and a condensation particle counter (CPC; Model 3772 and 3750, TSI) to count the particle number concentration. The SMPS measured particles from 10 to 500 nm in diameter with a scanning time of ∼ 130 s and a sample flow rate of 1 L min−1.
3.1 Temperature profile and transmission efficiency of the VIA
The VIA temperature is set with respect to the measured temperature values from the outer surface of the thermal desorption unit. To investigate the temperature profile inside the thermal desorption unit, we placed a thermocouple into different locations inside the unit and measured the temperature of the gas at different set temperatures and flow rates (Fig. A1). The temperature profile inside the unit was not uniform, as the gas was colder at the entrance than at the outlet of the unit. The temperatures reported in this study are the setpoint values of the thermal desorption unit of the VIA.
In our experiments, the residence time inside the desorption unit was 0.38 s or 0.5 s, and the time that the particles were exposed to the set temperature at the outlet of the unit was even shorter than the residence time. During the calibration of the NO3-CIMS (discussed in the following section), our measurements show that around 70 % of the ammonium sulfate mass was evaporated at a set VIA temperature of 300 ∘C. However, previous thermal denuder studies have shown that ammonium sulfate particles completely evaporate at 180 ∘C (Huffman et al., 2008; Hakala et al., 2017). This suggests that the time particles spent at the set temperature was too short for complete particle evaporation, and a fraction of the mass remained on the particles.
The particle transmission efficiency of the VIA was measured by sampling indoor air through the VIA and measuring the transmitted particle concentration with a condensation particle counter (CPC). The VIA was set to 25 ∘C, and the total flow through the VIA was 1 L min−1. About 90 % of indoor particles with diameters ranging from 10 to 200 nm (mode at 20 nm) were transmitted through the VIA.
3.2 Calibration of the NO3-CIMS and detection limit of the method
A simple method to calibrate the NO3-CIMS for highly oxygenated compound detection does not exist due to a lack of suitable standards. We used sulfuric acid (H2SO4) to determine the calibration factor, assuming that the sensitivities of nitrate clusters to sulfuric acid and highly oxygenated compounds are equal. We generated ammonium sulfate ((NH4)2SO4) particles by atomizing ammonium sulfate water solution. The particles were heated in the VIA set at 300 ∘C, and the SMPS measured the size distribution of ammonium sulfate particles before and after the particles were heated. The mass concentration of evaporated sulfuric acid was calculated from the size distribution data, assuming spherical particles with a density of 1770 kg m−3. The fraction of sulfuric acid in ammonium sulfate particles was considered in the calculation. The NO3-CIMS detected the evaporated sulfuric acid (H2SO4) as H2SO4NO and HSO ions, and the sum of their signal intensities was converted into mass concentration by applying different calibration factors (Fig. 2). The calibration curves are not as steep as the 1 : 1 line. This could be due to nucleation under a high concentration of sulfuric acid in the tubing between the VIA and the NO3-CIMS. Nucleation would lead to a decrease in the gaseous sulfuric acid, resulting in lower mass concentration detected by the NO3-CIMS compared to the SMPS (which simply measures the evaporation from the larger particles) as a function of the evaporated sulfuric acid. Wall losses between the VIA and the NO3-CIMS will certainly also take place, but this should to a first approximation be a constant factor and as such becomes included in the calibration factor (Jokinen et al., 2012). On average, the difference between the concentrations measured by the SMPS and the NO3-CIMS is smallest when a calibration factor of 2 × 1010 cm−3 is used. Therefore, we decided to use the calibration factor of 2 × 1010 cm−3 when converting the NO3-CIMS signals to concentrations. This value is close to the literature calibration factor values that range between 1.1 × 10¹⁰ and 1.89 × 1010 cm−3 (Jokinen et al., 2012; Kürten et al., 2012; Ehn et al., 2014). We acknowledge that our estimate comes with a very large uncertainty and thus provides concentrations of highly oxygenated compounds with large uncertainties. Hence, we focus more on the qualitative than on the quantitative analysis of the measured data.
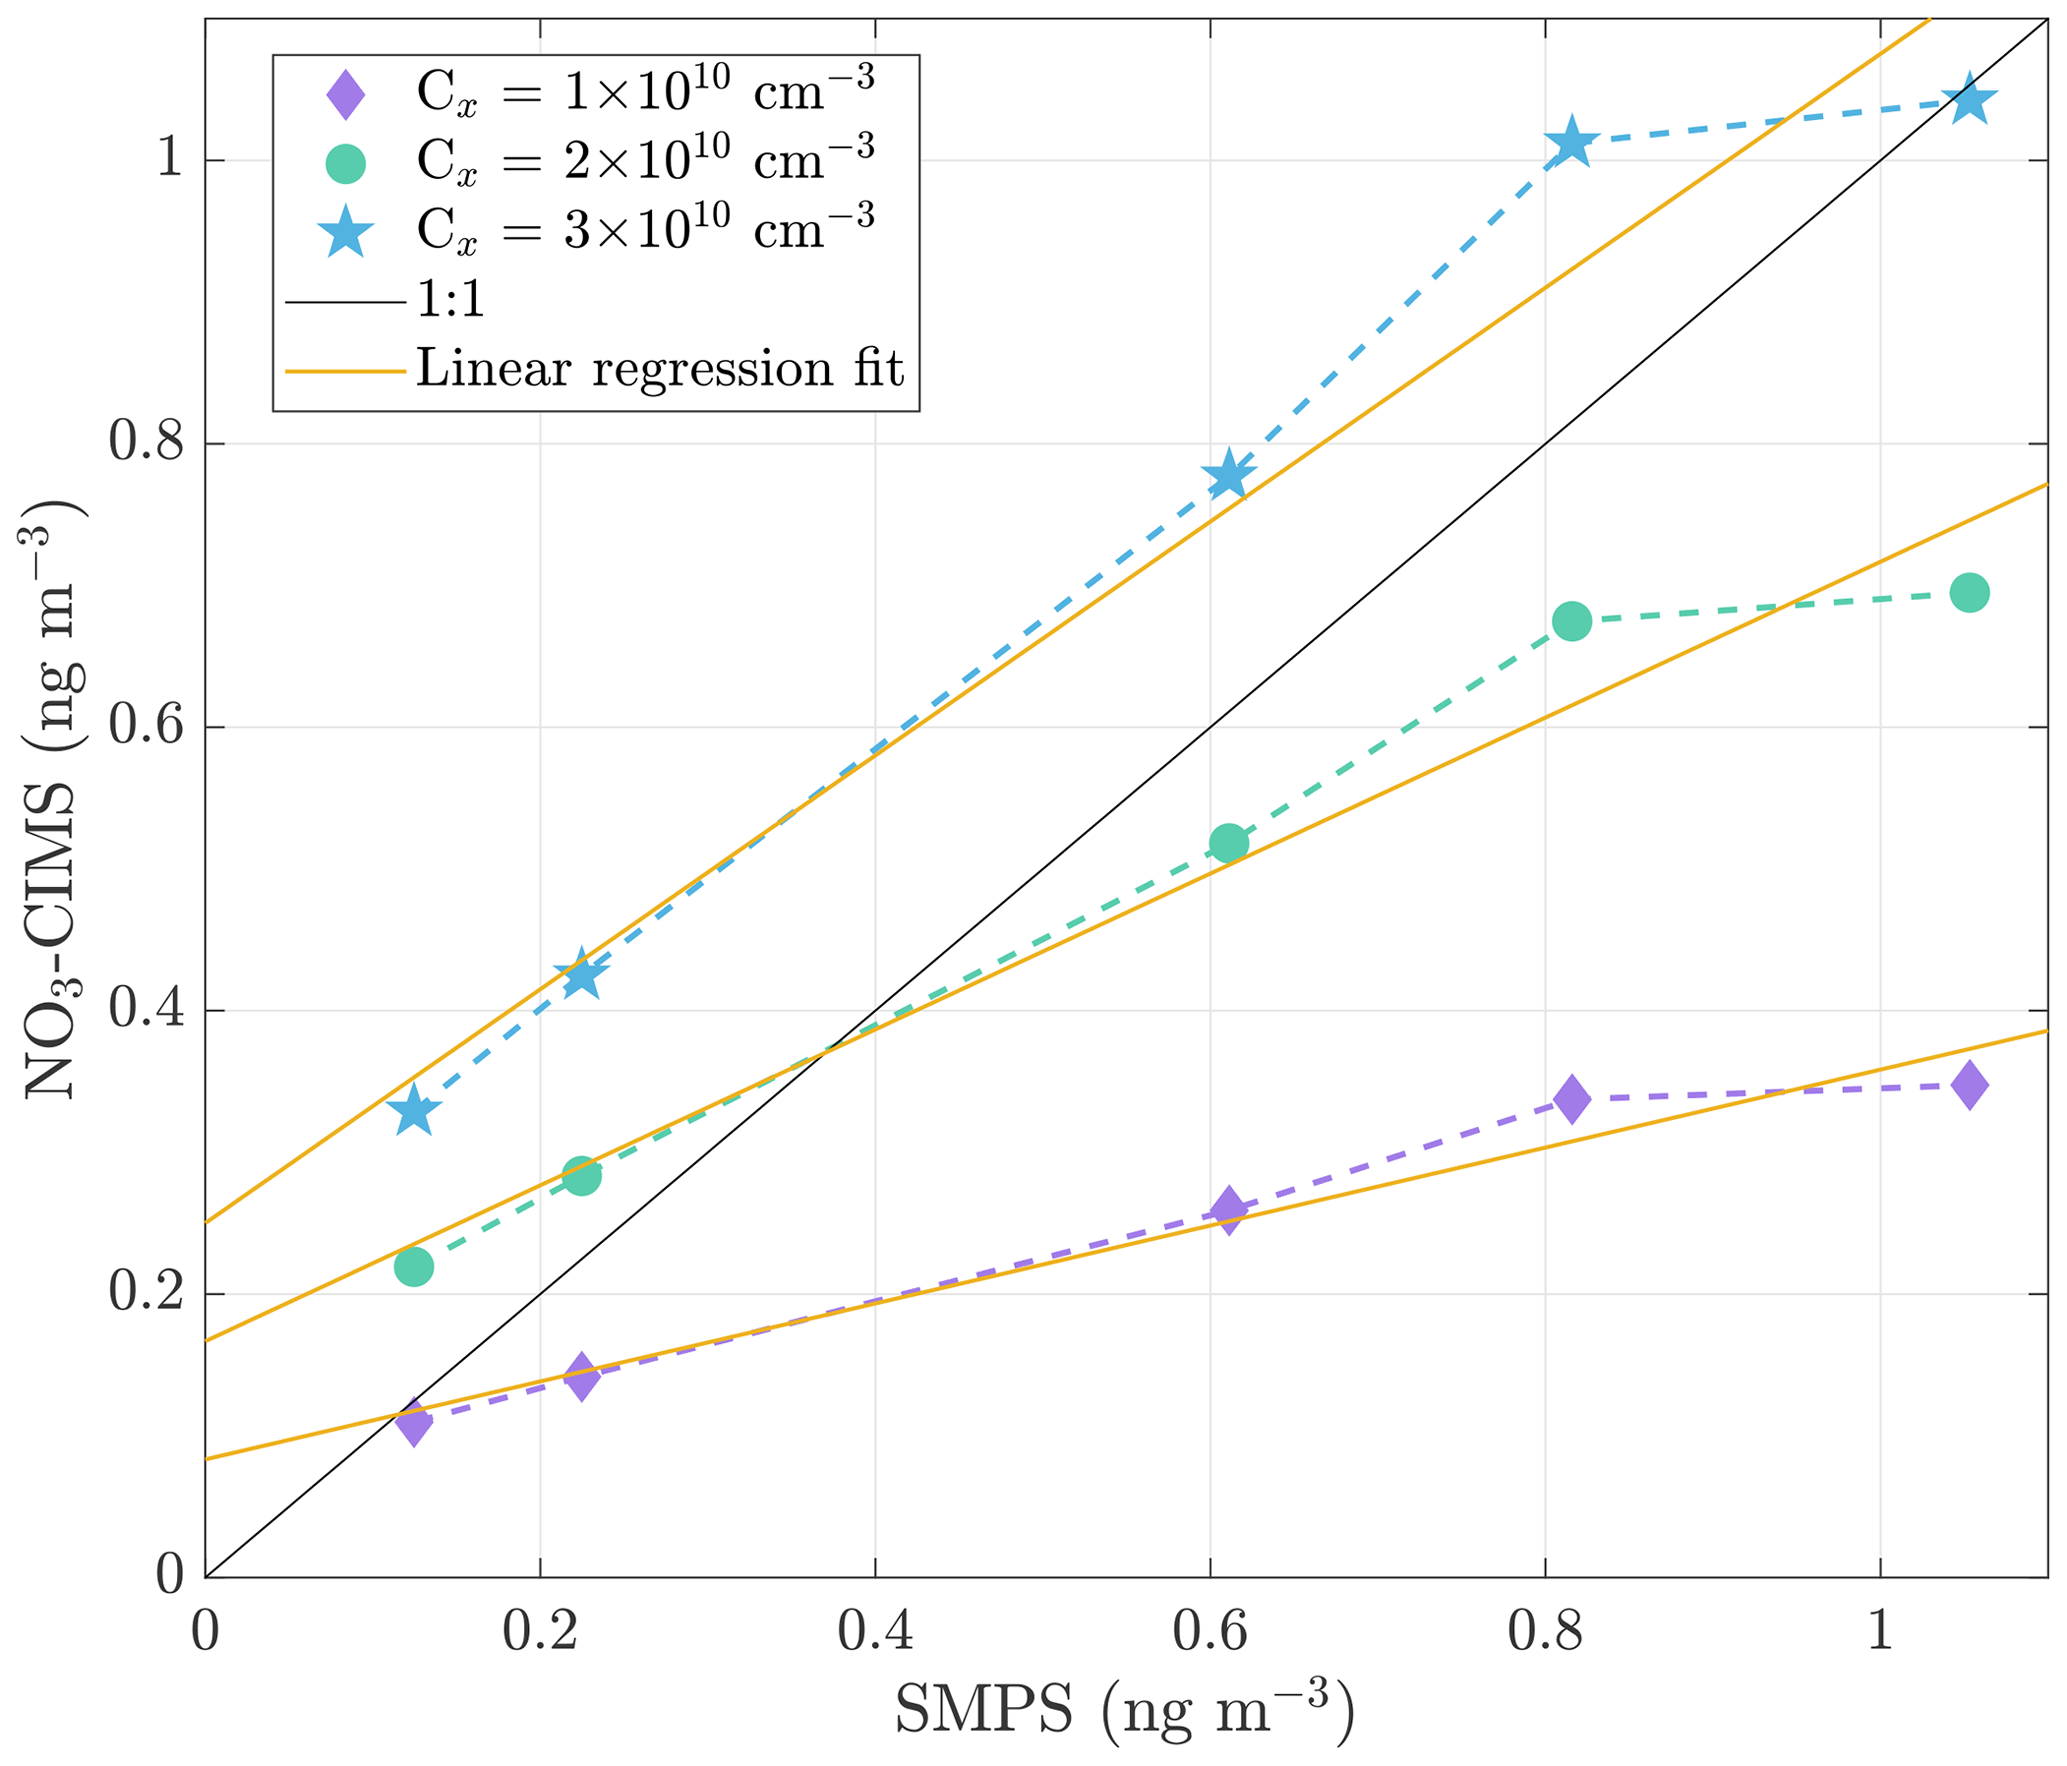
Figure 2Correlation between the mass concentration of evaporated sulfuric acid measured with the SMPS and the NO3-CIMS. The signal intensities measured by the NO3-CIMS were converted into mass concentration by applying calibration factors of 1 × 10¹⁰, 2 × 10¹⁰, and 3 × 1010 cm−3. The 1 : 1 line represents the points where the corresponding concentrations are identical. The solid yellow lines show the linear regression fits to the calibration curves.
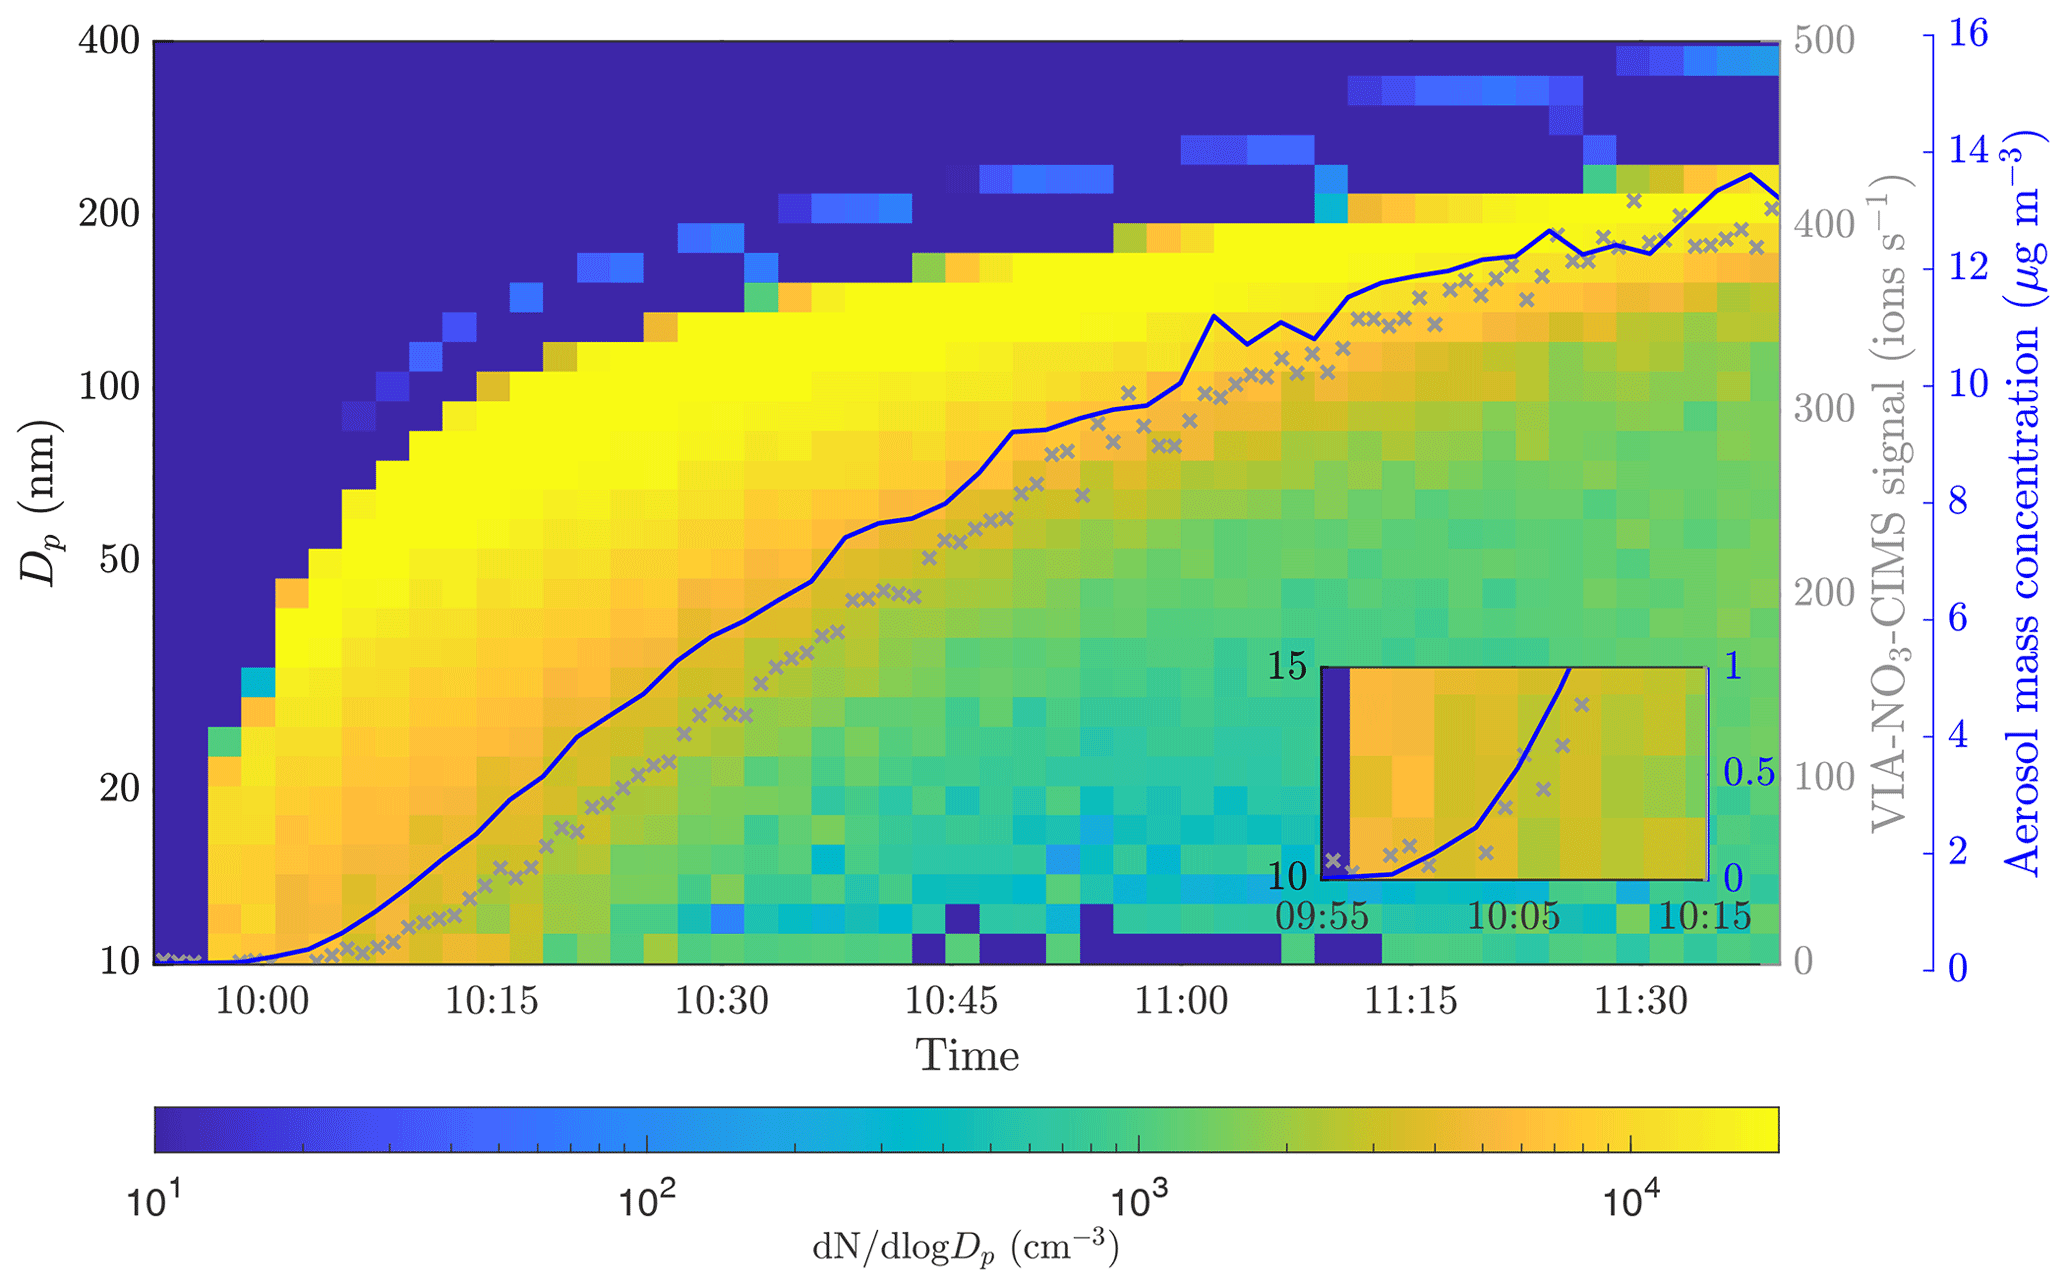
Figure 3SOA formation and growth from α-pinene ozonolysis observed by the SMPS. The blue line shows the aerosol mass concentration measured by the SMPS. The gray markers show the sum of the NO3-CIMS signals for compounds from 200 to 750 sampled through the VIA set to 230 ∘C. The inset shows a zoomed region of the point where the NO3-CIMS started to detect compounds.
We fit a linear regression model to the calibration curves, resulting in y intercepts of 0.08, 0.17, and 0.25 ng m−3 for the calibration factors of 1 × 10¹⁰, 2 × 10¹⁰, and 3 × 1010 cm−3, respectively (Fig. 2). Based on the calibration data, we estimate a detection limit of below 1 ng m−3 for a single compound (H2SO4). To evaluate the detection limit for bulk organic aerosol, we performed experiments in the environmental chamber. We added ozone (33 ppb) and α-pinene (120 ppb) to the chamber and observed aerosol formation and growth by the SMPS as shown in Fig. 3. During this event, the VIA sampled from the chamber at a set temperature of 230 ∘C, and the NO3-CIMS measured after the VIA. The sample flow through the VIA was 2 L min−1, and a dilution flow of 8 L min−1 of clean air was added after the VIA. When the SOA mass loading in the chamber was below 0.5 µg m−3, the NO3-CIMS signals for compounds from 200–750 started to increase. Therefore, with the crude sampling setup used here, we found a detection limit of well below 1 µg m−3 for organic aerosol. By applying a calibration factor of 2 × 1010 cm−3, we estimate that the mass concentration of the 200–750 organic compounds was 0.15 µg m−3 when the total SOA mass was 0.5 µg m−3. This detection limit of below 1 µg m−3 for organic aerosol is substantially higher compared to the detection limit of below 1 ng m−3 that we estimated for sulfuric acid. Organic aerosol potentially contains thousands of different compounds, and its signal is spread out over a wider range than the signal of sulfuric acid, mainly explaining the difference between the detection limits. Furthermore, the NO3-CIMS cannot detect all of the compounds evaporating from SOA, whereas it can detect a majority of the evaporated sulfuric acid. The VIA–NO3-CIMS system can be operated in different ways, and the detection limits obtained in this study are for the particular experimental setup presented in Sect. 2.1. The detection limit could be improved upon by optimizing the sampling setup, such as increasing the sample flow by using several denuders in parallel and optimizing the mixing of the sample and the dilution flow.
3.3 Background measurements
To show that the compounds detected by the NO3-CIMS are evaporated from the particle phase, several background measurements were conducted. Figure 4 shows a comparison between the background spectra and the particle-phase spectra measured by the NO3-CIMS. The background spectra (Fig. 4a, b, c, e) show a completely different pattern than the particle-phase spectra (Fig. 4d and f), indicating that the compounds detected by the NO3-CIMS are evaporated from the particle phase. The background spectrum measured through the HEPA filter (Fig. 4e) was recorded for each set VIA temperature (25, 70, 120, 170, 230, and 300 ∘C) and subtracted from the SOA evaporation spectra at the sampled temperature.
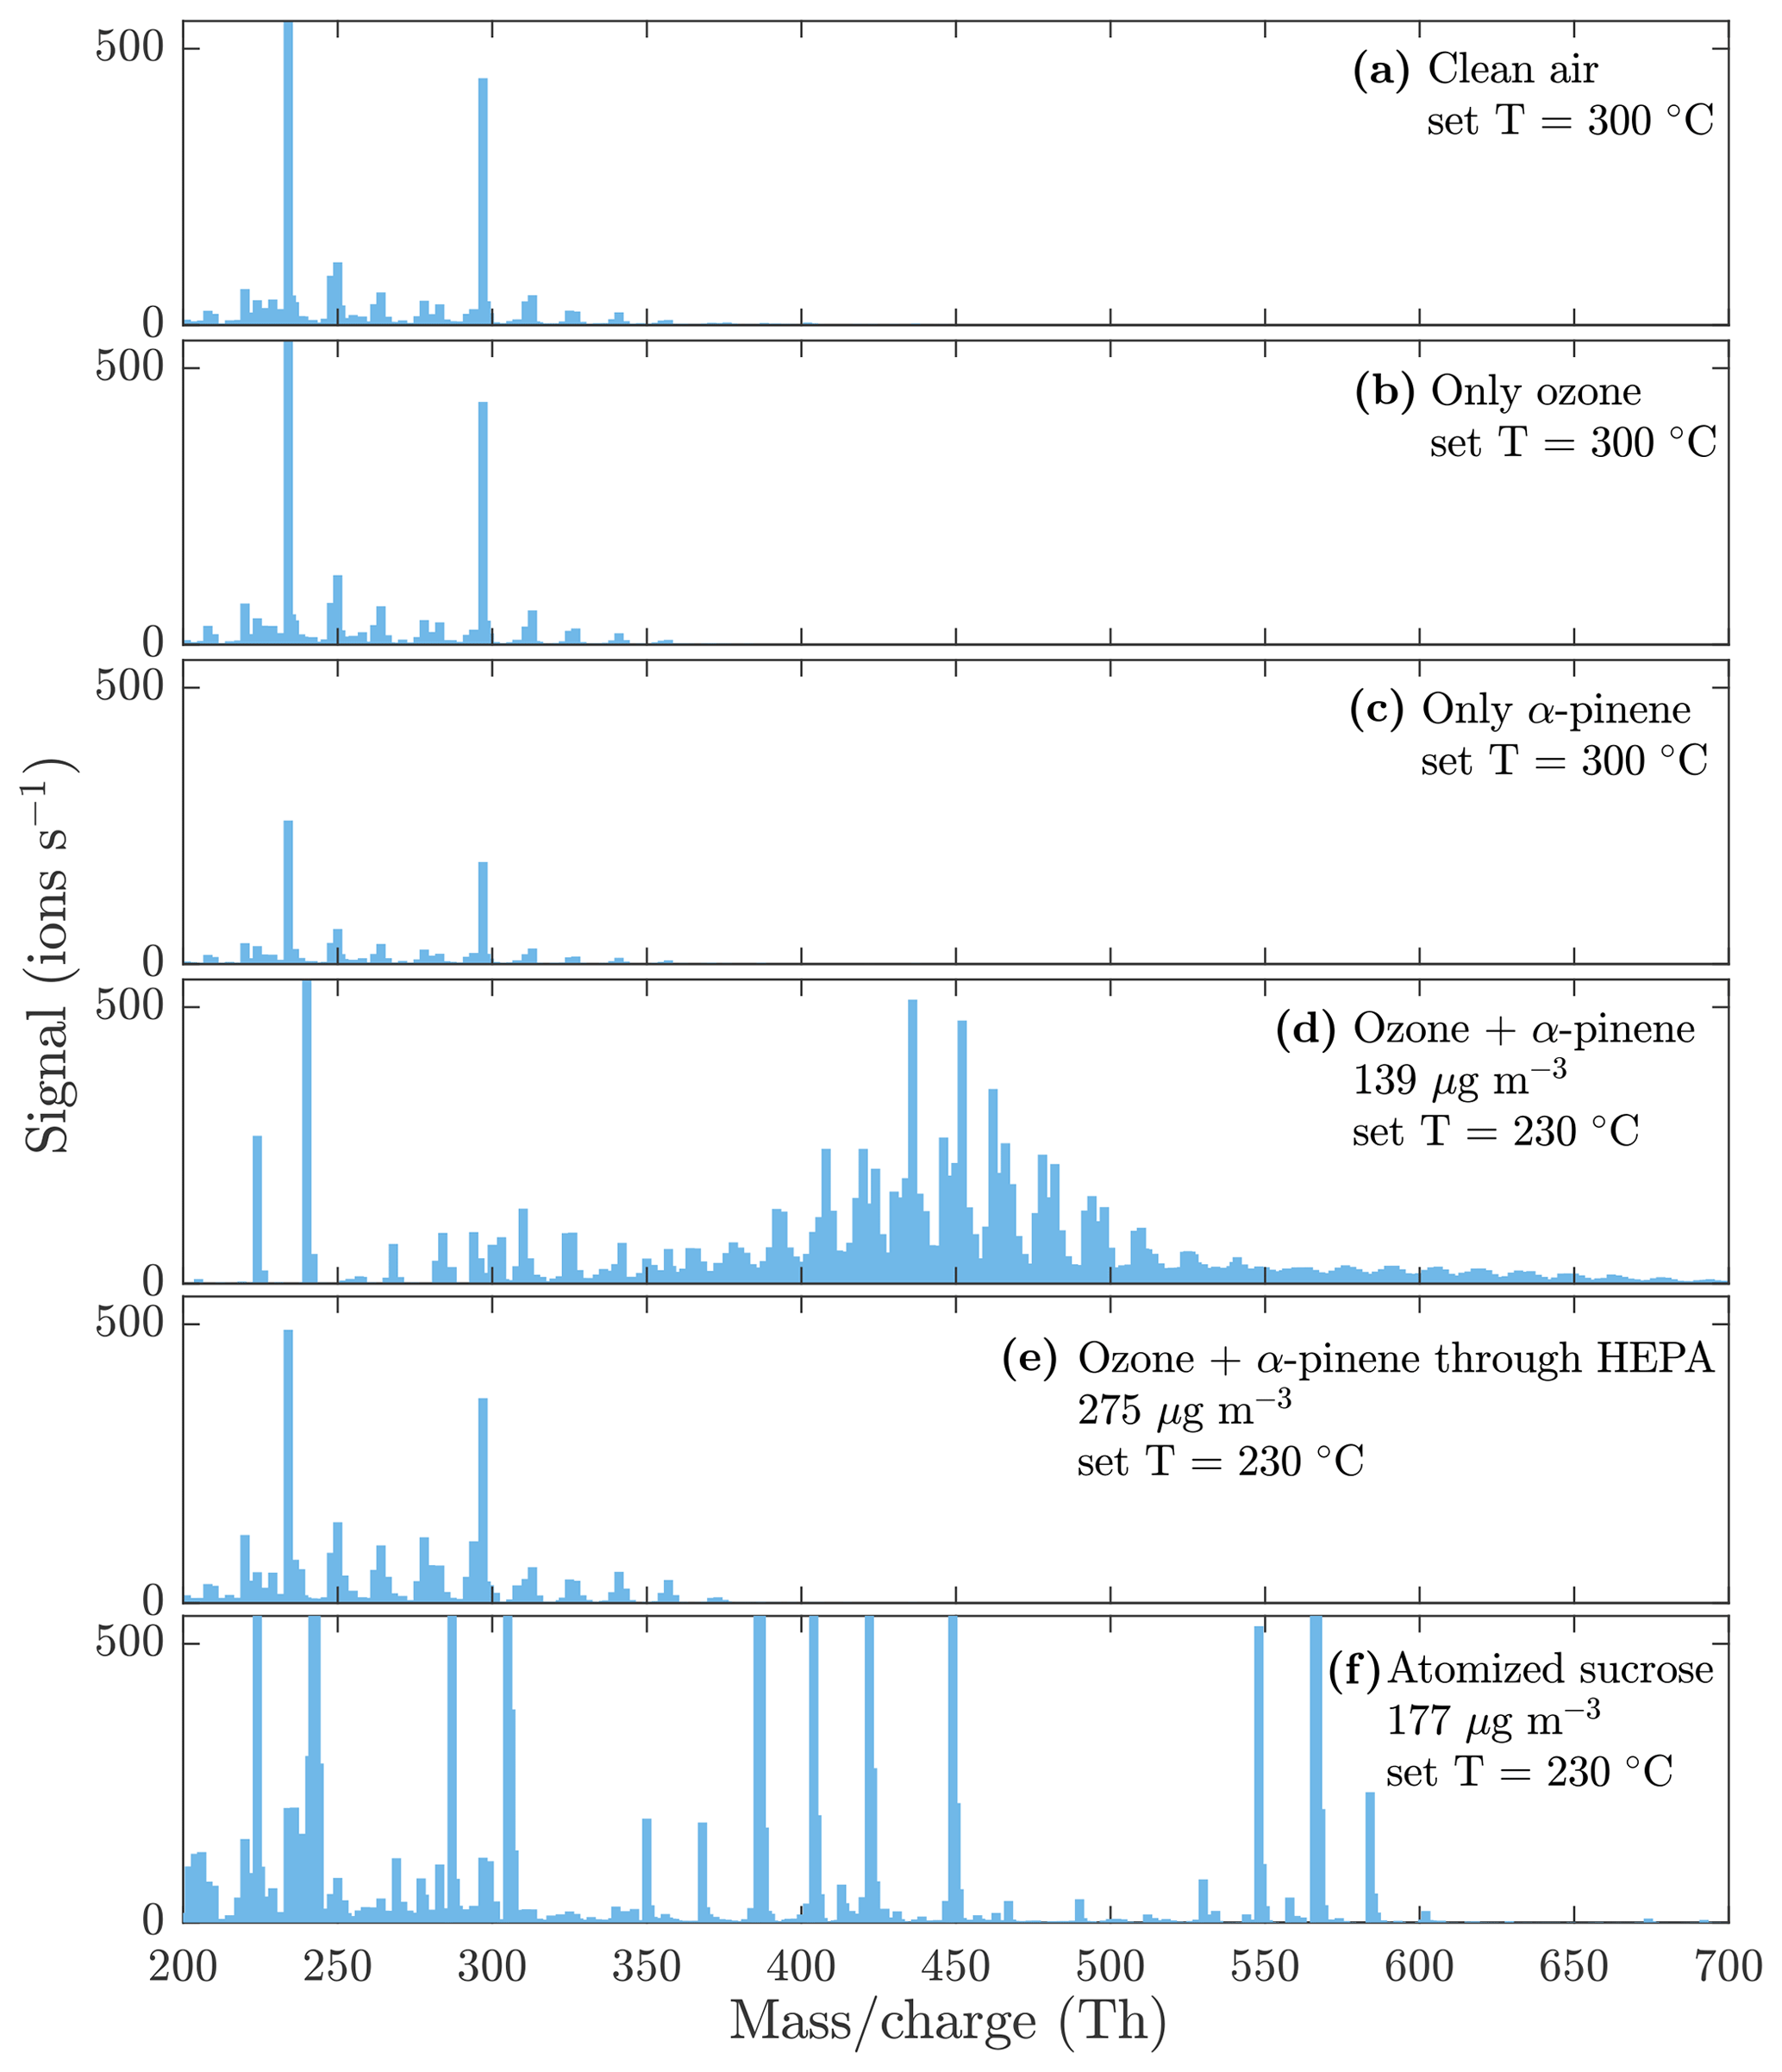
Figure 4Evaporation spectra measured by the NO3-CIMS during the heating of (a) only clean air, (b) only ozone, (c) only α-pinene, (d) α-pinene SOA, (e) α-pinene SOA with a HEPA filter added in front of the VIA (see Fig. 1 for the placement of the HEPA filter), and (f) sucrose particles. The sample flow through the VIA was 1.5 L min−1, and a dilution flow of 15 L min−1 of clean air was added after the VIA. The concentrations are the total aerosol mass loadings in the VIA before dilution. A peak list of the main compounds evaporated from α-pinene SOA in panel (d) is provided in the Appendix (Table A1).
4.1 Application to organic aerosol
To demonstrate the detection of particulate highly oxygenated compounds with the VIA coupled to the NO3-CIMS, we applied the described method to SOA generated from different precursors. The selected precursor reacted with ozone in the oxidation flow reactor, leading to SOA mass loading of 60 to 500 µg m−3 that was sampled through the VIA. The VIA temperature was set to six different temperature stages between 25 and 300 ∘C, and data were recorded for 10 min for each temperature. The sample flow through the VIA was 1.5 L min−1, and a dilution flow of 15 L min−1 of clean air was added after the VIA.
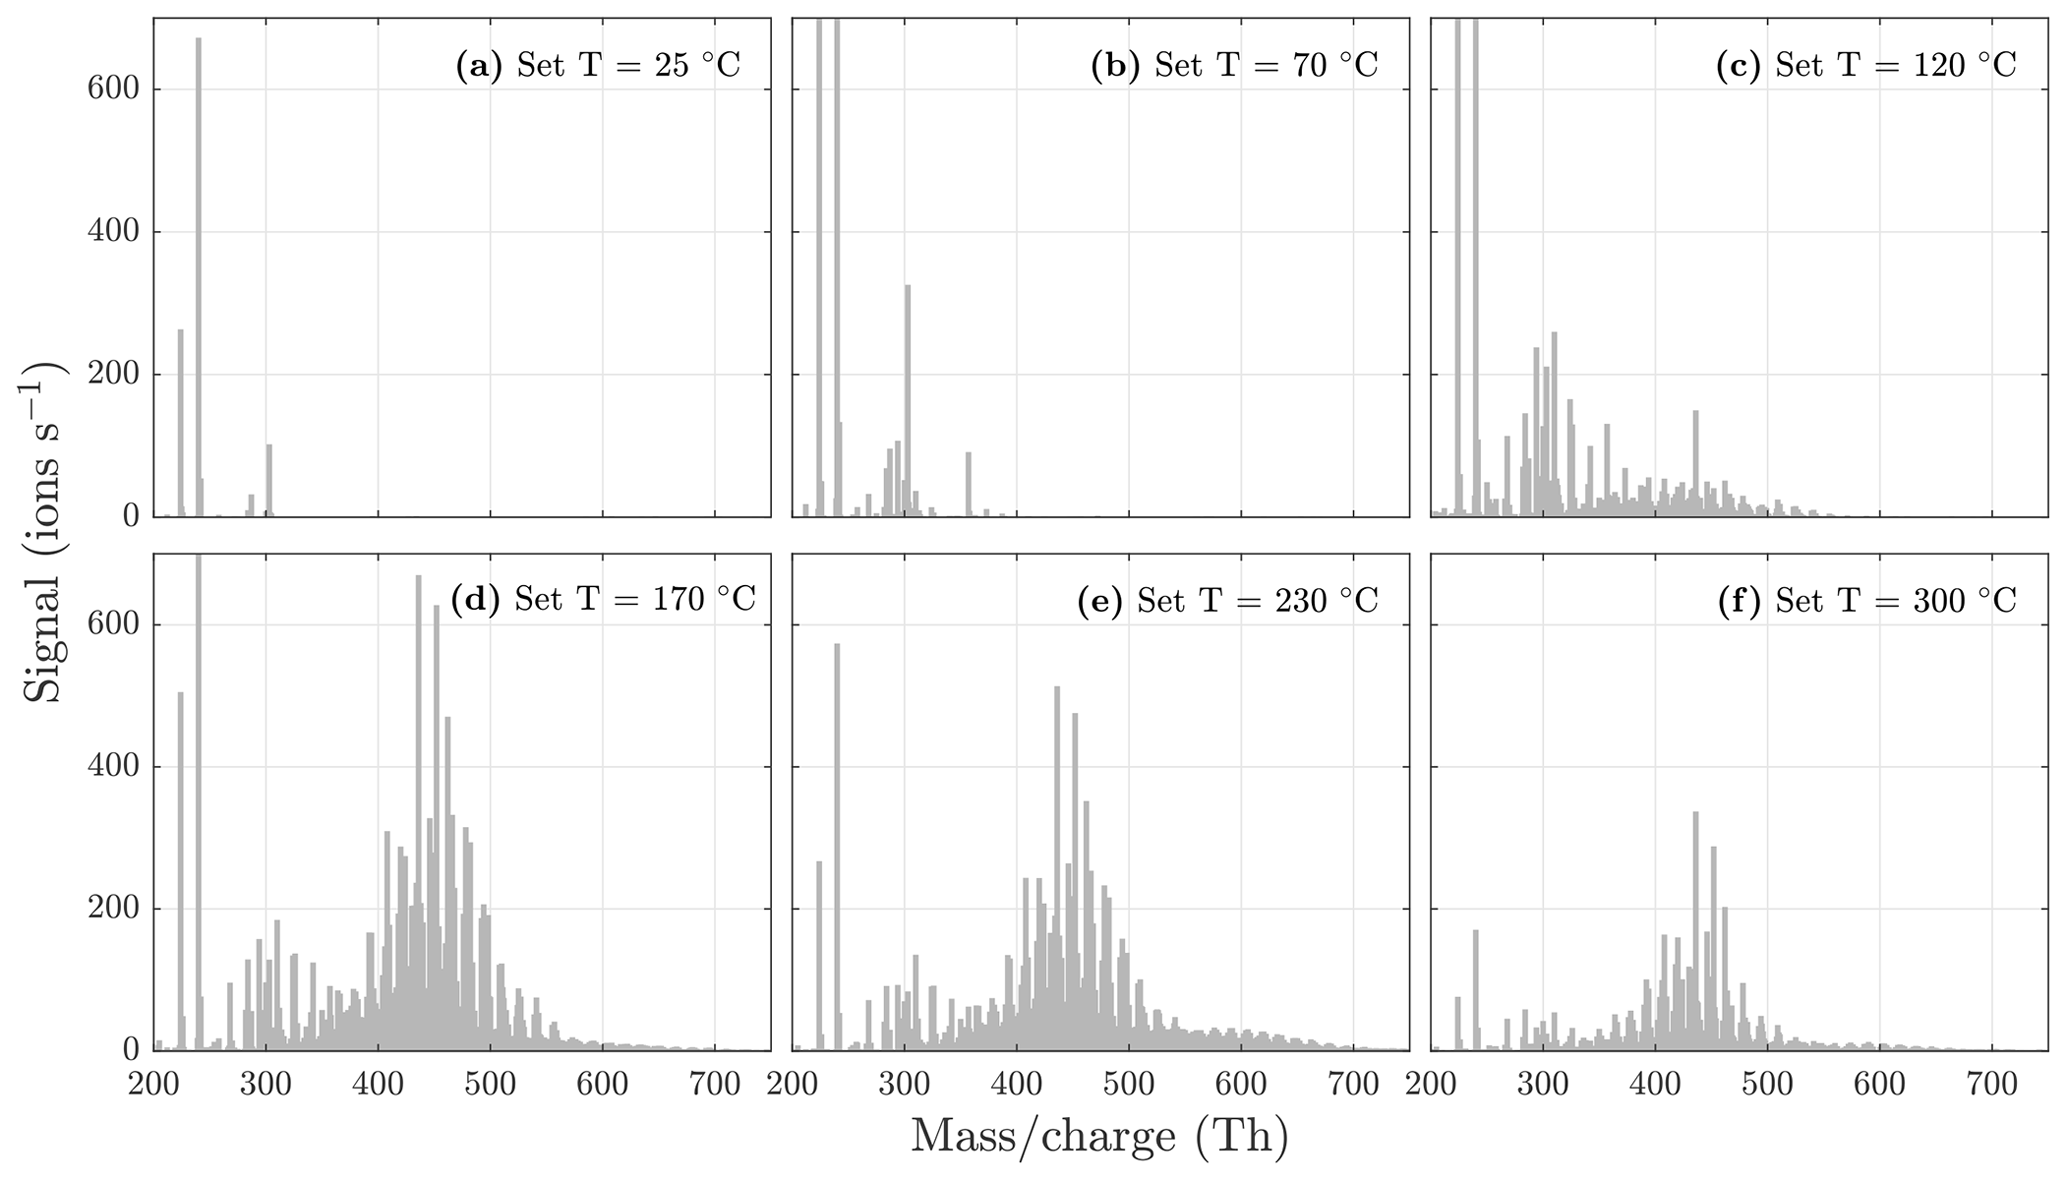
Figure 5NO3-CIMS spectra at 1 min averaging measured during α-pinene ozonolysis SOA evaporation at different temperatures. The total SOA mass loading was 139 µg m−3 in the VIA before dilution. Note that the y axes are set to the same scale, and therefore the full peaks at 224 and 240 are not visible in each spectrum. All molecules were detected as clusters with the nitrate ion.
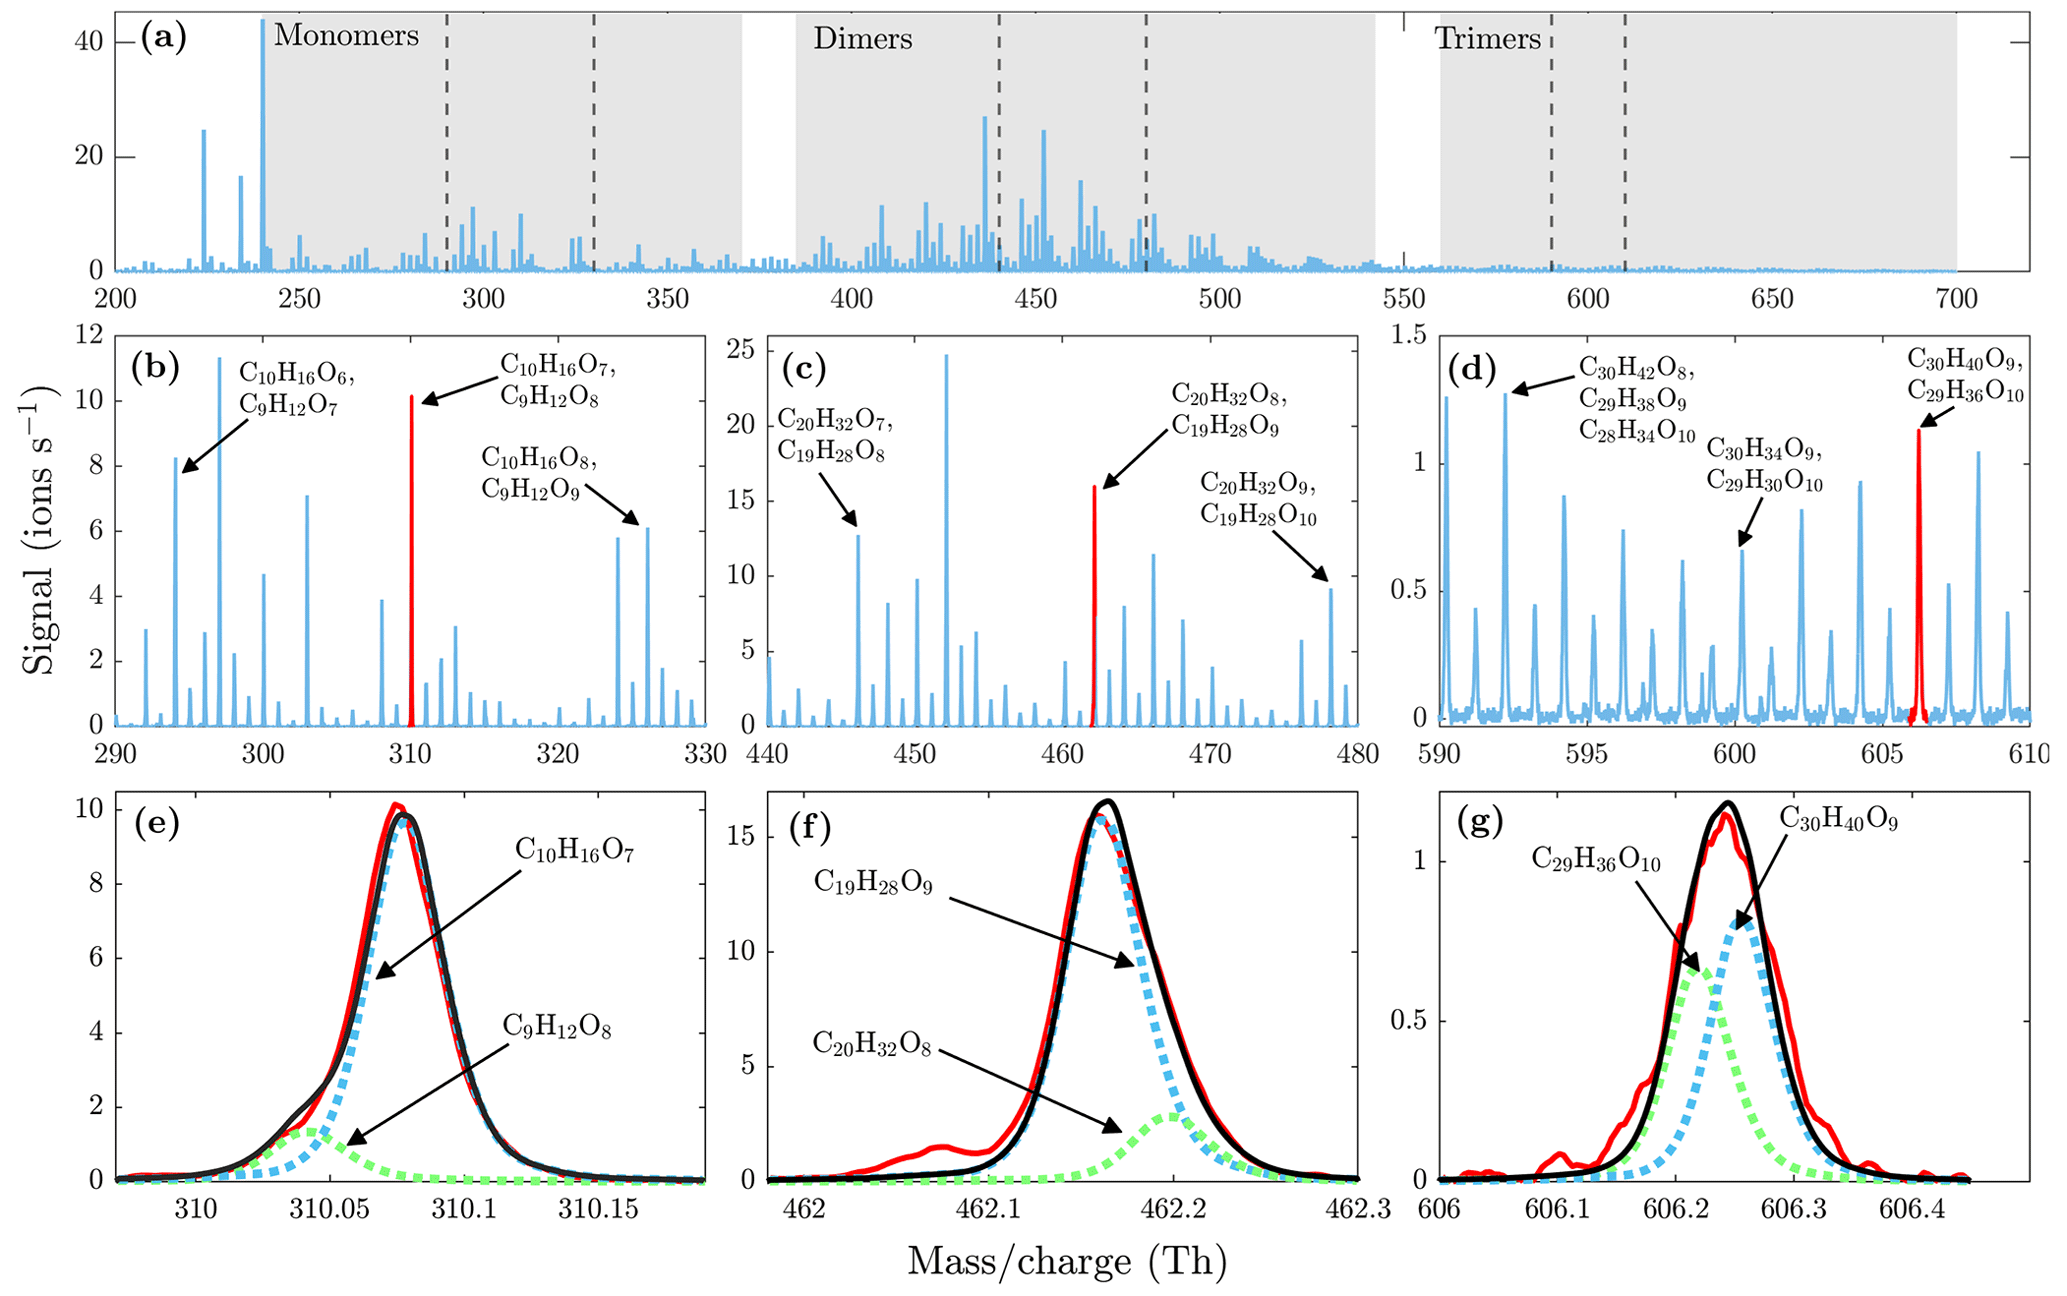
Figure 6(a) High-resolution mass spectrum measured at a set temperature of 230 ∘C at 1 min averaging during α-pinene ozonolysis SOA evaporation. Monomer, dimer, and trimer mass ranges are highlighted with gray shading. The dashed lines show the mass ranges that are zoomed in (b), (c), and (d). The high-resolution fits for peaks highlighted with red are shown in (e), (f), and (g). The black lines show the total signal fitted to the measured signals in red. All molecules were detected as clusters with the nitrate ion.
During the heating of SOA formed from α-pinene ozonolysis, the NO3-CIMS detected oxygenated organic compounds evaporating from the particle phase (Fig. 5). These compounds can be divided into three classes according to their ratio: monomers (240–370 Th), dimers (410–550 Th), and trimers (560–700 Th). Monomers include mainly C9–10 compounds, dimers include mainly C19–20 compounds, and trimers include mainly C29–30 compounds clustered with a nitrate ion. To better show the trimer region, we include the α-pinene ozonolysis SOA evaporation spectra with a logarithmic y scale in the Appendix (Fig. A2). The oxygen content of the identified evaporated compounds varies between 4 and 15 oxygen atoms. Our results show that monomers start to evaporate at a set temperature of 70 ∘C, dimers at a set temperature of 120 ∘C, and trimers at a set temperature of 230 ∘C. The removal of the gas-phase compounds before the VIA disturbs the gas–particle equilibrium, potentially leading to evaporation and detection of some organic compounds (mainly C5 compounds) already at 25 ∘C. According to the SMPS data, roughly half of the SOA mass evaporated at 120 ∘C, and almost all (> 99 %) of the mass evaporated at 300 ∘C. The dominating signals are C10H16O7, C10H16O6, and C10H14O8 for monomers; C18H30O8, C18H30O9, and C20H32O8 for dimers; and C30H42O8 and C30H40O9 for trimers. A peak list summarizing the elemental compositions and the ratios of the compounds evaporated with the highest signal intensities is provided in the Appendix (Table A1). Our findings are consistent with previous studies showing that the volatility of organic compounds decreases with increasing ratio and level of oxygenation (Kroll and Seinfeld, 2008; Peräkylä et al., 2020) and SOA consisting of oligomeric compounds (Lopez-Hilfiker et al., 2015; Zhang et al., 2017; Pospisilova et al., 2020). The compounds detected with the NO3-CIMS were identified using high-resolution analysis in order to separate the individual ions present at the same unit mass, as shown in Fig. 6. The signal intensities of trimers and their signal-to-noise ratios are lower compared to monomers and dimers, yet trimer signals are clearly distinguishable from the noise level. The majority of the monomers and dimers identified here have been detected in previous studies either in the gas phase or in the particle phase (Ehn et al., 2014; Quéléver et al., 2019; Pospisilova et al., 2020), whereas the trimers have not previously been observed in either phase. Our findings suggest that the particulate compounds that have not previously been found from the gas phase are formed through particle-phase reactions or through some other processes, such as thermally induced processes within the VIA.
The monomers, dimers, and trimers are also evident in the NO3-CIMS evaporation spectra of other kinds of SOA (Fig. 7), demonstrating that the VIA coupled to the NO3-CIMS is applicable to different organic species. The full evaporation spectra for different SOA precursors are included in the Appendix (Figs. A3–A6). Thermograms for monomers, dimers, and trimers evaporated from different kinds of SOA are shown in Fig. 8. The thermograms show an identical pattern of optimal evaporation temperature increasing with increasing ratio until the signals start to decrease. The decrease in the signals is discussed in more detail in Sect. 4.2. For each type of SOA, dimer signals reach the highest values, suggesting that SOA contains more dimers than monomers under the loadings and conditions used in this study. However, previous studies have shown that in the gas phase the monomer concentration is higher than the dimer concentration (McFiggans et al., 2019; Simon et al., 2020).
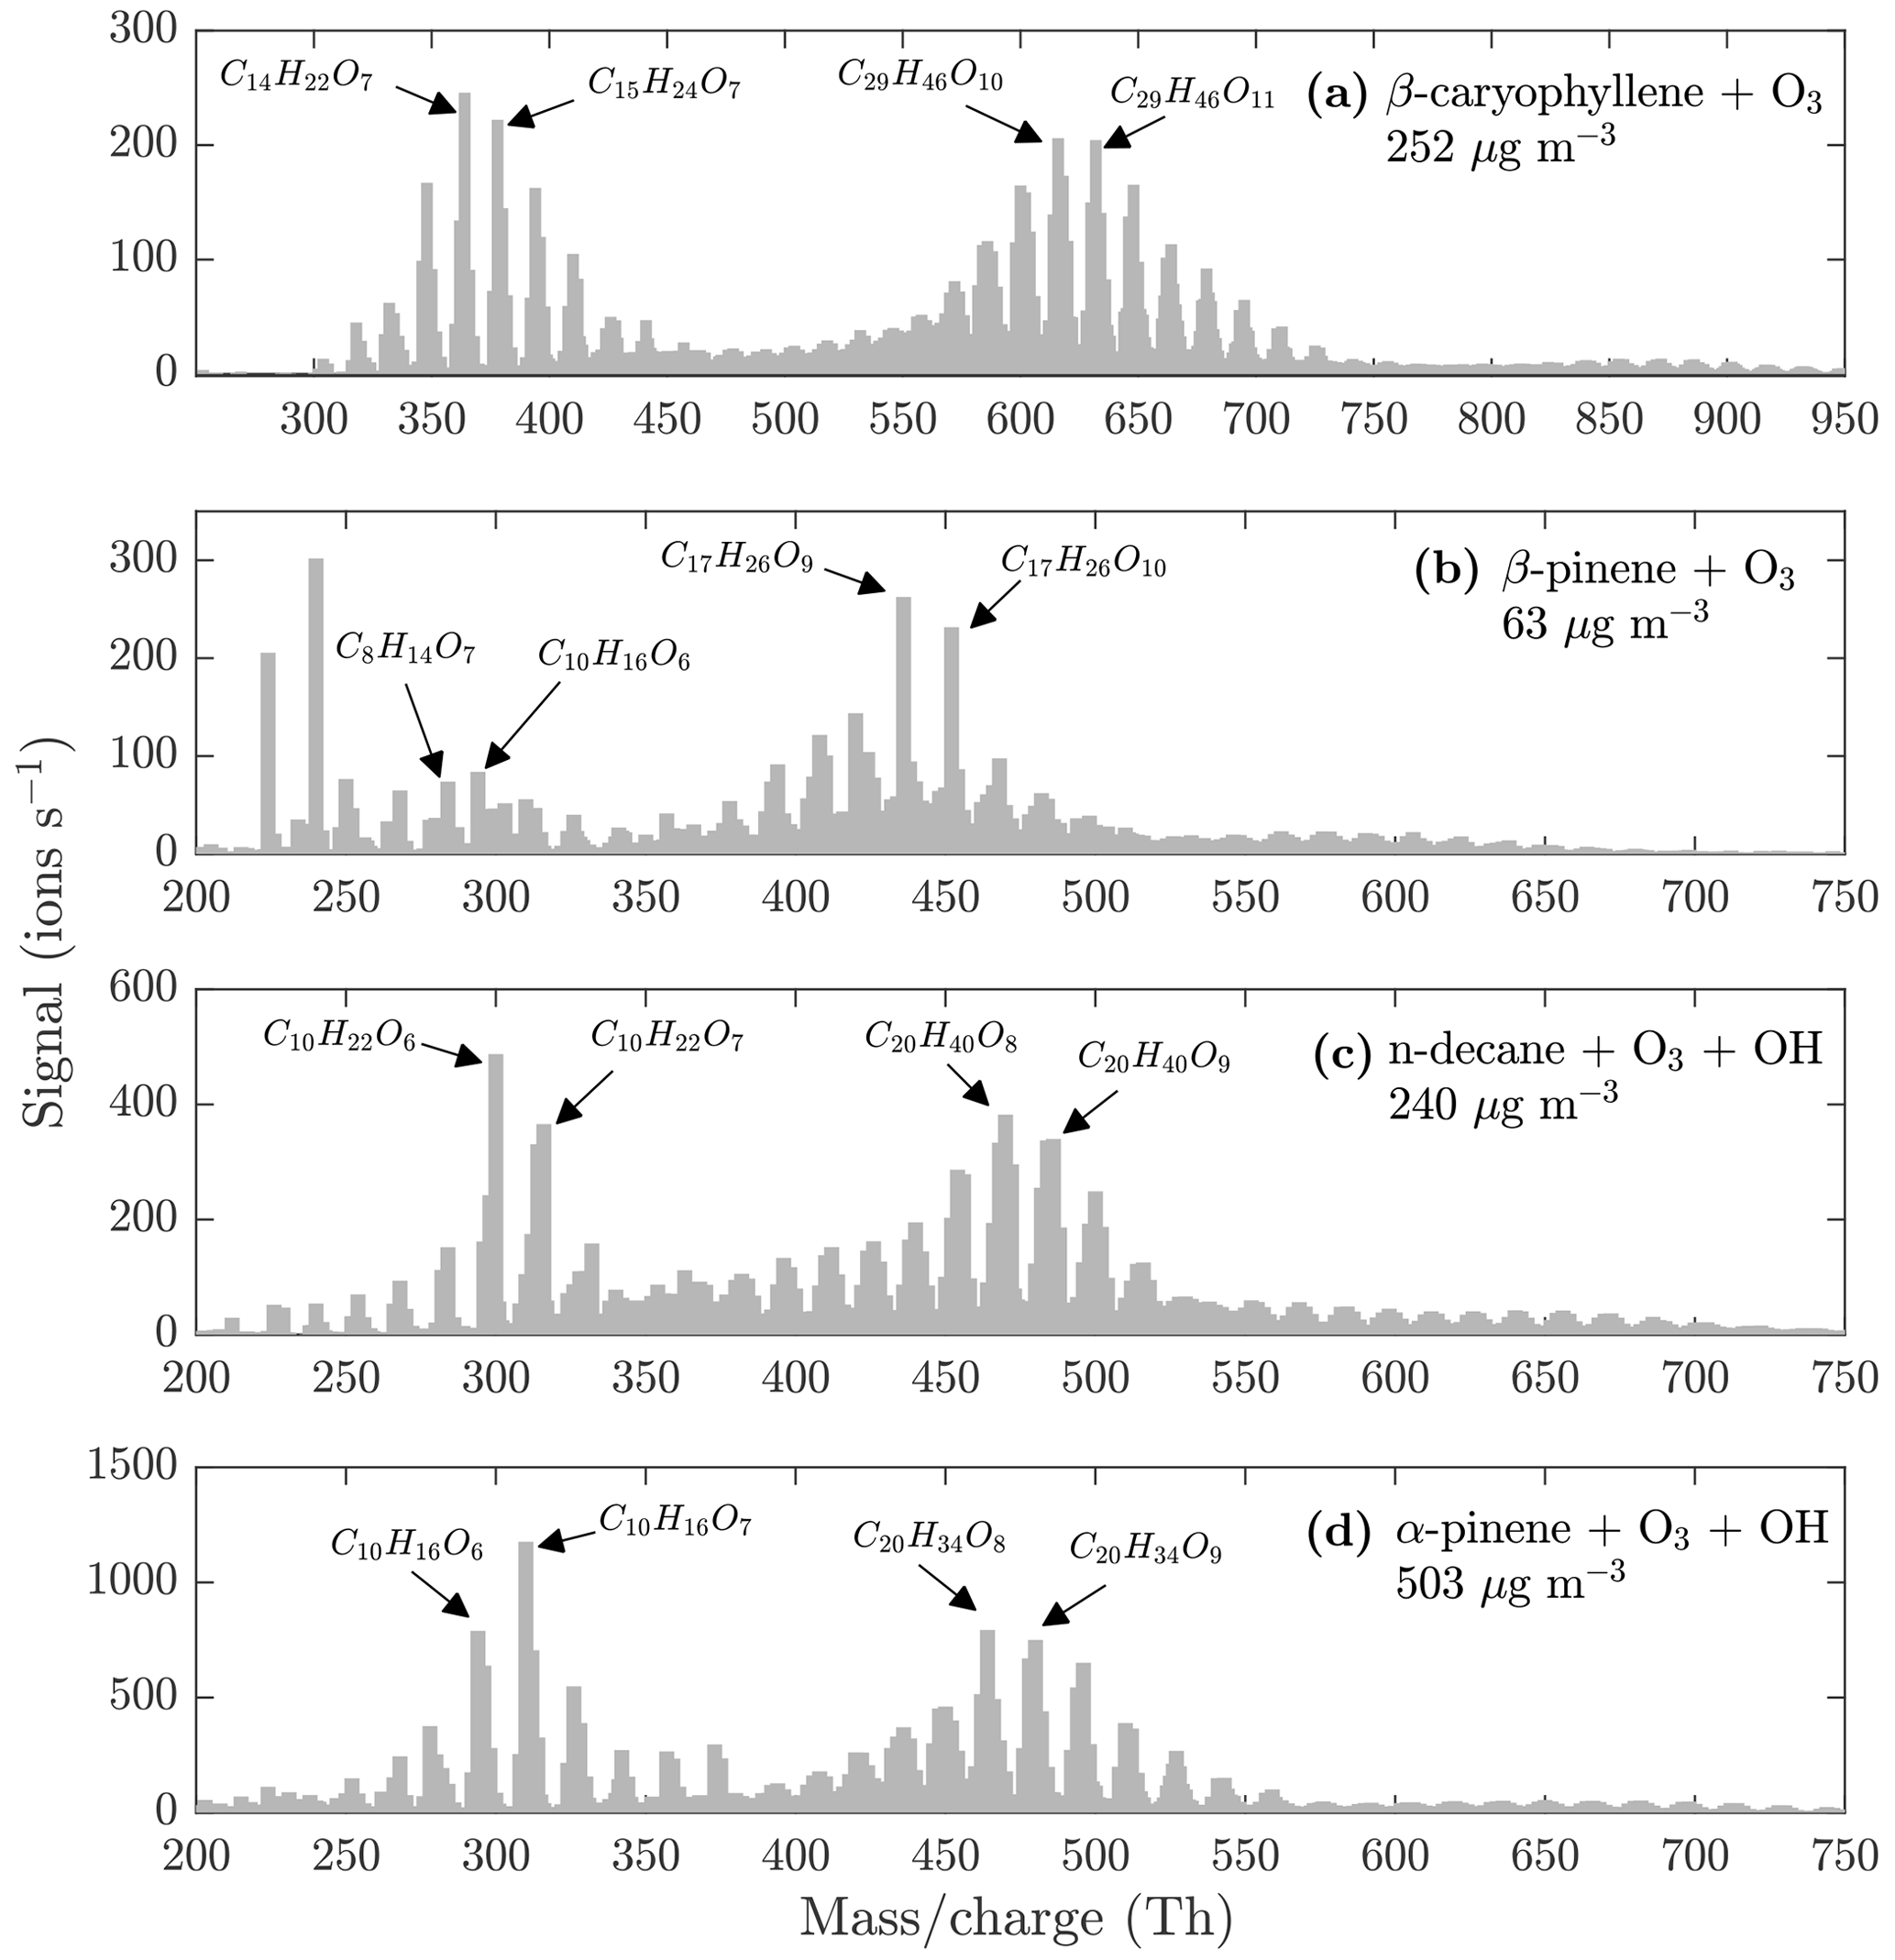
Figure 7Evaporation spectra measured by the NO3-CIMS during the heating of (a) β-caryophyllene SOA, (b) β-pinene SOA, (c) n-decane SOA, and (d) α-pinene SOA. The VIA was set to 230 ∘C. The concentrations are the total aerosol mass loadings in the VIA before dilution. All molecules were detected as clusters with the nitrate ion.
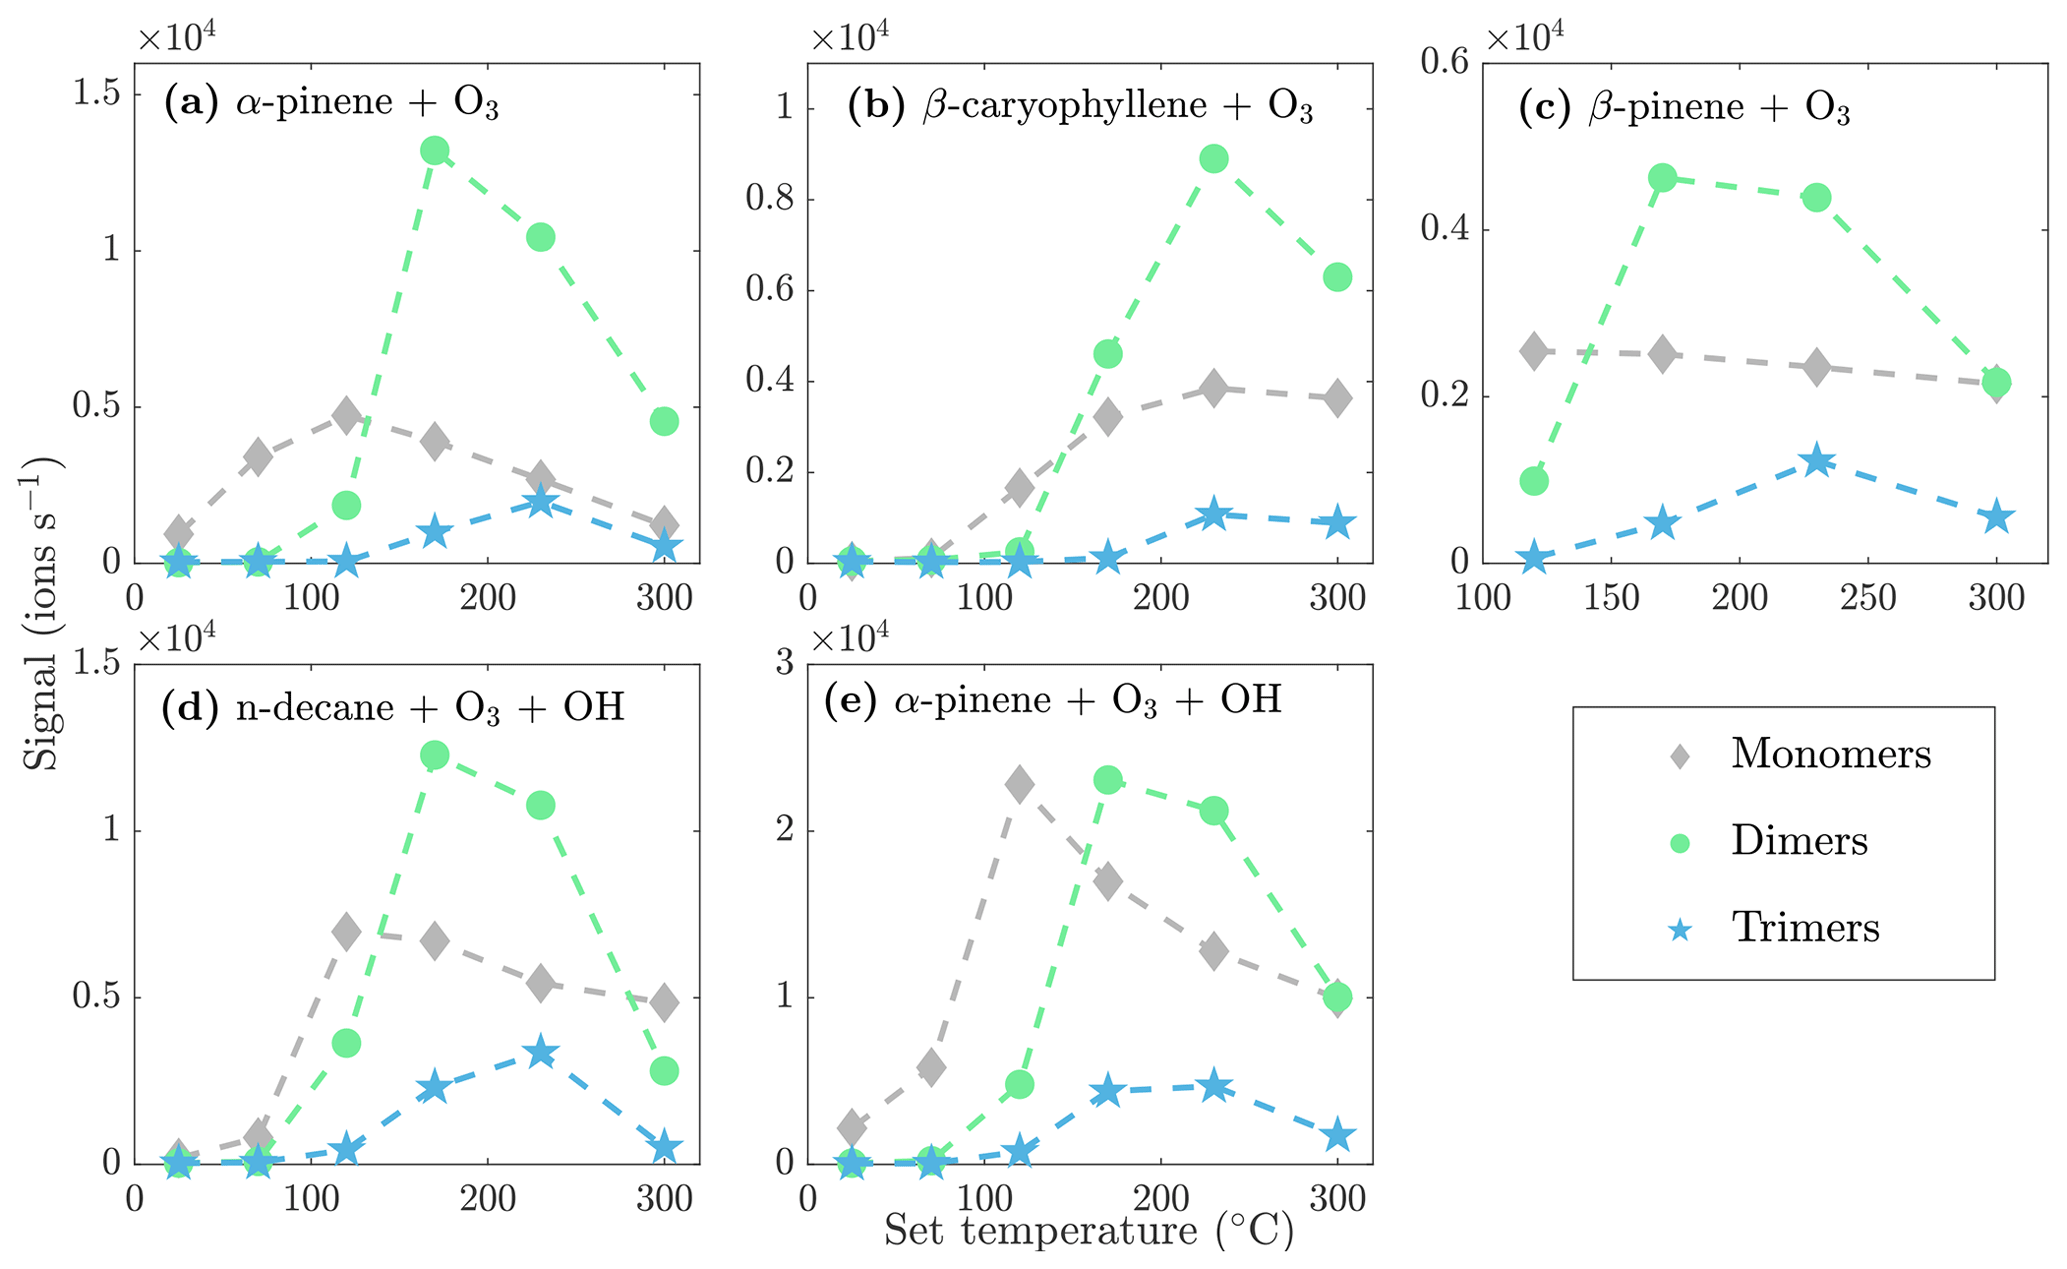
Figure 8Sum of the evaporated monomer, dimer, and trimer signals as a function of the set VIA temperature for different SOA evaporation experiments.
4.1.1 Comparison of the gas- and particle-phase compounds
To further investigate the differences between the gas and the particle phase, we performed additional experiments in the environmental chamber. We injected α-pinene and ozone into the chamber and measured the gas-phase compounds directly with the NO3-CIMS. Then, we injected NaCl seed particles with a diameter of 80 nm into the chamber to provide a surface for the gas-phase compounds to condense on. We measured the particle-phase compounds using the VIA set to 230 ∘C and made a comparison of the a-pinene ozonolysis gas- and particle-phase spectra (Fig. 9a). The sample flow through the VIA was 2 L min−1, and a dilution flow of 8 L min−1 of clean air was added after the VIA. Our results are consistent with previous work (Peräkylä et al., 2020) showing that the majority of the compounds with an ratio larger than 300 Th condense efficiently into the particle phase due to their low volatilities, and few of the compounds with an ratio smaller than 300 Th are found from the particle phase. If the gas-phase compounds undergo condensation into the particle phase without a structural change, one would expect to see a similar signal distribution in the gas and the particle phase, which is not observed here. Instead, the signal distributions are clearly different in the gas phase compared to the particle phase, suggesting that the condensed compounds are formed through particle-phase reactions or through some other processes within the VIA. Furthermore, molecular-level differences between the gas- and particle-phase compounds (Fig. 9b–d) suggest the occurrence of particle-phase reactions, which could lead to dimer and other larger oligomer formation in the particle phase. We do not estimate the partitioning of the compounds between the gas and the particle phase, as it is possible that the compounds are transformed after condensing into the particle phase.
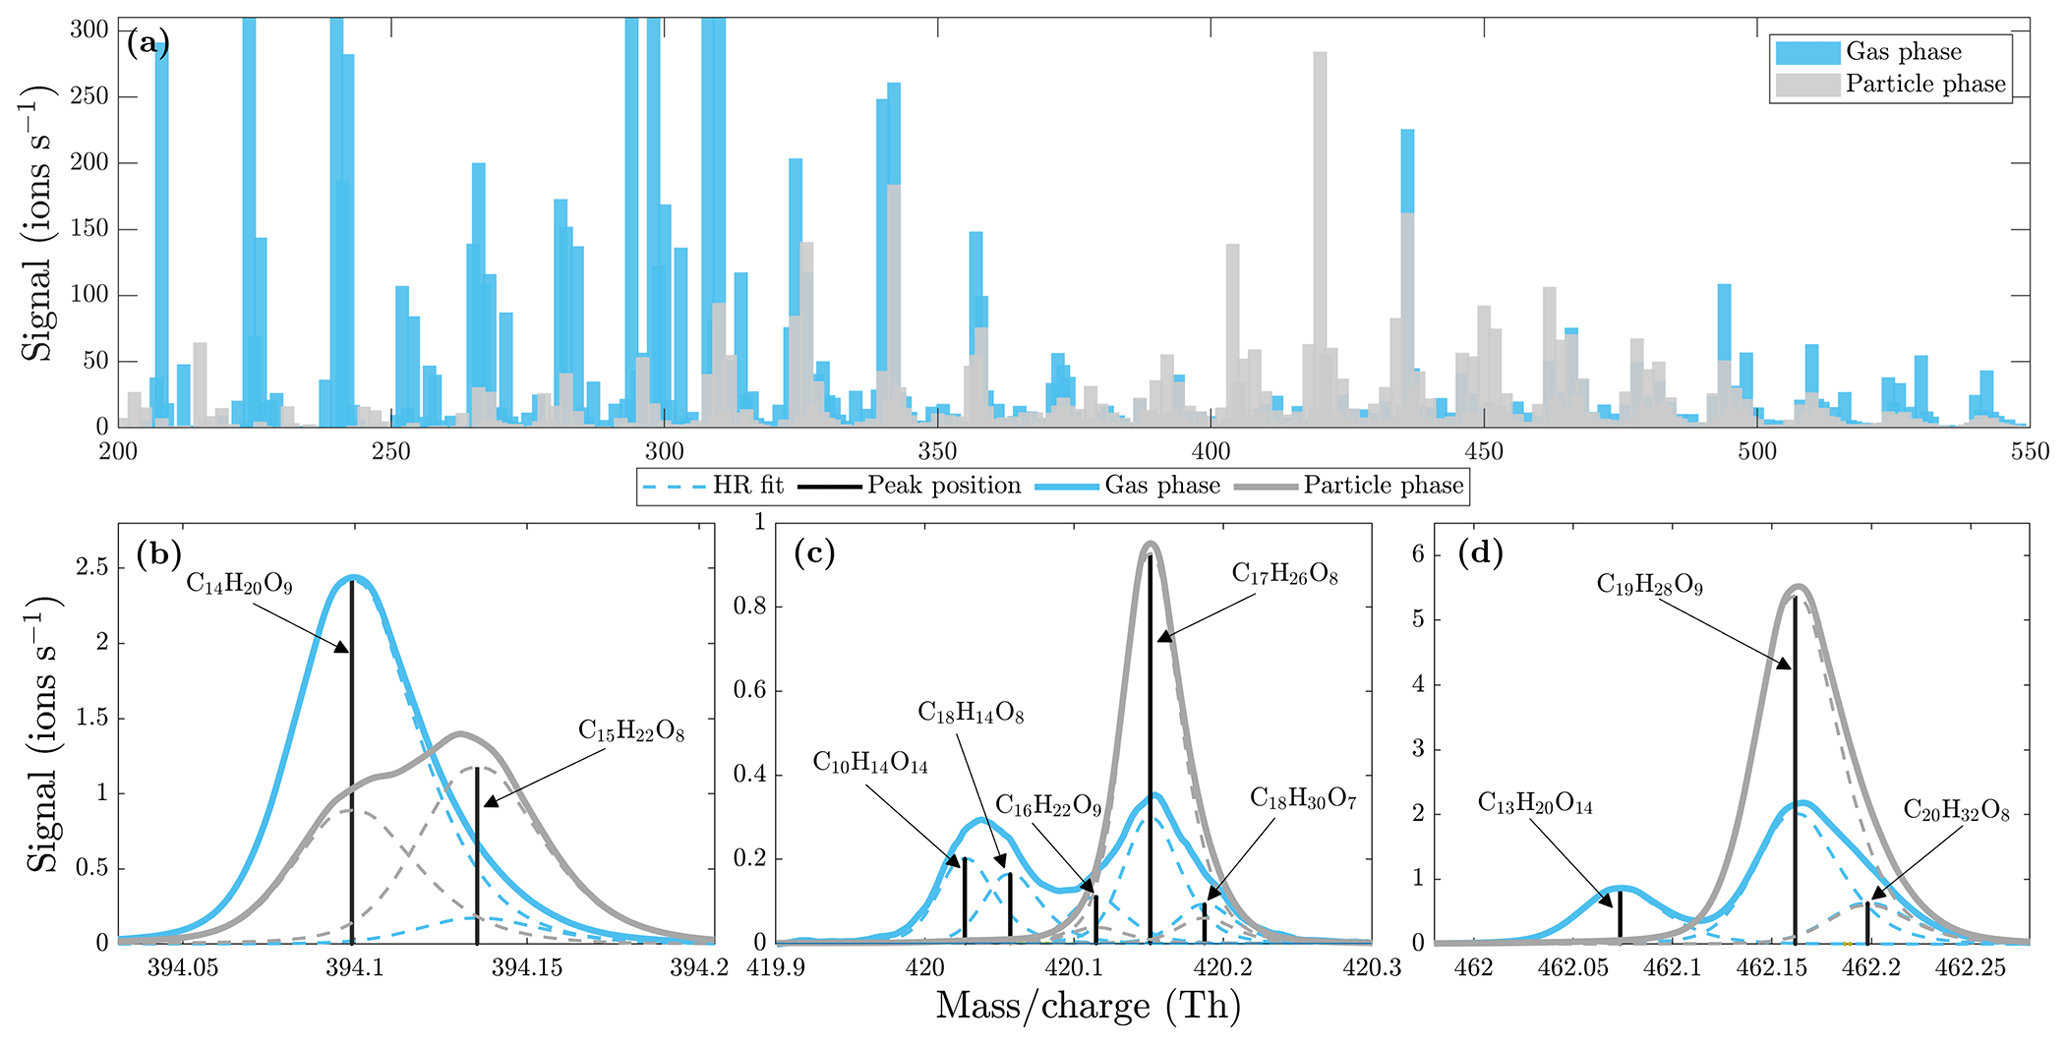
Figure 9Comparison of α-pinene ozonolysis gas- and particle-phase spectra (at a set temperature of 230 ∘C) measured by the NO3-CIMS. (a) Unit mass resolution (UMR) spectra with 20 min averaging. (b, c, d) High-resolution peak fits. Gas-phase spectrum in blue and particle-phase spectrum in gray. All molecules were detected as clusters with the nitrate ion.
4.1.2 Contribution of highly oxygenated compounds to SOA
Evaporated mass concentration from different kinds of SOA and the atomized sucrose at the different temperature stages are shown in Fig. 10. Concentrations measured by the SMPS are calculated by assuming spherical particles with a density of 1400 kg m−3 for SOA and of 1600 kg m−3 for sucrose. The NO3-CIMS signals were converted to mass concentration using a calibration factor of 2 × 1010 cm−3 obtained from the ammonium sulfate calibration we performed (see Sect. 3.2). Compounds with an ratio larger than 200 Th were included in the analysis. As noted in Sect. 4.1, the removal of the gas-phase compounds before the VIA disturbs the gas–particle equilibrium and could lead to evaporation of some organic compounds already at 25 ∘C. This could explain the larger amount of evaporated mass detected by the NO3-CIMS than the SMPS at 25 ∘C. Otherwise, the NO3-CIMS detects a smaller fraction of the evaporated compounds at lower temperatures compared to higher temperatures. This is expected, as the NO3-CIMS is not able to detect the least oxygenated compounds that evaporate from the particles first. Under the conditions of our experiment, our best estimate is that 10 % to 20 % of the total SOA mass was highly oxygenated compounds that the NO3-CIMS was able to detect. Previous studies of α-pinene ozonolysis have estimated that the contribution of condensing HOMs to total SOA mass was 50 % to 70 % (Ehn et al., 2014; Roldin et al., 2019). These studies were performed at lower SOA loadings (10 µg m−3) than what we used in the current study. For SOA loadings as high as those we used, we expect that the contribution of highly oxygenated compounds to total SOA mass would decrease due to partitioning of more volatile and less oxygenated species to the particles. Given this effect, the unknown particle-phase processes that can alter the SOA composition, and the large uncertainty in our quantification, our estimate seems to be within a reasonable and plausible range. More exact numbers will require further work to improve both the sampling and the quantification of our new VIA–NO3-CIMS design.
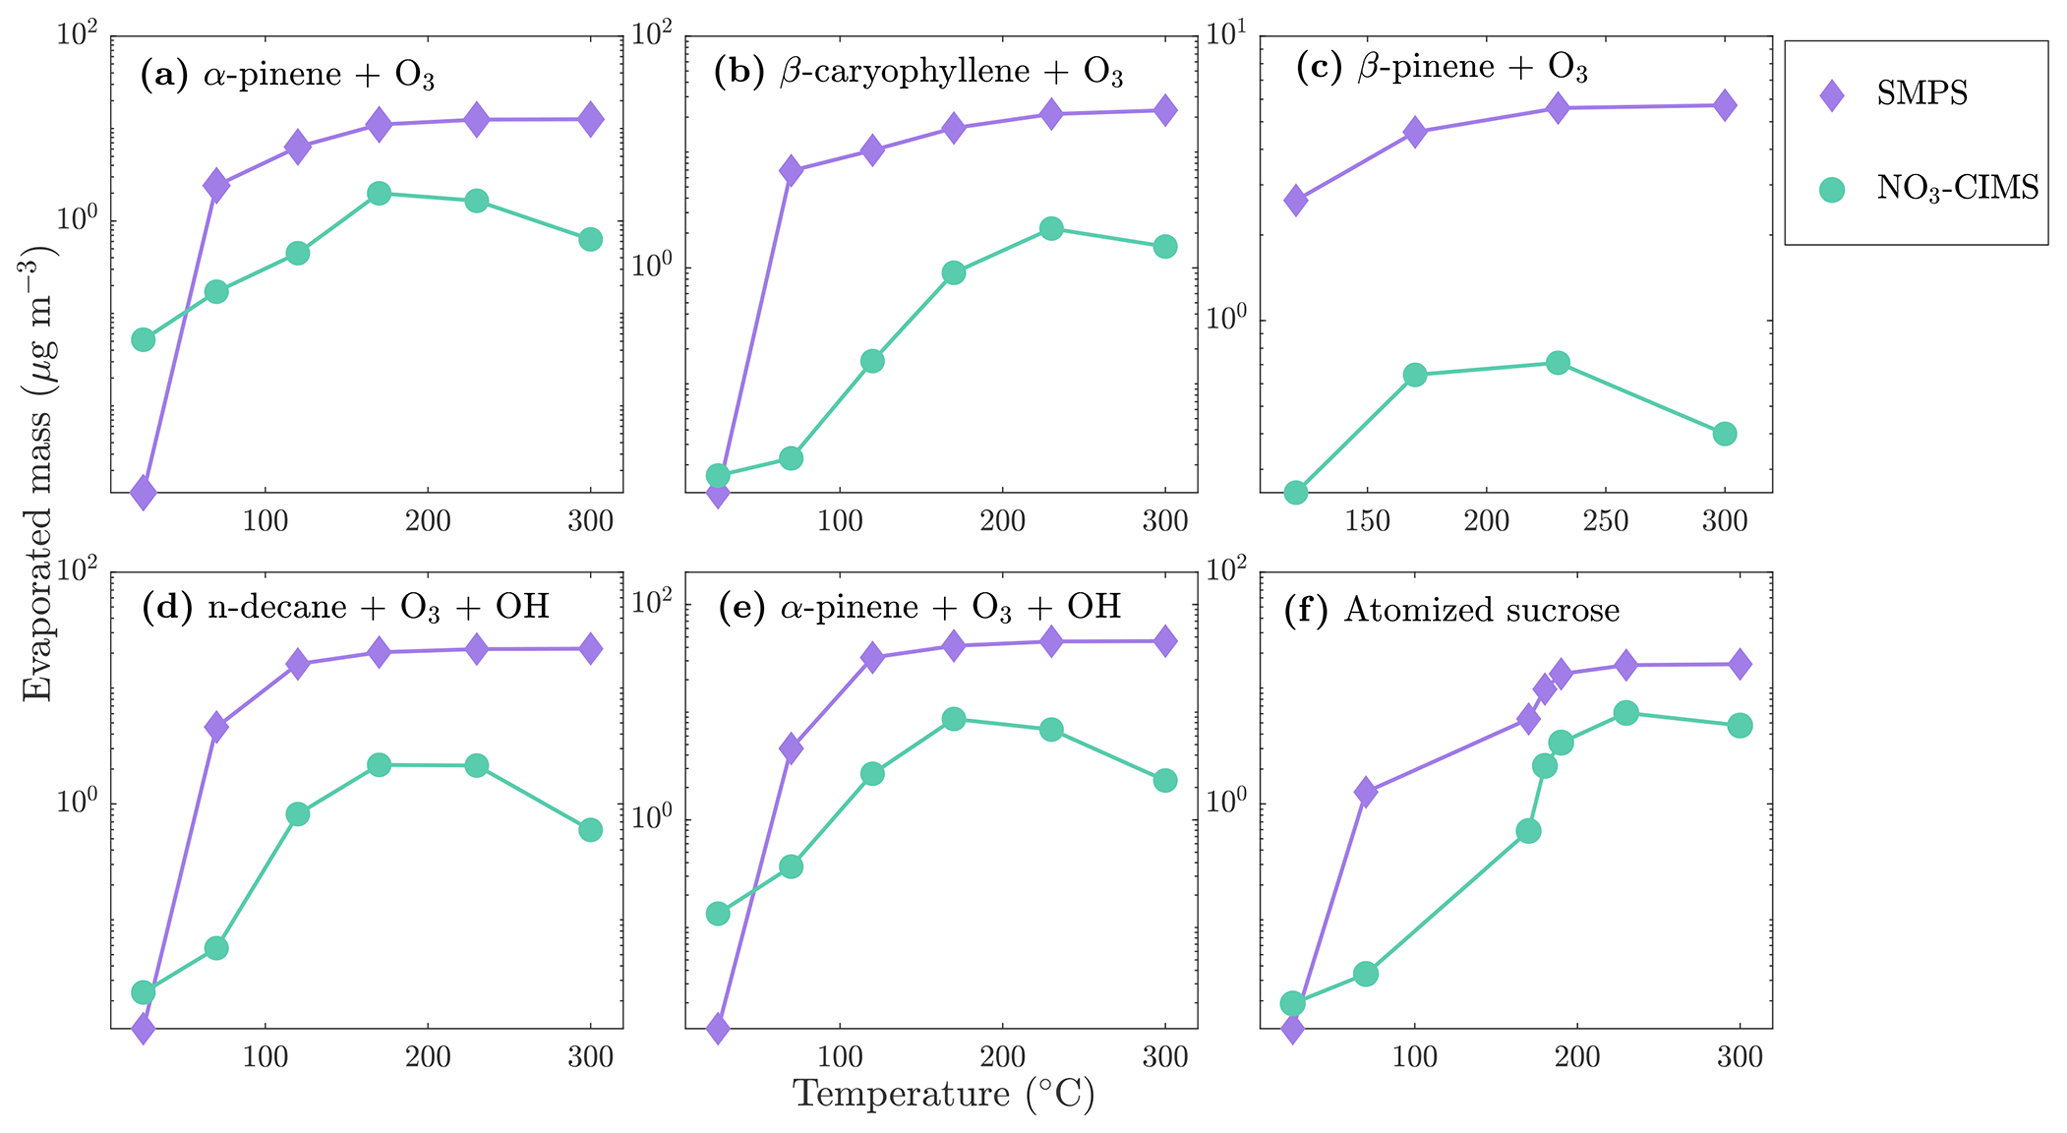
Figure 10Mass evaporated from particles measured by the SMPS and the NO3-CIMS during SOA and sucrose evaporation at different temperatures. A calibration factor of 2 × 1010 cm−3 was used for the NO3-CIMS mass concentration calculations.
4.2 Limitations of the method
4.2.1 Thermal decomposition
Using thermal evaporation to transfer compounds from particle phase to gas phase has potential limitations, such as thermal decomposition. Thermally unstable large molecules may decompose to form smaller fragments upon heating. These smaller fragments can then be detected, depending on the used gas-phase analyzer. Lopez-Hilfiker et al. (2015) measured acyl-containing compounds from α-pinene SOA using FIGAERO and reported thermograms showing secondary modes at much higher temperatures than expected for the specific molecular composition. These secondary modes were most likely caused by larger compounds decomposing to compounds with the same composition as the measured compound. In our results, the decrease in the NO3-CIMS signals after exceeding the optimal evaporation temperature could be attributed to thermal decomposition. When the set temperature was increased from 230 to 300 ∘C, the signals of larger ions (> 500 Th) decreased the most. However, we did not detect considerably large quantities of possible fragments resulting from thermal decomposition of the larger molecules. The total monomer signal decreased, and the signal of a few small ions (< 350 Th) increased. The products of the decomposition are likely to be higher-volatility and less oxygenated compounds that cannot be detected by the NO3-CIMS, and thus they are not seen in our results. The role of thermal decomposition in this system remains an important topic for future studies.
4.2.2 Vapor loss within the VIA
Thermal decomposition might not be the only reason for the observed signal decrease. Some compounds might begin to evaporate closer to the VIA entrance at higher VIA temperatures compared to lower VIA temperatures, and thus they have more time to collide with the surrounding walls and be lost. Furthermore, mixing the 1.5 or 2 L min−1 sample flow with 8 or 15 L min−1 clean air flow after the VIA can lead to turbulence and increased losses of the highly oxygenated compounds between the VIA and the NO3-CIMS. During the ammonium sulfate calibration of the NO3-CIMS, we did not observe a signal decrease when the set temperature was increased from 230 to 300 ∘C. However, according to the SMPS data, around 50 % of the ammonium sulfate mass was evaporated at 230 ∘C and around 70 % at 300 ∘C. Due to this, the additional evaporation at 300 ∘C could compensate the potential signal decrease. For the future experiments, the transmission of the evaporated compounds from the VIA to the NO3-CIMS needs to be improved to minimize the possible losses. Despite these limitations, the NO3-CIMS coupled to the VIA is a promising method able to detect particulate highly oxygenated compounds, even oligomers that are prone to thermal decomposition.
We present a method for measuring highly oxygenated compounds from organic aerosol using thermal evaporation of aerosol in the VIA followed by identification of the evaporated compounds by the NO3-CIMS. With the experimental setup used here, we estimate detection limits of below 1 ng m−3 for a single compound and below 1 µg m−3 for SOA. This can likely be improved by optimization of the setup, such as increasing the sample flow through the VIA and adding the dilution air as a sheath flow around the sample flow to maximize the transmission of the evaporated compounds from the VIA to the NO3-CIMS. We demonstrate the detection of particulate highly oxygenated compounds by applying the described method to SOA generated from different precursors. Furthermore, we compare the gas- and particle-phase compounds and see indications of oligomeric compounds formed through particle-phase reactions within SOA.
The VIA allows continuous online aerosol sampling, allowing measurements of fast atmospheric processes. By coupling the NO3-CIMS to the VIA, we can investigate the transformations and fate of the highly oxygenated compounds after condensing into the particle phase with the same technique used to measure them in the gas phase. Furthermore, the VIA can be coupled to different gas-phase analyzers in order to gain information of the particulate compounds with different volatilities. Further work investigating the potential particle-phase reactions will increase our understanding of the evolution and fate of organic aerosol.
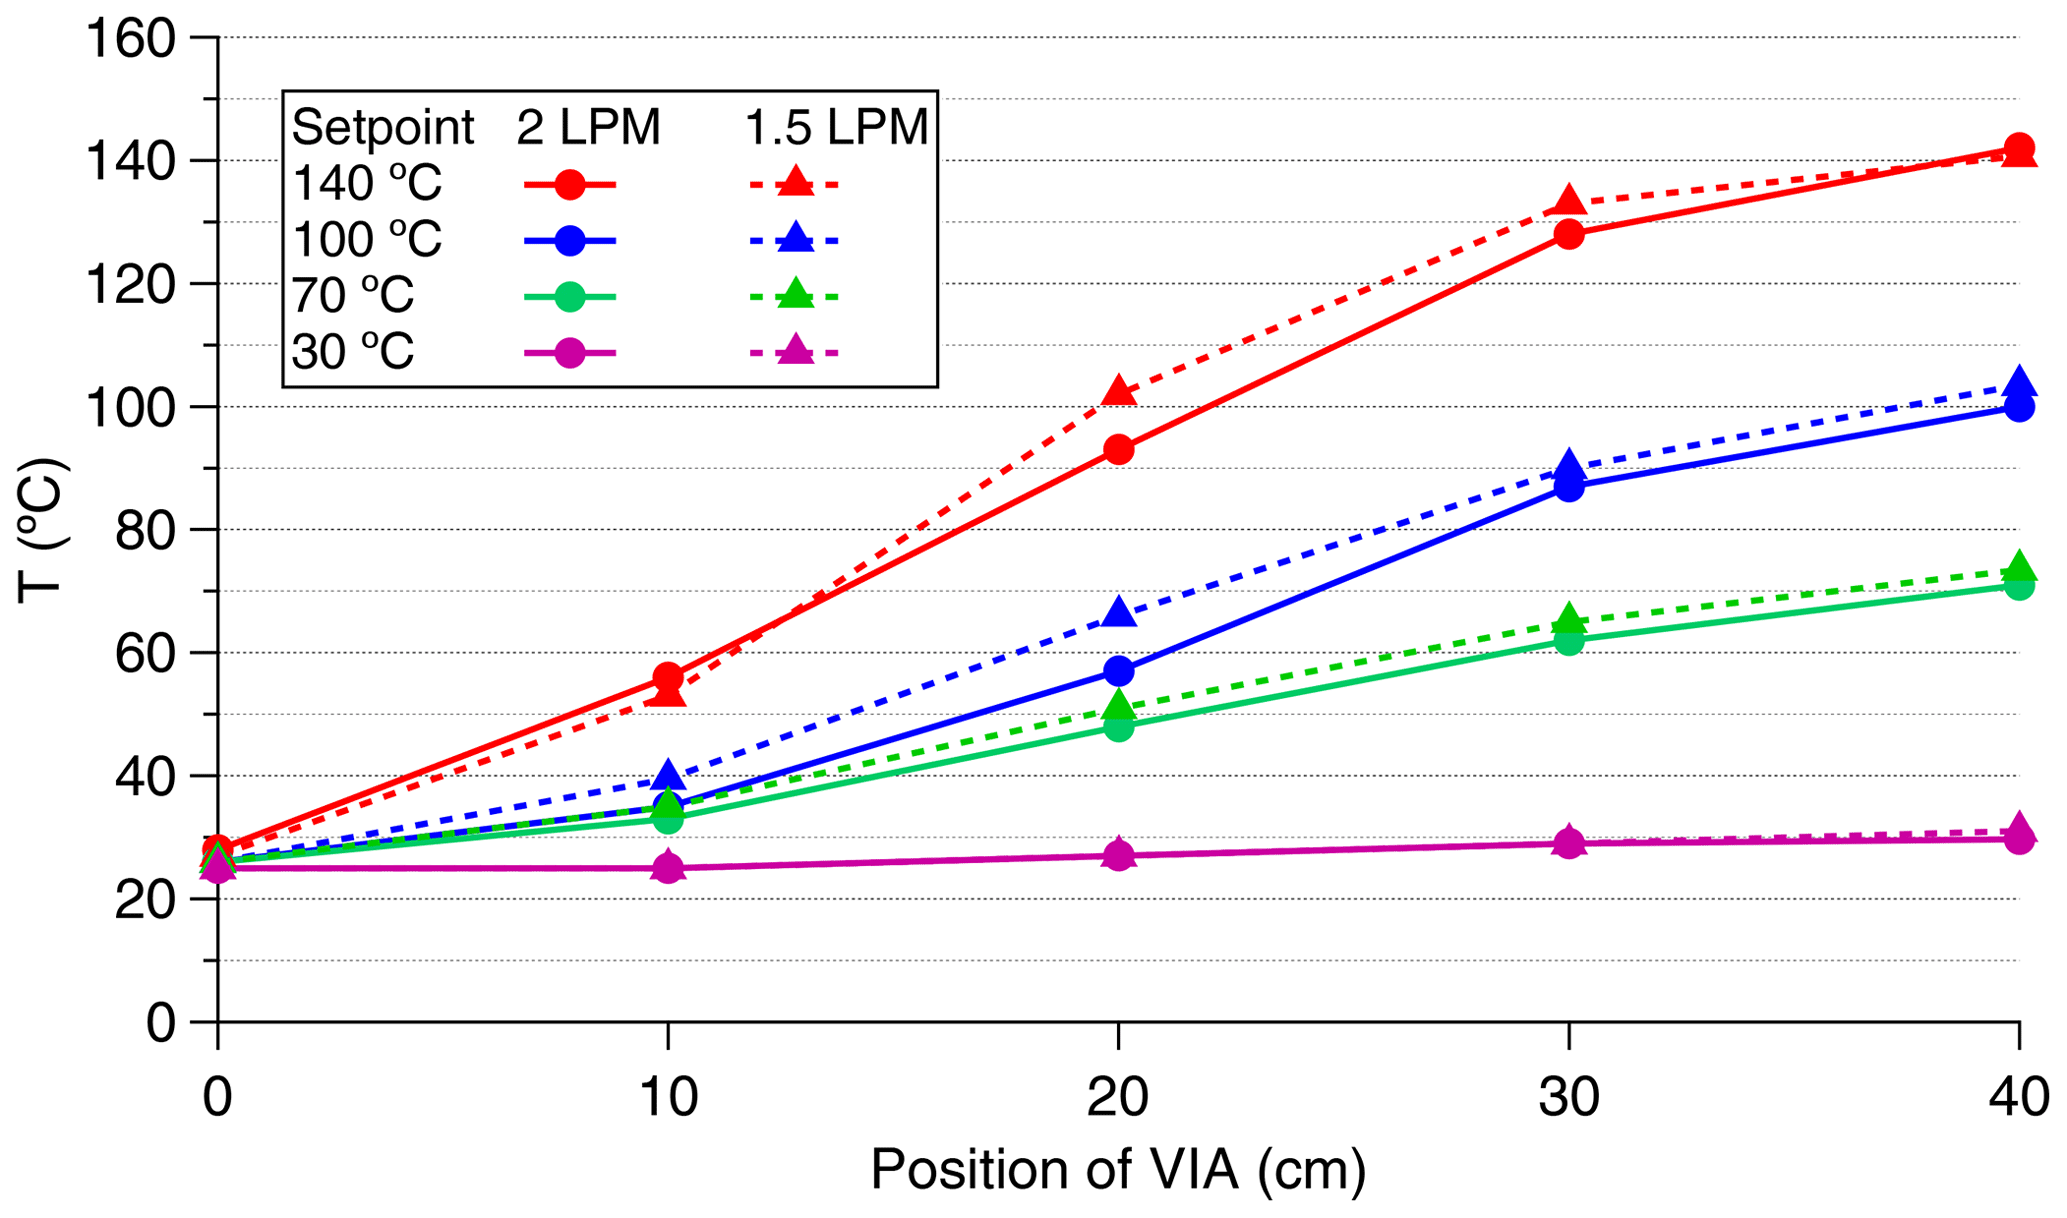
Figure A1Temperature profiles inside the thermal desorption unit of the VIA for different set temperatures and flow rates.
Table A1Peak list of the main compounds evaporated from α-pinene SOA particles. Note that the mass of the molecules includes the nitrate ion.
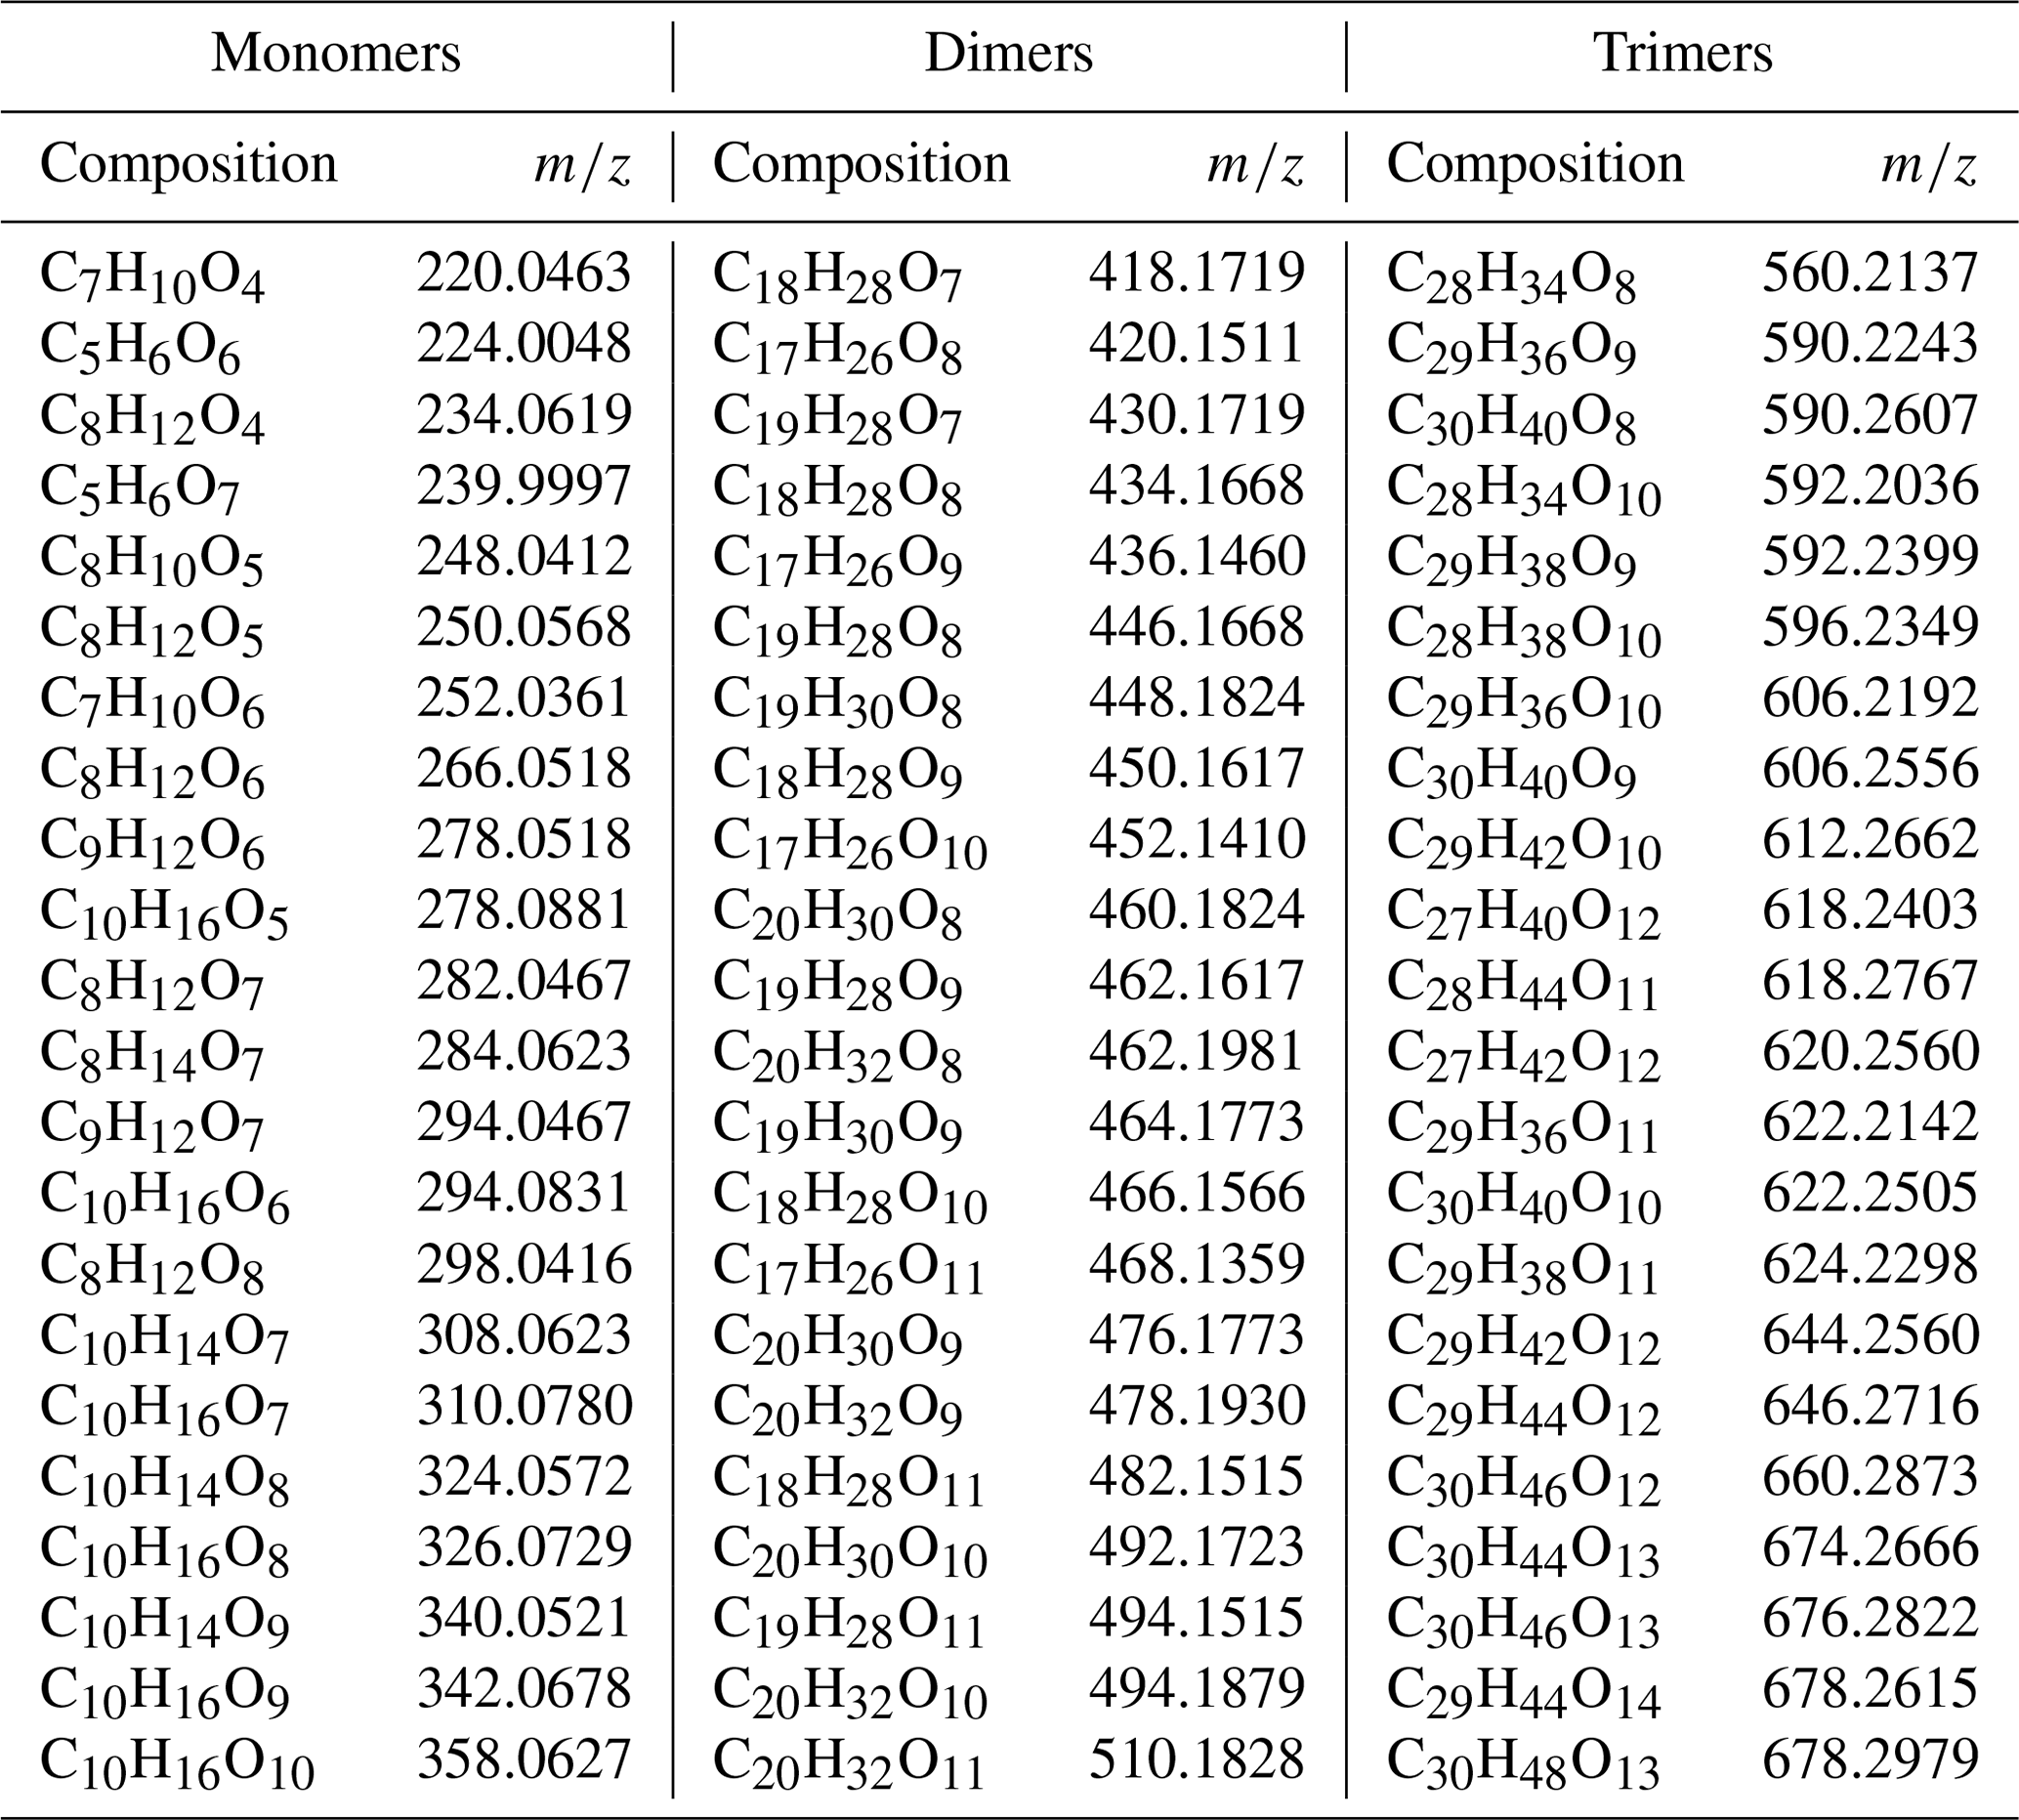
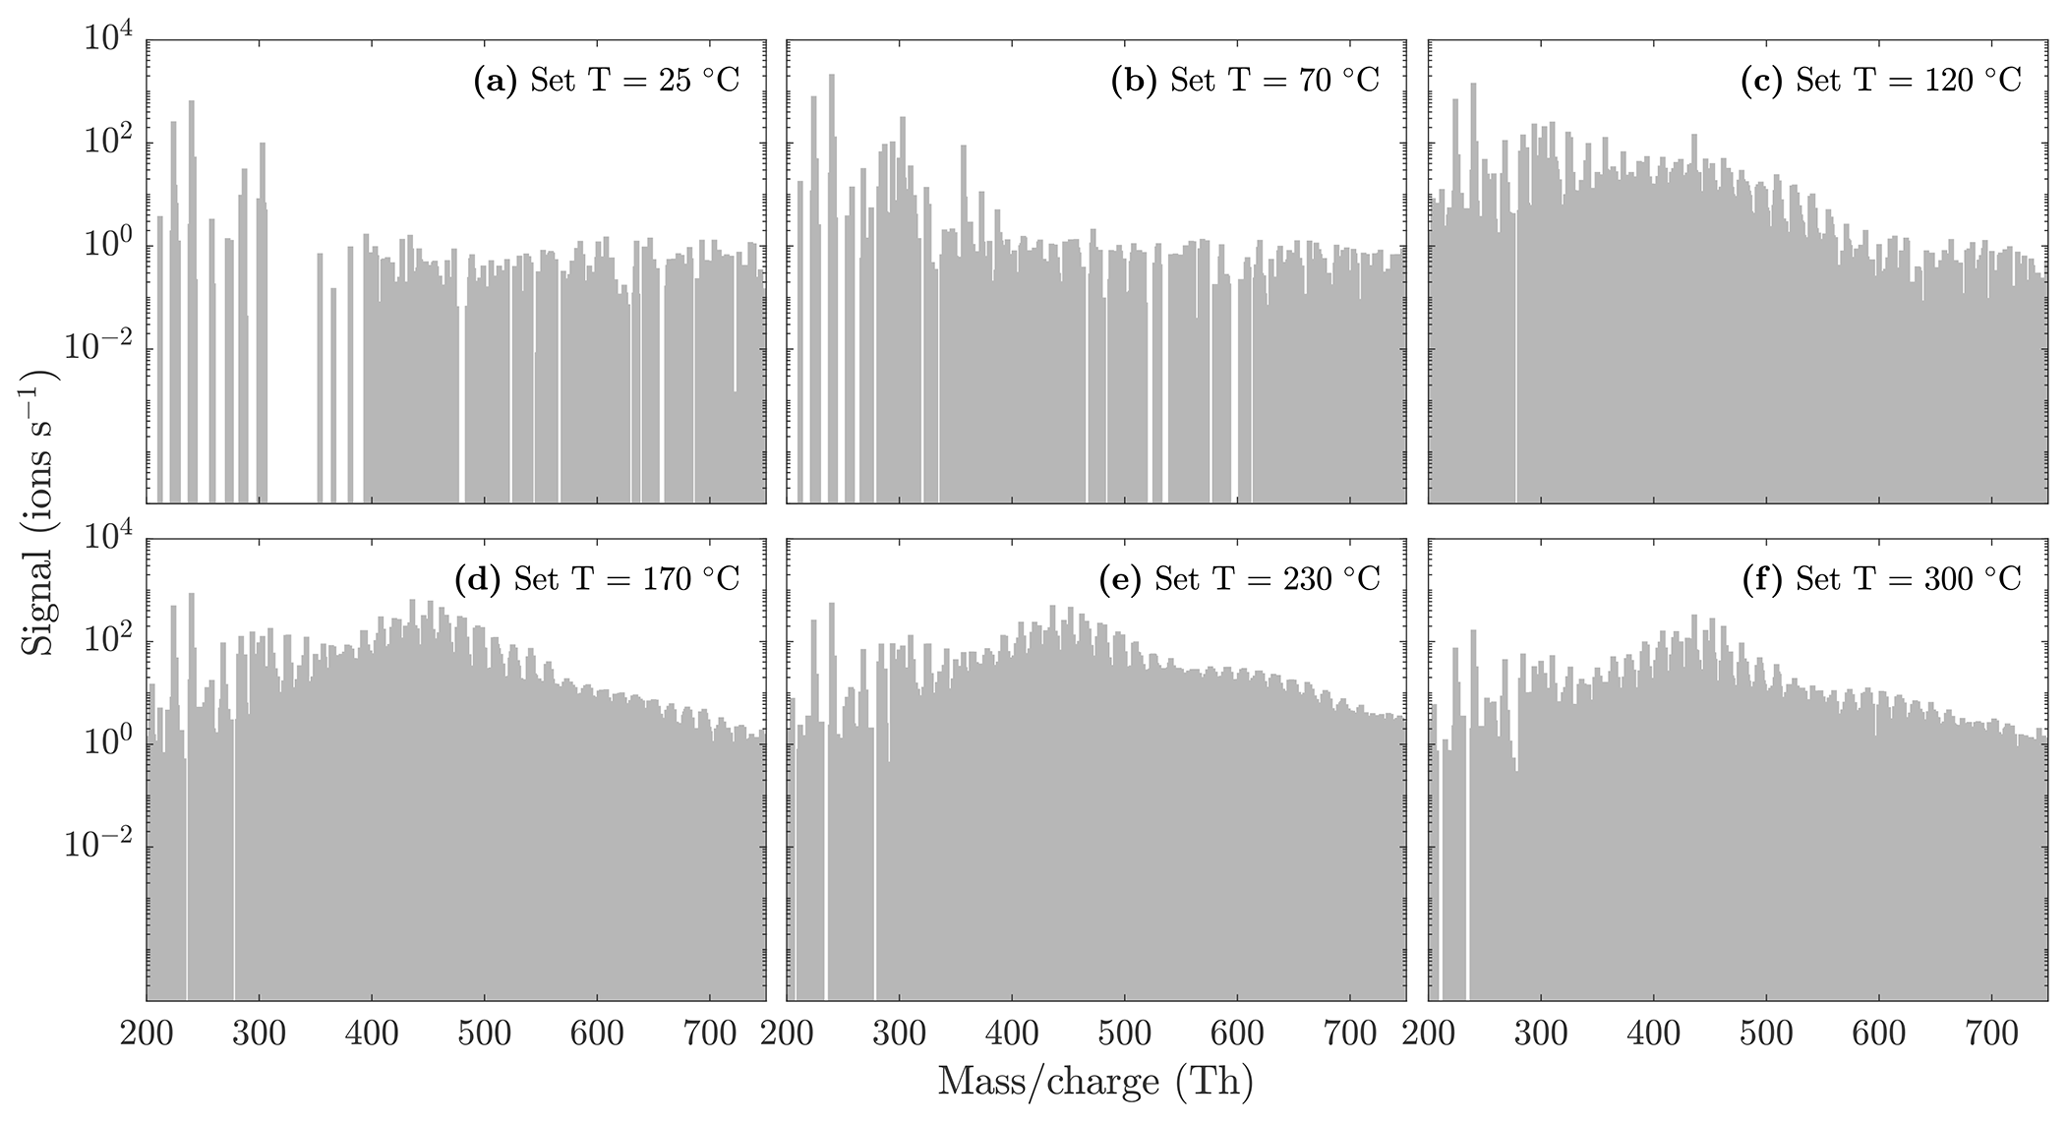
Figure A2NO3-CIMS spectra measured during α-pinene ozonolysis SOA evaporation at different temperatures. Same figure as Fig. 5, but with a logarithmic y scale to better show the trimer region.
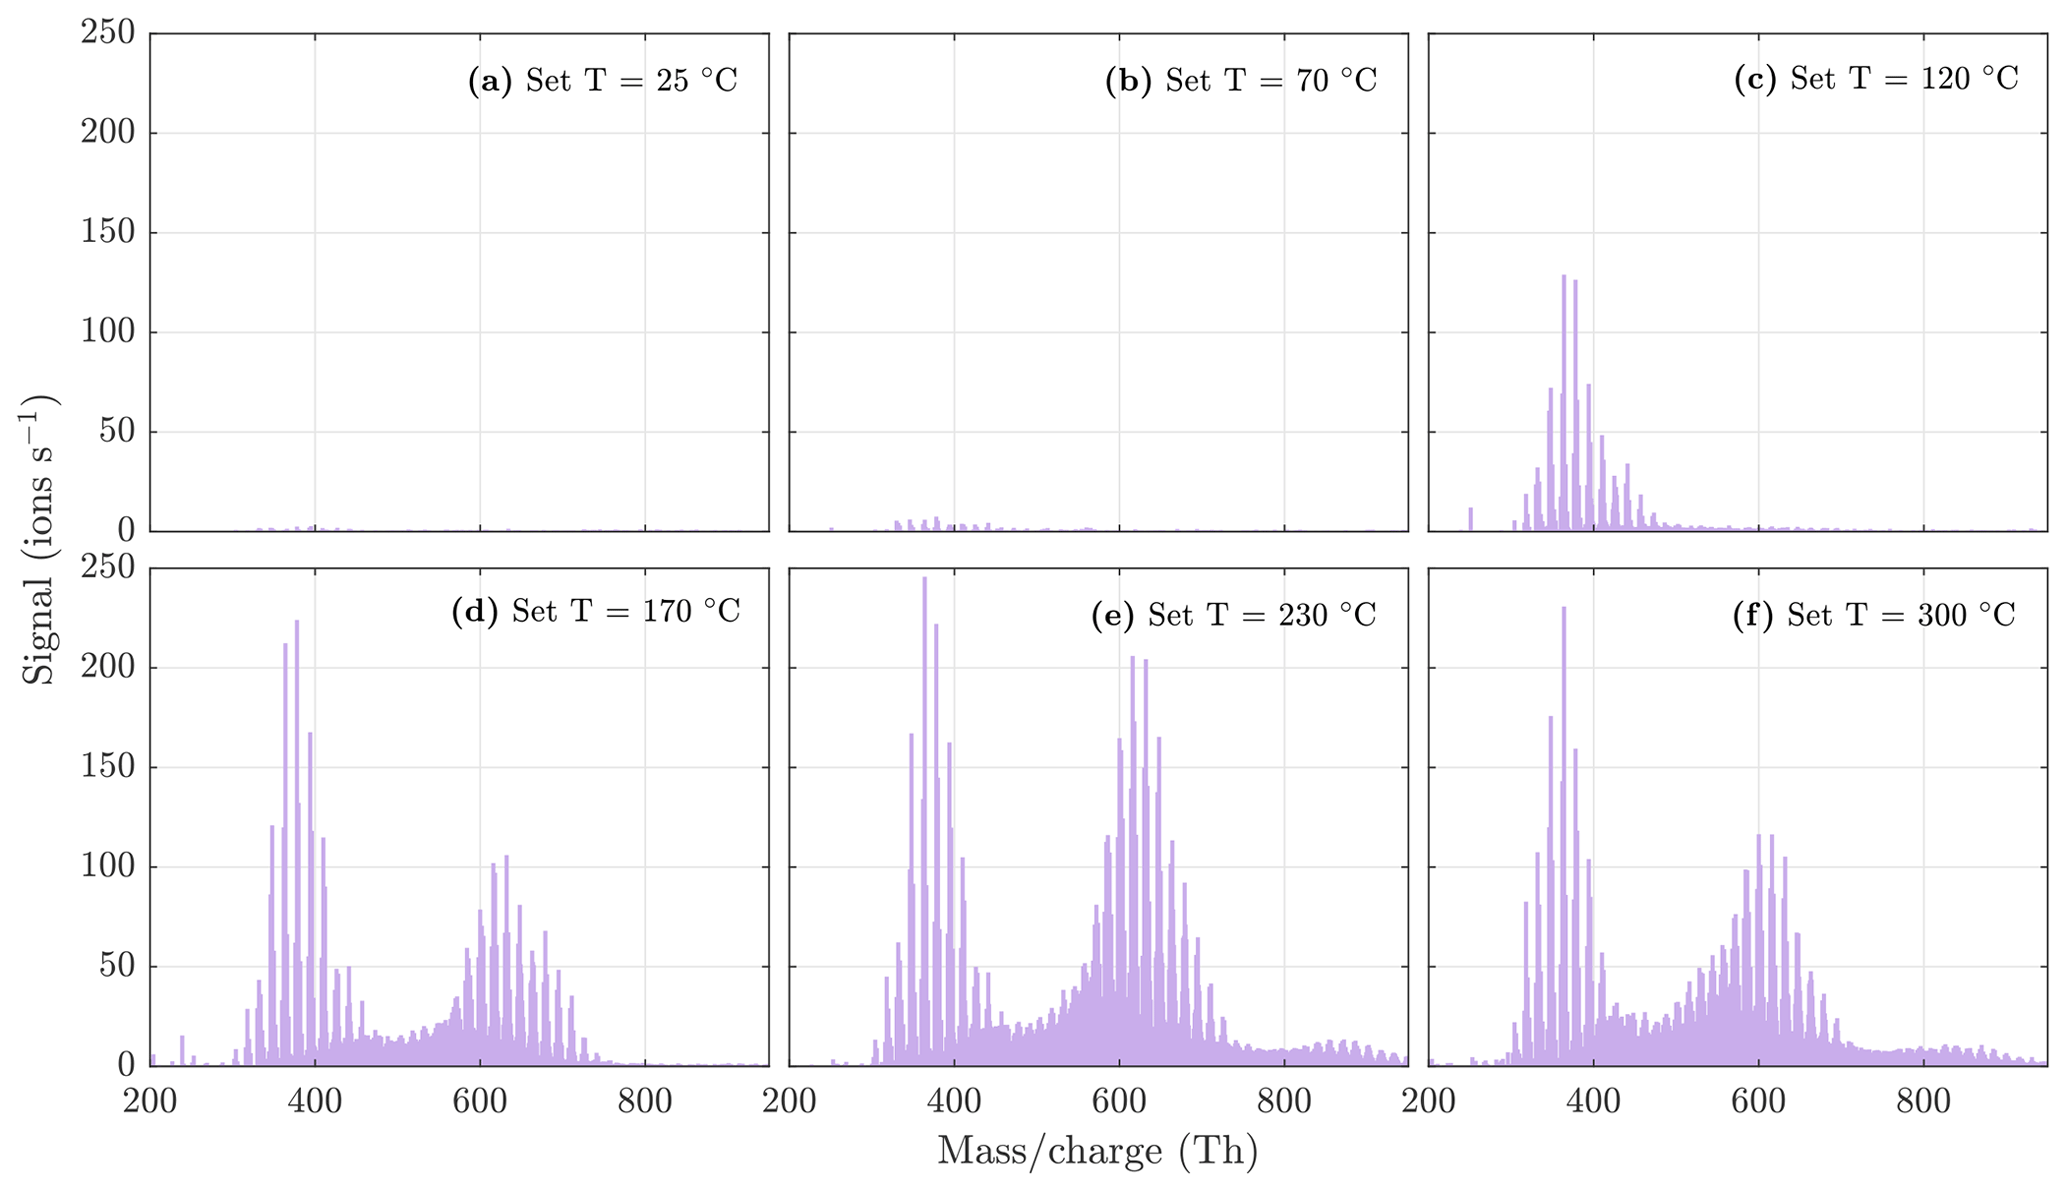
Figure A3NO3-CIMS spectra measured during β-caryophyllene ozonolysis SOA evaporation at different temperatures. The sample flow through the VIA was 1.5 L min−1, and a dilution flow of 15 L min−1 of clean air was added after the VIA. The total SOA mass loading was 252 µg m−3 in the VIA before dilution.
Figure A4NO3-CIMS spectra measured during β-pinene ozonolysis SOA evaporation at different temperatures. The sample flow through the VIA was 1.5 L min−1, and a dilution flow of 15 L min−1 of clean air was added after the VIA. The total SOA mass loading was 63 µg m−3 in the VIA before dilution.
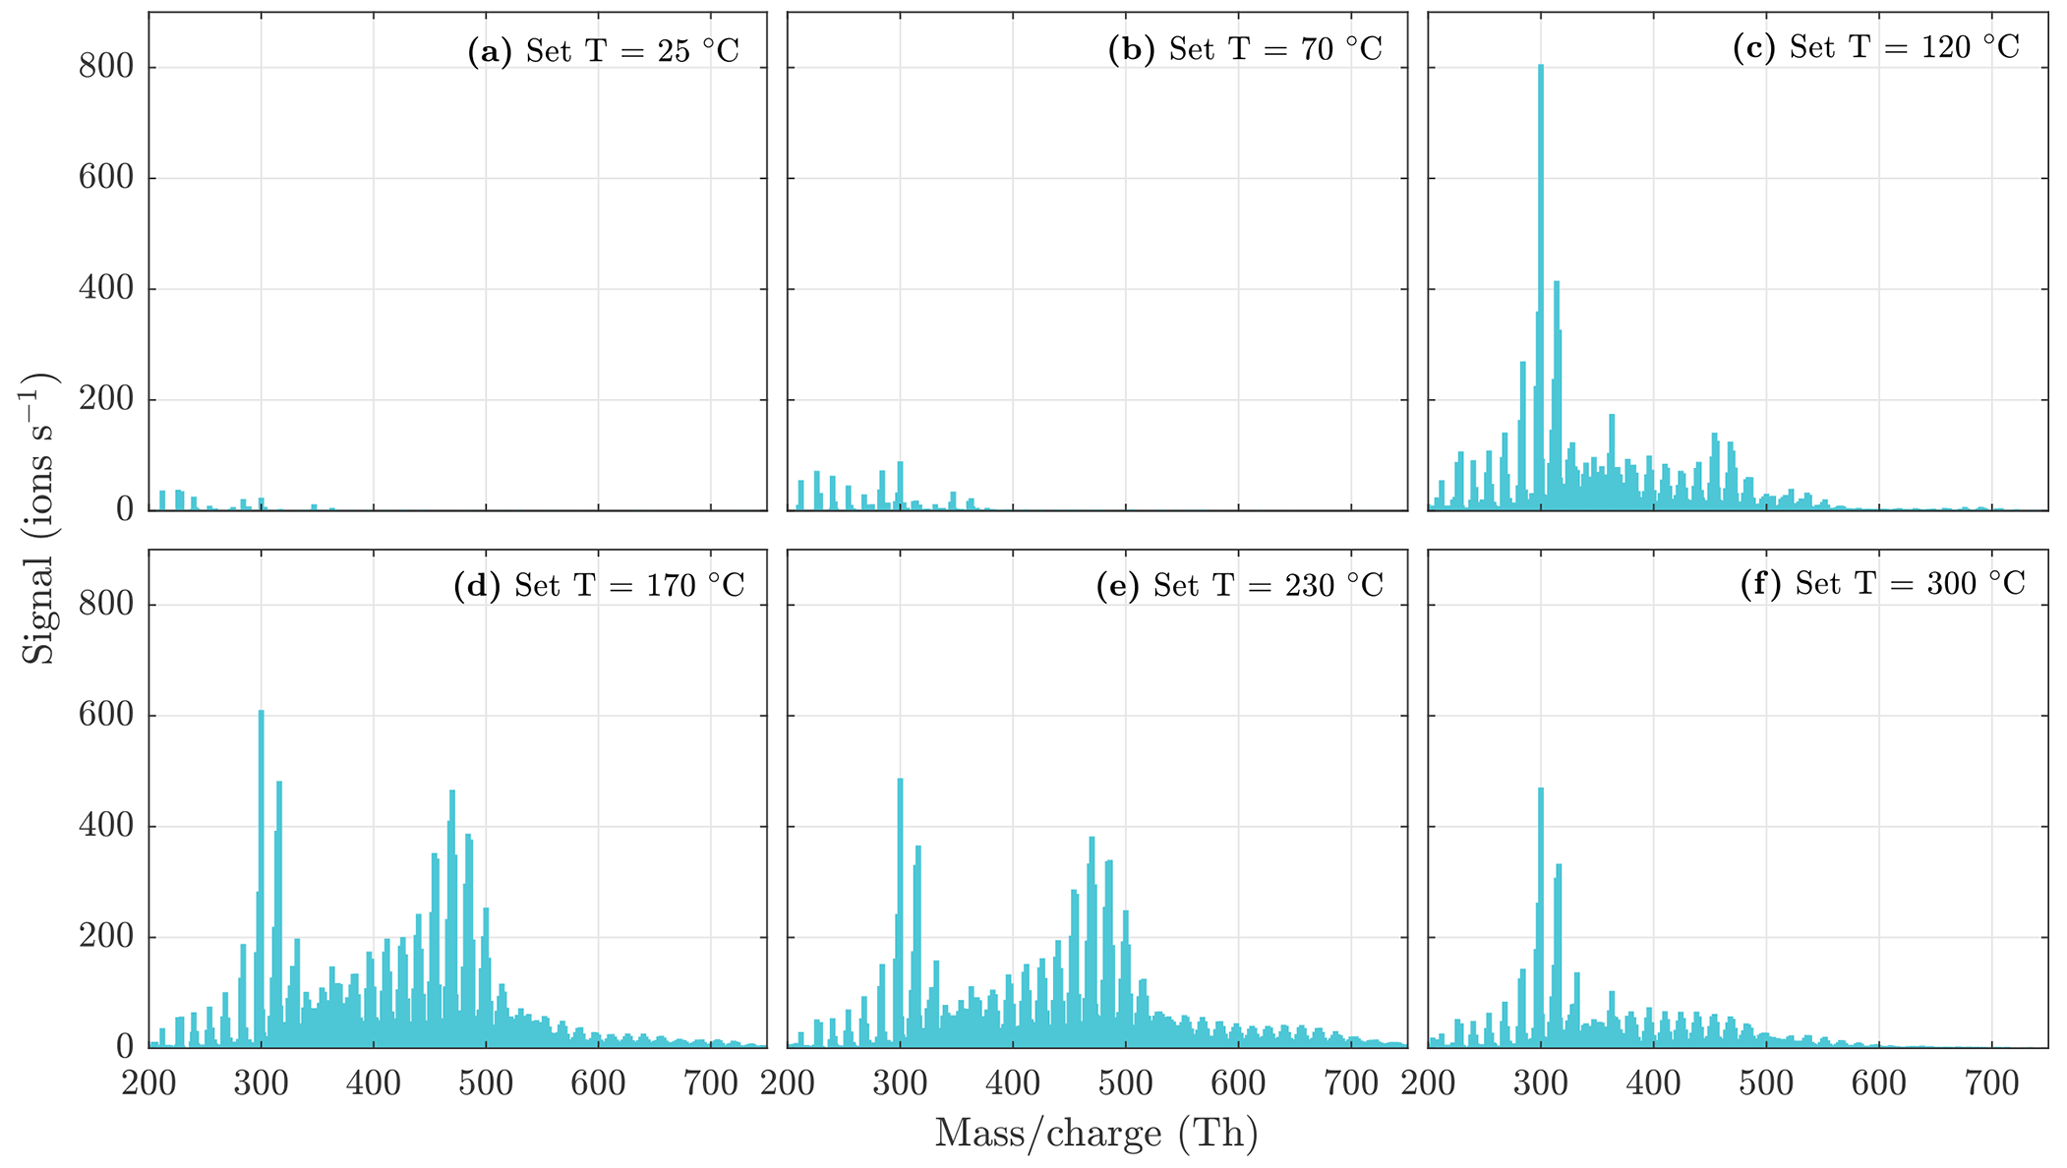
Figure A5NO3-CIMS spectra measured during n-decane ozonolysis and OH oxidation SOA evaporation at different temperatures. The sample flow through the VIA was 1.5 L min−1, and a dilution flow of 15 L min−1 of clean air was added after the VIA. The total SOA mass loading was 240 µg m−3 in the VIA before dilution.
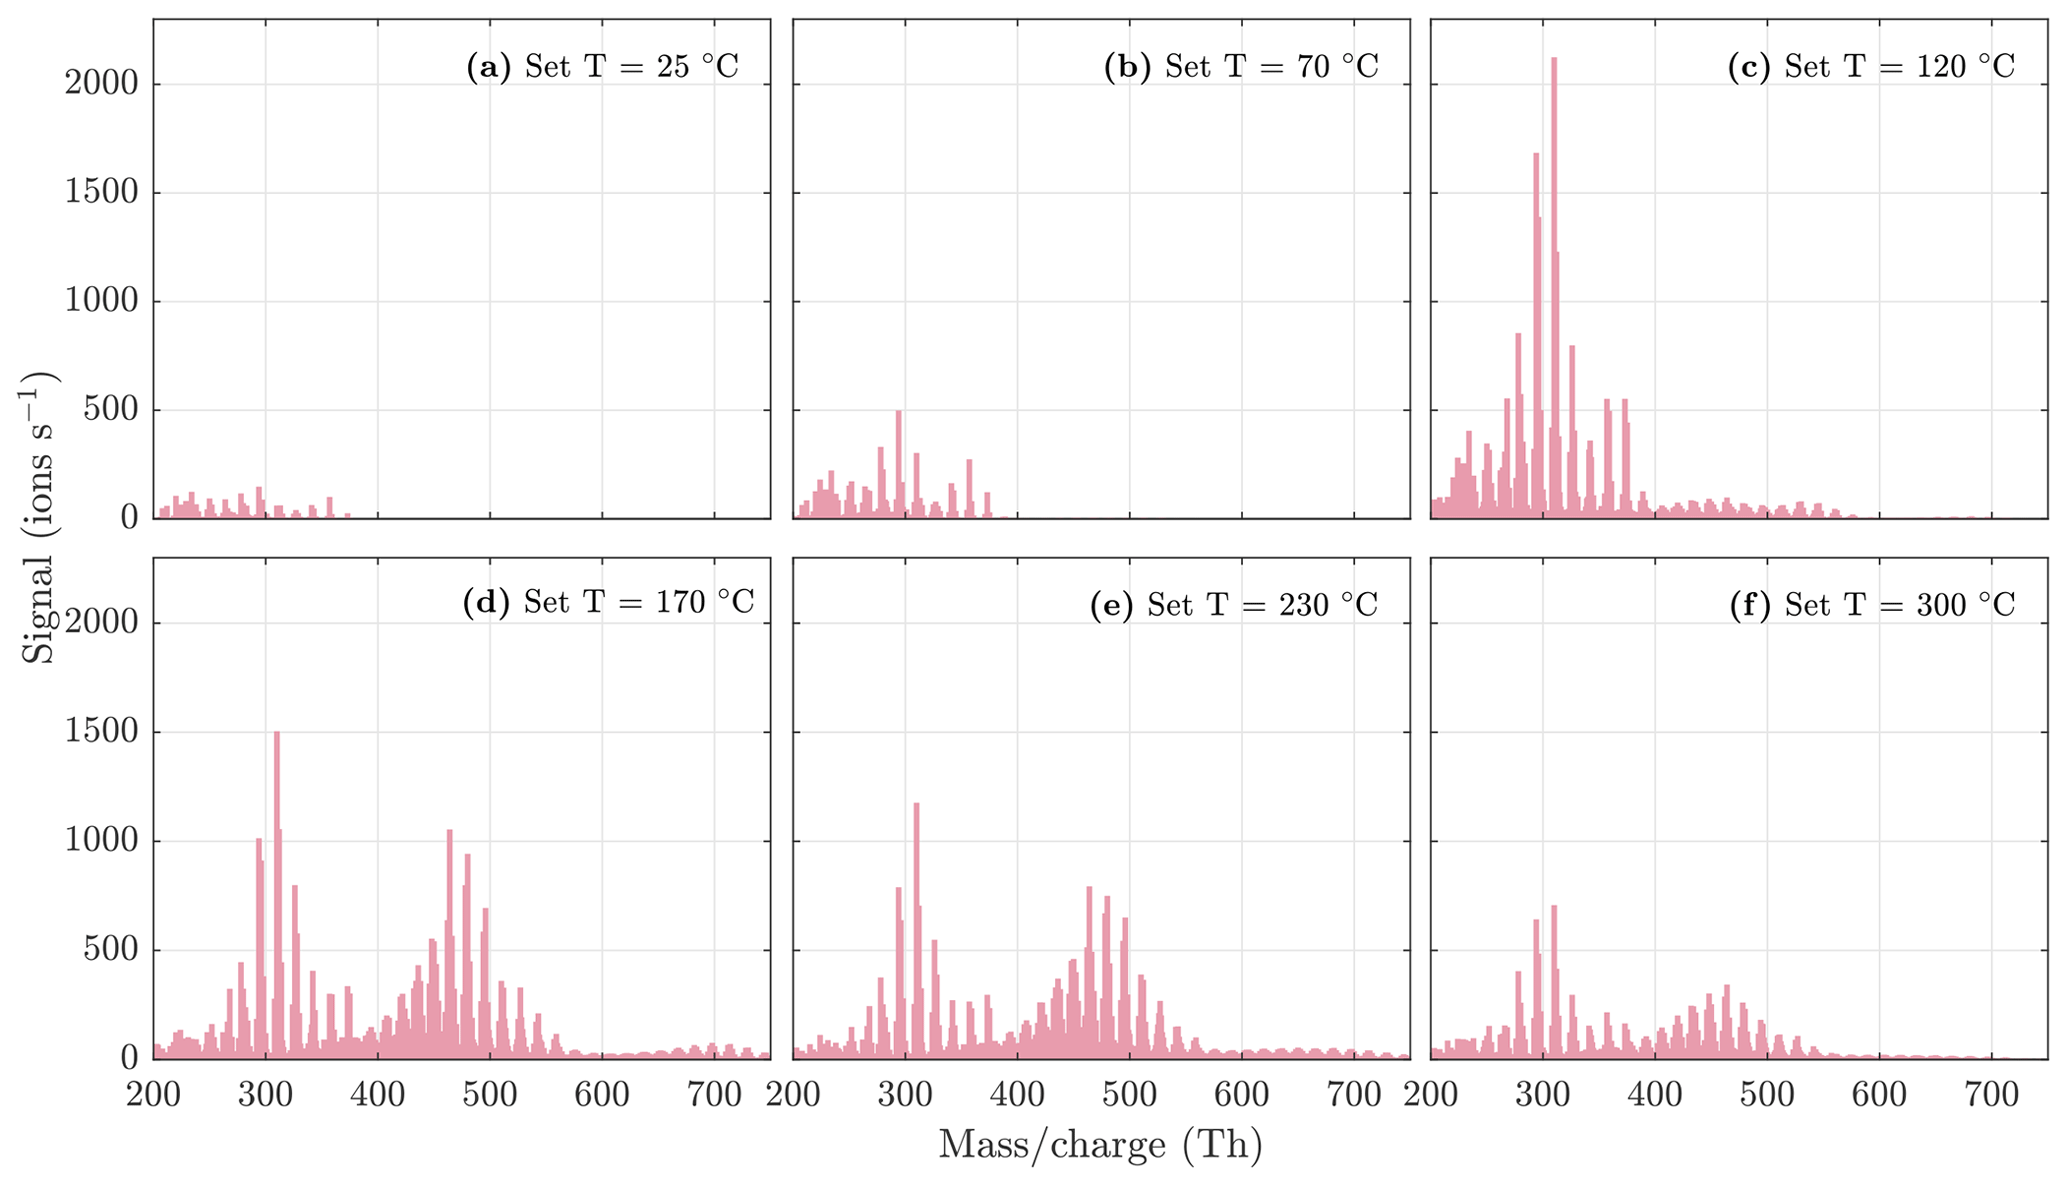
Figure A6NO3-CIMS spectra measured during α-pinene ozonolysis and OH oxidation SOA evaporation at different temperatures. The sample flow through the VIA was 1.5 L min−1, and a dilution flow of 15 L min−1 of clean air was added after the VIA. The total SOA mass loading was 503 µg m−3 in the VIA before dilution.
Data are available upon request from the corresponding author.
ME and JK designed the study. EH, JZ, FG, and NF conducted the experiments. EH and JZ analyzed the data. EH prepared the manuscript with contributions from all co-authors.
Jordan Krechmer and Douglas Worsnop work for Aerodyne Research, Inc., which developed the vaporization inlet for aerosols (VIA) used in this study.
Publisher’s note: Copernicus Publications remains neutral with regard to jurisdictional claims in published maps and institutional affiliations.
This research was funded by the Academy of Finland (grant nos. 317380, 320094, 325656, 345982, and 346370) and a University of Helsinki 3-year grant (grant no. 75284132). Ella Häkkinen thanks the Vilho, Yrjö and Kalle Väisälä Foundation for financial support. Frans Graeffe thanks Svenska Kulturfonden for financial support. Nicolas Fauré has been supported by the Swedish Research Council (VR; grant no. 2020-03497).
This research has been supported by the Academy of Finland (grant nos. 317380, 320094, 325656, 345982, and 346370), the University of Helsinki (grant no. 75284132), the Vilho, Yrjö and Kalle Väisälä Fund, Svenska Kulturfonden, and the Swedish Research Council (VR; grant no. 2020-03497).
Open-access funding was provided by the Helsinki University Library.
This paper was edited by Bin Yuan and reviewed by two anonymous referees.
Bianchi, F., Kurtén, T., Riva, M., Mohr, C., Rissanen, M. P., Roldin, P., Berndt, T., Crounse, J. D., Wennberg, P. O., Mentel, T. F., Wildt, J., Junninen, H., Jokinen, T., Kulmala, M., Worsnop, D. R., Thornton, J. A., Donahue, N., Kjaergaard, H. G., and Ehn, M.: Highly Oxygenated Organic Molecules (HOM) from Gas-Phase Autoxidation Involving Peroxy Radicals: A Key Contributor to Atmospheric Aerosol, Chem. Rev., 119, 3472–3509, https://doi.org/10.1021/acs.chemrev.8b00395, 2019. a, b
Carslaw, K., Lee, L., Reddington, C., Pringle, K., Rap, A., Forster, P., Mann, G., Spracklen, D., Woodhouse, M., Regayre, L., and Pierce, J.: Large contribution of natural aerosols to uncertainty in indirect forcing, Nature, 503, 67–71, https://doi.org/10.1038/nature12674, 2013. a
Crounse, J. D., Nielsen, L. B., Jørgensen, S., Kjaergaard, H. G., and Wennberg, P. O.: Autoxidation of Organic Compounds in the Atmosphere, J. Phys. Chem. Lett., 4, 3513–3520, https://doi.org/10.1021/jz4019207, 2013. a
Ehn, M., Thornton, J., Kleist, E., Sipila, M., Junninen, H., Pullinen, I., Springer, M., Rubach, F., Tillmann, R., Lee, B., Lopez-Hilfiker, F., Andres, S., Acir, I.-H., Rissanen, M., Jokinen, T., Schobesberger, S., Kangasluoma, J., Kontkanen, J., Nieminen, T., Kurten, T., Nielsen, L., Jorgensen, S., Kjaergaard, H., Canagaratna, M., Dal Maso, M., Berndt, T., Petaja, T., Wahner, A., Kerminen, V.-M., Kulmala, M., Worsnop, D., Wildt, J., and Mentel, T.: A large source of low-volatility secondary organic aerosol, Nature, 506, 476–479, https://doi.org/10.1038/nature13032, 2014. a, b, c, d, e
Eichler, P., Müller, M., D'Anna, B., and Wisthaler, A.: A novel inlet system for online chemical analysis of semi-volatile submicron particulate matter, Atmos. Meas. Tech., 8, 1353–1360, https://doi.org/10.5194/amt-8-1353-2015, 2015. a, b
Glasius, M. and Goldstein, A. H.: Recent Discoveries and Future Challenges in Atmospheric Organic Chemistry, Environ. Sci. Technol., 50, 2754–2764, https://doi.org/10.1021/acs.est.5b05105, 2016. a
Hakala, J., Mikkilä, J., Hong, J., Ehn, M., and Petäjä, T.: VH-TDMA: A description and verification of an instrument to measure aerosol particle hygroscopicity and volatility, Aerosol Sci. Tech., 51, 97–107, https://doi.org/10.1080/02786826.2016.1255712, 2017. a
Hallquist, M., Wenger, J. C., Baltensperger, U., Rudich, Y., Simpson, D., Claeys, M., Dommen, J., Donahue, N. M., George, C., Goldstein, A. H., Hamilton, J. F., Herrmann, H., Hoffmann, T., Iinuma, Y., Jang, M., Jenkin, M. E., Jimenez, J. L., Kiendler-Scharr, A., Maenhaut, W., McFiggans, G., Mentel, Th. F., Monod, A., Prévôt, A. S. H., Seinfeld, J. H., Surratt, J. D., Szmigielski, R., and Wildt, J.: The formation, properties and impact of secondary organic aerosol: current and emerging issues, Atmos. Chem. Phys., 9, 5155–5236, https://doi.org/10.5194/acp-9-5155-2009, 2009. a
Huffman, J. A., Ziemann, P. J., Jayne, J. T., Worsnop, D. R., and Jimenez, J. L.: Development and Characterization of a Fast-Stepping/Scanning Thermodenuder for Chemically-Resolved Aerosol Volatility Measurements, Aerosol Sci. Tech., 42, 395–407, https://doi.org/10.1080/02786820802104981, 2008. a
Hyttinen, N., Kupiainen-Määttä, O., Rissanen, M. P., Muuronen, M., Ehn, M., and Kurtén, T.: Modeling the Charging of Highly Oxidized Cyclohexene Ozonolysis Products Using Nitrate-Based Chemical Ionization, J. Phys. Chem. A, 119, 6339–6345, https://doi.org/10.1021/acs.jpca.5b01818, 2015. a
Jimenez, J., Donahue, N., Prevot, A., Zhang, Q., Kroll, J., DeCarlo, P., Allan, J. D., Coe, H., Ng, N., Aiken, A., Docherty, K., Ulbrich, I., Grieshop, A., Robinson, A., Duplissy, J., Smith, J., Wilson, K., Lanz, V., and Worsnop, D.: Evolution of Organic Aerosols in the Atmosphere, Science, 326, 1525–9, https://doi.org/10.1126/science.1180353, 2009. a
Jokinen, T., Sipilä, M., Junninen, H., Ehn, M., Lönn, G., Hakala, J., Petäjä, T., Mauldin III, R. L., Kulmala, M., and Worsnop, D. R.: Atmospheric sulphuric acid and neutral cluster measurements using CI-APi-TOF, Atmos. Chem. Phys., 12, 4117–4125, https://doi.org/10.5194/acp-12-4117-2012, 2012. a, b, c, d, e
Junninen, H., Ehn, M., Petäjä, T., Luosujärvi, L., Kotiaho, T., Kostiainen, R., Rohner, U., Gonin, M., Fuhrer, K., Kulmala, M., and Worsnop, D. R.: A high-resolution mass spectrometer to measure atmospheric ion composition, Atmos. Meas. Tech., 3, 1039–1053, https://doi.org/10.5194/amt-3-1039-2010, 2010. a, b
Kang, E., Root, M. J., Toohey, D. W., and Brune, W. H.: Introducing the concept of Potential Aerosol Mass (PAM), Atmos. Chem. Phys., 7, 5727–5744, https://doi.org/10.5194/acp-7-5727-2007, 2007. a, b
Kirkby, J., Duplissy, J., Sengupta, K., Frege, C., Gordon, H., Williamson, C., Heinritzi, M., Simon, M., Yan, C., Almeida, J., Tröstl, J., Nieminen, T., Ortega, I. K., Wagner, R., Adamov, A., Amorim, A., Bernhammer, A. K., Bianchi, F., Breitenlechner, M., Brilke, S., Chen, X., Craven, J., Dias, A., Ehrhart, S., Flagan, R. C., Franchin, A., Fuchs, C., Guida, R., Hakala, J., Hoyle, C. R., Jokinen, T., Junninen, H., Kangasluoma, J., Kim, J., Krapf, M., Kürten, A., Laaksonen, A., Lehtipalo, K., Makhmutov, V., Mathot, S., Molteni, U., Onnela, A., Peräkylä, O., Piel, F., Petäjä, T., Praplan, A. P., Pringle, K., Rap, A., Richards, N. A., Riipinen, I., Rissanen, M. P., Rondo, L., Sarnela, N., Schobesberger, S., Scott, C. E., Seinfeld, J. H., Sipila, M., Steiner, G., Stozhkov, Y., Stratmann, F., Tomé, A., Virtanen, A., Vogel, A. L., Wagner, A. C., Wagner, P. E., Weingartner, E., Wimmer, D., Winkler, P. M., Ye, P., Zhang, X., Hansel, A., Dommen, J., Donahue, N. M., Worsnop, D. R., Baltensperger, U., Kulmala, M., Carslaw, K. S., and Curtius, J.: Ion-induced nucleation of pure biogenic particles, Nature, 533, 521–526, 2016. a
Kroll, J. H. and Seinfeld, J. H.: Chemistry of secondary organic aerosol: Formation and evolution of low-volatility organics in the atmosphere, Atmos. Environ., 42, 3593–3624, https://doi.org/10.1016/j.atmosenv.2008.01.003, 2008. a
Kürten, A., Rondo, L., Ehrhart, S., and Curtius, J.: Calibration of a Chemical Ionization Mass Spectrometer for the Measurement of Gaseous Sulfuric Acid, J. Phys. Chem. A, 116, 6375–6386, https://doi.org/10.1021/jp212123n, 2012. a
Lambe, A. T., Ahern, A. T., Williams, L. R., Slowik, J. G., Wong, J. P. S., Abbatt, J. P. D., Brune, W. H., Ng, N. L., Wright, J. P., Croasdale, D. R., Worsnop, D. R., Davidovits, P., and Onasch, T. B.: Characterization of aerosol photooxidation flow reactors: heterogeneous oxidation, secondary organic aerosol formation and cloud condensation nuclei activity measurements, Atmos. Meas. Tech., 4, 445–461, https://doi.org/10.5194/amt-4-445-2011, 2011. a
Lee, B. H., Lopez-Hilfiker, F. D., Mohr, C., Kurtén, T., Worsnop, D. R., and Thornton, J. A.: An Iodide-Adduct High-Resolution Time-of-Flight Chemical-Ionization Mass Spectrometer: Application to Atmospheric Inorganic and Organic Compounds, Environ. Sci. Technol., 48, 6309–6317, https://doi.org/10.1021/es500362a, 2014. a
Lopez-Hilfiker, F. D., Mohr, C., Ehn, M., Rubach, F., Kleist, E., Wildt, J., Mentel, Th. F., Lutz, A., Hallquist, M., Worsnop, D., and Thornton, J. A.: A novel method for online analysis of gas and particle composition: description and evaluation of a Filter Inlet for Gases and AEROsols (FIGAERO), Atmos. Meas. Tech., 7, 983–1001, https://doi.org/10.5194/amt-7-983-2014, 2014. a
Lopez-Hilfiker, F. D., Mohr, C., Ehn, M., Rubach, F., Kleist, E., Wildt, J., Mentel, Th. F., Carrasquillo, A. J., Daumit, K. E., Hunter, J. F., Kroll, J. H., Worsnop, D. R., and Thornton, J. A.: Phase partitioning and volatility of secondary organic aerosol components formed from α-pinene ozonolysis and OH oxidation: the importance of accretion products and other low volatility compounds, Atmos. Chem. Phys., 15, 7765–7776, https://doi.org/10.5194/acp-15-7765-2015, 2015. a, b
Lopez-Hilfiker, F. D., Pospisilova, V., Huang, W., Kalberer, M., Mohr, C., Stefenelli, G., Thornton, J. A., Baltensperger, U., Prevot, A. S. H., and Slowik, J. G.: An extractive electrospray ionization time-of-flight mass spectrometer (EESI-TOF) for online measurement of atmospheric aerosol particles, Atmos. Meas. Tech., 12, 4867–4886, https://doi.org/10.5194/amt-12-4867-2019, 2019. a
McFiggans, G., Mentel, T. F., Wildt, J., Pullinen, I., Kang, S., Kleist, E., Schmitt, S., Springer, M., Tillmann, R., Wu, C., Zhao, D., Hallquist, M., Faxon, C., Le Breton, M., Hallquist, Å. M., Simpson, D., Bergström, R., Jenkin, M. E., Ehn, M., Thornton, J. A., Alfarra, M. R., Bannan, T. J., Percival, C. J., Priestley, M., Topping, D., and Kiendler-Scharr, A.: Secondary organic aerosol reduced by mixture of atmospheric vapours, Nature, 565, 587–593, https://doi.org/10.1038/s41586-018-0871-y, 2019. a
Mutzel, A., Poulain, L., Berndt, T., Iinuma, Y., Rodigast, M., Böge, O., Richters, S., Spindler, G., Sipilä, M., Jokinen, T., Kulmala, M., and Herrmann, H.: Highly Oxidized Multifunctional Organic Compounds Observed in Tropospheric Particles: A Field and Laboratory Study, Environ. Sci. Technol., 49, 7754–7761, https://doi.org/10.1021/acs.est.5b00885, 2015. a
Peräkylä, O., Riva, M., Heikkinen, L., Quéléver, L., Roldin, P., and Ehn, M.: Experimental investigation into the volatilities of highly oxygenated organic molecules (HOMs) , Atmos. Chem. Phys., 20, 649–669, https://doi.org/10.5194/acp-20-649-2020, 2020. a, b, c
Pospisilova, V., Lopez-Hilfiker, F. D., Bell, D. M., Haddad, I. E., Mohr, C., Huang, W., Heikkinen, L., Xiao, M., Dommen, J., Prevot, A. S. H., Baltensperger, U., and Slowik, J. G.: On the fate of oxygenated organic molecules in atmospheric aerosol particles, Science Advances, 6, eaax8922, https://doi.org/10.1126/sciadv.aax8922, 2020. a, b
Quéléver, L. L. J., Kristensen, K., Normann Jensen, L., Rosati, B., Teiwes, R., Daellenbach, K. R., Peräkylä, O., Roldin, P., Bossi, R., Pedersen, H. B., Glasius, M., Bilde, M., and Ehn, M.: Effect of temperature on the formation of highly oxygenated organic molecules (HOMs) from alpha-pinene ozonolysis, Atmos. Chem. Phys., 19, 7609–7625, https://doi.org/10.5194/acp-19-7609-2019, 2019. a
Riva, M., Heikkinen, L. M., Bell, D. M., Perakyla, O. J., Zha, Q., Schallhart, S., Rissanen, M. P., Imre, D., Petaja, T., Thornton, J. A., Zelenyuk-Imre, A., and Ehn, M.: Chemical transformations in monoterpene-derived organic aerosol enhanced by inorganic composition, npj Climate and Atmospheric Science, 2, 2, https://doi.org/10.1038/s41612-018-0058-0, 2019a. a
Riva, M., Rantala, P., Krechmer, J. E., Peräkylä, O., Zhang, Y., Heikkinen, L., Garmash, O., Yan, C., Kulmala, M., Worsnop, D., and Ehn, M.: Evaluating the performance of five different chemical ionization techniques for detecting gaseous oxygenated organic species, Atmos. Meas. Tech., 12, 2403–2421, https://doi.org/10.5194/amt-12-2403-2019, 2019b. a
Roldin, P., Ehn, M., Kurtén, T., Olenius, T., Rissanen, M., Sarnela, N., Elm, J., Rantala, P., Hao, L., Hyttinen, N., Heikkinen, L., Worsnop, D., Pichelstorfer, L., Xavier, C., Clusius, P., Öström, E., Petäjä, T., Kulmala, M., Vehkamäki, H., and Boy, M.: The role of highly oxygenated organic molecules in the Boreal aerosol-cloud-climate system, Nat. Commun., 10, 1–15, https://doi.org/10.1038/s41467-019-12338-8, 2019. a
Simon, M., Dada, L., Heinritzi, M., Scholz, W., Stolzenburg, D., Fischer, L., Wagner, A. C., Kürten, A., Rörup, B., He, X.-C., Almeida, J., Baalbaki, R., Baccarini, A., Bauer, P. S., Beck, L., Bergen, A., Bianchi, F., Bräkling, S., Brilke, S., Caudillo, L., Chen, D., Chu, B., Dias, A., Draper, D. C., Duplissy, J., El-Haddad, I., Finkenzeller, H., Frege, C., Gonzalez-Carracedo, L., Gordon, H., Granzin, M., Hakala, J., Hofbauer, V., Hoyle, C. R., Kim, C., Kong, W., Lamkaddam, H., Lee, C. P., Lehtipalo, K., Leiminger, M., Mai, H., Manninen, H. E., Marie, G., Marten, R., Mentler, B., Molteni, U., Nichman, L., Nie, W., Ojdanic, A., Onnela, A., Partoll, E., Petäjä, T., Pfeifer, J., Philippov, M., Quéléver, L. L. J., Ranjithkumar, A., Rissanen, M. P., Schallhart, S., Schobesberger, S., Schuchmann, S., Shen, J., Sipilä, M., Steiner, G., Stozhkov, Y., Tauber, C., Tham, Y. J., Tomé, A. R., Vazquez-Pufleau, M., Vogel, A. L., Wagner, R., Wang, M., Wang, D. S., Wang, Y., Weber, S. K., Wu, Y., Xiao, M., Yan, C., Ye, P., Ye, Q., Zauner-Wieczorek, M., Zhou, X., Baltensperger, U., Dommen, J., Flagan, R. C., Hansel, A., Kulmala, M., Volkamer, R., Winkler, P. M., Worsnop, D. R., Donahue, N. M., Kirkby, J., and Curtius, J.: Molecular understanding of new-particle formation from α-pinene between −50 and +25 ∘C, Atmos. Chem. Phys., 20, 9183–9207, https://doi.org/10.5194/acp-20-9183-2020, 2020. a
Smith, J. N., Moore, K. F., McMurry, P. H., and Eisele, F. L.: Atmospheric Measurements of Sub-20 nm Diameter Particle Chemical Composition by Thermal Desorption Chemical Ionization Mass Spectrometry, Aerosol Sci. Tech., 38, 100–110, https://doi.org/10.1080/02786820490249036, 2004. a
Zhang, X., Lambe, A., Upshur, M., Brooks, W., Gray Be, A., Thomson, R., Geiger, F., Surratt, J., Zhang, Z., Gold, A., Graf, S., Cubison, M., Groessl, M., Jayne, J., and Worsnop, D.: Highly Oxygenated Multifunctional Compounds in α-Pinene Secondary Organic Aerosol, Environ. Sci. Technol., 51, 5932–5940, https://doi.org/10.1021/acs.est.6b06588, 2017. a