the Creative Commons Attribution 4.0 License.
the Creative Commons Attribution 4.0 License.
 | 18 Apr 2023
Multiwavelength fluorescence lidar observations of smoke plumes
Igor Veselovskii
Nikita Kasianik
Mikhail Korenskii
Qiaoyun Hu
Philippe Goloub
Thierry Podvin
Dong Liu
A five-channel fluorescence lidar was developed for the study of atmospheric aerosol. The fluorescence spectrum induced by 355 nm laser emission is analyzed in five spectral intervals using interference filters. Central wavelengths and the widths of these five interference filters are, respectively, as follows: 438 and 29, 472 and 32, 513 and 29, 560 and 40, and 614 and 54 nm. The relative calibration of these channels has been performed using a tungsten–halogen lamp with a color temperature of 2800 K. This new lidar system was operated during summer–autumn 2022, when strong forest fires occurred in the Moscow region and generated a series of smoke plumes analyzed in this study. Our results demonstrate that, for urban aerosol, the maximal fluorescence backscattering is observed in a 472 nm channel. For the smoke, the maximum is shifted toward longer wavelengths, and the fluorescence backscattering coefficients in 472, 513 and 560 nm channels have comparable values. Thus, from the analysis of the ratios of fluorescence backscattering in available channels, we show that it is possible to identify smoke layers. The particle classification based on single-channel fluorescence capacity (ratio of the fluorescence backscattering to the elastic one) has limitations at high relative humidity (RH). The fluorescence capacity indeed decreases when water uptake of particles enhances the elastic scattering. However, the spectral variation of fluorescence backscattering does not exhibit any dependence on RH and can be therefore applied to aerosol identification.
- Article
(9111 KB) - Full-text XML
- BibTeX
- EndNote


The knowledge of the chemical composition of atmospheric aerosol is important for characterization of its impact on the Earth radiation balance (Boucher et al., 2013). The composition of aerosol, however, is strongly variable, and in practice, several general aerosol types are usually considered based on their origin (Dubovik et al., 2002). The Mie–Raman and high-spectral-resolution lidars provide the opportunity to derive the vertical distribution of the particle extinction and backscattering coefficients together with the multispectral depolarization ratio. The main aerosol types can be distinguished based on such observations (Burton et al., 2012, 2013; Groß et al., 2013; Mamouri and Ansmann, 2017; Papagiannopoulos et al., 2018; Nicolae et al., 2018; Hara et al., 2018; Wang et al., 2021; Mylonaki et al., 2021). However, due to the variability of the aerosol parameters, the particle intensive properties (properties that are independent of concentration), such as lidar ratios, depolarization ratios and Angstrom exponents, can vary in a wide range, even for aerosols from the same origin, which complicates their identification.
The fluorescence measurements provide new independent information about aerosol composition, which can be used for classification (Veselovskii et al., 2022b). Being induced by 355 nm laser radiation, the atmospheric fluorescence emission spreads in a wide spectral range from approximately 380 nm to beyond 700 nm. The multi-anode photomultipliers combined with a spectrometer, in principle, allow the full fluorescence spectrum to be profiled (Sugimoto et al., 2012; Saito et al., 2022; Reichardt et al., 2023). In a more simple approach, a single fluorescence channel has been integrated into existing multiwavelength Mie–Raman lidar (Veselovskii et al., 2020), and a fraction of the fluorescence spectrum is selected by a wideband interference filter. The high transmittance of modern interference filters (above 95 %) allows the efficient detection of fluorescence emission, and when combined with simultaneous depolarization measurements, the main aerosol types, such as dust, smoke, pollen and urban aerosol, can be identified (Veselovskii et al., 2022b). This classification scheme relies on the fluorescence capacity Gλ, which is the ratio of fluorescence backscattering to elastic backscattering at laser wavelength. The fluorescence capacity, however, depends on the relative humidity (RH) because enhanced elastic backscattering leads to a decrease of Gλ (Veselovskii et al., 2021). As a result, at high RH, we cannot discern unambiguously whether the decrease of Gλ comes from water uptake or from changes in the aerosol composition.
The water uptake increases the elastic backscattering but normally does not alter the chemical components, and consequently, the total amount of fluorescent molecules within a particle does not change. The illumination intensity distribution within a particle, as well as the emission angular distribution, can be altered by the change of particle size and refractive index during the hygroscopic growth. However, this effect occurs for relatively big microspheres with size parameter exceeding approximately 10 (Veselovskii et al., 2002). Thus, fluorescence of the fine-mode particles should be less influenced by the hygroscopic growth. Our existing lidar database in well-mixed boundary layer situations demonstrates that, at least for urban and smoke particles, the fluorescence backscattering coefficient did not change during water uptake. Thus, we have good reason to expect that the fluorescence spectrum is not modified by the aerosol hygroscopic growth and that several fluorescence channels should provide more reliable information with regard to aerosol types.
Smoke is one of the most abundant aerosol types, and it has been intensively studied with Mie–Raman lidars for decades (Adam et al., 2020, and references therein). Smoke is also characterized by a high fluorescence capacity (probably due to the presence of the organic carbon fraction); thus, fluorescence lidar measurements proved to be very efficient for smoke identification and analysis (Hu et al., 2022; Veselovskii et al., 2022a, b). However, as mentioned, at high RH levels, the classification of smoke based on a single-channel fluorescence may fail. The solution could be the detection of fluorescence at several wavelengths. In July 2022, a new lidar system equipped with five fluorescence channels was assembled at the Prokhorov General Physics Institute, Troitsk, Moscow. The lidar was in operation during summer and autumn 2022, when strong forest fires occurred in the Moscow region. In this paper, we analyze the spectral dependence of the fluorescence backscattering inside and outside the smoke plumes. The results demonstrate that the hygroscopic growth does not affect the spectral dependence of fluorescence backscattering.
The fluorescence lidar is based on a tripled Nd:YAG laser with a pulse energy of 80 mJ at 355 nm and a repetition rate of 20 Hz. Backscattered light is collected by a 40 cm aperture Newtonian telescope, and the lidar signals are digitized with Licel transient recorders with 7.5 m range resolution, allowing for simultaneous detection in the analog and photon-counting modes. The optical scheme of the receiving module is presented in Fig. 1. The system is designed to detect elastic backscattering at 355 nm, nitrogen Raman backscattering at 387 nm and fluorescence backscattering in five spectral intervals. These intervals are separated with dichroic beam splitters and are isolated by the interference filters manufactured by Alluxa. The central wavelengths and the widths of the transmission bands (FWHM) of these fluorescence channels are, respectively, as follows: 438 and 29, 472 and 32, 513 and 29, 560 and 40, and 614 and 54 nm. The transmission of the filters exceeds 97 %, while suppression of the optical signal out of the band is above OD6. To improve the suppression of elastic backscattering, we installed two filters in tandem in every channel.
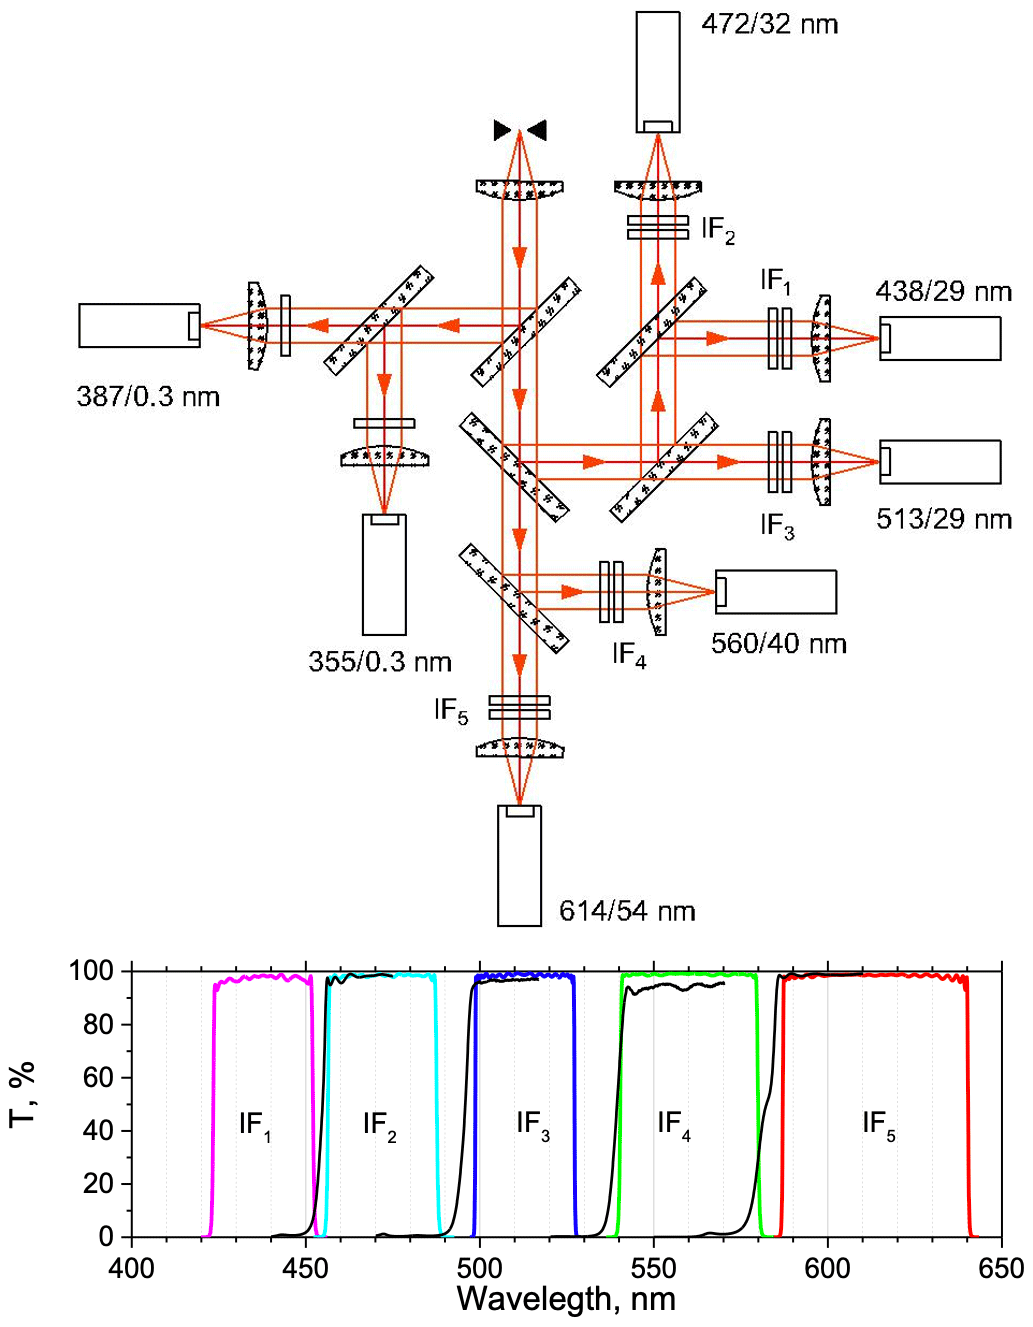
Figure 1Optical scheme of the receiving module of the lidar together with transmissions of interference filters IF1–IF5 in the fluorescence channels. Black lines show the transmissions of the 45∘ dichroic beam splitters used for the separation of fluorescence spectral components.
Laser radiation at 532 nm can induce additional aerosol fluorescence, which will contaminate longwave channels. To remove this potential contamination, the emissions at 532 and 1064 nm are separated with dichroic mirrors and are redirected to an optical dump. Therefore, the laser beam sent into the atmosphere has only one wavelength – 355 nm. As follows from Fig. 1, the 532 nm radiation is out of the transmission band of the filters, which prevents the leaking of residual 532 nm component to the fluorescence channels. We should mention that the vibrational overtone of N2 Raman scattering at 424.4 nm is within the transmission band of the 438 nm channel. In accordance with the results of Knippers et al. (1985), the Raman intensity of this overtone is about 3 orders of magnitude lower than intensity of the N2 fundamental vibration (for 488 nm laser wavelength). Based on our measurements, the contribution of the N2 overtone to the fluorescence signal from urban aerosol (with a backscattering coefficient of 1 Mm−1 sr−1 at 355 nm and G438 = 0.3 × 10⁻⁴) is estimated to be below 5 % at 1000 m height. In all the channels, the PMTs R9880U-01 were used, except in the 614 nm channel, where PMT R9880-20 was installed due to its higher sensitivity in the red spectral region. The background of strong sunlight during the daytime restricts the fluorescence observations to only nighttime. All the observations presented in this study were performed at a 45∘ angle to horizon.
The aerosol extinction coefficient at 355 nm (α355) was calculated from Raman observations as described in Ansmann et al. (1992). For the calculation of the backscattering coefficient β355 in the presence of clouds, we used the approach described in Veselovskii et al. (2022b). Additional information about atmospheric properties was available from radiosonde measurements at Dolgoprudnyi station, located about 50 km away from the observation site. It should be mentioned that the current lidar configuration does not allow the depolarization ratio to be measured.
The fluorescence-backscattering coefficient βFλ is calculated from the ratio of the fluorescence signal to the 387 nm nitrogen Raman signal, with correction for differential Raleigh and aerosol extinction, as described in Veselovskii et al. (2020). The atmospheric transmission of the fluorescence signal is calculated for the wavelengths corresponding to the center of the filter transmission band. The error due to the neglect of the spectral dependence of the Raleigh extinction inside the filter transmission band is the largest for the shortwave channel (438 nm). Computations show that, at a height of 4000 m, the corresponding error of βF438 is below 4 %. For correction of errors resulting from the aerosol differential extinction, we need to make an assumption about the value of the extinction Angstrom exponent (EAE). In particular, for the aged smoke, the EAE for 355 and 532 nm wavelengths is about 1 (Hu et al., 2022), and this value was used in the data analysis in our study. The uncertainties, due to a possible deviation of EAE from a value of 1, are analyzed in Sect. 3.1 of this paper.
For calculation of βFλ, one needs to know the differential cross section of the nitrogen Raman scattering, σR, and the relative sensitivity of the nitrogen and fluorescence detection channels. The value σR = 2.744 × 10⁻³⁰ cm2 sr−1 at 355 nm was taken from Venable et al. (2011). The sensitivity of the R9880U-01 photocathode in the 387–438 nm range varies by less than 10 %, so we neglect this variation and calculate the relative sensitivity of the PMTs as described in Veselovskii et al. (2020). The relative sensitivity of the rest of the fluorescence channels with respect to the 438 nm one was calculated from laboratory measurements using a tungsten–halogen lamp, Thorlabs QTH10/M, with a color temperature of 2800 K as a source, assuming this source follows the Planck blackbody emission. For calibration, the telescope is installed horizontally, and the lamp is placed at a distance of 4 m from the entrance. The screen, installed in front of the telescope, selected the central part of the lamp radiation, which had a diameter of 50 mm, which was used for calibration. This procedure was performed once a week, and variations of the calibration coefficients during the August–September 2022 period were below 15 % for the 614 nm channel and below 10 % for the rest of the channels. Thus, the uncertainties of βFλ calculation include the systematical errors of the calibration procedure (εcal), the errors due to the indeterminacy of the choice of the Angstrom exponent (εA) and the statistical errors of the measurements (εst). For the vertical profiles of the fluorescence backscattering in Sect. 3, we do not provide the systematical errors of the calibration; however, εcal values are considered when the spectra of the fluorescence backscattering are analyzed.
One should note that βFλ is the integral of fluorescence backscattering over the filter transmission band Dλ. To compare βFλ at different fluorescence channels, we compute the mean backscattering coefficients per elementary spectral interval – , denoted as the fluorescence-spectral-backscattering coefficient. The fluorescence capacity Gλ, which is the ratio of the fluorescence backscattering to the elastic one, in principle, can be calculated for any laser wavelength. In our previous studies, we calculated Gλ with respect to β532; however, in this work, it was calculated with respect to 355 nm , since the 532 nm wavelength was not available. All βFλ, Gλ and Bλ profiles presented in this work were smoothed with the Savitzky–Golay method, using a second-order polynomial with seven 8points in the window.
In August 2022, numerous smoke layers originating from the forest fires in the Ryazan region (about 160 km southeast of Moscow) were detected over the lidar station. The travel time of the layers was less than 2 d; thus, the smoke could be considered to be fresh. The previous fluorescence studies of smoke plumes transported over the Atlantic and including 466 and 44 nm fluorescence measurements revealed that fluorescence capacity (calculated for β532), in the absence of hygroscopic growth, varied within the range of (2.5–5.0) × 10−4 (Veselovskii et al., 2021, 2022a, b; Hu et al., 2022). The backscattering Angstrom exponent (BAE) of smoke for 355 and 532 nm wavelengths is about 2.0, and the fluorescence capacity G472 in the 472 and 32 nm channels (calculated for β355 from past studies) is expected to be in the range of (0.8–1.6) × 10−4. Here and below, the fluorescence capacity for 472 nm will be provided because, in most of the cases, the fluorescence in this channel was maximal.
3.1 Fluorescence measurements during smoke episode
3.1.1 27–28 August 2022
Backward trajectories of 2 d from the NOAA HYSPLIT model for the air mass reaching Moscow on 28 August at 00:00 UTC are shown in Fig. 2. Air masses observed at 1500 m passed over the fire region at a level close to the ground and should thus contain biomass burning aerosols. The relative humidity measured by the radiosonde at 00:00 UTC was about 35 % at 1000 m and increased with height up to 70 % at 3000 m. The temporal evolutions of the aerosol-backscattering coefficient β355, the fluorescence backscattering βF472 and the fluorescence capacity G472 are shown in Fig. 3. Aerosols are localized mainly below 3000 m, while above 4000 m, cloud layers can be seen. The highest fluorescence-backscattering values were encountered before 20:30 UTC inside the boundary layer. The fluorescence capacity exceeds 2.5 × 10⁻⁴, which is the highest G472 observed in our measurements. After 20:30 UTC, G472 decreases but remains above 1 × 10⁻⁴, which, in principle, can be due to mixing of smoke with urban aerosol.
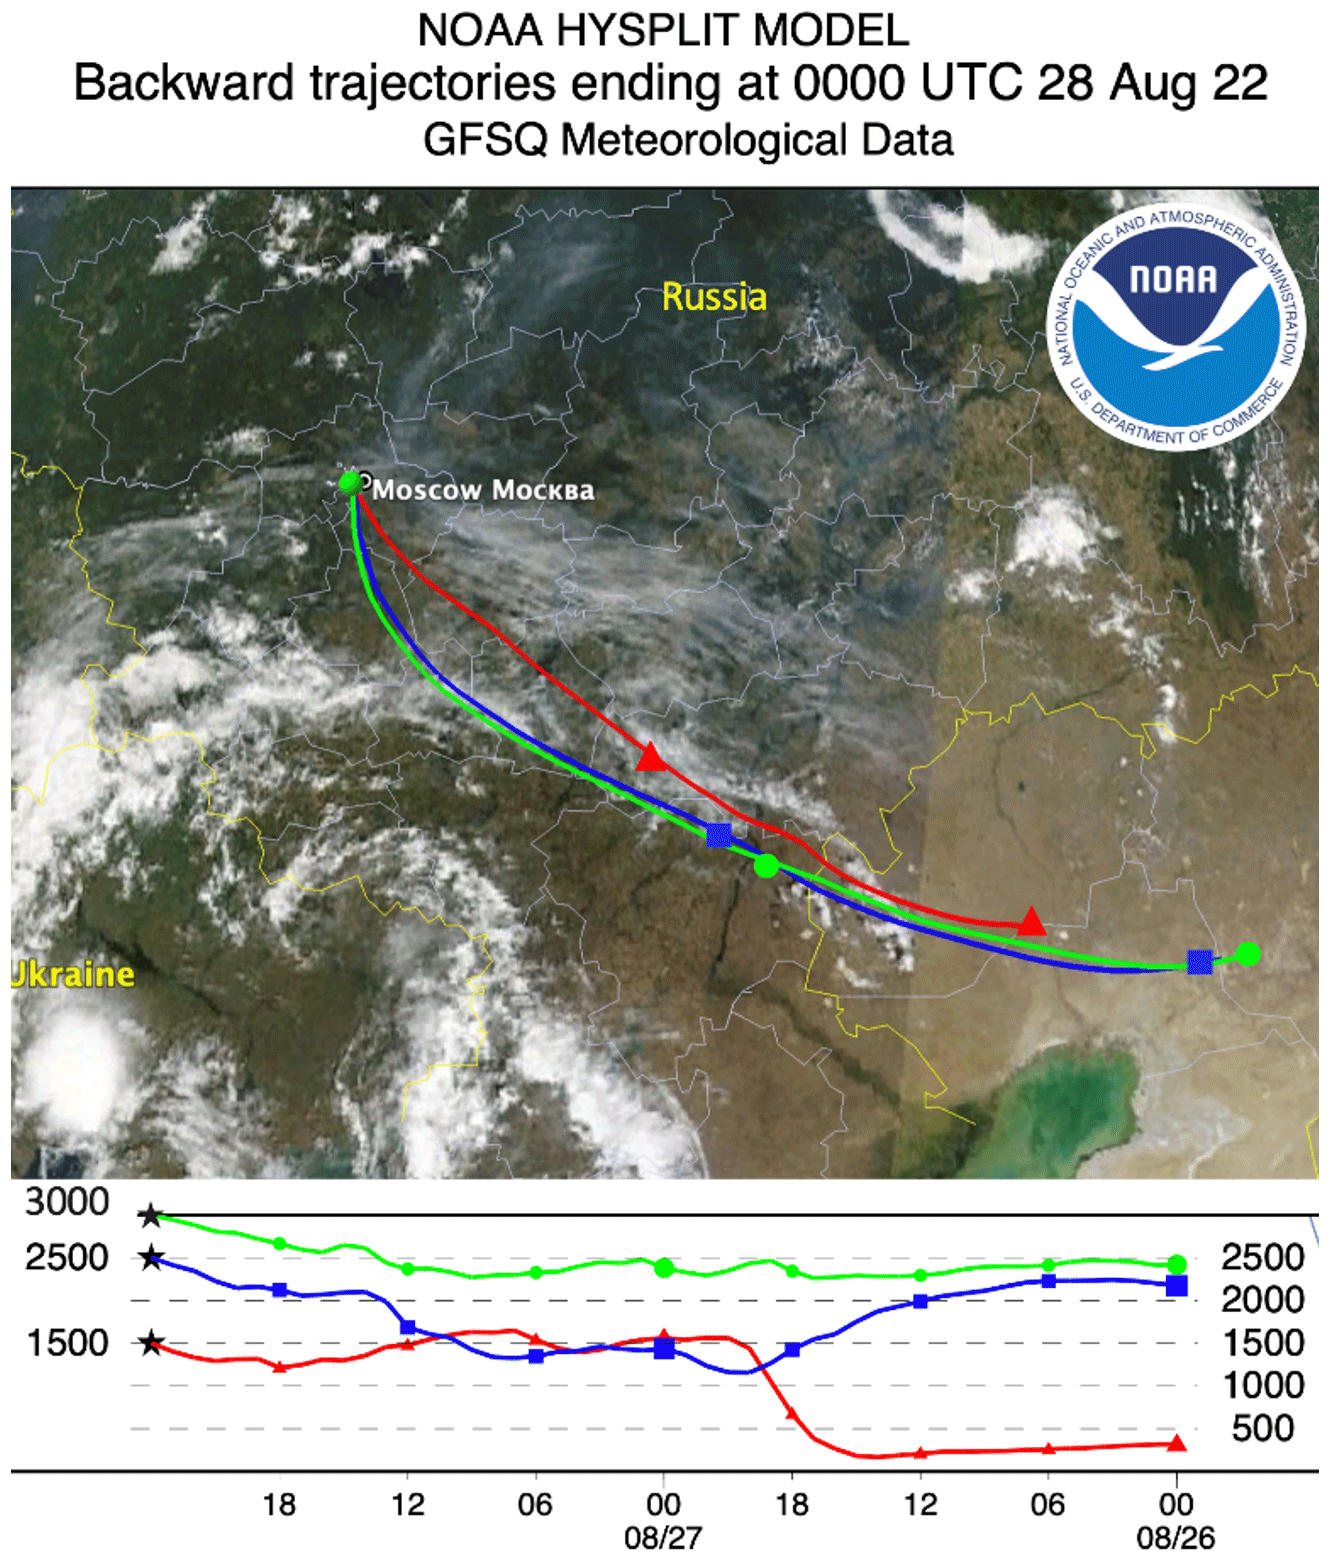
Figure 2Backward trajectories of 2 d from the NOAA HYSPLIT model for the air mass in Moscow on 28 August at 00:00 UTC. The basemap is the Earth's true-color image observed by MODIS Terra for the same period.
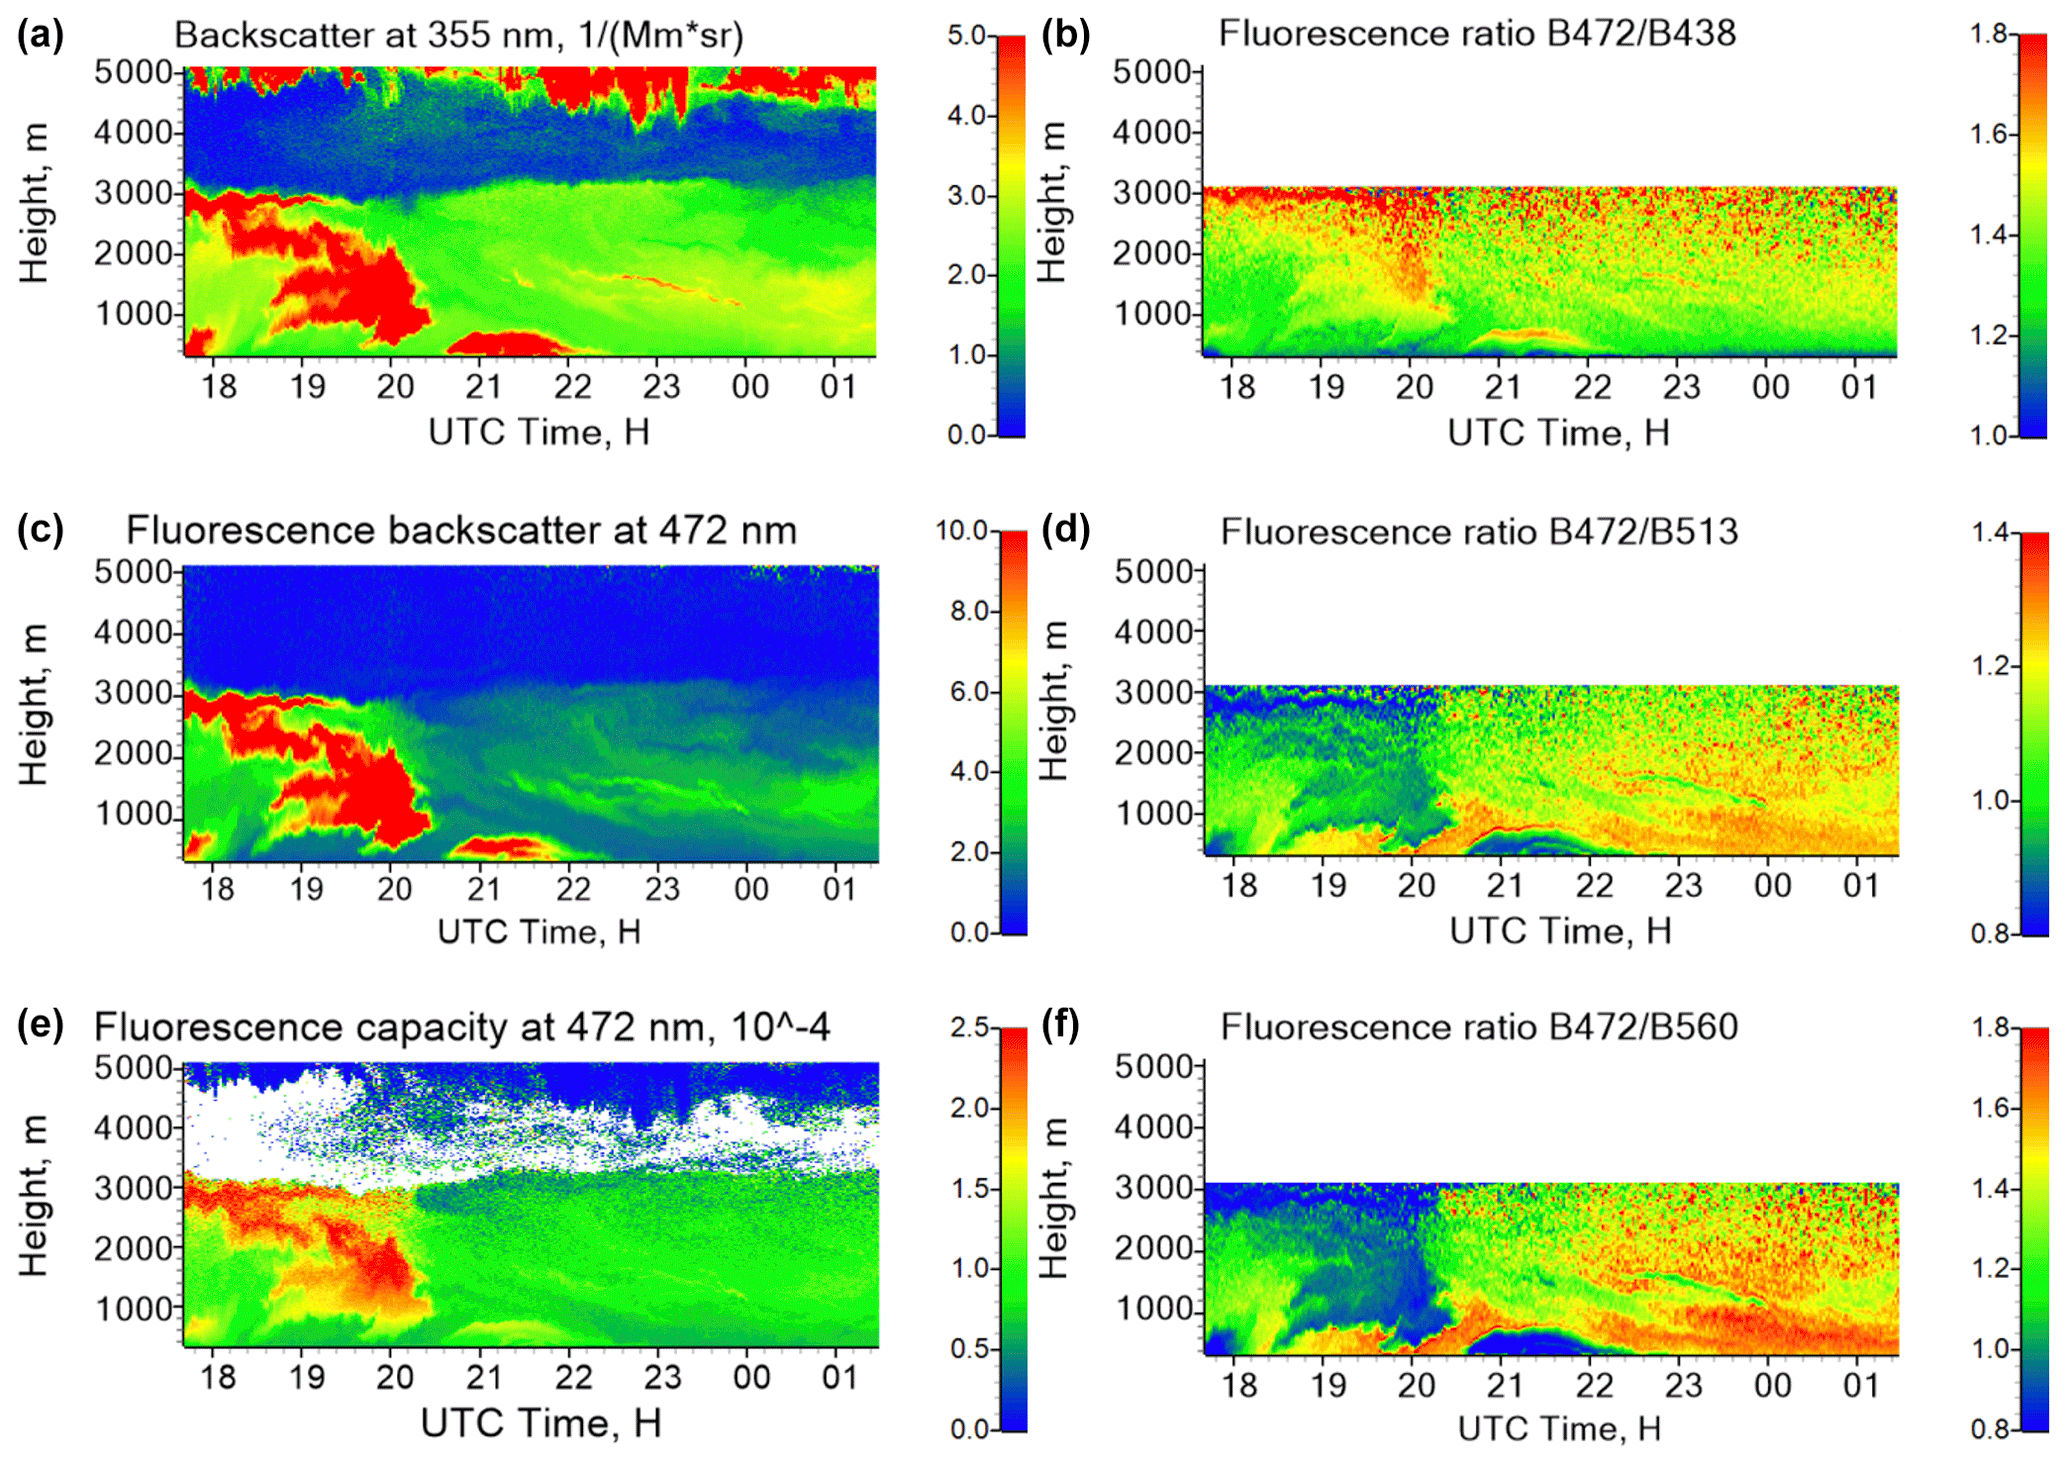
Figure 3Spatiotemporal distribution of particle parameters on the night of 27–28 August 2022. (a, c, e) Aerosol-backscattering coefficient β355, fluorescence backscattering βF472 (in 10−4 Mm−1 sr−1) and fluorescence capacity G472. (b, d, f) Ratios of fluorescence-spectral-backscattering coefficients – and .
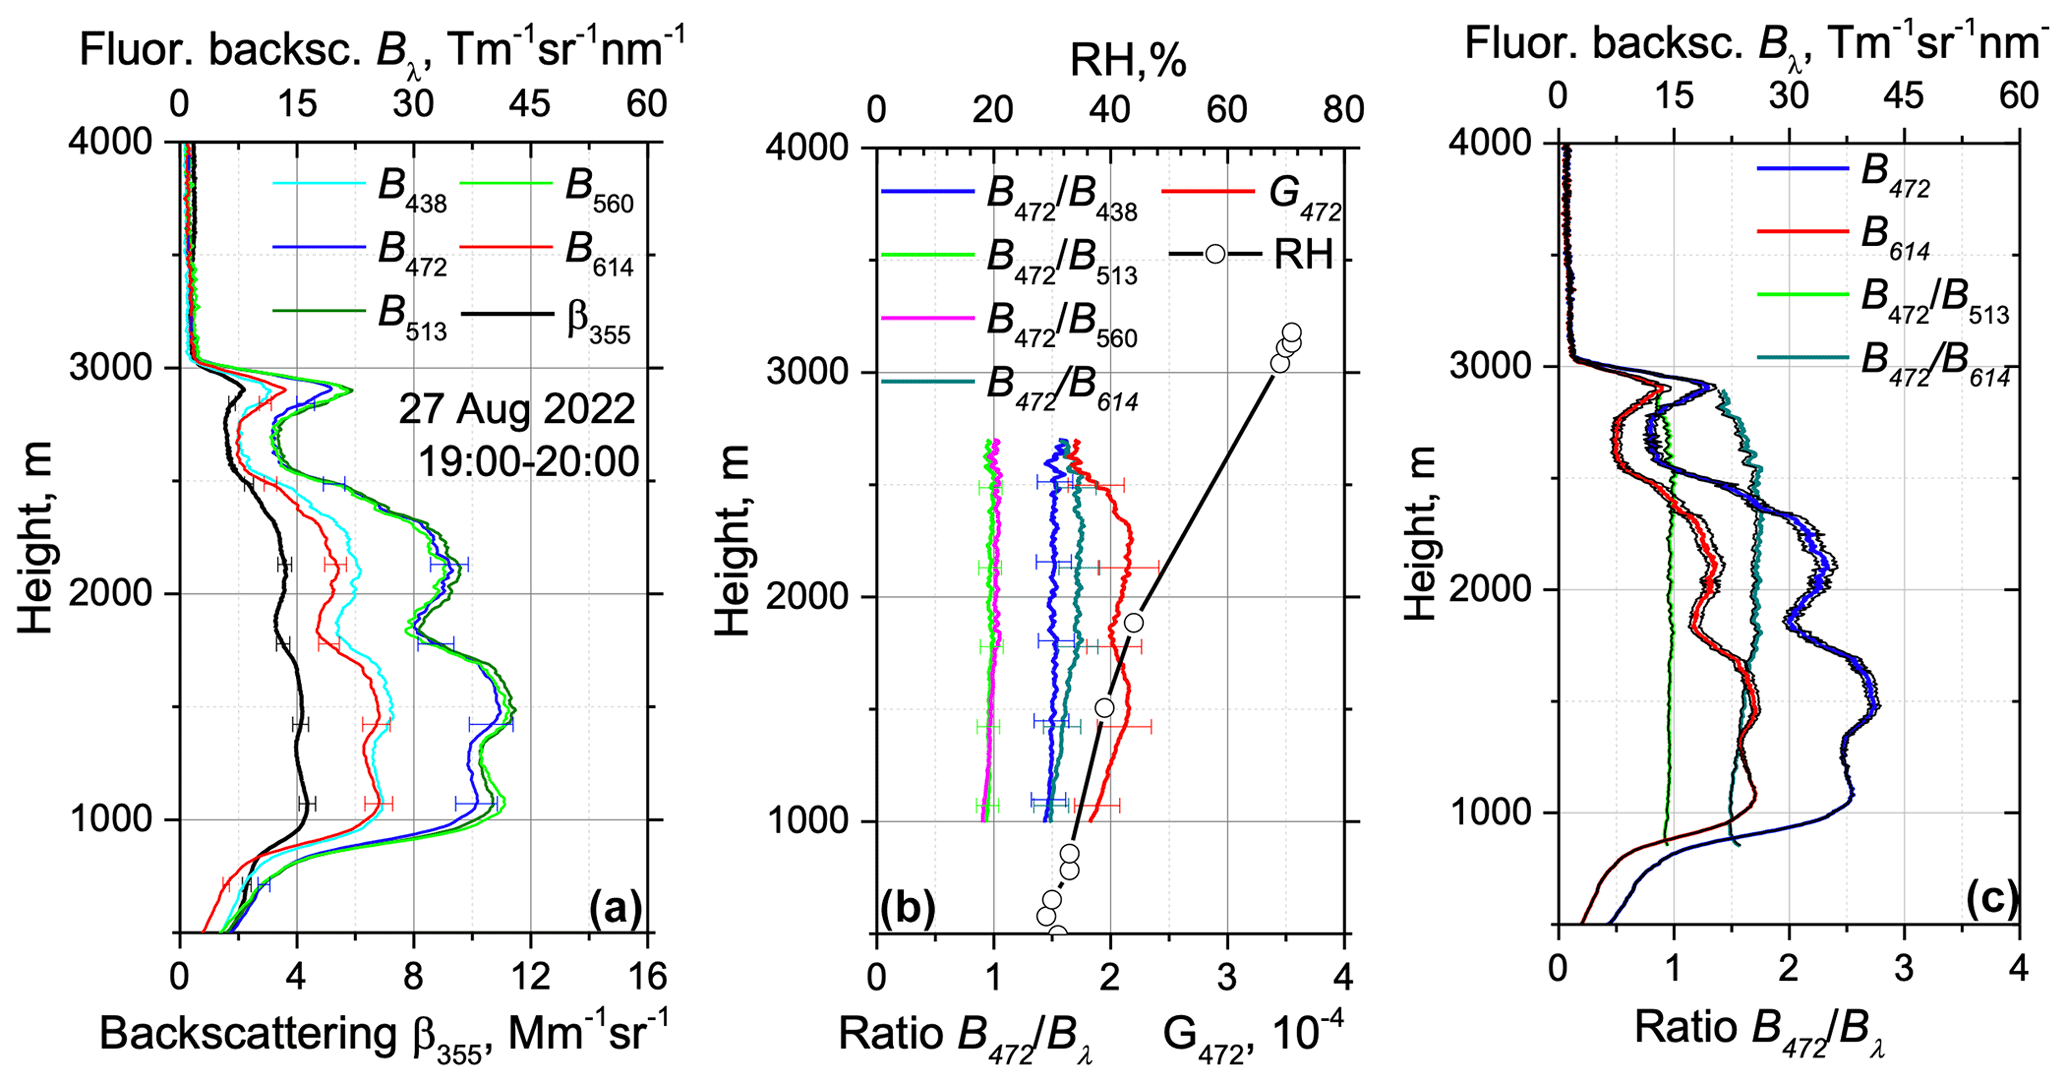
Figure 4Observations on 27 August 2022 for the period 19:00–20:00 UTC. (a) Fluorescence-spectral-backscattering coefficients Bλ at 438, 472, 513, 560 and 614 nm and the aerosol-backscattering coefficient β355. (b) The ratios , , and and the fluorescence capacity G472. Symbols show the relative humidity measured by a radiosonde at 00:00 UTC on 28 August. (c) Fluorescence-spectral-backscattering coefficients Bλ at 472 and 614 nm wavelengths and the ratios and calculated for the Angstrom exponent values A = 0.5, 1 and 1.5. Results for A = 0.5 and A = 1.5 are shown with thin black lines; the increase of A decreases the Bλ. The profiles in panels (a) and (b) are calculated for A = 1.
Vertical profiles of the fluorescence-spectral-backscattering coefficients Bλ are shown in Fig. 4a for the period that exhibited the highest fluorescence capacity (19:00–20:00 UTC). The profiles of B472, B513 and B560 are similar, and the ratios and in Fig. 4b are close to 1. The fluorescence capacity G472 is above 2.0 × 10⁻⁴ in the 1–2.5 km height range, where β355 and Bλ are maximal. To quantify the uncertainty due to the indeterminacy of the EAE choice, the Fig. 4c shows the profiles of B472 and B614 and the ratios and calculated for values of EAE A = 0.5, 1 and 1.5. The optical depth at 355 nm exceeded 0.55 at 3000 m height. The aerosol differential extinction provides the largest effect on B614, and the difference between the values obtained with A = 1 and 1.5 at 3000 m is about 6.5 %. For B472, this difference is lower by about 5 %. However, for the ratios of fluorescence backscattering, the influence of aerosol is lower – for both and , the corresponding difference is below 2.0 %.
Fluorescence spectra of two distinct temporal intervals can be seen in Fig. 5. In the interval corresponding to high fluorescence capacity (19:00–20:00 UTC), the maximum fluorescence backscattering is observed in the 513 nm channel, which agrees with the spectrum of smoke fluorescence provided by Reichardt et al. (2023). In the second interval (23:00–01:00 UTC), when fluorescence capacity is lower, the fluorescence is maximal at 472 nm, and at longer wavelengths, it decreases fast. The lidar ratios (S355) for both time intervals are shown in the same figure. For the first interval (with maximum G472), S355 is about 60 sr, while for the second interval, S355 decreases to about 40 sr. The highest spectral fluorescence capacity of smoke (capacity per elementary spectral interval) reported by Reichardt et al. (2023) for the 455–535 nm range is about 8 × 10⁻⁶ nm−1. This is very comparable with our value (11 × 10−6 nm−1) calculated from the data plotted in Figs. 4 and 5 at 472 nm in the 19:00–20:00 UTC time interval.
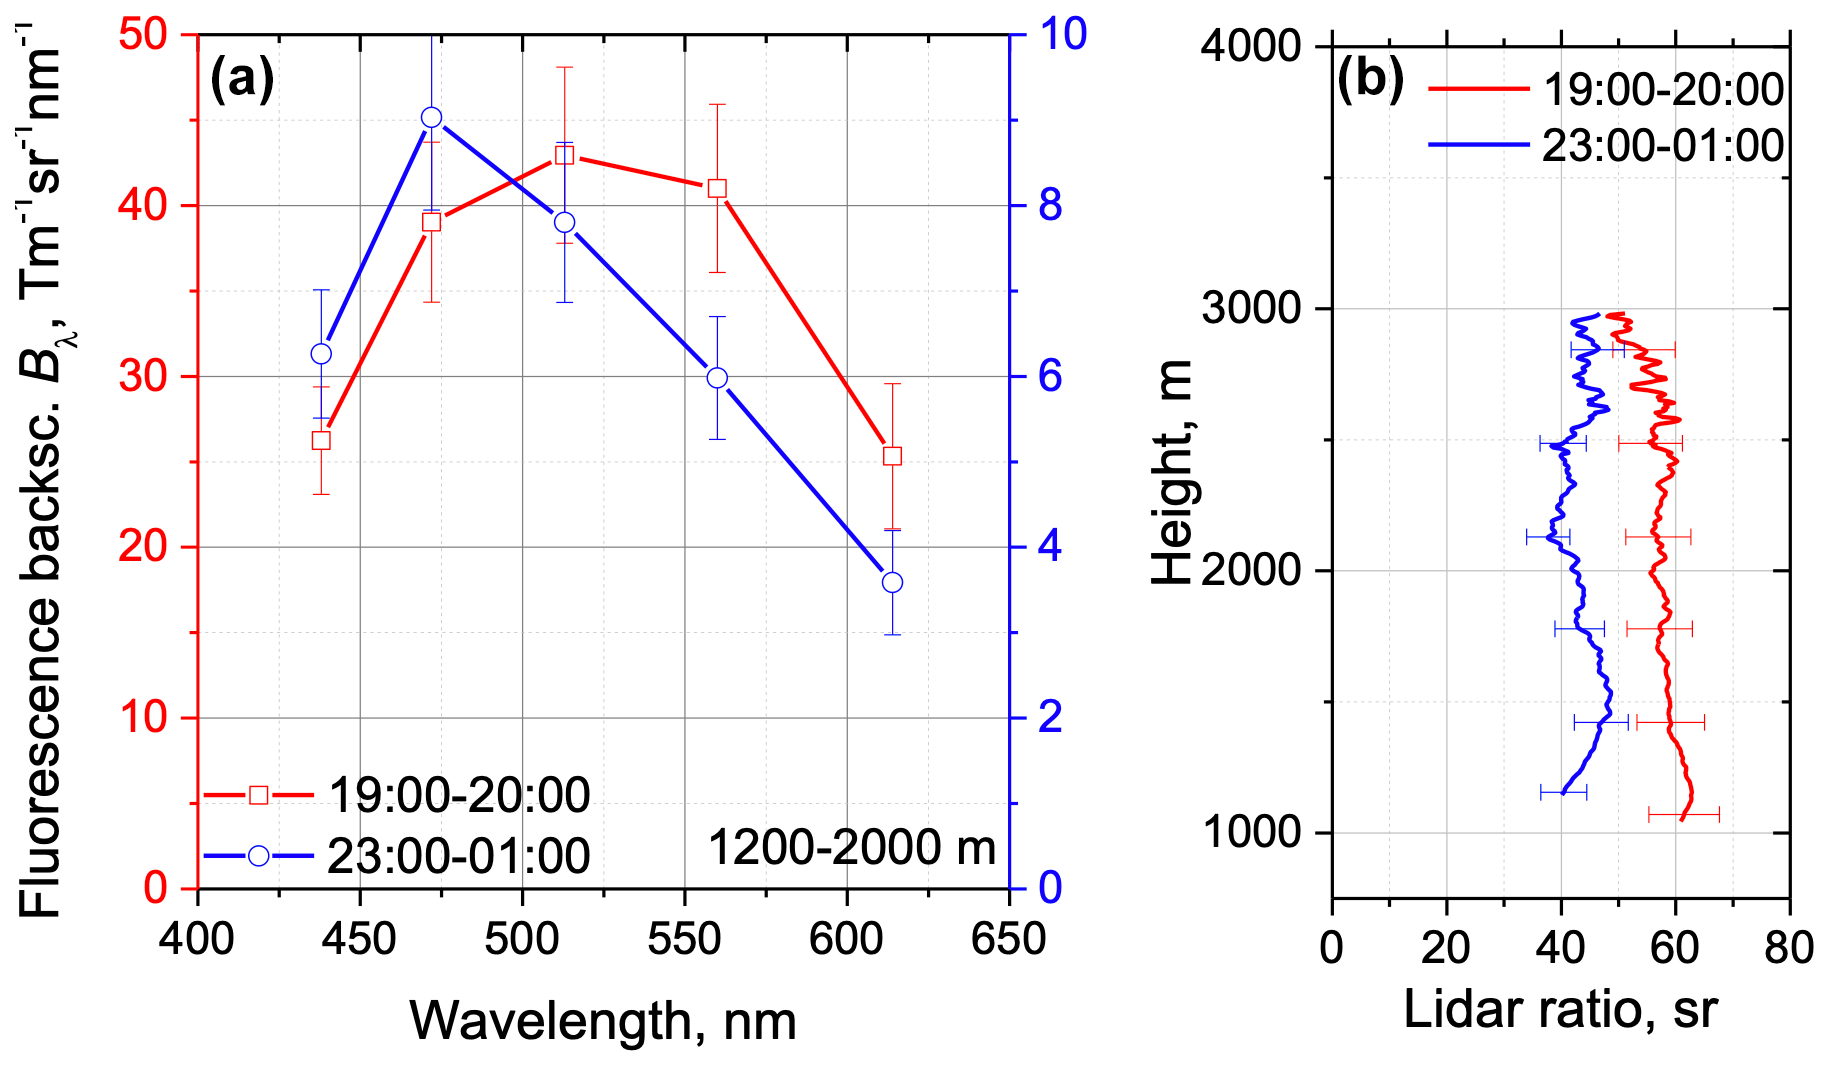
Figure 5(a) Spectrum of fluorescence backscattering Bλ on the night of 27–28 August 2022 for the 19:00–20:00 and 23:00–01:00 UTC intervals. Results are averaged inside the 1200–2000 m height range. (b) Profiles of lidar ratios at 355 nm for the same temporal intervals.
The variation of the fluorescence spectra is revealed by the ratio of the fluorescence-backscattering coefficients at different wavelengths (e.g., ). In particular, inside the aerosol plume in Fig. 3, Bλ does not change significantly in the 472–560 nm range, and the ratios and are close to 1. The spatiotemporal evolution of these ratios is shown in the right column in Fig. 3. The intervals with the maximum G472 are well distinguished by minimum and ratios. At the same time, the ratio appears to be less sensitive to G472 changes. Actually, this ratio even increases inside the aerosol plume. Thus, the analysis of Fig. 3 reveals two types of particles. The first type, having a high fluorescence capacity (G472 > 2.0 × 10⁻⁴) and a lidar ratio close to 60 sr, can be classified as pure smoke. The second type, with lower fluorescence capacity (G472 ∼ 1 × 10⁻⁴) and a smaller lidar ratio, can be classified as a mixture of smoke and urban aerosol.
Forest fires stopped in the beginning of September, so during September–October, the urban aerosols were predominant. Figure 6 shows corresponding fluorescence spectra, normalized to B472. Measurements were performed during 07:00–09:00 UTC and were averaged within the boundary layer between 500 and 1000 m. For urban aerosol, fluorescence at wavelengths larger than 472 nm decreases fast. The presence of remaining smoke, however, may lead to some increase of Bλ in the 513–614 nm interval. For urban aerosol particles, the fluorescence capacity G472 varied within a (0.1–0.4) × 10−4 interval and the lidar ratio varied within a 30–50 sr interval. Thus, mixing of smoke and urban particles can explain the variability observed in the fluorescence spectrum in Fig. 5.
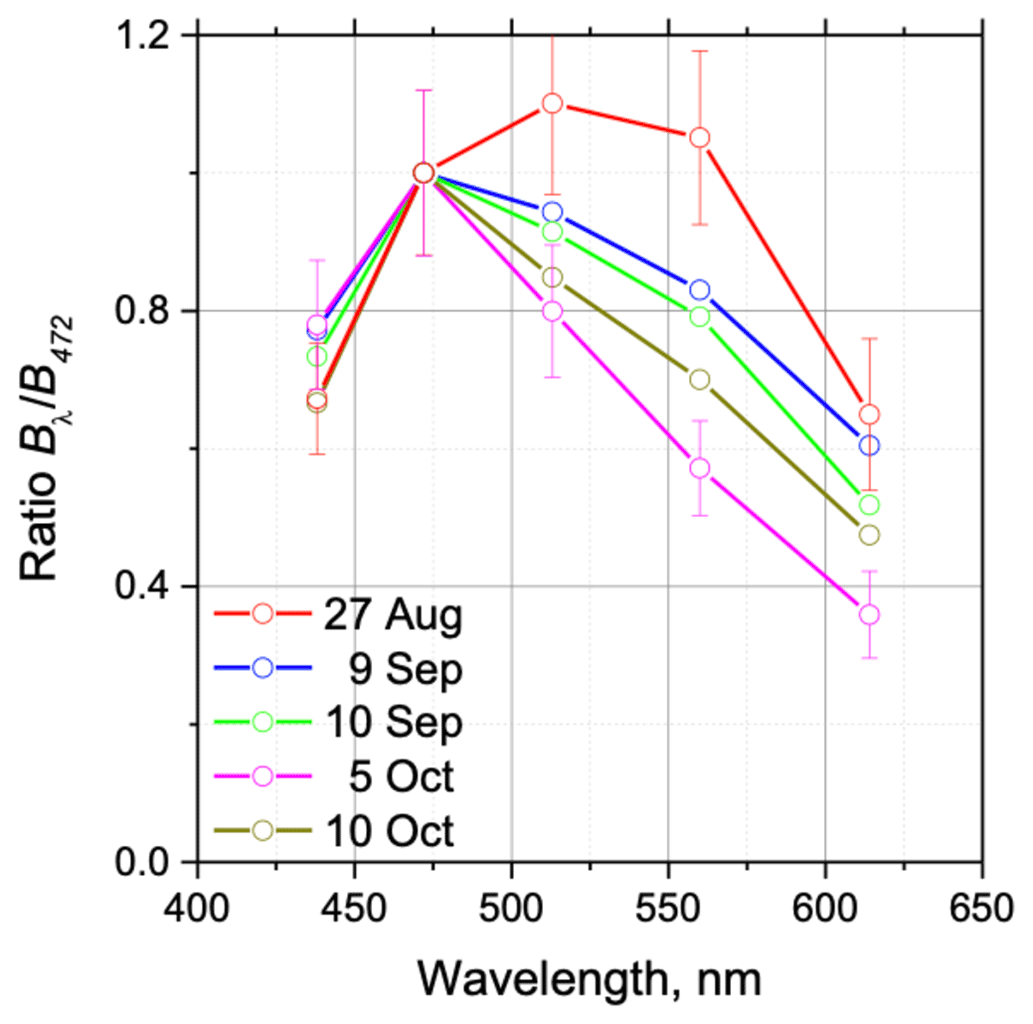
Figure 6Fluorescence spectra measured in September–October 2022, when forest fires were over. Fluorescence-backscattering coefficients Bλ were averaged inside the 500–1000 m height range and normalized according to B472. For comparison, the fluorescence spectrum in the smoke plume on 27 August from Fig. 5 is also presented.
3.1.2 17 August 2022
The spatiotemporal intervals with high fluorescence capacity were also observed for other days. On the night of 17–18 August 2022, between 18:00–19:00 UTC, the fluorescence capacity at 472 nm (G472) within the aerosol plume increased above 1 × 10⁻⁴ (Fig. 7). Simultaneously, the ratio decreased to less than 0.8. Outside the plume, the fluorescence capacity was (0.4–0.7) × 10−4, and the ratio increased up to 1.2. Corresponding fluorescence spectra are shown in Fig. 8. Inside the plume, the fluorescence was maximal in the 560 nm channel, while outside, the maximum shifted to 472 nm. Similarly to the 27–28 August event (Fig. 5), the lidar ratio S355 was about 60 sr inside the plume and decreased down to about 30 sr outside the plume. Thus, again, we conclude that, in the interval with the highest G472, smoke particles are predominant, while outside, it is very likely that aerosol is a mixture of smoke and urban particles.
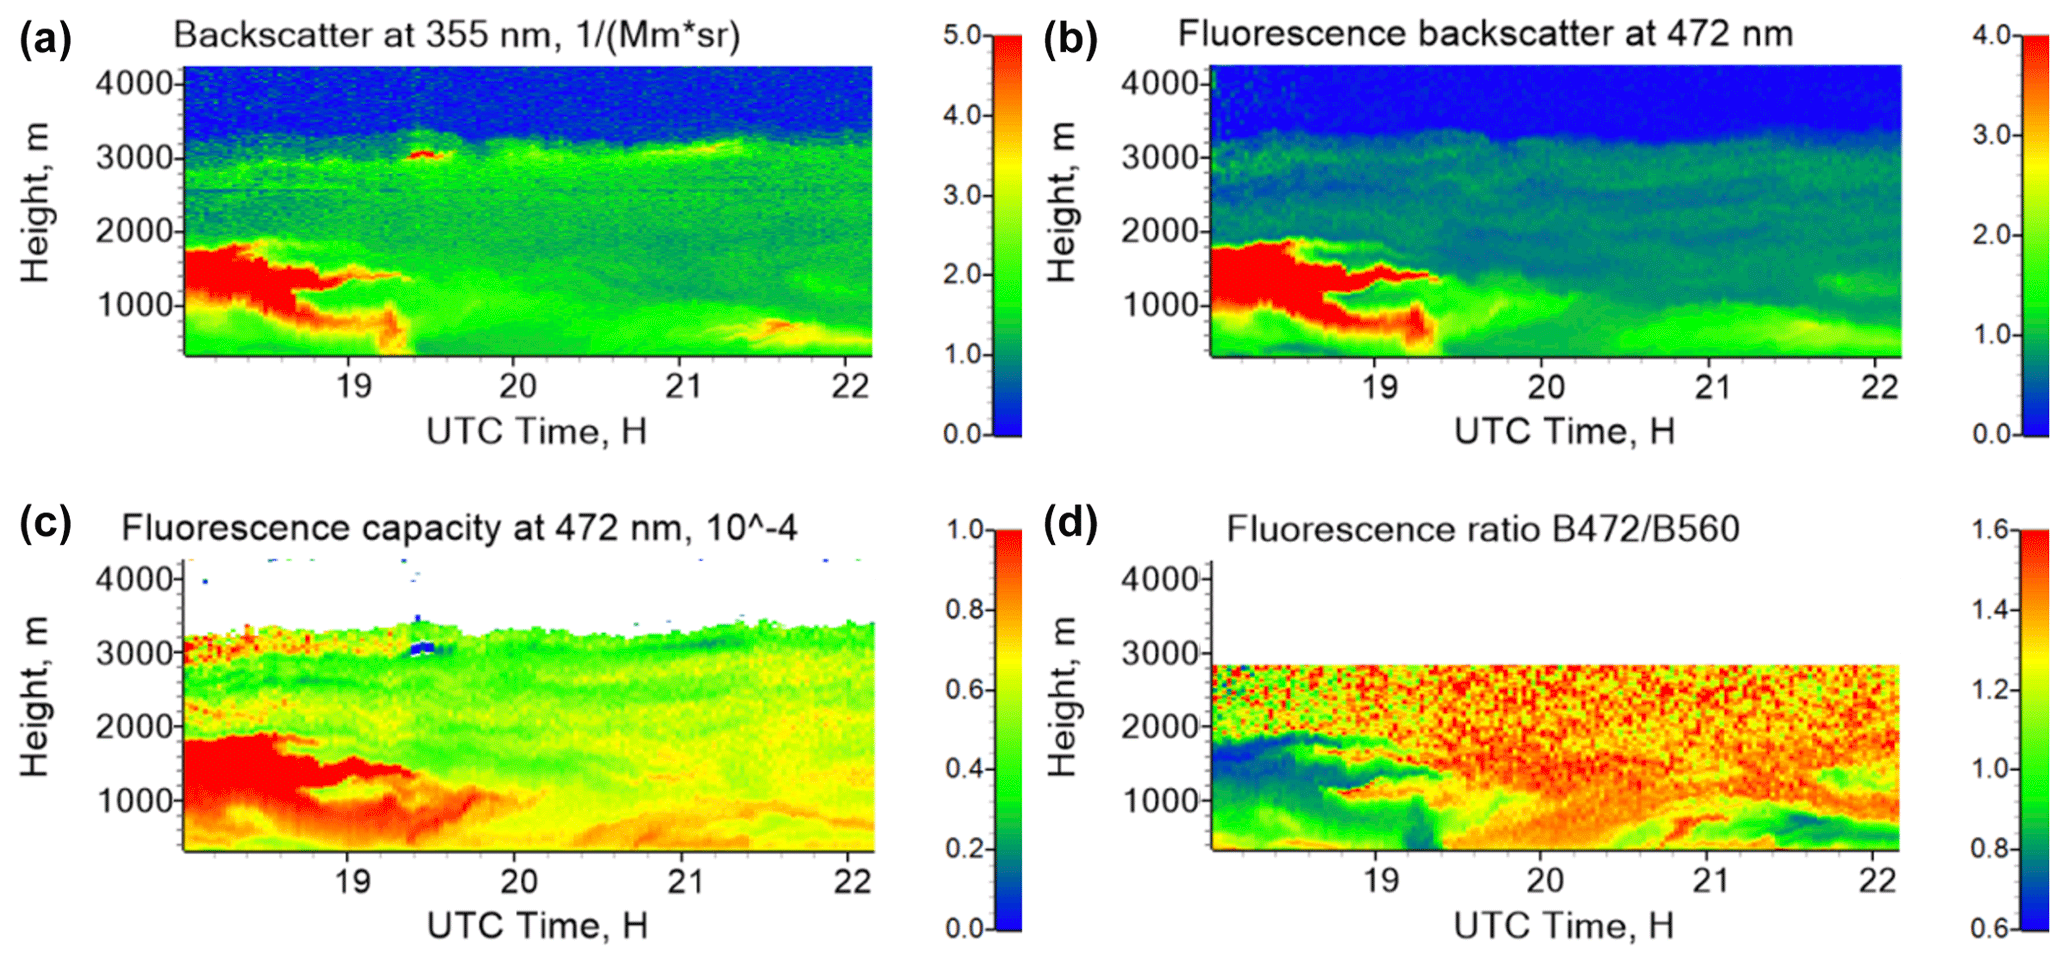
Figure 7Observations on 17 August 2022. (a, c) Aerosol-backscattering coefficient β355 and fluorescence capacity G472. (b, d) Fluorescence-backscattering coefficient βF472 (in 10−4 Mm−1 sr−1) and the ratio of fluorescence-spectral-backscattering coefficients .
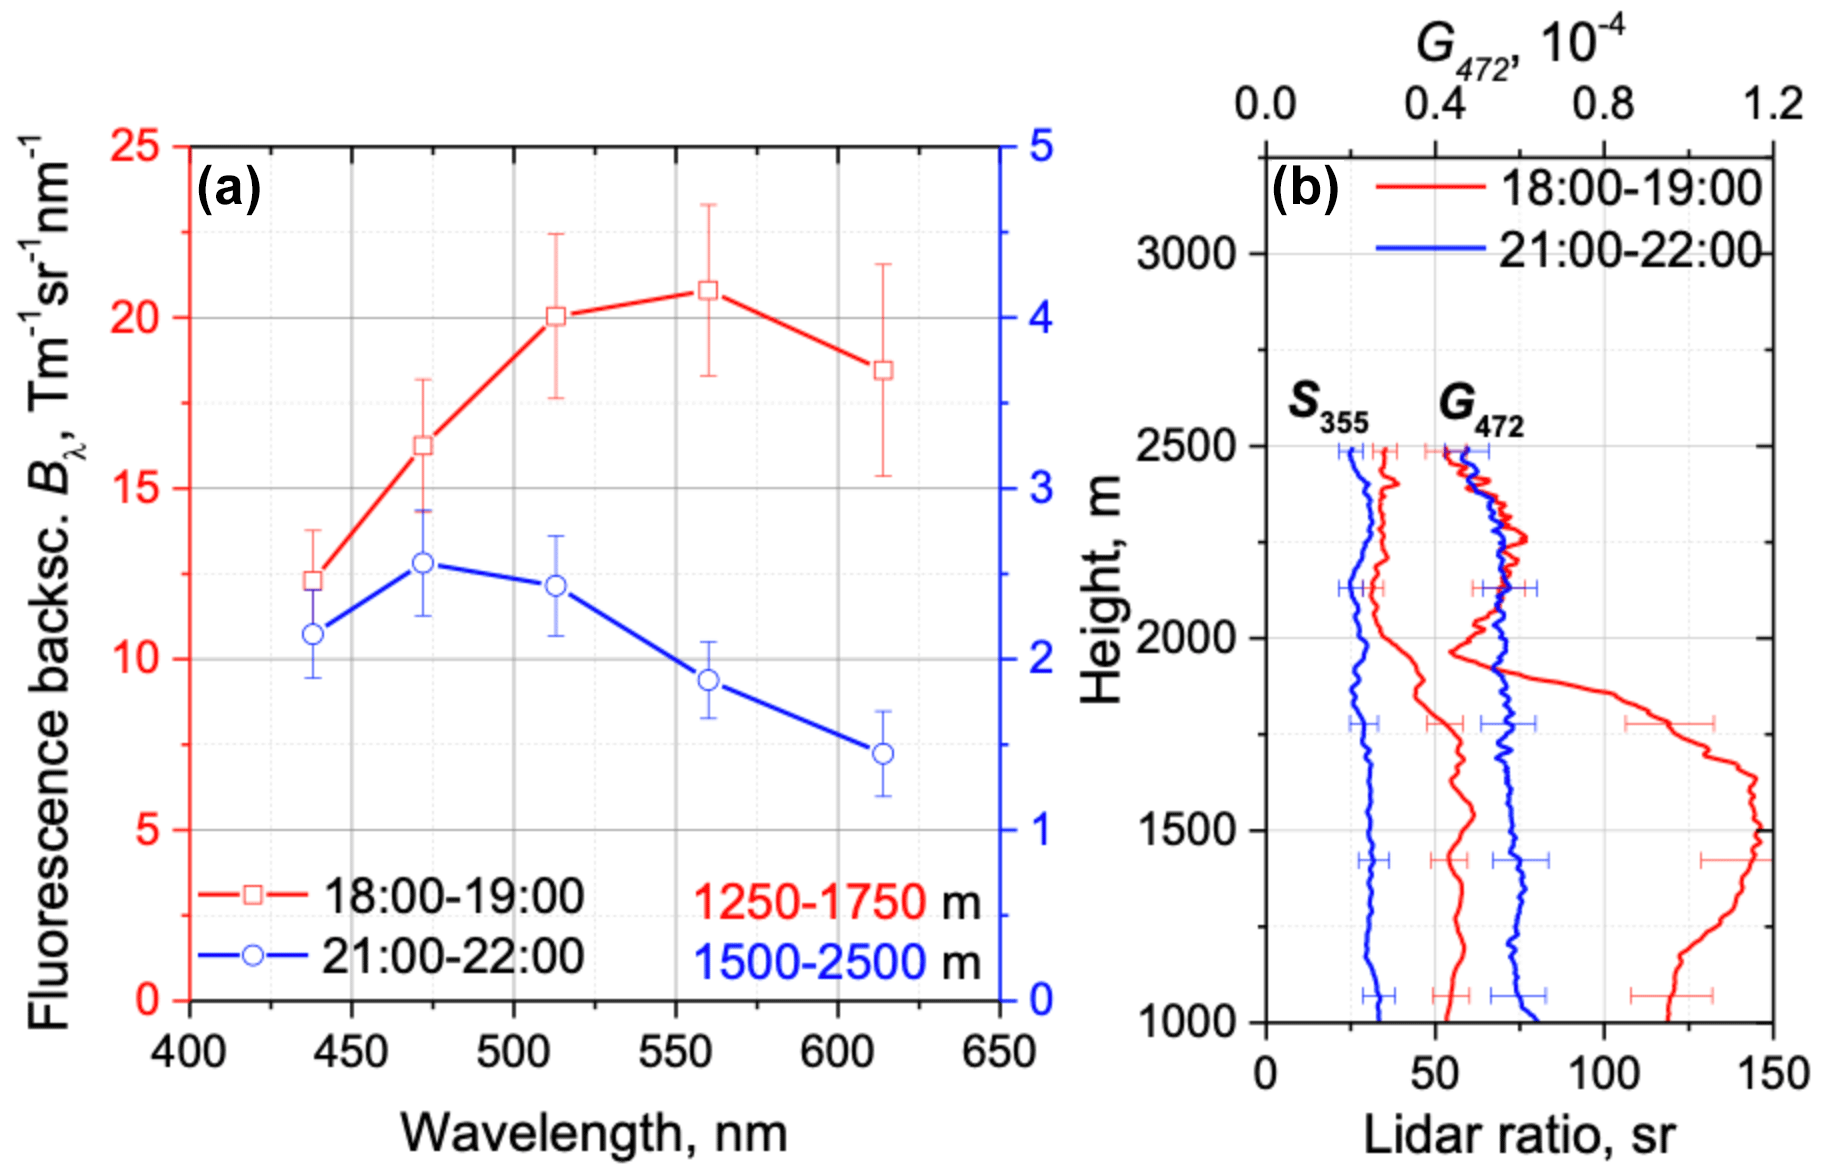
Figure 8(a) Spectra of fluorescence backscattering Bλ on 17 August 2022 for the 18:00–19:00 and 21:00–22:00 UTC periods. Results are averaged within the 1250–1750 and 1500–2500 m height ranges respectively. (b) Profiles of lidar ratio S355 and fluorescence capacity G472 for the same temporal periods.
3.2 Analysis of fluorescence profiles observed in the presence of hygroscopic growth of aerosol
Our previous studies with a single-channel fluorescence lidar revealed that the hygroscopic growth of aerosol particles decreases the fluorescence capacity but does not affect the fluorescence-backscattering coefficient (Veselovskii et al., 2021). Thus, when fluorescence spectra are available, one can expect that the spectral dependence of fluorescence-backscattering coefficients will preserve information about particle types (and will not be influenced by water uptake). Below, we provide an interpretation of the measurements performed during the nights of 21–22 and 23–24 August 2022. In both cases, RH increased with altitude, and the hygroscopic growth is one possible contributor to the observed increase in the particle-backscattering coefficient. Our results show that, on 21–22 August, the shape of the fluorescence spectrum (the set of ratios) did not exhibit any change with altitude, whereas, conversely, on 23–24 August, the shape of the fluorescence spectrum changed with altitude, indicating a possible change of aerosol composition with height.
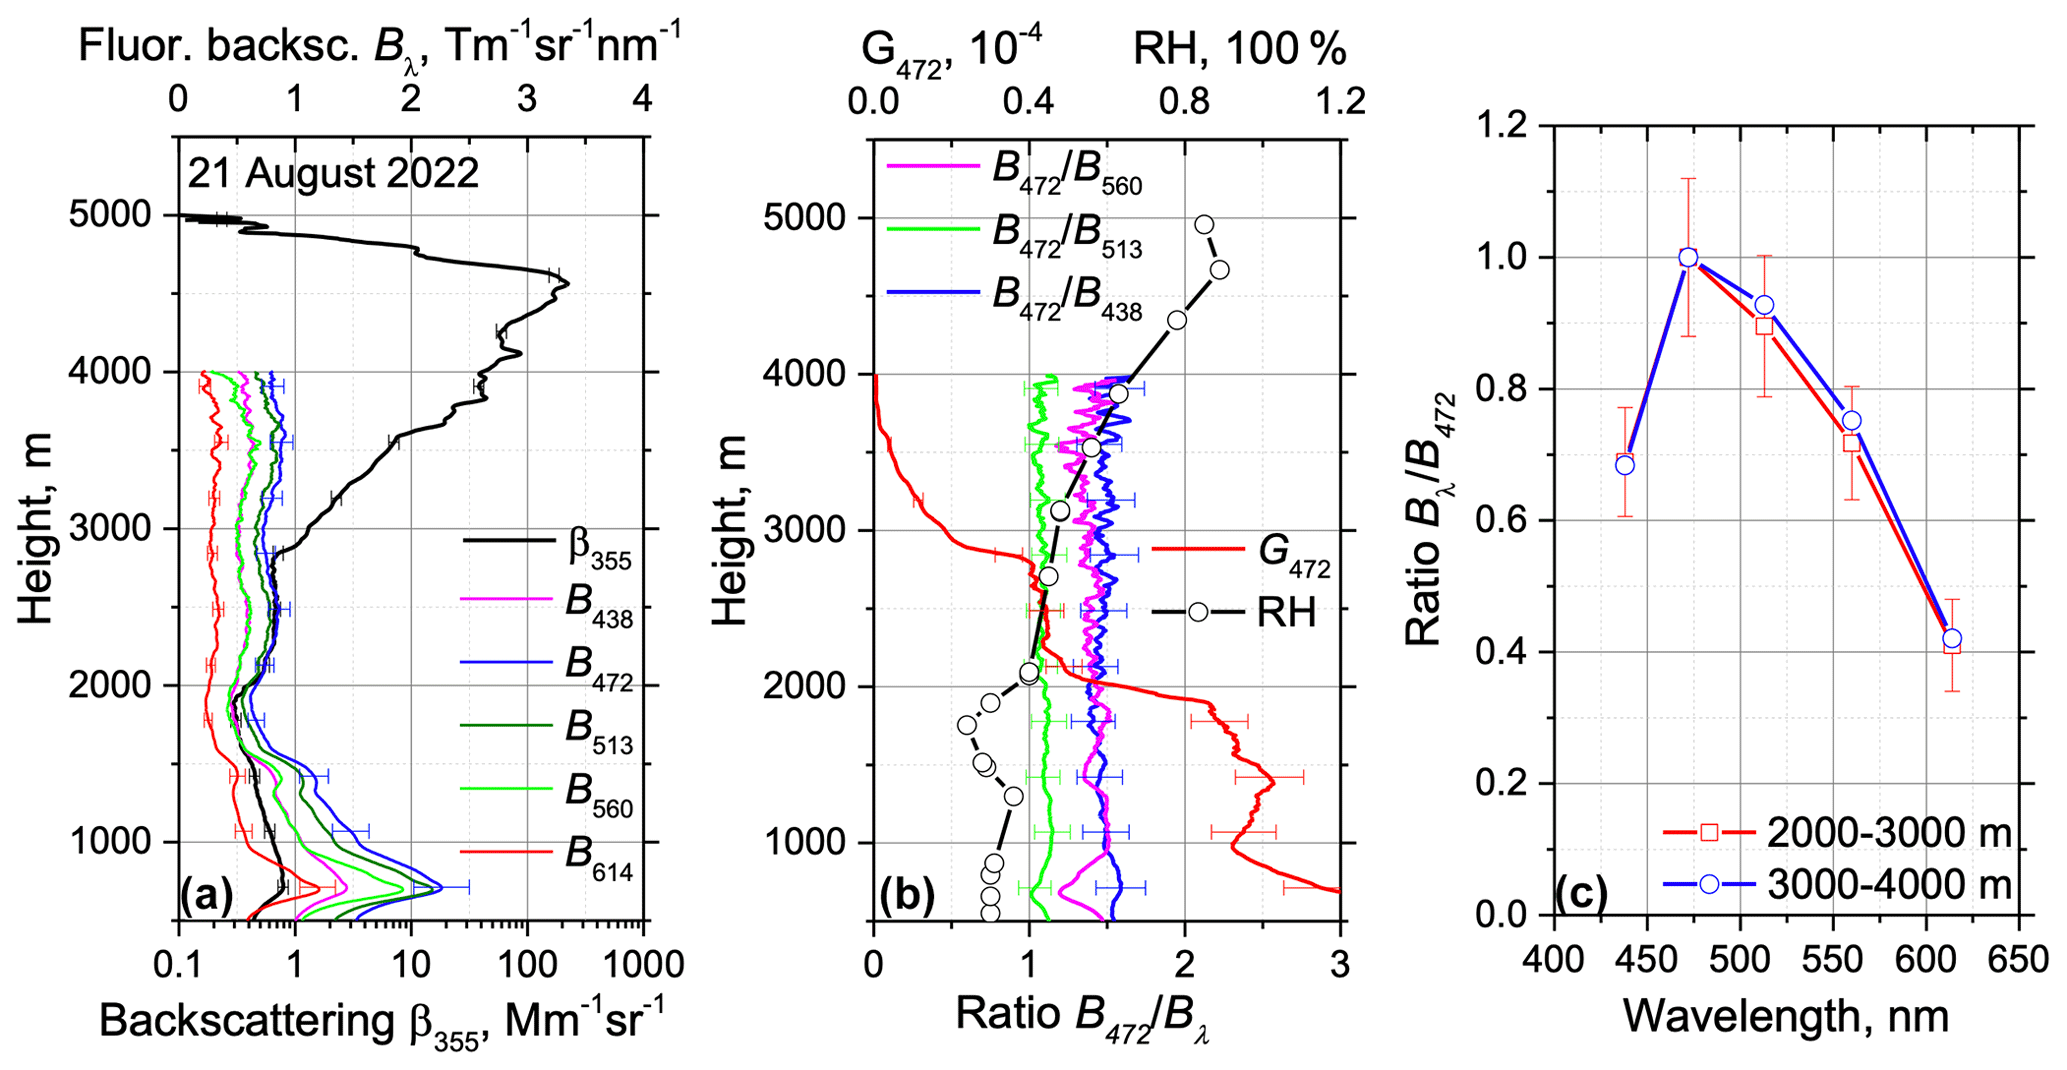
Figure 9Vertical profiles of the particle parameters on 21 August 2022 for the period 22:00–24:00 UTC. (a) The fluorescence-spectral-backscattering coefficients Bλ at 438, 472, 513, 560 and 614 nm and the aerosol-backscattering coefficient β355. (b) The ratios , and and the fluorescence capacity G472. Symbols show the relative humidity measured by a radiosonde at 00:00 UTC on 22 August. (c) Spectrum of the fluorescence-backscattering coefficient Bλ for height intervals of 2000–3000 and 3000–4000 m. Values of Bλ are normalized according to B472.
Figure 9 shows vertical profiles of the fluorescence-spectral-backscattering coefficients Bλ together with the backscattering coefficient β355, fluorescence capacity G472, and , and ratios on 21 August 2022. Profiles of the ratio are noisier and are not used for analysis. The profile of the relative humidity measured by a radiosonde at Dolgoprudnyi station shows an increase of RH with altitude from 30 % to 80 % within the 1000–4500 interval. Inside the 3000–4000 m range, the fluorescence backscattering does not demonstrate significant variations, while elastic backscattering increases by 2 orders of magnitude (from approximately 1 to 100 Mm−1 sr−1), which should be attributed to aerosol hygroscopic growth. The fluorescence capacity G472 decreases to less than 0.01 × 10⁻⁴ at 4000 m; however, the ratios , and do not change with altitude, meaning that (i) the spectrum (its shape) is not affected by the water uptake process and that (ii) aerosol composition remains constant.
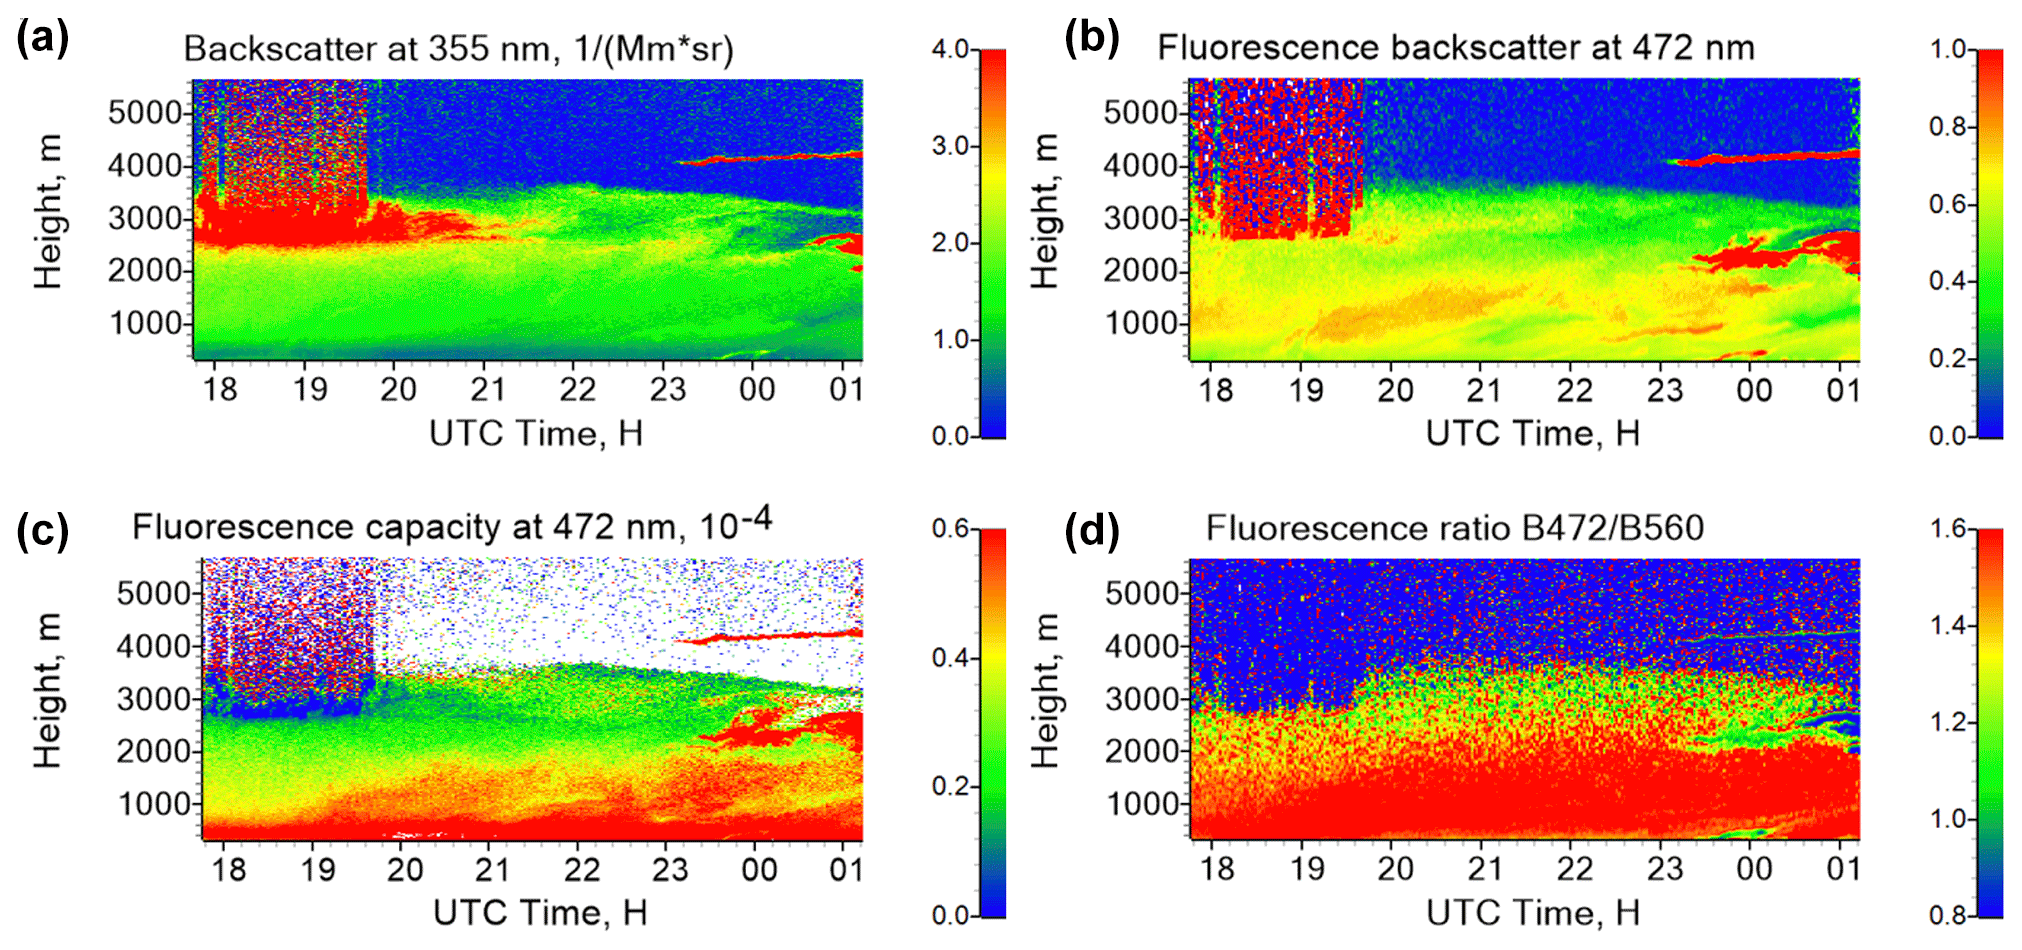
Figure 10Spatiotemporal distributions of the particle parameters on the night of 23–24 August 2022. (a, c) The aerosol-backscattering coefficient β355 together with the fluorescence capacity G472. (b, d) The fluorescence-backscattering coefficient βF472 (in 10−4 Mm−1 sr−1) and the ratio .
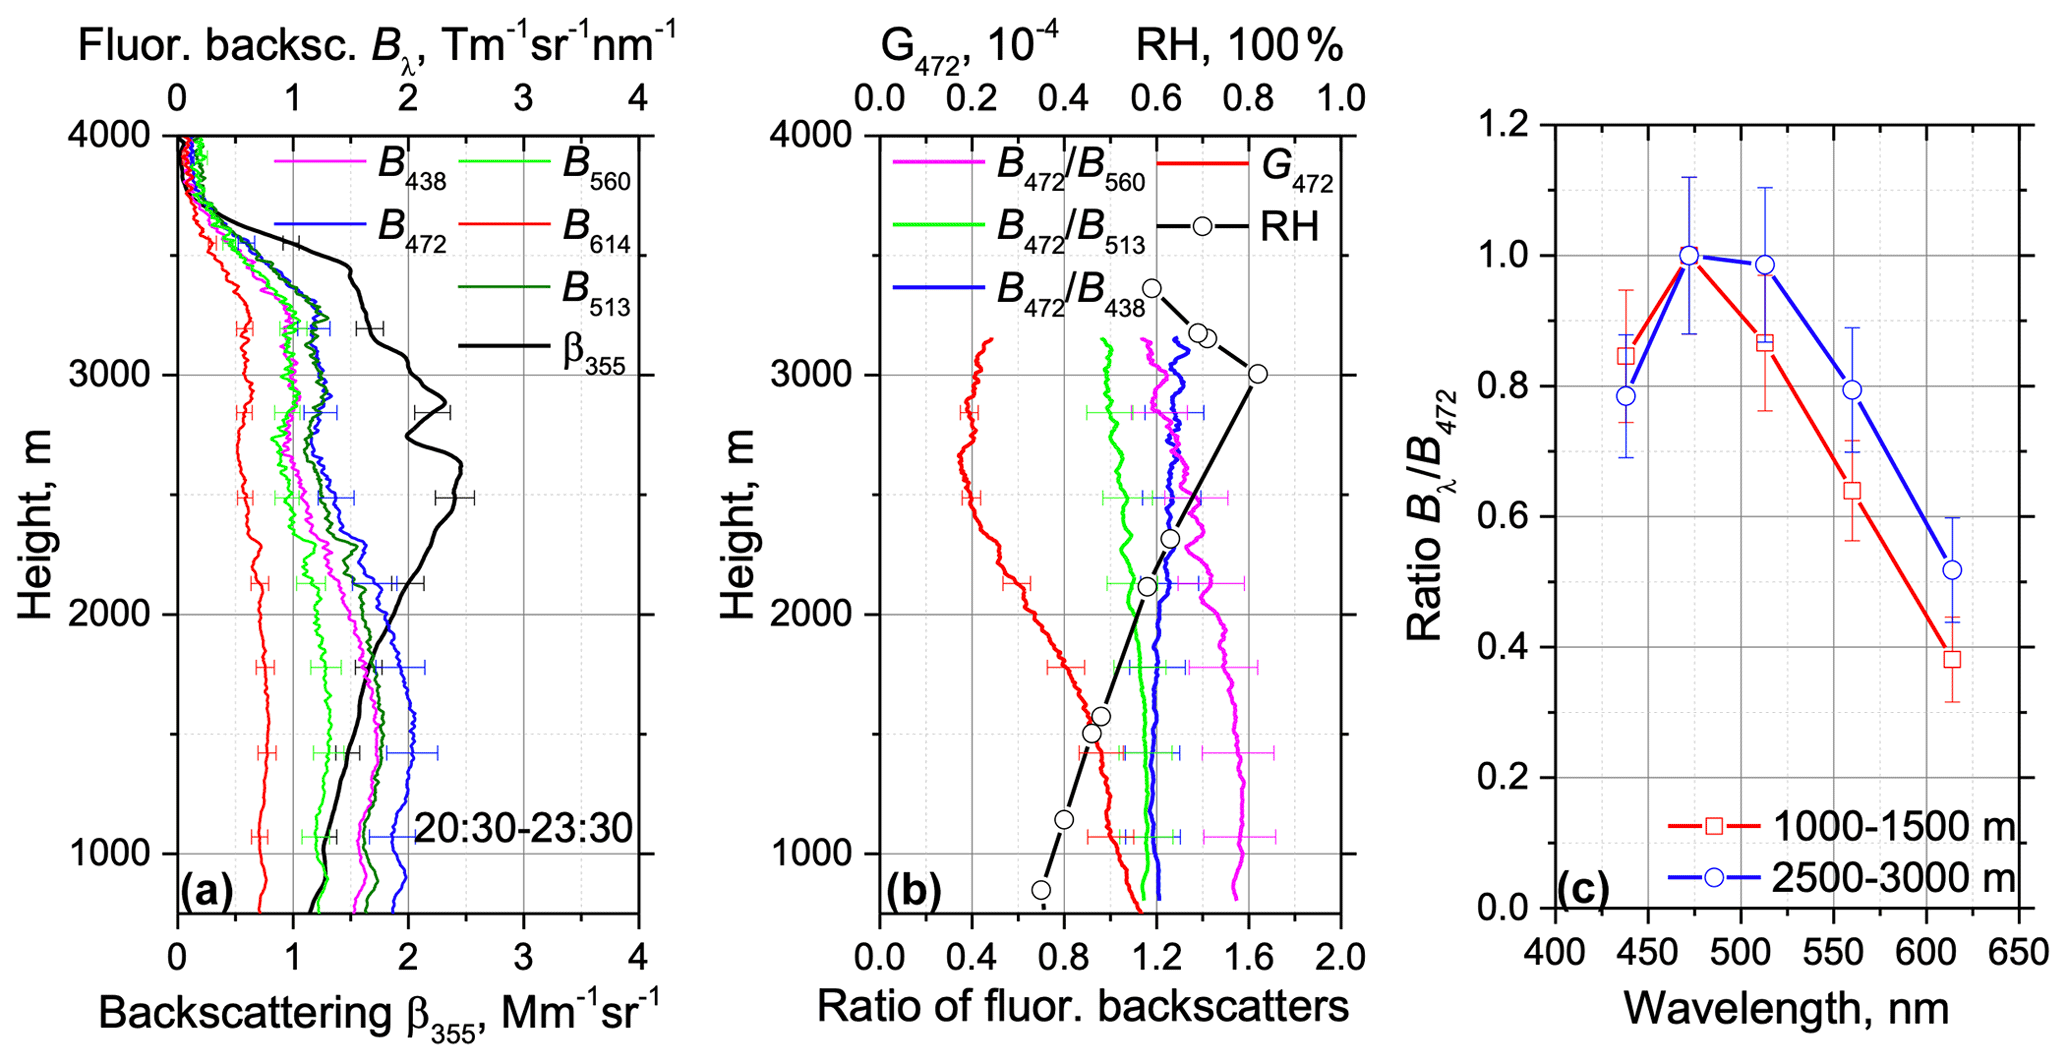
Figure 11Vertical profiles of the particle parameters on 23 August 2022 for the period 20:30–23:30 UTC. (a) The fluorescence-spectral-backscattering coefficients Bλ at 438, 472, 513, 560 and 614 nm and the aerosol-backscattering coefficient β355. (b) The ratios , and and the fluorescence capacity G472. Symbols show the relative humidity measured by a radiosonde at 00:00 UTC on 24 August. (c) Spectrum of the fluorescence-backscattering coefficient Bλ for height intervals of 1000–1500 and 2500–3000 m. Values of Bλ are normalized according to B472.
The temporal evolution of the particle parameters on the night of 23–24 August is presented in Fig. 10. The relative humidity increases with height, and during the 18:00–20:00 UTC time interval, a cloud was formed at ∼ 3000 m. After 20:00 UTC, the fluorescence capacity inside the 2000–3000 m height range was low (below 0.2 × 10⁻⁴); however, low values of G472 can also be explained by particle hygroscopic growth – thus, one can not yet conclude that aerosol composition has changed because the two effects (RH + aerosol changes) can occur simultaneously. Meanwhile, the ratio decreases above 2000 m, which can be an indication of aerosol composition change. Profiles of aerosol properties for the time interval 20:30–23:30 UTC are shown in Fig. 11. In accordance with the radiosonde measurements, the relative humidity reaches 80 % at 3000 m at 00:00 UTC. At 1000 m height, where RH is low (∼ 35 %), G472 is about 0.4 × 10⁻⁴; hence, the urban aerosol type is predominant. Both and ratios decrease above 2000 m, while increases. As mentioned above, such behavior can be an indication that the contribution of smoke rises with height.
Normalized fluorescence spectra for two height intervals, 1000–1500 and 2500–3000 m, are shown in Fig. 11c. In the second interval, the spectrum is shifted towards longer wavelengths, which corroborates that the smoke fraction in the aerosol mixture increases above 2000 m. Thus, the analysis of this episode demonstrates that multi-spectral fluorescence backscattering provides an opportunity for particle identification even in the presence of hygroscopic growth.
Observations performed with a five-channel fluorescence lidar allow the atmospheric aerosol fluorescence spectrum to be estimated. For the urban aerosol type, the maximum fluorescence is observed at 472 nm. However, for smoke particles, the maximum is shifted toward longer wavelengths, and the fluorescence-backscattering coefficients in the 472, 513 and 560 nm channels are comparable. Hence, the ratios and , allow the smoke layers to be identified because, for smoke, these ratios are smaller than for urban particles.
During strong forest fires in August 2022, we regularly observed over Moscow aerosol plumes that were characterized by a high fluorescence capacity (G472 > 1 × 10⁻⁴). Inside these plumes, the lidar ratio S355 increased up to 60 sr, with a shift of the fluorescence maximum to 513 or 560 nm occurring simultaneously. Particles inside the plume were very likely composed of pure smoke, while outside the plume, a smoke–urban mixture was probable. Classification of aerosol particles based on single-channel fluorescence measurements has limitations at high RH because the fluorescence capacity decreases due to water uptake. However, our experimental database of fluorescence-backscattering ratios does not show a noticeable dependence on RH, which means these ratios allow us to identify smoke layers even in the presence of hygroscopic growth.
In our measurements, the laser emitted only 355 nm radiation. However, such a configuration is not optimal for aerosol characterization; it is important to use dual-wavelength (355 and 532 nm) depolarization and lidar ratio measurements together with the fluorescence observations. Such a laser-induced-fluorescence exploratory instrument (LIFE) is currently under construction and will start operation in 2023 at the Laboratoire d'Optique Atmosphérique (LOA), Atmospheric Observatory of Lille (ATOLL) platform (France) within the frameworks of the Observation for Climate (OBS4CLIM) project and the Aerosol and Gas Optical Remote Sensing Analysis joint laboratory (AGORA-Lab) activities. More generally, it seems promising to upgrade widely used multiwavelength Mie–Raman high-performance lidars with a couple of fluorescence channels. According to our results, at least for smoke, the 472 and 513 nm channels can be considered. The wavelengths of anti-Stokes components of nitrogen and oxygen stimulated by 532 nm radiation are 473 nm and 491 nm respectively. The oxygen component is blocked by the filter, while the nitrogen one is inside the transmission band of the 472 nm channel. The power of anti-Stokes scattering increases with temperature, but even at 30 ∘C, its contribution to the fluorescence signal is insignificant. Estimations show that, for the backscattering coefficients β355 = 1 Mm−1 sr−1 and βF513 = 0.2 × 10⁻⁴ Mm−1 sr−1 (urban aerosol), the relative contribution of the nitrogen anti-Stokes component to the fluorescence (the fraction of βF472) at 1000 m height is below 4 × 10⁻⁴.
The results presented in this study are preliminary. We focused mainly on the fresh-smoke analysis. However, smoke particle fluorescence properties depend on chemical composition and, in particular, on its organic carbon fraction. In addition, smoke fluorescence may be influenced by the burning process and transportation conditions. More observation campaigns at different locations are needed to clarify this. In the coming spring–summer period, analysis of the fluorescence spectra of different aerosol types, particularly pollen, is planned. At present, the system used in this study is being modified to include depolarization capability.
Lidar measurements are available upon request (philippe.goloub@univ-lille.fr).
IV assembled the lidar and wrote the paper. NK and MK performed the measurements. QH and PG analyzed the data and helped with the preparation of the paper. TP helped with lidar design, and DL participated in the preparation of the paper.
The contact author has declared that none of the authors has any competing interests.
Publisher's note: Copernicus Publications remains neutral with regard to jurisdictional claims in published maps and institutional affiliations.
We acknowledge funding from the CaPPA project funded by the ANR through the PIA under contract ANR-11-LABX-0005-01, the “Hauts de France” Regional Council (project CLIMIBIO) and the European Regional Development Fund (FEDER). The European Space Agency (ESA) is greatly acknowledged for supporting the atmospheric observation activities of the LOA in the framework of the Quality Assurance for Earth Observation (QA4EO). The authors also want to thank the OBS4CLIM project funded by the ANR under contract ANR-21-ESRE-0013.
This research has been supported by the Russian Science Foundation (project 21-17-00114), the ANR (CaPPA project through the PIA under contract ANR-11-LABX-0005-01 and OBS4CLIM project under contract ANR-21-45 ESRE-0013), the “Hauts de France” Regional Council (project CLIMIBIO) and the European Regional Development Fund (FEDER).
Publisher’s note: the article processing charges for this publication were not paid by a Russian or Belarusian institution.
This paper was edited by Vassilis Amiridis and reviewed by two anonymous referees.
Adam, M., Nicolae, D., Stachlewska, I. S., Papayannis, A., and Balis, D.: Biomass burning events measured by lidars in EARLINET – Part 1: Data analysis methodology, Atmos. Chem. Phys., 20, 13905–13927, https://doi.org/10.5194/acp-20-13905-2020, 2020.
Ansmann, A., Riebesell, M., Wandinger, U., Weitkamp, C., Voss, E., Lahmann, W., and Michaelis, W.: Combined Raman elastic-backscatter lidar for vertical profiling of moisture, aerosols extinction, backscatter, and lidar ratio, Appl. Phys. B, 55, 18–28, https://doi.org/10.1007/BF00348608, 1992.
Boucher, O., Randall, D., Artaxo, P., Bretherton, C., Feingold, G., Forster, P., Kerminen, V.-M., Kondo, Y., Liao, H., Lohmann, U., Rasch, P., Satheesh, S. K., Sherwood, S., Stevens, B., and Zhang, X. Y.: Clouds and Aerosols, in: Climate Change 2013: The Physical Science Basis. Contribution of Working Group I to the Fifth Assessment Report of the Intergovernmental Panel on Climate Change, edited by: Stocker, T. F., Qin, D., Plattner, G.-K., Tignor, M., Allen, S. K., Boschung, J., Nauels, A., Xia, Y., Bex, V., and Midgley, P. M., Cambridge University Press, Cambridge, United Kingdom and New York, NY, USA, https://doi.org/10.1017/CBO9781107415324.016, 2013.
Burton, S. P., Ferrare, R. A., Hostetler, C. A., Hair, J. W., Rogers, R. R., Obland, M. D., Butler, C. F., Cook, A. L., Harper, D. B., and Froyd, K. D.: Aerosol classification using airborne High Spectral Resolution Lidar measurements – methodology and examples, Atmos. Meas. Tech., 5, 73–98, https://doi.org/10.5194/amt-5-73-2012, 2012.
Burton, S. P., Ferrare, R. A., Vaughan, M. A., Omar, A. H., Rogers, R. R., Hostetler, C. A., and Hair, J. W.: Aerosol classification from airborne HSRL and comparisons with the CALIPSO vertical feature mask, Atmos. Meas. Tech., 6, 1397–1412, https://doi.org/10.5194/amt-6-1397-2013, 2013.
Dubovik, O., Holben, B. N., Eck, T. F., Smirnov, A., Kaufman, Y. J., King, M. D., Tanre, D., and Slutsker, I.: Variability of absorption and optical properties of key aerosol types observed in worldwide locations, J. Atmos. Sci., 59, 590–608, https://doi.org/10.1175/1520-0469(2002)059<0590:VOAAOP>2.0.CO;2, 2002.
Groß, S., Esselborn, M., Weinzierl, B., Wirth, M., Fix, A., and Petzold, A.: Aerosol classification by airborne high spectral resolution lidar observations, Atmos. Chem. Phys., 13, 2487–2505, https://doi.org/10.5194/acp-13-2487-2013, 2013.
Hara, Y., Nishizawa, T., Sugimoto, N., Osada, K., Yumimoto, K., Uno, I., Kudo, R., and Ishimoto, H.: Retrieval of aerosol components using multi-wavelength Mie-Raman lidar and comparison with ground aerosol sampling, Remote Sens., 10, 937, https://doi.org/10.3390/rs10060937, 2018.
Hu, Q., Goloub, P., Veselovskii, I., and Podvin, T.: The characterization of long-range transported North American biomass burning plumes: what can a multi-wavelength Mie–Raman-polarization-fluorescence lidar provide?, Atmos. Chem. Phys., 22, 5399–5414, https://doi.org/10.5194/acp-22-5399-2022, 2022.
Knippers,W., van Helvoort, K., and Stolte, S.: Vibrational overtones of the homonuclear diatomics (N2, O2, D2) observed by the spontaneous 385 Raman effect, Chem. Phys. Let., 121, 279–286, https://doi.org/10.1016/0009-2614(85)87179-7, 1985.
Mamouri, R.-E. and Ansmann, A.: Potential of polarization/Raman lidar to separate fine dust, coarse dust, maritime, and anthropogenic aerosol profiles, Atmos. Meas. Tech., 10, 3403–3427, https://doi.org/10.5194/amt-10-3403-2017, 2017.
Mylonaki, M., Giannakaki, E., Papayannis, A., Papanikolaou, C.-A., Komppula, M., Nicolae, D., Papagiannopoulos, N., Amodeo, A., Baars, H., and Soupiona, O.: Aerosol type classification analysis using EARLINET multiwavelength and depolarization lidar observations, Atmos. Chem. Phys., 21, 2211–2227, https://doi.org/10.5194/acp-21-2211-2021, 2021.
Nicolae, D., Vasilescu, J., Talianu, C., Binietoglou, I., Nicolae, V., Andrei, S., and Antonescu, B.: A neural network aerosol-typing algorithm based on lidar data, Atmos. Chem. Phys., 18, 14511–14537, https://doi.org/10.5194/acp-18-14511-2018, 2018.
Papagiannopoulos, N., Mona, L., Amodeo, A., D'Amico, G., Gumà Claramunt, P., Pappalardo, G., Alados-Arboledas, L., Guerrero-Rascado, J. L., Amiridis, V., Kokkalis, P., Apituley, A., Baars, H., Schwarz, A., Wandinger, U., Binietoglou, I., Nicolae, D., Bortoli, D., Comerón, A., Rodríguez-Gómez, A., Sicard, M., Papayannis, A., and Wiegner, M.: An automatic observation-based aerosol typing method for EARLINET, Atmos. Chem. Phys., 18, 15879–15901, https://doi.org/10.5194/acp-18-15879-2018, 2018.
Reichardt, J., Behrendt, O., and Lauermann, F.: Spectrometric fluorescence and Raman lidar: absolute calibration of aerosol fluorescence spectra and fluorescence correction of humidity measurements, Atmos. Meas. Tech., 16, 1–13, https://doi.org/10.5194/amt-16-1-2023, 2023.
Saito,Y., Hosokawa, T., and Shiraishi, K.: Collection of excitation-emission-matrix fluorescence of aerosol-candidate-substances and its application to fluorescence lidar monitoring, Appl. Optics, 61, 653–660, https://doi.org/10.1364/AO.445507, 2022.
Sugimoto, N., Huang, Z., Nishizawa, T., Matsui, I., and Tatarov, B.: Fluorescence from atmospheric aerosols observed with a multichannel lidar spectrometer, Opt. Express 20, 20800–20807, https://doi.org/10.1364/OE.20.020800, 2012.
Venable, D. D., Whiteman, D. N., Calhoun, M. N., Dirisu, A. O., Connell, R. M., and Landulfo, E.: Lamp mapping technique for independent determination of the water vapor mixing ratio calibration factor for a Raman lidar system, Appl. Optics, 50, 4622–4632, https://doi.org/10.1364/AO.50.004622, 2011.
Veselovskii, I., Griaznov, V., Kolgotin, A., and Whiteman, D.: Angle- and size-dependent characteristics of incoherent Raman and fluorescent scattering by microsoheres 2.: Numerical simulation, Appl. Optics, 41, 5783–5791, https://doi.org/10.1364/AO.41.005783, 2002.
Veselovskii, I., Hu, Q., Goloub, P., Podvin, T., Korenskiy, M., Pujol, O., Dubovik, O., and Lopatin, A.: Combined use of Mie–Raman and fluorescence lidar observations for improving aerosol characterization: feasibility experiment, Atmos. Meas. Tech., 13, 6691–6701, https://doi.org/10.5194/amt-13-6691-2020, 2020.
Veselovskii, I., Hu, Q., Goloub, P., Podvin, T., Choël, M., Visez, N., and Korenskiy, M.: Mie–Raman–fluorescence lidar observations of aerosols during pollen season in the north of France, Atmos. Meas. Tech., 14, 4773–4786, https://doi.org/10.5194/amt-14-4773-2021, 2021.
Veselovskii, I., Hu, Q., Ansmann, A., Goloub, P., Podvin, T., and Korenskiy, M.: Fluorescence lidar observations of wildfire smoke inside cirrus: a contribution to smoke–cirrus interaction research, Atmos. Chem. Phys., 22, 5209–5221, https://doi.org/10.5194/acp-22-5209-2022, 2022a.
Veselovskii, I., Hu, Q., Goloub, P., Podvin, T., Barchunov, B., and Korenskii, M.: Combining Mie–Raman and fluorescence observations: a step forward in aerosol classification with lidar technology, Atmos. Meas. Tech., 15, 4881–4900, https://doi.org/10.5194/amt-15-4881-2022, 2022b.
Wang, N., Shen, X., Xiao, D., Veselovskii, I., Zhao, C., Chen, F., Liu, C., Rong, Y., Ke, J., Wang, B., Qi, B., and Liu, D.: Development of ZJU high-spectral-resolution lidar for aerosol and cloud: feature detection and classification, J. Quant. Spectrosc. Ra., 261, 107513, https://doi.org/10.1016/j.jqsrt.2021.107513, 2021.