the Creative Commons Attribution 4.0 License.
the Creative Commons Attribution 4.0 License.
 | 27 Apr 2023
Pseudorandom modulation continuous-wave narrowband sodium temperature and wind lidar
Xin Fang
Feng Li
Lei-lei Sun
We report the first pseudorandom modulation continuous-wave (PMCW) narrowband sodium temperature and wind lidar developed at the University of Science and Technology of China (USTC). The laser system uses a 1178 nm diode seed laser and a fiber Raman amplifier with a fiber-coupled acousto-optic frequency shifter (AOFS) to generate a narrowband 589.158 nm light with an output power of 1.5 W at three frequencies of v0, v+, and v−. Based on an innovative technique and algorithm, the main beam and the residual beam modulated by electro-optic modulator (EOM) with M pseudorandom sequence code (M-code) are separately directed to the vertical and eastward directions. The three-frequency light is designed in timing with the multiple-period 127-bit M-code groups. The uncertainties of the temperature and wind with the vertical and temporal resolutions of 1 km and 30 min under clear-sky conditions are estimated to be 5.0 K and 10 m s−1, respectively, at the sodium peak. The temperature and wind results are in good agreement with those observed by satellite and nearby ground-based meteor radar, demonstrating the reliability of the PMCW narrowband sodium lidar system for measuring the mesopause region's temperature and wind.
- Article
(9881 KB) - Full-text XML
- BibTeX
- EndNote


Temperature and wind are important atmospheric parameters for studying wave dynamics in the mesopause region, such as gravity waves, atmospheric tides, and planetary waves. A pulsed narrowband sodium lidar can measure the mesopause region's temperature and wind with high temporal and vertical resolutions. With the development of laser technology, the pulsed narrowband sodium lidar has been gradually developed and improved. Gibson et al. (1979) first measured the sodium ground-state hyperfine structure and the mesopause temperature with an accuracy of 15 K near the peak of the sodium layer. Using a dye laser pumped by excimer, Fricke and von Zahn (1985) obtained 5 K accuracy of temperature measurements with a vertical resolution of 1 km and a temporal resolution of 10 min.
She et al. (1992) developed a high-spectral-resolution narrowband sodium lidar system using dual-frequency technology. Subsequently, three-frequency technology was applied in their lidar for simultaneous temperature and wind measurements in the mesosphere and lower thermosphere (MLT) region (She et al., 2003). Hu et al. (2011) reported a mobile narrowband sodium lidar with temperature measurements. Li et al. (2012) constructed a narrowband sodium lidar with several technical improvements and obtained simultaneous temperature and wind results. A flashlamp-pumped solid-state 589 nm laser or solid-state 589 nm seed laser based on a Raman fiber amplifier was applied in a pulsed narrowband sodium lidar (Xia et al., 2017; Yang et al., 2018). All-solid-state sodium lidar systems based on the sum frequency of pulsed 1064 nm and pulsed 1319 nm were developed to detect the mesopause region's temperature and wind (Kawahara et al., 2002, 2017).
However, pulsed lasers, either dye or solid in the pulsed sodium lidars, cannot be used on the space-borne platform due to size, weight, and power consumption limitations. Therefore, developing a lightweight and small-sized narrowband sodium lidar is necessary for airborne and space-borne purposes. Referring to an idea of continuous wave (CW) in the application of microwave radar (Ridenour et al., 1948), CW lidar is a feasible miniaturized and lightweight lidar system. Takeuchi et al. (1986) first developed a CW aerosol lidar with ranging capability using M pseudorandom sequence code (M-code)-modulated CW laser sources. Abo and Nagasawa (1984) proposed a random modulation CW lidar for Na layer detection. She et al. (2012) gave a detailed simulation of pseudorandom modulation continuous-wave (PMCW) sodium lidar for temperature and wind measurements in the mesopause region and pointed out that PMCW sodium lidar can achieve a signal-to-noise ratio comparable to pulsed sodium lidar. Li et al. (2021) implemented a PMCW single-frequency sodium lidar for sodium density measurement using an M-code-modulated 589 nm diode laser.
This study aims to develop a PMCW three-frequency narrowband sodium lidar for simultaneous temperature and wind measurements in the mesopause region. The detection principle of PMCW narrowband sodium lidar (PMCW-NSL) is described in Sect. 2. The system structure of PMCW-NSL is presented in Sect. 3. Section 4 discusses the returning signals and temperature and wind results, followed by a summary in Sect. 5.
The PMCW-NSL mainly utilizes pseudorandom M-code ai to modulate the CW laser beam and decodes return signals by the cross-correlation between ai and its inverse code . The cross-correlation of the M-code has been described in the early simulation by She et al. (2012) and sodium density measurements by Li et al. (2021). It can be given as below:
According to the cross-correlation, we can obtain the decoded (inverted) signal with range resolution information as follows:
where P0 is the CW laser power, hν is the energy of a single photon, Gj (Li et al., 2021) is the atmospheric response of the lidar system at altitude hj (, c is the speed of light and Δt is the length of time for a single code αi), and B is the average intensity of background noise in Δt.
When the M-code value is 1, the CW beam is transmitted from the polarization crystal inside the electro-optic modulator (EOM). When the M-code value is 0, the CW laser is reflected by the polarization crystal. We refer to the transmitted light as the main light and the reflected output light as the residual light. Since the M-code has approximately the same number of occurrences of 0 and 1 in one cycle, this means that half of the energy of the CW laser is lost due to modulation. To improve the utilization efficiency of laser power, an innovative method is proposed for residual light detection under certain conditions and achieving the complete use of the CW laser.
Since the principle of CW modulation by EOM is based on the assumption that there is no light loss under ideal conditions, the sum of the main and residual light should equal the intensity of the incident light (West and Jones, 1951). If the modulation sequence of the main light is the M-code sequence ai and the residual light sequence is bi, then the relationship between bi and ai is given below:
Similar to the M-code sequence, we also establish the inverted code of the residual light sequence as follows:
By substituting Eq. (3) into Eq. (4), we can obtain
where is the inverted code for ai. The cross-correlation function between the residual light sequence and its inverted code can be calculated according to Eqs. (3) and (5):
By substituting the cross-correlation function (Eq. 1) of the M sequence into the above equation, the cross-correlation function of the residual light code sequence can be obtained:
Table 1 shows the values of the residual light code, inverted code, and cross-correlation function. The inverted codes satisfy the autocorrelation property of pseudorandom coding. Although the correlation function results differ from the M-code, they can also be used for CW laser detection under certain conditions.
Table 1Sequences of residual light code, its associated receiving code, and their correlation for N=31.
Similar to the M sequence, residual light is modulated by the residual light sequence bi to CW, and then the acquisition signal equation can be obtained:
For a single acquisition cycle time, the sky background noise signal is nearly constant, and the system noise signal is replaced with a constant signal. Similar to the main light, the acquired signal above is decoded by the one-to-one inverse code of the residual light sequence, and the new inverted signal Rm at altitude hm (, where c is the speed of light and Δt is the length of time for a single code ) can be obtained as follows:
Comparing the decoded signals from the M-code, we can find several differences in the final form of Eq. (9) from Eq. (1): there is an additional term in the decoded signal. This term is always a negative constant when computing the decoded signal of any given height. The background signal is also negative. The decoded signals are just the altitude return signals superimposed with a large negative background. Consequently, when CW lidar detection is performed using residual light, the background noise cannot be directly acquired in the decoded signal. To solve this issue, we add an additional zero-set code period to the M-code to explicitly measure the background noise signal.
The PMCW-NSL system consists of a transmitter with a CW laser modulated by an M-code, a receiver with two Newtonian telescopes, and a specifically designed acquisition and timing subsystem. The schematic diagram of the PMCW-NSL system is shown in Fig. 1.
The transmitter is to generate an M-code-modulated 589 nm CW laser and send it into the atmosphere. In cooperation with Shanghai Frequency Calibration Co., LTD., we have developed an all-solid-state CW laser source suitable for PMCW-NSL based on fiber Raman laser technology (Murray et al., 1998; Feng et al., 2004; Taylor et al., 2010). Its basic principle is shown in Fig. 1, and its physical photo is shown in Fig. 2. A narrowband 1178 nm diode continuous laser with a linewidth of ∼50 kHz and power of 30 mW (TOPTICA DL Pro, tunable diode laser) acts as the seeder injected into the fiber Raman amplifier with two-stage fiber Raman amplification. The first stage of the fiber Raman amplifier amplifies the 1178 nm seed laser to about 150 mW, divided into two outputs, one for laser frequency locking and the other for the input of the secondary amplification after frequency shift by a fiber acousto-optic frequency shifter (AOFS). The laser frequency locking is completed by a Doppler-free saturated absorption system with an accuracy of ±1 MHz. The fiber AOFS consisted of two acousto-optic modulators (AOMs) and two optical switches with laser shift frequencies of 0, +315, and −315 MHz at 1178.316 nm (corresponding frequency shifts of 0 (v0), +630 (v+), and −630 MHz (v−) at 589.158 nm after passing the second-harmonic generator (SHG) which is a periodically poled lithium niobate (PPLN) crystal). The power of an amplified 589 nm laser is ∼1.5 W at v0, v+, and v− frequencies. Notably, the optical fiber Raman amplifier only weighs ∼25 kg and consumes ∼450 W of power, which is clearly superior to the laser used in the pulsed sodium lidar.
M-code then modulates the amplified 589 nm laser via an electro-optic modulator (EOM). Both the main light and the residual light are directed to the atmosphere in the vertical and eastward directions, respectively. To eliminate the effects of the inverted signals of the strong Rayleigh return signal scattered from the lower atmosphere, called “ghost targets”, we send the laser beam at a distance of 9 m from the receiving telescope and align the sending and receiving optical axis using an automatic collimation system with an accuracy of ∼10 µrad (Li et al., 2012). The key parameters of the PMCW-NSL system are given in Table 2.
The receiver of PMCW-NSL includes two Newtonian prime-focus telescopes, pointing in the zenith direction and eastward at 20∘ tilted from the zenith. The return signal from each telescope is acquired after 10 m length optical fiber transmission, lens collimation, filtering by an optical filter, lens convergence, and a photoelectric conversion process. The main parameters of the receiver are shown in Table 1.
The timing control for the PMCW-NSL is one of the major technical challenges ensuring the lidar obtains return signals effectively. It is mainly composed of two parts. One is responsible for coding the CW laser and trigging the acquisition; the other is for switching the laser beam and tagging return signals in three frequencies. The timing diagram of PMCW-NSL is shown in Fig. 3. A transistor–transistor logic (TTL) signal (S1) with a frequency of 3 Hz generated by the signal generator acts as the main synchronization clock of the system. S1 triggers one self-developed field-programmable gate array (FPGA) circuit board at a frequency division of 3 to generate three TTL signals (S2, S3, and S4) with a pulse width of the S1 period length as the control signals of the three-frequency switching of fiber AOFS and the spectrum tagging signals of the photon counter. S1 also externally triggers a digital delay and pulse generator (DG645) to generate 23 TTL pulsed signals as the external trigger of the photon counter and an arbitrary waveform generator (AWG). The AWG produces one M-code group with 14 periods of 127 M-code and 2 periods of zero-set 127 M-code and a short idle time of one cycle. A 7 µs time length for a single code corresponds to a range resolution of 1.05 km.
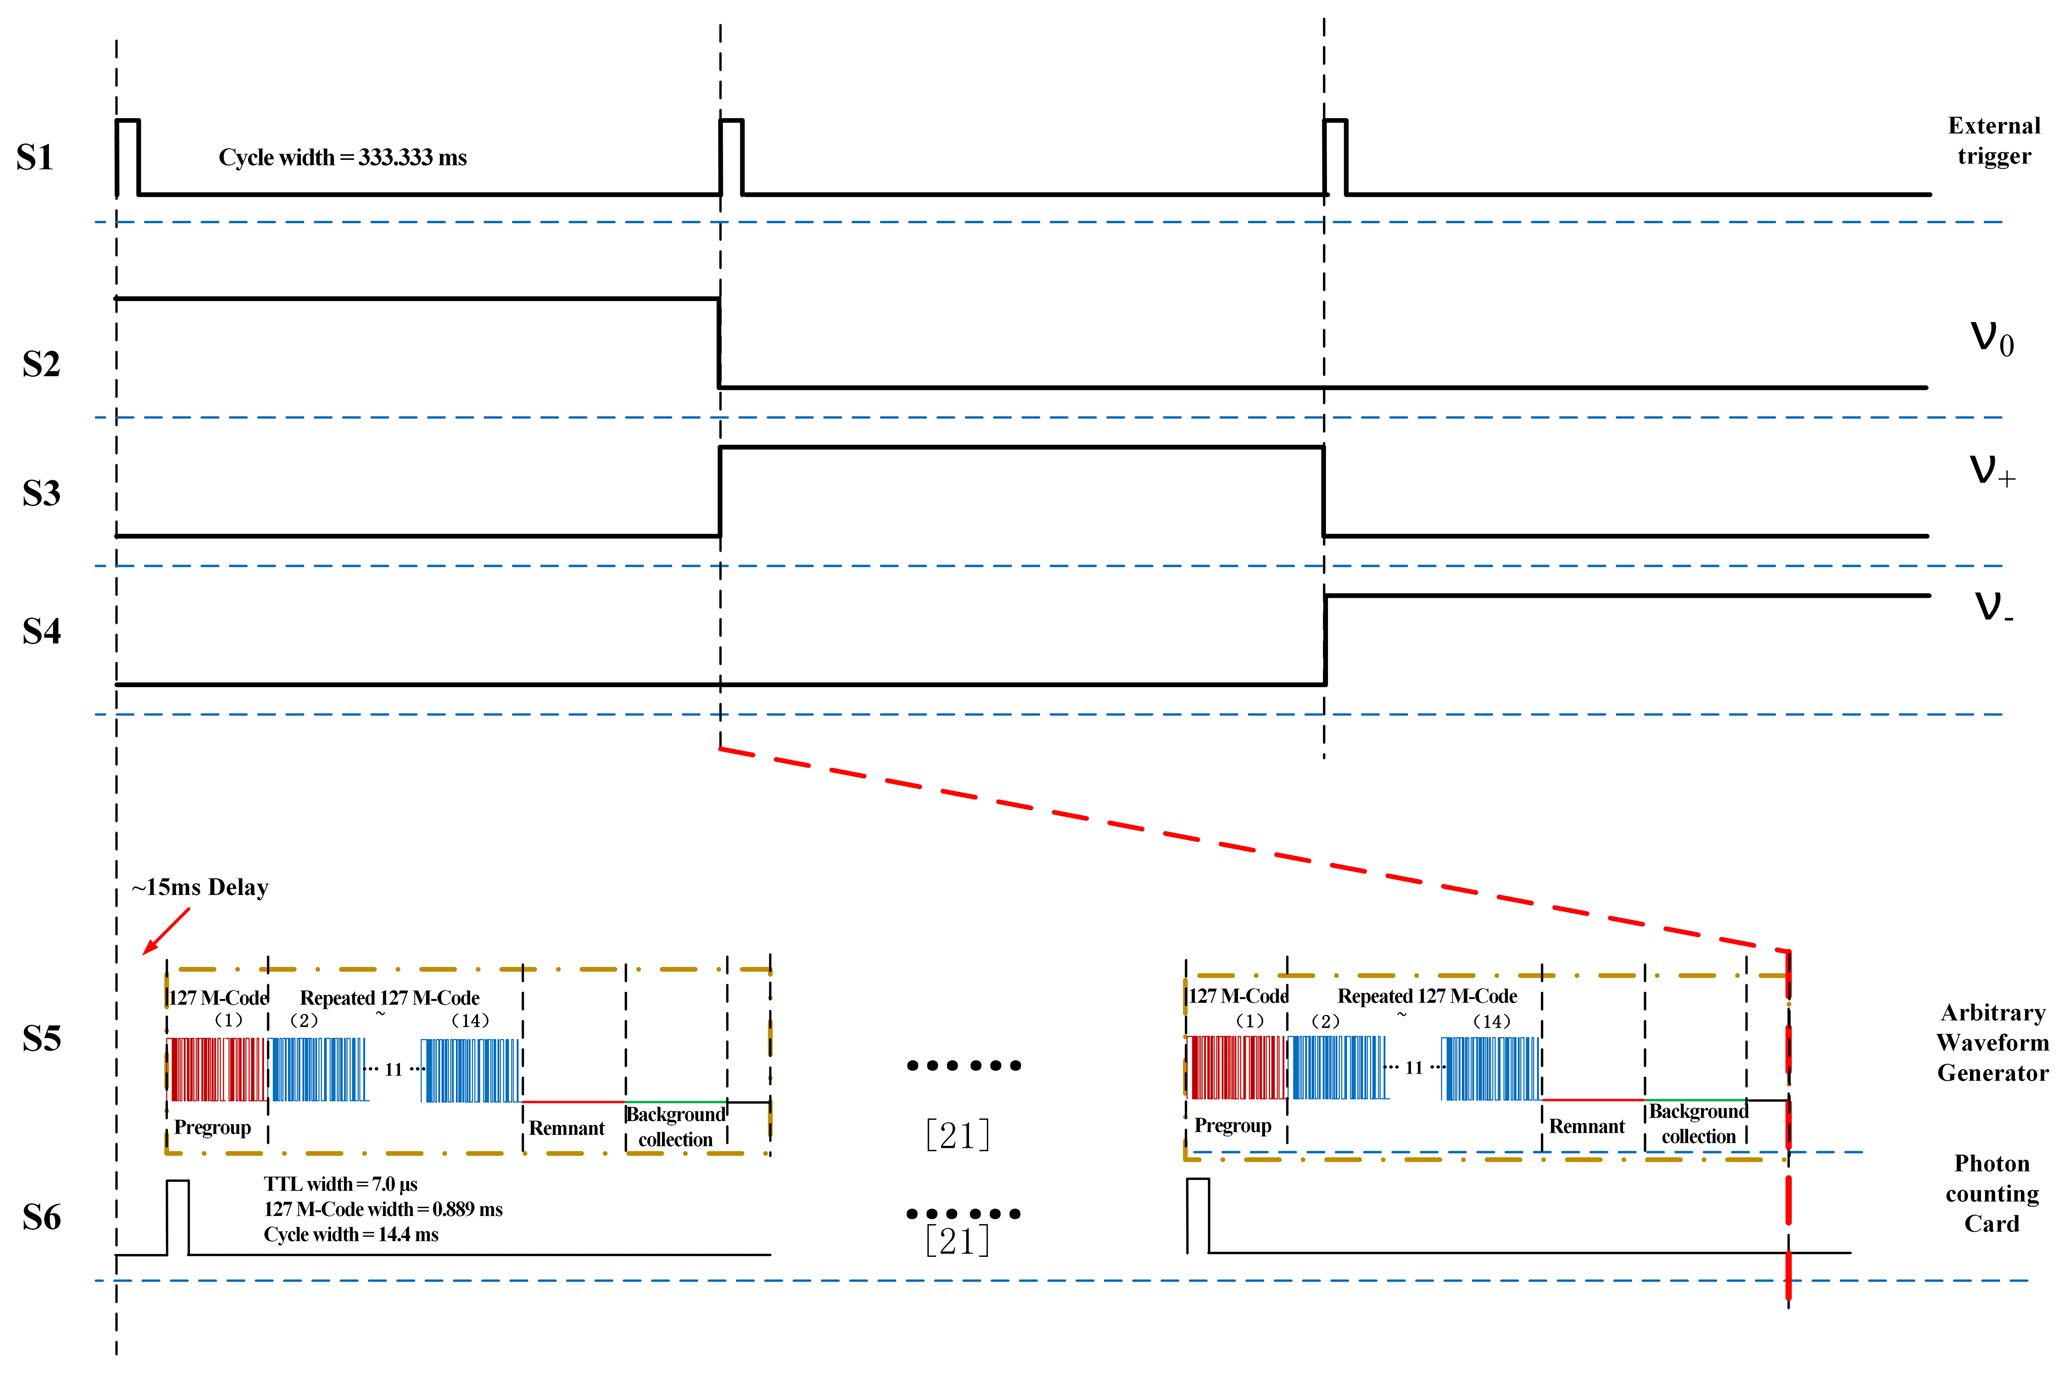
The total detection range of the 127 M-code is, therefore, km. The time length of 23 M-code groups is just slightly less than the S1 period. PMCW-NSL alternatively sends a laser in M-code groups of three frequencies at 3 Hz and receives the respective return signal. The detailed design of the M-code group was illustrated in our previous work (Li et al., 2021). Note that the S5 and S6 signals in one S1 cycle are zoomed in Fig. 3.
PMCW-NSL acquires backscattering return signals of three frequencies (v0, v+, and v−) in 5 min with 2048 bins and 7 µs bin width. We first sum up signals of 127 M-code cycles from the same code bin in 5 min and then decode these signals to obtain range-resolved profiles. An example of the three-frequency signals observed by PMCW-NSL that accumulated from 10:22 to 10:26 UT on 24 November 2021 is shown in Fig. 4. Figure 4a shows the raw three-frequency signals with a spatial resolution of 1.05 km and a temporal resolution of 5 min. According to Eq. (7), the inverted signal profile with range resolution information and background removal similar to that obtained by pulsed sodium lidar is shown in Fig. 4b. It is noted that the removal background includes background shift and pure background shot noise acquired at the second period of zero-set 127 M-codes. Figure 4c and d are the signal profiles in the sodium layer and corresponding signal-to-noise ratios (SNRs). The number of return signal photons at three frequencies reaches 1×10⁵, 5×10⁴, and 5×10⁴ at the peak altitude of the sodium layer with SNRs larger than 30, 15, and 15, respectively.
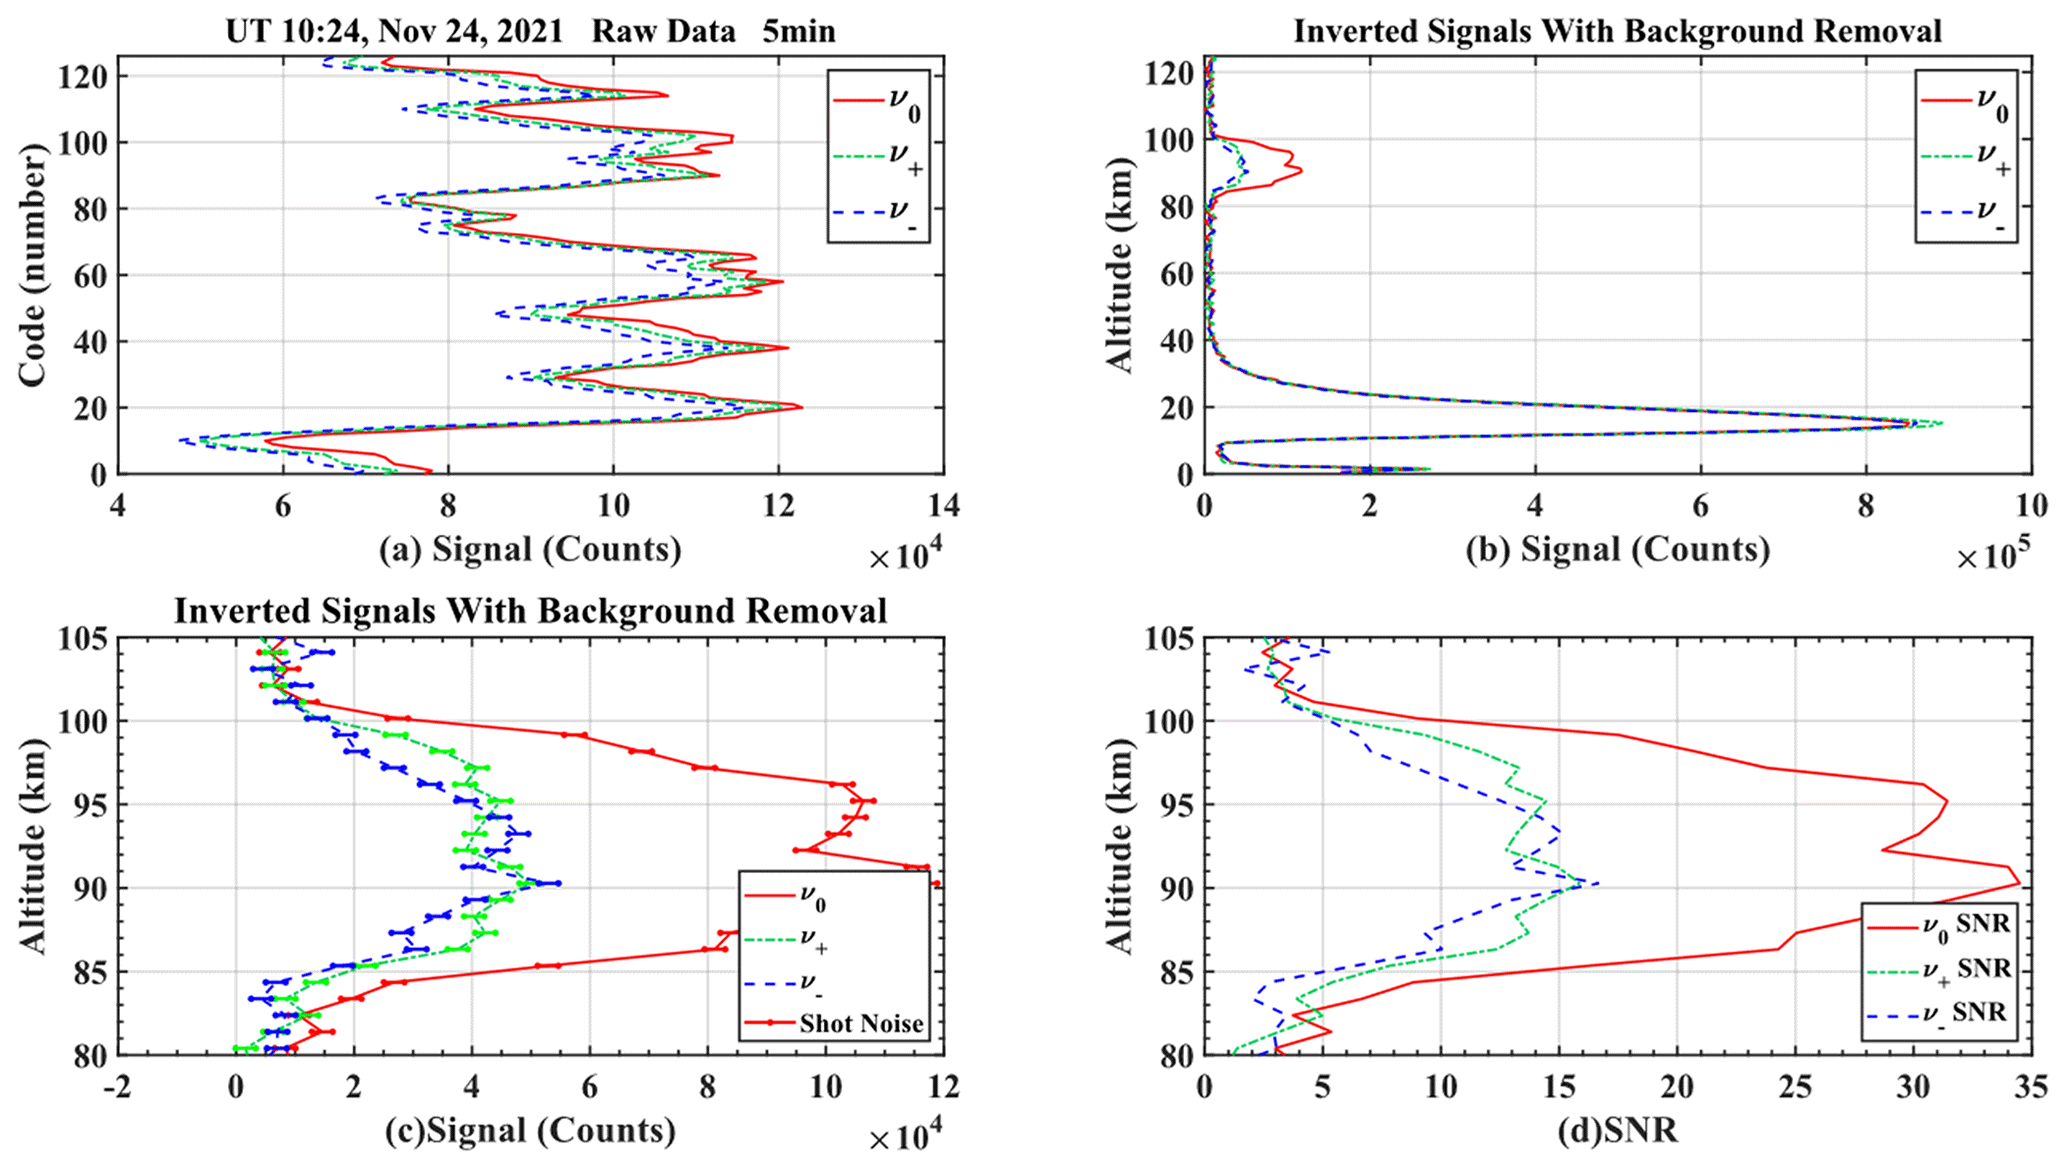
Figure 4Profiles of (a) raw signals arranged in M-code sequence with 1.05 km spatial and 5 min temporal resolutions on 24 November 2021, (b) inverted signals with background subtracted, (c) inverted signals of only the sodium layer region, and (d) the signal-to-noise ratio of v0, v+, and v− frequencies of PMCW-NSL.
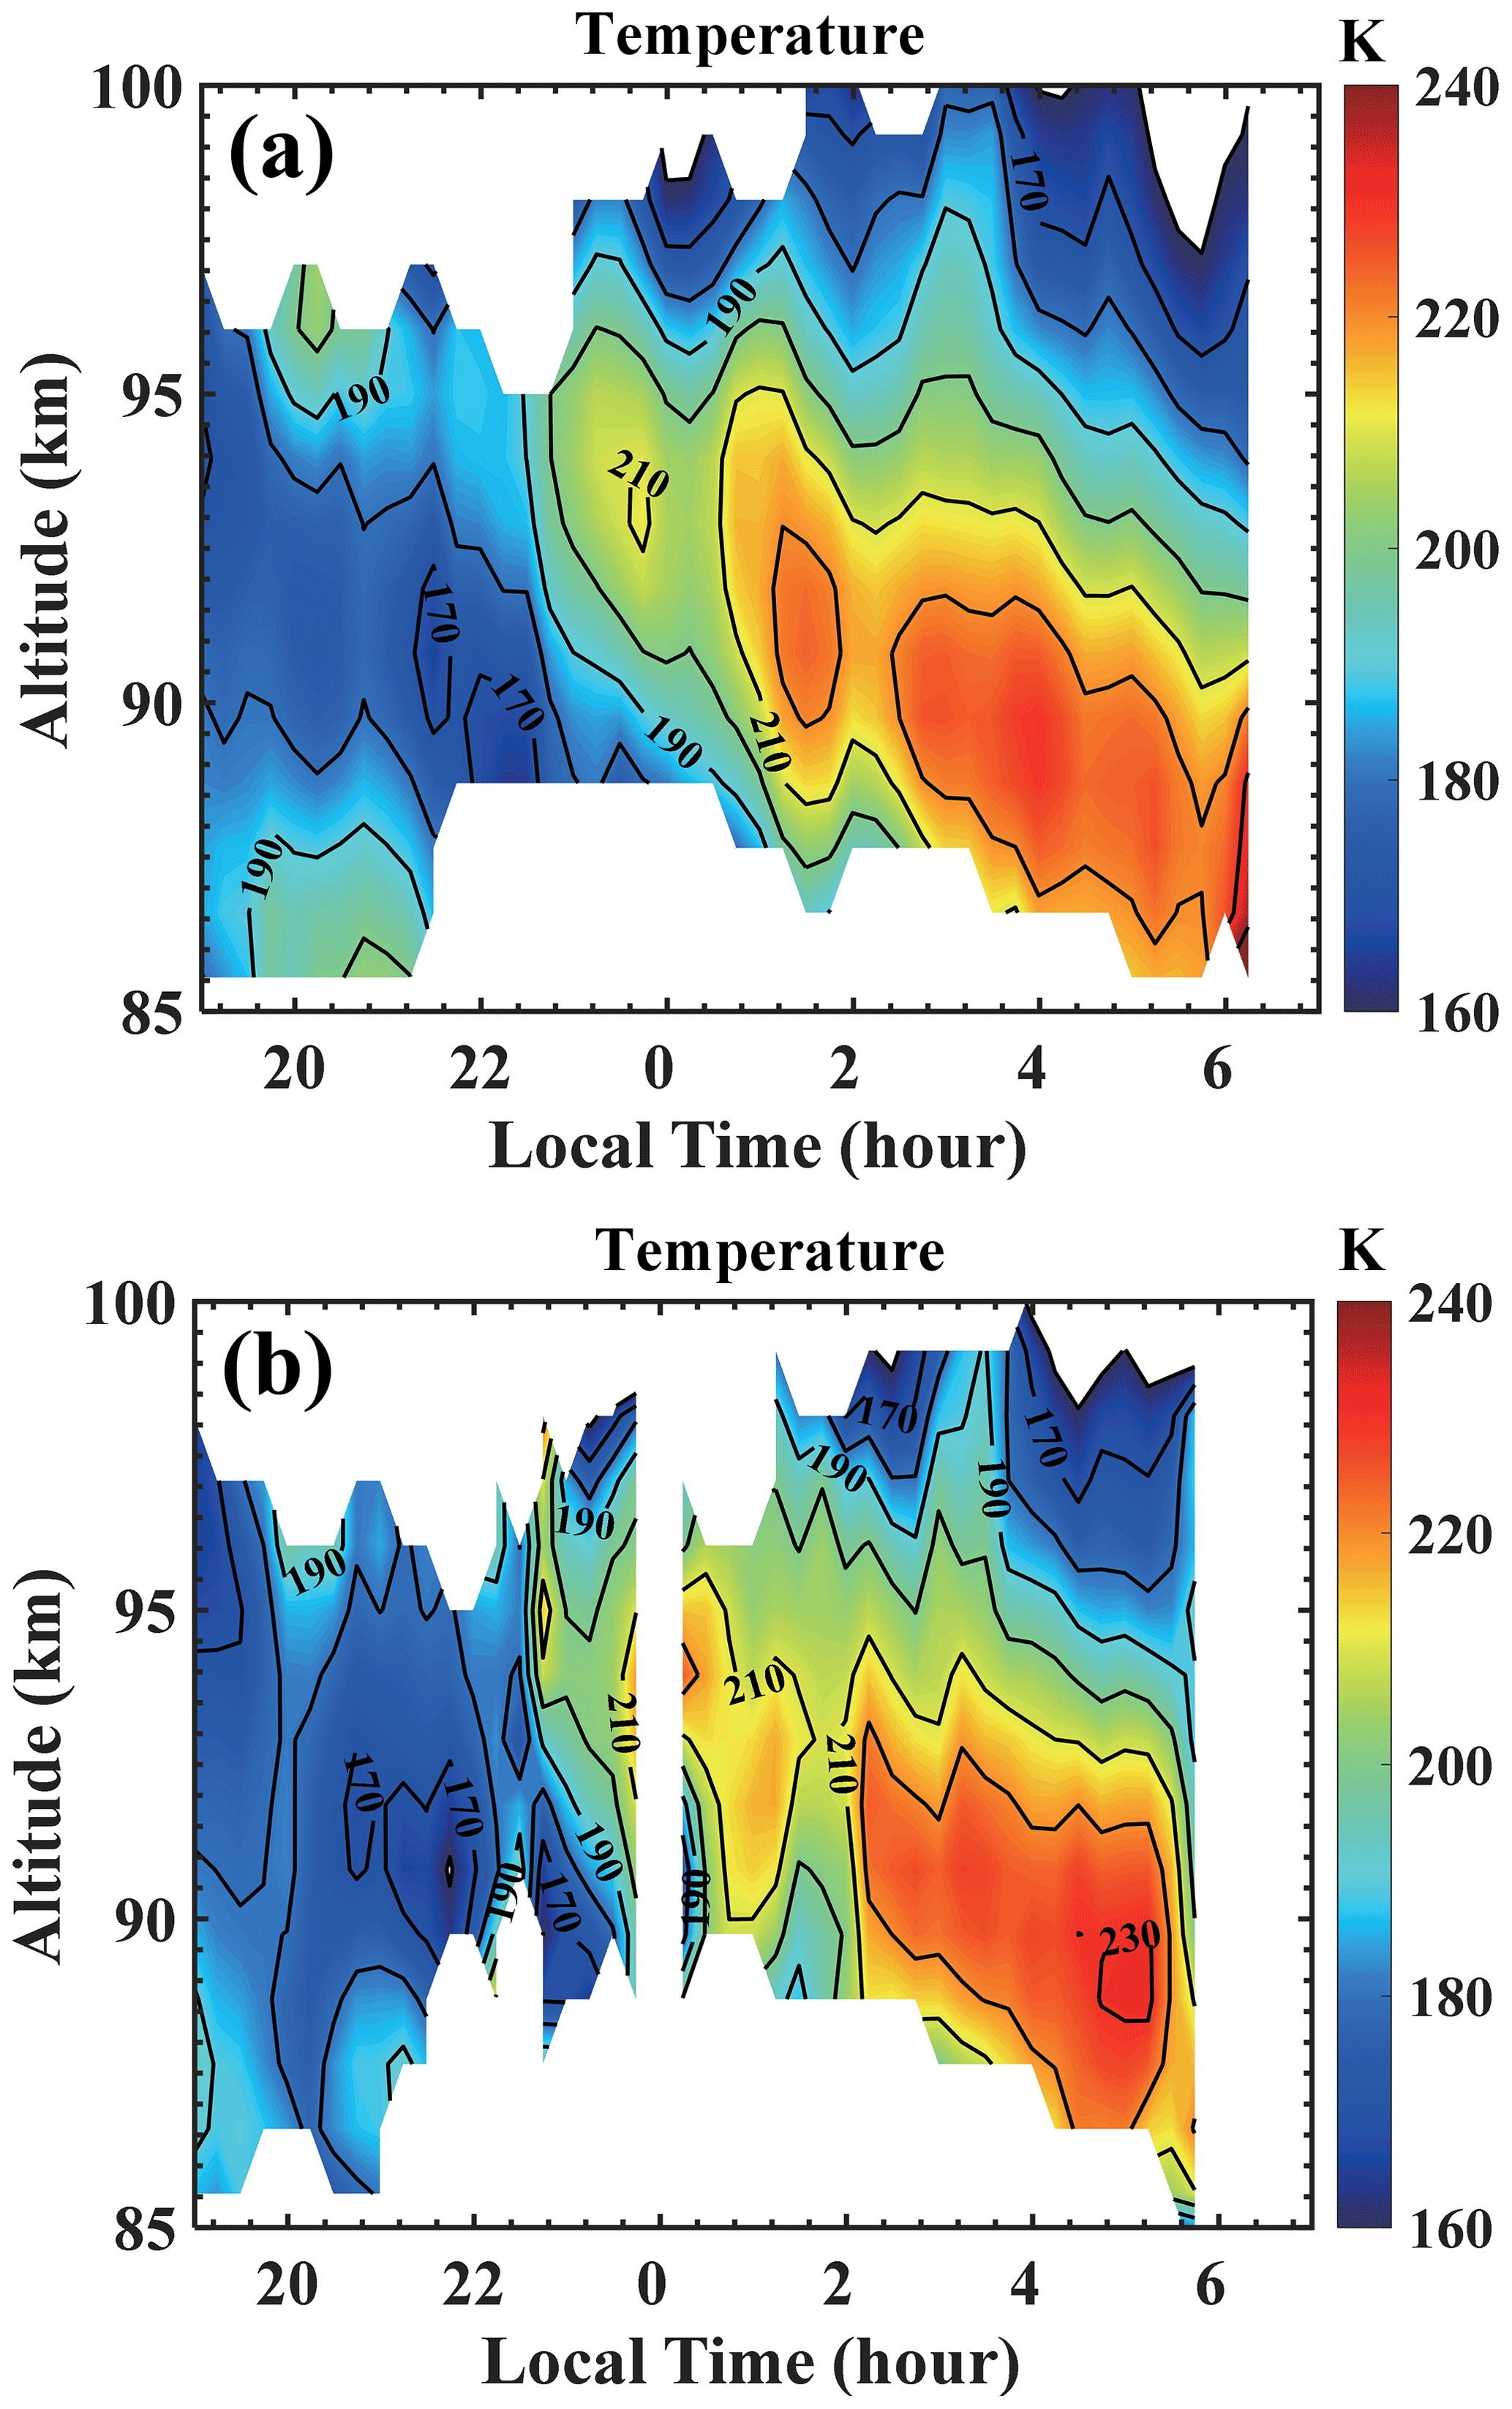
Figure 5Temperature contour observed by PMCW-NSL on 24 November 2021 in (a) vertical and (b) eastward directions.
Since the SNR of PMCW-NSL is lower than that of pulse lidar at the same power, photon counts are accumulated for at least 15 min to improve the SNR. Figure 5 shows the nighttime temperature contour results with a time resolution of 15 min. The temperature varied from 160 to 240 K during the night, and an apparent wave structure with a downward phase can be seen, suggesting possible modulation by tides. The white part in the contour indicates that the temperature uncertainty is greater than 25 K or that the signal SNR is insufficient and the temperature results within are invalid. The temperature uncertainty is about 5 K near the peak of the sodium layer (90–95 km), while it is larger than 25 K at the edge of the sodium layer.
Because our pulsed narrowband sodium temperature and wind lidar cannot simultaneously run with PMCW-NSL, we compare the PMCW-NSL temperature results at 12:30 UT (20:30 LT) with the Sounding of the Atmosphere using Broadband Emission Radiometry (SABER) observation (https://data.gats-inc.com/last access: 10 December 2021) on 30 November 2021, as shown in Fig. 6. The temporal and vertical resolutions of PMCW-NSL results are 30 min and 1 km, respectively, while those for the SABER results are 2 min and 2 km. The temperature observed by the PMCW-NSL is in generally good agreement with that of the SABER. But there are slight differences in absolute values, significantly below 90 km and above 97 km. One possible reason for these differences could be the difference in measurement locations and resolutions.
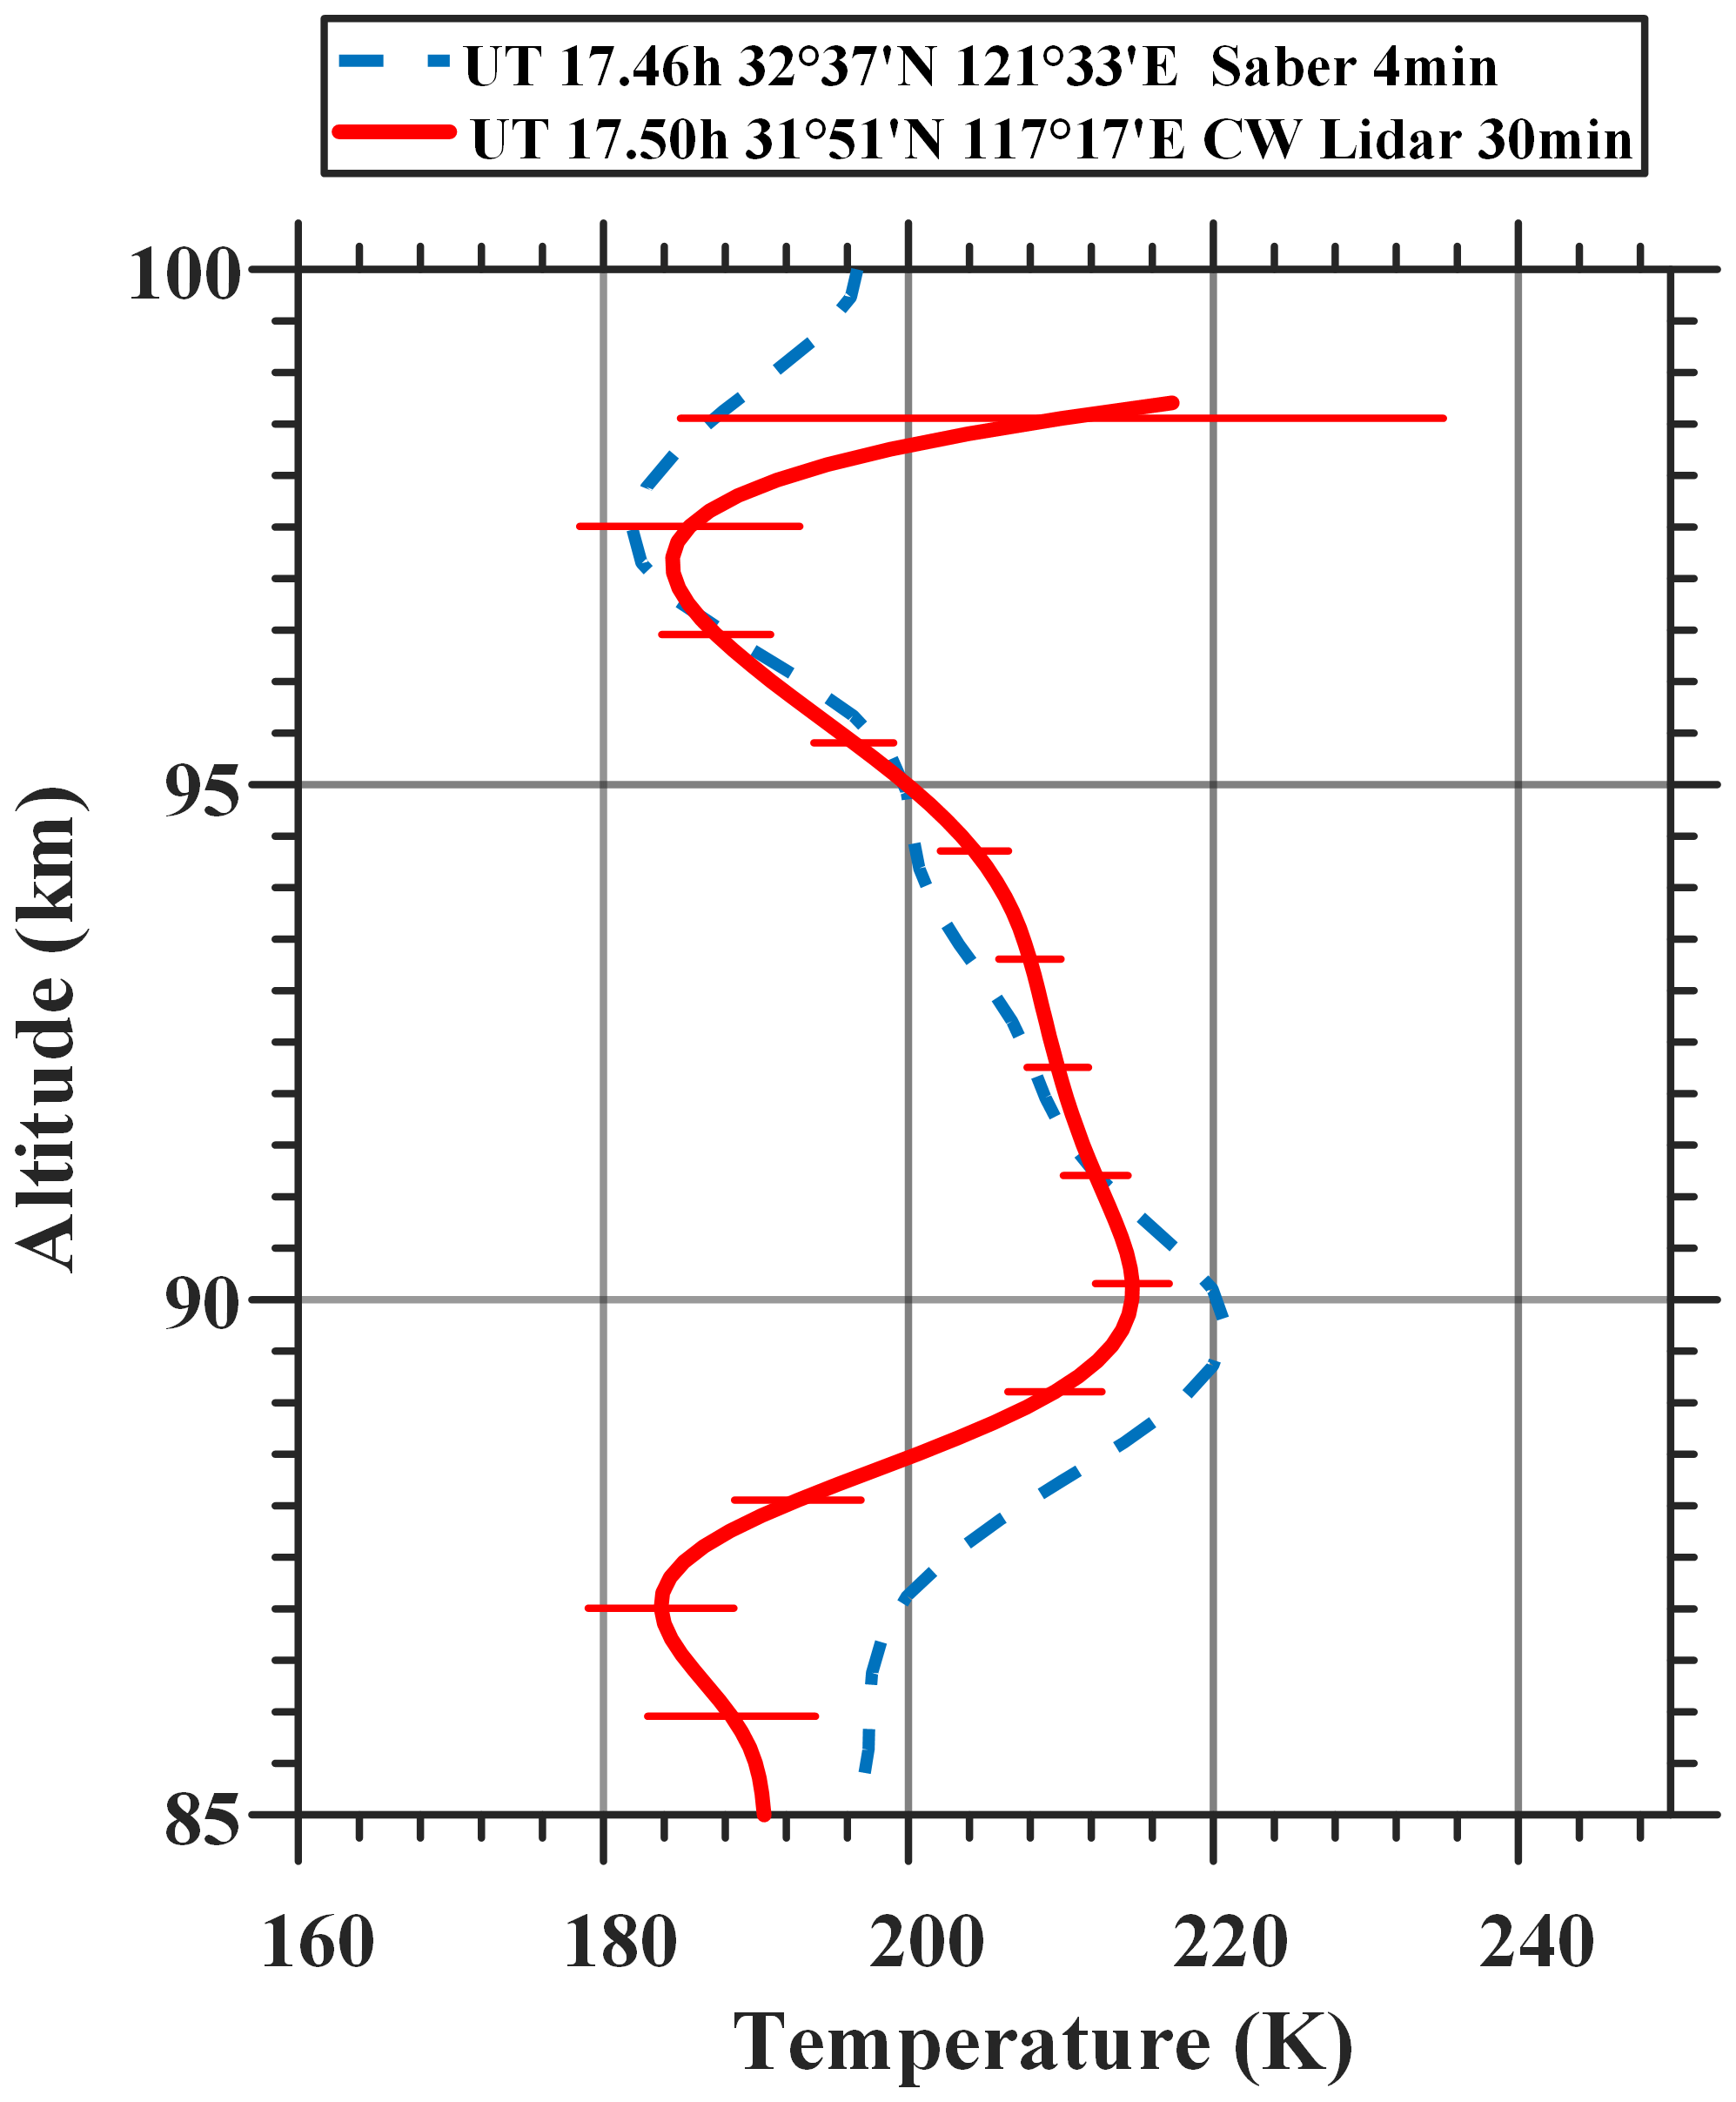
Figure 6Comparison of temperature profiles between PMCW-NSL (solid red line) and SABER (dashed blue line).
The vertical and zonal winds observed by PMCW-NSL on 24 November 2021 are shown in Fig. 7. The vertical resolution of the data is 1 km, and the temporal resolution is 1 h. The white region in the contour indicates that the wind error at this point is greater than 20 m s−1, which is considered an unreliable result. Figure 7b shows that the zonal winds at 87–97 km are about −20 to 100 m s−1, and the error is large at the edge of the sodium layer due to a low SNR. From the zonal wind, the contour shows an obvious downward phase progression, likely related to the solar tides. From the vertical wind profiles shown in Fig. 8, the vertical wind fluctuates within ±5 m s−1 overnight, and the nightly mean of the vertical wind velocity is close to 0. This is in good agreement with other vertical wind observations (White, 1999). The error bars of the nightly mean vertical wind velocity in Fig. 8 represent the measurement uncertainties due to statistical noise.
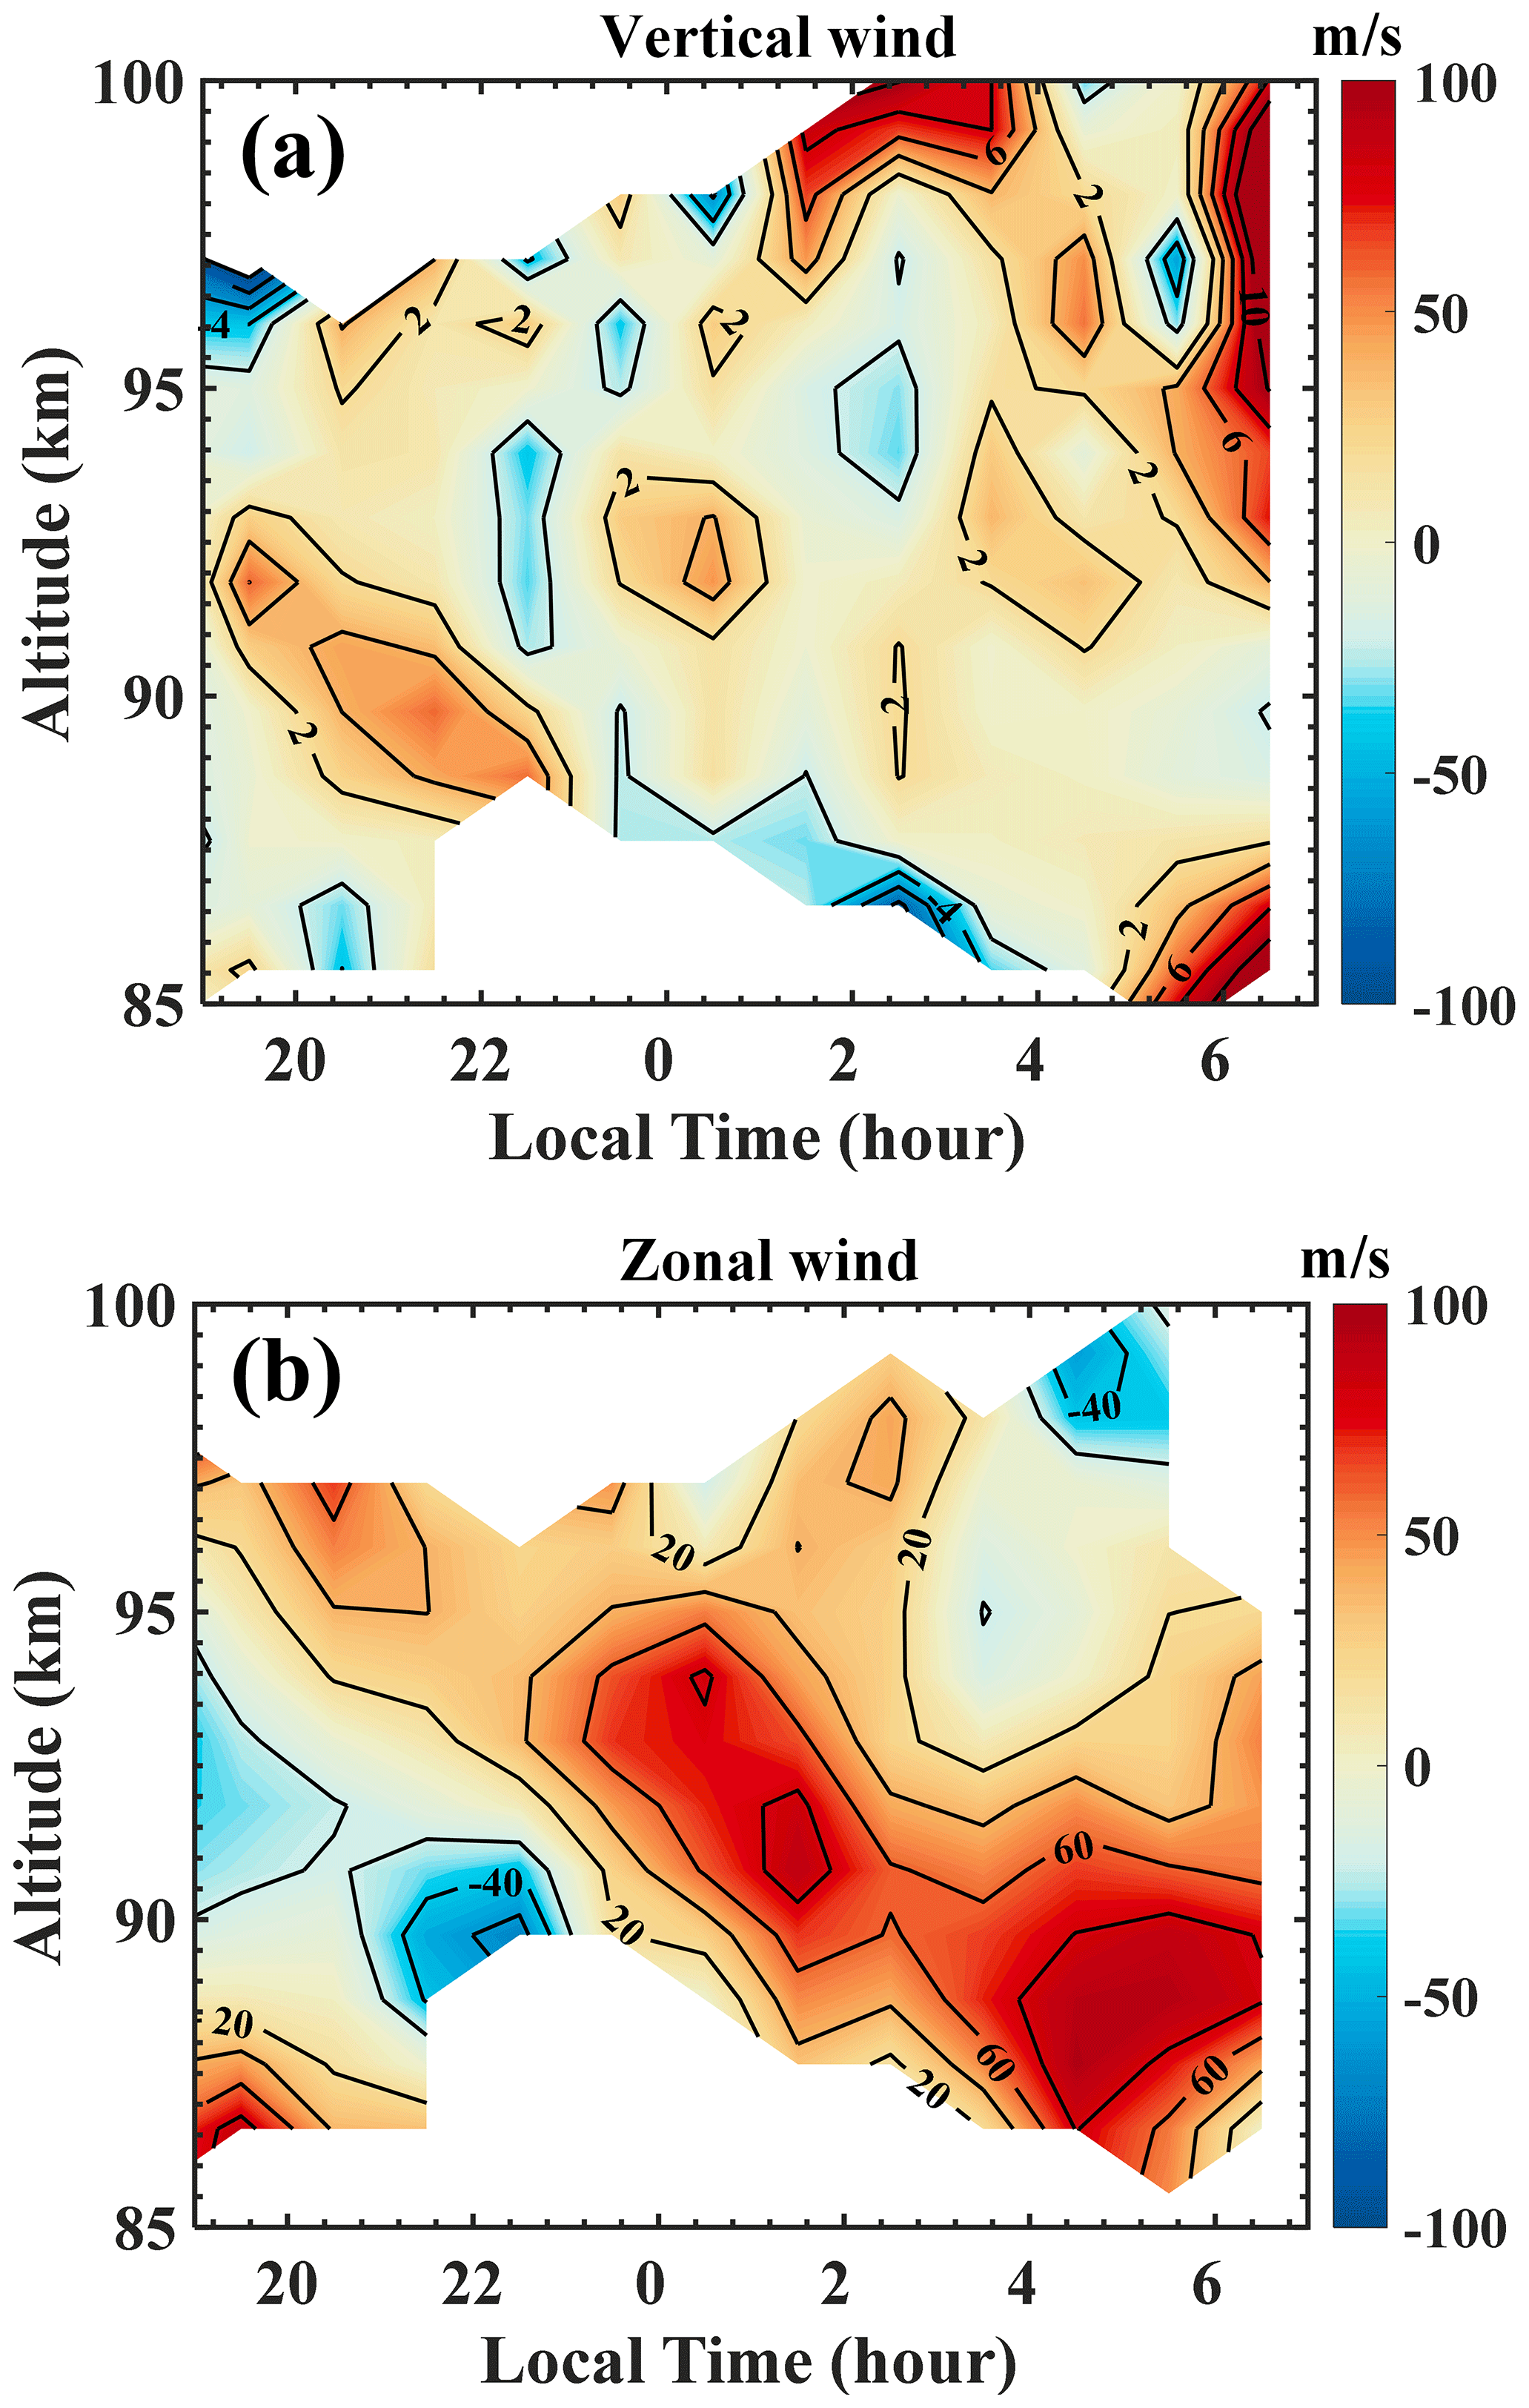
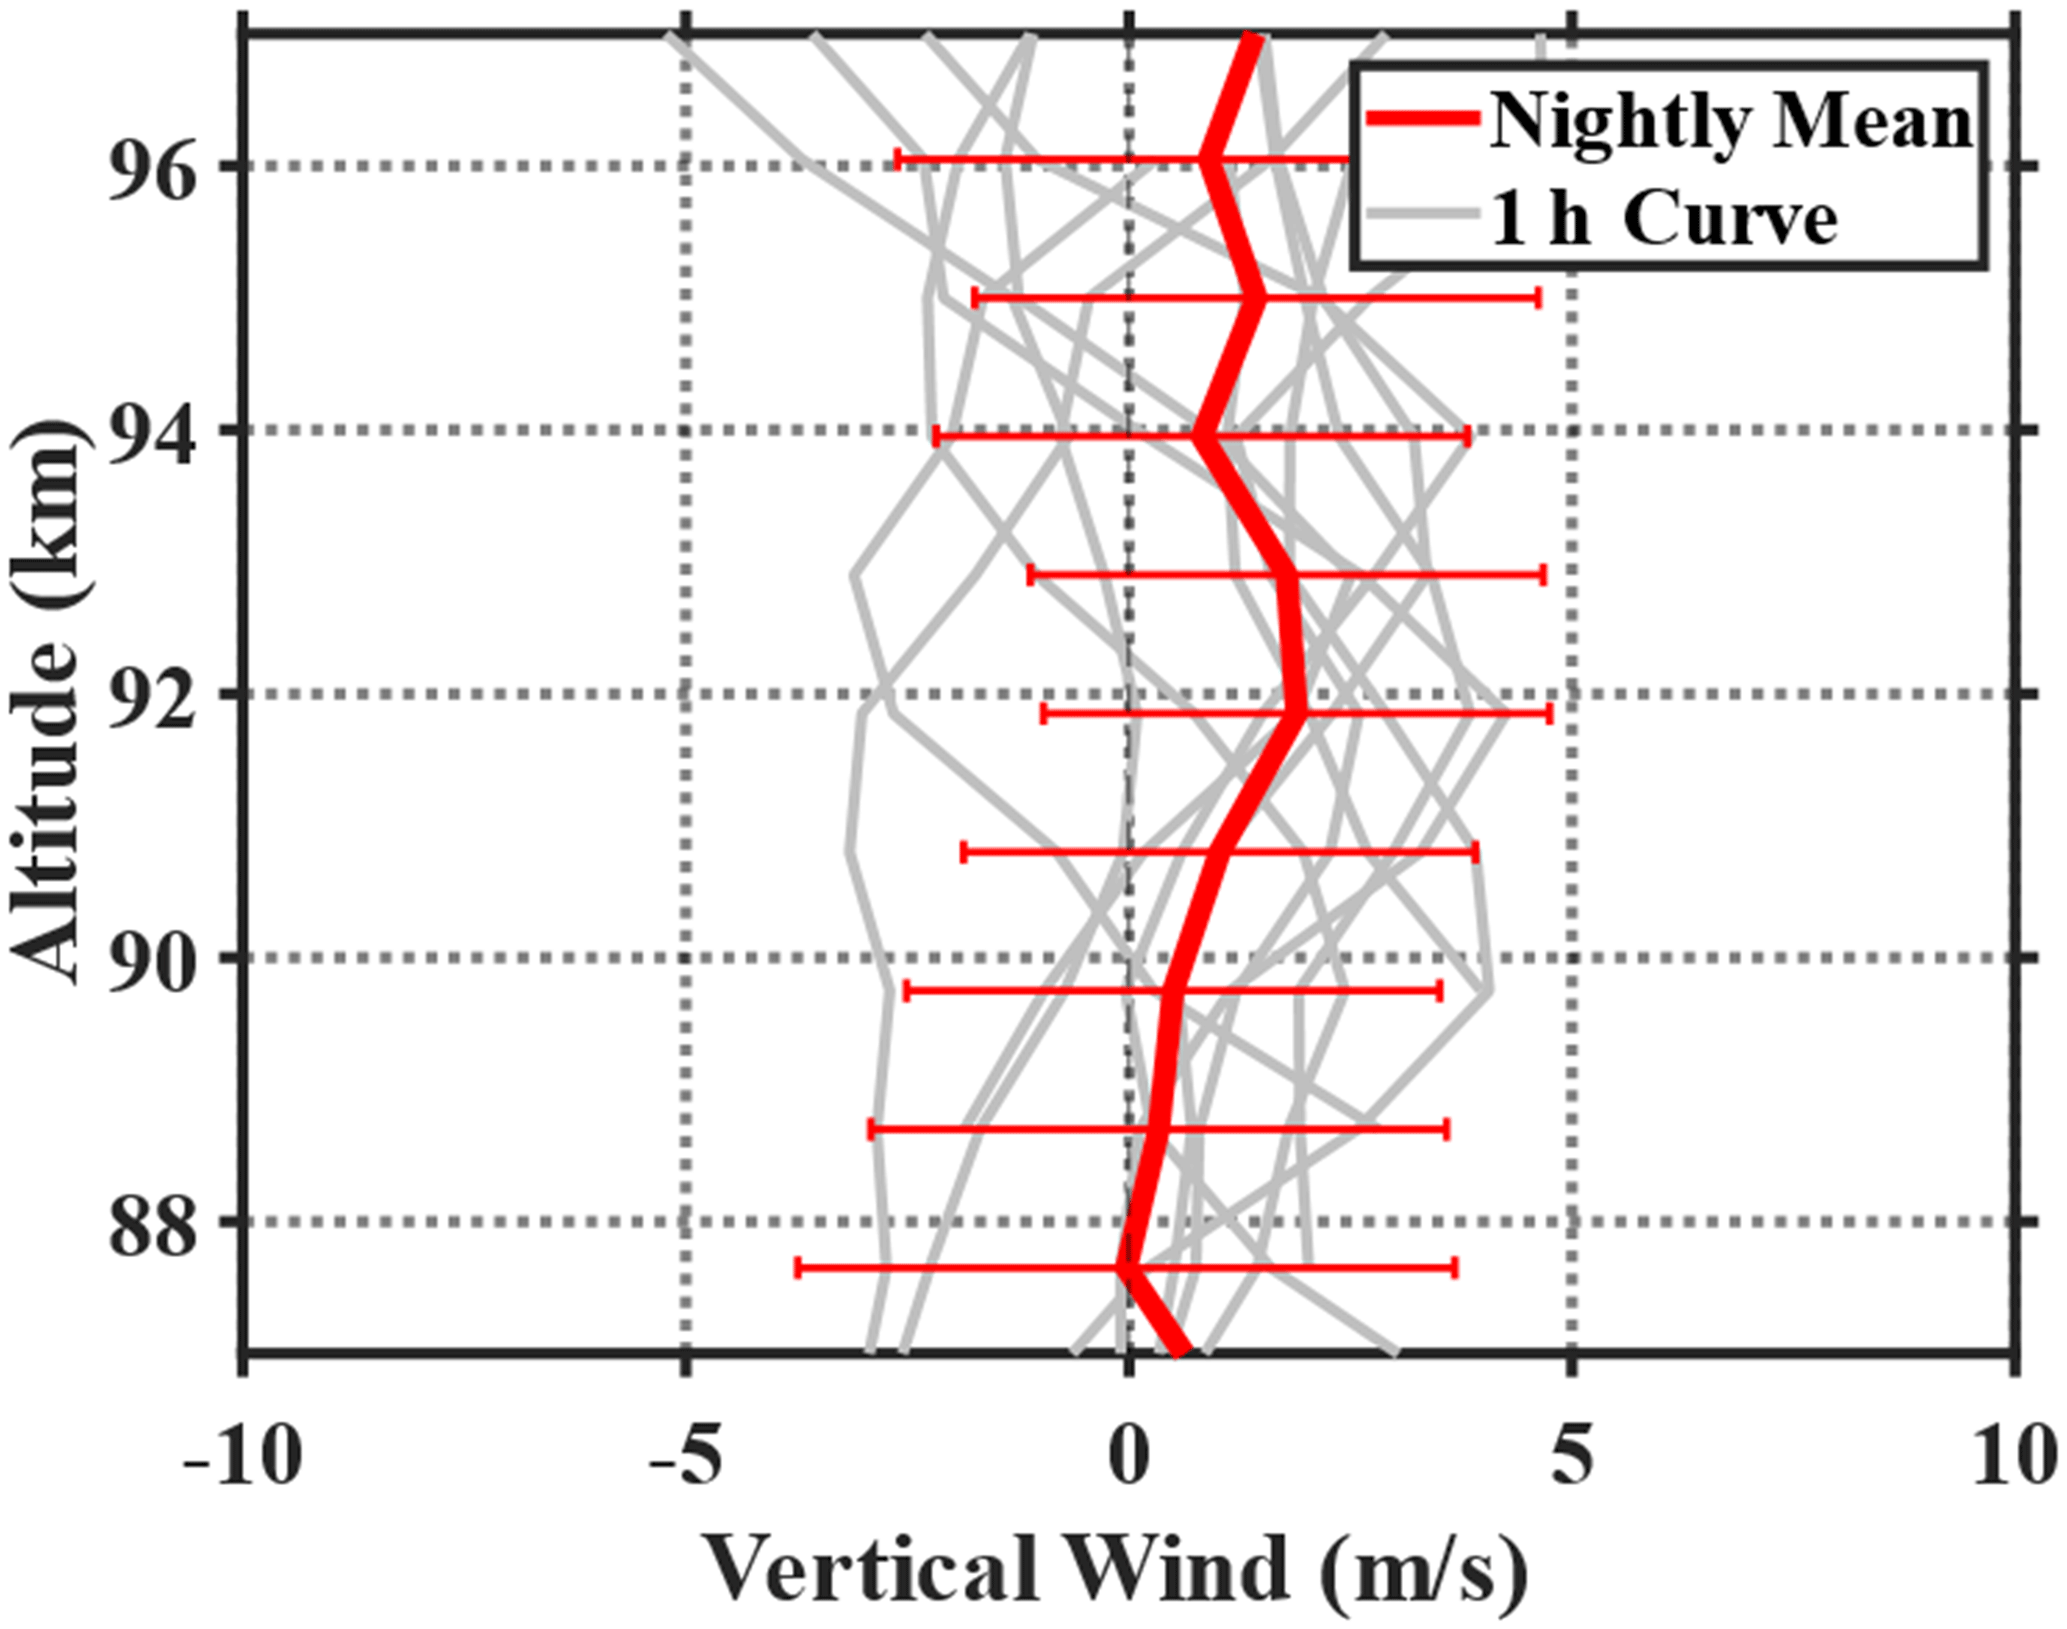
Figure 9 compares zonal winds on 1 December 2021, observed by PMCW-NSL, with those observed by a meteor radar located ∼200 km northwest of the lidar site (University of Science and Technology of China, 2020). The uncertainty of zonal wind observed by the PMCW-NSL is less than 10 m s−1 at the sodium peak and ∼25 m s−1 at the edge of the sodium layer. The uncertainty of zonal wind observed by the meteor radar for the 1 h average is less than 5 m s−1 at 86 km (Zeng et al., 2022). Both observations suggest similar variations in time and structure. The downward phase progression of the semidiurnal tide is clear in both plots. The zonal wind maximum of 100 m s−1 observed by PMCW-NSL appears earlier than that of 80 m s−1 by meteor radar. Figure 10 compares the nightly mean zonal wind profile of the PMCW-NSL (solid red line) and meteor radar (dashed blue line) on 1 December 2021. The zonal wind of the PMCW-NSL shows a good agreement with that of the meteor radar.
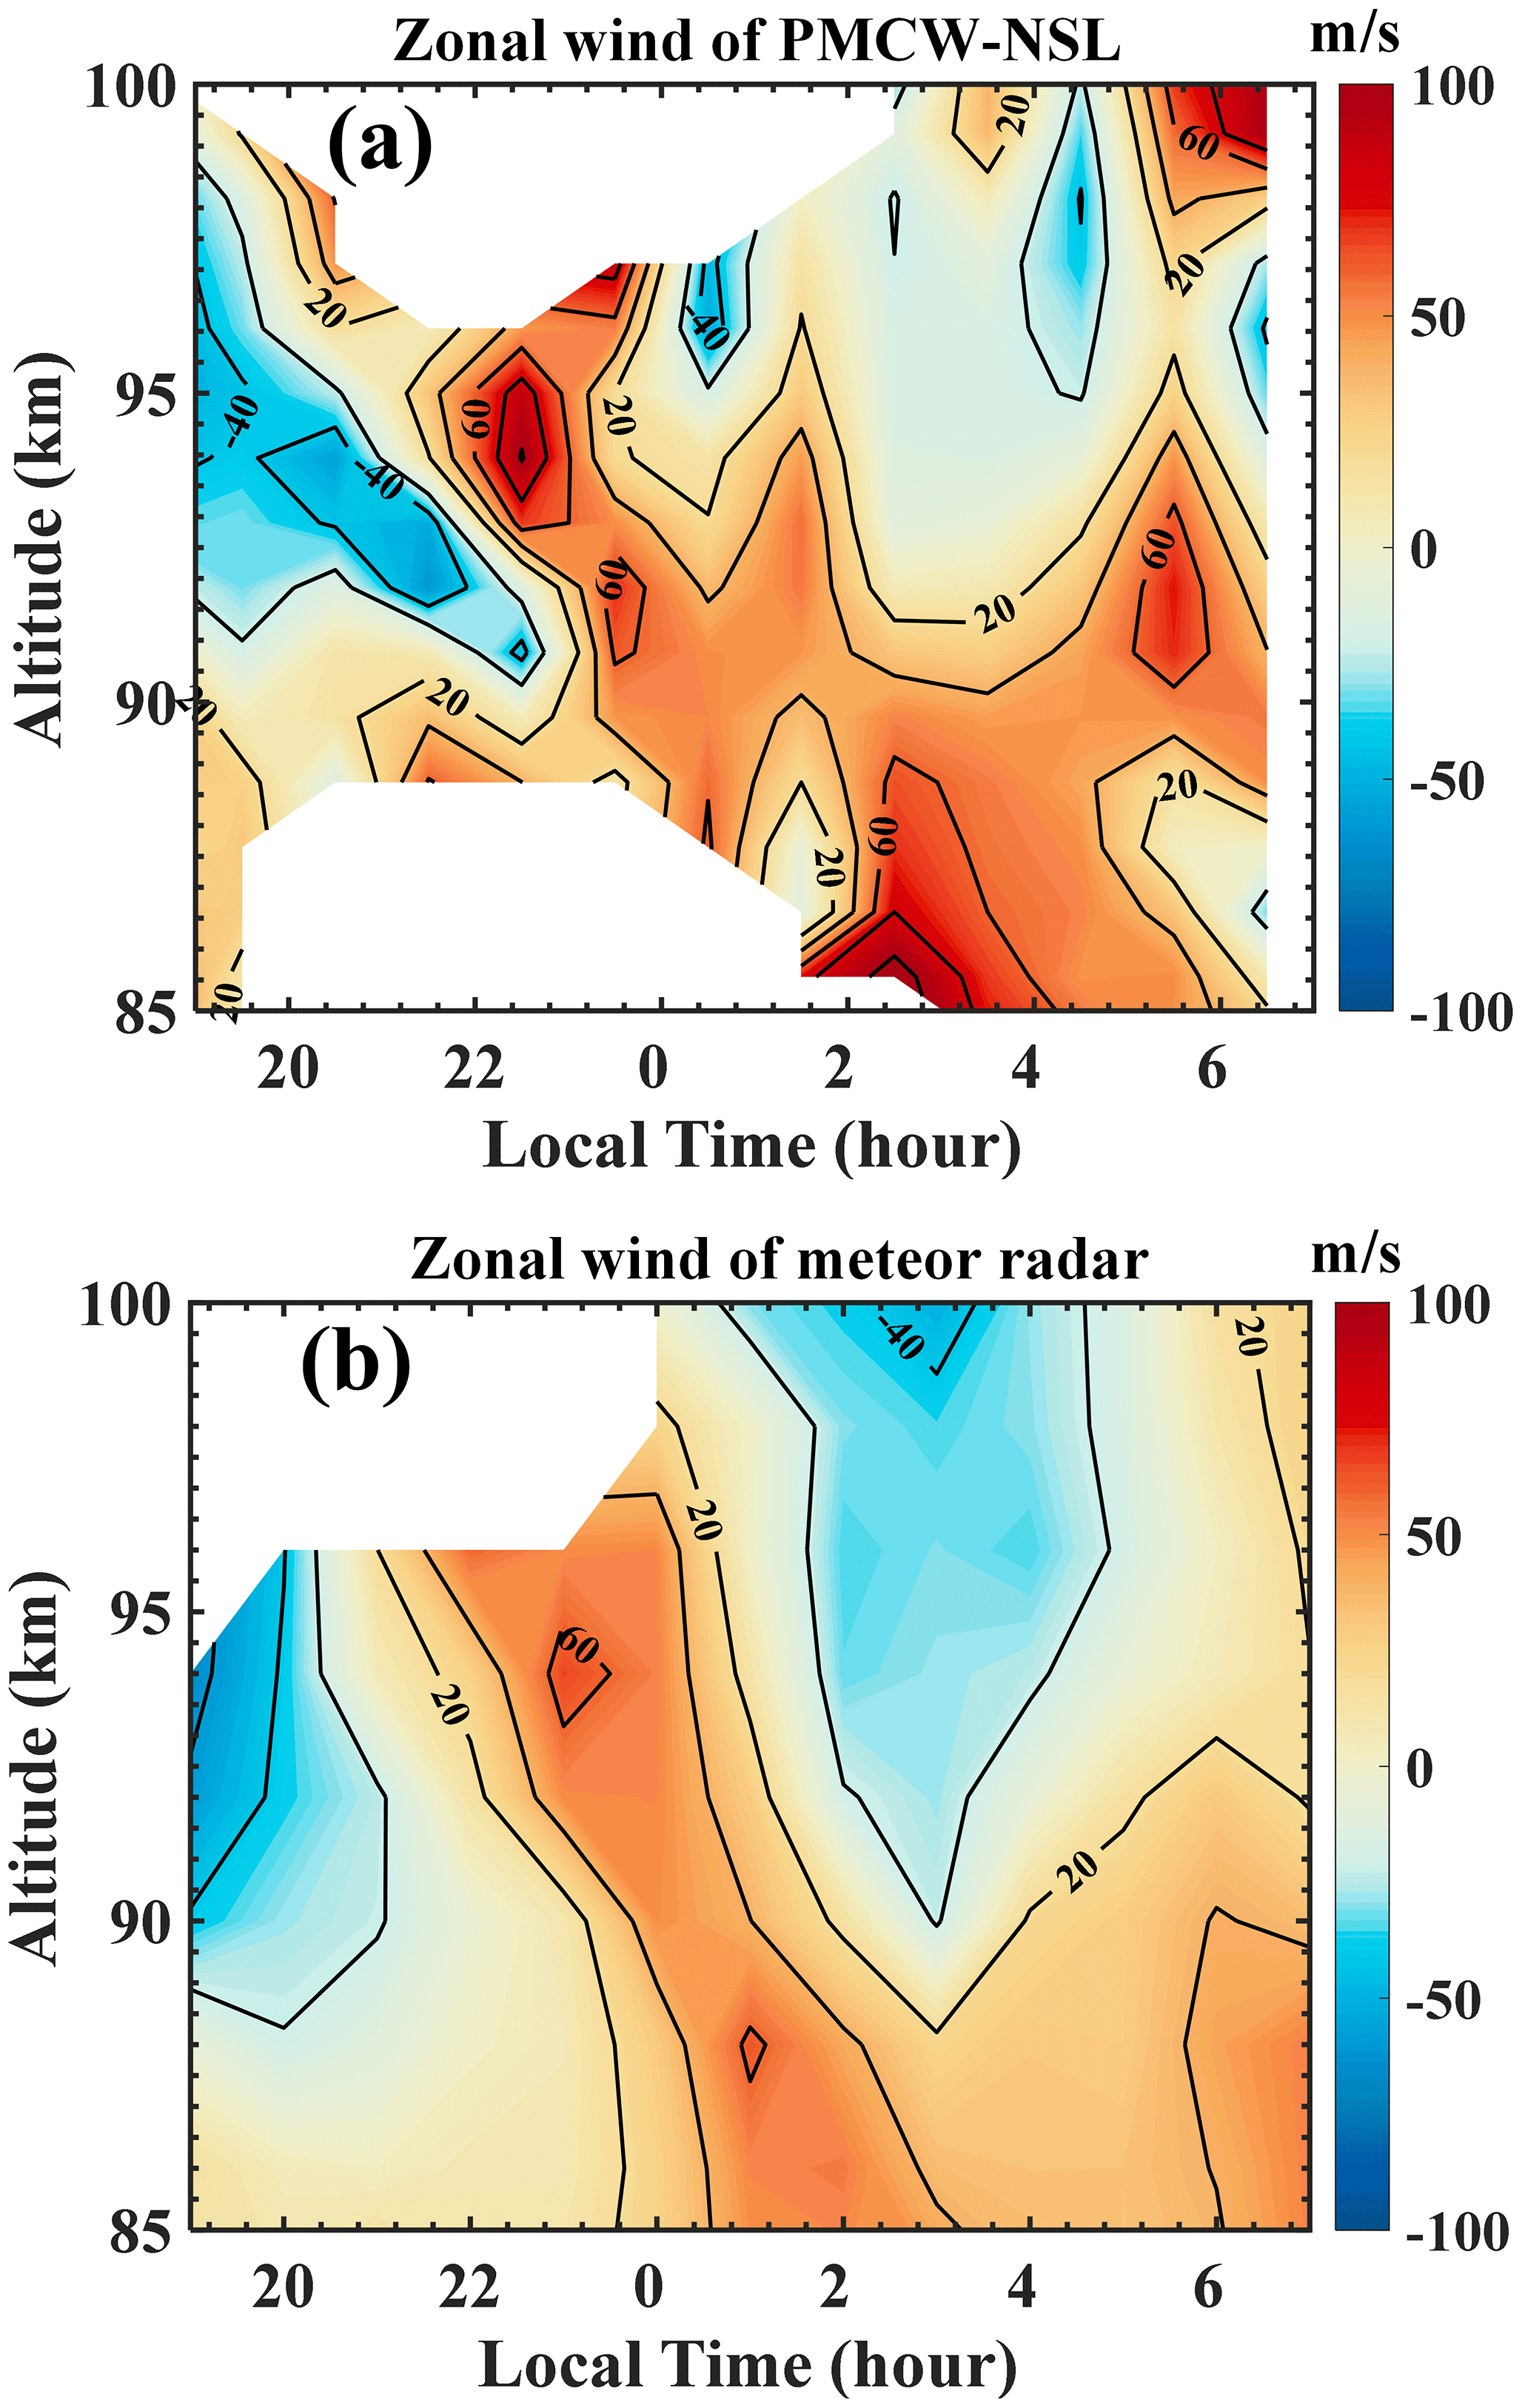
Figure 9Zonal wind contour of (a) PMCW-NSL with a vertical resolution of 1 km and temporal resolution of 1 h and (b) meteor radar with a vertical resolution of 2 km and a temporal resolution of 1 h on 1 December 2021.
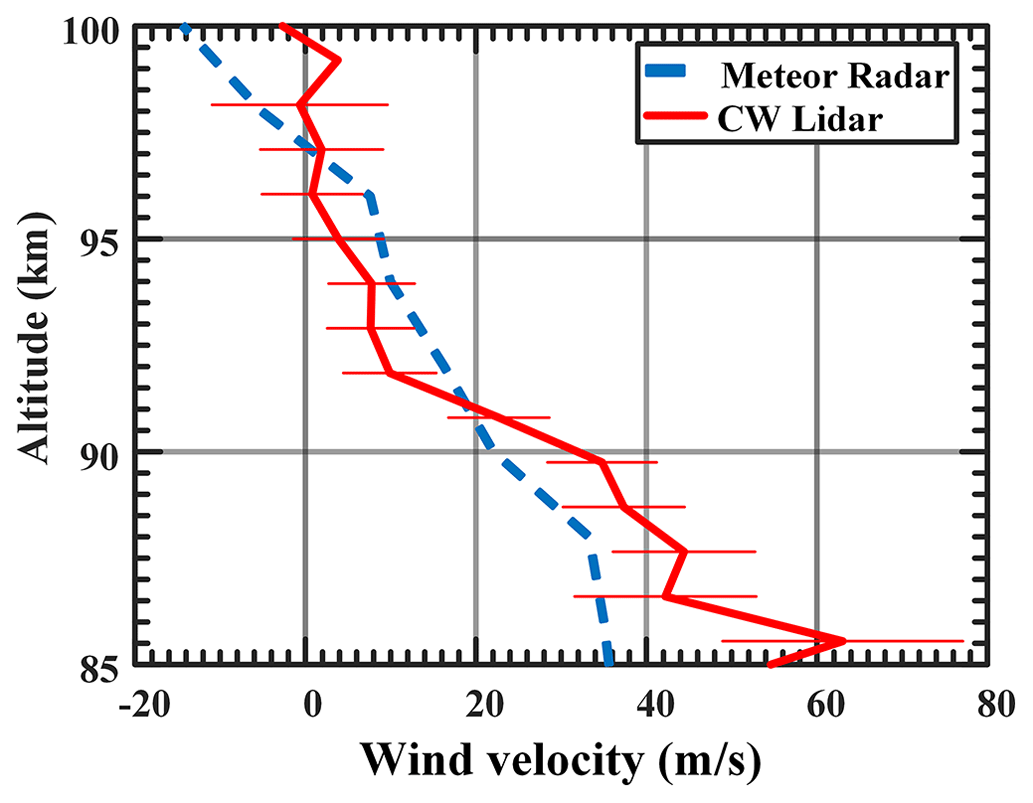
Figure 10Comparison of nightly mean zonal wind profile between PMCW-NSL (solid red line) and meteor radar (dashed blue line) on 1 December 2021.
We successfully developed the first PMCW-NSL system for simultaneous measurements of the mesopause region's temperature and wind. The lidar system adopted a 1178 nm diode seeder and a co-developed fiber Raman amplifier with a fiber-coupled AOFS inside to obtain a 589 nm light at three frequencies with almost the same power, which outputs on the same path. An EOM was introduced to modulate the 589 nm laser in M-code. Based on the innovative decoded technique and algorithm for CW lidar, both the main and the residual lights modulated by M-code are used and directed to the atmosphere in the vertical and eastward directions, tilted 20∘ from the zenith. Two Newtonian telescopes with a diameter of 762 mm and pointing in the corresponding directions are used to receive the return signals. The three-frequency laser is emitted out sequentially, triggered at 3 Hz in external mode. In one period of the external trig, the special M-code group consisted of 14 periods of 127 M-code and 2 periods of zero-set 127 M-code, and a short idle time is designed to acquire valid return signals and pure background noises.
Using the PMCW-NSL system, we successfully retrieved the mesopause region's temperature and wind with uncertainties of ∼5 K and ∼10 m s−1 at the peak of the sodium layer. The temperature comparison between PMCW-NSL observations and SABER observations shows good agreement with slight differences. The zonal wind results observed by PMCW-NSL also agree with those observed by a nearby meteor radar. These demonstrate that the PMCW-NSL can reliably measure the mesopause region's temperature and wind. In the future, we plan to improve its accuracy and resolution by implementing a 20 W 589 nm CW laser in the PMCW-NSL system.
The PMCW-NSL data at Hefei are available by contacting the corresponding author. We will upload the data to the National Space Science Data Center, National Science and Technology Infrastructure of China. The wind data of the meteor radar can be applied for from the National Space Science Data Center, National Science and Technology Infrastructure of China (https://doi.org/10.12176/01.05.021, University of Science and Technology of China, 2020). The SABER temperature data are available at https://data.gats-inc.com/saber/Version2_0/Level2A/2021/ (last access: 10 December 2021; SABER team, 2021).
XF wrote the paper and provided technical guidance for lidar development. FL developed the lidar system and retrieved the data. LlS retrieved the data. TL designed the experiment, contributed to the discussion and revision of the paper, and explained the results.
The contact author has declared that none of the authors has any competing interests.
Publisher's note: Copernicus Publications remains neutral with regard to jurisdictional claims in published maps and institutional affiliations.
We acknowledge Wen Yi for providing wind data of the meteor radar, which can be applied for from the National Space Science Data Center, National Science and Technology Infrastructure of China (http://www.nssdc.ac.cn/eng, last access: 10 December 2021). We thank the SABER team for making the SABER temperature dataset available at https://data.gats-inc.com/ (last access: 10 December 2021). The authors would like to thank Chiao-Yao She for the helpful discussion.
This research has been supported by the National Natural Science Foundation of China (grant nos. 42130203, 41974177, and 41974175), the B-type Strategic Priority Program of the Chinese Academy of Sciences (grant no. XDB41000000), and the pre-research project on civil aerospace technologies (no. D020105) funded by China's National Space Administration.
This paper was edited by Markus Rapp and reviewed by Bifford Williams and one anonymous referee.
Abo, M. and Nagasawa, C.: Random modulation CW dye lidar for measuring mesospheric sodium layer, in: The 17th International Laser Radar Conference, Sendai, Japan, p. 258, 25–29 July 1984.
Feng, Y., Huang, S., Shirakawa, A., and Ueda, K.: 589 nm light source based on Raman fiber laser, Jpn. J. Appl. Phys. 2, 43, L722–L724, https://doi.org/10.1143/JJAP.43.L722, 2004.
Fricke, K. H. and von Zahn, U.: Mesopause temperature derived from probing the hyperfine structure of the D2 resonance line of sodium by lidar, J. Atmos. Terr. Phys., 47, 499–512, https://doi.org/10.1016/0021-9169(85)90116-3, 1985.
Gibson, A., Thomas, L., and Bhattachacharyya, S.: Laser observation of ground-state hyperfine structure of sodium and of temperatures in the upper atmosphere, Nature, 281, 131–132, https://doi.org/10.1038/281131a0, 1979.
Hu, X., Yan, Z. A., Guo, S. Y., and Cheng, Y.: Sodium fluorescence Doppler lidar to measure atmospheric temperature in the mesopause region, Chinese Sci. Bull., 56, 417–423, https://doi.org/10.1007/s11434-010-4306-x, 2011.
Kawahara, T. D., Kitahara, T., Kobayashi, F., Saito, Y., Nomura, A., She, C.-Y., Krueger, D. A., and Tsutsumi, M.: Wintertime mesopause temperatures observed by lidar measurements over Syowa station (69∘ S, 39∘ E), Antarctica, Geophys. Res. Lett., 29, 1709, https://doi.org/10.1029/2002GL015244, 2002.
Kawahara, T. D., Nozawa, S., Saito, N., Kawabata, T., Tsuda, T. T., and Wada, S.: Sodium temperature/wind lidar based on laser-diode-pumped Nd:YAG lasers deployed at Tromso, Norway (69.6∘ N, 19.2∘ E), Opt. Express, 25, A491–A501, https://doi.org/10.1364/OE.25.00A491, 2017.
Li, F., Li, T., Fang, X., Tian, B., and Dou, X.: Pseudo-random modulation continuous-wave lidar for the measurements of mesopause region sodium density, Opt. Express, 29, 1932–1944, https://doi.org/10.1364/OE.410852, 2021.
Li, T., Fang, X., Liu, W., Gu, S. Y., and Dou, X.: Narrowband sodium lidar for the measurements of mesopause region temperature and wind, Appl. Optics, 51, 5401–5411, https://doi.org/10.1364/AO.51.005401, 2012.
Murray, J. T., Roberts, W. T., Austin, W. L., Powell, R. C., and Bonaccini, D.: Fiber Raman Laser for sodium guide star, Adaptive Optical System Technologies, Parts 1 and 2, Proc. SPIE 3353, Adaptive Optical System Technologies, 330–339, https://doi.org/10.1117/12.321725, 1998.
Ridenour, L., Glasoe, G. N., Lebacqz, J. V., Collins, G. B., Greenwood, I. A., Holdam, J. V., Macrae, D., and Pierce, J. R.: MIT Radiation Laboratory Series, Phys. Today, 1, p. 15, https://doi.org/10.1063/1.3066103, 1948.
SABER team: SABER temperature data, GATS Data Server [data set], https://data.gats-inc.com/saber/Version2_0/Level2A/2021/, last access: 10 December 2021.
She, C. Y., Yu, J. R., Latifi, H., and Bills, R. E.: High-Spectral-Resolution Fluorescence Lidar for Mesospheric Sodium Temperature Measurements, Appl. Optics, 31, 2095–2106, https://doi.org/10.1364/AO.31.002095, 1992.
She, C. Y., Sherman, J., Yuan, T., Williams, B. P., Arnold, K., Kawahara, T. D., Li, T., Xu, L., J. Vance, D., and Krueger, D. A.: The first 80 h continuous lidar campaign for simultaneous observation of mesopause region temperature and wind, Geophys. Res. Lett., 30, 1319, https://doi.org/10.1029/2002GL016412, 2003.
She, C. Y., Abo, M., Yue, J., Williams, B. P., Nagasawa, C., and Nakamura, T.: Mesopause-region temperature and wind measurements with pseudorandom modulation continuous-wave (PMCW) lidar at 589 nm, Appl. Optics, 51, 1981, https://doi.org/10.1364/AO.50.002916, 2012.
Takeuchi, N., Baba, H., Sakurai, K., and Ueno, T.: Diode-laser random-modulation CW lidar, Appl. Optics, 25, 63–67, https://doi.org/10.1364/AO.25.000063, 1986.
Taylor, L. R., Feng, Y., and Calia, D. B.: 50 W CW visible laser source at 589 nm obtained via frequency doubling of three coherently combined narrow-band Raman fibre amplifiers, Opt. Express, 18, 8540–8555, https://doi.org/10.1364/OE.18.008540, 2010.
University of Science and Technology of China: Atmospheric wind in the MLT region of Mengcheng Meteor Radar, Version 1.0, National Space Science Data Center [data set], https://doi.org/10.12176/01.05.021, 2020.
West, C. D. and Jones, R. C.: On the Properties of Polarization Elements as Used in Optical Instruments. 1. Fundamental Considerations, J. Opt. Soc. Am., 41, 976–982, https://doi.org/10.1364/JOSA.41.000976, 1951.
White, M. A.: A frequency-agile sodium lidar for the measurement of temperature and velocity in the mesopause region, PhD thesis, Colorado State University, USA, 129 pp., 1999.
Xia, Y., Du, L. F., Cheng, X. W., Li, F. Q., Wang, J. H., Wang, Z. L., Yang, Y., Lin, X., Xun, Y., Gong, S., and Yang, G.: Development of a Solid-State Sodium Doppler Lidar Using an All-Fiber-Coupled Injection Seeding Unit for Simultaneous Temperature and Wind Measurements in the Mesopause Region, Opt. Express, 25, 5264–5278, https://doi.org/10.1364/OE.25.005264, 2017.
Yang, Y. L., Yang, Y., Xia, Y., Lin, X., Zhang, L., Jiang, H. W., Cheng, X. W., Liu, L., Ji, K., and Li, F. Q.: Solid-State 589 nm Seed Laser Based on Raman Fiber Amplifier for Sodium Wind/Temperature Lidar in Tibet, China, Opt. Express, 26, 16226–16235, https://doi.org/10.1364/OE.26.016226, 2018.
Zeng, J., Yi, W., Xue, X., Reid, I., Hao, X., Li, N., Chen, J., Chen, T. D., and Dou, X. K.: Comparison between the Mesospheric Winds Observed by Two Collocated Meteor Radars at Low Latitudes, Remote Sens.-Basel, 14, 2354, https://doi.org/10.3390/rs14102354, 2022.