the Creative Commons Attribution 4.0 License.
the Creative Commons Attribution 4.0 License.
 | 05 May 2023
Performance evaluation of portable dual-spot micro-aethalometers for source identification of black carbon aerosols: application to wildfire smoke and traffic emissions in the Pacific Northwest
Mrinmoy Chakraborty
Amanda Giang
Black carbon (BC) is a component of particulate matter, emitted from the incomplete combustion of carbonaceous fuels. The presence of BC in the atmosphere can disrupt the atmospheric radiation budget, and exposure to BC can adversely affect human health. Multi-wavelength light-absorption-based dual-spot aethalometers can be used to quantify the source and characteristics of BC from traffic or biomass-burning-based sources. However, aethalometer measurements are affected by artifacts such as aerosol loading and light scattering; hence, they often need correction to reduce measurement uncertainty. This work assesses the performance of the recently developed portable aethalometer (MA300, AethLabs). Due to their portability and ease of usage, MA300s can be suitable for mobile and personal exposure monitoring. Here, we evaluate BC concentration and source apportionment accuracy of three MA300 units relative to a widely used aethalometer, the AE33 (Magee Scientific). Synchronous field measurements were performed at a major traffic intersection during regular and wildfire-smoke-affected days in Vancouver, Canada. We find that MA300-reported BC mass concentrations were strongly correlated (Slope range between 0.73 and 1.01, with R2 = 0.9) compared to the reference instrument, yet there is visible instrumental variability in the normalized concentrations (5 %) across three units. The mean absolute error of MA300-reported BC concentrations ranged between 0.44–0.98 µg m−3, with the highest deviations observed in wildfire-smoke-affected polluted days. From the aerosol light absorption measurement perspective, MA300s tend to underestimate the absorption coefficients (babs) across the five wavelengths. UV channel light absorption results were subjected to the highest amount of noise and were found to be consistently underestimating in all the MA300 units, leading to systematic bias in source apportionment analysis. Absorption Ångström exponent values from the MA300 units were able to capture the variability of aerosol sources within a day, with a mean value of 1.15 during clean days and 1.46 during wildfire-smoke-affected days. We investigated the application of the latest non-linear aethalometer correction protocols in the MA300 and found that flow fluctuations enhanced noise across all channels, compared to onboard instrument correction. We also identify that the UV (λ = 370 nm) channel absorption measurements are most sensitive to instrumental artifacts during the wildfire-smoke-affected period. Hence, as an alternative to traditional UV and IR (λ = 880 nm)-based BC source apportionment methods, in this work, we tested the blue (λ = 470 nm) and IR wavelengths for BC source apportionment calculation. When the blue–IR-based source apportionment technique is adopted instead of the UV–IR, there is a 10 % (on average) decrease in the percentage difference of the apportioned components from the reference monitor.
- Article
(2547 KB) - Full-text XML
-
Supplement
(2760 KB) - BibTeX
- EndNote


Black carbon (BC) is the major light-absorbing component of atmospheric aerosol, produced from the incomplete combustion or pyrolysis of carbonaceous matter (Bond and Bergstrom, 2006). During the past decade, there has been significant interest in BC as a key research target for climate change and health impact assessment studies (Petzold et al., 2013), as BC has been identified as a short-lived climate forcer (Szopa et al., 2021), and its mitigation strategies can contribute to achieving near-term climate goals. Additionally, the World Health Organization recognized BC as one of the primary causes of cardiopulmonary morbidity and mortality as it may act as a universal carrier of chemicals of varying toxicity to the lungs (WHO, 2012). Yet, accurate real-time monitoring of BC concentration and quantitative source attribution in different macro- and micro-environments remains a challenge due to the presence of measurement artifacts, logistical issues (for example, remote sampling locations with limited access to electricity), and lack of clear scientific assessments of instrument performance (Alas et al., 2020; Segura et al., 2014).
Measurement of BC is a complicated process because there is no clear chemical definition of the species (Tasoglou et al., 2018). BC particles, composed primarily of graphene-like sp2-bonded carbon and refractory in nature, strongly absorb short- and long-wave light radiation (Lack et al., 2014). Several measurement techniques have been developed based on these observed properties of BC, and the definition of BC can change based on the technique adopted. There are three main processes used to quantify mass concentration of BC: (1) as elemental carbon (EC) mass concentration derived from thermal–optical analysis of aerosol deposited on filters (Bauer et al., 2009) (e.g. Sunset thermal–optical OC-EC (organic carbon–elemental carbon) analyzer); (2) as equivalent black carbon (eBC) measurements derived from light absorption of aerosol collected on a filter (Hansen et al., 1984) material (e.g. aethalometer, multi-angle absorption photometer) or from photo-acoustic measurements (e.g. the photo acoustic soot spectrometer); and (3) the laser-induced incandescence (LII) technique, used to measure refractory BC (rBC) concentration after the development of the single-particle soot photometer (SP2) instrument (Schwarz et al., 2006). From the pool of commercially available instruments, aethalometers have been extensively used by the scientific community and regulatory bodies to monitor real-time BC (or eBC) concentration; however, few studies have compared and reported the benefits and measurement uncertainties of the different BC measuring instruments used in the literature (Petzold et al., 2013; Tasoglou et al., 2018).
In aethalometers, aerosol particles are collected on filter tape by drawing sample air from the environment; synchronous light transmission measurements are then performed by photometers (Hansen et al., 1984). Light transmission measurements are converted to attenuation (ATN) units, and the rate of change of ATN is converted to BC mass concentration. The aethalometer-reported BC mass concentrations are derived from the light absorption measurements at an infrared (IR) wavelength (880 nm), as light absorption at 880 nm has been identified as predominantly due to BC (Hansen et al., 1984). Combustion-generated light-absorbing aerosol components interact differently with light at different wavelengths based on the source/type of fuel or combustion temperature. Combustion of wood leads to both BC and light-absorbing organic compounds (e.g. polycyclic aromatic hydrocarbons or humic-like substances), which tend to absorb light at lower wavelengths strongly (e.g. UV ∼ 365 nm) (Sandradewi et al., 2008a). Fossil-fuel-based aerosol sources (e.g. diesel vehicles) generate soot, which tends to absorb light uniformly across the spectrum (Bond and Bergstrom, 2006). Based on these developments, recent aethalometers are equipped with multi-wavelength (UV to IR) light absorption capabilities, which have been used for source characterization of BC (Sandradewi et al., 2008b; Helin et al., 2018; Healy et al., 2017). In addition, the mixing state of aerosol can influence the light absorption measurements of bulk aerosol (Bond and Bergstrom, 2006; Saleh et al., 2015; Healy et al., 2015). At lower wavelengths (near-UV), light absorption measurements were found to be enhanced (by a factor > 2) due to the presence of brown carbon (BrC) during wildfire-affected aerosols in Canada (Healy et al., 2015). The same study identified minimal light absorption enhancements due to the lensing effect at higher wavelengths (near-IR) regions. As such, light-apportionment-based BC measurements and their source apportionment can be further complicated by the bulk aerosol's source and mixing state. Aethalometer-reported raw BC measurements often require additional complex corrections applied to the light absorption data to account for measurement artifacts from the filter loading effect and the multiple scattering effect (Drinovec et al., 2015; Virkkula et al., 2007; Weingartner et al., 2003). As particle deposition on the filter spot increases, the newer particle deposits are subject to a shadowing effect (i.e. loading effect) on the light transmission, resulting in a non-linear change of ATN with BC concentration at the higher ATN range (Weingartner et al., 2003; Gundel et al., 1984). To account for the loading effect, a compensation scheme is usually embedded in the aethalometer software by assuming fixed compensation parameters (Virkkula et al., 2007, 2015) or by considering the dynamic changes in the aerosol loading (Drinovec et al., 2015). In addition to the loading effect, aerosol components may scatter light (depending upon aerosol composition, for example, the presence of salt components), and light scattered from the filter media can also impact the aethalometer light ATN measurements. This effect is typically corrected by incorporating a multiple-scattering correction factor (C) within the aethalometer correction mechanism. In the aethalometer's onboard correction algorithm, the manufacturer includes a standard value of C for all wavelengths depending on the type of filter installed, as C is found to be strongly dependent on the filter material used (e.g. Cquartz=2.14 and CTFE=1.57) (Segura et al., 2014; Drinovec et al., 2015). However, Bernardoni et al. (2021) and Segura et al. (2014) estimated comparatively higher values of C with wavelength dependency by comparing different field and laboratory-based instrumental measurements. Additionally, wavelength-dependent C values were shown to depend on the aerosol's single scattering albedo (SSA), which can directly impact the light absorption estimates (Yus-Díez et al., 2021). Bernardoni et al. (2021) also identified limitations of using fixed C values in the aethalometer source apportionment results. However, deriving optimized C values is challenging, requires additional monitoring, and may not always be transferable as aerosol properties and filter–matrix interactions with light scattering can change by instruments operated in different regions.
The Magee Scientific AE33 aethalometer measures aerosol light absorption at seven different wavelengths (370–950 nm) and uses the latest dual-spot technique to measure real-time BC concentration (Drinovec et al., 2015; Rajesh and Ramachandran, 2018). Dual-spot aethalometers use two deferentially loaded filter spots to estimate real-time light attenuation measurement with respect to a reference (or clean) spot. AE33s have been extensively used in recent field studies around the world (Cuesta-Mosquera et al., 2021; Duc et al., 2020; Goel et al., 2021; Li et al., 2020; Wang et al., 2021) and are considered a reference-grade instrument for accurate and real-time measurement of BC (or equivalent BC) (Bernardoni et al., 2021; Healy et al., 2017; Meena et al., 2021; Rajesh et al., 2021). Data collected from AE33s have also been used to provide insights into aerosol light absorption and to identify BC sources (biomass burning or traffic emission) based on the widely used two-component aethalometer model (Sandradewi et al., 2008a; Healy et al., 2017; Rajesh et al., 2021). Source apportionment of BC aerosol from the two-component aethalometer model divides the BC concentration into two segments based on their source of origin (biomass burning or fossil-fuel-based sources). Near-UV and near-IR light absorption measurements estimate the two BC source fractions. However, the choice of wavelength can change the estimates and has been extensively studied in literature (Zotter et al., 2017).
Although advanced aethalometers like the AE33 are widely used, they may not be appropriate in certain environments where portability and battery-powered operation are essential since these instruments are expensive and bulky and require external pumps or an external power supply to operate. Portable but effective instruments are often required for mobile monitoring, in-vehicle commuter exposure (Weichenthal et al., 2015; Apte et al., 2011), indoor personal exposure (Jeong and Park, 2017), and the monitoring of wildfire smoke using unmanned aerial vehicles (Aurell et al., 2021). Over the past decade, researchers have become increasingly interested in micro-aethalometers, as they are suitable for characterizing emissions in these challenging micro-environments (Alas et al., 2020; Aurell et al., 2021; Liu et al., 2021). The newly developed micro-aethalometer model MA300 (AethLabs) uses similar measurement techniques to the AE33 but with a smaller form factor, a built-in rechargeable battery, and a low-volume pump, making it suitable for indoor measurements and personal exposure analysis.
Currently, the MA300's onboard correction algorithm uses a linear loading correction method (Virkkula et al., 2007) applied to simultaneous dual-filter-spot (dual-spot) measurements. In contrast, the AE33 onboard algorithm uses a real-time dual-spot correction that includes adjustments for real-time variations in flow rate (Drinovec et al., 2015), which can lead to non-linearities in the relationship between ATN and BC surface loading.
In this work, we compare three MA300 units and their performance with a reference AE33 instrument through a long-term co-location campaign in Vancouver, Canada. During the campaign, all aethalometers were exposed to daily traffic emissions from the nearby multi-lane major road intersection as well as several days of wildfire smoke. In recent years, frequent wildfires in the Pacific Northwest regions of North America have been contributing to an increasing concentration of biomass-burning-based aerosol and poorer local and regional air quality through the short- and long-range transport of wildfire smoke (Filonchyk et al., 2022). To quantify the contribution of biomass-burning-based BC to total BC, we also assess the aerosol light absorption measurement capabilities and source apportionment performance based on the standard UV–IR aethalometer source apportionment mode, as well as modifications to the aethalometer source apportionment model to improve performance (Sandradewi et al., 2008a; Healy et al., 2019; Zotter et al., 2017). Finally, we provide recommendations for selecting appropriate use cases and data post-processing methods for the MA300 micro-aethalometers.
2.1 Site details and study period
Co-located eBC measurements with an AE33 and three MA300s were conducted at a regulatory air quality monitoring station operated by Metro Vancouver, the regional regulator, at Clark Drive, a busy road junction with six travel lanes. Clark Drive is a major truck route for goods movement and connects to a major regional port. This air quality station is < 20 m from the roadway and is equipped with several reference-grade instruments, including the AE33, to monitor near-road pollutant concentrations (Healy et al., 2019; Wang et al., 2018). The MA300s were co-located at the Clark Drive station for 14 weeks (15 August to 30 November 2020). During this measurement period, the Greater Vancouver Area experienced wildfire smoke originating from within the province of British Columbia and other parts of western North America (Nguyen et al., 2021), with days (n = 11) exceeding 24 h average PM2.5 concentrations of 25 µg m−3. We classify the campaign data into two distinct measurement periods based on the days Metro Vancouver issued air quality advisories: 8 through 18 September as “wildfire” days and the rest as “regular” days.
2.2 Aethalometers
Concentrations of eBC were measured using two different types of aethalometers, a seven-wavelength AE33 (Magee Scientific, California) and three individual five-wavelength MA300s (AethLabs, San Francisco, California). Both aethalometers use a dual-spot mechanism and can measure aerosol absorption in multiple wavelengths in real time. Details on the dual-spot aethalometer sampling mechanism have been provided elsewhere (Drinovec et al., 2015; Rajesh and Ramachandran, 2018). The AE33 was operated at a flow rate of 5 L min−1 with a time resolution of 1 min and came embedded with a real-time non-linear correction mechanism (Drinovec et al., 2015). We installed three MA300 units (hereafter referred to as MA300A, MA300B, and MA300C) in parallel with the AE33. The MA300s were operated at a flow rate of 150 mL min−1 with a data collection frequency of 1 min. Data from MA300s include dual-channel five-wavelength raw photometer measurements along with compensated eBC (eBCc) mass concentrations corrected by the onboard algorithm (Virkkula et al., 2007). More details on the two instruments and operational differences are provided in the Supplement (Table S2). All four aethalometers were connected to the same sampling line fitted with a 1 µm cyclone to eliminate any additional sampling artifacts. Since the AE33 and MA300 operate on different wavelength channels, we considered five wavelengths (370, 470, 520, 660, and 880 nm) from the AE33 as closest to the MA300's operating wavelengths (375, 470, 528, 625, 880 nm) and compared their results. For simplicity, these wavelength channels were renamed as UV (370–375 nm), blue (470 nm), green (520–528 nm), red (625–660 nm), and IR (880 nm).
2.3 Dual-spot aethalometer correction algorithm
Both the AE33 and the MA300 use dual-spot sampling technology, where aerosols are collected on two filter spots at different flow rates, and the light attenuation is measured at multiple wavelengths through comparison with a reference (zero aerosol loading) spot. The outputs from the sample-loaded spots are then combined in order to estimate real-time eBC concentration, as aerosol loading will occur differently, and any non-linearity in continuous measurement can be compensated for by the dual spot results. Filter-based light absorption techniques are subject to measurement artifacts due to scattering on the filter, scattering of light aerosols loaded on the filter surface or due to some particles being shadowed by others (Weingartner et al., 2003). In addition to these measurement artifacts, current aethalometer real-time correction algorithms do not consider light absorption enhancement occurring from the lensing effect, particularly at lower wavelengths due to light-absorbing organic components. Present designs of a stand-alone aethalometer are not equipped to estimate light absorption enhancement in real time, as they can not distinguish the aerosol mixing state and focus on bulk aerosol properties. Therefore, aethalometers require proper estimation of loading compensation factors and multiple scattering factors for accurate measurement (Weingartner et al., 2003; Virkkula et al., 2007, 2015).
In both the AE33 and MA300, wavelength-specific light attenuation (ATN) is measured by the three detectors (two on the loaded spot and one on the reference spot) and is obtained by Eq. (1).
I0, I1, and I2 are photometer signals from the reference spot, loading spot 1, and loading spot 2, respectively. Fresh filter spots will have an ATN value of 0, and continuous aerosol deposition on the filter spots will gradually increase ATN to a user-defined threshold value (typically 120 for AE33 and 100 for MA300) before moving to the next set of fresh filter spots. The AE33 utilizes the Drinovec et al. (2015) correction, where ATN measurements at each time stamp are converted into a compensated absorption coefficient (babs,λ) using Eq. (2). Finally, the eBC mass concentrations are derived by dividing the IR channels' absorption coefficients by the corresponding mass absorption cross-section (MAC; in m2 g−1) as provided by the manufacturer (Eq. 3).
In Eq. (2), k and C refer to the loading and multiple scattering correction factors, respectively. In this work, a TFE-coated glass fiber filter (model M8060) was used in the AE33; hence we used the manufacturer-recommended scattering correction factor (C) of 1.39. AE33's aerosol-loaded filter spots comprised an area (A) of 0.785 cm2. ΔATN1(λ) refers to the change in ATN at loading spot 1 within the time change of Δt (= 1 min). The recommended filter lateral leakage factor (ξ) was set to 0.01, representing 1 % leakage of the tape. The wavelength-specific loading correction factor (k) is calculated by solving a non-linear equation consisting of flow (F) and attenuation measurements (ATN) at each time step from both filter spots (Eq. 4).
In contrast, MA300's onboard algorithm uses a linear loading correction scheme (Virkkula et al., 2007) for the operational ATN range of 1–100 at each time stamp and assumes a scattering correction factor of 1.3 (from Firmware v1.09) for the PTFE filter material. Even though the MA300 includes flow measurements in the raw data files, it does not consider any lateral filter leakage parameters and flow values in their correction algorithm. Wavelength-dependent MAC values for both MA300 and AE33 models (Table S1) were taken from the user manuals provided by their respective manufacturers. These MAC values may not represent the realistic MAC values of real-time sampled aerosol as MAC values can change by aerosol composition, monitoring site, or even measurement instrument (Healy et al., 2017). Hence, fixed MAC values used in aethalometers can contribute to uncertainty in reported eBC concentration. Details on the MA300's onboard algorithm and symbols and definitions are provided in the Supplement (Sects. S2 and S1).
2.4 Modified Drinovec method in MA300
To compare the effect of loading correction on MA300 measurements, we utilized the raw light absorption data from the MA300s and applied a modified version of the Drinovec et al. (2015) method. We utilized the raw photometer data from MA300s and Eqs. (1)–(4) to estimate non-corrected babs (babs,NC), followed by calculating the loading correction factor (k) and Drinovec compensated babs (babs,D). We observed that the MA300 sensor data were affected by both drift and post-filter-change transient effects. The drift in the photometer data was removed by calculating statistical outliers before calculating ATN and has been explained in detail in the Supplement (Sect. S3). In the Drinovec et al. (2015) correction algorithm, loading effect estimations are sensitive to flow fluctuations (Eq. 4) and transient effects from filter changes. By inspecting the transient effect in the MA300 data, we identified a modified ATN range (15 < ATN < 30) for linear fitting, which differs from the AE33 range (10 < ATN < 30).
2.5 Aerosol light absorption characteristics
Aerosol light absorption coefficients (babs(λ), Mm−1) are an important parameter in understanding spectral light interactions. babs evaluated from aethalometers in conjunction with additional light scattering measurements can be used to derive single scattering albedo (SSA), a parameter used in studying the radiative impact of atmospheric aerosol (Rajesh and Ramachandran, 2018). Furthermore, multi-wavelength babs data are essential for real-time source apportionment of eBC (Sandradewi et al., 2008b; Zotter et al., 2017). Although estimation of SSA and radiative properties are outside the scope of this work, we focus on evaluating the babs back-calculated from the aethalometer-reported compensated eBC concentrations in order to assess the source apportionment capabilities of the MA300. For individual wavelengths, aerosol absorption coefficients (babs(λ), Mm−1) were calculated using Eq. (5), in which reported eBC concentrations across the five wavelengths are multiplied by their respective MACλ values. We also calculated the modified Drinovec et al. (2015)-corrected MA300 babs,D values to assess any potential performance improvements.
Spectral light absorption coefficients (babs(λ)) exhibit a power law relationship (Eq. 6) (Kirchstetter et al., 2004; Moosmüller et al., 2011). The power law exponent (α), i.e. the Absorption Ångström exponent, is a quantity that is used to measure the spectral dependence of light absorption and has been used as a metric to understand the source of absorbing aerosols. Higher values of α (> 1) imply a higher spectral dependence of light absorption by the sample (Garg et al., 2016). In theory, a pure BC aerosol particle is a strong absorber over the whole spectrum (near-UV to near-IR); hence it would show a weak spectral dependence (αBC=1).
From a five- or seven-wavelength aethalometer, α can be derived from a log-linear regression between babs and wavelength (λ) on a log–log scale (Stampfer et al., 2020). However, the use of a wavelength pair (λ1,λ2) for the determination of α is more common and has been utilized in several source-apportionment-based studies (Segura et al., 2014; Zotter et al., 2017). In this work, we calculated α values using the multi-wavelength power law fit of babs values.
2.6 Source apportionment using aethalometer data
One of the major use cases of multi-wavelength aethalometers is to perform source apportionment (SA) of eBC mass concentration. Source characterization of eBC is usually achieved by the widely used aethalometer model developed by Sandradewi et al. (2008b). For the AE33, this SA model is built into the device software for estimation of the real-time contribution of biomass burning (BB; in %) to total eBC mass. The majority of aethalometer-based SA studies have used this method to characterize sources of eBC originating from fossil fuel or transportation sources (referred to as eBCff) and biomass burning or wood burning sources (referred to as eBCbb) (Sandradewi et al., 2008b; Healy et al., 2017; Rajesh and Ramachandran, 2017; Zotter et al., 2017; Grange et al., 2020; Deng et al., 2020; Bernardoni et al., 2021). This model is based on the principle that eBC emitted from biomass burning (wood burning, wildfire) sources will tend to show enhanced absorption in the near-UV region of the light spectrum, compared to fossil fuel (transportation, liquid fuel) sources. The components of eBC derived from the aethalometer model strongly rely on a fixed pair of absorption Ångström exponent inputs (αff and αbb). However, in reality, fixing αff and αbb does not capture the real-world variability in α from different fuel and burn conditions, leading to inaccurate estimates (Healy et al., 2017). Ambient aerosol is often mixed with volatile organic compounds, undergoes ageing processes, and forms BrC components. As a result, bulk aerosol light absorption from highly mixed environments often contributes to lower-wavelength light absorption (Saleh et al., 2015; Healy et al., 2015). Ideally, values of αff and αbb should be derived from radiocarbon-based 14C analysis of the aerosol samples (Zotter et al., 2017; Sandradewi et al., 2008a). Due to the limitations of on-site (Zotter et al., 2017; Sandradewi et al., 2008a) measurement, we use the values from Zotter et al. (2017) for two wavelength pairs (UV–IR and blue–IR), which were verified using multiple instrument comparison and radiocarbon-based analysis. The constrained values of αff and αbb used in this study are as follows:
-
UV–IR with α pairs as 0.9 (αff) and 2.09 (αbb)
-
blue–IR with α pairs as 0.9 (αff) and 1.75 (αbb).
To understand the impact of input parameters on the aethalometer model, a sensitivity analysis on the choice of α has been performed for different combinations of babs inputs as experienced by AE33 during the regular and wildfire periods and discussed in Sect. 3.5.1. Equations for the source apportionment (SA) can be found in the Supplement (Sect. S4). It is important to note that the aethalometer model operates on near-UV and near-IR babs values using Eqs. (S3)–(S7), and at first, it separates the contribution of light absorption to biomass burning source (babs,bb) and fossil fuel source (babs,ff). Next, eBC components (eBCbb and eBCff) were derived using Eqs. (S8) and (S9) and by dividing the babs components by instrument-specific MAC(880 nm) values (Table S1). The rationale of using similar MAC values for determining both the eBC components has been discussed by Zotter et al. (2017). To further assess the performance of different artifact correction protocols, SA calculations were performed separately on three sets of babs values from the AE33 and MA300s:
-
babs from AE33, instrument-reported data used as reference measurement;
-
babs from MA300, instrument-reported data with onboard correction; and
-
babs,D from MA300, Drinovec-corrected data from MA300's raw measurement.
2.7 Data analysis
Data collected from the aethalometers were temporally aggregated to avoid any additional sampling noise (Hagler et al., 2011). We chose the hourly average to remain consistent with previous studies used in a similar context. For QA/QC of the AE33 data, we removed any flagged data points (filter spot change, internal tests) as a part of post-processing the data. Similar flagged data points were eliminated from MA300 units from the raw data files. During the measurement period, we also identified unusually elevated concentrations of PM2.5 for 3 d (31 October–2 November 2020) during the regular period, which was attributed to local fireworks from Halloween celebrations. These 3 d of data were removed from the main analysis to increase the consistency of the data. Data from these days have been separately analyzed as a case study to check the performance of MA300 in high-PM events and provided in the Supplement (Sect. S6). The performance of the MA300 was assessed for both precision (via unit-to-unit variability) and relative accuracy (via linear regression against the AE33). Relative accuracy was assessed using the slope of the linear fits. However, as the measured and derived parameters had different scales or ranges across wavelength channels, MA300 units, and periods, we needed to remove measurement bias and focus on the instrument's variability. Therefore, we chose to normalize the data for individual groups by scaling them with respect to their range of measurement, also known as min–max normalization (Géron, 2022).
Additionally, mean absolute error (MAE), root mean square error (RMSE), and normalized root mean squared error (NRMSE) were calculated. More details about these metrics and methods have been explained in detail in the Supplement (Sect. S5). All the statistical analysis, error calculations, and instrumental analysis were performed in R (version 4.0.3), with a suite of open-source packages (TidyVerse, Wickham et al., 2019; OpenAir, Carslaw and Ropkins, 2012; hydroGOF, Zambrano-Bigiarini, 2020).
Data collected from AE33 and the MA300s (A, B, and C) during the campaign were separated into previously defined “wildfire” and “regular” periods for studying the aethalometer's performance in two different sources of aerosols. At first, we compare the instrument-reported eBC concentration from MA300 and AE33. It is important to note that aethalometer-reported eBC concentrations are derived from IR channel absorption only. Next, we explore the effect of loading correction on the MA300's raw data by applying a modified version of the Drinovec et al. (2015) method. Finally, we investigate the performance of the paired-wavelength aethalometer model for source identification of eBC using MA300 data.
3.1 eBC mass concentration during the study period
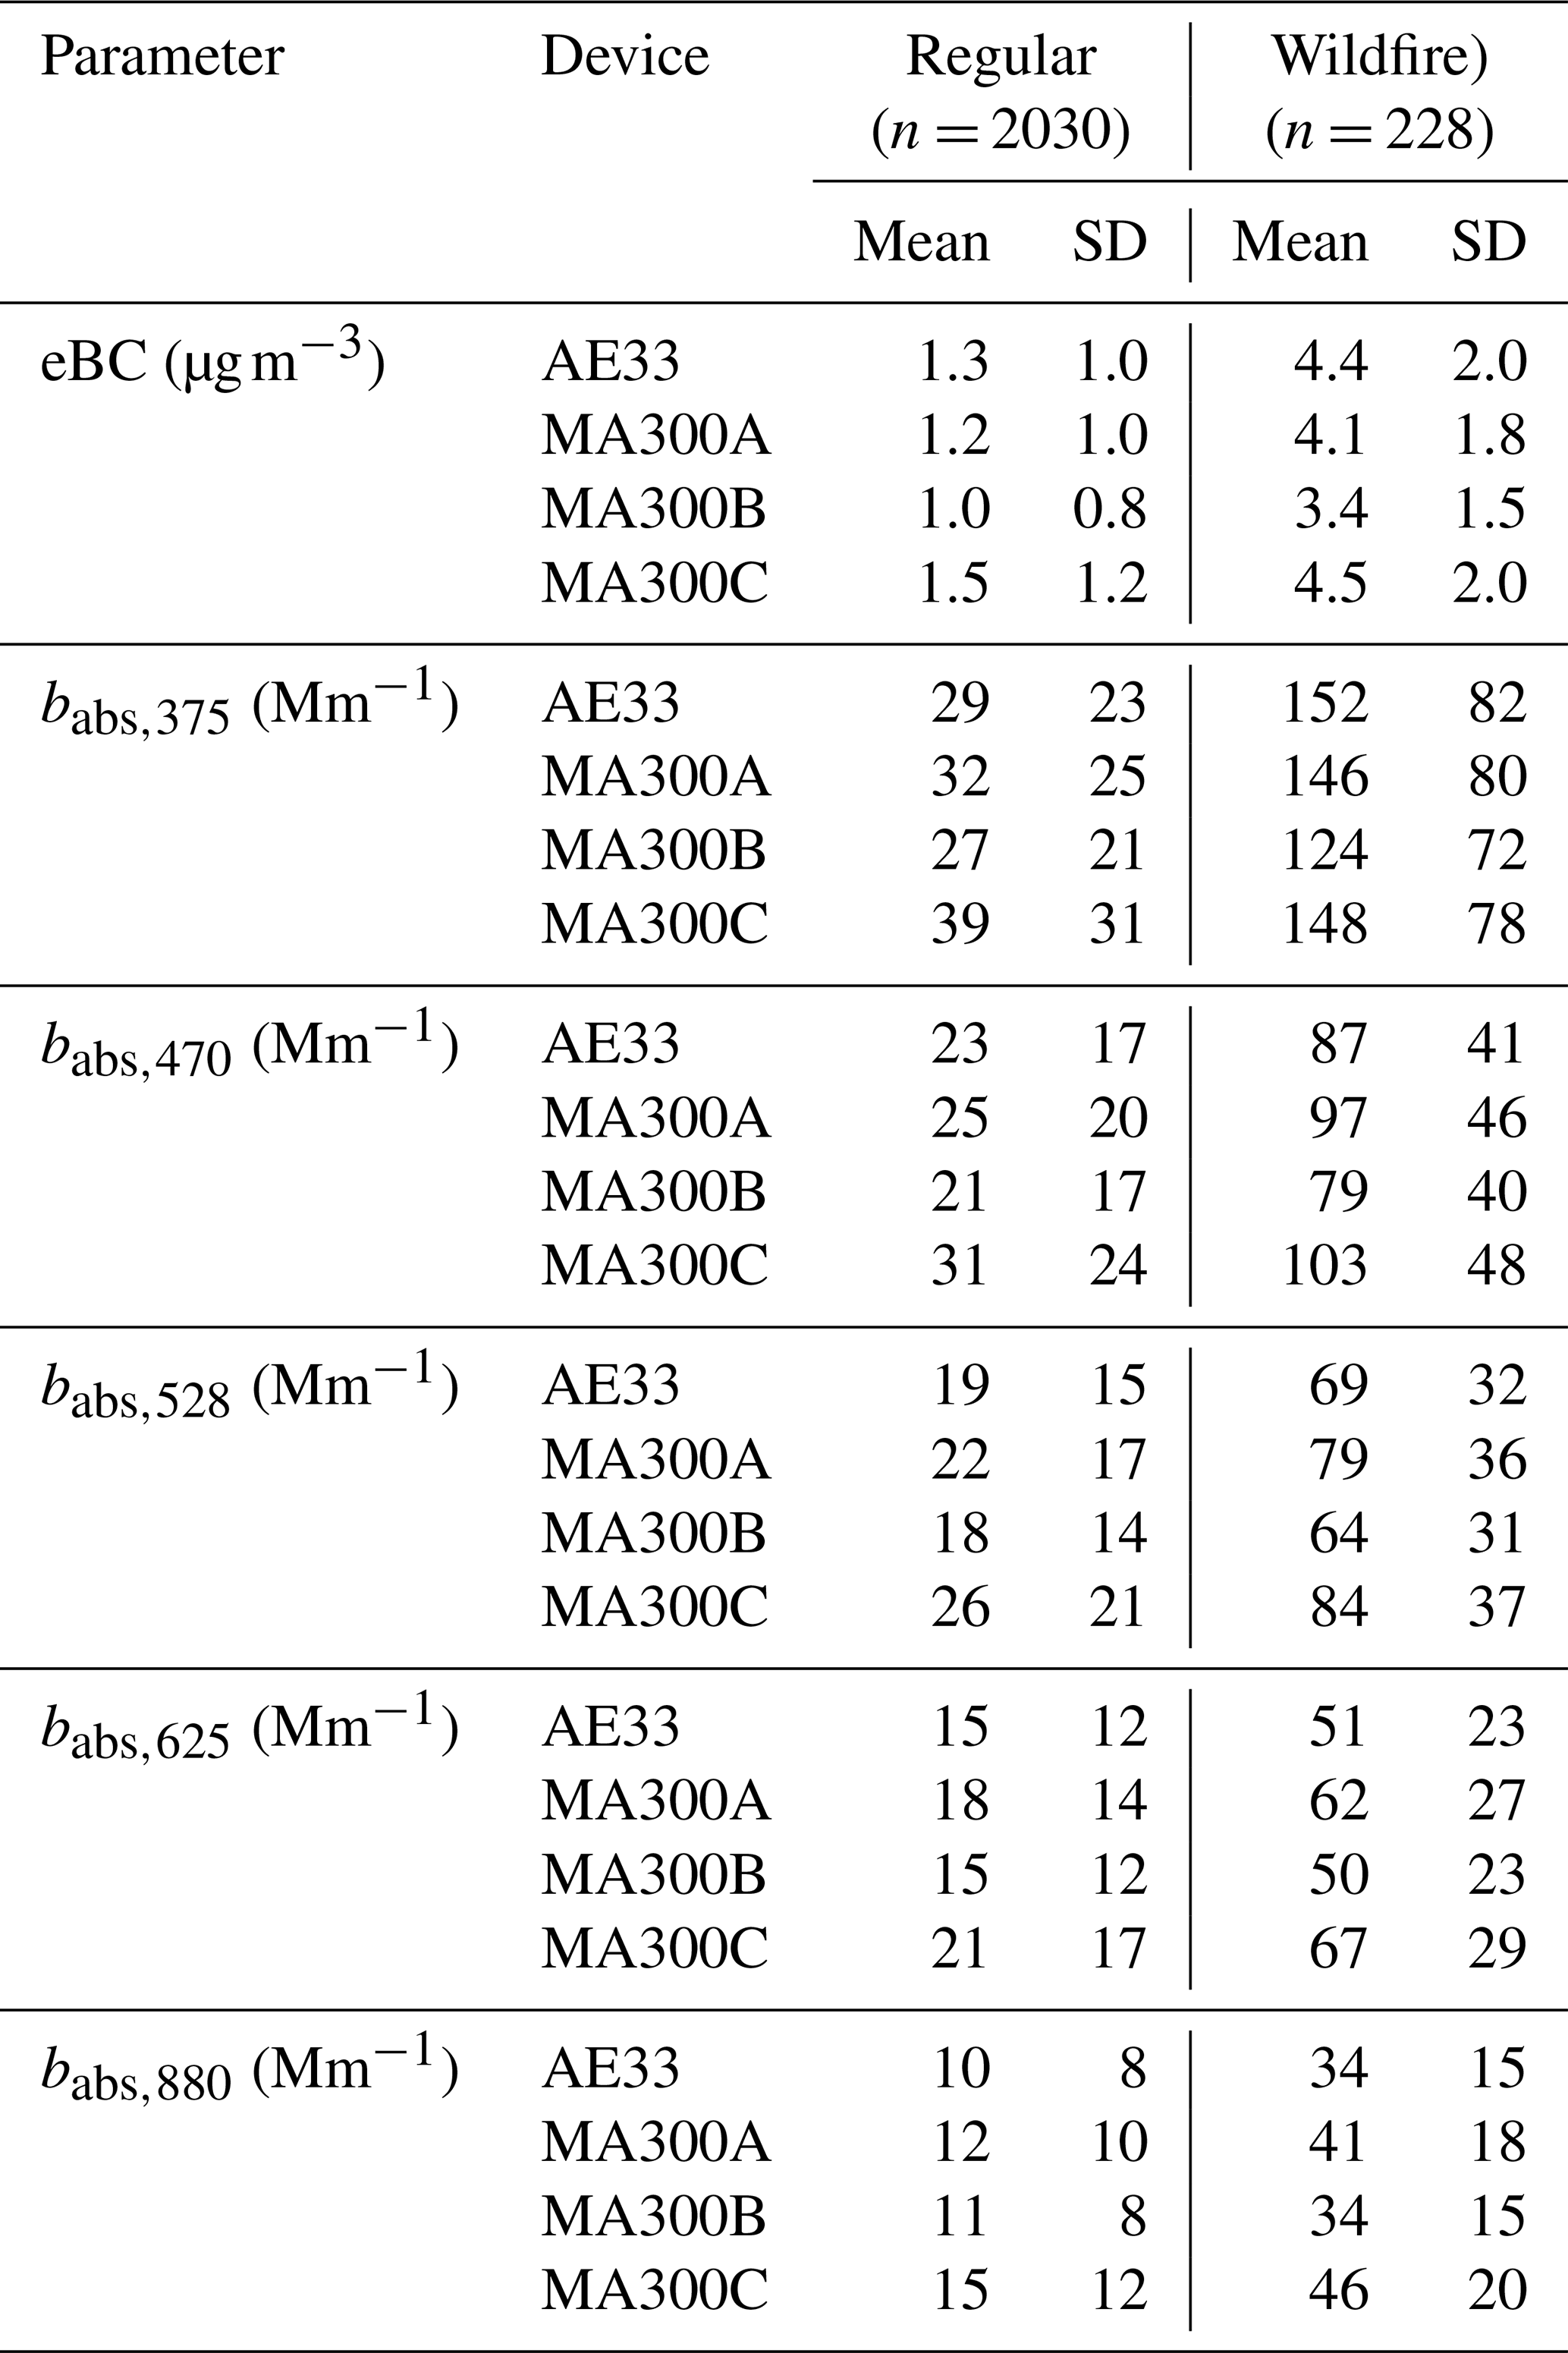
An hourly statistical summary of eBC mass concentration for regular and wildfire periods from the four aethalometers is presented in Table 1. Hourly eBC concentration reported by the reference aethalometer AE33 ranged between 0.03–10.8 µg m−3, with an average of 1.3 µg m−3 during the regular period and 4.4 µg m−3 during the wildfire period. Since eBC sources can vary within a day, eBC concentration for the measurement periods was again aggregated to estimate the average hour-of-day (diurnal) concentration. The average within-day hourly eBC concentration during the regular period varied from 0.76 to 2.15 µg m−3, with the lowest observed concentrations from 01:00 to 04:00 PT and the highest observed concentration from 06:00 to 10:00 PT. This diurnal concentration profile follows the traffic count of the junction, indicating the influence of significant sources as the vehicular emissions, which is consistent with previous near-road studies (Healy et al., 2017, 2019). However, the effect of wildfire smoke raised the concentration range of diurnal variation of eBC, with the lowest reported value of 3.1 µg m−3 to the highest of 6.03 µg m−3 during the wildfire period. The observed effect in eBC concentration due to wildfire smoke compared to the regular period was consistent with previously studied wildfire episodes in similar regions (Healy et al., 2019). A time series of aethalometer-reported eBC concentrations during the wildfire period has been provided in the Supplement (Fig. S2).
Table 1Statistical summary (Mean and standard deviation) of eBC, and multi-wavelength babs from the four aethalometers used in this study. Summaries were calculated for the two periods (regular and wildfire) separately.
3.1.1 Comparison of MA300- vs. AE33-reported eBC
The average eBC concentration reported by the three MA300 units was lower by 5 % during the regular days and 9 % during the wildfire days than the AE33 measurements. In a previous study, Blanco-Donado et al. (2022) identified an average difference of 9 % in the MA200-reported (sister model of MA300) eBC concentration and AE33-reported eBC concentration. Diurnal variation of hourly eBC concentration reported by MA300 units ranged between 0.75 to 1.9 µg m−3 during the regular period and 2.9 to 5.2 µg m−3 during the wildfire period, consistently lower than the AE33-reported values. In Fig. 1a, we present the scatter plot of the MA300-reported hourly eBC concentration against the AE33-reported values during the campaign. From the linear fit in the scatter plots, we calculated a R2 = 0.9 when MA300s were compared against AE33's data. Calculated R2 values from MA300's data in this study were found to be consistent with previous studies (Kuula et al., 2020; Alas et al., 2020), with similar MA-series sister aethalometer models (MA200, MA350). The mean and standard deviation of eBC measurements by the MA300 units and the AE33 are presented in Table 1, separated by regular and wildfire periods. In the regular period, the calculated coefficients of variation were 80 % from MA300's measurement and 79 % for AE33's measurement, which reduced to 45 % during the wildfire period for both MA300 and AE33. Our results reveal that the variability of hourly eBC concentration captured by the MA300 (average of three MA300 units) was similar to the AE33's measurement. The average MAE of MA300-measured eBC was found to be significantly higher during the wildfire period (0.97 µg m−3) as compared to the regular period (0.43 µg m−3) (Table S3a).

Figure 1(a) Scatter plot of eBC mass concentration for individual MA300 units A, B and C vs. AE33. The dashed line represents the 1 : 1 line, and solid colours are the regression fit lines for the individual MA300 units. (b) Linear relationship of multi-unit pooled standard deviation (SD) from normalized MA300 measurements for each µg m−3 of normalized AE33 eBC concentration. The fit line (in blue) represents the linear response of MA300's variability across the concentration range. The shaded region represents the 95 % CI of the fit.
Increased absolute error during the wildfire period can be attributed to the higher observed absolute concentration of eBC, which results in more potential for large absolute differences with respect to the reference measurement. Average normalized errors (NRMSE) for the three MA300s were calculated as 8.5 % and 12.5 % during the regular and wildfire period, respectively. Higher MAE and NRMSE during the wildfire period indicate that the MA300's errors have increased in both absolute and relative terms. This means MA300's relative accuracy can deteriorate in a highly polluted environment. Since the aerosol sampling process between the AE33 and MA300 can differ (filter mechanism, flow rate), it is possible that MA300's measurement errors are associated with filter loading interactions. Differences in sampling flow rates (for MA300 – 150 mL min−1 and for AE33 – 5000 mL min−1) can change differences in face velocity and hence change the particle penetration depth into the filter (Moteki et al., 2010). Further, from the real-time estimates of eBC concentration, we calculated the device-specific filter loadings (in µg cm−2) for the corresponding flow rate of measurement (see Table S6) and found that wildfire periods were subjected to higher loadings (almost 3.5 times higher than the regular period). When filter loadings of MA300s and AE33 were normalized with their set flow rate, we found that MA300s were experiencing significantly higher filter loading (0.054 µg cm−2 mL−1) than AE33 (0.006 µg cm−2 mL−1) during the wildfire period. Higher filter loading and lower face velocity can lead to large measurement errors in MA300's results, particularly during the wildfire period.
3.1.2 Unit-to-unit variability of MA300-reported eBC
The linear fit results in Fig. 1a indicate that the variability in AE33-reported eBC concentrations was captured well by the MA300 units during the whole campaign. However, we observed variability in the slope of the linear fit line across the MA300 units (MA300 = 1.01, MA300B = 0.73, MA300C = 0.87), highlighting the presence of unit-to-unit variability. The range of slopes calculated from this study is consistent with other reported slopes from MA-series instruments when compared against a reference monitor (Kuula et al., 2020; Alas et al., 2020; Blanco-Donado et al., 2022). To assess the unit-to-unit variability of MA300s, we adapt the methodology from Müller et al. (2011), where instruments of the same make and type were evaluated against a reference instrument. The ratio of the standard deviation across MA300 units and the reference instrument is representative of the coefficient of variability against the reference measurement.
First, we normalize the absolute measurements from MA300 units by the range of concentration (max–min criteria) to only consider the measurement bias and eliminate any device-specific noise. Next, we created a pool of MA300's measurements (for absolute and normalized data separately) for each bin (of width 1 µg m−3) based on AE33-reported eBC data. The standard deviation of the pooled measurement from MA300 was fitted against the AE33's measurement. The slope of the linear fit corresponds to the linear response of MA300's variability across the concentration range (Fig. 1b). The slope of this linear fit line is 0.049 and can be interpreted as an approximately 5 % variability across MA300 units of hourly eBC mass concentration. When compared against non-normalized measurements, MA300 exhibited 21 % unit-to-unit variability (see Fig. S7). In Fig. 1b, we also see that a linear fit can not totally explain MA300's unit-to-unit variability (R2 = 0.6) and depend on the observed concentration range, which suggests estimates of unit-to-unit variability can change based on the range of eBC concentration.
The variability in the absolute measurements from the multiple units of similar instruments can be partially explained by the instrumental measurement noise (Müller et al., 2011). Typically, the aethalometer's instrumental noise is defined as the single standard deviation of the eBC mass concentration with particle-free air (Müller et al., 2011; Cuesta-Mosquera et al., 2021), which has been reported as 0.032 µg m−3 for AE33 (Cuesta-Mosquera et al., 2021) for 1 min time resolution. MA300's noise levels were separately assessed in the laboratory following the recommendations by Backman et al. (2017). Briefly, a HEPA filter was installed, and the MA300 units were set to intake particle-free air samples at a frequency of 5 min for 36 h with controlled weather parameters indoors. We could not report MA300A's noise level due to instrumental error (optical saturation); however, the noise level for MA300B was 0.04 µg m−3 and for MA300C was 0.163 µg m−3. The noise estimates for MA300 units were much higher (1.25–5.1 times) than the AE33-reported noise value. Previously, Holder et al. (2018) reported that noise estimates in MA-series aethalometers could be much higher (1.5–5 times) than the reference instrument for 1 min averaged data. As mentioned in Sect. 3.1.1, filter loading during a high-BC event can lead to measurement errors that vary by each instrument's sensitivity. Mean filter loading (eBC mass per unit filter area; see Table S6) during the regular period was 1.63, 1.46, 1.96, and 5.8 µg cm−2 for devices MA300A, MA300B, MA300C, and AE33 respectively. For the wildfire period, the filter loading has increased across all the devices (5.49, 4.85, 5.79, and 19.0 µg cm−2) as expected. During the wildfire period, filter loading per unit volume of air sampled increased by a factor of 2 in AE33 (see Table S6). However, for MA300 units, this factor varied (2.4 for MA300A, 2.27 for MA300B, and 1.9 for MA300C). Even though all these devices measure the same environment, we find differences in the aerosol loading on MA300 filters. We hypothesize this variability might be occurring due to the variability in sampled airflow and instrumental noise. By studying the instrumental noise and filter loading estimates, we find that the error contribution in MA300's eBC measurement can be sensitive to their exposed concentration range. This observation aligns with a previous study on MA-series aethalometers, where the impact of high eBC concentration has been found to impose large errors from more pronounced filter loading corrections (Alas et al., 2020).
3.2 Multi-wavelength babs
Absorption coefficients (babs) derived from Eq. (5) for the five wavelengths were utilized in this section. We consider five channels representative of five wavelengths of light measurement in AE33 and MA300. As shown in Table S1, the channel-specific wavelength may not match exactly in different aethalometer models. However, for simplicity, we adopted MA300-measured wavelengths as a reference, and the nearest wavelengths from AE33 were used for comparison. We present a statistical summary of multi-wavelength babs measurements from all four devices in Table 1.
3.2.1 Enhanced babs during the wildfire period characterized by AE33
During the regular period, AE33's average babs values were calculated as 29, 23, 19, 15, and 10 Mm−1 for UV (λ=375 nm), blue (λ=470 nm), green (λ=528 nm), red (λ=625 nm), and IR (λ=880 nm) channels, respectively. We observe that the average values of babs increased across the light spectrum during the wildfire-smoke-impacted period (Table 1). Particularly, aerosol light absorption in the UV channel, babs,UV, increased by a factor of 5 (from 29 to 152 Mm−1), whereas the babs,IR enhancement over the regular period was slightly lower, by a factor of 3 (from 10 to 34 Mm−1). To further check the differences in relative spectral absorption, for the wildfire and regular period, we compared the normalized babs from the AE33 (Fig. S8). We used Welch's t test on the regular and wildfire data separately for all the channels and found the observed spectral light absorption enhancement to be statistically significant (p < 0.05). The UV had the largest absorption enhancement during the wildfire period, reflecting the elevated contribution of organic compounds originating from wildfire smoke (Healy et al., 2019; Laing et al., 2020). As mentioned in Eq. (6), the strength of spectral light absorption can be evaluated by fitting a power law to the absorption coefficients. The exponent (α = AAE) of the spectral power law fit was higher in the wildfire period (α = 1.7 from AE33) compared to the regular period (α = 1.2 from AE33) due to the strong impact of wildfires on the enhanced light absorption in lower (UV and near-UV) wavelengths (Fig. S3). This finding is consistent with previous studies which showed similar UV enhancements during wildfire smoke and wood-burning events (Garg et al., 2016; Laing et al., 2020; Helin et al., 2021).
3.2.2 Comparison of MA300's multi-wavelength babs with AE33
To assess the performance of the MA300 babs measurements across all five wavelengths, we used unit-specific normalized measurements of each wavelength's babs for individual periods and compared them to the normalized wavelength-specific babs measurements from the AE33. As shown in Table 1, the absolute babs measurement range can significantly vary based on the measurement period or wavelength; a direct comparison of absolute values may not provide insights into measurement differences between wavelengths. We find that the MA300-reported absolute measurements overestimated babs,IR by 20 % and 18 % during the regular and wildfire periods, respectively, when compared against AE33. However, the overestimation percentage decreased to 10 % for the UV channel (babs,UV) during the regular period and interestingly switched to a 9 % underestimation during the wildfire period. Unpaired t-test results revealed most of these findings to be statistically significant (p < 0.05) except for babs,UV during the wildfire period (p = 0.075). The underestimation of babs,UV during the wildfire period appears to be borderline statistically significant with a p value of 0.075, indicating that there is some evidence to suggest that the underestimation is real; however, the result does not reach the usual threshold for statistical significance. The underestimation of babs,UV during the wildfire period can lead to erroneous source characterization results as UV and IR light absorption estimates are the primary inputs for the aethalometer source apportionment algorithm (Sandradewi et al., 2008a). When compared to the AE33, MA300 babs measurement errors were found to be higher during the wildfire period across all the units (Table S3b). The mean absolute error for the babs,UV ranged between 35.7–40.0 Mm−1 during the wildfire period, which was 3 times the range observed during the regular period. Normalized errors (NRMSE) were found to be 14.4 %–18.4 % and 7.9 %–8.4 % during the wildfire and regular periods, respectively. The lowest absolute errors were found in the babs,IR measurements (3.4–5.4 Mm−1 during the regular and 7.0–13.2 Mm−1 during the wildfire period).
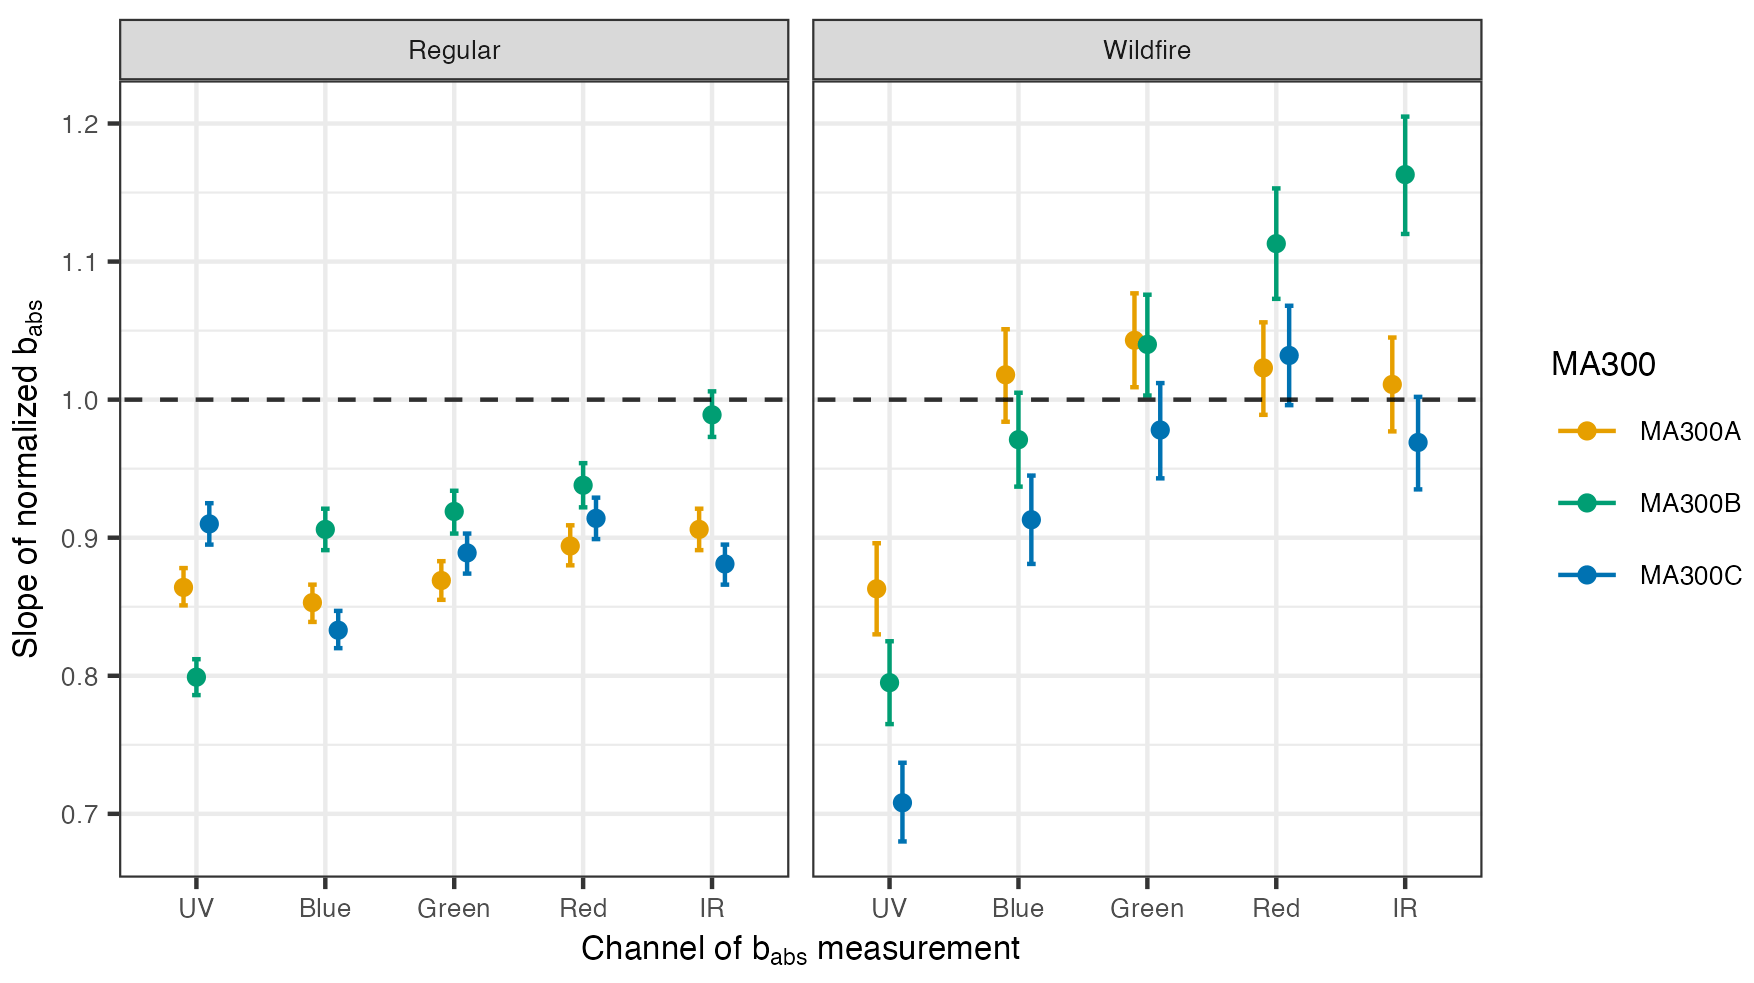
Figure 2Slope of regression fit from the linear fit of normalized multi-wavelength babs values of MA300s vs. AE33 during the regular and wildfire period. The dashed horizontal line is a slope of 1. The error bars show the 95 % confidence interval of the linear fit.
As shown in Fig. 2, the linear fit of individual MA300 units vs. AE33's hourly averaged normalized multi-wavelength babs revealed significant variability within MA300 units. It is important to note that, in Fig. 1, we present the linear performance of MA300 units (with respect to AE33) in measuring eBC for the whole campaign, which corresponds to the IR channel measurement only. Equation (5) shows that the linear relationship of MA300's babs,IR and AE33's babs,IR will be directly related to eBC measurements multiplied by the ratio of MACIR values between MA300 and AE33.
During the regular period, the slopes ranged between 0.80 and 0.99, while during the wildfire period, it ranged from 0.71 and 1.16 (Fig. 2). Previously, Cuesta-Mosquera et al. (2021) tested 23 units of AE33 in both laboratory and ambient settings, assessing the instrument's performance before and after maintenance. They found that, after maintenance, AE33 tends to slightly underestimate (slopes slightly reduced from 1) for ambient aerosol measurements at wavelengths 590, 660, and 880 nm, but any wavelength dependency of the unit-to-unit variability of AE33 was not reflected. Here, to assess the unit-to-unit variability of MA300s across the five channels, we used the coefficient of variation (CV) of the normalized slopes from the three units (Fig. 2). Unit-to-unit variability was highest in babs,UV (CV ≈ 8 %). Underestimation of babs,UV and high unit-to-unit variability will impact the SA results, particularly during the wildfire period. However, the variability in the blue channel was found to be low (CV ≈ 4 %), and slope values were much closer to 1 during the wildfire period, which makes it a potential near-UV wavelength of choice for the SA studies using the MA300.
3.3 Absorption Ångström exponent (α)
The strength of spectral light absorption of aerosols is considered one of the most important parameters in understanding an aerosol's impact on earth's radiation balance and can be derived from aethalometer measurements (Zotter et al., 2017; Bernardoni et al., 2021). In addition, α values are used for determining fossil fuel and biomass burning source contributions in eBC from the aethalometer source apportionment model (Sandradewi et al., 2008a; Healy et al., 2019). In this section, the exponent of a power law fit (Eq. 6), the absorption Ångström exponent (α), was derived for two wavelength pairs – UV (λ=375 nm) and IR (λ=880 nm) and blue (λ=470 nm) and IR (λ=880 nm) using the hourly averaged babs values. In the literature, α has been calculated by several combinations of wavelengths. Grange et al. (2020) reported α by curve fitting all absorption wavelengths, as shown in Fig. S3 (for AE33) and in Fig. S4 (MA300 units). However, most studies (Garg et al., 2016; Zotter et al., 2017; Healy et al., 2019; Rajesh et al., 2021) have focused on reporting α by choosing two extreme wavelength pairs on the measurement spectrum, as we choose here. The distribution of α values (based on a UV–IR pairing) from the three MA300 units and the AE33 for the wildfire and regular period is shown in Fig. S9. During the regular period, we observed a unimodal distribution with a α peak close to 1.13 (from AE33). This suggests that regular periods were mostly experiencing a strong single source of aerosol from the nearby traffic emissions. For MA300 measurements, we find the distribution to be wider than AE33. During the wildfire period, the distributions broadened and were multi-modal. The peak of AE33's α distribution was found to be 1.69, which is very close to that previously recommended as an optimal αbb value by Zotter et al. (2017) for SA calculations. In Fig. 3, we show each device's hourly mapped α values estimated by UV–IR and blue–IR pairs. Daytime α values for both wavelength pairs during the regular period were found to be lowest and closer to unity, representing aerosol sources from traffic sources (Healy et al., 2019; Bernardoni et al., 2021). In contrast, nighttime α values were found to be highest during the regular period, which could be attributed to local wood-burning sources (Healy et al., 2019). During the wildfire-affected days, the scenario becomes the opposite; the highest α values were during daytime and the lowest during nighttime. We speculate that, at our measurement site, aerosol light interaction can change significantly by time of day as dominant sources and additional oxidation processes fluctuate. The error bars in the α measurement (Fig. 3) were consistently higher in MA300-based measurement as compared to the AE33, which we believe to be contributed by the errors from babs measurements. Additionally, we find the blue–IR-based α values were consistently lower during the wildfire period. The slopes of the fit lines (in Fig. 3) were 1.05, 1.1, 1.03, and 1.13 for MA300A, MA300B, MA300C, and AE33, respectively, indicating a lowering of α values. This is in line with the differences observed in babs measurement in the UV and blue channel during the wildfire period.
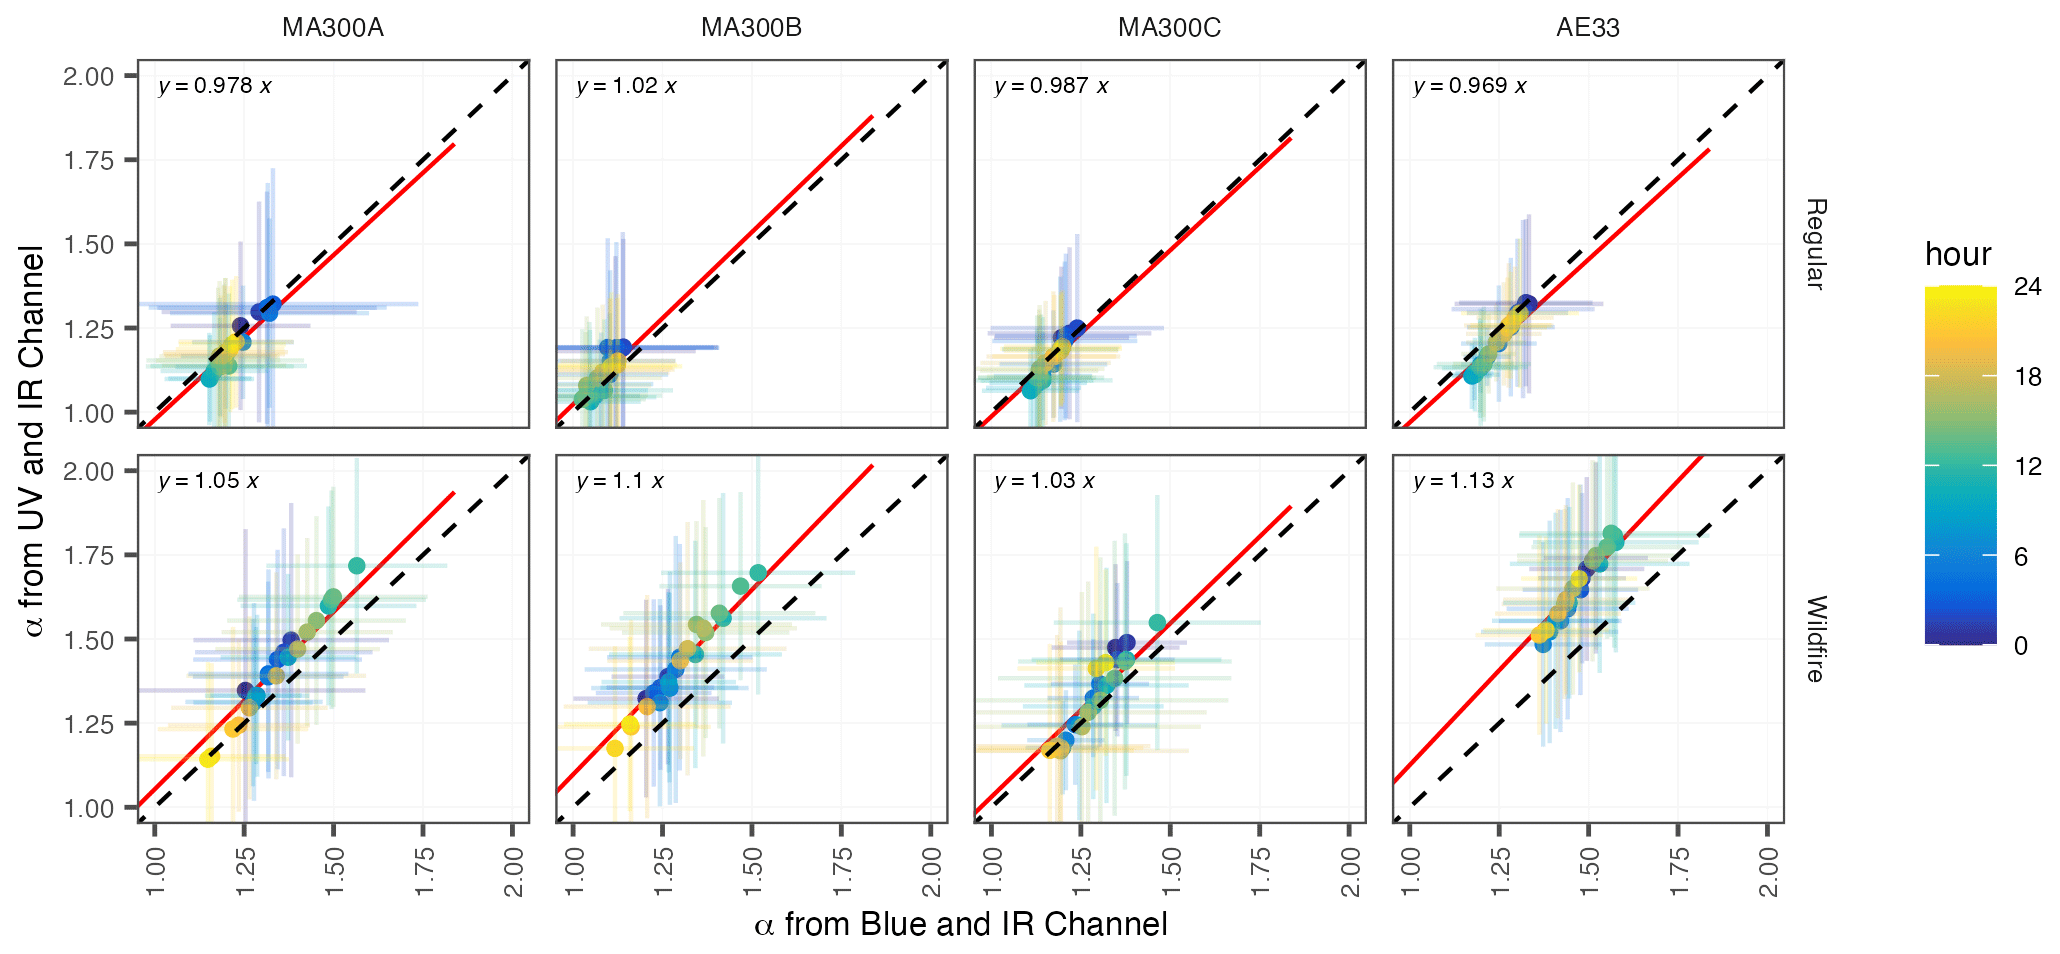
Figure 3Ångström exponent (α) (by the hour of the day) measured by different aethalometers during the regular and wildfire period. Average hourly α values derived from the blue–IR wavelength pair (on x axis) and the UV–IR wavelength pair (on y axis), with error bars representing respective standard deviation. Red lines represent the linear relationship (forced through the origin), and the dashed line is 1 : 1.
3.4 Analysis of loading correction in MA300
In this section, we examine the effect of loading correction on the MA300's data for two extreme spectral measurement channels, UV and IR. From the whole campaign, we utilized hourly measurements from MA300A and AE33 and compared them in Fig. 4. The measurement from AE33 was corrected using onboard dual-spot correction following Drinovec et al. (2015), and for MA300A, three groups of data were considered – raw data (i.e. without correction, babs,NC), onboard corrected data (i.e. with Virkkula et al., 2007 correction, babs), and modified Drinovec-corrected data (i.e. with modified Drinovec et al., 2015, correction, babs,D, as discussed in Sect. 2.4). As shown in Fig. 4, the onboard correction in MA300A yields an improved slope of the fit line (i.e. closer to 1) for both channels. The slope changes from 2.7 to 1.13 in the IR channel and 1.6 to 0.954 in the UV channel when MA300A's onboard correction is adopted. The slope from MA300A's babs,IR (1.13) is directly related to the slopes presented in Fig. 1a. Similar results were observed in the other MA300 units, indicating the effectiveness of the MA300's onboard correction scheme. Adopting the modified Drinovec correction scheme yields improvements in the fit slope (1.3 in IR and 0.89 in UV); however, the modified Drinovec correction was also found to cause additional noise in the data over the whole spectra (Table S3c), making it unsuitable for application in the MA300. The modified Drinovec algorithm utilizes a non-linear algorithm (Drinovec et al., 2015), which involves flow estimates from the dual-spot aethalometer. From the onboard mass flowmeter readings, we find that filter spots 1 in all the MA300 units were drawing comparatively lower airflow with wider variability. MA300 uses a sampling flow rate of 150 mL min−1, and ideally, (100 mL min−1) is split to filter spot 1. MA300's flow set point deviation ranged from −9.7 % to 2.4 % for MA300A, −8.9 % to 5.8 % for MA300B, and −14.2 % to 1.4 % for MA300C. In contrast, AE33 was run at 5 L min−1 (with set airflow of 3333.33 mL min−1 on filter spot 1) and had smaller deviations from the set point (−0.44 % to 3.2 %). A high range of flow variability can lead to additional noise in corrected eBC measurements when a flow-based correction technique, such as the Drinovec et al. (2015) algorithm, is adopted in MA300 devices.
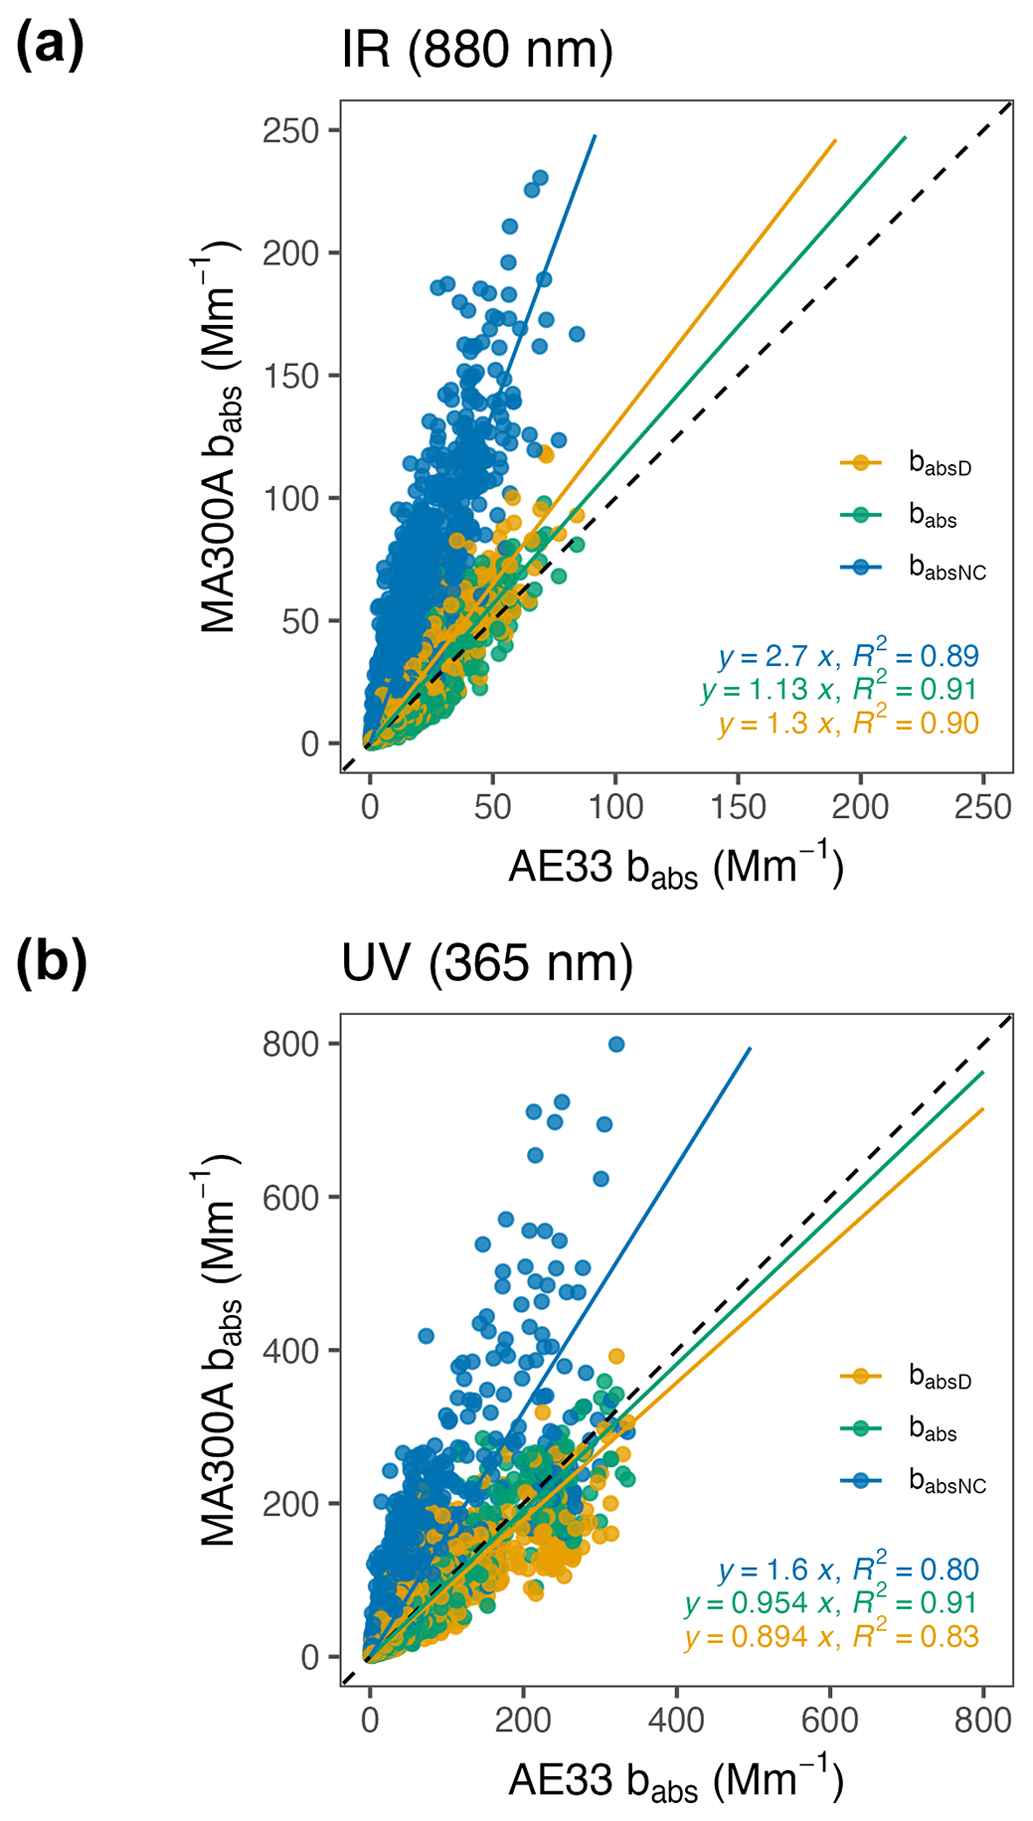
Figure 4Scatter plot of IR (a) and UV (b) channel's babs from MA300A unit against the reference measurement (AE33). Dashed line represents the 1 : 1 line. Colours in scatter points and fit lines represent three different data set from MA300A: Data without correction (babs,NC), data with onboard correction (babs), and data with modified Drinovec correction (babs,D).
3.5 Source apportionment results
To examine the source apportionment (SA) capabilities of the MA300, we applied the widely used two-component aethalometer model (Sandradewi et al., 2008a) on calculated hourly babs values and compared the results to the apportioned results from the AE33. Previously, in Sect. 3.2.2, we identify that the UV channel absorption measurements, babs,UV, are subject to higher error than light absorption measurements done at higher wavelengths. In aethalometers with multi-wavelength measurement capacity, babs,UV reports the highest number of light absorption measurements in characterizing ambient aerosols, which essentially drives the filter movement due to the fastest ATN increase (Drinovec et al., 2015). We also identified that MA300's babs,UV showed an underestimating linear relationship with AE33 during the wildfire period, with the highest unit-to-unit variability. It was previously identified that PTFE-filter-based micro-aethalometers (as in MA300) were susceptible to deviations in light absorption measurements irrespective of a clean or aerosol-loaded filter spot (Düsing et al., 2019). In our study, all three MA300s were subjected to strong loading effects (Table S6) in addition to RH changes (45 % to 95 %) during the sampling periods. Being a near-road emission measurement site, our measurements captured complex aerosol mixtures of various mixing states. During the regular period, local traffic during the daytime contributes to fresh BC-enriched aerosols, which can be hydrophobic in nature (Sarangi et al., 2019; Wang et al., 2020), and by nighttime, these fresh BC-enriched aerosols can evolve by ageing and change their morphological and optical properties. In contrast, during the wildfire-smoke-affected days, the measurement site experienced enhanced quantities of aged aerosols through long-range transport from the Pacific Northwest. These claims align with our calculated α values, as shown in Fig. 3. With the abundance of organic aerosol components during wildfire days, coated BC particles have been found to dominate and often enhance light absorption in lower wavelengths due to the presence of BrC (Healy et al., 2015). These wildfire-smoke-affected BC particles can be mixed with a significant fraction of secondary organics, which can be hygroscopic in nature (Wang et al., 2020). In MA300, sampling hygroscopic aerosols during the wildfire-smoke-affected days can lead to interactions with water vapour and filter materials, which can significantly impact the UV-channel light absorption measurements (Düsing et al., 2019).
Given these challenges with the UV channel, the blue–IR channel pairing can be considered an alternative for source apportionment (Zotter et al., 2017; Deng et al., 2020), and MA300 photometer measurements from the blue channel were more accurate and precise as compared to the UV channel. To assess source apportionment performance at distinguishing biomass-burning-derived (BB) and fossil-fuel-derived (FF) eBC, we use babs data from both artifact correction mechanisms (MA300 onboard and modified Drinovec) and two-wavelength pairs (UV–IR and blue–IR). In literature, the uncertainty in using the aethalometer model has been explored (Garg et al., 2016; Zotter et al., 2017; Healy et al., 2019) in detail. With the aim to evaluate the SA performance of MA300 units, we consider AE33's SA results as true apportioned results and have been discussed in Sect. 3.5.1. Next, in Sect. 3.5.2, we discuss the relative comparison of MA300's output with respect to AE33.
3.5.1 Aethalometer model results from AE33
This section explores the source apportionment (SA) results from the aethalometer model (Sandradewi et al., 2008b) adopted in the reference device, AE33. Figure 5 shows the diurnal variation of AE33-reported eBC concentration and its contribution from eBCbb, eBCff, and percentage contribution of eBCbb to the total eBC (BB(%)) during the measurement period using both the UV–IR and blue–IR method. The diurnal variation of eBC components is consistent with patterns observed in previous studies (Rajesh and Ramachandran, 2017; Healy et al., 2019; Deng et al., 2020), with increased concentration of eBCff during the morning and evening hours coinciding with peak traffic flows and likely contributions from fresh diesel emissions. Using the UV–IR-based SA method (Fig. 5a, b), daily eBCff concentrations were in the range of 0.6–1.9 µg m−3 during the regular period and in 1.0–3.8 µg m−3 during the wildfire period. eBCbb concentrations were found to be in the range of 0.1–0.2 µg m−3 during the regular period and 1.3–2.6 µg m−3 during the wildfire period. The calculated percentage contribution of eBCbb to total eBC emissions (BB %) was 9 %–20 % during the regular period and 31 %–60 % during the wildfire period. Even though the traffic emissions dominated the location of aerosol sampling, the biomass burning contributions in the regular period have been previously hypothesized to originate from local household wood burning sources (Healy et al., 2019), with the highest concentrations during the evening to late night.
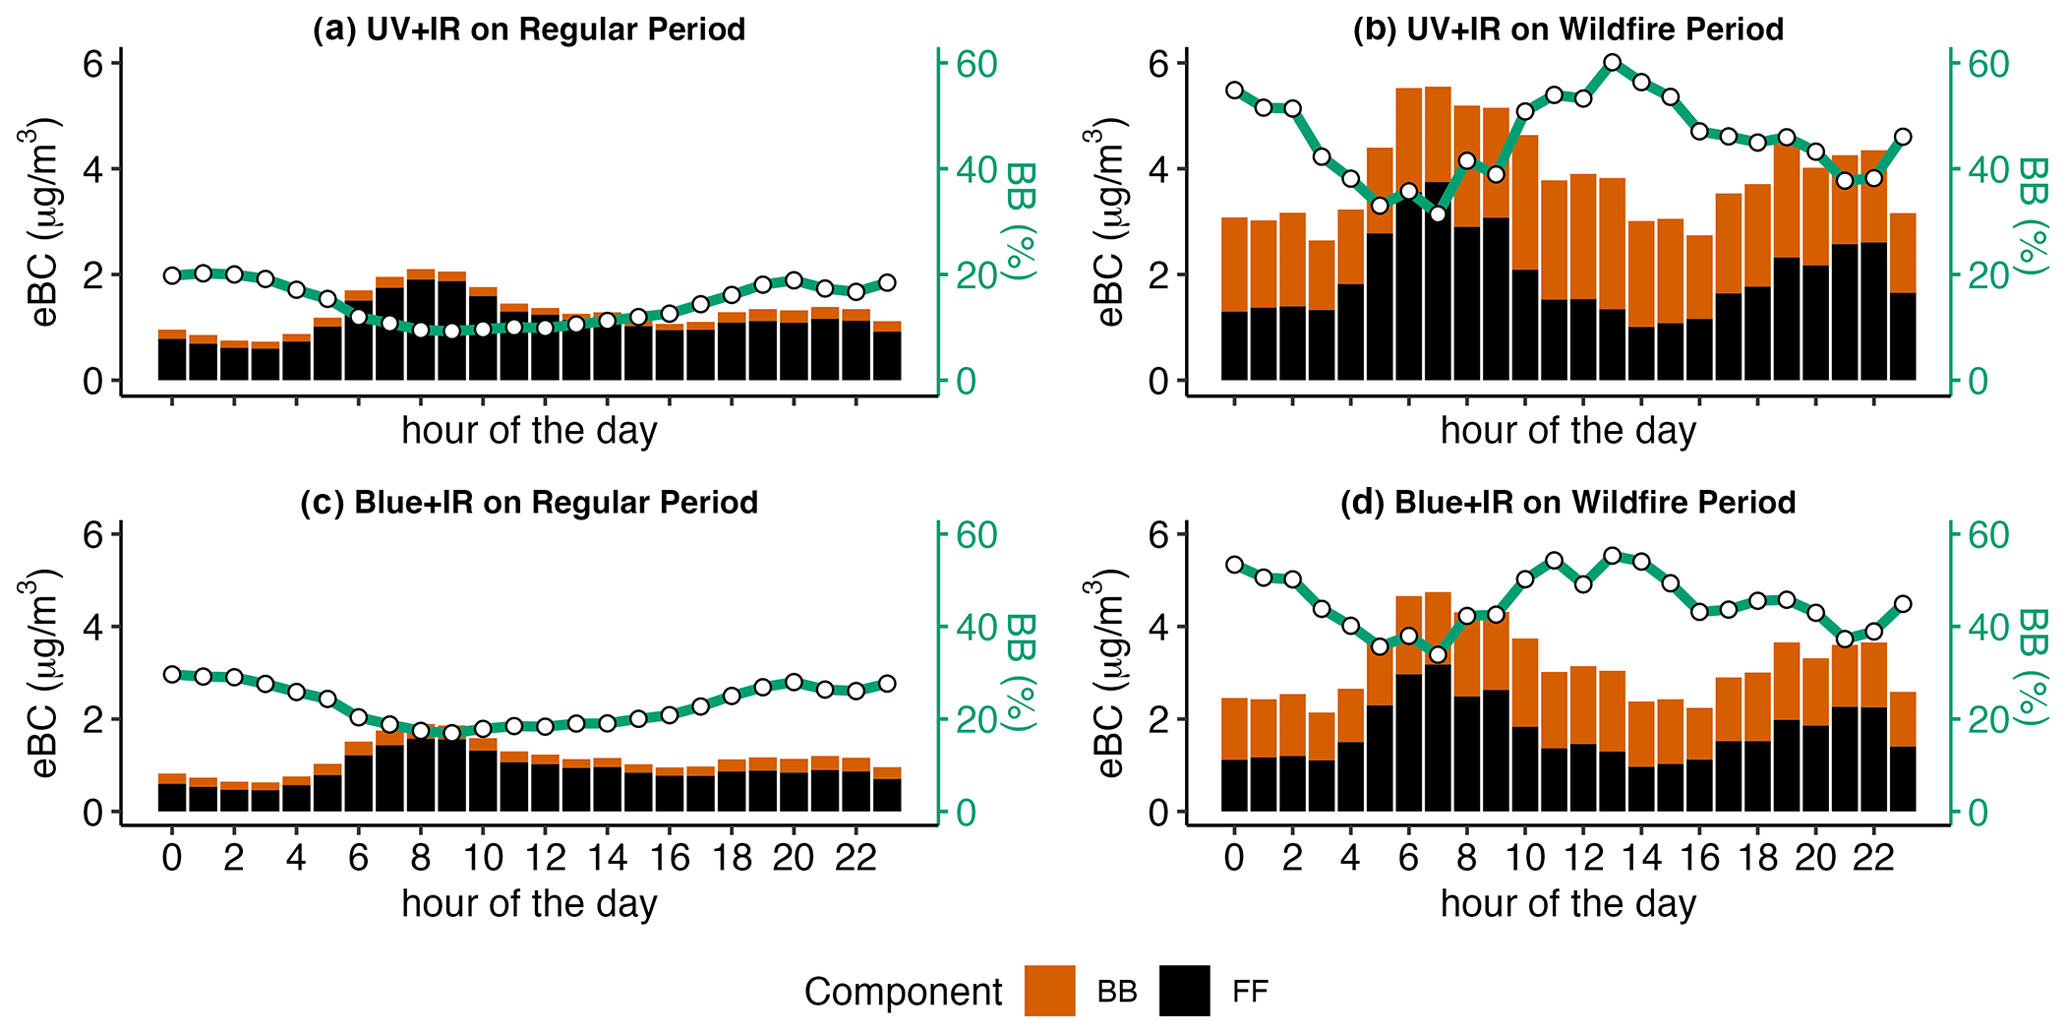
Figure 5Diurnal variation of AE33-reported eBC contribution from BB and FF sources during regular (reg) days and wildfire-smoke-affected (wildfire) days. Panels (a) and (b) are for the UV–IR pairs, and panels (c) and (d) are for the blue–IR pairs. Wildfire-smoke-affected days are in panels (b) and (d), and regular days are in panels (a) and (c). The green line (right axis) represents the percentage of eBC mass from biomass burning during the measurement period.
During the wildfire period, the enhanced eBC concentration was heavily influenced by the biomass burning components, eBCbb; however, we hypothesize that the enhancement of eBCff may be due to two major factors. Firstly, there may have been a real increase in the number of heavy-duty vehicles during the early morning and evening hours that coincided with the wildfire period, increasing the eBC emission from fossil-fuel-based sources. Secondly, during wildfire-smoke-affected days, aerosols can be a complex mixture of fresh and highly aged components, and the presence of BrC (Wang et al., 2019) and the lensing effect (Healy et al., 2015) has been found to impact the bulk aerosol light absorption measurements, particularly in the lower wavelengths. Hence, using a fixed pair of α for the source apportionment model could not accurately separate eBC in two components (Garg et al., 2016). To verify the impact of seasonality on eBCff during the wildfire period source apportionment results, we considered two additional week-long periods (24–30 August and 14–20 October) before and after the wildfire-smoke-affected period (Fig. S12). We found that the fossil fuel component dominated the eBC mass throughout the day, and the eBCff range was similar to the regular period. We find a slight difference (increase in pre-wildfire period) in the eBCff concentrations in the late-night hours. Both pre- and post-wildfire weeks followed almost similar diurnal eBCff profile as the regular period. Hence, no seasonality in eBCff was identified with this analysis. From the unidentified seasonality in eBCff, we speculate that the calculated contribution of eBCff during the wildfire period increases as the overall eBC increases, even if the eBC is estimated from a highly mixed environment.
Blue–IR-based results (Fig. 5c, d) show that absolute eBCff mass concentration tends to be lower by 16 % on average (20 % during the regular and 14 % during the wildfire period) as compared to UV–IR results. On the contrary, absolute eBCbb concentrations derived from blue–IR-based SA showed mixed responses – underestimated by 21 % during the wildfire period and overestimated by 41 % (Fig. S5). When the normalized concentration of SA components was compared found, good agreement (slope = 0.97–1.02, R2 = 0.93–1) was found in the results from the blue–IR pair with the UV–IR pair. It is important to note that derived absolute eBCff and eBCbb components are dependent on the absolute babs inputs in the aethalometer model, and inherently, babs,UV measurements are higher than babs,blue. The effect of different input levels of babs and α pair on the aethalometer model was explored through a sensitivity analysis and has been presented in Figs. S10 and S11. For test purposes, we used AE33's mean babs concentrations for UV, blue, and IR channels from the regular and wildfire period, with αbb in the range 1.6–3.0 and αff in the range 0.8–1.5. Sensitivity analysis results show that apportioned babs,bb and babs,ff can often get negative values or values even higher than the input babs,IR values, which is an established flaw of the aethalometer model (Grange et al., 2020). For a clean environment, lower babs input can cause large errors in the estimates of babs,bb and babs,ff. Hence, we claim that source apportionment should not be conducted below the MDL (minimum detection limit) of the black carbon concentration, which has been found to be 0.21 µg m−3 for MA300. For babs,UV of 29 Mm−1 and babs,IR of 10 Mm−1 (which is the AE33's average measurement value during the regular period), we find that babs,bb values are mostly negative or very close to zero (Fig. S10a). On the other hand, babs,ff gets overestimated for larger combinations of α pair (Fig. S10b). Results from our assumed α pair performed well. Using the blue–IR pair (Fig. S11), babs,bb and babs,ff were found to show a wider range of positive estimates for different combinations of α pair.
3.5.2 Comparison of aethalometer model results from MA300 and AE33
In this section, we compare the diurnal characteristics of apportioned eBC components from MA300 with respect to AE33. For each SA approach (wavelength pairings: UV–IR or blue–IR) and correction methods applied (MA300's onboard or Drinovec), we calculated the percentage difference (between MA300 and AE33) of the absolute eBCbb, eBCff and BB(%) values, for the two periods (regular and wildfire) separately. In Fig. 6, we present the outcomes of MA300's onboard corrected results. The percentage difference of apportioned parameters for the modified Drinovec-corrected responses is presented in Fig. S13. The diurnal profiles of the apportioned components of MA300 eBC (average of the three units) were calculated and are provided in the Supplement (Fig. S6). From the diurnal patterns of MA300's SA results, we identify that the UV–IR-based absolute eBCff mass concentrations were in the range of 0.7–1.7 and 1.8–3.9 µg m−3 during the regular and wildfire period respectively. This range changed to 0.6–1.5 and 1.5–3.3 µg m−3 for the regular and wildfire periods, respectively, when the blue–IR SA method was applied. For eBCbb, the absolute concentration ranges were 0.1–0.16 µg m−3 during the regular period and 0.8–1.7 µg m−3 during the wildfire period for UV–IR-based SA and 0.1–0.2 µg m−3 during the regular period and 0.7–1.4 µg m−3 during the wildfire period for blue–IR-based SA. Adapting the blue–IR wavelength pair on MA300 had a similar effect on under-/overestimation of absolute eBC components as observed for AE33 (Fig. S5), suggesting that the influence of wavelength pair selection is consistent across instrument types. In Table S5, we summarized the calculated diurnal mean and standard deviation of different SA results from the instruments. From Fig. 7, we find that the MA300 eBC components were mostly underestimated as compared to AE33's apportioned concentration. During the regular period, MA300-reported eBCbb was underestimated by up to 50 % to the AE33's data. However, the difference in eBCff was found to become occasionally positive and were within ±40 %. Late-night periods with low traffic conditions (i.e. fewer eBCff sources) may present challenges for MA300 data collection and contribute to overestimation of eBCff. The benefits of using the blue–IR-based SA method on MA300s are most evident during the wildfire period. By adopting blue–IR-based SA instead of UV–IR wavelength, we find improved (lowering difference in MA300 to AE33) source characterization results by MA300s. The percentage difference reduces from −44 % to −33 %, 44 % to 37 %, and −42 % to −34 % for eBCbb concentration, eBCff concentration, and BB(%) respectively. We see a similar improvement in the Drinovec-corrected MA300 data; however, as previously noted, the concentration profile for Drinovec-corrected MA300 data is susceptible to noise. Figure 7 also shows how the percentage difference between MA300 and AE33 source characterization varies diurnally. The highest differences in the eBCff were observed during low traffic periods, which are likely to have increased uncertainty as babs measurements might fall beyond the detection limit (Backman et al., 2017). From the Drinovec-corrected SA results, we find that the diurnal range percentage difference (Fig. S13) in eBC components was higher during the wildfire period. This observation aligns with the previously estimated increased errors in Drinovec-corrected data, offsetting the SA results from AE33. The impact of additional noise in MA300's SA results by Drinovec correction can also be visible in hours with low concentration, particularly during the regular period. However, the blue–IR-based SA on Drinovec-corrected data reduces the percentage difference of MA300's eBC components from AE33.
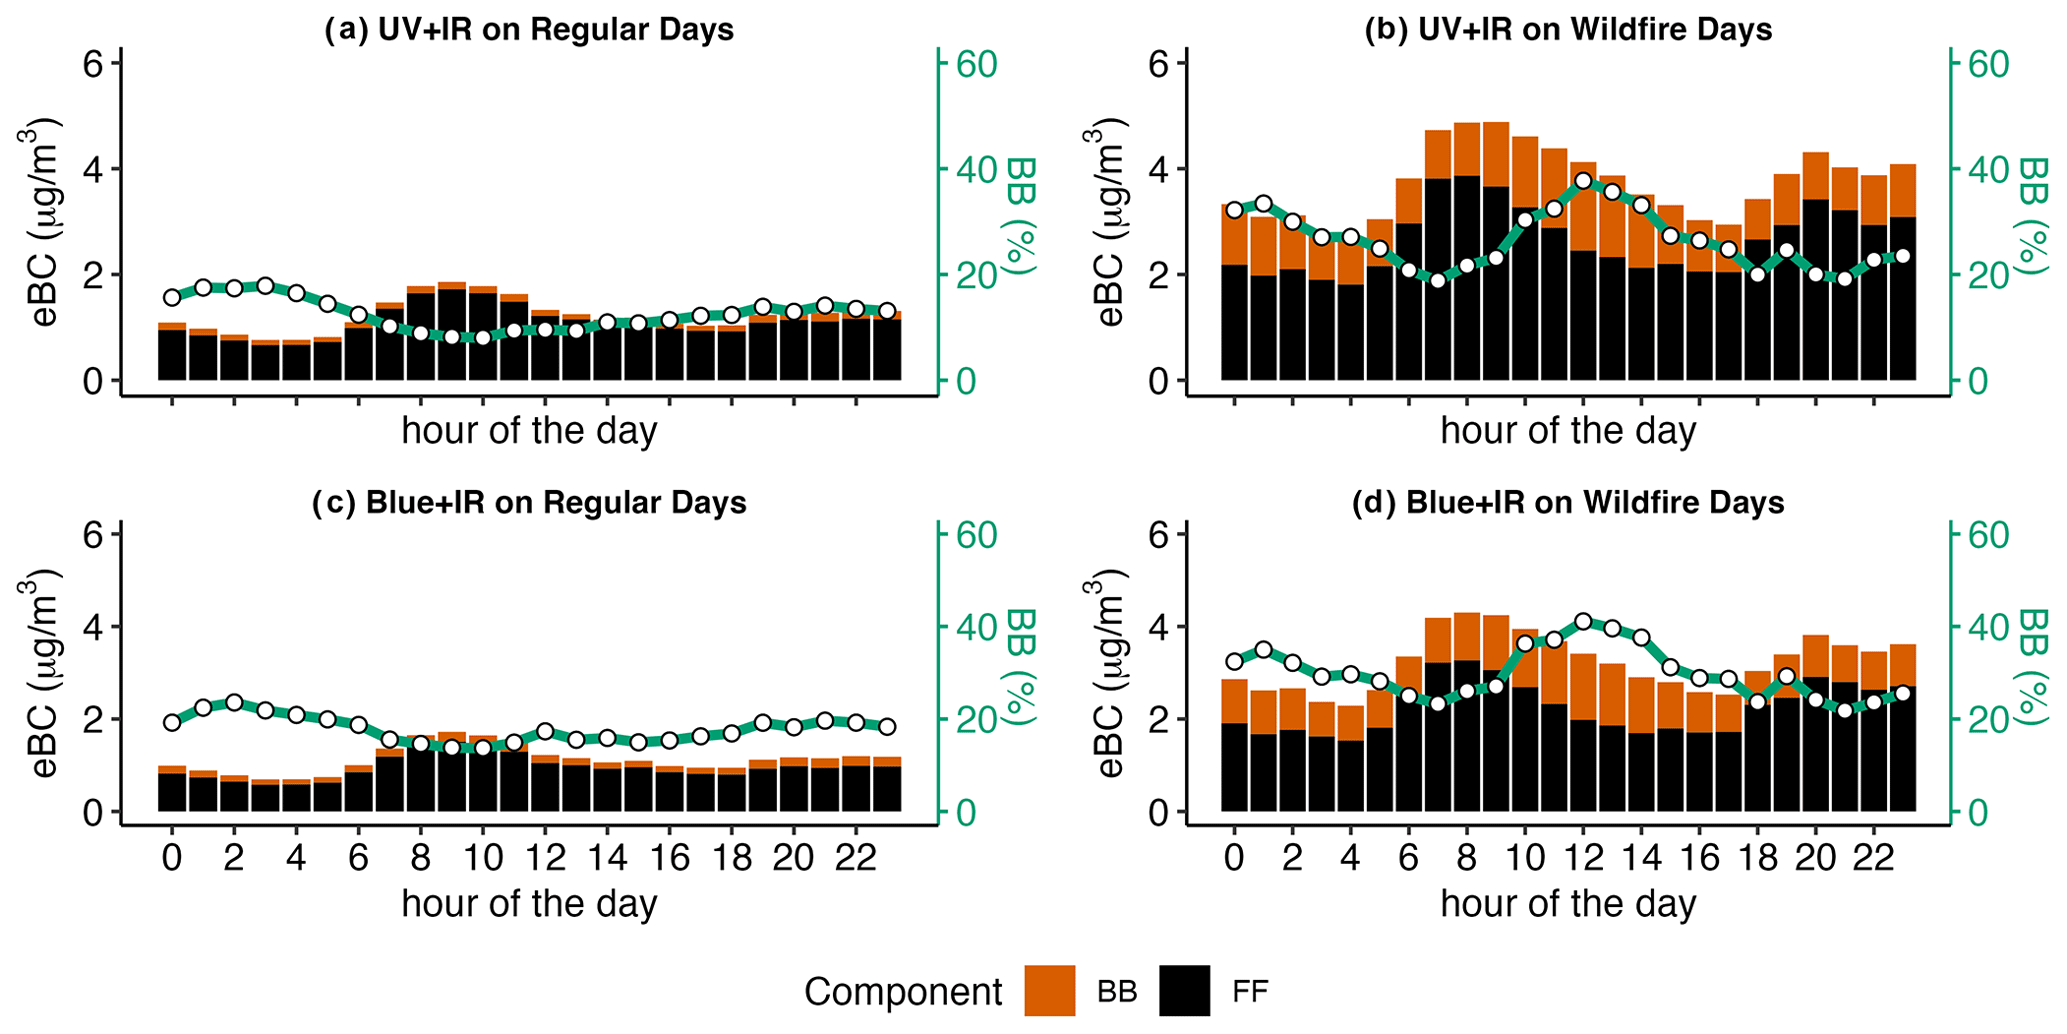
Figure 6Diurnal variation of MA300-reported (onboard corrected) eBC contribution from BB and FF sources during regular (reg) days and wildfire-smoke-affected (wildfire) days. Panels (a) and (b) are for the UV–IR pairs, and panels (c) and (d) are for the blue–IR pairs. Wildfire-smoke-affected days are in panels (b) and (d), and regular days are in panels (a) and (c). The green line (right axis) represents the percentage of eBC mass from biomass burning during the measurement period.

Figure 7Percentage difference of hourly SA results in between MA300 and AE33. For MA300s, the average of onboard corrected data for the two periods (regular and wildfire). SA results from UV–IR and blue–IR wavelength pairs have been evaluated separately.
In this study, we have characterized the performance of the MA300 micro-aethalometer against the AE33 aethalometer, identifying potential strengths and limitations given different monitoring needs and user focus. We find that multi-wavelength micro-aethalometers can be used in several contexts. With the growing number of studies using MA-series micro-aethalometers (MA200, MA300, and MA350), we try to assess MA300's capability in estimating eBC concentration in real-world environments and MA300's unit-to-unit variability in assessing eBC concentrations, as well as multi-wavelength absorption coefficients and MA300's source apportionment capabilities.
Overall, we found that MA300s were able to reproduce the trends in eBC concentration in both regular and wildfire periods, as compared to the reference-grade AE33. However, we identify that the MA300-reported concentrations were lower by 13 % when compared against the reference AE33's results. The underestimation by MA300 can be attributed to measurement uncertainty arising from sensor performance, differences in wavelength-fixed MAC values, and differences in the onboard correction algorithms. This underestimation could be addressed by applying post-analysis correction/calibration. The range of observed concentrations and unit-to-unit variation are also important factors to take into account in the design of a sampling strategy. In the study region, on days with good air quality, observed concentrations can be lower the than the instrument's limit of detection (LOD; Backman et al., 2017). As the MA300 is a low-flow instrument, while the AE33 is a high-flow one, the MA300 is less sensitive to minor temporal changes in eBC concentration. The inherent noise (from particle-free air) from the two MA300 units was found to be between 0.04 and 0.163 µg m−3, much higher (1.25–5.1 times) than the AE33-reported noise estimates and can contribute to the measurement error estimates. This can lead to increased measurement error in comparatively cleaner environments. Since MA300 operates at very low-flow conditions, we regularly audited and calibrated the flow (twice a month), and we recommend that MA300 users conduct routine flow audits while doing continuous sampling, particularly in a highly polluted environment. The absolute error (MAE) of eBC measurement from MA300 (compared to the AE33) can be in the range of 0.42–0.97 µg m−3 depending upon the measurement period. We observe larger MAE during high-pollution conditions (e.g. wildfire period in this study). Based on these findings, caution may be required when MA300s are used to capture spatial or temporal differences in absolute eBC measurements below the 0.97 µg m−3 threshold. However, this can not be treated as a limit of detection for MA300 but a concentration level to identify meaningful differences in measurement. In this study, we calculated the hourly concentration of eBC by time-integrating the instrument's data collection frequency of 1 min and found that the hourly averaged eBC concentrations from individual MA300 units were well correlated with the reference measurements. In future applications of the MA300, trade-offs between high temporal resolution and increased noise should be considered (Liu et al., 2021; Hagler et al., 2011), recognizing that temporal integration can alleviate the unit-specific measurement noise. From the MA300's raw photometer readings, we identified the presence of instrumental drift across the units, which was not present in AE33. In data post-processing, we choose to eliminate these drifted signal points by considering them outliers. We recommend that future MA300 users verify the raw photometer readings for better data estimations, particularly during high-frequency data collection. The presence of drift determines the quality of light absorption measurement, and the instrument's onboard algorithm does not eliminate such drifted signals, which can be due to the physical operation of the instrument, such as filter tape change (Drinovec et al., 2015) or due to environmental factors (Düsing et al., 2019).
We explored the application of the latest non-linear aethalometer loading correction protocols in the MA300 by adopting a modified Drinovec correction method but found increased noise in MA300 babs estimates across the spectra as a result. In dual-spot aethalometers, loading correction algorithms can be made robust and scientifically accurate by considering the transient effect of filter change, filter-specific scattering correction parameter, flow leakage, and measurement discontinuity due to filter change, which has been thoroughly considered in the algorithm proposed by Drinovec et al. (2015) and developed for model AE33. We applied a modified version of Drinovec's algorithm to MA300 raw data and identified obstacles to its effective adoption in this instrument. We hypothesize that inconsistency in flow fluctuation in MA300 is a key roadblock in deriving the real-time loading correction parameter.
Characterizing unit-to-unit variability can speak of instrument precision and may be particularly important for use cases where multiple MA300s are simultaneously deployed to measure a pollution event. We reported the precision of MA300 eBC in terms of unit-to-unit variability (based on normalized responses) as 5 %. This value is slightly higher than that reported for other aethalometer models: 4.3 % for AE31 (Müller et al., 2011) and 0.5 % for AE33 (Cuesta-Mosquera et al., 2021). This variability can increase to 21 % when absolute measurements are considered, reflecting individual instruments' sensitivity and noise characteristics affecting precision. For the multi-wavelength babs, the highest unit-to-unit variability was found in the UV channel (8 %) with large instrumental noise, which is consistent with previous studies on multi-wavelength aethalometers (Cuesta-Mosquera et al., 2021; Müller et al., 2011). The unit-to-unit variability in the UV channel was not identified to be significantly varying with filter loading impacts and hence could be occurring due to problems associated with LED light sources or detectors.
Derived absorption Ångström exponent (α) values were found to follow a diurnal variability from both MA300 and AE33, following a source-specific pattern. Traffic emissions dominated regular period days, and α values were found to be the lowest (during peak traffic hours) and close to 1. Even though babs measurements have contributed to large variability in MA300's α values, the source-specific changes were clearly visible, particularly in identifying the differences in freshly emitted aerosols (with fossil fuel sources) or aged aerosols.
This study did not take into account the lensing effect of BC, which has been identified as being particularly relevant during wildfire periods (Healy et al., 2015) and can impact the light absorption coefficient measurement. Evaluating how lensing impacts the babs measurements of MA300 is an important area for future work.
From the five-wavelength light absorption measurements, we found that the UV channel was strongly underestimated (18 %) and experienced the highest amount of measurement error (average MAE of 45 Mm−1 during the wildfire period). Light absorption measurements in the UV channel can also be sensitive to interference from the volatile to semi-volatile organic compounds on the filter tape (Vecchi et al., 2014) or from the other light-absorbing non-BC combustion particles, which affect lower wavelengths more than higher ones. Hence, using UV and IR channels for eBC source apportionment may be less reliable, particularly during high-pollution events. As an alternative technique, we tested the blue- and IR-channel-based source apportionment results. The UV–IR-based SA method on MA300's onboard corrected data tends to underestimate eBCff and eBCbb mass concentrations; however, the relative contribution estimates remain comparable during the regular period. In the wildfire period, due to discrepancies observed in UV channel's babs, 44 % underestimation of eBCbb and 44 % overestimation of eBCff were identified. Including blue–IR-based SA resulted in better estimates of eBCbb and eBCff concentrations, 10 % improvement in eBCbb and 7 % improvement in eBCff. However, it is important to note that switching to blue–IR from UV–IR may lead to a difference in the estimation of components – which can be corrected by calibration with a site-specific reference grade eBC monitoring system (such as AE33). For spatial source apportionment study across a region, several micro-aethalometers (like MA300s) can be utilized for localized monitoring, along with a centralized state-of-the-art reference aethalometer. This can be helpful to determine the estimated change in eBC components when the wavelength pair is changed and improve the data quality of spatio-temporal source evaluation of eBC.
The data associated with this article are available at https://doi.org/10.5683/SP3/DRQBUY (Chakraborty et al., 2022). Code can be requested via the given corresponding e-mail address.
The supplement related to this article is available online at: https://doi.org/10.5194/amt-16-2333-2023-supplement.
The authors MC, AG, and NZ were responsible for the conceptualization of the study. Data collection, data analysis, and the methodology development were led by MC, under the supervision of NZ and AG. Any software for processing and evaluating the data was written by MC. All figures were produced by MC. The original draft of the paper was written by MC. The review and editing of the paper were done by AG and NZ.
The contact author has declared that none of the authors has any competing interests.
Publisher's note: Copernicus Publications remains neutral with regard to jurisdictional claims in published maps and institutional affiliations.
We would like to thank Sakshi Jain and Melanie MacArthur for helping with instrument setup and data acquisition troubleshooting. We acknowledge Ken Reid and Johnny Le from Metro Vancouver for helping with the co-location campaign at the Clark Drive site. We are grateful to receive support from Air Quality and Climate Change, Metro Vancouver Regional District, Burnaby, Canada. We are thankful to Luka Drinovec for the introduction to the AE33's compensation algorithm. We would also like to express our sincere thanks to Steven Rogak for his valuable support in conducting the preliminary laboratory experiment.
This research has been supported by the Natural Sciences and Engineering Research Council of Canada (grant nos. RGPIN-2018-04582 and RGPIN-2018-04893) and the Science and Engineering Research Board (Overseas Doctoral Fellowship). This research was undertaken, in part, thanks to funding from the Canada Research Chairs Program.
This paper was edited by Pierre Herckes and reviewed by R Subramanian and one anonymous referee.
Alas, H. D. C., Müller, T., Weinhold, K., Pfeifer, S., Glojek, K., Gregorič, A., Močnik, G., Drinovec, L., Costabile, F., Ristorini, M., and Wiedensohler, A.: Performance of microAethalometers: Real-world Field Intercomparisons from Multiple Mobile Measurement Campaigns in Different Atmospheric Environments, Aerosol Air Qual. Res., 20, 2640–2653, https://doi.org/10.4209/aaqr.2020.03.0113, 2020. a, b, c, d, e
Apte, J. S., Kirchstetter, T. W., Reich, A. H., Deshpande, S. J., Kaushik, G., Chel, A., Marshall, J. D., and Nazaroff, W. W.: Concentrations of fine, ultrafine, and black carbon particles in auto-rickshaws in New Delhi, India, Atmos. Environ., 45, 4470–4480, https://doi.org/10.1016/j.atmosenv.2011.05.028, 2011. a
Aurell, J., Gullett, B., Holder, A., Kiros, F., Mitchell, W., Watts, A., and Ottmar, R.: Wildland fire emission sampling at Fishlake National Forest, Utah using an unmanned aircraft system, Atmos. Environ., 247, 118193, https://doi.org/10.1016/j.atmosenv.2021.118193, 2021. a, b
Backman, J., Schmeisser, L., Virkkula, A., Ogren, J. A., Asmi, E., Starkweather, S., Sharma, S., Eleftheriadis, K., Uttal, T., Jefferson, A., Bergin, M., Makshtas, A., Tunved, P., and Fiebig, M.: On Aethalometer measurement uncertainties and an instrument correction factor for the Arctic, Atmos. Meas. Tech., 10, 5039–5062, https://doi.org/10.5194/amt-10-5039-2017, 2017. a, b, c
Bauer, J. J., Yu, X.-Y., Cary, R., Laulainen, N., and Berkowitz, C.: Characterization of the Sunset Semi-Continuous Carbon Aerosol Analyzer, J. Air Waste Manage., 59, 826–833, https://doi.org/10.3155/1047-3289.59.7.826, 2009. a
Bernardoni, V., Ferrero, L., Bolzacchini, E., Forello, A. C., Gregorič, A., Massabò, D., Močnik, G., Prati, P., Rigler, M., Santagostini, L., Soldan, F., Valentini, S., Valli, G., and Vecchi, R.: Determination of Aethalometer multiple-scattering enhancement parameters and impact on source apportionment during the winter 2017/18 EMEP/ACTRIS/COLOSSAL campaign in Milan, Atmos. Meas. Tech., 14, 2919–2940, https://doi.org/10.5194/amt-14-2919-2021, 2021. a, b, c, d, e, f
Blanco-Donado, E. P., Schneider, I. L., Artaxo, P., Lozano-Osorio, J., Portz, L., and Oliveira, M. L. S.: Source identification and global implications of black carbon, Geosci. Front., 13, 101149, https://doi.org/10.1016/j.gsf.2021.101149, 2022. a, b
Bond, T. C. and Bergstrom, R. W.: Light absorption by carbonaceous particles: An investigative review, Aerosol Sci. Tech., 40, 27–67, https://doi.org/10.1080/02786820500421521, 2006. a, b, c
Carslaw, D. C. and Ropkins, K.: openair – An R package for air quality data analysis, Environ. Model. Softw., 27-28, 52–61, https://doi.org/10.1016/j.envsoft.2011.09.008, 2012. a
Chakraborty, M., Giang, A., and Zimmerman, N.: Performance evaluation of portable dual-spot micro-aethalometers for source identification of Black Carbon aerosols: Application to wildfire smoke and traffic emissions in the Pacific Northwest, Borealis, V1 [data set], https://doi.org/10.5683/SP3/DRQBUY, 2022. a
Cuesta-Mosquera, A., Močnik, G., Drinovec, L., Müller, T., Pfeifer, S., Minguillón, M. C., Briel, B., Buckley, P., Dudoitis, V., Fernández-García, J., Fernández-Amado, M., Ferreira De Brito, J., Riffault, V., Flentje, H., Heffernan, E., Kalivitis, N., Kalogridis, A.-C., Keernik, H., Marmureanu, L., Luoma, K., Marinoni, A., Pikridas, M., Schauer, G., Serfozo, N., Servomaa, H., Titos, G., Yus-Díez, J., Zioła, N., and Wiedensohler, A.: Intercomparison and characterization of 23 Aethalometers under laboratory and ambient air conditions: procedures and unit-to-unit variabilities, Atmos. Meas. Tech., 14, 3195–3216, https://doi.org/10.5194/amt-14-3195-2021, 2021. a, b, c, d, e, f
Deng, J., Guo, H., Zhang, H., Zhu, J., Wang, X., and Fu, P.: Source apportionment of black carbon aerosols from light absorption observation and source-oriented modeling: an implication in a coastal city in China, Atmos. Chem. Phys., 20, 14419–14435, https://doi.org/10.5194/acp-20-14419-2020, 2020. a, b, c
Drinovec, L., Močnik, G., Zotter, P., Prévôt, A. S. H., Ruckstuhl, C., Coz, E., Rupakheti, M., Sciare, J., Müller, T., Wiedensohler, A., and Hansen, A. D. A.: The ”dual-spot” Aethalometer: an improved measurement of aerosol black carbon with real-time loading compensation, Atmos. Meas. Tech., 8, 1965–1979, https://doi.org/10.5194/amt-8-1965-2015, 2015. a, b, c, d, e, f, g, h, i, j, k, l, m, n, o, p, q, r, s
Duc, H. N., Shingles, K., White, S., Salter, D., Chang, L. T.-C., Gunashanhar, G., Riley, M., Trieu, T., Dutt, U., Azzi, M., Beyer, K., Hynes, R., and Kirkwood, J.: Spatial-Temporal Pattern of Black Carbon (BC) Emission from Biomass Burning and Anthropogenic Sources in New South Wales and the Greater Metropolitan Region of Sydney, Australia, Atmosphere, 11, 570, https://doi.org/10.3390/atmos11060570, 2020. a
Düsing, S., Wehner, B., Müller, T., Stöcker, A., and Wiedensohler, A.: The effect of rapid relative humidity changes on fast filter-based aerosol-particle light-absorption measurements: uncertainties and correction schemes, Atmos. Meas. Tech., 12, 5879–5895, https://doi.org/10.5194/amt-12-5879-2019, 2019. a, b, c
Filonchyk, M., Peterson, M. P., and Sun, D.: Deterioration of air quality associated with the 2020 US wildfires, Sci. Total Environ., 826, 154103, https://doi.org/10.1016/j.scitotenv.2022.154103, 2022. a
Garg, S., Chandra, B. P., Sinha, V., Sarda-Esteve, R., Gros, V., and Sinha, B.: Limitation of the Use of the Absorption Angstrom Exponent for Source Apportionment of Equivalent Black Carbon: a Case Study from the North West Indo-Gangetic Plain, Environ. Sci. Technol., 50, 814–824, https://doi.org/10.1021/acs.est.5b03868, 2016. a, b, c, d, e
Géron, A.: Hands-On Machine Learning with Scikit-Learn, Keras, and TensorFlow, O'Reilly Media, Inc., google-Books-ID: X5ySEAAAQBAJ, ISBN 9781492032649, 2022. a
Goel, V., Hazarika, N., Kumar, M., Singh, V., Thamban, N. M., and Tripathi, S. N.: Variations in Black Carbon concentration and sources during COVID-19 lockdown in Delhi, Chemosphere, 270, 129435, https://doi.org/10.1016/j.chemosphere.2020.129435, 2021. a
Grange, S. K., Lötscher, H., Fischer, A., Emmenegger, L., and Hueglin, C.: Evaluation of equivalent black carbon source apportionment using observations from Switzerland between 2008 and 2018, Atmos. Meas. Tech., 13, 1867–1885, https://doi.org/10.5194/amt-13-1867-2020, 2020. a, b, c
Gundel, L. A., Dod, R. L., Rosen, H., and Novakov, T.: The relationship between optical attenuation and black carbon concentration for ambient and source particles, Sci. Total Environ., 36, 197–202, https://doi.org/10.1016/0048-9697(84)90266-3, 1984. a
Hagler, G. S., Yelverton, T. L., Vedantham, R., Hansen, A. D., and Turner, J. R.: Post-processing method to reduce noise while preserving high time resolution in aethalometer real-time black carbon data, Aerosol Air Qual. Res., 11, 539–546, https://doi.org/10.4209/aaqr.2011.05.0055, 2011. a, b
Hansen, A. D., Rosen, H., and Novakov, T.: The aethalometer – An instrument for the real-time measurement of optical absorption by aerosol particles, Sci. Total Environ., 36, 191–196, https://doi.org/10.1016/0048-9697(84)90265-1, 1984. a, b, c
Healy, R. M., Wang, J. M., Jeong, C. H., Lee, A. K., Willis, M. D., Jaroudi, E., Zimmerman, N., Hilker, N., Murphy, M., Eckhardt, S., Stohl, A., Abbatt, J. P., Wenger, J. C., and Evans, G. J.: Light-absorbing properties of ambient black carbon and brown carbon from fossil fuel and biomass burning sources, J. Geophys. Res., 120, 6619–6633, https://doi.org/10.1002/2015JD023382, 2015. a, b, c, d, e, f
Healy, R. M., Sofowote, U., Su, Y., Debosz, J., Noble, M., Jeong, C. H., Wang, J. M., Hilker, N., Evans, G. J., Doerksen, G., Jones, K., and Munoz, A.: Ambient measurements and source apportionment of fossil fuel and biomass burning black carbon in Ontario, Atmos. Environ., 161, 34–47, https://doi.org/10.1016/j.atmosenv.2017.04.034, 2017. a, b, c, d, e, f, g
Healy, R. M., Wang, J. M., Sofowote, U., Su, Y., Debosz, J., Noble, M., Munoz, A., Jeong, C.-H., Hilker, N., Evans, G. J., and Doerksen, G.: Black carbon in the Lower Fraser Valley, British Columbia: Impact of 2017 wildfires on local air quality and aerosol optical properties, Atmos. Environ., 217, 116976, https://doi.org/10.1016/j.atmosenv.2019.116976, 2019. a, b, c, d, e, f, g, h, i, j, k, l
Helin, A., Niemi, J. V., Virkkula, A., Pirjola, L., Teinilä, K., Backman, J., Aurela, M., Saarikoski, S., Rönkkö, T., Asmi, E., and Timonen, H.: Characteristics and source apportionment of black carbon in the Helsinki metropolitan area, Finland, Atmos. Environ., 190, 87–98, https://doi.org/10.1016/j.atmosenv.2018.07.022, 2018. a
Helin, A., Virkkula, A., Backman, J., Pirjola, L., Sippula, O., Aakko-Saksa, P., Väätäinen, S., Mylläri, F., Järvinen, A., Bloss, M., Aurela, M., Jakobi, G., Karjalainen, P., Zimmermann, R., Jokiniemi, J., Saarikoski, S., Tissari, J., Rönkkö, T., Niemi, J. V., and Timonen, H.: Variation of Absorption Ångström Exponent in Aerosols From Different Emission Sources, J. Geophys. Res.-Atmos., 126, e2020JD034094, https://doi.org/10.1029/2020JD034094, 2021. a
Holder, A., Seay, B., Brashear, A., Yelverton, T., Blair, J., and Blair, S.: Evaluation of a multi-wavelength black carbon (BC) sensor, Clean Air Soc. Australia and New ZealandLidcomeA, 2018. a
Jeong, H. and Park, D.: Contribution of time-activity pattern and microenvironment to black carbon (BC) inhalation exposure and potential internal dose among elementary school children, Atmos. Environ., 164, 270–279, https://doi.org/10.1016/j.atmosenv.2017.06.007, 2017. a
Kirchstetter, T. W., Novakov, T., and Hobbs, P. V.: Evidence that the spectral dependence of light absorption by aerosols is affected by organic carbon, J. Geophys. Res.-Atmos., 109, D21208, https://doi.org/10.1029/2004JD004999, 2004. a
Kuula, J., Mäkelä, T., Aurela, M., Teinilä, K., Varjonen, S., González, Ó., and Timonen, H.: Laboratory evaluation of particle-size selectivity of optical low-cost particulate matter sensors, Atmos. Meas. Tech., 13, 2413–2423, https://doi.org/10.5194/amt-13-2413-2020, 2020. a, b
Lack, D. A., Moosmüller, H., McMeeking, G. R., Chakrabarty, R. K., and Baumgardner, D.: Characterizing elemental, equivalent black, and refractory black carbon aerosol particles: a review of techniques, their limitations and uncertainties, Anal. Bioanal. Chem., 406, 99–122, https://doi.org/10.1007/s00216-013-7402-3, 2014. a
Laing, J. R., Jaffe, D. A., and Sedlacek, III, A. J.: Comparison of Filter-based Absorption Measurements of Biomass Burning Aerosol and Background Aerosol at the Mt. Bachelor Observatory, Aerosol Air Qual. Res., 20, 663–678, https://doi.org/10.4209/aaqr.2019.06.0298, 2020. a, b
Li, X., Xiao, M., Xu, X., Zhou, J., Yang, K., Wang, Z., Zhang, W., Hopke, P. K., and Zhao, W.: Light Absorption Properties of Organic Aerosol from Wood Pyrolysis: Measurement Method Comparison and Radiative Implications, Environ. Sci. Technol., 54, 7156–7164, https://doi.org/10.1021/acs.est.0c01475, 2020. a
Liu, X., Hadiatullah, H., Zhang, X., Hill, L. D., White, A. H. A., Schnelle-Kreis, J., Bendl, J., Jakobi, G., Schloter-Hai, B., and Zimmermann, R.: Analysis of mobile monitoring data from the microAeth® MA200 for measuring changes in black carbon on the roadside in Augsburg, Atmos. Meas. Tech., 14, 5139–5151, https://doi.org/10.5194/amt-14-5139-2021, 2021. a, b
Meena, G. S., Mukherjee, S., Buchunde, P., Safai, P. D., Singla, V., Aslam, M. Y., Sonbawne, S. M., Made, R., Anand, V., Dani, K. K., and Pandithurai, G.: Seasonal variability and source apportionment of black carbon over a rural high-altitude and an urban site in western India, Atmos. Pollut. Res., 12, 32–45, https://doi.org/10.1016/j.apr.2020.10.006, 2021. a
Moosmüller, H., Chakrabarty, R. K., Ehlers, K. M., and Arnott, W. P.: Absorption Ångström coefficient, brown carbon, and aerosols: basic concepts, bulk matter, and spherical particles, Atmos. Chem. Phys., 11, 1217–1225, https://doi.org/10.5194/acp-11-1217-2011, 2011. a
Moteki, N., Kondo, Y., Nakayama, T., Kita, K., Sahu, L. K., Ishigai, T., Kinase, T., and Matsumi, Y.: Radiative transfer modeling of filter-based measurements of light absorption by particles: Importance of particle size dependent penetration depth, J. Aerosol Sci., 41, 401–412, https://doi.org/10.1016/j.jaerosci.2010.02.002, 2010. a
Müller, T., Henzing, J. S., de Leeuw, G., Wiedensohler, A., Alastuey, A., Angelov, H., Bizjak, M., Collaud Coen, M., Engström, J. E., Gruening, C., Hillamo, R., Hoffer, A., Imre, K., Ivanow, P., Jennings, G., Sun, J. Y., Kalivitis, N., Karlsson, H., Komppula, M., Laj, P., Li, S.-M., Lunder, C., Marinoni, A., Martins dos Santos, S., Moerman, M., Nowak, A., Ogren, J. A., Petzold, A., Pichon, J. M., Rodriquez, S., Sharma, S., Sheridan, P. J., Teinilä, K., Tuch, T., Viana, M., Virkkula, A., Weingartner, E., Wilhelm, R., and Wang, Y. Q.: Characterization and intercomparison of aerosol absorption photometers: result of two intercomparison workshops, Atmos. Meas. Tech., 4, 245–268, https://doi.org/10.5194/amt-4-245-2011, 2011. a, b, c, d, e
Nguyen, P. D. M., Martinussen, N., Mallach, G., Ebrahimi, G., Jones, K., Zimmerman, N., and Henderson, S. B.: Using Low-Cost Sensors to Assess Fine Particulate Matter Infiltration (PM2.5) during a Wildfire Smoke Episode at a Large Inpatient Healthcare Facility, International Journal of Environmental Research and Public Health, 18, 9811, https://doi.org/10.3390/ijerph18189811, 2021. a
Petzold, A., Ogren, J. A., Fiebig, M., Laj, P., Li, S.-M., Baltensperger, U., Holzer-Popp, T., Kinne, S., Pappalardo, G., Sugimoto, N., Wehrli, C., Wiedensohler, A., and Zhang, X.-Y.: Recommendations for reporting “black carbon” measurements, Atmos. Chem. Phys., 13, 8365–8379, https://doi.org/10.5194/acp-13-8365-2013, 2013. a, b
Rajesh, T. A. and Ramachandran, S.: Characteristics and source apportionment of black carbon aerosols over an urban site, Environ. Sci. Pollut. R., 24, 8411–8424, https://doi.org/10.1007/s11356-017-8453-3, 2017. a, b
Rajesh, T. A. and Ramachandran, S.: Black carbon aerosol mass concentration, absorption and single scattering albedo from single and dual spot aethalometers: Radiative implications, J. Aerosol Sci., 119, 77–90, https://doi.org/10.1016/j.jaerosci.2018.02.001, 2018. a, b, c
Rajesh, T. A., Ramachandran, S., and Dhaker, V. K.: Black carbon aerosols: Relative source strengths of vehicular emissions and residential/open wood burning over an urban and a semi-urban environment, Atmos. Pollut. Res., 12, 101060, https://doi.org/10.1016/j.apr.2021.101060, 2021. a, b, c
Saleh, R., Marks, M., Heo, J., Adams, P. J., Donahue, N. M., and Robinson, A. L.: Contribution of brown carbon and lensing to the direct radiative effect of carbonaceous aerosols from biomass and biofuel burning emissions, J. Geophys. Res.-Atmos., 120, 10285–10296, https://doi.org/10.1002/2015JD023697, 2015. a, b
Sandradewi, J., Prévôt, A. S., Szidat, S., Perron, N., Alfarra, M. R., Lanz, V. A., Weingartner, E., and Baltensperger, U. R.: Using aerosol light abosrption measurements for the quantitative determination of wood burning and traffic emission contribution to particulate matter, Environ. Sci. Technol., 42, 3316–3323, https://doi.org/10.1021/es702253m, 2008a. a, b, c, d, e, f, g, h
Sandradewi, J., Prévôt, A. S. H., Weingartner, E., Schmidhauser, R., Gysel, M., and Baltensperger, U.: A study of wood burning and traffic aerosols in an Alpine valley using a multi-wavelength Aethalometer, Atmos. Environ., 42, 101–112, https://doi.org/10.1016/j.atmosenv.2007.09.034, 2008b. a, b, c, d, e
Sarangi, B., Ramachandran, S., Rajesh, T. A., and Dhaker, V. K.: Black carbon linked aerosol hygroscopic growth: Size and mixing state are crucial, Atmos. Environ., 200, 110–118, https://doi.org/10.1016/j.atmosenv.2018.12.001, 2019. a
Schwarz, J. P., Gao, R. S., Fahey, D. W., Thomson, D. S., Watts, L. A., Wilson, J. C., Reeves, J. M., Darbeheshti, M., Baumgardner, D. G., Kok, G. L., Chung, S. H., Schulz, M., Hendricks, J., Lauer, A., Kärcher, B., Slowik, J. G., Rosenlof, K. H., Thompson, T. L., Langford, A. O., Loewenstein, M., and Aikin, K. C.: Single-particle measurements of midlatitude black carbon and light-scattering aerosols from the boundary layer to the lower stratosphere, J. Geophys. Res.-Atmos., 111, D16207, https://doi.org/10.1029/2006JD007076, 2006. a
Segura, S., Estellés, V., Titos, G., Lyamani, H., Utrillas, M. P., Zotter, P., Prévôt, A. S. H., Močnik, G., Alados-Arboledas, L., and Martínez-Lozano, J. A.: Determination and analysis of in situ spectral aerosol optical properties by a multi-instrumental approach, Atmos. Meas. Tech., 7, 2373–2387, https://doi.org/10.5194/amt-7-2373-2014, 2014. a, b, c, d
Stampfer, O., Austin, E., Ganuelas, T., Fiander, T., Seto, E., and Karr, C. J.: Use of low-cost PM monitors and a multi-wavelength aethalometer to characterize PM2.5 in the Yakama Nation reservation, Atmos. Environ., 224, 117292, https://doi.org/10.1016/j.atmosenv.2020.117292, 2020. a
Szopa, S., Naik, V., Adhikary, B., Artaxo, P., Berntsen, T., Collins, W. D., Fuzzi, S., Gallardo, L., Kiendler-Scharr, A., Klimont, Z., Liao, H., Unger, N., and Zanis, P.: Short-Lived Climate Forcers. In Climate Change 2021: The Physical Science Basis. Contribution of Working Group I to the Sixth Assessment Report of the Intergovernmental Panel on Climate Change, edited by: Masson-Delmotte, V., Zhai, P., Pirani, A., Connors, S. L., Péan, C., Berger, S., Caud, N., Chen, Y., Goldfarb, L., Gomis, M. I., Huang, M., Leitzell, K., Lonnoy, E., Matthews, J. B. R., Maycock, T. K., Waterfield, T., Yelekçi, O., Yu, R., and Zhou, B., Cambridge University Press, Cambridge, United Kingdom and New York, NY, USA, 817–922, https://doi.org/10.1017/9781009157896.008, 2021. a
Tasoglou, A., Subramanian, R., and Pandis, S. N.: An inter-comparison of black-carbon-related instruments in a laboratory study of biomass burning aerosol, Aerosol Sci. Tech., 52, 1320–1331, https://doi.org/10.1080/02786826.2018.1515473, 2018. a, b
Vecchi, R., Bernardoni, V., Paganelli, C., and Valli, G.: A filter-based light-absorption measurement with polar photometer: Effects of sampling artefacts from organic carbon, J. Aerosol Sci., 70, 15–25, https://doi.org/10.1016/j.jaerosci.2013.12.012, 2014. a
Virkkula, A., Mäkelä, T., Hillamo, R., Yli-Tuomi, T., Hirsikko, A., Hämeri, K., and Koponen, I. K.: A Simple Procedure for Correcting Loading Effects of Aethalometer Data, J. Air Waste Manage., 57, 1214–1222, https://doi.org/10.3155/1047-3289.57.10.1214, 2007. a, b, c, d, e, f, g
Virkkula, A., Chi, X., Ding, A., Shen, Y., Nie, W., Qi, X., Zheng, L., Huang, X., Xie, Y., Wang, J., Petäjä, T., and Kulmala, M.: On the interpretation of the loading correction of the aethalometer, Atmos. Meas. Tech., 8, 4415–4427, https://doi.org/10.5194/amt-8-4415-2015, 2015. a, b
Wang, J. M., Jeong, C.-H., Hilker, N., Shairsingh, K. K., Healy, R. M., Sofowote, U., Debosz, J., Su, Y., McGaughey, M., Doerksen, G., Munoz, T., White, L., Herod, D., and Evans, G. J.: Near-Road Air Pollutant Measurements: Accounting for Inter-Site Variability Using Emission Factors, Environ. Sci. Technol., 52, 9495–9504, https://doi.org/10.1021/acs.est.8b01914, 2018. a
Wang, Q., Han, Y., Ye, J., Liu, S., Pongpiachan, S., Zhang, N., Han, Y., Tian, J., Wu, C., Long, X., Zhang, Q., Zhang, W., Zhao, Z., and Cao, J.: High Contribution of Secondary Brown Carbon to Aerosol Light Absorption in the Southeastern Margin of Tibetan Plateau, Geophys. Res. Lett., 46, 4962–4970, https://doi.org/10.1029/2019GL082731, 2019. a
Wang, Q., Liu, H., Ye, J., Tian, J., Zhang, T., Zhang, Y., Liu, S., and Cao, J.: Estimating Absorption Ångström Exponent of Black Carbon Aerosol by Coupling Multiwavelength Absorption with Chemical Composition, Environ. Sci. Technol. Lett., 8, 121–127, https://doi.org/10.1021/acs.estlett.0c00829, 2021. a
Wang, X., Ye, X., Chen, J., Wang, X., Yang, X., Fu, T.-M., Zhu, L., and Liu, C.: Direct links between hygroscopicity and mixing state of ambient aerosols: estimating particle hygroscopicity from their single-particle mass spectra, Atmos. Chem. Phys., 20, 6273–6290, https://doi.org/10.5194/acp-20-6273-2020, 2020. a, b
Weichenthal, S., Van Ryswyk, K., Kulka, R., Sun, L., Wallace, L., and Joseph, L.: In-Vehicle Exposures to Particulate Air Pollution in Canadian Metropolitan Areas: The Urban Transportation Exposure Study, Environ. Sci. Technol., 49, 597–605, https://doi.org/10.1021/es504043a, 2015. a
Weingartner, E., Saathoff, H., Schnaiter, M., Streit, N., Bitnar, B., and Baltensperger, U.: Absorption of light by soot particles: determination of the absorption coefficient by means of aethalometers, J. Aerosol Sci., 34, 1445–1463, https://doi.org/10.1016/S0021-8502(03)00359-8, 2003. a, b, c, d
Janssen, N. A. H., Gerlofs-Nijland, M. E., Lanki, T., Salonen, R. O., Cassee, F., Hoek, G., Fischer, P., Brunekreef, B., and Krzyzanowski, M.: Health effects of black carbon, World Health Organization, Regional Office for Europe, https://apps.who.int/iris/handle/10665/352615 (last access: 23 March 2023), 2012. a
Wickham, H., Averick, M., Bryan, J., Chang, W., McGowan, L. D., François, R., Grolemund, G., Hayes, A., Henry, L., Hester, J., Kuhn, M., Pedersen, T. L., Miller, E., Bache, S. M., Müller, K., Ooms, J., Robinson, D., Seidel, D. P., Spinu, V., Takahashi, K., Vaughan, D., Wilke, C., Woo, K., and Yutani, H.: Welcome to the Tidyverse, Journal of Open Source Software, 4, 1686, https://doi.org/10.21105/joss.01686, 2019. a
Yus-Díez, J., Bernardoni, V., Močnik, G., Alastuey, A., Ciniglia, D., Ivančič, M., Querol, X., Perez, N., Reche, C., Rigler, M., Vecchi, R., Valentini, S., and Pandolfi, M.: Determination of the multiple-scattering correction factor and its cross-sensitivity to scattering and wavelength dependence for different AE33 Aethalometer filter tapes: a multi-instrumental approach, Atmos. Meas. Tech., 14, 6335–6355, https://doi.org/10.5194/amt-14-6335-2021, 2021. a
Zambrano-Bigiarini, M.: hzambran/hydroGOF: v0.4-0, Zenodo [code], https://doi.org/10.5281/zenodo.839854, 2020. a
Zotter, P., Herich, H., Gysel, M., El-Haddad, I., Zhang, Y., Močnik, G., Hüglin, C., Baltensperger, U., Szidat, S., and Prévôt, A. S. H.: Evaluation of the absorption Ångström exponents for traffic and wood burning in the Aethalometer-based source apportionment using radiocarbon measurements of ambient aerosol, Atmos. Chem. Phys., 17, 4229–4249, https://doi.org/10.5194/acp-17-4229-2017, 2017. a, b, c, d, e, f, g, h, i, j, k, l, m, n