the Creative Commons Attribution 4.0 License.
the Creative Commons Attribution 4.0 License.
 | 12 May 2023
Comparison of atmospheric CO, CO2 and CH4 measurements at the Schneefernerhaus and the mountain ridge at Zugspitze
Antje Hoheisel
Cedric Couret
Bryan Hellack
Martina Schmidt
The CO, CO2 and CH4 mole fractions have been measured since 2002 at the Environmental Research Station Schneefernerhaus, which is located approximately 300 m below the summit of Zugspitze in the German Alps. Although the station is located remotely at an altitude of 2650 m a.s.l., local pollution events by snow blowers and snow groomers can be detected in the high temporal-resolution time series of seconds or minutes. Therefore, a time-consuming flagging process, carried out manually by the station manager, is necessary.
To examine local influences and the effectiveness of data flagging, a 290 m long intake line to the higher Zugspitze ridge was used to measure CO, CO2 and CH4 mole fractions at a potentially less polluted location between October 2018 and October 2020. The comparison of these two time series shows that the mountain ridge measurement is almost unaffected by local pollution. It also demonstrates that the influence of local pollution events on the Schneefernerhaus measurements is successfully removed by the station manager. Only a small deviation of up to 0.24 ppm can be observed during the day between the CO2 time series of the Schneefernerhaus and the mountain ridge in winter, probably due to anthropogenic sources.
- Article
(6310 KB) - Full-text XML
- BibTeX
- EndNote


Since the beginning of the industrial era, the mole fraction of greenhouse gases, such as CO2 and CH4, has increased strongly (Etheridge et al., 1996, 1998; Dlugokencky and Tans, 2022; Dlugokencky, 2022). The atmospheric mole fractions of CO2 and CH4 in preindustrial times are determined by measuring, for example, air enclosed in ice cores (Etheridge et al., 1996, 1998), and since the second half of the 20th century (e.g. Keeling et al., 1976), direct atmospheric measurements of CO2 and CH4 have been possible. Historically, most measurement stations are located on coasts, such as Mace Head, Ireland (Bousquet et al., 1996); island mountains, such as Mauna Loa, Hawaii (Keeling et al., 1976) or Izana, Spain (Navascues and Rus, 1991; Gomez-Pelaez et al., 2019); or continental mountains, such as Mount Cimone, Italy (Ciattaglia, 1983), Jungfraujoch, Switzerland (Sturm et al., 2005; Schibig et al., 2016) or Schauinsland, Germany (Schmidt et al., 2003). Measurements at such stations are usually less affected by regional and local influences than measurements at urban stations. Thus, long-term records from remote stations play an important role in improving understanding of the global carbon cycle and the impact of greenhouse gases on global warming.
Trace gas measurements of CO2 have been performed at Zugspitze since 1981 at different locations (Reiter, 1986; Yuan et al., 2019). First, at a pedestrian tunnel (ZPT), approximately 250 m below the summit, then at the terrace of the summit (ZUG) and since 2002 at the Environmental Research Station Schneefernerhaus (ZSF). The scientific programme at the Schneefernerhaus is operated by several German research institutes with the aim of monitoring the physical and chemical properties of the atmosphere and analysing various processes that influence the weather and climate (UFS, 2020). At the Schneefernerhaus the measurements of CO, CO2 and CH4 mole fractions are performed by the German Environment Agency (UBA – Umweltbundesamt). The Zugspitze greenhouse gas measurement programme is part of the Global Atmosphere Watch (GAW) programme and joined the atmospheric network ICOS (Integrated Carbon Observation System) in 2021.
Due to the high elevation of mountain stations, the measured ambient air is less affected by regional and local influences compared to urban stations. In recent years, several studies have analysed the CO2 and CH4 measurements performed at Zugspitze (e.g. Yuan et al., 2018, 2019; Giemsa et al., 2019), also in combination with δ13C-CO2 ratios (e.g. Ghasemifard et al., 2019a, b). However, recent studies of greenhouse gas measurements with a temporal resolution of seconds to minutes have shown that local influences of anthropogenic activities can be seen in several mountain station time series, such as Pic du Midi, where a small sewage treatment facility near the air intake of the analyser causes local CH4 peaks (El Yazidi et al., 2018), or Jungfraujoch, where the CO2 measurement shows an influence of local anthropogenic activities, potentially by visitors and tourism (Affolter et al., 2021).
Since 2012, new measurement techniques with a temporal resolution of nearly 1 Hz have been used at the Schneefernerhaus to measure atmospheric CO, CO2 and CH4 mole fractions. This enabled the detection of local pollution events in the measured records, which could not be seen to this extent in previous measurements with lower time resolution. In particular, in winter, snow groomers and gasoline snow blowers lead to strong CO peaks in the Schneefernerhaus time series, which must be flagged manually to prevent an influence on the records. The German Meteorological Service (DWD – Deutscher Wetterdienst) has also found that its measurements of radon (222Rn) activity at the Schneefernerhaus are partially contaminated by local geogenic sources of radon. Therefore, since 2014 they have used an ambient air inlet at the mountain ridge approximately 150 m uphill of the Schneefernerhaus for their measurements of 222Rn (Frank et al., 2017). As the local sources influencing the measurements of CO, CO2 and CH4 at the Schneefernerhaus are presumably near the station, a change in the location of the air intake line could also reduce the influence on the CO, CO2 and CH4 time series. A new inlet line, installed from the Schneefernerhaus to the mountain ridge in 2018, allowed for the measurement of CO, CO2 and CH4 mole fractions in ambient air collected at the mountain ridge since October 2018.
In our study, a 2-year long comparison measurement between the ambient air of the Schneefernerhaus and of the mountain ridge is analysed. The main focus of this study is to characterise the local pollution events and to compare the influence of these events on the Schneefernerhaus and mountain ridge measurements.
2.1 Site description
Zugspitze is Germany's highest mountain and its summit is 2962 m above sea level. It is located in southern Germany in the northern Alps at the border with Austria (Fig. 1). The surrounding area consists largely of bare land, forests and pastures. Urban areas occur less frequently. Around 11 km northeast of Zugspitze lies the city of Garmisch-Partenkirchen (∼ 27 000 inhabitants). Innsbruck (∼ 131 000 inhabitants, 35 km southeast) and Munich (∼ 1 509 000 inhabitants, 90 km northeast) are the largest cities within 100 km.
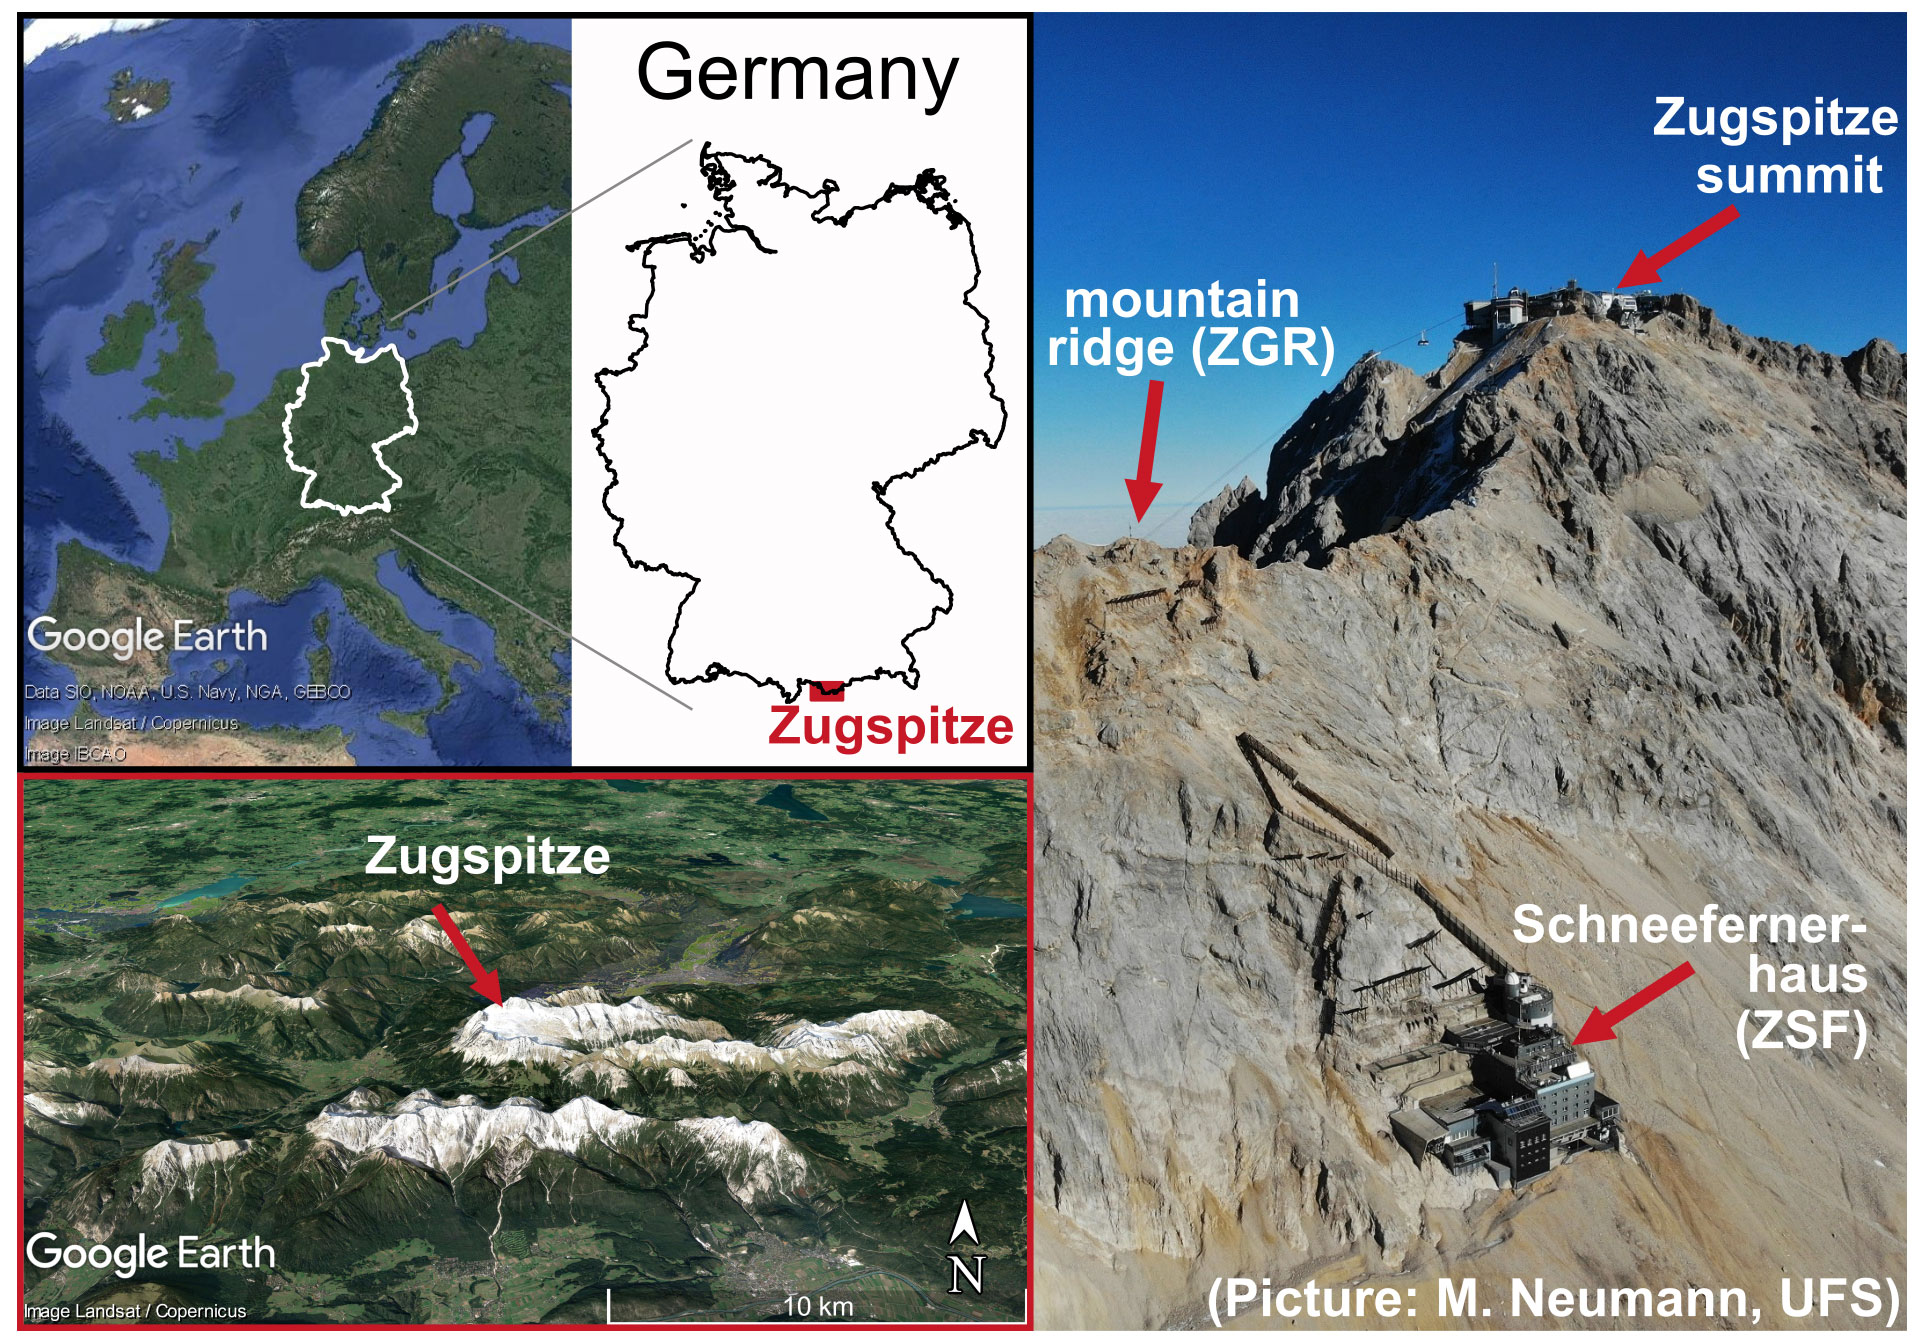
Figure 1Location of the Zugspitze Schneefernerhaus measurement site. On the right side the two inlet lines at the Schneefernerhaus (ZSF) and the mountain ridge (ZGR) are shown (map data on left side from © Google Earth).
Atmospheric greenhouse gas measurements are carried out by the UBA at the Environmental Research Station Schneefernerhaus (47∘25′00′′ N, 10∘58′46′′ E), which is approximately 300 m below the summit of Zugspitze (Fig. 1, right panel). The air inlet for the measurements at the Schneefernerhaus (ZSF, 2669 m a.s.l.) is installed at the research terrace on the fifth floor (Fig. 1, right panel). The analysis of recent high temporal-resolution trace gas measurements has shown that the measured records at the Schneefernerhaus are occasionally influenced by local pollution.
Possible sources can be found at the Schneefernerhaus itself, at the rack railway tunnel from the Schneefernerhaus to the valley, at the summit of Zugspitze and at the glacier plateau Zugspitzplatt, which is a ski resort in winter. Zugspitzplatt is located approximately 100 m below the Schneefernerhaus. Each year more than 500 000 tourists (Bayerische Zugspitzbahn Bergbahn AG) visit the summit of Zugspitze and Zugspitzplatt, which can be reached from the valley by cable cars and rack railways. Furthermore, working activities at the Schneefernerhaus, such as the use of gasoline snow blowers, can influence the measurement. To keep local impacts low, electric snow blowers are generally used. However, after heavy snowfall, gasoline-powered equipment is needed. On weekdays, 12 people normally work at the Schneefernerhaus during regular working hours.
In 2018, the DWD replaced an old and broken inlet line from the Schneefernerhaus to the mountain ridge (ZGR, 2825 m a.s.l.) with a 290 m long new inlet line made of stainless steel (Fig. 1). Since October 2018, it has been possible to simultaneously measure the mole fraction of CO, CO2 and CH4 in the ambient air of the Schneefernerhaus and of the mountain ridge above the Schneefernerhaus.
2.2 Experimental setup
Since October 2018, the mole fractions of CO, CO2 and CH4 in ambient air at Zugspitze have been measured with three analysers, which are installed in the Environmental Research Station Schneefernerhaus and are connected to one of two inlet lines. One leads to the research terrace of the Schneefernerhaus (ZSF, 2669 m a.s.l.) and the other to the mountain ridge (ZGR, 2825 m a.s.l.). In addition to the ambient air of the Schneefernerhaus or the mountain ridge, the analysers simultaneously measure the same calibration and target gases for quality control (see Sect. 2.3 for further details). The measuring routine is controlled by the same multiposition rotary valve (model: EMT2SF6MWE, Valco Vici, Switzerland), through which all three instruments receive the measuring samples. The experimental setup is shown in Fig. A1.
The CO2 and CH4 mole fractions in the ambient air of the Schneefernerhaus are measured with cavity ring-down spectroscopy (CRDS) G2301 analyser (Picarro, Inc., Santa Clara, CA) and the CO mole fractions with off-axis integrated cavity output spectroscopy (OA-ICOS) EP30 analyser (LGR, Los Gatos Research). Ambient air is pumped with a flow rate of 500 L min−1 from the research terrace on the fifth floor through the glass inlet at a height of 2.5 m above the terrace. To avoid freezing, the top of the glass inlet is heated. Part of the flow is then passed through a ∼ 350 mL cold trap (Gaßner Glastechnik GmbH, Germany) to dry the ambient air and, thus, reduce the influence of water vapour on the measurement. The fluid bath of the cold trap is filled with silicon oil (model: M90.055/03, Huber Kältemaschinenbau AG, Germany) and is cooled to C with a cryogenic cooler (model: TC100E, Huber Kältemaschinenbau AG, Germany). The dried air is then measured by the CRDS G2301 and the OA-ICOS EP30 analysers, with the flow rate controlled to 0.2 and 0.4 L min−1, respectively. Therefore, the residence time of air in the setup from the inlet at the research terrace to the analysers is only 35 s.
The CO, CO2 and CH4 mole fractions in the ambient air of the mountain ridge are measured with a CRDS G2401 analyser (Picarro, Inc., Santa Clara, CA). The air is pumped through a 290 m stainless steel tube (1.2 cm o.d.) from the mountain ridge to the Schneefernerhaus with a flow rate of 16 L min−1. The air inlet at the mountain ridge is protected from rain but not heated. A part of this airflow is then used by the CRDS G2401 analyser. Since 5 February 2019 this ambient air has been dried using the same drying system as the one used for the Schneefernerhaus measurements. The residence time of ambient air from the mountain ridge to the analyser is 6 min 40 s. Therefore, to account for the different residence times between the Schneefernerhaus and mountain ridge measurements, the CRDS G2401 data averaged over 1 min are shifted by −6 min.
On 16 July 2019 the setup was modified (see Fig. A1) by relocating two pumps out of the direct flow path of the three analysers. During this study, the UBA air quality measuring station on Zugspitze joined the atmospheric network ICOS (Integrated Carbon Observation System). In the course of the ICOS labelling process, the CRDS G2301 and the OA-ICOS EP30 analysers were sent to the ICOS Atmosphere Thematic Centre (ATC) Metrology Laboratory for validation. Therefore, two large data gaps occurred in the measured time series. From 9 May 2019 to 8 August 2019, no CO, CO2 and CH4 mole fractions were measured at the mountain ridge and between 1 January 2020 and 8 July 2020, no CO mole fractions were measured at the Schneefernerhaus.
2.3 Calibration, correction and quality control
The mole fractions of CO, CO2 and CH4 in the ambient air of the Schneefernerhaus and the mountain ridge were measured with a temporal resolution of 5 to 10 s with two CRDS analysers (G2301, G2401) and one OA-ICOS EP30 analyser. These measurements are averaged over 1 min. The 1 min averaged values of the ambient air time series are calibrated using a two-point calibration to take into account the drift of the analysers and to link the records to the international scale (CO: WMO X2014A; CO2: WMO X2019; CH4: WMO X2004A). Therefore, every 3 d, all analysers measure the same low and high working standard cylinders for 15 min. The four reference gases provided by the ESRL's Global Monitoring Laboratory (GML) of the National Oceanic and Atmospheric Administration (NOAA) are analysed every 2 months for 30 min. These WMO reference gases span the CO mole fraction from 124 to 269 ppb, the CO2 mole fraction from 379 to 430 ppm and the CH4 mole fraction from 1835 to 2120 ppb. Unless otherwise specified, the calibrated average values over 1 min were used in the analysis of the time series.
In addition to calibration cylinders, a target cylinder is simultaneously measured every 3 d by all analysers for quality control. The calibrated target measurements of CO, CO2 and CH4 were stable over time, and there is no significant mean difference between the G2301/EP30 and G2401 analyses for all three species. Table 1 shows the average and standard deviation of the CO, CO2 and CH4 mole fractions for the 2-year comparison for each analyser and their difference. Furthermore, the CO, CO2 and CH4 mole fractions in ambient air from the Schneefernerhaus inlet was measured simultaneously with all analysers for 15 d in July 2020. The average differences between the hourly averaged CO, CO2 and CH4 mole fractions measured with the G2301/EP30 and G2401 analysers are ppb (mean ± SD) in CO, 0.04 ± 0.02 ppm in CO2 and 0.3 ± 0.2 ppb in CH4.
Table 1Calibrated target gas measurements which were performed with the CRDS G2301, G2401 and OA-ICOS EP30 analysers. The average and standard deviation of each analyser and the differences are shown. The CRDS G2301 and OA-ICOS EP30 analysers were usually used for the ambient air measurement at the Schneefernerhaus and the CRDS G2401 analyser for the measurements at the mountain ridge.

Two corrections were applied to the CO data. First, a large difference of roughly 5 ppb between the Schneefernerhaus and mountain ridge data was observed in the first few months of the comparison measurement. The quality control measurements show that this difference is not caused by the analysers or the calibration. The main difference between the two setups for measuring the ambient air at the Schneefernerhaus and at the mountain ridge, leaving aside the different intake lines, is that the air from the mountain ridge was not dried. This observed offset disappeared after the air from the mountain ridge has also been dried since 5 February 2019. To determine the influence on the CO data prior to 5 February 2019, the same air from the Schneefernerhaus intake was measured with all three analysers on 12 December 2018, where the air for the CRDS G2301 and OA-ICOS EP30 analysers were dried as usual, but the air for CRDS G2401 analyser was not. No significant difference was found for CO2 and CH4 mole fractions. However, the CO mole fractions were on average 5.2 ± 1.5 ppb lower for device G2401. Therefore, a correction factor of 5.2 ppb was applied to the CO mole fractions from the mountain ridge for the time without drying. Since there is no information about the exact dependence of the CO mole fraction as a function of water vapour, the applied CO correction is based on the previously described comparison measurement, which was performed only once. Secondly, an influence of the pumps used in the flow path to the analysers could be detected, and therefore the setup was modified on 16 July 2019. Test measurements of quality control gases were performed to determine this impact. In three measurements the pump was placed within the flow path, as usual, and in two cases the pump was excluded. The CO measurement showed a difference of 7.5 ppb. For CH4 and CO2, no significant influence by the pump could be observed. Thus, the CO mole fractions for both analysers are corrected by −7.5 ppb until 16 July 2019. Since the CO measurements of the ambient air of the Schneefernerhaus and of the mountain ridge were equally affected, the difference between both measurements was not influenced.
2.4 Data flagging
The station manager from UBA manually applied different flags to the Schneefernerhaus CO, CO2 and CH4 time series to document invalid values, such as artefacts and outliers, due to technical problems or work at the setup as well as local pollution events. Additional data from other trace gas measurements, meteorological data and station logbooks were used for this purpose. These data from the Schneefernerhaus were called “ZSF QC” in this study. The half-hourly, hourly, daily and monthly averages of CO, CO2 and CH4 mole fractions at the Schneefernerhaus reported to national and international databases such as the World Data Centre for Greenhouse Gases (WDCGG) are also based on 1 min averaged data where local pollution events have been flagged as invalid in addition to artefacts and outliers. However, since this study also aims to assess the impact of local pollution on the Schneefernerhaus time series, a dataset that excludes only instrumental and technical problems but not local pollution events was also used in this study. This dataset was called “ZFS with local pollution”. Since the mountain ridge is more elevated than the Schneefernerhaus, no strong pollution events in the measured time series were assumed. Thus, only technical artefacts and outliers were flagged in the time series from the mountain ridge, called “ZGR”.
3.1 CO, CO2 and CH4 mole fractions measured at the Schneefernerhaus and the mountain ridge
Since October 2018, CO, CO2 and CH4 mole fractions have been measured in the ambient air of the Schneefernerhaus and the mountain ridge. Figure 2 shows the time series of 1 min averaged values at both sites. The measurements from the mountain ridge (ZGR) are displayed in red, the Schneefernerhaus ZSF QC time series are shown in black, and the one with local pollution in blue. In contrast to the mountain ridge measurement, strong pollution events can be observed at the Schneefernerhaus (ZSF time series with local pollution). These are mainly visible in the CO record but also in CO2 and partly in CH4. High CO pollution events of more than 400 ppb can be noticed, especially during the snow season. These spikes are caused by snow clearing in front of the station with gasoline snow blowers or to prepare the nearby ski area with snow groomers. In January 2019, heavy snowfall and an avalanche that passed over the station led to the intensive use of gasoline snow blowers at the station. During this time, extremely high CO mole fractions of up to 28 000 ppb and corresponding CO2 and CH4 spikes were measured at the Schneefernerhaus. In addition, CO2 peaks can be caused by scientists working on the measurement terrace near the inlet. These local pollution events at the Schneefernerhaus were identified and flagged manually by the station manager to reduce and avoid their influence on the measurement.
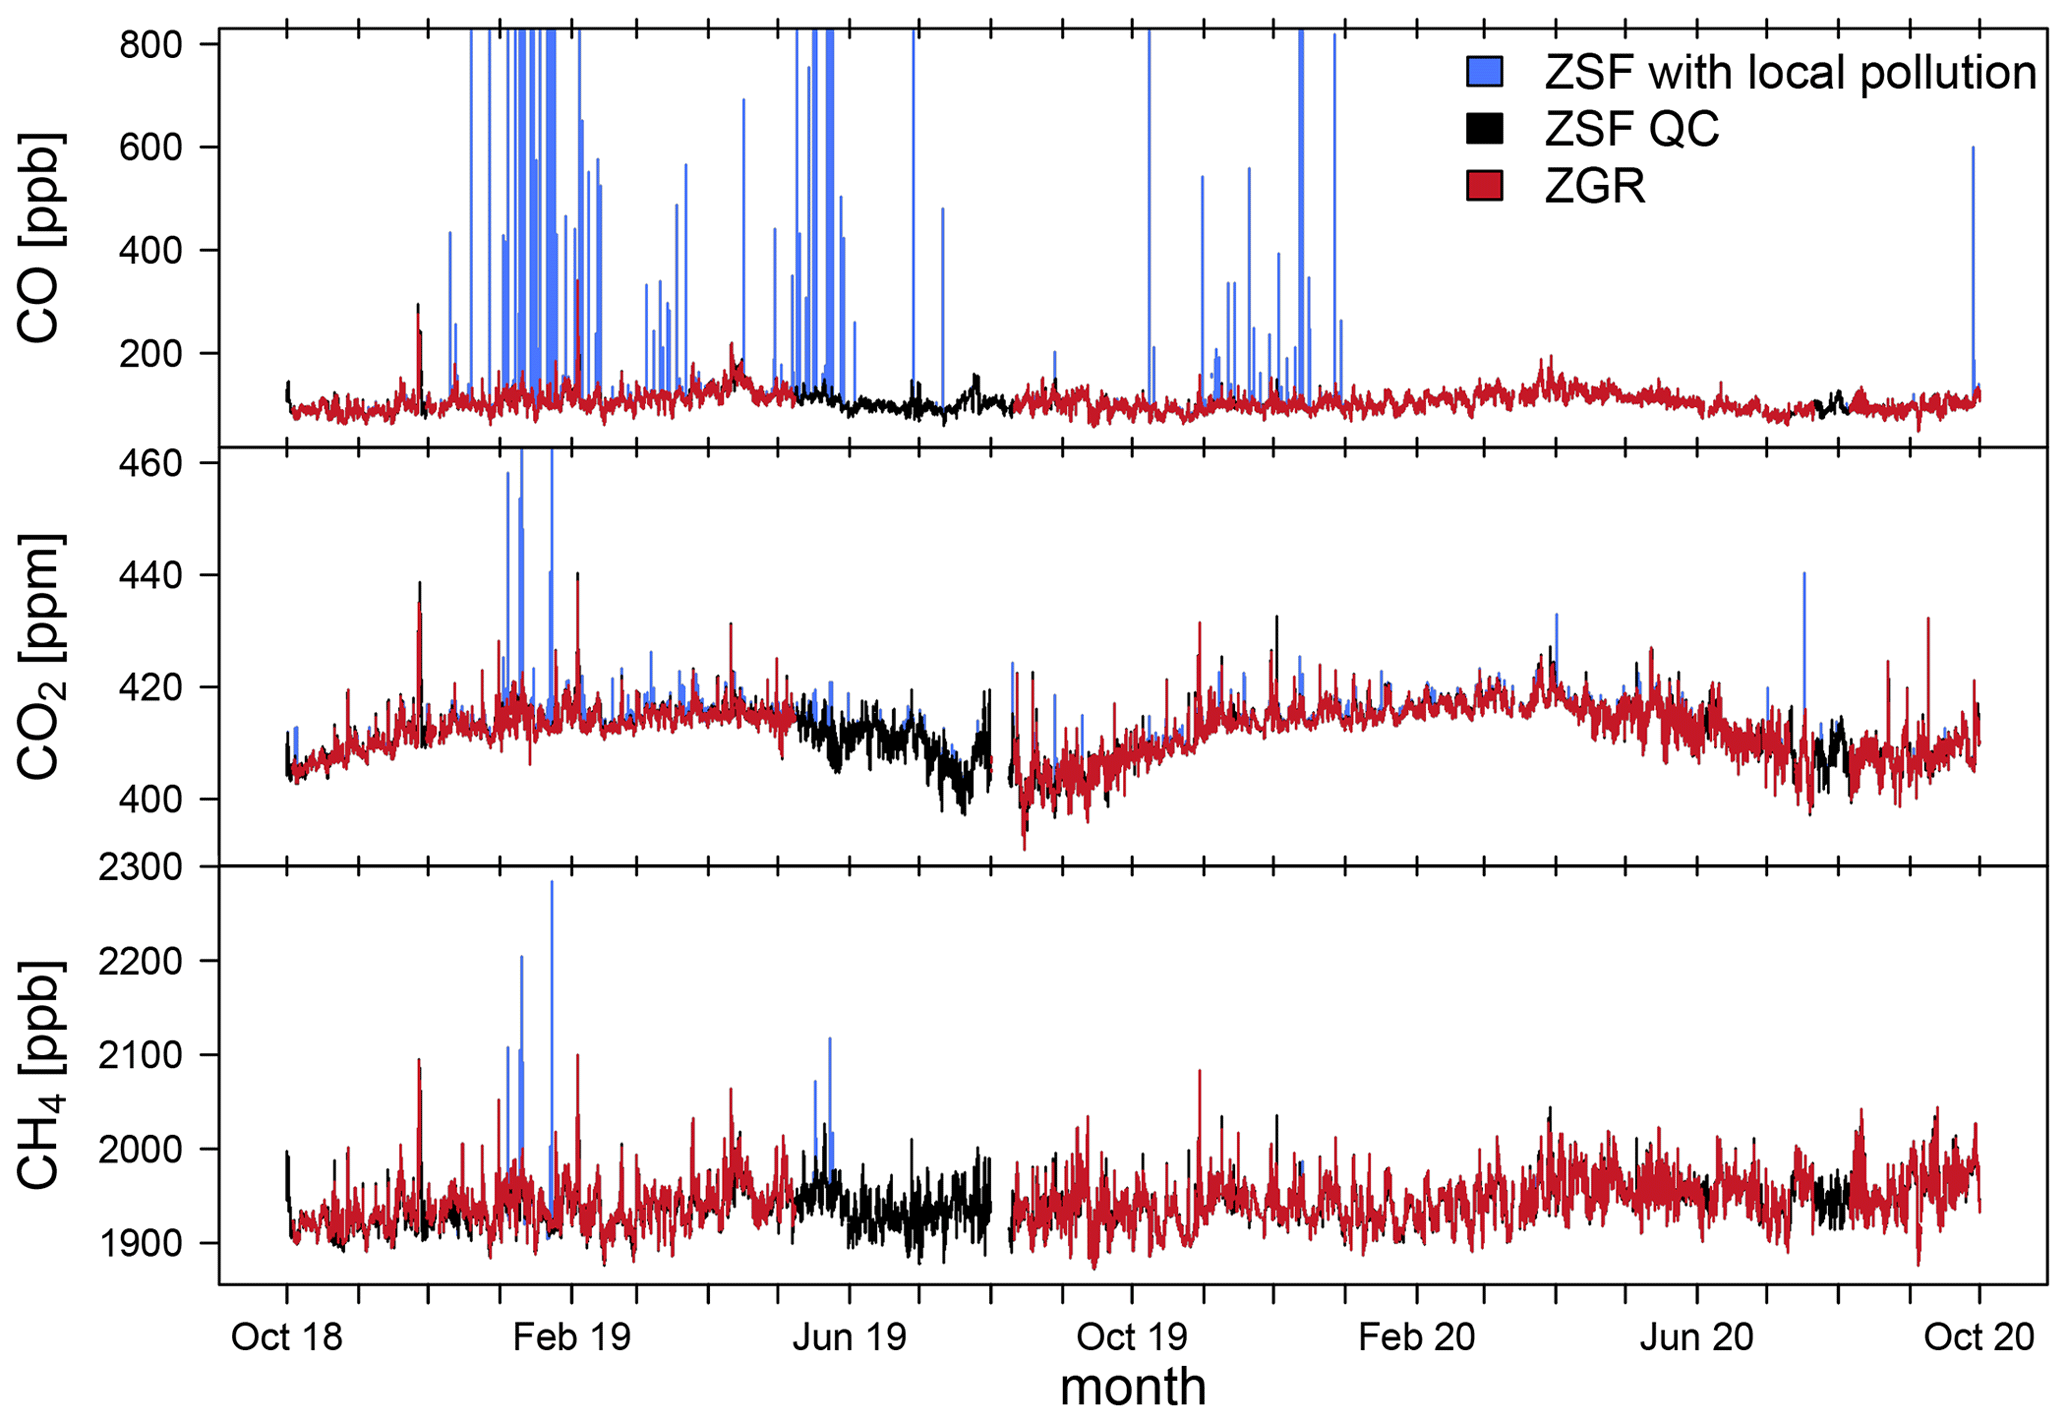
Figure 2CO, CO2 and CH4 mole fractions in the ambient air of the Schneefernerhaus (ZSF QC: black; ZSF with local pollution: blue) and of the mountain ridge (ZGR: red). The data shown are averaged over 1 min.
The Schneefernerhaus ZSF QC time series had similar CO, CO2 and CH4 mole fractions to measurements from the mountain ridge, and both time series followed the same seasonal variations. The CO mole fractions ranged from 48 to 342 ppb. The CO2 mole fractions showed a seasonal cycle with lower values in summer varying between 390 and 440 ppm, and the mole fractions of CH4 ranged from 1872 to 2100 ppb. As expected, the measurements of the ambient air of the mountain ridge and the Schneefernerhaus showed similar large-scale patterns, but at the mountain ridge, they are much less influenced by local pollution.
3.2 Local pollution events of CO and CO2 at the Schneefernerhaus
In the CO and CO2 Schneefernerhaus time series with local pollution that averaged over 1 min, large and narrow peaks can occasionally be detected. Approximately 2 % of CO or CO2 data measured at the Schneefernerhaus were strongly contaminated by local pollution and are therefore flagged manually by the station manager. This corresponds to 1000 high-CO events (12 900 1 min averaged values) and 2100 high-CO2 events (25 900 1 min averaged values).
Figure 3 shows the number of local polluted and manually flagged CO and CO2 data points against the time of day (a) and month (b). Due to their anthropogenic origin, strong diurnal and seasonal variations in the occurrence of pollution events are observed. The polluted and manually marked CO and CO2 data points occurred at 92 % and 95 %, respectively, during the day between 06:00 and 18:00 UTC. Furthermore, 94 % and 92 % of the polluted and manually flagged CO and CO2 data occurred during the snow season at high altitude (October to May) and after snowfall events when the snow blower and snow groomer are used more often.
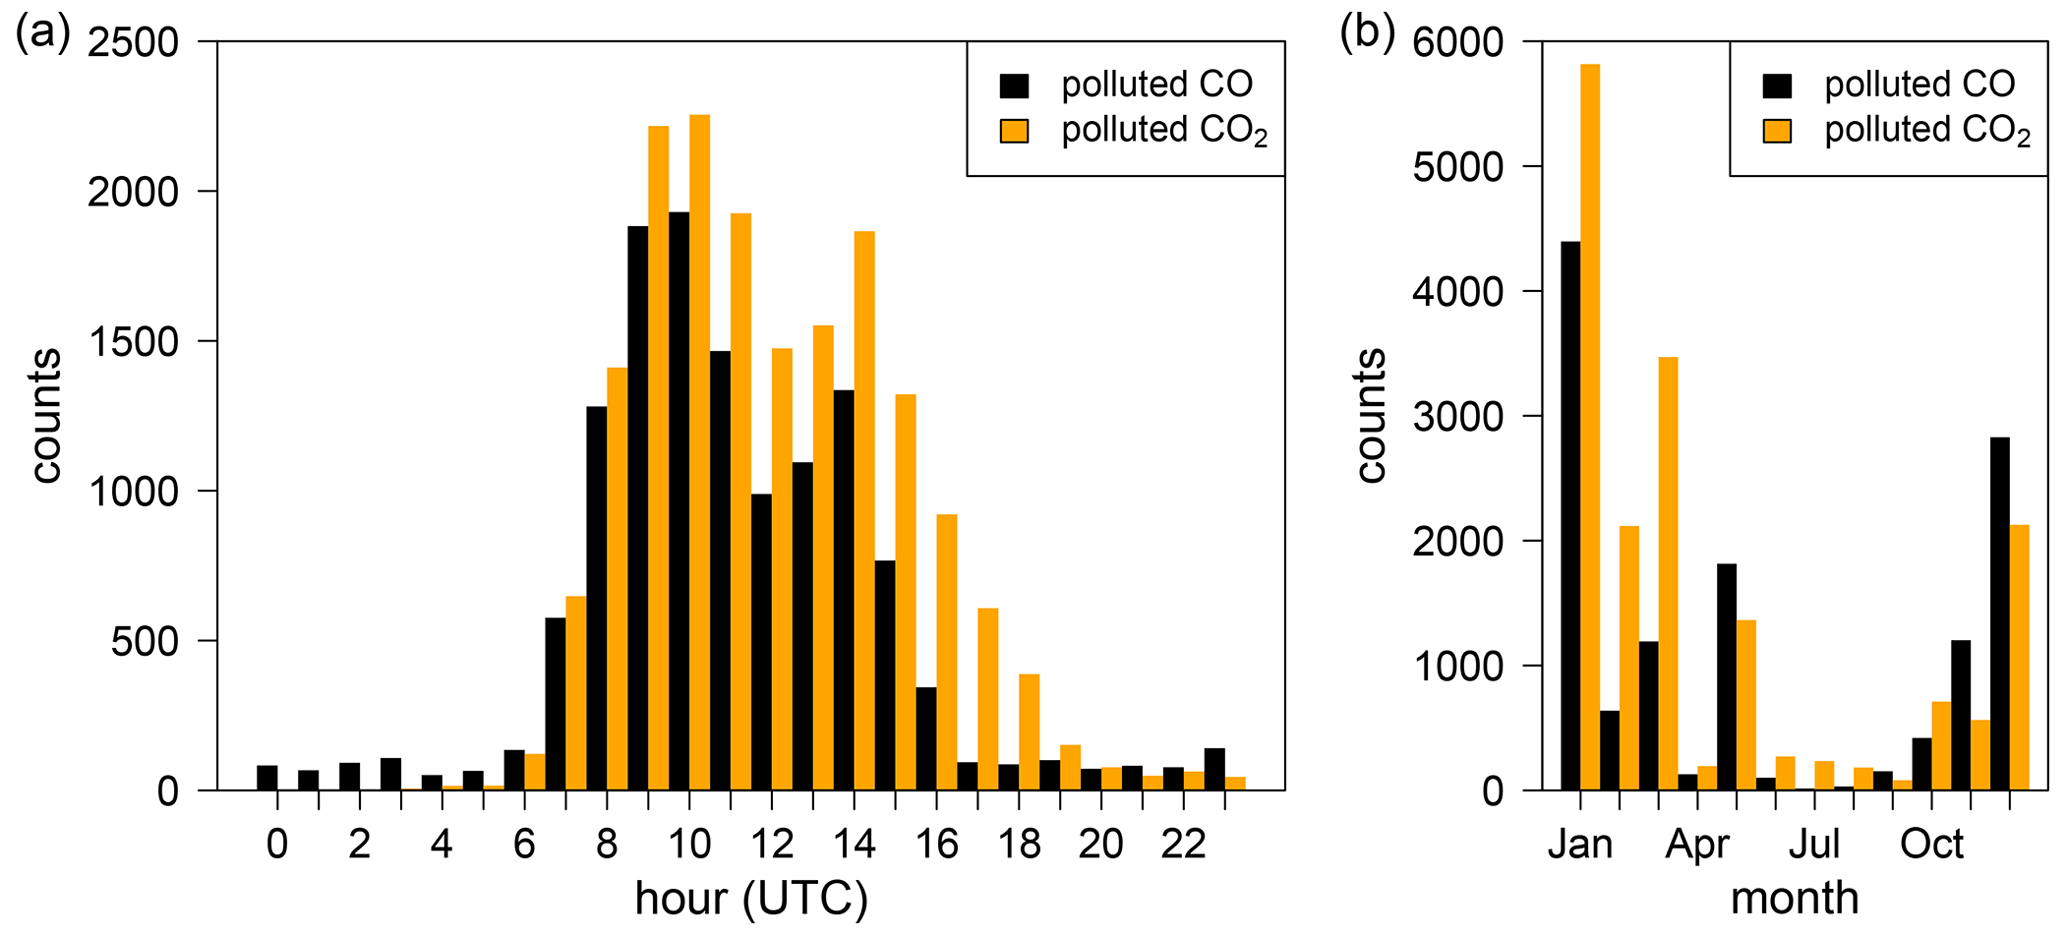
Figure 3Distribution of local polluted and manually flagged CO and CO2 data at the Schneefernerhaus as a function of month and time of day. The 1 min averaged dataset was used for this analysis.
In 2020, the COVID-19 pandemic led to temporary restrictions on tourism at Zugspitze and a reduction in work at the Schneefernerhaus and the ski resort. Unfortunately, our CO analyser for ambient air from the Schneefernerhaus was being validated at the ICOS ATC Metrology Laboratory as part of the ICOS labelling process at that time. Instead, we analysed NO2 measured at the Schneefernerhaus. Especially for NO2, but also for CO2, a decrease in the occurrence of peaks was observed in the measured time series at the Schneefernerhaus, indicating a reduction in local pollution events.
3.3 Local pollution events of CH4 at the Schneefernerhaus
The CH4 mole fraction measured at the Schneefernerhaus is also occasionally influenced by local pollution events. The high CH4 peaks in the Schneefernerhaus time series with local pollution coincide with high-CO or high-CO2 events and are manually excluded by the station manager. Furthermore, inverse CH4 spikes of several parts per billion occurred in the Schneefernerhaus time series, which were not detected at the mountain ridge. Typically, these inverse spikes do not occur as single events but during periods with multiple inverse spikes. These periods can last between some hours to multiple days and start and end abruptly (see Fig. 4a). Two tests were performed during such events with inverse CH4 spikes. First, we exchanged the analysers and second, we used an independent intake line that receives ambient air from the same location on the terrace at the Schneefernerhaus. The inverse CH4 spikes were measured in the air from both sampling lines to the Schneefernerhaus terrace and with both analysers when measuring ambient air from the Schneefernerhaus. However, they were not detected when measuring ambient air from the mountain ridge. Therefore, these spikes are neither an artefact nor caused by the analyser, the measurement setup or the inlet. Thus, CH4-depleted air must be transported occasionally to the measuring terrace.
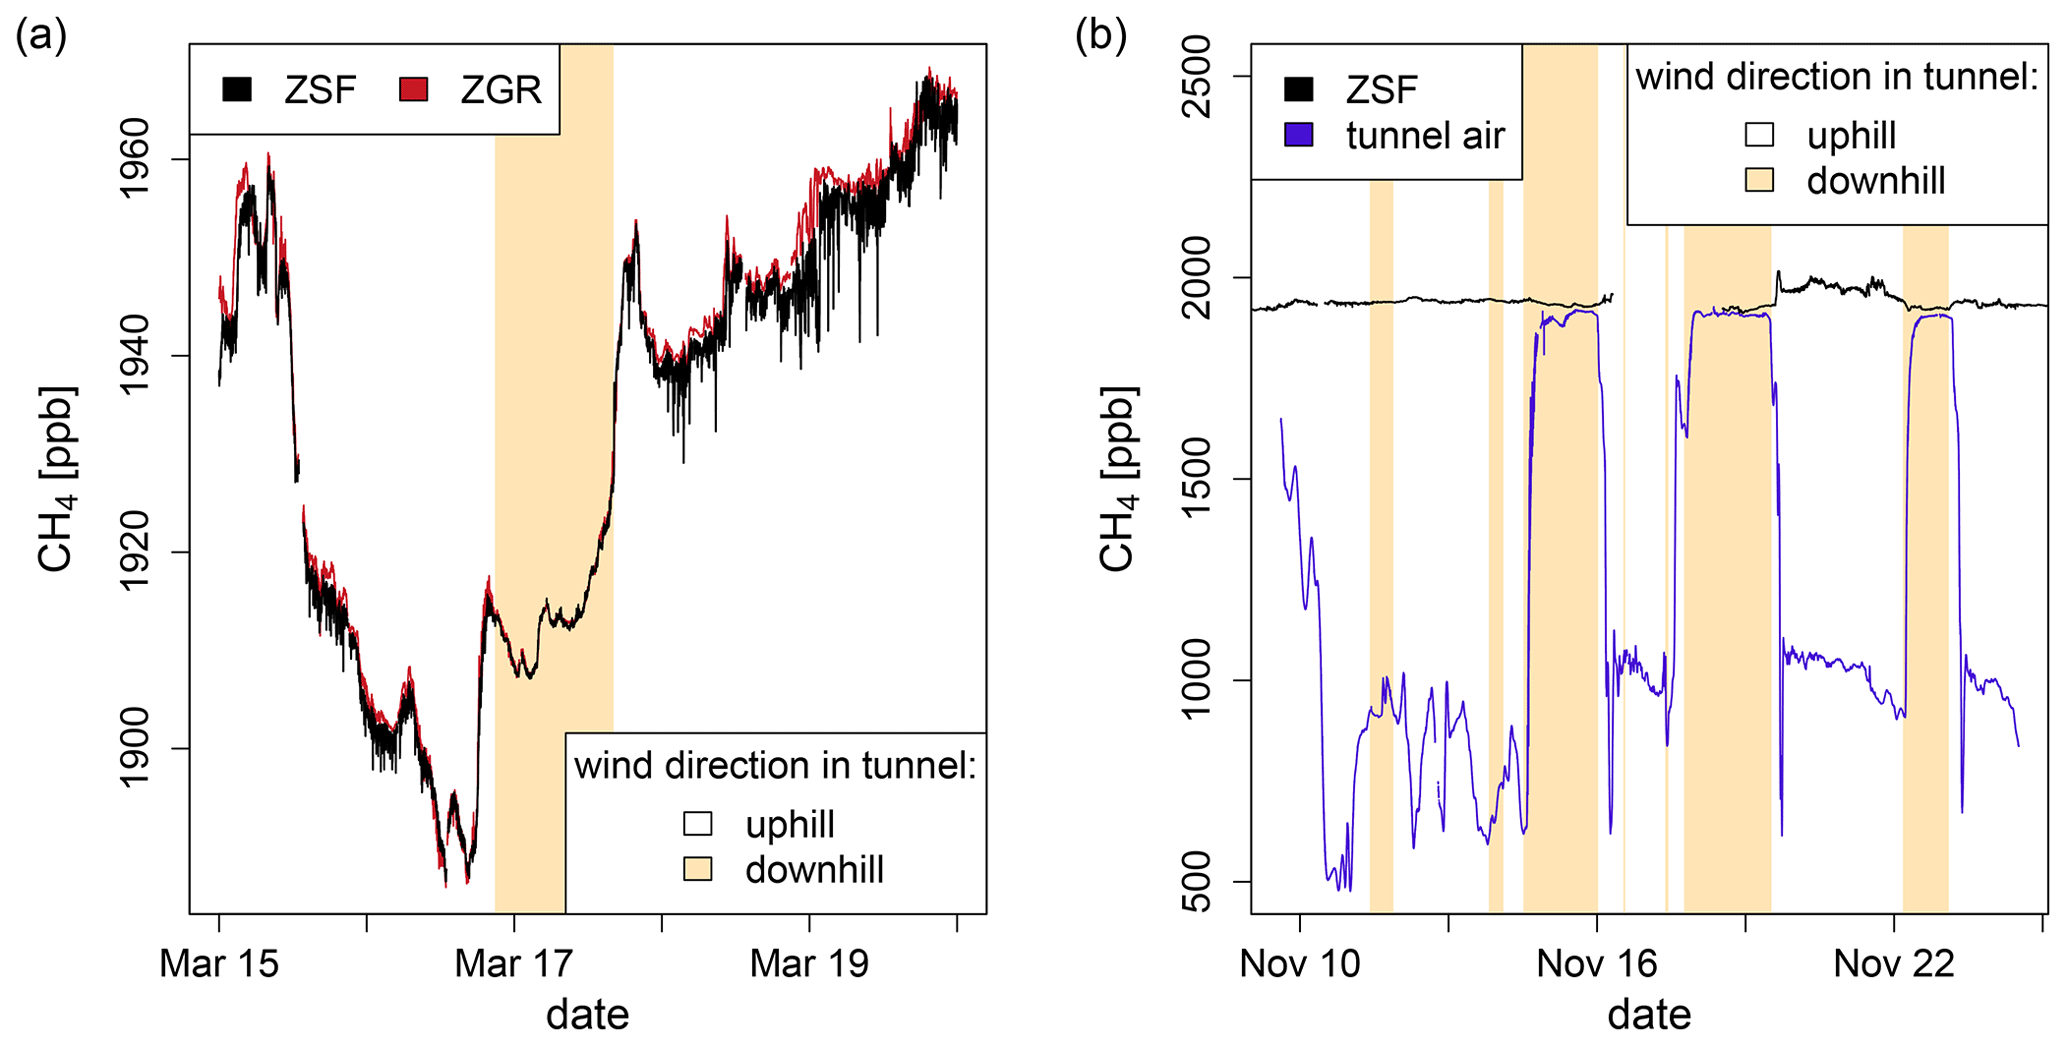
Figure 4(a) Example of inverse CH4 spikes measured at the Schneefernerhaus (ZSF: black) but not at the mountain ridge (ZGR: red). They are probably caused by CH4-depleted air from the nearby rack railway tunnel. (b) CH4 mole fraction in ambient air at the Schneefernerhaus (ZSF: black) and in tunnel air (blue) near the entrance of the rack railway tunnel. The beige-coloured time intervals correspond to a downhill wind direction in the rack railway tunnel.
From the Schneefernerhaus station, a rack railway tunnel leads downhill to the valley. An opening to this tunnel is located 45 m from the measurement terrace to direct the tunnel air, which has a high radon concentration, to the outside and to reduce the radon concentration inside the Schneefernerhaus station. For 15 d in November 2020, the CH4 mole fraction was measured with a CRDS G1301 analyser (Picarro, Inc., Santa Clara, CA) inside the tunnel near the opening (see Fig. 4b). The measured mole fraction of CH4 strongly depends on the direction of the tunnel airflow, which was measured in the tunnel with a 1D anemometer. As the tunnel air flows downhill, fresh air enters the tunnel through the opening, and the CH4 mole fraction has only slightly lower values than those measured on the terrace. However, extremely low CH4 mole fractions between 500 and 1000 ppb are measured when the tunnel air flows uphill. In this case, local wind pattern can transport the CH4-depleted tunnel air into the ambient air inlet line at the Schneefernerhaus, resulting in inverse CH4 spikes. Since the tunnel air flows downhill more frequently in summer than in winter, the influence of the tunnel air, and thus of the inverse CH4 spikes, seems to be larger in winter.
3.4 Comparison of local pollution events at the Schneefernerhaus and the mountain ridge
Although strong local pollution events are noticeable in the CO and CO2 mole fractions measured at the Schneefernerhaus, such strong events did not occur in the mountain ridge time series. Only small peaks are sometimes noticeable in the mountain ridge record, when the wind blows from southeast, from the station Schneefernerhaus to the mountain ridge (see Appendix A1). However, these pollution events have much smaller amplitudes than those measured simultaneously at the Schneefernerhaus. On approximately 83 % of the days when local pollution events were visible in the CO or CO2 measurements at the Schneefernerhaus, we did not find corresponding peaks at the mountain ridge. Even extremely high-CO events of more than 1000 ppb at the Schneefernerhaus are usually not detectable at the mountain ridge.
Figure 5 shows frequency distributions of deviations between the Schneefernerhaus and mountain ridge time series averaged to minute values for CO (Fig. 5a) and CO2 (Fig. 5b) mole fractions. On the left, the Schneefernerhaus time series with local pollution are used for the calculation, and on the right is the Schneefernerhaus ZSF QC dataset, where local pollution events were manually excluded by the station manager. The daytime data (red) show a high number of large positive differences when the Schneefernerhaus time series with local pollution are used. These strong positive deviations disappear in the right panels when the Schneefernerhaus ZSF QC data are included in the calculation. This indicates that the large positive differences are caused by local pollution at the Schneefernerhaus. Furthermore, it shows that strong local pollution events in the Schneefernerhaus time series are successfully excluded by the station manager.
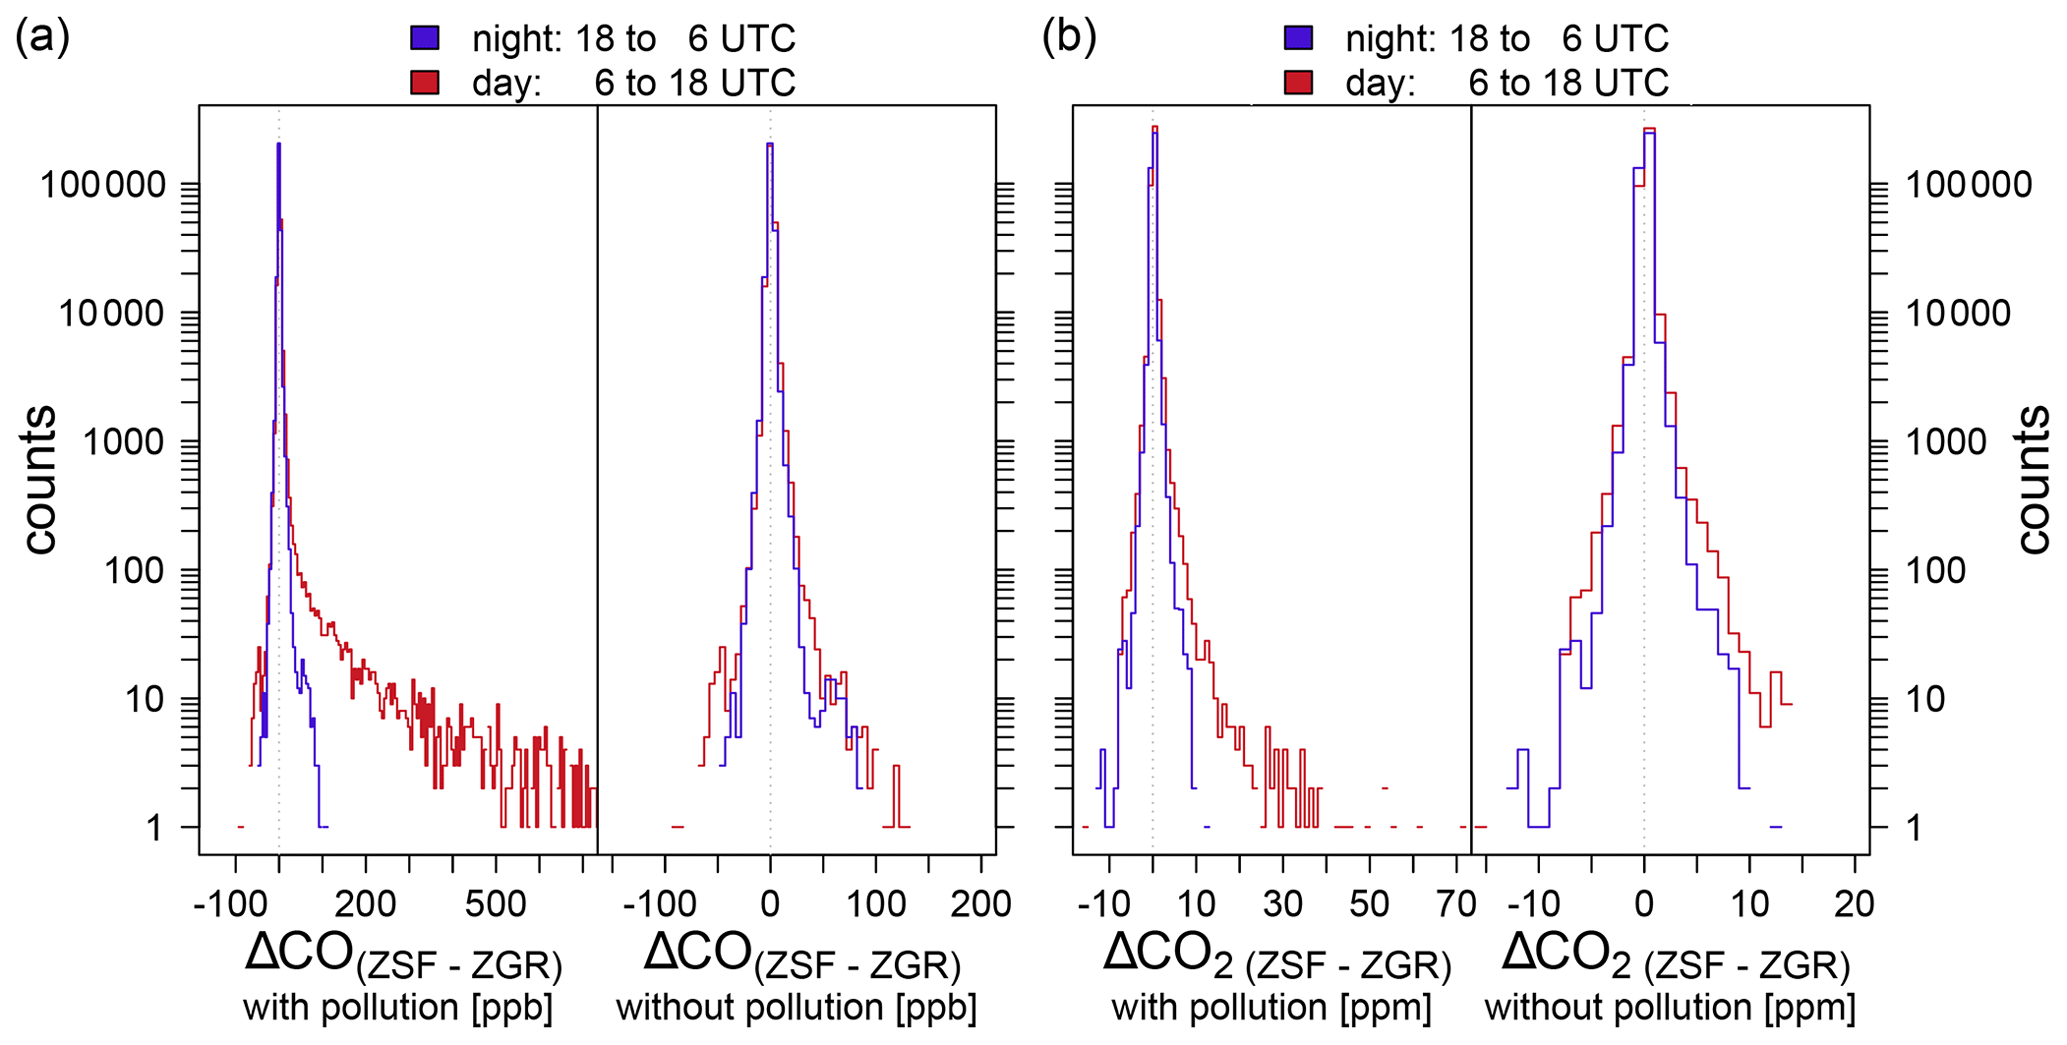
Figure 5The frequency distribution of the difference between the 1 min averaged Schneefernerhaus (ZSF) and the mountain ridge (ZGR) measurements for CO (a) and CO2 (b). The counts are displayed on a logarithmic scale. The blue colour corresponds to nighttime (18:00 to 06:00 UTC) and red to daytime (06:00 to 18:00 UTC) data. On the left side of the two figures, the Schneefernerhaus dataset with local pollution is used to calculate the differences, while on the right side the Schneefernerhaus ZSF QC dataset is used, in which local pollution events have been manually removed by the station manager.
3.5 Differences between the Schneefernerhaus and the mountain ridge measurements
The above analyses of the Schneefernerhaus and the mountain ridge measurements have shown that the mountain ridge time series are less influenced by local pollution, and strong local pollution events at the Schneefernerhaus are successfully flagged by the station manager. To verify whether there are further influences from local sources in the Schneefernerhaus time series, which do not manifest themselves as spikes, the hourly mean values of the measurements from the Schneefernerhaus were compared with those from the mountain ridge. These correspond to the QC datasets reported to national and international databases.
Figure 6 shows the hourly averaged mole fraction of CO, CO2 and CH4 measured at the Schneefernerhaus (black) and at the mountain ridge (red) as well as the difference between both locations. The hourly data for the Schneefernerhaus used in this comparison are calculated from the Schneefernerhaus ZSF QC time series, in which local pollution events are manually excluded. The average difference between the Schneefernerhaus and mountain ridge data is 0.3 ± 2.4 ppb for CO, 0.1 ± 0.4 ppm for CO2 and −0.4 ± 3.4 ppb for CH4 and meets the compatibility goal determined by the WMO (2020). The large standard deviations in CO, CO2 and CH4 differences cannot be explained by instrumental noise. A comparison of the CO, CO2 and CH4 mole fractions measured for 15 d with OA-ICOS EP30 or CRDS G2401 and CRDS G2301 using exactly the same air shows a standard deviation of hourly averages of 0.6 ppb CO, 0.02 ppm CO2 and 0.2 ppb CH4. Thus, the large standard deviations of the hourly differences between the ambient air of the Schneefernerhaus and the mountain ridge are probably caused by the different measuring locations. As local wind conditions can vary strongly between the Schneefernerhaus and the mountain ridge (see Appendix A1 and Fig. A2), air masses often occur with a time delay between the two locations.

Figure 6(a, c, e) Hourly averaged Schneefernerhaus (ZSF QC: black) and mountain ridge (ZGR: red) mole fractions of CO, CO2 and CH4 as well as the difference between both locations. (b, d, f) The frequency of the differences between the Schneefernerhaus and the mountain ridge calculated using the 1 min averaged data. All data are shown in black, whereas only the differences at night (18:00 to 06:00 UTC) and during the day are shown in blue and red, respectively.
To analyse the distribution of the differences between the Schneefernerhaus ZSF QC and the mountain ridge measurement in more detail, the frequency of the 1 min differences between both locations are shown on the right side in Fig. 6. In addition to the whole dataset (black), the distribution is shown for nighttime (blue; 18:00 to 06:00 UTC) and daytime (red) mole fractions. The differences in the CO mole fractions show a small shift of 0.4 ppb between nighttime and daytime and a symmetric distribution. However, the differences are still within the uncertainties in the analysers.
The CO2 mole fractions show larger differences during the day, with an average of 0.13 ppm. This is approximately 0.07 ppm larger than that during the night and exceeds the WMO compatibility goal of 0.1 ppm (WMO, 2020). Furthermore, the distribution is asymmetric to positive differences, which even increase during the day. This indicates elevated CO2 mole fractions at the Schneefernerhaus for daytime values. One explanation for this may be that the influence of local sources is not completely excluded by manual flagging, but the different sites may also receive slightly different signals from regional pollution due to the different altitudes and complex topography. The influence of local sources on the CO2 time series at a remote mountain station is noticed also at other stations. At the mountain station Jungfraujoch, the average difference between the usual location and another, less polluted one is 0.01 ppm overnight and even 0.49 ppm during the day (Affolter et al., 2021).
In contrast to the CO2 mole fractions, CH4 time series from the Schneefernerhaus and the mountain ridge are comparable within the WMO compatibility goal of 2 ppb (WMO, 2020) overnight and during the day. However, the distribution is slightly asymmetric towards negative values. This distribution is probably related to inverse CH4 spikes visible at the Schneefernerhaus, which are caused by CH4-depleted air from the rack railway tunnel (Sect. 3.3).
3.6 Annual and diurnal cycles
The annual and diurnal cycles of the mole fraction of CO, CO2 and CH4 measured in ambient air at the Schneefernerhaus and the mountain ridge are analysed and compared in Fig. 7. To describe the Schneefernerhaus data the ZSF QC dataset (black) and the ZSF time series with local pollution (blue) are used again. In the calculations, only data for which simultaneous measurements at both locations are available are taken into account. The diurnal cycles for the high alpine winter (October to March) and from April to September are determined by calculating the diurnal variations per month and then averaging them.
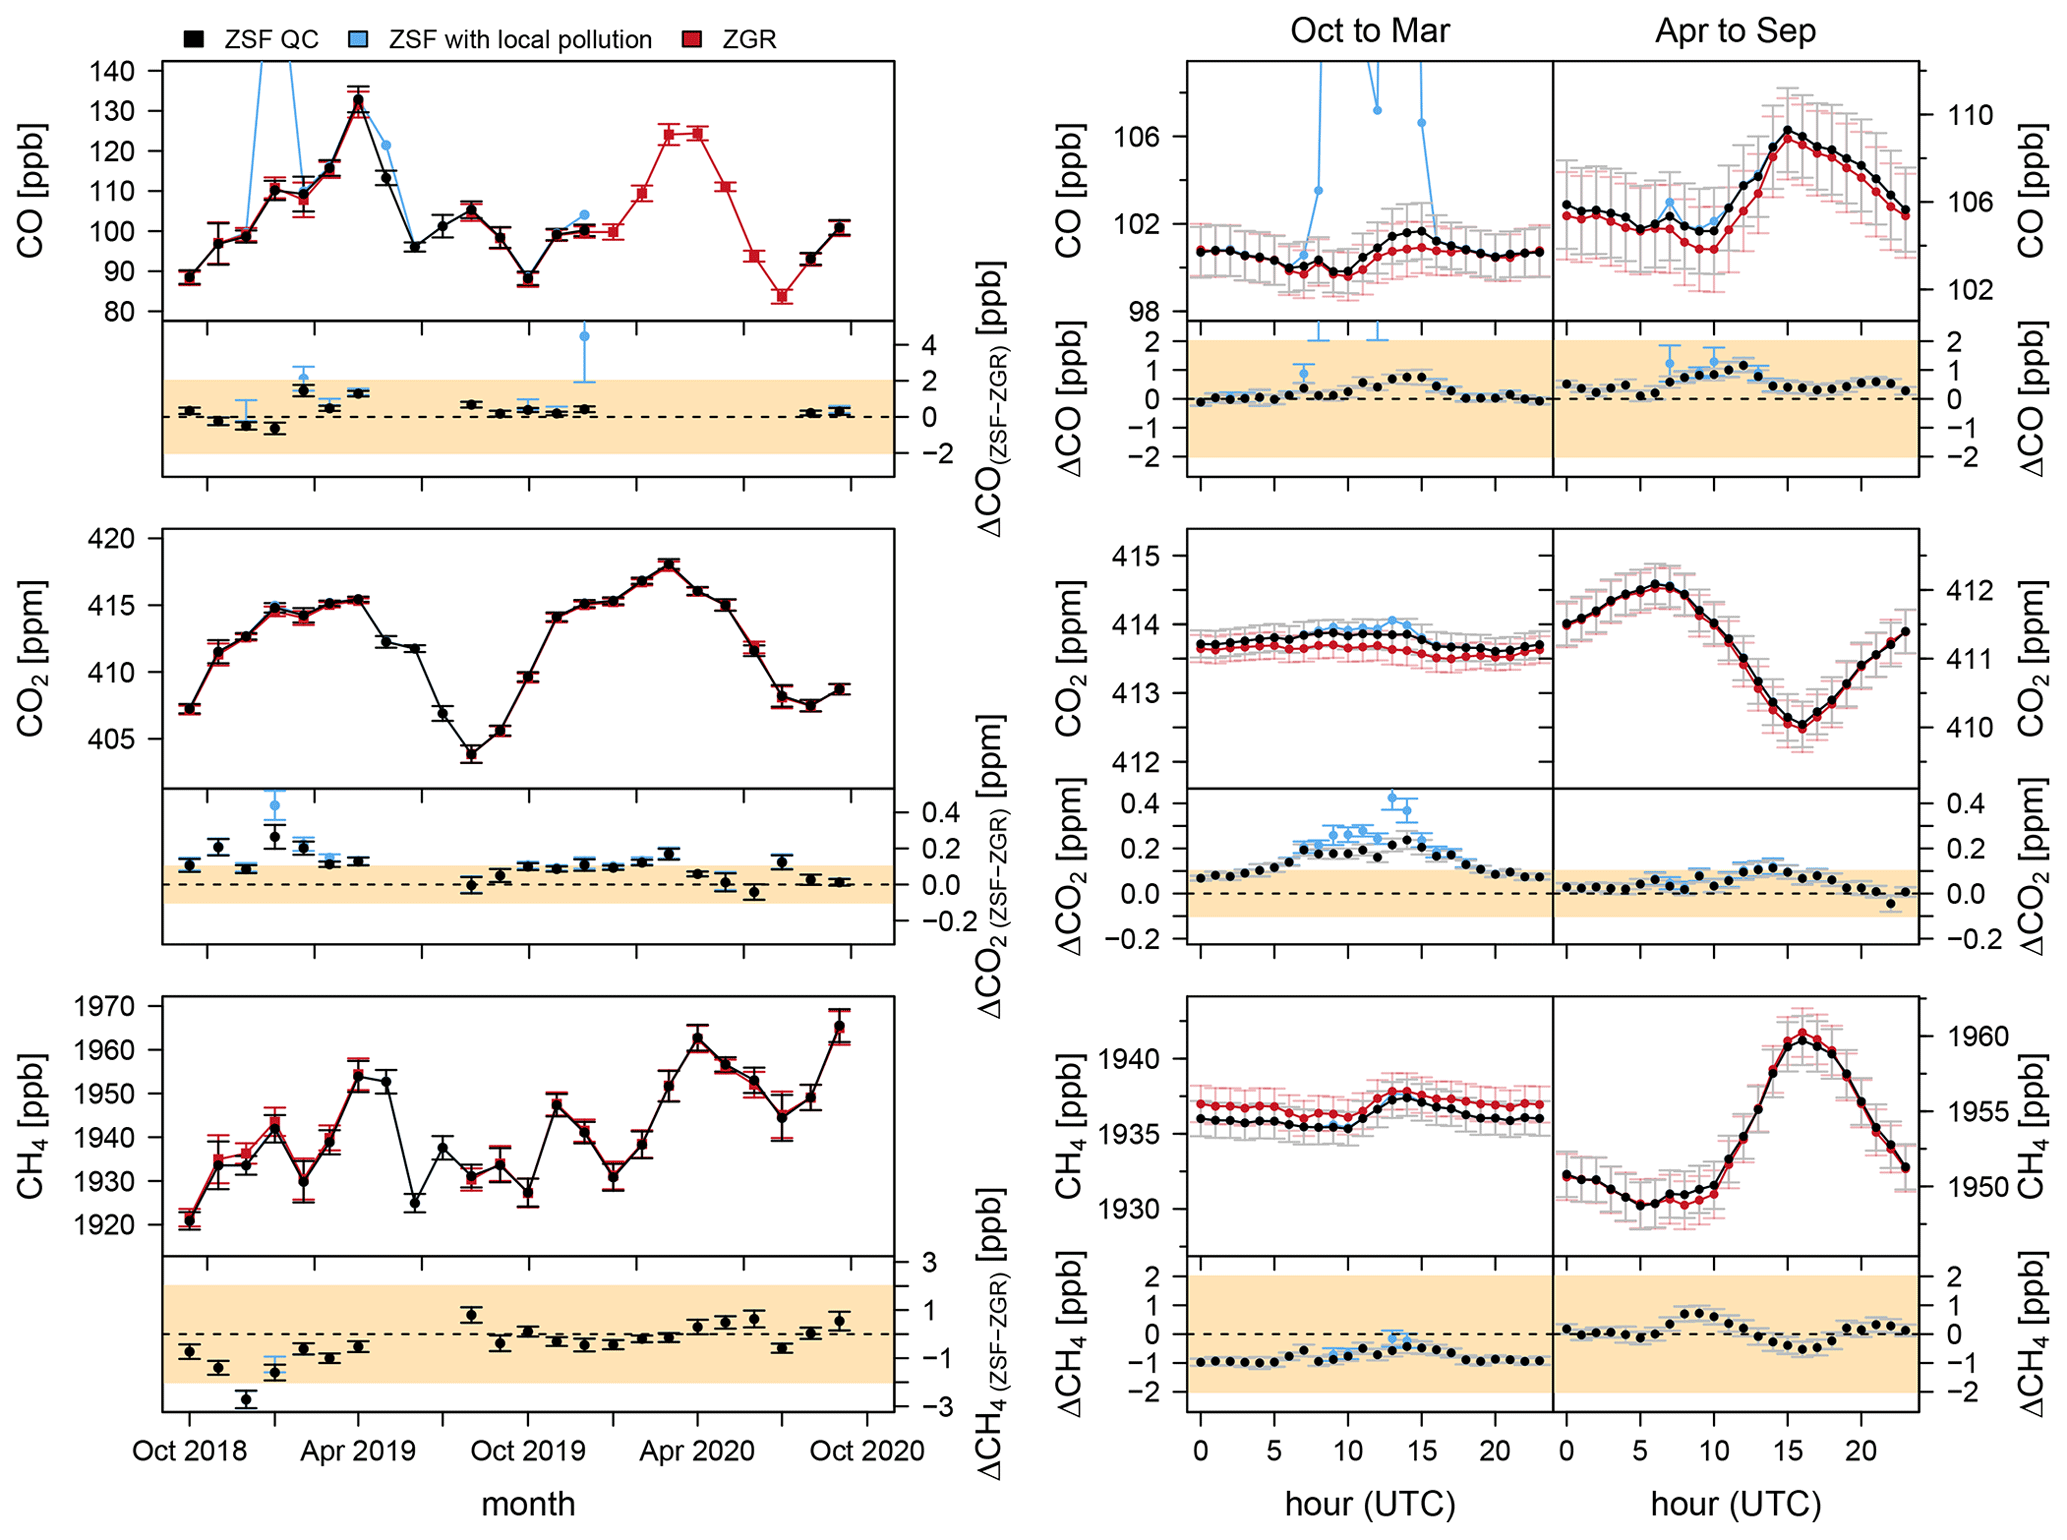
Figure 7Annual and diurnal cycles in the Schneefernerhaus (ZSF QC: black, ZSF with local pollution: blue) and mountain ridge (ZGR: red) measurements. In addition, the difference between the Schneefernerhaus and mountain ridge data is shown. The error bars are the standard errors in the averages. The beige-coloured areas correspond to the WMO compatibility goals (WMO, 2020).
The general pattern of the annual and diurnal cycles of CO, CO2 and CH4 measured at the Schneefernerhaus and the mountain ridge are similar to those of other mountain stations in the Northern Hemisphere (Thoning et al., 1989; De Wekker et al., 2009). The diurnal cycles are mainly determined by the planetary boundary layer height and convective upslope winds (Yuan et al., 2019). Depending on the season and the time of day, the air masses of the free troposphere or the planetary boundary layer are measured. Since air from the planetary boundary layer is typically more polluted in CO and CH4, higher values are measured during the day especially in summer. Since CO2 uptake by the biosphere reduces the CO2 mole fraction in the boundary layer, the CO2 mole fraction measured at Zugspitze is lower during the day in summer.
In the following, the difference between the Schneefernerhaus and mountain ridge measurements is discussed in more detail. The monthly averaged CO and CH4 mole fractions measured at the Schneefernerhaus (ZSF QC) and the mountain ridge (ZGR) as well as the diurnal cycles for both locations do not show differences below the recommended compatibility of 2 ppb. For CH4, a small annual cycle in the differences can be noticed, with slightly positive values in summer and negative values in winter. The especially low CH4 mole fractions at the Schneefernerhaus between November 2018 and January 2019 compared to the mountain ridge are caused by particularly frequent and strong inverse CH4 spikes in the Schneefernerhaus time series (see Sect. 3.3).
The monthly CO2 mole fractions measured at the Schneefernerhaus are comparable to those at the mountain ridge in summer. However, stronger deviations are observed in winter. In addition, the diurnal CO2 cycle at the Schneefernerhaus shows up to 0.24 ppm higher values in the afternoon than at the mountain ridge, although the strong local pollution events in the Schneefernerhaus time series are already excluded. Otherwise, the difference would be up to 0.35 ppm in winter. The difference between the diurnal cycles at the Schneefernerhaus and at the mountain ridge in the afternoon decreases in summer compared to winter, but it does not disappear completely. Thus, the Schneefernerhaus ZSF QC time series still show influences from local or regional sources in winter and during the day, which are not visible at the mountain ridge due to the higher elevation, complex wind pattern (see Appendix A1 and Fig. A2) and the topography of Zugspitze.
Other mountain stations also show local influences, which depend on the season and time of day. At Jungfraujoch, the diurnal cycle of CO2 between measurements at the usual location and a less polluted site deviate up to 0.4 ppm in winter and up to 1.3 ppm in summer (Affolter et al., 2021). Thus, the CO2 measurement at Jungfraujoch is more strongly influenced in summer, which is probably due to the larger number of tourists. At the Schneefernerhaus, on the other hand, the strongest influence was observed in winter.
3.7 Working day dependency in the Schneefernerhaus time series
In this study, a more frequent occurrence of CO and CO2 spikes during the day was found, which can be attributed to anthropogenic activities. In addition to the diurnal dependence, these local pollution events also have a working day dependence. Thus, 92 % of the data points that were manually excluded due to local pollution occur on weekdays and not at weekends.
In a previous study by Yuan et al. (2019), which analysed the CO2 time series at the Schneefernerhaus between 2002 and 2016, a weekly cycle in the CO2 measurement with lower CO2 mole fractions at weekends and higher CO2 mole fractions on weekdays is described. Additionally, they found stronger diurnal cycles on weekdays with higher values, especially in the morning, for the combined time period 2002 to 2016. They explained these findings by local anthropogenic working activities at the Schneefernerhaus.
When analysing the Schneefernerhaus and mountain ridge measurements between October 2018 and October 2020 for the weekly cycle and stronger diurnal cycles, no working day dependencies were detected for either the CO2 or the CO and CH4 data. Therefore, we investigated the CO2 time record for the Schneefernerhaus between 2002 and 2021, similar to Yuan et al. (2019). A statistical analysis was performed using the resampling technique described in Daniel et al. (2012) to determine if a weekly cycle showed a significant pattern. No significant weekend effect (mean weekend value minus mean weekday value) occurred until 2007 and after 2014. However, significantly higher values were evident during the week in the data between 2008 and 2014 (Fig. A3). Furthermore, the average diurnal CO2 cycles at weekends were comparable for the three time periods 2002–2007, 2008–2014 and 2015–2021, which is not the case for weekdays. A strong difference of up to 1.5 ppm was noticed between the diurnal CO2 cycles at weekends and on weekdays in the time periods 2002–2007 and 2008–2014 (Fig. A4). Such a difference is not noticeable in the CO2 data from 2015 to 2021.
A micro-leakage in the inlet system could explain the noticed weekend effect and the higher CO2 values during the day on weekdays, as the strongest effect would be noticeable during the working hours when the CO2 mole fraction in the laboratory is higher. Between 2014 and 2015, the entire measurement setup, including the intake system, was thoroughly checked for leakages, and old connections were renewed. In the process, the high temporal-resolution CO2 measurements of the CRDS analyser were also used. Presumably, the micro-leakage was fixed at that time, as no working day dependency has been detectable since then.
Ambient air measured at the Schneefernerhaus with high temporal resolution showed local pollution events caused by human activities, especially in CO and CO2. These peaks occur mainly in the winter season and during the day. Therefore, approximately 2 % of the measured data were flagged manually by the station manager.
To prevent the influence of this local pollution, additional measurements were taken at a more elevated location for comparison. This study showed that the atmospheric mole fractions of CO, CO2 and CH4 can be measured at the mountain ridge using a 290 m long intake line. The time series determined in this way does not show a strong influence of local pollution events, unlike the measurements at the Schneefernerhaus.
The comparison of measurements performed at the Schneefernerhaus with baseline time series from the mountain ridge characterises the local influence on the CO, CO2 and CH4 time series. It is confirmed that strong local pollution events at the Schneefernerhaus can be successfully removed from the Schneefernerhaus time series by the station manager. No significant difference in the annual cycle of CO and CH4 for the Schneefernerhaus time series with manually flagged pollution events and the mountain ridge could be noticed, and the diurnal cycles were similar at both locations, too. The annual and diurnal cycles in CO2 measured at the Schneefernerhaus and the mountain ridge also show the same pattern. In summer the difference between monthly values and diurnal cycles is negligible. In winter, however, higher CO2 mole fractions occur at the Schneefernerhaus especially during the day, which indicates a small impact of local or regional pollution that is not yet excluded.
With the exception of slightly elevated CO2 mole fractions during the day, the CO, CO2 and CH4 measurements at the Schneefernerhaus station are also consistent with the background measured at the mountain ridge. However, as it is difficult to maintain the 290 m intake line, especially in the winter months, and thus to ensure continuous series of measurements on the mountain ridge, it is important to continue measurements at both sites in the future.
A1 Wind pattern
The wind direction and wind velocity at the Schneefernerhaus and at the Zugspitze summit are measured by DWD, and at the mountain ridge they are measured by the Environmental Research Station Schneefernerhaus (UFS – Umweltforschungsstation Schneefernerhaus). Figure A2 shows the wind roses computed from the available wind direction and the wind velocity at the three locations between October 2018 and October 2020. The colours indicate different wind speed ranges. The wind direction measured at the Schneefernerhaus and at the mountain ridge is most likely influenced by the characteristic locations and thus by the topography of the mountain. The mountain ridge above the Schneefernerhaus runs largely from west to east, so the Schneefernerhaus is on the southern slope of the mountain. Therefore, north and south winds are more frequently measured on the mountain ridge and the main wind directions at the Schneefernerhaus are east and west. At the Zugspitze summit, the inflow of air masses is less restricted, with more frequent winds from the northwest, southwest and southeast. Furthermore, the average wind velocity at the summit is 6.0 m s−1 and therefore larger than that at the mountain ridge (4.0 m s−1) or the Schneefernerhaus (3.2 m s−1).
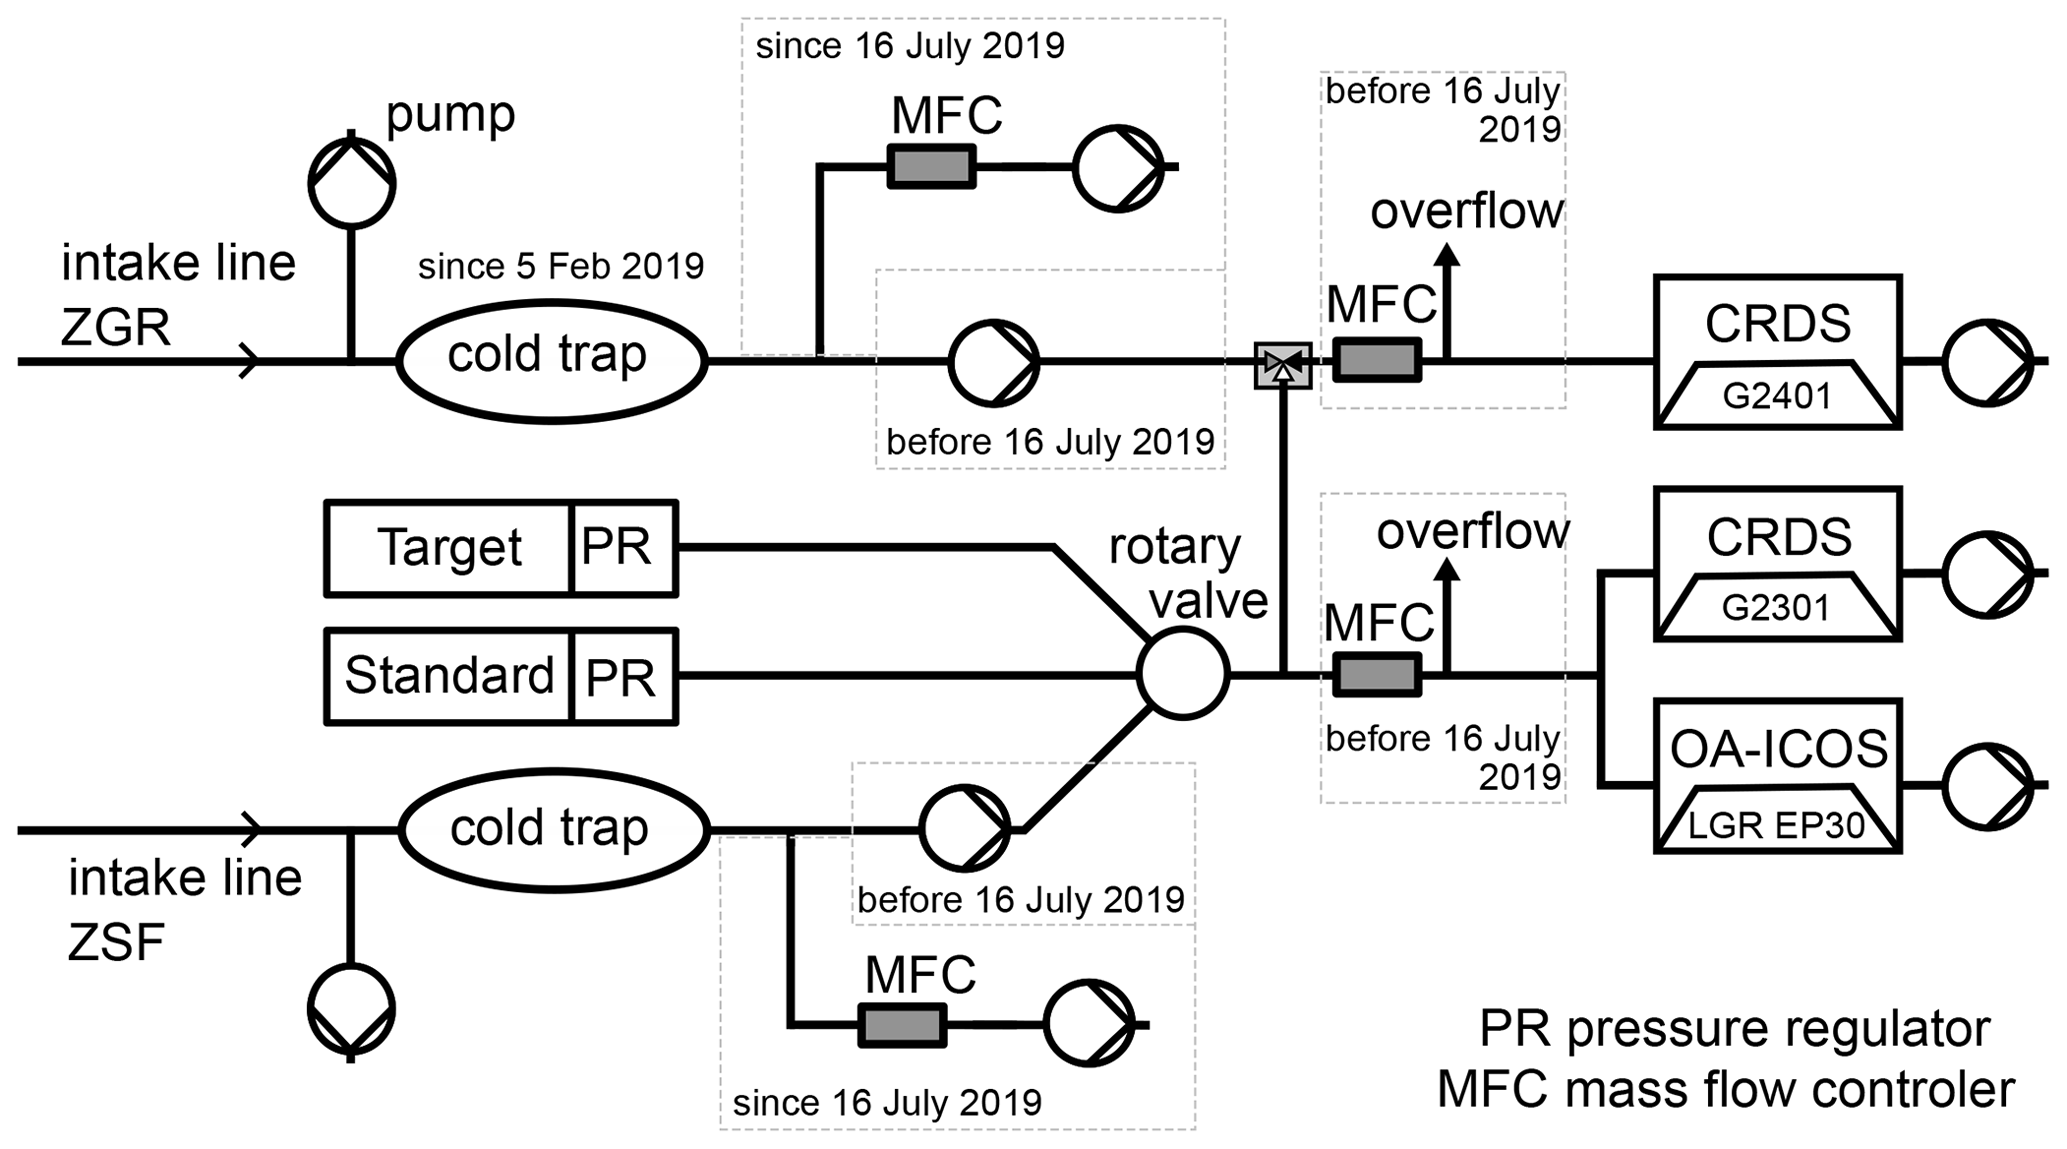
Figure A1Experimental setup to measure CO, CO2 and CH4 in ambient air from the Schneefernerhaus and from the mountain ridge.
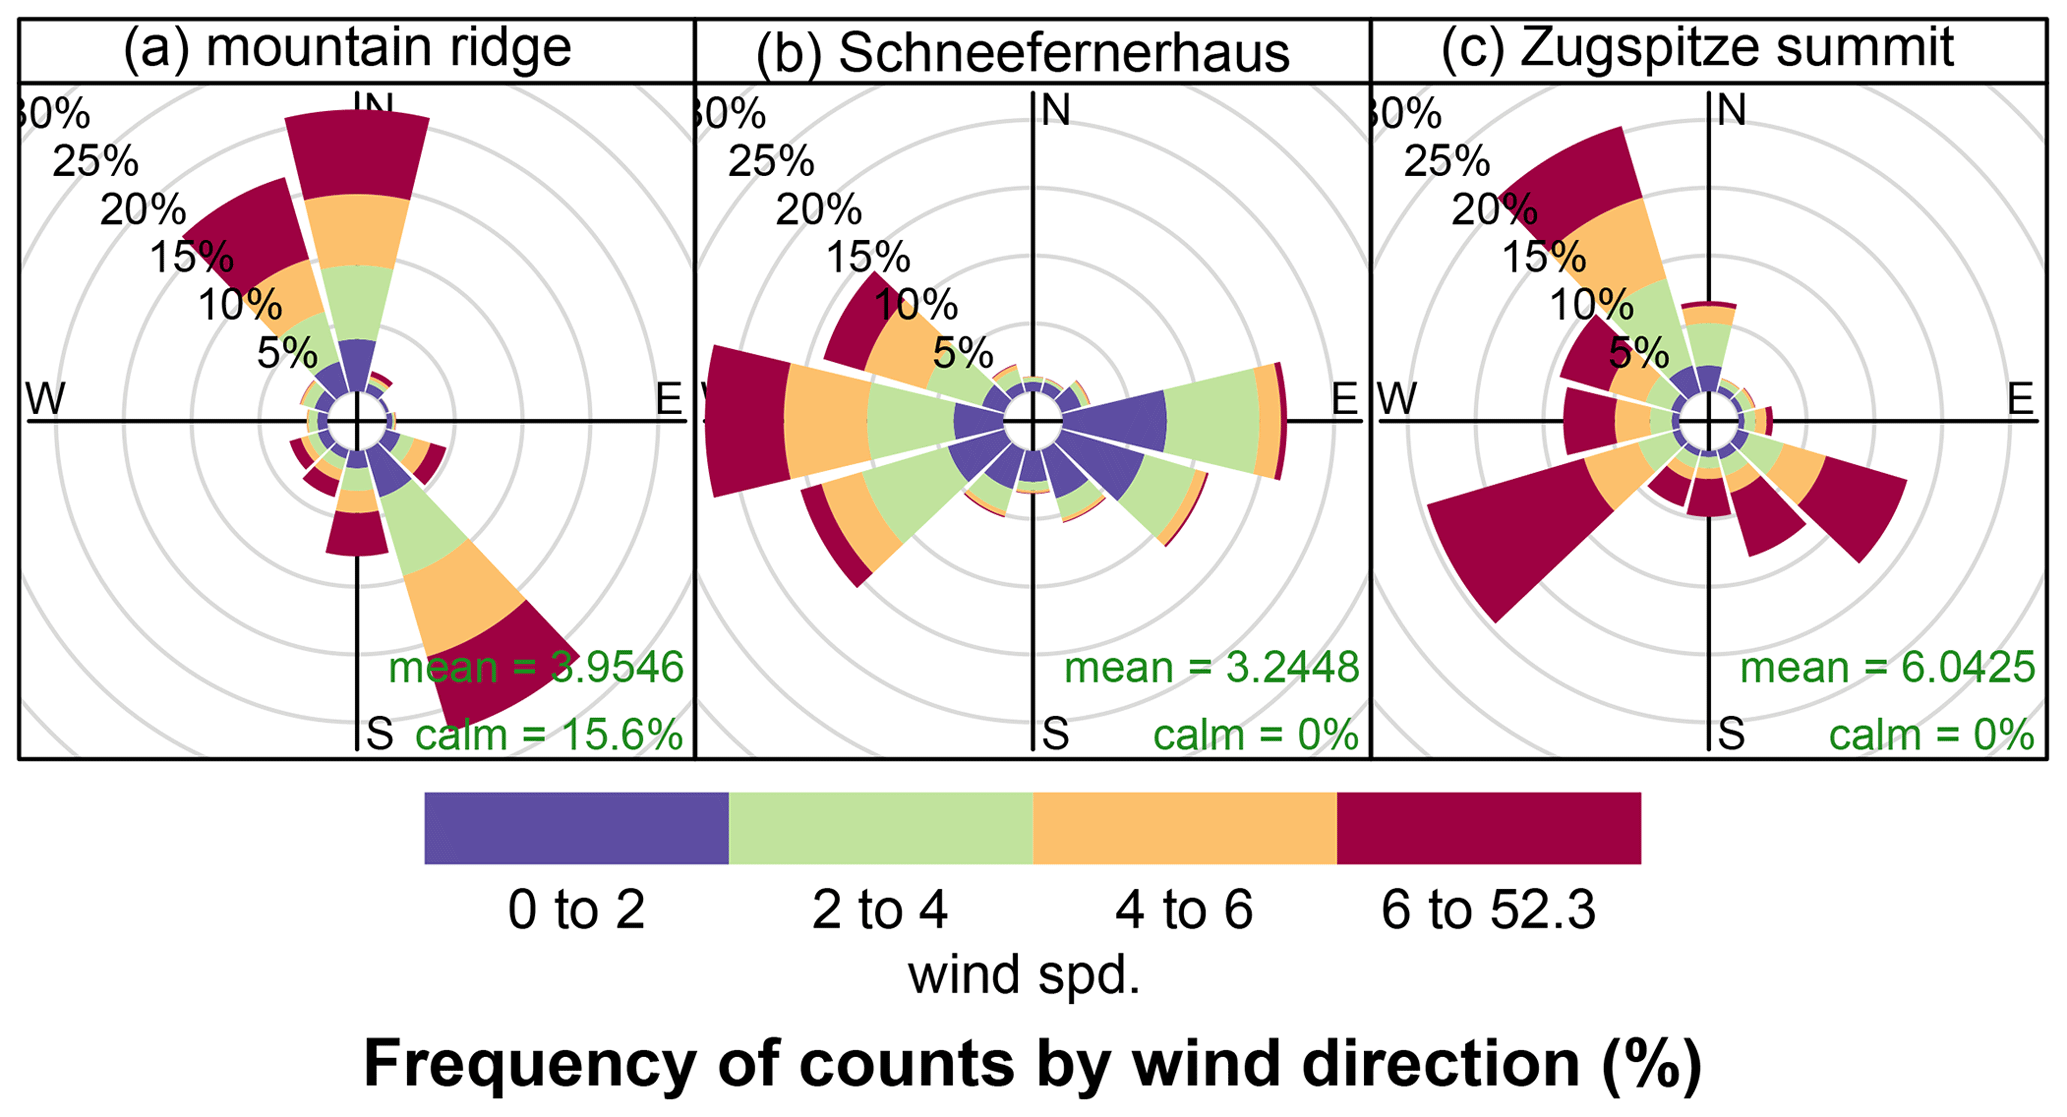
Figure A2Wind rose plots for the mountain ridge (a), the Schneefernerhaus (b) and Zugspitze summit (c) showing the wind directions and wind velocities between October 2018 and October 2020 provided by UFS (mountain ridge) and by DWD (Schneefernerhaus and Zugspitze summit). The colours correspond to different wind speed ranges.
A2 Working day dependency in the Schneefernerhaus time series between 2002 and 2021
To determine if the CO2 mole fraction is generally higher on weekdays than at weekends, the data were detrended by subtracting a moving 31 d mean to remove the annual cycle. Since we are interested in the average variations within a week, weeks with missing days were excluded. A statistical analysis was performed using the resampling technique described in Daniel et al. (2012) to identify if a weekly cycle shows a significant pattern. For each year, we tested whether the weekend effect magnitude (mean weekend value minus mean weekday value) was significant. Until 2007, no significant (p > 0.1) weekend effect was noticeable. Between 2008 and 2014 every year except 2013 showed a significant (p < 0.1) weekend effect. No weekend effect has been visible since 2015. Therefore, we separate the CO2 time series into three parts: 2002–2007, 2008–2014 and 2015–2021. Figure A3 shows the weekly cycles for all three time intervals. Even visually, the difference between the weekly cycles for 2008–2014 and the other two time periods is obvious. As expected, the weekly cycle for the time interval 2015–2021 shows no significant (p < 0.05) weekend effect, as does the weekly cycle for the time period 2008–2014. A slight tendency towards higher values during the week can also be observed for the 2002–2007 time interval compared to the 2015–2021 period. However, the variation is so small that the significance test (p < 0.05) shows no significant weekend effect for the period 2002–2007.

Figure A3Weekly cycles in CO2 measured at the Schneefernerhaus during three time periods: 2002–2007 (blue), 2008–2014 (red), 2015–2021 (black). The CO2 mole fraction is detrended by subtracting the moving 31 d average, and weeks with missing days were excluded before averaging for each day of the week.
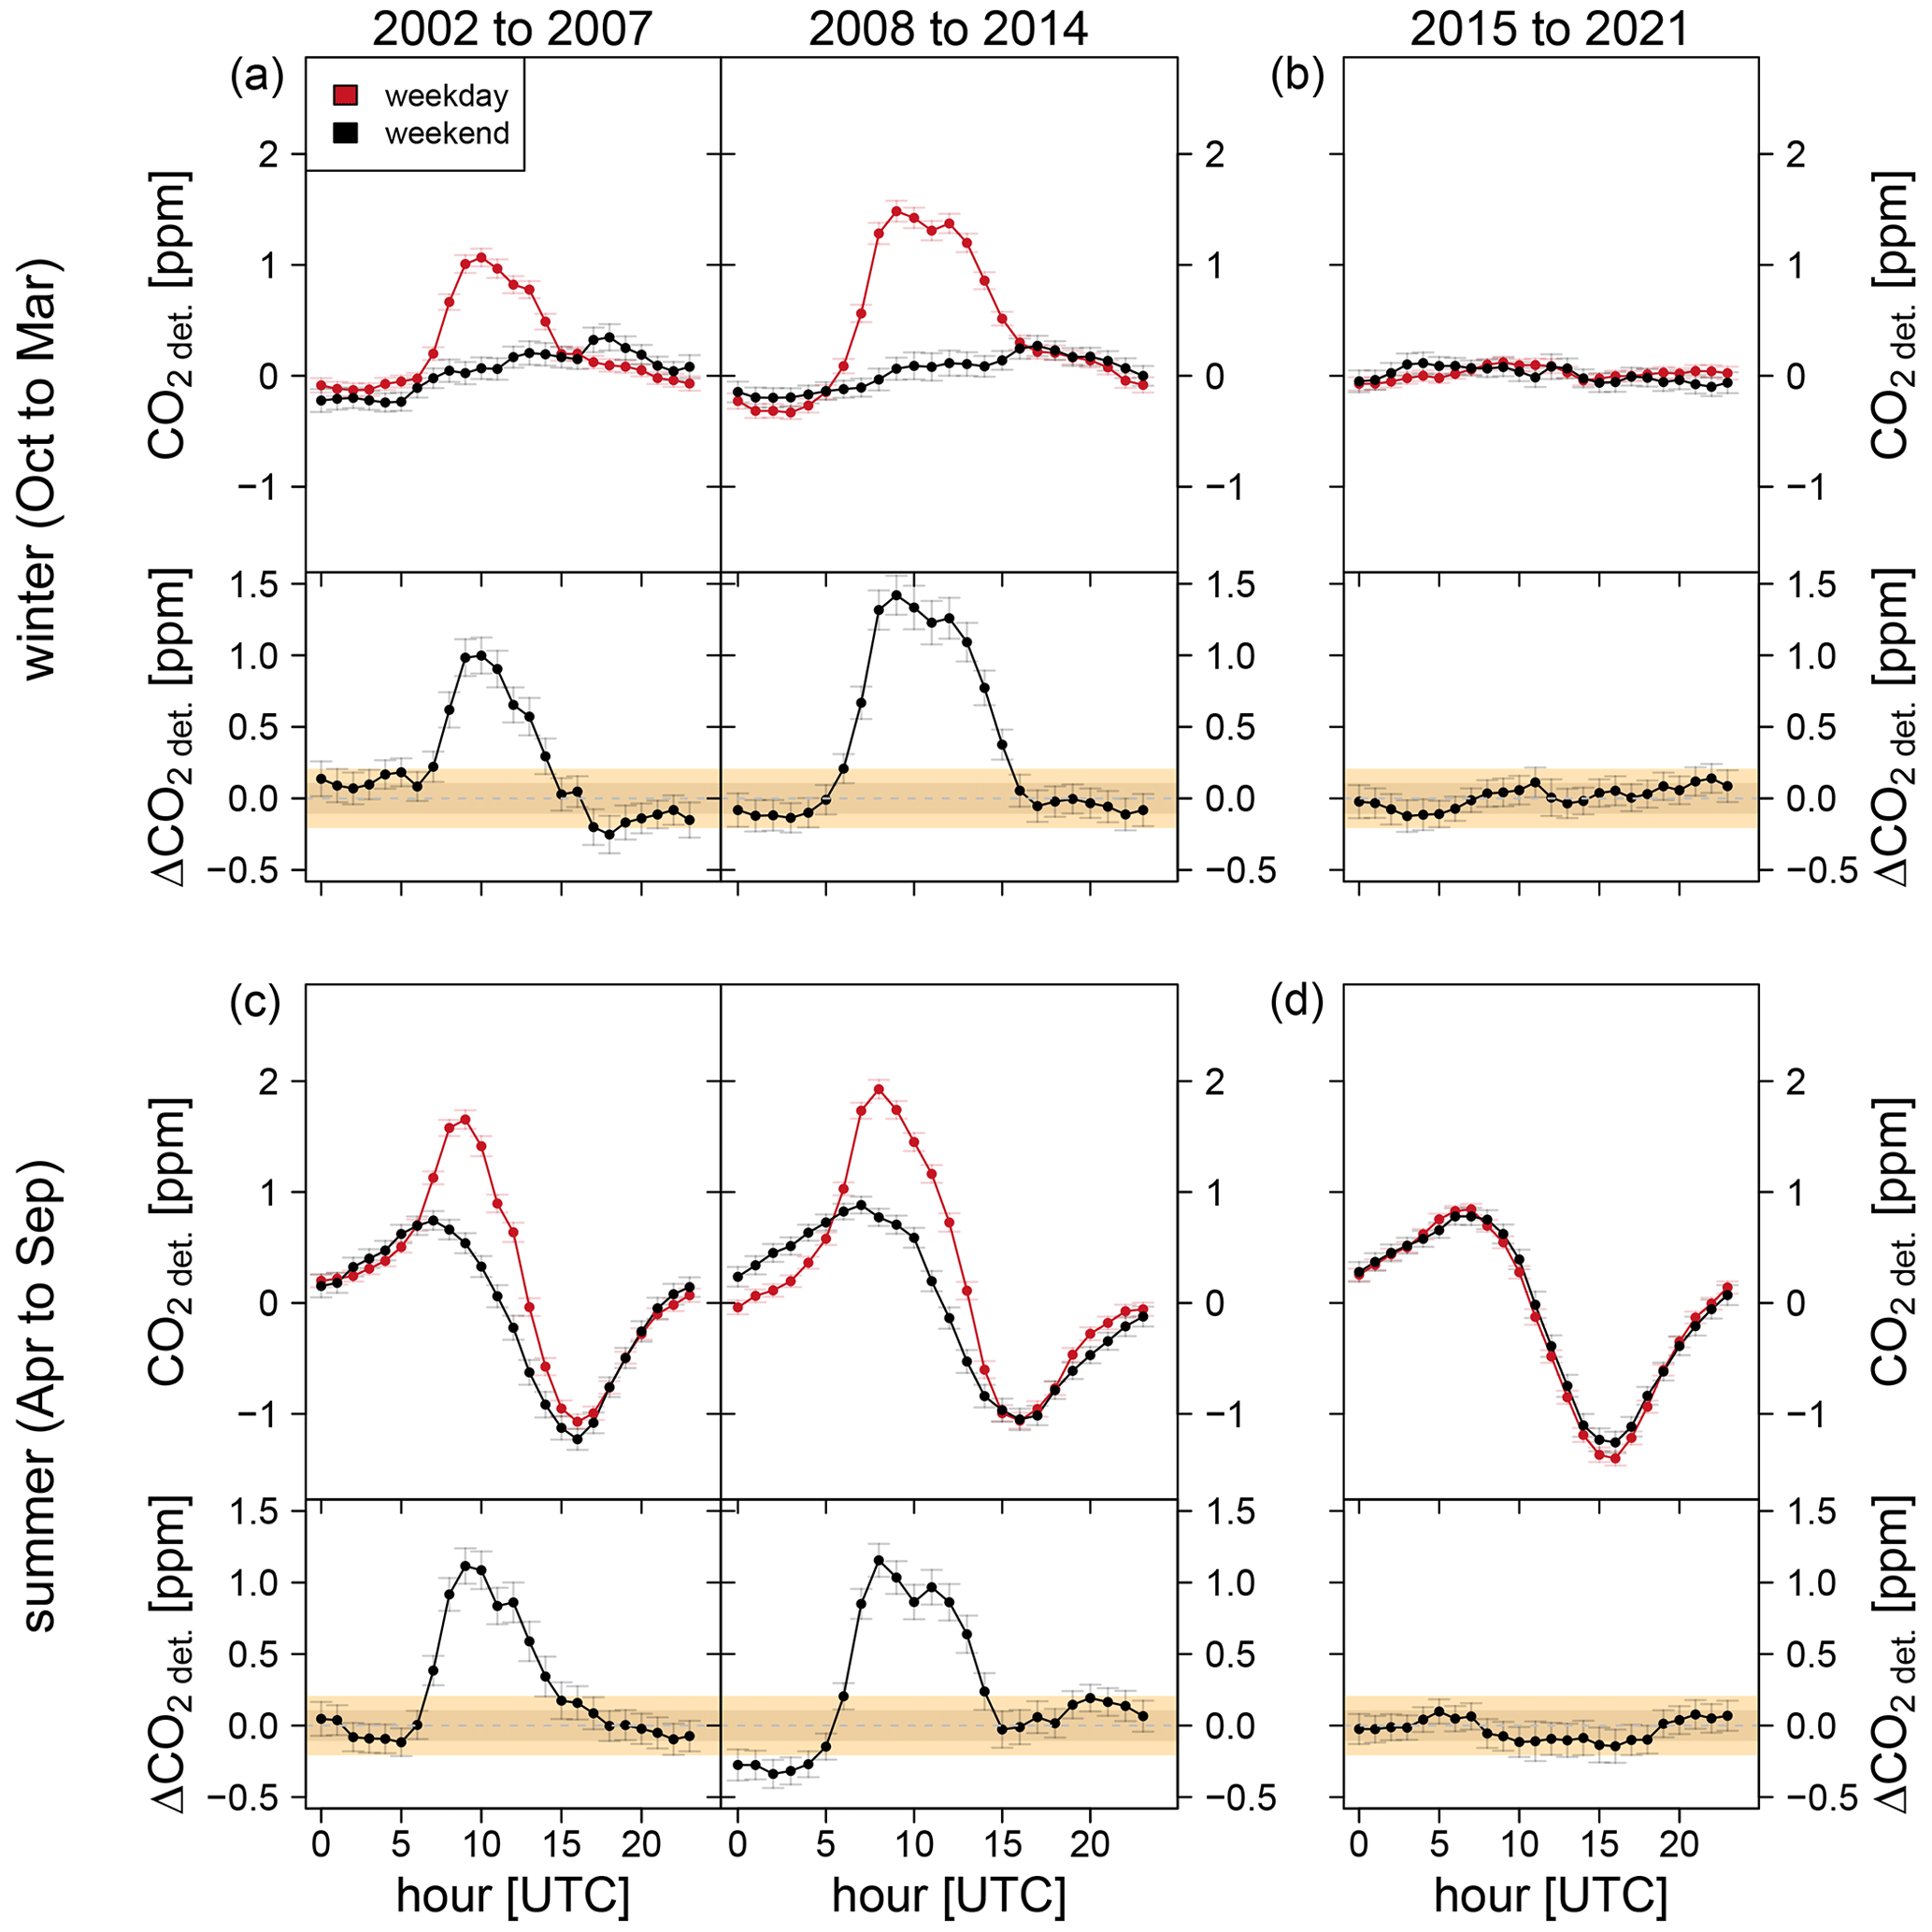
Figure A4Mean diurnal cycles for the Schneefernerhaus calculated from the weekend and weekday data between 2002 and 2021 for two seasons. Diurnal cycles calculated using weekday data are coloured red, and those using weekend data are in black. Panels (a) and (b) correspond to the seasons October to March, and panels (c) and (d) correspond to April to September. The cycles in the lower part of all panels show the difference between weekdays and weekends. The beige-coloured areas correspond to the normal and extended WMO compatibility goals (WMO, 2020).
Furthermore, we calculated the mean diurnal cycles for weekends and weekdays for each year. Before averaging, each single diurnal cycle is subtracted by the average nighttime (18:00 to 06:00 UTC) CO2 mole fraction. For the years 2002 to 2014, a similar working day dependency can be noticed as reported by Yuan et al. (2019), with much stronger diurnal cycles on weekdays than at weekends. Since 2015, the difference in the diurnal cycles between weekdays and weekends disappeared. Figure A4 shows the diurnal cycles for weekdays and weekends for the winter (October to March) and summer (April to September). The weekday (Monday to Friday) diurnal cycles are shown in red and weekend cycles (Saturday and Sunday) in black. In addition, the differences between averaged weekday and weekend values are shown. For the first two time periods (2002–2007 and 2008–2014), stronger CO2 peaks (05:00 to 15:00 UTC) were noticed during weekdays, which did not occur at weekends. The difference between weekdays and weekends was lower than 0.2 ppm during the night and reached values between 1 and 1.5 ppm during the day. In the time period 2015–2021 the diurnal cycles of weekends and weekdays showed no strong differences, with values lower than 0.2 ppm for the whole day. Comparing the three periods, it was further noticed that the diurnal cycles of weekends have the same amplitude and shape, especially in summer.
Yuan et al. (2019) explained the working day dependencies by local anthropogenic working activities at the Schneefernerhaus. This seems plausible, since the main increase in CO2 occurred during working hours on weekdays. The tourist activities around the Schneefernerhaus are, on the other hand, normally stronger at weekends than on weekdays. However, the absence of the weekly cycle and of the difference in the diurnal cycles of weekday and weekend data since 2015 implicate a relevant change in the working activities at the Schneefernerhaus that did not occur. It is more likely that a micro-leakage in the inlet system caused higher CO2 values during the week until it was fixed between 2014 and 2015. The micro-leakage affected the measured CO2 mole fractions only during working hours, when the CO2 mole fraction inside the laboratory was much higher due to the presence of humans. The analysis has shown that nowadays there is no strong impact of local pollution at weekends or on weekdays.
The high-resolution (1 min) CO, CO2 and CH4 records of the Zugspitze Schneefernerhaus (ZSF) and the mountain ridge (ZGR) used in this study are available on request from the data owner (cedric.couret@uba.de). Hourly averaged CO, CO2 and CH4 records of the Zugspitze Schneefernerhaus (ZSF) are openly available from the World Data Centre for Greenhouse Gases (WDCGG) at the following URL: https://gaw.kishou.go.jp (World Data Centre for Greenhouse Gases, 2022).
AH and MS designed the study together with CC. AH evaluated the data and wrote the paper with the help of MS, CC and BH. CC was responsible for the greenhouse gas measurements at the Schneefernerhaus and at the mountain ridge.
The contact author has declared that none of the authors has any competing interests.
Publisher’s note: Copernicus Publications remains neutral with regard to jurisdictional claims in published maps and institutional affiliations.
The authors would like to thank the German Meteorological Service (DWD – Deutscher Wetterdienst) for providing the intake line to the mountain ridge. We also thank Gabriele Frank (DWD) and Josef Salvamoser (IGU – Institut für angewandte Isotopen-, Gas- und Umweltuntersuchungen) for making it possible to use the intake line to the mountain ridge for our comparison measurements. Our thanks also go to the UFS team for maintaining the intake lines and operating the weather station on the mountain ridge.
We wish to thank Frank Meinhardt and Ludwig Ries for their great support in these cooperation projects between the German Environment Agency (UBA) and Heidelberg University.
This research has been supported by the Umweltbundesamt (Project 95297 and Project 167847 grants).
This paper was edited by Gerrit Kuhlmann and reviewed by two anonymous referees.
Affolter, S., Schibig, S., Berhanu, T., Bukowiecki, N., Steinbacher, M., Nyfeler, P., Hervo, M., Lauper, J. and Leuenberger, M.: Assessing local CO2 contamination revealed by two near-by high altitude records at Jungfraujoch, Switzerland, Environ. Res. Lett., 16, 044037, https://doi.org/10.1088/1748-9326/abe74a, 2021. a, b, c
Bousquet, P., Gaudry, A., Ciais, P., Kazan, V., Monfray, P., Simmonds, P. G.,Jennings, S. G., and O'Connor, T. C.: Atmospheric CO2 concentration variations recorded at Mace Head, Ireland, from 1992 to 1994, Phys. Chem. Earth, 21, 477–481, 1996. a
Ciattaglia, L.: Interpretation of atmospheric CO2 measurements at Mt. Cimone (Italy) related to wind data, J. Geophys. Res., 88, 1331, https://doi.org/10.1029/JC088iC02p01331, 1983. a
Daniel, J. S., Portmann, R. W., Solomon, S., and Murphy, D. M.: Identifying weekly cycles in meteorological variables: The importance of an appropriate statistical analysis, J. Geophys. Res.-Atmos., 117, 14, https://doi.org/10.1029/2012jd017574, 2012. a, b
De Wekker, S. F., Ameen, A., Song, G., Stephens, B. B., Hallar, A. G., and McCubbin I. B.: A preliminary investigation of boundary layer effects on daytime atmospheric CO2 concentrations at a mountaintop location in the Rocky Mountains, Acta Geophys., 57, 904–922, https://doi.org/10.2478/s11600-009-0033-6, 2009. a
Dlugokencky, E.: NOAA/GML, https://gml.noaa.gov/ccgg/trends_ch4/, last access: 23 June 2022. a
Dlugokencky, E. and Tans, P.: NOAA/GML, https://gml.noaa.gov/ccgg/trends/, last access: 23 June 2022. a
El Yazidi, A., Ramonet, M., Ciais, P., Broquet, G., Pison, I., Abbaris, A., Brunner, D., Conil, S., Delmotte, M., Gheusi, F., Guerin, F., Hazan, L., Kachroudi, N., Kouvarakis, G., Mihalopoulos, N., Rivier, L., and Serça, D.: Identification of spikes associated with local sources in continuous time series of atmospheric CO, CO2 and CH4, Atmos. Meas. Tech., 11, 1599–1614, https://doi.org/10.5194/amt-11-1599-2018, 2018. a
Etheridge, D. M., Steele, L. P., Langenfelds, R. L., Francey, R. J., Barnola, J. M., and Morgan, V. I.: Natural and anthropogenic changes in atmospheric CO2 over the last 1000 years from air in Antarctic ice and firn, J. Geophys. Res.-Atmos., 101, 4115–4128, https://doi.org/10.1029/95jd03410, 1996. a, b
Etheridge, D. M., Steele, L. P., Francey, R. J., and Langenfelds, R. L.: Atmospheric methane between 1000 AD and present: Evidence of anthropogenic emissions and climatic variability, J. Geophys. Res.-Atmos., 103, 15979–15993, https://doi.org/10.1029/98jd00923, 1998. a, b
Frank, G., Salvamoser, J., Steinkopff, T., and Ries, L.: Radon-222 und Beryllium-7 als natürlicher tracer, UFS-Wissenschaftliche Resultate 2015/2016, Hrg. Umweltforschungsstation Schneefernerhaus GmbH, 2017. a
Ghasemifard, H., Yuan, Y., Luepke, M., Schunk, C., Chen, J., Ries, L., Leuchner, M., and Menzel, A.: Atmospheric CO2 and delta C-13 Measurements from 2012 to 2014 at the Environmental Research Station Schneefernerhaus, Germany: Technical Corrections, Temporal Variations and Trajectory Clustering, Aerosol Air Qual. Res., 19, 657–670, https://doi.org/10.4209/aaqr.2018.01.0010, 2019a. a
Ghasemifard, H., Vogel, F. R., Yuan, Y., Luepke, M., Chen, J., Ries, L., Leuchner, M., Schunk, C., Vardag, S. N., and Menzel, A.: Pollution Events at the High-Altitude Mountain Site Zugspitze-Schneefernerhaus (2670 m a.s.l.), Germany, Atmosphere, 10, 17, https://doi.org/10.3390/atmos10060330, 2019b. a
Giemsa, E., Jacobeit, J., Ries, L., and Hachinger, S.: Investigating regional source and sink patterns of Alpine CO2 and CH4 concentrations based on a back trajectory receptor model, Environ. Sci Eur., 31, 24, https://doi.org/10.1186/s12302-019-0233-x, 2019. a
Gomez-Pelaez, A. J., Ramos, R., Cuevas, E., Gomez-Trueba, V., and Reyes, E.: Atmospheric CO2, CH4, and CO with the CRDS technique at the Izaña Global GAW station: instrumental tests, developments, and first measurement results, Atmos. Meas. Tech., 12, 2043–2066, https://doi.org/10.5194/amt-12-2043-2019, 2019. a
Keeling, C. D., Bacastow, R. B., Bainbridge, A. E., Ekdahl, C. A., Guenther, P. R., Waterman, L. S., and Chin, J. F. S.: Atmospheric carbon dioxide variations at Mauna Loa Observatory, Hawaii, Tellus, 28, 538–551, 1976. a, b
Navascues, B. and Rus, C.: Carbon dioxide observations at Izaña baseline station, Tenerife (Canary Islands): 1984–1988, Tellus, 43B, 118–125, 1991. a
Reiter, R., Sladkovic, R., and Kanter, H.-J.: Concentration of trace gases in the lower troposphere, simultaneously recorded at neighboring mountain stations Part I: Carbon Dioxide, Meteorl. Atmos. Phys., 35, 187–200, https://doi.org/10.1007/BF01041811, 1986. a
Schibig, M. F., Mahieu, E., Henne, S., Lejeune, B., and Leuenberger, M. C.: Intercomparison of in situ NDIR and column FTIR measurements of CO2 at Jungfraujoch, Atmos. Chem. Phys., 16, 9935–9949, https://doi.org/10.5194/acp-16-9935-2016, 2016. a
Schmidt, M., Graul, R., Sartorius, H., and Levin, I.: Carbon dioxide and methane in continental Europe: A climatology, and (222)Radon-based emission estimates, Tellus B, 48, 457–473, https://doi.org/10.3402/tellusb.v48i4.15926, 1996. a
Sturm, P., Leuenberger, M., and Schmidt, M.: Atmospheric O2, CO2 and δ13C observations from the remote sites Jungfraujoch, Switzerland, and Puy de Dôme, France, Geophys. Res. Lett., 32, 2467, https://doi.org/10.1029/2005GL023304, 2005. a
Thoning, K. W., Tans, P. P., and Komhyr, W. D.: Atmospheric carbon dioxide at Mauna Loa Observatory: 2. Analysis of the NOAA GMCC data, 1974–1985, J. Geophys. Res.-Atmos., 94, 8549–8565, https://doi.org/10.1029/JD094iD06p08549, 1989. a
UFS 2020: Environmental Research Station Schneefernerhaus, https://www.schneefernerhaus.de, last access: 24 September 2020. a
WMO 2020: 20th WMO/IAEA Meeting on Carbon Dioxide, Other Greenhouse Gases and Related Measurement Techniques (GGMT-2019), Jeju Island, South Korea 2–5 September 2019, GAW Report No. 255, 2020. a, b, c, d, e
World Data Centre for Greenhouse Gases: https://gaw.kishou.go.jp, last access: 18 July 2022. a
Yuan, Y., Ries, L., Petermeier, H., Steinbacher, M., Gómez-Peláez, A. J., Leuenberger, M. C., Schumacher, M., Trickl, T., Couret, C., Meinhardt, F., and Menzel, A.: Adaptive selection of diurnal minimum variation: a statistical strategy to obtain representative atmospheric CO2 data and its application to European elevated mountain stations, Atmos. Meas. Tech., 11, 1501–1514, https://doi.org/10.5194/amt-11-1501-2018, 2018. a
Yuan, Y., Ries, L., Petermeier, H., Trickl, T., Leuchner, M., Couret, C., Sohmer, R., Meinhardt, F., and Menzel, A.: On the diurnal, weekly, and seasonal cycles and annual trends in atmospheric CO2 at Mount Zugspitze, Germany, during 1981–2016, Atmos. Chem. Phys., 19, 999–1012, https://doi.org/10.5194/acp-19-999-2019, 2019. a, b, c, d, e, f, g