the Creative Commons Attribution 4.0 License.
the Creative Commons Attribution 4.0 License.
 | 25 May 2023
Improved counting statistics of an ultrafine differential mobility particle size spectrometer system
Dominik Stolzenburg
Tiia Laurila
Pasi Aalto
Joonas Vanhanen
Tuukka Petäjä
Juha Kangasluoma
Differential mobility particle size spectrometers (DMPSs) are widely used to measure the aerosol number size distribution. Especially during new particle formation (NPF), the dynamics of the ultrafine size distribution determine the significance of the newly formed particles within the atmospheric system. A precision quantification of the size distribution and derived quantities such as new particle formation and growth rates is therefore essential. However, size-distribution measurements in the sub-10 nm range suffer from high particle losses and are often derived from only a few counts in the DMPS system, making them subject to very high counting uncertainties. Here we show that a CPC (modified Airmodus A20) with a significantly higher aerosol optics flow rate compared to conventional ultrafine CPCs can greatly enhance the counting statistics in that size range. Using Monte Carlo uncertainty estimates, we show that the uncertainties of the derived formation and growth rates can be reduced from 10 %–20 % down to 1 % by deployment of the high statistics CPC on a strong NPF event day. For weaker events and hence lower number concentrations, the counting statistics can result in a complete breakdown of the growth rate estimate with relative uncertainties as high as 40 %, while the improved DMPS still provides reasonable results at 10 % relative accuracy. In addition, we show that other sources of uncertainty are present in CPC measurements, which might become more important when the uncertainty from the counting statistics is less dominant. Altogether, our study shows that the analysis of NPF events could be greatly improved by the availability of higher counting statistics in the used aerosol detector of DMPS systems.
- Article
(859 KB) - Full-text XML
-
Supplement
(495 KB) - BibTeX
- EndNote


Differential/scanning mobility particle size spectrometer (DMPS or SMPS) systems can be used to measure the number size distribution of ambient aerosol particles ranging in size from sub-10 nm to hundreds of nanometres (Aalto et al., 2001; Wang and Flagan, 1990). The instruments typically consist of an impactor, a charger, a DMA (differential mobility analyser), and a CPC (condensation particle counter). The impactor is used to limit the maximum particle size to enable multiple charging corrections in the inversion. The charger then brings the particles to a known charge distribution (typically steady-state bipolar charging equilibrium as described by, for example, Wiedensohler, 1988), and the charged particles are size-selected in a DMA based on their electrical mobility. Finally, the number concentration is counted by condensational growth and subsequent optical detection with a CPC. The number size distribution is then determined by stepping/scanning different voltages at the DMA and the application of an inversion process if the maximum particle size, the charging probability, all the losses, and the detection efficiency are known.
As size predominantly determines the dynamics of ultrafine aerosol particles, measurements of the particle number size distribution are essential for understanding the role of aerosols in the atmospheric system. One process in which the smallest ultrafine (< 100 nm) particles are the most important is so-called atmospheric new particle formation (NPF). During NPF, small molecular clusters form from gaseous precursors and subsequently grow to larger sizes (Kulmala et al., 2013), where they can contribute to the budget of cloud condensation nuclei and impact the Earth's radiative balance (e.g. Gordon et al., 2017). To obtain an in-depth understanding of the dynamics of NPF, it is essential to measure the number size distribution down to even sub-10 nm aerosol particles accurately and reliably (Dada et al., 2020; Kulmala et al., 2012). However, there are still significant discrepancies between different particle size-distribution data sets, especially for the sub-10 nm size range (Kangasluoma et al., 2020). In the sub-10 nm size range, a large fraction of the sample (typically > 95 %) is lost in the measurement system due to diffusional losses, low charging probability, and low detection efficiency of the CPC especially in the sub-5 nm size range, emphasizing the need to acquire sufficient statistics for the counted particles.
The number of registered counts in the CPC is determined from the total size-dependent penetration of the DMPS/SMPS, the CPC aerosol flow rate through the optics, and the sampling interval for an individual size. Most recent advances in the sub-10 nm size distribution instrumentation have been focused on increasing the sampling time (Stolzenburg et al., 2017), size resolution (Kangasluoma et al., 2018), or inversion performance (Stolzenburg et al., 2022a). However, large advances are expected simply by using a CPC with a large aerosol flow rate, which linearly increases the number of counted particles. In addition, it remains unquantified to what extent improved counting statistics provide more reliable results on quantities typically inferred from sub-10 nm size distributions, such as the particle growth and formation rate. Solid uncertainty estimates for these size-distribution-derived quantities are rare (Dada et al., 2020; Kangasluoma and Kontkanen, 2017) or only provided via sophisticated inversion schemes (Ozon et al., 2021).
In the current work, we use a new laminar flow CPC (modified Airmodus A20) that has 2.5 L min−1 aerosol (and optics) flow rate within a DMPS (Kangasluoma et al., 2015). It was operated in Hyytiälä, Finland, in parallel with a TSI 3776 as the detector downstream of the same DMPS system (raw particle number size distributions are provided in Stolzenburg et al., 2023). Here, we demonstrate the improved data quality given by the larger counting statistics, perform an uncertainty analysis for the system, and finally determine the effect of the counting statistics on the calculations of the particle growth and formation rate through Monte Carlo analysis (Monte Carlo analysis software code is provided in Stolzenburg and Laurila, 2023).
2.1 Measurement setup
The measurements were performed from 24 March–19 May 2017 at the SMEAR II station (Station for Measuring Ecosystem–Atmosphere Relations; Hari and Kulmala, 2005) The station is located in Hyytiälä, southern Finland (61∘51′ N, 24∘17′ E). The DMPS system used in this measurement has a short Hauke-type DMA that was used to select particle sizes in the range of 1–40 (Aalto et al., 2001) and operated at an aerosol-to-sheath flow ratio of 4 L min−1 20 L min−1. The modified Airmodus A20 CPC and the TSI 3776 CPC measured in parallel in the DMPS system, as illustrated in Fig. 1. In parallel to this nano-DMPS setup, a long-DMPS using a different DMA (long-column Hauke DMA) but the same inlet and charger was operated simultaneously (Aalto et al., 2001). In addition, also the total aerosol number concentration above 4 nm is determined using a TSI 3775 CPC sampling outside air without an upstream DMA.
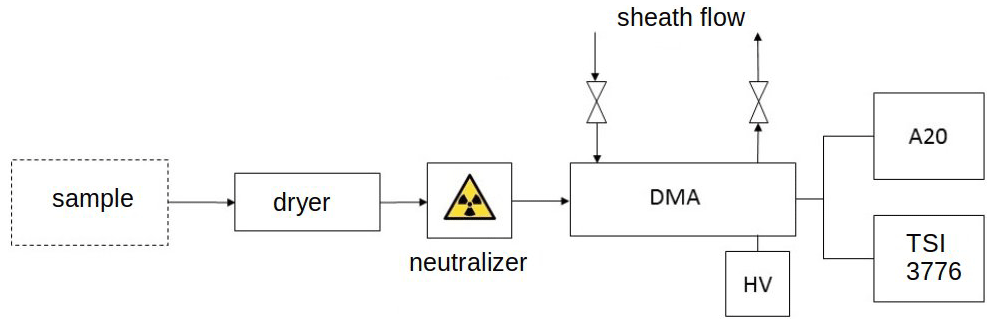
Figure 1Schematic of the measurement setup. Sample is taken from the ambient air and dried to < 40 % relative humidity, neutralized with a bipolar diffusion charger, and a DMA is used for size classification, operated at an aerosol to sheath flow ratio of 4 L min−1 20 L min−1. Downstream of the DMA the sample is split between the two CPCs.
2.2 CPCs
The modified Airmodus A20 CPC is a laminar flow CPC, where the entire sample flow is heated and saturated with butanol. The saturated sample flow goes to a multi-tube (six tubes) condenser, where the temperature is decreased to activate the aerosol particle growth by condensation, followed by optical detection. The nominal cut-off diameter, using the factory settings, of the Airmodus A20 CPC is 7 nm. The TSI 3776 CPC is also a laminar-type CPC, but in contrast to the A20 CPC, the TSI 3776 CPC utilizes the ultrafine CPC design, where the sample flow is introduced in the middle of the condenser with a capillary (Stolzenburg and McMurry, 1991). The TSI 3776 CPC was operated with the high-flow setting, where the CPC draws an inlet flow of 1.5 L min−1, of which 1.2 L min−1 is directed to a bypass. Of the remaining 0.3 L min−1, 0.25 L min−1 is used as a sheath flow and 0.05 L min−1 as the sample flow; i.e. the effective detector flow of undiluted sample in the CPC optics is only 0.05 L min−1.
Kangasluoma et al. (2015) showed that a conventional, unsheathed CPC can be tuned for even sub-3 nm particle detection by increasing the temperature difference between the saturator and the condenser and by adjusting the inlet flow rate. With the factory settings of the Airmodus A20 CPC, the saturator temperature is 39 ∘C, and the condenser temperature is 15 ∘C. The modified Airmodus A20 CPC used in this study has a saturator temperature of 44 ∘C and a condenser temperature of 10 ∘C, and the inlet flow rate was increased from 1 to 2.5 L min−1, which is entirely analysed in the optics unit, resulting in a factor of 50 difference in analysed sample flow between the two CPCs. While higher detector flow rates would result in even better counting statistics, it would require adjustments in the CPC design to achieve similar particle activation due to lower supersaturations and would also result in a lower size resolution for the DMPS system if the sheath flow rate remains constant (higher sheath flow rates would in turn reduce the dynamic size range of the DMPS).
The detection efficiency of the CPCs was characterized using negative silver particles produced with a tube furnace. The test particles were charged with a 241Am radioactive source and size classified with a short Hauke DMA running at aerosol flow rate of 4 L min−1 and sheath flow rate of 20 L min−1. The CPCs, TSI 3776, modified A20, and standard A20 were calibrated one by one against a TSI electrometer 3068B running at 1 L min−1 flow rate.
Figure S1 in the Supplement shows the cut-off calibration curves for the CPCs. The 50 % cut-off diameters of the Airmodus A20, the modified Airmodus A20 and the TSI 3776 CPC are approximately 5.5, 2.9, and 2.0 nm, respectively. With the modifications, the modified Airmodus A20 CPC has a performance almost comparable to the TSI 3776 CPC. It should be noted that this specific device in this specific calibration performed exceptionally well, as its nominal cut-off is typically closer to 2.5–3 nm for silver test particles (Wlasits et al., 2020).
Apart from their differences in activation efficiency and effective detector flow rate, the two CPCs have different response times to a change in aerosol concentration, which are ∼ 0.1 s for the TSI 3776 and ∼ 1 s for the (unmodified) Airmodus A20 (Enroth et al., 2018). However, as we will see below, that small difference does not affect our approach in comparing the counting statistics of the two CPCs.
2.3 Counting process of a CPC: Poisson process
A random variable N has a Poisson distribution with the parameter μτ>0, where τ is the measurement time, and μ is the intensity (rate) of the process, if the random variable can obtain discrete values (0, 1, 2, 3, …) within the time interval τ. If the process is characterized by the following properties, (1) for τ=0 we have N(0)=0; (2) in separate time intervals, the numbers of detected events are independent of each other; and (3) the number of events in any interval of length τ obey the Poisson distribution:
A Poisson distribution can be shown to have the following properties: the expected value E[N] of the distribution can be calculated as E[N]=μτ, and the standard deviation (σ) can be calculated as .
In a CPC, the particles are counted in the optical unit of the CPC, where a nozzle directs the particle stream to cross a laser beam perpendicularly. Light is scattered from the laser beam as the particles cross it, and the scattered light is collected by a photodiode. In typical optics with ∼ 1 L min−1 aerosol flow, the probability of coincidence in the counting process is negligible with moderate number concentrations (< 30 000 cm−3), which are typically measured downstream of a DMPS system. In our DMPS, the voltage is stepped from 3 to 1000 V in 17 steps (corresponding to selected mobility diameters of 2.07 to 40 nm assuming singly charged particles), with a settling time of 1 s at the beginning of each voltage step (which should remove any bias from different response times of CPCs, if they are ≤ 1 s). The measured particle number concentration C (in cm−3) for size is determined by the number of particles N counted in the time interval τ where the voltage is kept constant (which varies between 3.5 s for the largest size and 64 s for the smallest size) by using the volumetric flow rate through the optics Qopt:
If we assume that the number concentration remains constant during the voltage scan of the DMPS (which is anyway also a requirement for any inversion procedure which considers multiply charged aerosols), the counting process in the DMPS can be considered a Poisson process.
In our setup, we can neglect the total penetration of the system since the compared CPCs measure in parallel in the same DMPS system, and the total penetration is the same for both. This allows us to compare the raw data from the CPCs without an inversion and the uncertainties related to it (Stolzenburg et al., 2022a). As our DMPS outputs the average concentration during each voltage step, we need to rearrange Eq. (2) for the counted particles N. This also shows that we can predict that a factor 50 increase of Qopt (effective undiluted optics flow of 0.05 L min−1 in the TSI 3776 versus 2.5 L min−1 in the modified Airmodus A20) should lead to a factor 50 increase of N:
2.4 Uncertainty in CPC measurements
Uncertainty is a fundamental concept in statistics and probability, and it occurs in all measurements. The uncertainty of a measurement can be systematic, due to human error or resulting from the natural fluctuation of the observed system. In most cases, the total uncertainty of the measurement is a combination of uncertainty from multiple sources. Ultimately, we are interested in the uncertainty of the data obtained from an individual CPC within a DMPS setup, which could be used within uncertainty estimates of subsequently derived variables (J, GR). However, we are typically not able to quantify that total uncertainty and are not able to disentangle the counting process from other sources of uncertainty, such as electronic noise or flow variations in the CPC optics (called measurement error in the following). However, our specific setup allows us to confine the counting uncertainty due to the availability of another CPC.
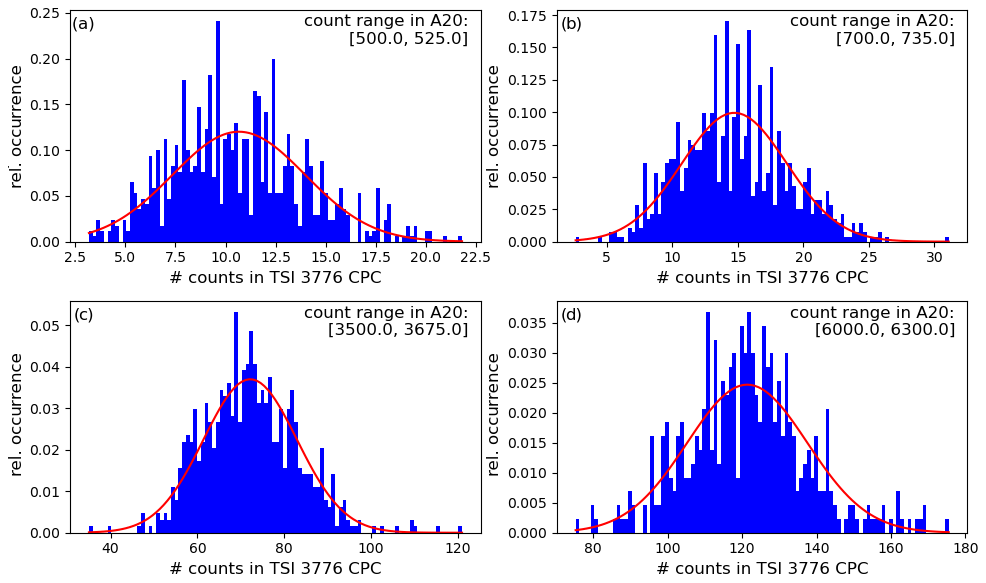
Figure 2Distributions of TSI 3776 counts from four example count ranges simultaneously measured in the modified A20 (a) [500, 525], (b) [700, 735], (c) [3500, 3675], and (d) [6000, 6300]. The counts from the same times are selected from the TSI 3776 CPC and plotted as a histogram. Red line shows the fitted Gaussian PDF.
We chose the following approach to obtain an uncertainty estimate of the measurements with the DMPS using the TSI 3776 as a detector. First, only data for particles ≥ 6 nm are used for the error analysis to ensure that the detection efficiencies of the CPCs do not affect the result. As we can see in Fig. S1, at 6 nm, the calibration curves of both CPCs have plateaued. Next, we choose the measurement time where the modified Airmodus A20 measures particle counts N in certain narrow ranges [N1, N2], where with . The counts from the corresponding times are then selected from the parallel measuring TSI 3776. These selected particle counts are plotted as a normalized histogram, and a Gaussian probability density function (PDF) is fitted to the data (which is a good approximation to a Poisson distribution when E[N]>10). This approach of choosing finite count intervals from the Airmodus A20 data instead of just using a single count value is due to the otherwise limited statistics which would not allow for solid fits of the corresponding count distributions of the TSI 3776. Figure 2 shows four examples of the resulting histograms and fits.
We are now interested in the uncertainties determining the width of these PDFs. By selecting count ranges in the modified Airmodus A20, we select measurements with an actual number concentration Ctrue±ΔCtrue, where the uncertainty originates from the counting and measurement error in the modified Airmodus A20 and the finite width of selected counts in the interval range (with the relative error due to this kept below 5 % by our interval selection ), which are assumed to be independent error sources and hence can be expressed in relative uncertainties as follows:
The Ctrue constrained by the selection of modified Airmodus A20 measurements is also measured simultaneously by the TSI 3776. Therefore, the PDF of counts measured in the TSI 3776 (or its width, i.e. its relative uncertainty ) results from the uncertainty in the Ctrue values selected by the modified Airmodus A20 measurements, the counting error of the 3776, and the measurement error of the 3776, expressed in relative uncertainties as follows:
We see that besides the measurement errors, we can specify all terms in Eq. (5). As we aim to determine the total error of the TSI 3776 of an independent measurement of a concentration Ctrue given by the uncertainties in counting and measurement, which we can now link to the measured width of the PDF via Eq. (5) obtaining
If we now neglect the uncertainty in the measurement of the modified Airmodus A20 CPC, Eq. (6) provides an upper estimate of the total error in the CPC 3776.
2.5 Growth rate and formation rate and propagated uncertainties via MC simulations
Using these error estimates, we can derive the corresponding uncertainties in the quantities typically derived from DMPS size-distribution data, the growth rate (GR) and formation rate (J). Here, we calculate the GR using the 50 % appearance time method (Stolzenburg et al., 2018; Lehtipalo et al., 2014) with an automated algorithm, which after manually defining a time window for the NPF event, fits sigmoidal functions to the rise of the measured raw number concentration (the approach is independent of the absolute magnitude of the signal and hence the inversion procedure; see Lehtipalo et al., 2014) in each size channel separately. The 50 % appearance times are then plotted against the sizes of the corresponding channels, and a linear interpolation is used for the size range 3–6 nm (2.99–6.28 nm) and 6–10 nm (6.28–10.94 nm) to obtain GR3–6 and GR6–10 as the slope of that interpolation, respectively.
The formation rate can be calculated for particle size range [dp, dp+Δdp] according to Eq. (7) (Kulmala et al., 2012):
Here, CoagS is the coagulation sink (loss rate of particles in that size range with the background particles due to coagulation), and is the number concentration of the particles in the size range [dp, dp+Δdp]. The coagulation sink is calculated for the geometric mean diameter of the selected size range and in the atmospheric conditions typical for the SMEAR II; it can be empirically estimated from the condensation sink (CS) of a non-volatile vapour (Dal Maso et al., 2005) as in Eq. (8) (Lehtinen et al., 2007):
We use the size interval [3 nm, 6 nm] to calculate the formation rate at 3 nm (J3) in all subsequent calculations. For the automated algorithm, the integrated concentration of the interval was smoothed, and the GR3–6 value for the specific NPF day was used as input for the last term. The diurnal variation of J3 was then fitted by a Gaussian expression, and its peak value was used as the NPF-event-specific J3 value.
We performed a Monte Carlo simulation on one of the NPF days (28 March 2017). New sets of data were generated from the original data 10 000 times, by altering the measured counts in each size channel for each measurement time according to their underlying uncertainties. We performed three sets of MC simulations. First and second, we use a Poisson counting error to vary the TSI 3776 and the modified Airmodus A20 data (assuming a uncertainty). The generated input data (counts) were used to directly calculate GR3–6 and GR6–10 as the appearance time method can be performed on the raw signal. For the calculation of the formation rate, we inverted the raw signal into a size distribution using a least-squares algorithm which also considers the data above 10 nm obtained from the long-DMPS. Comparison of the resulting formation and growth rates allows the investigation of the effect of increasing counting statistics with respect to these size-distribution-derived quantities. As a third simulation, we assume the total error for the TSI 3776 derived via Eq. (6) (upper error estimate) as the input uncertainty in the Monte Carlo runs altering the raw counts and compare it with the Poisson-only case of the TSI 3776 to investigate the magnitudes of counting and measurement error on GR3–6, GR6–10, and J3. The relative uncertainties for each size-distribution evolution measurement (in time and size) used as input for all three Monte Carlo simulations are shown in Fig. S2 in the Supplement.
3.1 Effect of counting statistics on the inverted size distributions and number closure
We analysed the dataset by classification of the NPF event days (Dal Maso et al., 2005) and calculated formation and growth rates for the subset of class-I NPF event days. Figure 3 shows an example NPF day (28 March 2017) from both CPCs (modified Airmodus A20 Fig. 3a and TSI 3776 Fig. 3b). The 28 March is chosen as the example day as it is a typical class-1 NPF event day with a strong nucleation rate but not much higher than average GR, such that the nucleation mode persists over a long enough time in the sub-10 nm range to investigate the effect of improved counting statistics in full detail. We can see that the modified Airmodus A20 produces a smoother distribution in the areas of low concentrations (blue-to-yellow colour range). Besides the lower nominal cut-off in the laboratory calibration of the TSI 3776 (Fig. S1), the signal at the small sizes below 5 nm is noisier in the TSI 3776-derived size distribution compared to the modified Airmodus A20-derived size distribution. Potentially, the overall reduced statistics counterbalance the effect of a more efficient detection at these sizes. Moreover, it needs to be noted that ambient cut-offs are subject to larger uncertainties due to the unknown chemical composition of the counted particles and the composition-dependent response of the CPCs, which can be more than 3 nm difference for the d50 cut-off diameter between different seed materials for the unmodified Airmodus A20 (and only 1.2 nm maximum variation for the TSI 3776) (Wlasits et al., 2020).
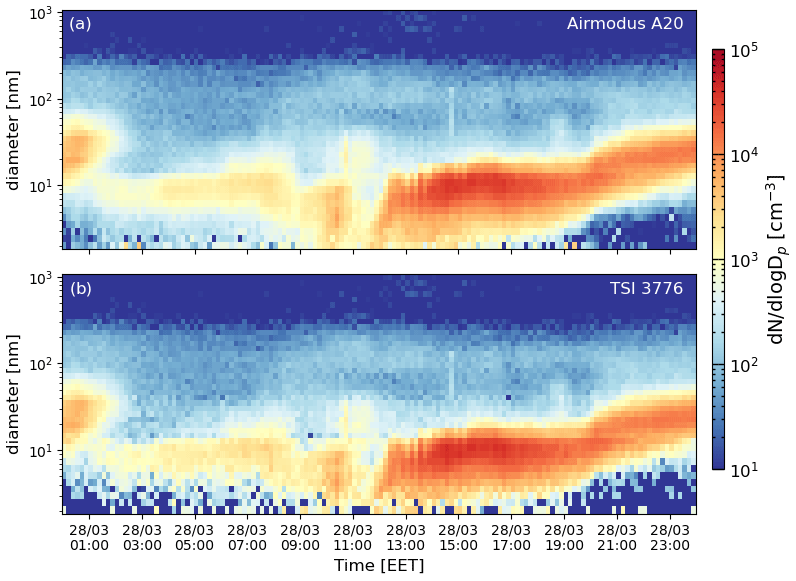
Figure 3Comparison of the inverted size distribution using the signal of two different CPCs in the nano-DMPS (2–40 nm) for 28 March 2017, a strong NPF day in Hyytiälä, Finland. Panel (a) shows the size distribution in as the colour code with the measured diameter on the y axis and the time on the x axis using the modified Airmodus A20 as detector in the nano-DMPS. Panel (b) shows the same using the TSI 3776 as detector in the nano-DMPS.
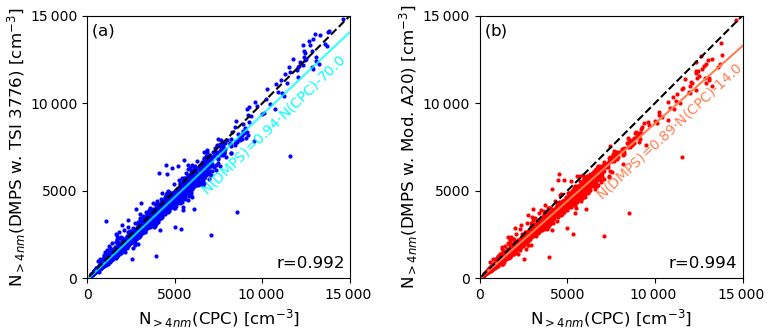
Figure 4Comparison of the total number concentration above 4 nm obtained from integration of the inverted DMPS data and the total concentration measurement using a TSI 3775 CPC. Panel (a) shows the correlation for the entire campaign dataset when the TSI 3776 is used in the DMPS inversion and total concentration integration, and (b) shows the same when the modified Airmodus A20 is used. The cyan and coral solid lines show the linear fit (corresponding equation is written below) to the data, indicating the deviation from the 1 : 1 dashed black line.
Next, we compare the performance of the DMPS using different detectors with respect to the number closure with a simultaneously measuring total CPC (TSI Model 3775, nominal cut-off 4 nm). The correlation of the full campaign dataset between the integrated number concentration of the DMPS system (above 4 nm) and the total concentration measurement with the CPC 3775 is shown in Fig. 4 for both detectors (Fig. 4a using the TSI 3776 in the inversion and subsequent integration and Fig. 4b using the modified Airmodus A20). Pearson's coefficient of correlation is high for both (0.992 and 0.994) but slightly better in cases when the modified Airmodus A20 is used within the DMPS inversion, which is reasonable due to the increased statistics. However, the data deviate from the 1 : 1 relation (0.89 slope for the modified Airmodus A20, which is more significant than for the TSI 3776 based DMPS data with a slope of 0.94). This could be due to a different plateau value reached in the counting efficiency curves and not correctly accounted for by the calibration. Wlasits et al. (2020) showed that plateau values of the same instrument vary slightly between different calibrations. Therefore, this could easily lead to offsets in the inversion, resulting in the observed discrepancies in the total number concentration.
3.2 The effect of increased counting statistics on the particle formation and growth rates
In Fig. 5, we compare the calculated GR3–6, GR6–10, and J3 values obtained from the DMPS data with the different underlying detectors for all NPF class-I events (see Dal Maso et al., 2005) recorded throughout the campaign (in total 19 events). We observe strong correlations in the derived growth and formation rates, with the lowest correlation coefficient for GR3–6, where the signal is most noisy. Interestingly, the formation rate is more robust, even if derived at 3 nm, where also the GR3–6 is used within the calculation of Eq. (7). However, as shown in Fig. 4, the modified Airmodus A20 measured slightly lower concentrations compared to the TSI 3776, while GR3–6 was measured higher by the Airmodus A20 for values above 3 nm h−1. Therefore, in these cases with a high growth term possibly dominating the formation rate calculations due to a fast growth rate (> 3 nm h−1), the lower N3–6 might compensate for the higher GR3–6 reducing the fluctuations between the two instruments. In addition, the other terms and in Eq. (7) might also buffer the higher GR due to N3–6 values in that case.
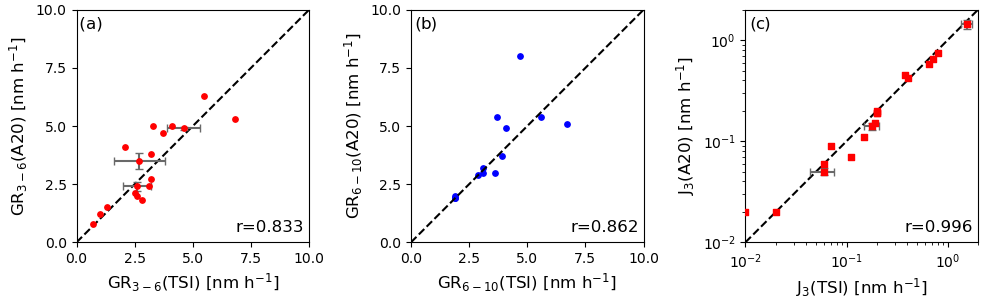
Figure 5Comparison of the GR3–6 (a), GR6–10 (b) and J3 (c) obtained from the datasets recorded by the TSI 3776 (x axes) and modified Airmodus A20 (y axes) used as detector downstream of the same DMA. For GR3–6 and J3, the three events analysed by Monte Carlo simulations show error bars which denote the Monte Carlo-derived uncertainty from the counting error only.
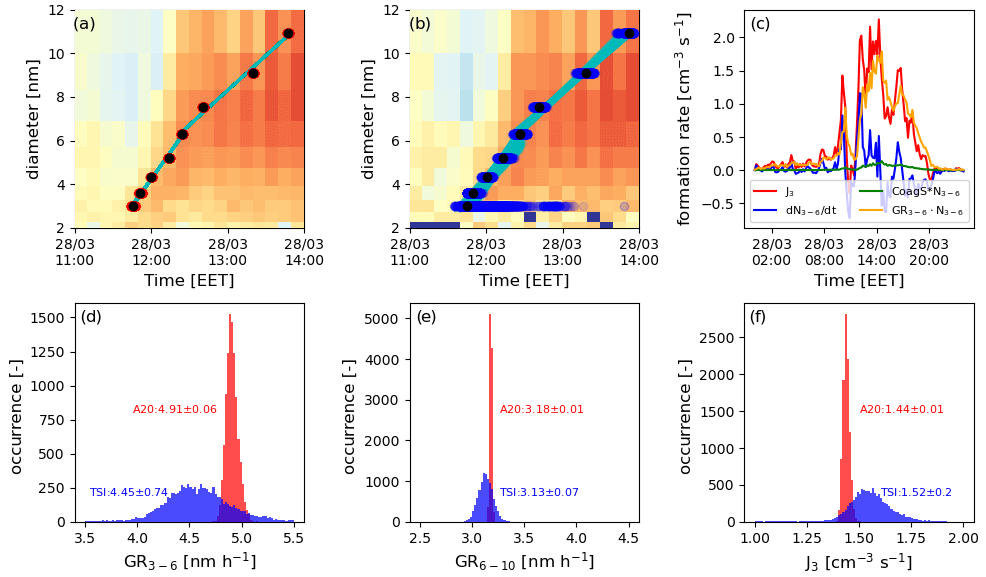
Figure 6Results from the Monte Carlo simulations testing the influence of a pure counting error on the size-distribution-derived quantities J3, GR3–6, and GR6–10. Panel (a) shows the appearance times (red dots) and linear growth rate fits (for two size ranges, cyan lines) for 10 000 Monte Carlo runs on top of the original size distribution (colour code not shown and only for illustrative purposes) randomly varying the count rates (assuming a counting error only) in the modified Airmodus A20 (black dots result from the original data). Panel (b) shows the same for the TSI 3776 dataset (blue dots are appearance times derived from Monte Carlo varied data assuming a pure counting error, black dots are original data, and cyan lines are the linear growth rate fits). Panel (c) shows the formation rate calculation at 3 nm according to Eq. (6) (using the TSI 3776) with the red line J3, the blue line the approximated change in total number concentration of the calculation bin, the green line the correction term due to the coagulation sink, and the orange line the correction term due to the growth flux out of the size bin of interest. Panels (d)–(f) show the histograms of the Monte Carlo results for the GR3–6 (d), GR6–10 (e), and J3 (f), with the red histograms corresponding to values derived from the modified Airmodus A20 dataset and the blue histograms corresponding to values derived from the TSI 3776 dataset.
In Fig. 6 we present the results from our Monte Carlo analysis of 28 March 2017, comparing the performance of the modified Airmodus A20 with the TSI3776, assuming the measured signal is only subject to a counting uncertainty. Figure 6a and b present the results of the 10 000 GR3–6 and GR6–10 calculations performed with the same automated appearance time algorithm, showing the obtained 50 % appearance times at each diameter (channel) on top of the original size distribution and the corresponding linear fits for the GR estimate. Apparently, the smaller the channel size, the larger the spread between the appearance time results, especially for the TSI 3776, where the relative uncertainty of each measurement becomes very large below 4 nm due to the limited count rates (which is in the range of 10 counts per measurement during NPF; see also Fig. S2 in the Supplement). It needs to be noted that it seems to be especially the channel at 3 nm, which has a broad spread in 50 % appearance times dominating the variation in the subsequent GR3–6 derivation.
This directly translates into the significantly larger variance of the GR3–6 values derived from the TSI 3776 compared to the modified Airmodus A20 (Fig. 6d and e). For GR3–6 the relative statistical uncertainty (defined as 1σ standard deviation divided by the initial GR3–6 result obtained from the actual measurement data) from the counting error is much larger for the TSI 3776 ( ∼ 16 %) compared to the modified Airmodus A20 ( ∼ 1 %). GR6–10 shows lower overall uncertainties and fewer, but still significant, differences between the two CPCs (2 % compared to 0.3 %). Interestingly, the mean of the Monte Carlo distributions is slightly offset between the two CPCs for both GR3–6 and GR6–10, demonstrating the observed variations shown in Fig. 5 and with the mean of the distributions roughly centred around the original result. However, even though we saw good correlation for the J3 values within the campaign derived from both instruments, it seems that J3 is also heavily influenced by the counting statistics. In Hyytiälä, the most dominant term in the calculation of the formation rate is often the growth term out of the bin of interest, i.e. (Eq. 7 and Fig. 6c), especially at fast growth rates, which is confirmed here. Therefore, the fluctuations in GR3–6 are directly translated (Fig. 6f) into large uncertainties for the TSI 3776-derived J3 ( ∼ 13 % relative uncertainty) and much lower in the modified Airmodus A20-derived J3 ( ∼ 1 %).
Table 1Overview of the results of the Monte Carlo simulations for all 3 investigated days. Formation and growth rate as obtained from the initial data are given together with the relative uncertainty (1σ standard deviation of the Monte Carlo obtained distribution of GR and J values divided by the initial result in %).
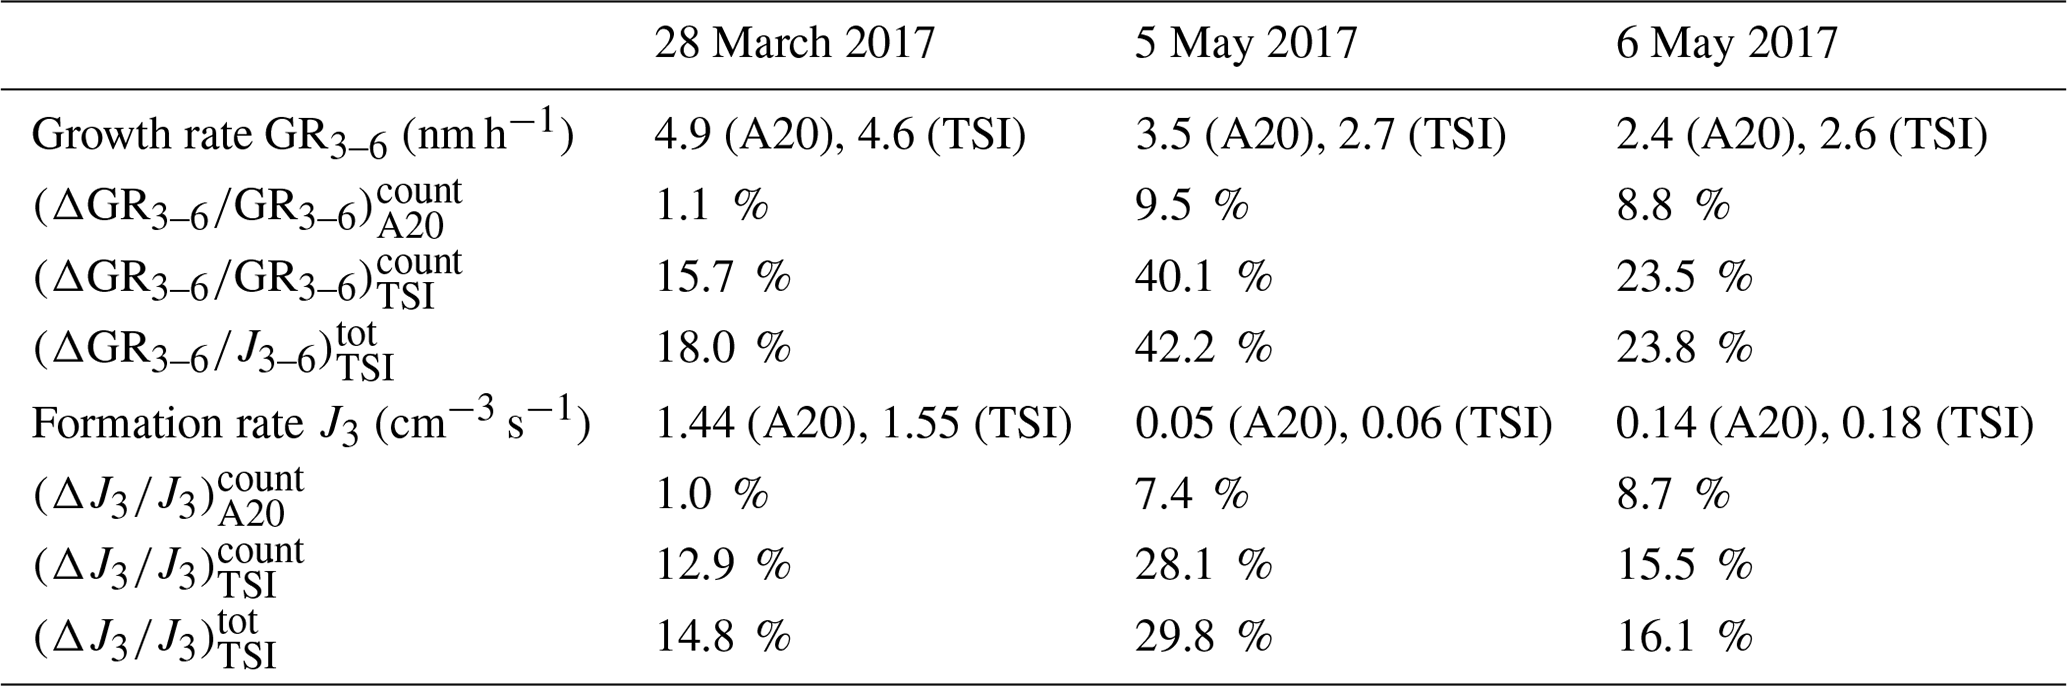
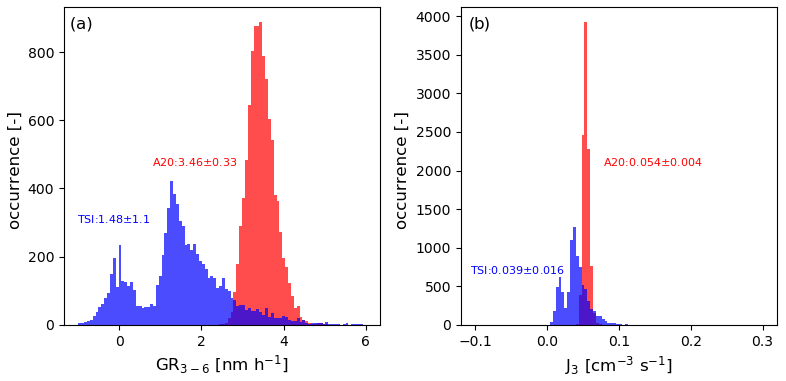
Figure 7Results from the Monte Carlo simulations testing the influence of a pure counting error and an additional measurement error on the size-distribution-derived quantities J3 and GR3–6 for a very weak NPF event (J3 ∼ 0.05 cm−3 s−1). The histograms of the Monte Carlo results for the GR3–6 (a) and J3 (b) are shown. The red histograms correspond to values derived from the modified Airmodus A20 data assuming only a counting error, and the blue histograms correspond to values derived from the TSI 3776 data assuming only a counting error.
In addition, it needs to be noted that 28 March 2017 was one of the days with the highest formation rate (J3 ∼ 1.5 cm−3 s−1) throughout the campaign. Therefore, we repeated the analysis for 2 additional days with significantly lower J3 (5 and 6 May 2017, with J3 = 0.05 cm−3 s−1 and J3 = 0.15 cm−3 s−1, respectively). We present the Monte Carlo results for GR3–6 and J3 for the intermediate formation rate day (6 May 2017) in Fig. S3 in the Supplement and show all results for GR3–6 and J3 in Table 1. As expected, the lower J3 also resulted in lower count rates in both CPCs during NPF. Therefore, also a larger counting uncertainty in the size-distribution-derived quantities was observed, with up to 23 % relative uncertainty in GR3–6 and 16 % in J3 when the TSI 3776 is used and with a still significant reduction for the modified Airmodus A20 down to ∼ 9 % relative uncertainty (for the 6 May 2017). At very low J3 (5 May 2017, Fig. 7), the Monte Carlo distributions for the TSI 3776 data get skewed (with the mean of the distribution also deviating significantly from the original result), and the Monte Carlo results show a bimodal distribution, with unphysical GR values around 0, indicating problems with the automated GR fitting. The relative uncertainty becomes as large as 40 %. This shows that GR values derived at such low number concentrations and with such low counting statistics are not reliable. Only instrumentation which provides enough signal can be used: even though the modified Airmodus A20 relative uncertainty already becomes as large as 10 %, this value is still lower than the relative uncertainty of GR3–6 for the TSI dataset of a very strong NPF event day with J3 almost 2 orders of magnitude higher. Altogether, the counting uncertainties derived for all 3 d analysed by the Monte Carlo approach can explain the observed scatter between the values derived by the two instruments (see error bars for the three selected events in Fig. 5), which implies that the counting uncertainty is a major issue when GR and J values are compared between different instruments.
3.3 Estimating the total error of the TSI 3776 and its effect on the particle formation and growth rates
We now aim to estimate the total error in a CPC measurement based on our dual setup. As described by Eq. (6), we can obtain an upper estimate of the total error in the TSI 3776 measurement by selecting small count ranges in the modified Airmodus A20 and estimating the width of the resulting count distribution in the TSI 3776 at simultaneous measurements. In Fig. 8a we show the upper relative error estimate together with the pure counting error () for a set of selected count intervals in the modified Airmodus A20 versus the expected value of counts in the TSI 3776 (). We see that the relative uncertainty is significantly larger than what would be expected from a pure counting error, indicating that there are also other important sources of uncertainty in a typical DMPS measurement, resulting from fluctuations in flow rates or electronic noise. If we further assume that the relative uncertainty of such an additional source is the same for any CPC, we can further simplify Eq. (6) by setting and even solve it for that missing error source, which is shown in Fig. 8b. We obtain a roughly constant value of around 4 % across all count ranges, also indicating that these fluctuations are indeed independent from the counting error.
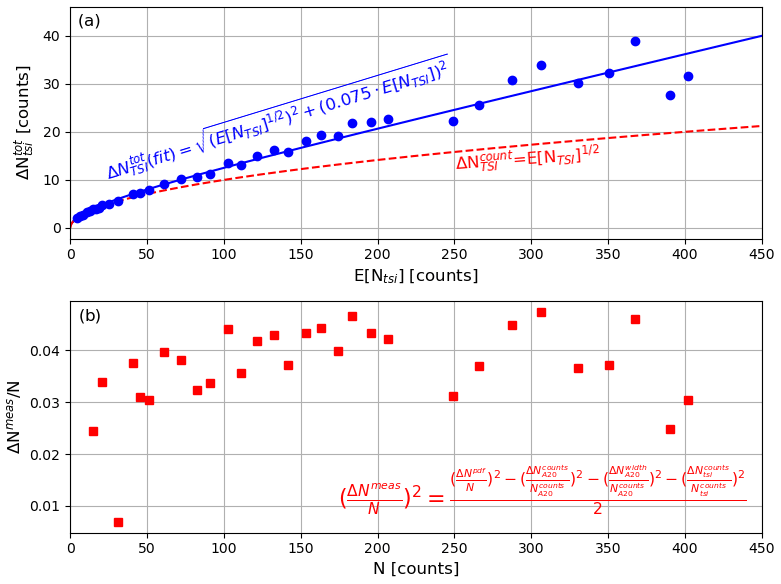
Figure 8Total uncertainty estimate for the TSI 3776 by selecting narrow count ranges in the modified Airmodus A20. Panel (a) shows the estimates of the total uncertainty via Eq. (6) for several count ranges in the modified Airmodus A20 as blue circles. The blue line is a fit describing the total uncertainty as the quadratic sum of the counting uncertainty and a measurement uncertainty with its relative magnitude being the free parameter of the fit. The dashed red line shows the pure counting uncertainty as reference. Panel (b) shows the relative measurement uncertainty as red squares when Eq. (6) is solved under the assumption that the relative uncertainty in both CPCs has the same magnitude (see in-panel equation).
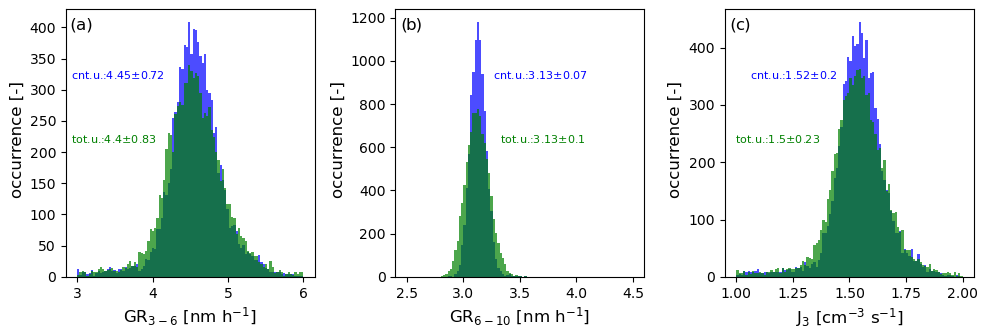
Figure 9Results from the Monte Carlo simulations testing the influence of a total measurement error in the TSI 3776 on the size-distribution-derived quantities J3, GR3–6, and GR6–10. Panel (a) shows the Monte Carlo outcomes for GR3–6 using only the counting statistics as variation for the input data from the TSI 3776 in blue (same as Fig. 6d) and using the total uncertainty in green as derived via Eq. (6) and the fit from Fig. 8. Panel (b) shows the same for GR6–10 and (c) for J3 using the same colour convention.
To estimate the influence of such additional uncertainties in CPC measurements on the size-distribution-derived quantities GR3–6, GR6–10, and J3, we performed another Monte Carlo simulation using a fitted expression as in Eq. (6) (counting uncertainty plus an additional measurement uncertainty, where its relative magnitude is the free parameter of the fit) to the total error in Fig. 8a as the input for the variation of the measured counts in the TSI 3776. Figure 9 shows the resulting histograms for GR3–6, GR6–10, and J3 for the strong NPF event day together with the results from the Monte Carlo analysis using the pure counting uncertainty only. While the distributions are even further skewed, the relative widths do not dramatically increase further. For the events at reduced J3 (Fig. S3 in the Supplement and Table 1), the influence of the measurement error on the size-distribution-derived quantities GR3–6 and J3 becomes almost negligible compared to the even higher counting uncertainties as almost no further broadening of the result distributions is observed. Altogether, this clearly demonstrates that the counting uncertainty is the dominant source of error for nucleation and growth rate determination when a TSI 3776 ultrafine CPC is used.
Our limited dataset does not allow for the reverse procedure due to a lack of statistics (i.e. selecting narrow count ranges in the TSI 3776 and obtaining the PDF for the simultaneous measurements of the modified Airmodus A20), and hence we do not provide a detailed Monte Carlo analysis on the effects on the growth and formation rate. However, as the relative counting error is so much lower in the modified Airmodus A20, we suspect that this additional source of uncertainty would dominate the formation and growth uncertainties in that case by the following simple reasoning: the relative counting uncertainty scales with , and the measurement uncertainty seems to be independent of the number of counts (Fig. 8b), and hence the ∼ 4 % measurement uncertainty start to dominate the total uncertainty above 625 counts as , which is roughly the sub-5 nm count rates measured in the modified Airmodus A20 during the NPF event of 28 March 2017.
The strength and importance of NPF with respect to the climate system is often characterized by formation and growth rates, which are commonly derived from the evolution of measured particle number size distributions obtained from DMPS/SMPS systems. However, the uncertainties in the DMPS measurements and their effect on the size-distribution-derived quantities are not well quantified. As the CPC counting process can be considered a Poisson process, the resulting uncertainty from the counting process can be non-negligible at the low count rates and might dominate the uncertainty in the derived size distribution and formation and growth rates.
Here, we deploy a DMPS system with a modified Airmodus A20 CPC providing a factor 50 higher counting statistics compared to the commonly used TSI 3776 ultrafine CPC. We found that the modified Airmodus A20 provides smoother number size distributions, especially in the case of low concentrations of ultrafine particles and achieves very good correlation with simultaneous absolute number concentration measurements. The difference between the counting statistics of the CPCs is propagated to the values derived from the measured number size distribution, resulting in significantly reduced uncertainties for GR3–6 (1 % compared to 16 %), GR6–10 (0.3 % compared to 2 %), and J3 (1 % compared to 13 %). This effect is even stronger, when the formation rates and hence number concentrations are low, where a reliable GR estimate might only be possible with a DMPS with sufficient counting statistics. In addition, our dual CPC–DMPS setup allowed for a quantification of the total uncertainty related to the CPC measurement in a DMPS system, showing that additional sources of uncertainties with a relative uncertainty of around 4 % are present at all count rates. However, we showed that the counting uncertainty is the main source of error for the size-distribution-derived quantities J and GR for the widely used TSI 3776. The additional sources of uncertainty might only become important in the derivation of the nucleation and growth rates when the counting uncertainties are reduced as in the case of the modified Airmodus A20.
This study shows significant improvement in the determination of the formation and growth rate during NPF by the deployment of a DMPS with improved counting statistics. The wide deployment of such instrumentation which is optimized for sub-10 nm measurements could significantly reduce our uncertainties in formation and growth rate determination or even allow for the application of better analysis tools due to the increased statistics (Pichelstorfer et al., 2018; Ozon et al., 2021) and hence boost our understanding of NPF; for example, they provide better mass closure in aerosol growth (Stolzenburg et al., 2022b). However, this study also shows that other sources of uncertainty are typically present in DMPS measurements, which also need to be understood and potentially be reduced or at least be well quantified, which requires future work on CPC techniques.
The software code for performing the Monte Carlo analysis is available under https://doi.org/10.5281/zenodo.7962563 (Stolzenburg and Laurila, 2023).
Raw particle number size distribution data and retrieved growth and formation rates are available under https://doi.org/10.5281/zenodo.7962336 (Stolzenburg et al., 2023).
The supplement related to this article is available online at: https://doi.org/10.5194/amt-16-2471-2023-supplement.
TL, PA, JV, and JK performed the measurements; DS and TL analysed the data and performed the simulations; DS, TL, TP, and JK were involved in the scientific discussion and interpretation of the results; DS and TL wrote the manuscript; and all co-authors commented on the manuscript.
Joonas Vanhanen is the Chief Technology Officer of Airmodus Ltd., the company producing and selling the A20 CPC. The remaining authors have no conflicts of interest to declare. This study was independently performed and was not co-funded by Airmodus Ltd.
Publisher’s note: Copernicus Publications remains neutral with regard to jurisdictional claims in published maps and institutional affiliations.
We thank Lubna Dada for her support in nucleation rate calculations.
This work was funded by the Academy of Finland Flagship via the Atmosphere and Climate Competence Center (ACCC; grant no. 337549) and the Academy of Finland (grant nos. 1325656, 346370, and 79999129). It also received funding from the University of Helsinki 3-year grant (grant no. 75284132) and the University of Helsinki ACTRIS-HY. It also received support from the European Union's Horizon 2020 Research and Innovation programme under a Marie Skłodowska–Curie Action (grant agreement no. 895875) (NPF-PANDA), from the European Commission through Research Infrastructures Services Reinforcing Air Quality Monitoring Capacities in European Urban & Industrial AreaS (RI-URBANS; grant no. 101036245) and through ACTRIS-CF (329274) and ACTRIS-Suomi (328616).
Open-access funding was provided by the Helsinki University Library.
This paper was edited by Hang Su and reviewed by two anonymous referees.
Aalto, P., Hämeri, K., Becker, E., Weber, R., Salm, J., Mäkelä, J. M., Hoell, C., O'dowd, C. D., Hansson, H.-C., Väkevä, M., Koponen, I. K., Buzorius, G., and Kulmala, M.: Physical characterization of aerosol particles during nucleation events, Tellus B, 53, 344–358, https://doi.org/10.3402/tellusb.v53i4.17127, 2001.
Dada, L., Lehtipalo, K., Kontkanen, J., Nieminen, T., Baalbaki, R., Ahonen, L., Duplissy, J., Yan, C., Chu, B., Petäjä, T., Lehtinen, K., Kerminen, V.-M., Kulmala, M., and Kangasluoma, J.: Formation and growth of sub-3-nm aerosol particles in experimental chambers, Nat. Protoc., 15, 1013–1040, https://doi.org/10.1038/s41596-019-0274-z, 2020.
Dal Maso, M., Kulmala, M., Riipinen, I., Wagner, R., Hussein, T., Aalto, P. P., and Lehtinen, K. E. J.: Formation and growth of fresh atmospheric aerosols: eight years of aerosol size distribution data from SMEAR II, Hyytiälä, Finland, Boreal Environ. Res., 10, 323–336, 2005.
Enroth, J., Kangasluoma, J., Korhonen, F., Hering, S., Picard, D., Lewis, G., Attoui, M., and Petäjä, T.: On the time response determination of condensation particle counters, Aerosol Sci. Tech., 52, 778–787, https://doi.org/10.1080/02786826.2018.1460458, 2018.
Gordon, H., Kirkby, J., Baltensperger, U., Bianchi, F., Breitenlechner, M., Curtius, J., Dias, A., Dommen, J., Donahue, N. M., Dunne, E. M., Duplissy, J., Ehrhart, S., Flagan, R. C., Frege, C., Fuchs, C., Hansel, A., Hoyle, C. R., Kulmala, M., Kürten, A., Lehtipalo, K., Makhmutov, V., Molteni, U., Rissanen, M. P., Stozkhov, Y., Tröstl, J., Tsagkogeorgas, G., Wagner, R., Williamson, C., Wimmer, D., Winkler, P. M., Yan, C., and Carslaw, K. S.: Causes and importance of new particle formation in the present-day and preindustrial atmospheres, J. Geophys. Res.-Atmos., 122, 8739–8760, https://doi.org/10.1002/2017JD026844, 2017.
Hari, P. and Kulmala, M.: Station for Measuring Ecosystem–Atmosphere Relations (SMEAR II), Boreal Environ. Res., 10, 315–322, 2005.
Kangasluoma, J. and Kontkanen, J.: On the sources of uncertainty in the sub-3 nm particle concentration measurement, J. Aerosol Sci., 112, 34–51, https://doi.org/10.1016/j.jaerosci.2017.07.002, 2017.
Kangasluoma, J., Ahonen, L., Attoui, M., Vuollekoski, H., Kulmala, M., and Petäjä, T.: Sub-3 nm Particle Detection with Commercial TSI 3772 and Airmodus A20 Fine Condensation Particle Counters, Aerosol Sci. Tech., 49, 674–681, https://doi.org/10.1080/02786826.2015.1058481, 2015.
Kangasluoma, J., Ahonen, L. R., Laurila, T. M., Cai, R., Enroth, J., Mazon, S. B., Korhonen, F., Aalto, P. P., Kulmala, M., Attoui, M., and Petäjä, T.: Laboratory verification of a new high flow differential mobility particle sizer, and field measurements in Hyytiälä, J. Aerosol Sci., 124, 1–9, https://doi.org/10.1016/j.jaerosci.2018.06.009, 2018.
Kangasluoma, J., Cai, R., Jiang, J., Deng, C., Stolzenburg, D., Ahonen, L. R., Chan, T., Fu, Y., Kim, C., Laurila, T. M., Zhou, Y., Dada, L., Sulo, J., Flagan, R. C., Kulmala, M., Petäjä, T., and Lehtipalo, K.: Overview of measurements and current instrumentation for 1–10 nm aerosol particle number size distributions, J. Aerosol Sci., 148, 105584, https://doi.org/10.1016/j.jaerosci.2020.105584, 2020.
Kulmala, M., Petäjä, T., Nieminen, T., Sipilä, M., Manninen, H. E., Lehtipalo, K., Dal Maso, M., Aalto, P. P., Junninen, H., Paasonen, P., Riipinen, I., Lehtinen, K. E. J., Laaksonen, A., and Kerminen, V.-M.: Measurement of the nucleation of atmospheric aerosol particles, Nat. Protoc., 7, 1651–1667, https://doi.org/10.1038/nprot.2012.091, 2012.
Kulmala, M., Kontkanen, J., Junninen, H., Lehtipalo, K., Manninen, H. E., Nieminen, T., Petäjä, T., Sipilä M., M., Schobesberger, S., Rantala, P., Franchin, A., Jokinen, T., Järvinen, E., Äijälä, M., Kangasluoma, J., Hakala, J., Aalto, P. P., Paasonen, P., Mikkilä, J., Vanhanen, J., Aalto, J., Hakola, H., Makkonen, U., Ruuskanen, T., Mauldin, R. L., Duplissy, J., Vehkamäki, H., Bäck, J., Kortelainen, A., Riipinen, I., Kurtén, T., Johnston, M. V., Smith, J. N., Ehn, M., Mentel, T. F., Lehtinen, K. E. J., Laaksonen, A., Kerminen, V.-M., and Worsnop, D. R.: Direct Observations of Atmospheric Aerosol Nucleation, Science, 339, 943–946, https://doi.org/10.1126/science.1227385, 2013.
Lehtinen, K. E. J., Maso, M. D., Kulmala, M., and Kerminen, V.-M.: Estimating nucleation rates from apparent particle formation rates and vice versa: Revised formulation of the Kerminen–Kulmala equation, J. Aerosol Sci., 38, 988–994, https://doi.org/10.1016/j.jaerosci.2007.06.009, 2007.
Lehtipalo, K., Leppä, J., Kontkanen, J., Kangasluoma, J., Franchin, A., Wimmer, D., Schobesberger, S., Junninen, H., Petäjä, T., Sipilä, M., Mikkilä, J., Vanhanen, J., Worsnop, D. R., and Kulmala, M.: Methods for determining particle size distribution and growth rates between 1 and 3 nm using the Particle Size Magnifier, Boreal Environ. Res., 19, 215–236, 2014.
Ozon, M., Stolzenburg, D., Dada, L., Seppänen, A., and Lehtinen, K. E. J.: Aerosol formation and growth rates from chamber experiments using Kalman smoothing, Atmos. Chem. Phys., 21, 12595–12611, https://doi.org/10.5194/acp-21-12595-2021, 2021.
Pichelstorfer, L., Stolzenburg, D., Ortega, J., Karl, T., Kokkola, H., Laakso, A., Lehtinen, K. E. J., Smith, J. N., McMurry, P. H., and Winkler, P. M.: Resolving nanoparticle growth mechanisms from size- and time-dependent growth rate analysis, Atmos. Chem. Phys., 18, 1307–1323, https://doi.org/10.5194/acp-18-1307-2018, 2018.
Stolzenburg, D. and Laurila, T.: Monte_Carlo analysis of Particle Number Size-Distribution Data of twin-DMPS equipped with two CPCs for nanoparticle detection for SMEAR II station, Hyytiälä, Finland, Spring 2017 (Version v0), Zenodo [code], https://doi.org/10.5281/zenodo.7962563, 2023.
Stolzenburg, D., Steiner, G., and Winkler, P. M.: A DMA-train for precision measurement of sub-10 nm aerosol dynamics, Atmos. Meas. Tech., 10, 1639–1651, https://doi.org/10.5194/amt-10-1639-2017, 2017.
Stolzenburg, D., Fischer, L., Vogel, A. L., Heinritzi, M., Schervish, M., Simon, M., Wagner, A. C., Dada, L., Ahonen, L. R., Amorim, A., Baccarini, A., Bauer, P. S., Baumgartner, B., Bergen, A., Bianchi, F., Breitenlechner, M., Brilke, S., Buenrostro Mazon, S., Chen, D., Dias, A., Draper, D. C., Duplissy, J., El Haddad, I., Finkenzeller, H., Frege, C., Fuchs, C., Garmash, O., Gordon, H., He, X., Helm, J., Hofbauer, V., Hoyle, C. R., Kim, C., Kirkby, J., Kontkanen, J., Kürten, A., Lampilahti, J., Lawler, M., Lehtipalo, K., Leiminger, M., Mai, H., Mathot, S., Mentler, B., Molteni, U., Nie, W., Nieminen, T., Nowak, J. B., Ojdanic, A., Onnela, A., Passananti, M., Petäjä, T., Quéléver, L. L. J., Rissanen, M. P., Sarnela, N., Schallhart, S., Tauber, C., Tomé, A., Wagner, R., Wang, M., Weitz, L., Wimmer, D., Xiao, M., Yan, C., Ye, P., Zha, Q., Baltensperger, U., Curtius, J., Dommen, J., Flagan, R., Kulmala, M., Smith, J. N., Worsnop, D. R., Hansel, A., Donahue, N. M., and Winkler, P. M.: Rapid growth of organic aerosol nanoparticles over a wide tropospheric temperature range, P. Natl. Acad. Sci. USA, 115, 9122–9127, https://doi.org/10.1073/pnas.1807604115, 2018.
Stolzenburg, D., Ozon, M., Kulmala, M., Lehtinen, K. E. J., Lehtipalo, K., and Kangasluoma, J.: Combining instrument inversions for sub-10 nm aerosol number size-distribution measurements, J. Aerosol Sci., 159, 105862, https://doi.org/10.1016/j.jaerosci.2021.105862, 2022a.
Stolzenburg, D., Wang, M., Schervish, M., and Donahue, N. M.: Tutorial: Dynamic organic growth modeling with a volatility basis set, J. Aerosol Sci., 166, 106063, https://doi.org/10.1016/j.jaerosci.2022.106063, 2022b.
Stolzenburg, D., Laurila, T., and Kangasluoma, J.: Raw Particle Number Size-Distribution Data of twin-DMPS equipped with two CPCs for nanoparticle detection for SMEAR II station, Hyytiälä, Finland, Spring 2017 (Version v0), Zenodo [data set], https://doi.org/10.5281/zenodo.7962336, 2023.
Stolzenburg, M. R. and McMurry, P. H.: An Ultrafine Aerosol Condensation Nucleus Counter, Aerosol Sci. Tech., 14, 48–65, https://doi.org/10.1080/02786829108959470, 1991.
Wang, S. C. and Flagan, R. C.: Scanning Electrical Mobility Spectrometer, Aerosol Sci. Tech., 13, 230–240, https://doi.org/10.1080/02786829008959441, 1990.
Wiedensohler, A.: An approximation of the bipolar charge distribution for particles in the submicron size range, J. Aerosol Sci., 19, 387–389, https://doi.org/10.1016/0021-8502(88)90278-9, 1988.
Wlasits, P. J., Stolzenburg, D., Tauber, C., Brilke, S., Schmitt, S. H., Winkler, P. M., and Wimmer, D.: Counting on chemistry: laboratory evaluation of seed-material-dependent detection efficiencies of ultrafine condensation particle counters, Atmos. Meas. Tech., 13, 3787–3798, https://doi.org/10.5194/amt-13-3787-2020, 2020.