the Creative Commons Attribution 4.0 License.
the Creative Commons Attribution 4.0 License.
 | 01 Jun 2023
The impacts of assimilating Aeolus horizontal line-of-sight winds on numerical predictions of Hurricane Ida (2021) and a mesoscale convective system over the Atlantic Ocean
Chengfeng Feng
The Aeolus satellite, the first spaceborne wind lidar launched by the European Space Agency (ESA) on 22 August 2018, provides global measurements of horizontal line-of-sight (HLOS) winds. The assimilation of Aeolus HLOS winds has been proven to improve numerical weather predictions (NWPs). Still, its influences on forecasts of tropical cyclones (TCs) and tropical convective systems have yet to be examined in detail. This study investigates the impacts of assimilating Aeolus HLOS winds on the analysis and forecasts of Hurricane Ida (2021) and a mesoscale convective system (MCS) embedded in an African easterly wave (AEW) over the Atlantic Ocean (AO) with the mesoscale community Weather Research and Forecasting (WRF) model and the NCEP Gridpoint Statistical Interpolation (GSI)-based three-dimensional ensemble-variational (3DEnVAR) hybrid data assimilation (DA) system. Mie-cloudy and Rayleigh-clear winds are assimilated. The results for Ida (2021) show that assimilating Aeolus HLOS winds leads to better track predictions. The intensity forecasts are improved in some cases, even with limited coverage of Aeolus HLOS winds within the inner core region of Ida (2021). In addition, the structure of heavy precipitation associated with Ida (2021) is refined after the assimilation of Aeolus HLOS winds. Further diagnosis demonstrates that the improved intensity and precipitation forecasts result from enhanced divergence in the upper level of the troposphere after the assimilation of Aeolus HLOS winds. Additional results from the MCS associated with an AEW indicate that assimilating Aeolus HLOS winds enhances forecasts of its precipitation structure and the associated low-level divergence. Findings from this study suggest that the assimilation of Aeolus HLOS winds has the potential to improve forecasts for TCs and tropical convective systems.
- Article
(12719 KB) - Full-text XML
- BibTeX
- EndNote


Measuring three-dimensional wind profiles in the Global Observing System (GOS), especially over the oceans and remote land areas, is essential for exploring atmospheric dynamics, understanding critical issues of climate change, improving the estimation of air pollutant dispersion, and creating better initial conditions (ICs) for numerical weather predictions (NWPs; WMO, 2017; Baker et al., 2014; Pu et al., 2017; Zhang and Pu, 2010; Pu et al., 2010; Rennie et al., 2021b). Large areas of the tropical atmosphere lack measurement of wind profiles, which suggests the potential for significantly improving forecasting skills for various tropical convective systems with additional wind observations (Baker et al., 2014). To provide high spatial and temporal near-vertical wind profiles globally, the Aeolus satellite, the first spaceborne wind lidar, was launched by the European Space Agency (ESA) on 22 August 2018 (Reitebuch et al., 2020; ESA, 2022).
After successfully launching into a sun-synchronous orbit at about 320 km altitude with a weekly cycle, the Aeolus satellite now passes the Equator at 18:00 (06:00) local time (LT) during ascending (descending) orbits (Andersson et al., 2008; Krisch et al., 2022; ESA, 2022). The azimuth angle of the Aeolus satellite closely approaches 270∘ (90∘) for ascending (descending) orbits near the Equator, and the viewing angle toward the atmosphere is 35∘ off-nadir. The horizontal line-of-sight (HLOS) wind component, derived from the measured wind along the laser beam line of sight (LOS), is approximately east–west-oriented for most of the orbits (Krisch et al., 2022).
The Atmospheric Laser Doppler INstrument (ALADIN), on board the Aeolus mission, measures Doppler-shifted backscattered light scattering by atmospheric molecules and particulates with two separate interferometers: the Fizeau (Mie channel) for large particles, cloud droplets, ice crystals, dust, and aerosols and the Fabry–Pérot (Rayleigh channel) for moving molecules, including oxygen and nitrogen (Andersson et al., 2008; Reitebuch et al., 2009; Ingmann and Straume, 2016). Based on the signal-to-noise ratio, four types of HLOS winds are available, including Mie-clear, Mie-cloudy, Rayleigh-clear, and Rayleigh-cloudy (de Kloe et al., 2023). Rayleigh-clear winds perform better than Rayleigh-cloudy winds due to little or no contamination from Mie scattering. Mie-cloudy winds are better than Mie-clear winds because measurements from the Mie channel require strong backscattering from aerosols, water droplets, or ice crystals (Rennie et al., 2021a). The horizontal resolution of the Mie channel is typically about 10–15 km along the ground track and about 90 km for the Rayleigh channel. Vertically, the sizes of 24 range bins vary from 250 m to 2 km (Krisch et al., 2022).
Aeolus HLOS winds have been validated with different reference observations over many regions since launching, such as ground-based radar measurements (Zuo et al., 2022), ground-based coherent Doppler wind lidars (Wu et al., 2022), airborne Doppler wind lidars (Witschas et al., 2020, 2022), in situ atmospheric motion vectors (AMVs; Rani et al., 2022; Lukens et al., 2022), NWP equivalents (Rani et al., 2022; Martin et al., 2021), and radiosonde observations (Martin et al., 2021; Baars et al., 2020). Validation shows that the quality of Mie-cloudy winds is better than that of Rayleigh-clear winds (Zuo et al., 2022; Rani et al., 2022). Furthermore, Aeolus HLOS winds can capture atmospheric dynamic structures well, such as the low-level jet (LLJ), tropical easterly jet (TEJ; Rani et al., 2022), and atmospheric gravity waves (GWs; Banyard et al., 2021). As the Aeolus products are continuously calibrated and validated, the product processor is updated, and the performance of the Aeolus Level-2B (L2B) wind product improves (Wu et al., 2022). Thus, the current Aeolus products are suitable for data assimilation (DA) in the Global Forecast System (GFS; Pourret et al., 2022; Guo et al., 2021).
The assimilation of Aeolus HLOS winds has already been shown to improve analyses and forecasts in many global NWP models, including the Météo-France global NWP model ARPEGE (Pourret et al., 2022), the Canadian Global Deterministic Prediction System (GDPS; Laroche and St-James, 2022), and ECMWF's Integrated Forecasting System (IFS; Rennie et al., 2021a). Several other studies have assessed the impacts of assimilating Aeolus HLOS winds on tropical cyclones (TCs) by observing system experiments (OSEs). Rani et al. (2022) conducted OSEs to examine the impacts of the assimilation of Aeolus HLOS winds on simulations of the location, intensity, and vertical extent of north Indian Ocean (NIO) cyclones, and the improvements due to Aeolus winds were marginal. Marinescu et al. (2022) carried out OSEs with the operational Hurricane Weather and Research Forecasting (HWRF) model to assess the impacts of assimilating Aeolus HLOS winds on forecasting TCs, and their results suggest that the most significant potential impacts from the assimilation of Aeolus observations are likely to occur in the upper troposphere and lower stratosphere and within about 500 km of the TC center. The OSEs performed with the NOAA Finite-Volume Cubed-Sphere Global Forecast System (FV3GFS) suggested that the assimilation of Aeolus HLOS winds can reduce track forecast error in the eastern Pacific Basin and Atlantic Basin (Garrett et al., 2022). However, the potential impacts of assimilating these so-called “Aeolus near-real-time (NRT)” HLOS winds on simulations of TCs and tropical convective systems have not been investigated in detail. From August to September 2021, the NASA Convective Processes Experiment – Aerosols & Winds (CPEX-AW) field campaign, in collaboration with ESA, conducted post-launch calibration and validation activities for the Aeolus satellite near St. Croix over the Atlantic Ocean (AO), marking notable TCs and other tropical convective systems observed by the Aeolus satellite. In this study, we use Hurricane Ida (2021), a major hurricane, and a mesoscale convective system (MCS) embedded in an African easterly wave (AEW) during NASA's CPEX-AW campaign to assess the impacts of assimilating Aeolus HLOS winds.
The paper is organized as follows. Section 2 introduces the mesoscale community Weather Research and Forecasting (WRF) model, the NCEP Gridpoint Statistical Interpolation (GSI)-based three-dimensional ensemble-variational (3DEnVAR) hybrid DA system, the Integrated Multi-satellitE Retrievals for GPM (IMERG) precipitation dataset, and the statistical evaluation metrics. Section 3 discusses the impacts of assimilating Aeolus HLOS winds on forecasts of Hurricane Ida (2021). Section 4 diagnoses the influence of the assimilation of Aeolus HLOS winds on the analysis of atmospheric conditions associated with Hurricane Ida (2021). Section 5 evaluates the influence of the assimilation of Aeolus HLOS winds on an MCS embedded in an AEW. Finally, Sect. 6 summarizes the results and assesses the need for future work.
2.1 WRF model
An advanced research version of WRF model (WRF-ARW) V4.4 (Skamarock et al., 2019) is applied in this study, with 61 terrain-following levels and the model top set at 10 hPa, as indicated by Table 1. Two domains are employed in all experiments. Their sizes differ in the experiments of Hurricane Ida (2021) and the MCS within an AEW, as illustrated in Fig. 1. The horizontal resolutions of the parent and inner domains are 12 and 4 km, and the time steps of the parent and inner domains are 30 and 10 s, respectively. The boundary conditions of the parent domain are obtained from the horizontal resolution NCEP GFS final analyses (FNL; National Centers for Environmental Prediction et al., 2015). Details of the parameterization scheme options are listed in Table 1.
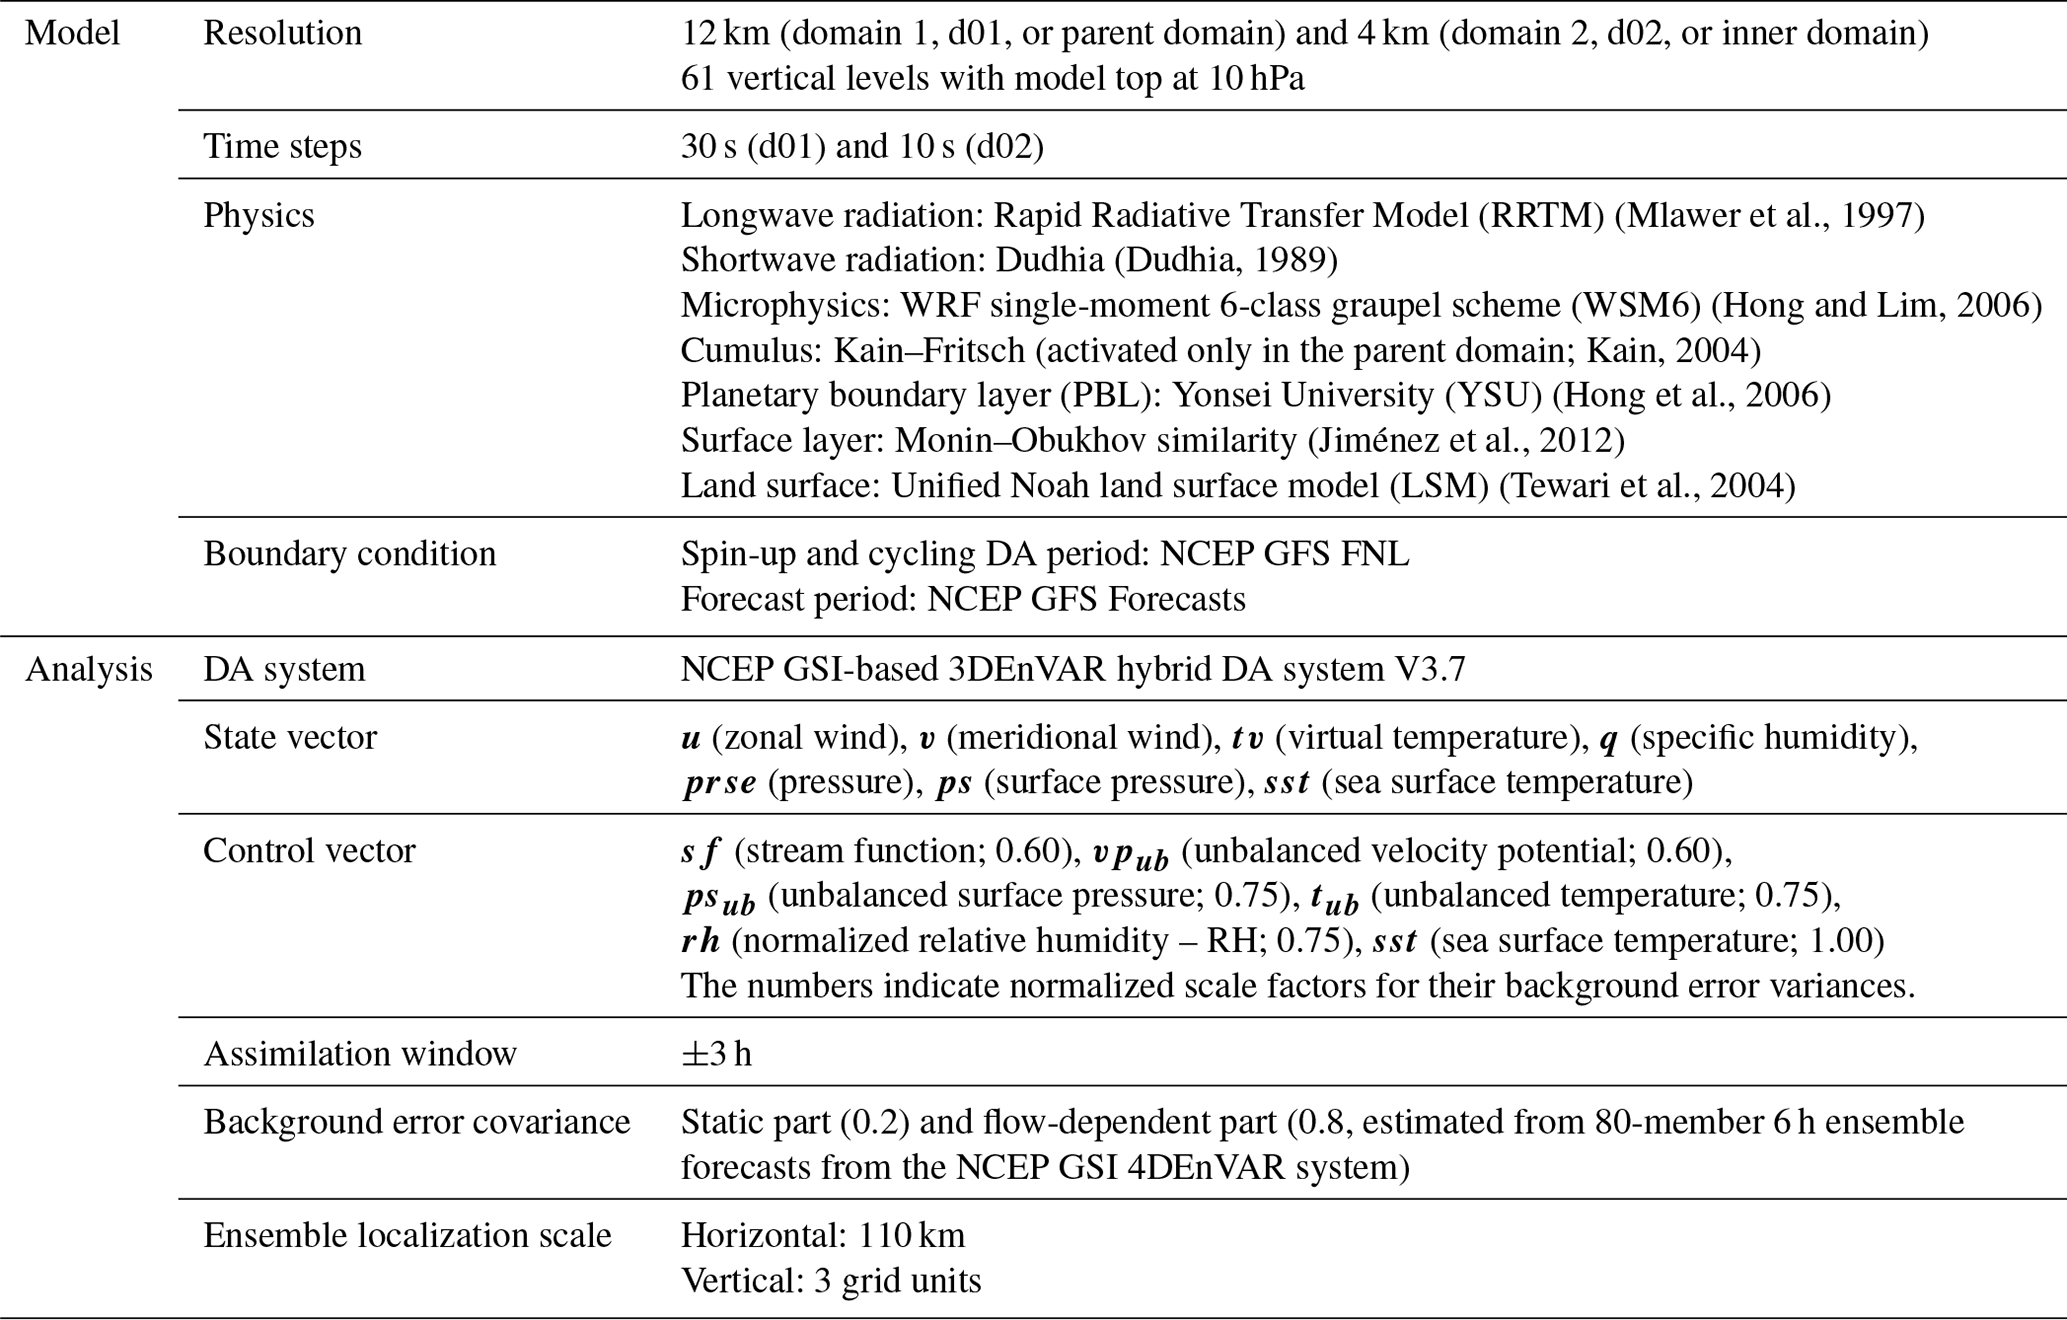
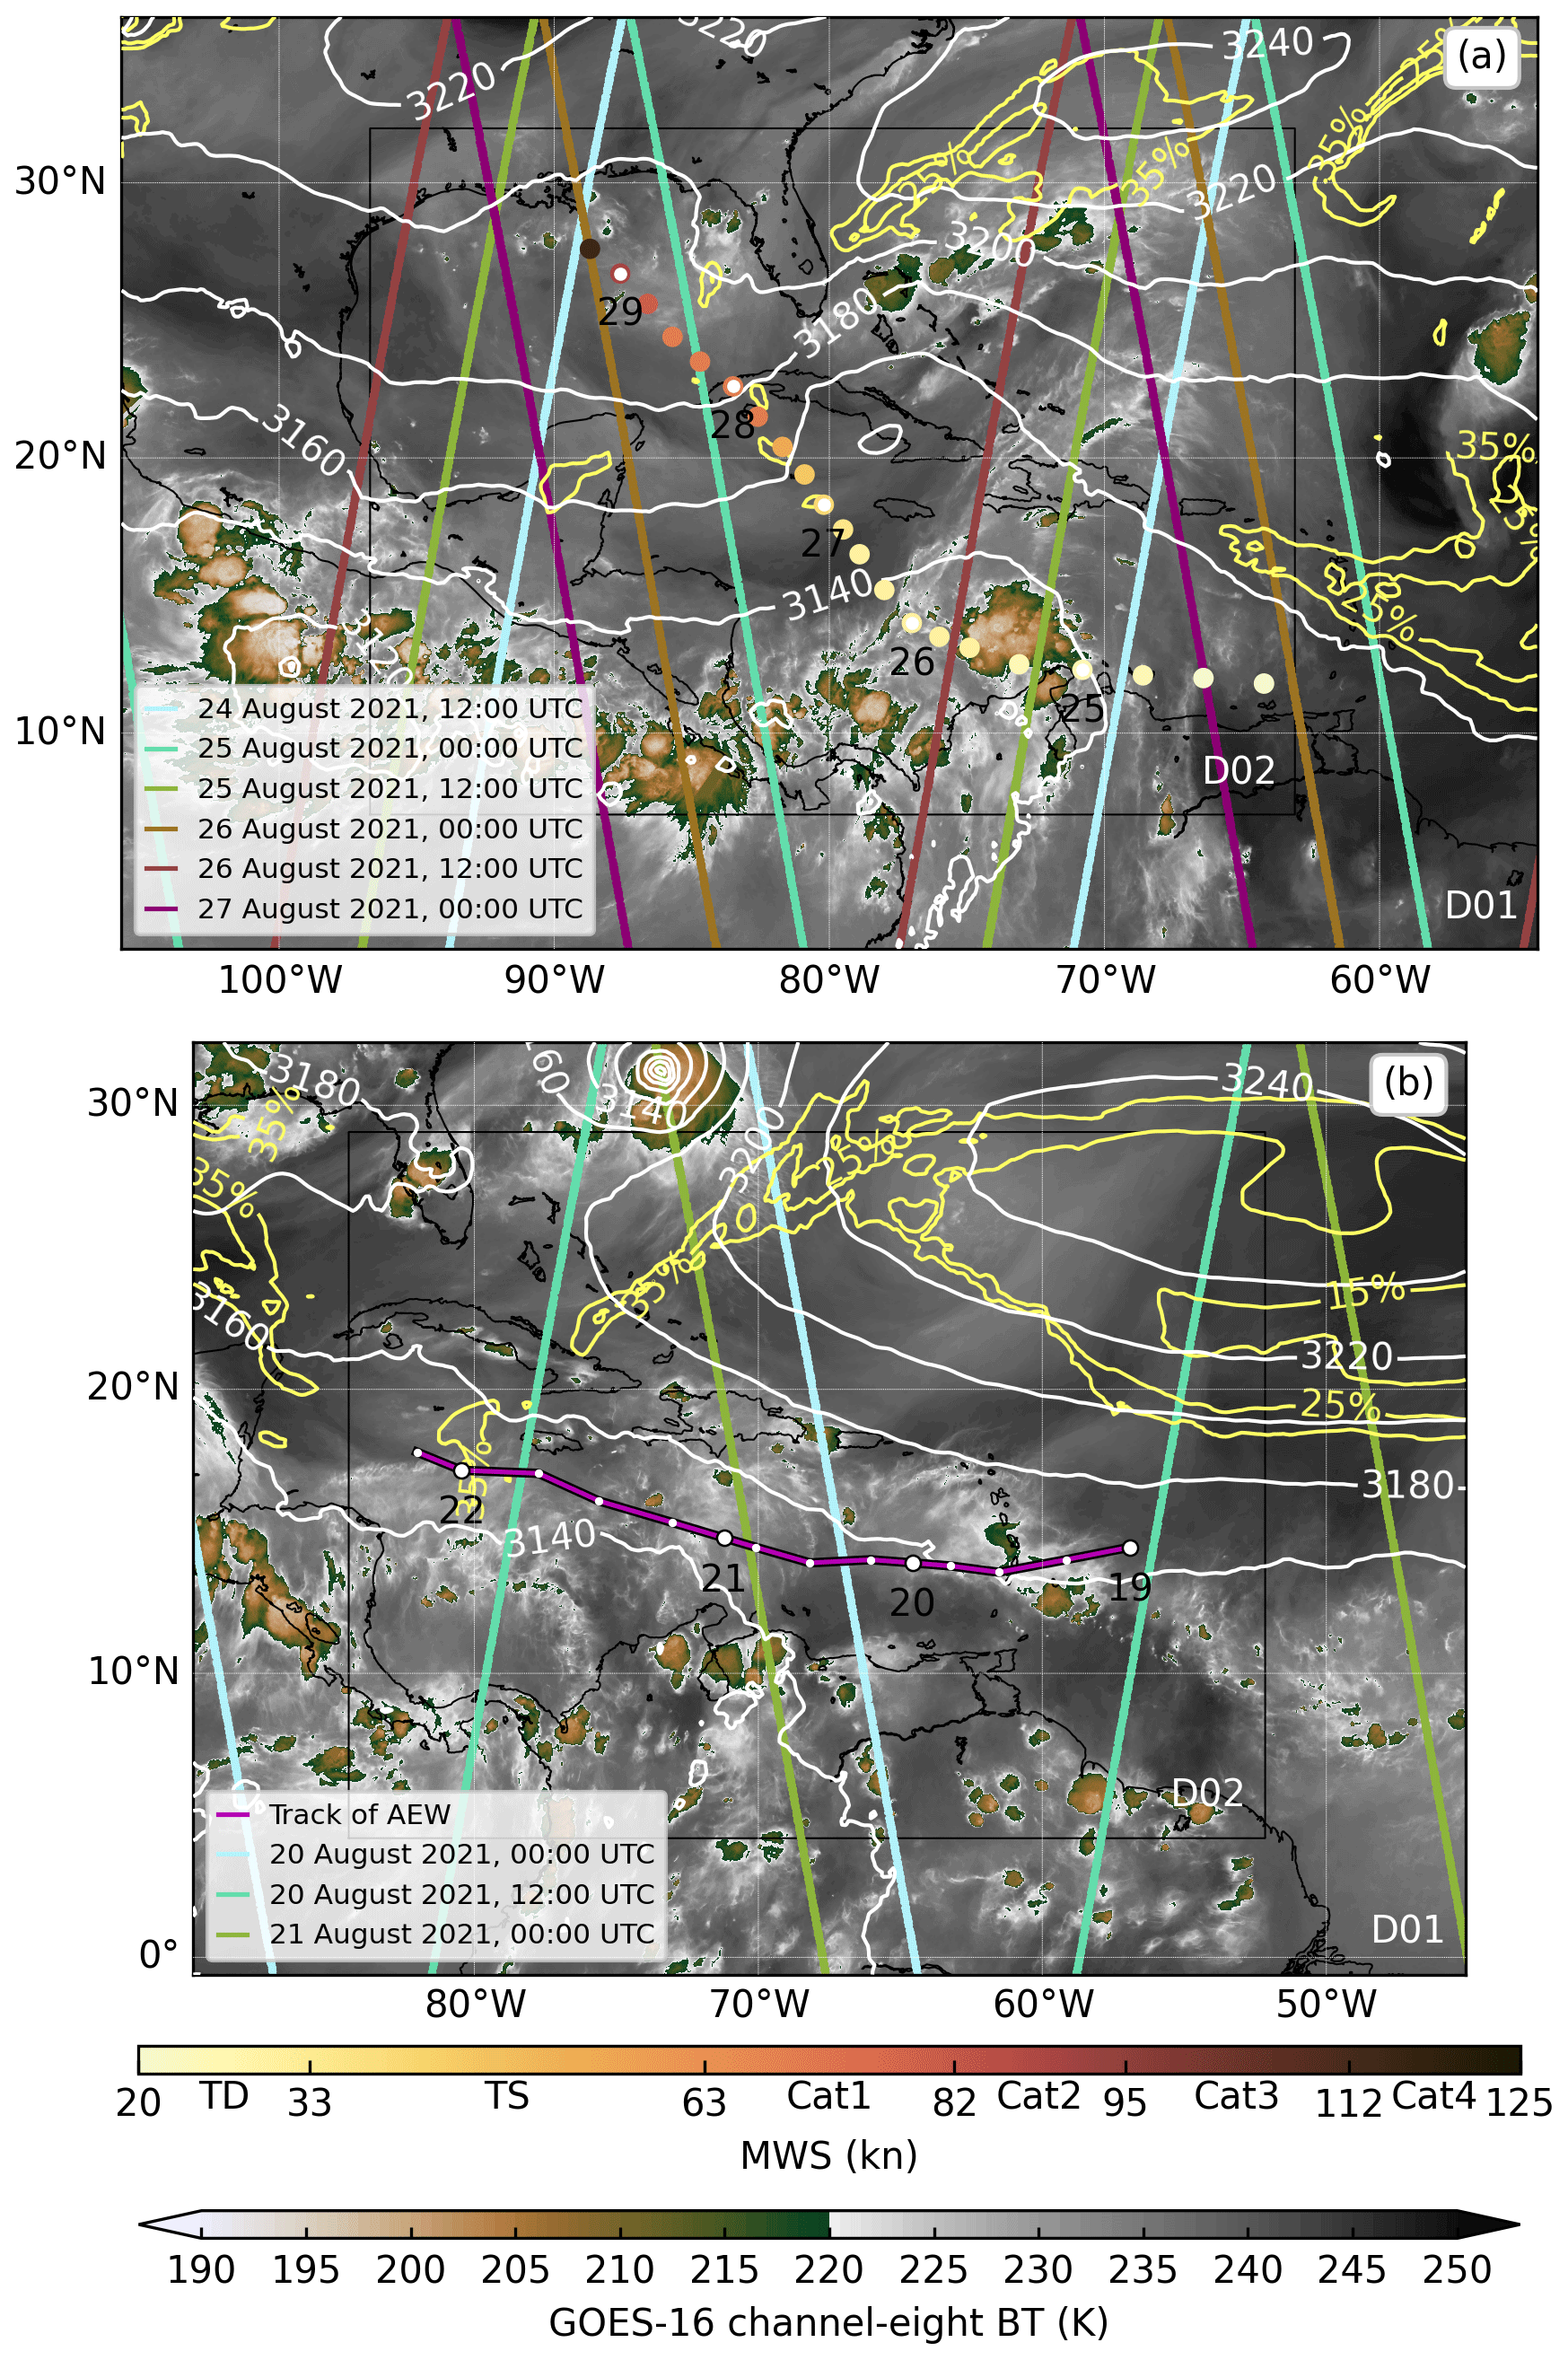
Figure 1Two nested domains (d01: 12 km; d02: 4 km) in experiments 2500_L2B (a) and 1918_L2B (b). The Aeolus measurement swaths (colored lines) are from 24 August 2021, 12:00 UTC, to 27 August 2021, 00:00 UTC (a), and from 20 August 2021, 00:00 UTC, to 21 August 2021, 00:00 UTC (b). The track and MWSs (colored dots) of Hurricane Ida (2021) in panel (a) are adopted from the NHC best-track data, and the days are illustrated below the open markers indicating 00:00 UTC. Two classifications (TD: tropical depression; TS: tropical storm) and different categories (Cat1: Category 1; Cat2: Category 2; Cat3: Category 3; Cat4: Category 4) based on the Saffir–Simpson hurricane wind scale are given below the color bar of MWS. The AEW in panel (b) is tracked manually using the GFS-analyzed relative vorticity maxima at 700 hPa (purple line with black edges). The white dots with the numbers below along the AEW track indicate 00:00 UTC on a given day. The geopotential height at 700 hPa (white lines) and RH at 850 hPa (yellow lines), obtained from GFS analysis, are overlaid atop the Geostationary Operational Environmental Satellite-16 (GOES-16) channel-eight brightness temperatures (BTs; shaded) on 25 August 2021, 12:00 UTC (a), and 21 August 2021, 00:00 UTC (b). Only RH less than 35 % is shown in panels (a) and (b).
2.2 NCEP GSI-based 3DEnVAR hybrid DA system
The DA system used in this study is the NCEP GSI-based 3DEnVAR hybrid DA system V3.7 (Hu et al., 2018), the details of which are listed in Table 1. The cost function of the GSI system has two terms: the background and observational error terms.
In the background error term (the first term in Eq. 1), x is the analysis and xb is the first guess, namely a 6 h WRF model simulation. The hybrid background error covariance matrix consists of a prescribed static part B1 and a flow-dependent part B2. The weighting factors of these two portions are 0.2 (α1) and 0.8 (α2), respectively. The flow-dependent part is estimated by 80-member 6 h ensemble forecasts from the NCEP GSI four-dimensional ensemble-variational (4DEnVAR) system. The default homogeneous isotropic horizontal ensemble localization scale is 110 km, and the default vertical localization scale is 3 grid units (see Table 1). In the observational error term (the second term in Eq. 1), y0 is the observation, H is the forward model, and R is the observation error covariance. Thus, the observation minus analysis (OmA) and the observation minus background (OmB) are defined as y0−H(x) and y0−H(xb), respectively.
The observations y0 in this study are the Aeolus L2B baseline 12 NRT HLOS winds (ESA, 2021). The quality control (QC) steps used in this study are the following:
-
Mie-clear and Rayleigh-cloudy products are not used in this study due to their poor quality (Rennie et al., 2021a; Pourret et al., 2022; Laroche and St-James, 2022).
-
Aeolus HLOS winds marked as invalid retrievals by the L2B processor are eliminated (Rennie et al., 2021a).
-
The GSI system rejects Mie-cloudy and Rayleigh-clear HLOS winds when their L2B estimated instrumental errors (before scaling) are over 12 and 10 m s−1, respectively (Rennie et al., 2021a).
-
Aeolus HLOS winds are discarded when their absolute value is larger than 1000 m s−1.
-
A gross check is adopted to remove observations with normalized OmBs (OmB normalized by σ) larger than 4σ, while σ is the standard deviation of the observation errors (similar to QC Step 6 in Pourret et al., 2022).
The forward model H(x) of the Mie-cloudy and Rayleigh-clear HLOS winds (Pourret et al., 2022; Laroche and St-James, 2022; Rennie et al., 2021a) is defined as
The forward model H(x) interpolates the WRF model winds (zonal wind component u and meridional wind component v) according to the geolocation of the Aeolus observations and projects the interpolated model winds to the HLOS winds with the horizontal azimuth angle θ. The vertical velocity is assumed to be 0 in the forward model because it seems to be a second-order problem even for tropical convective systems (Rennie and Isaksen, 2020).
The observation error covariance matrix R can be divided into R=Σ½CΣ½. C is the correlation matrix. Since we assume that the observations are uncorrelated in this study, C is an identity matrix. Σ½ is a diagonal matrix of the standard deviation of the observation error σ. The observation error consists of the instrument and representation error, while the representation error includes the observation–operator error and the error due to unresolved scales and processes (Janjić et al., 2018). Since the representation error is unknown and the primary goal of this study is to investigate the impacts of the assimilation of Aeolus HLOS winds on Hurricane Ida (2021) and an MCS embedded in an AEW, we simply use the L2B dynamic estimated instrumental errors to estimate the standard deviation of the observation error σ. Figure 2 shows scatterplots of the valid Mie-cloudy (a) and Rayleigh-clear (b) HLOS winds against their estimated instrumental errors from 25 August 2021, 06:00 UTC, to 27 August 2021, 00:00 UTC (cycling DA period of experiment 2500_L2B). The Mie-cloudy HLOS winds are clustered primarily between −20 and 20 m s−1, and their estimated instrumental errors lie mostly between 1 and 4 m s−1. Based on the statistics of the data, the standard deviation of the observation errors for the Mie-cloudy winds is assigned to 2.5 m s−1 in this study, as indicated by the black line in Fig. 2a. The Rayleigh-clear HLOS winds are mainly between −30 and 30 m s−1, and their estimated instrumental errors vary primarily from 3 to 6 m s−1. The standard deviation of the observation errors for the Rayleigh-clear winds is set at 4.5 m s−1 based on the statistics of data samples. The Rayleigh-clear winds have a higher standard deviation of observation errors because the quality of the Mie-cloudy winds is better than that of the Rayleigh-clear winds (Zuo et al., 2022; Rani et al., 2022).
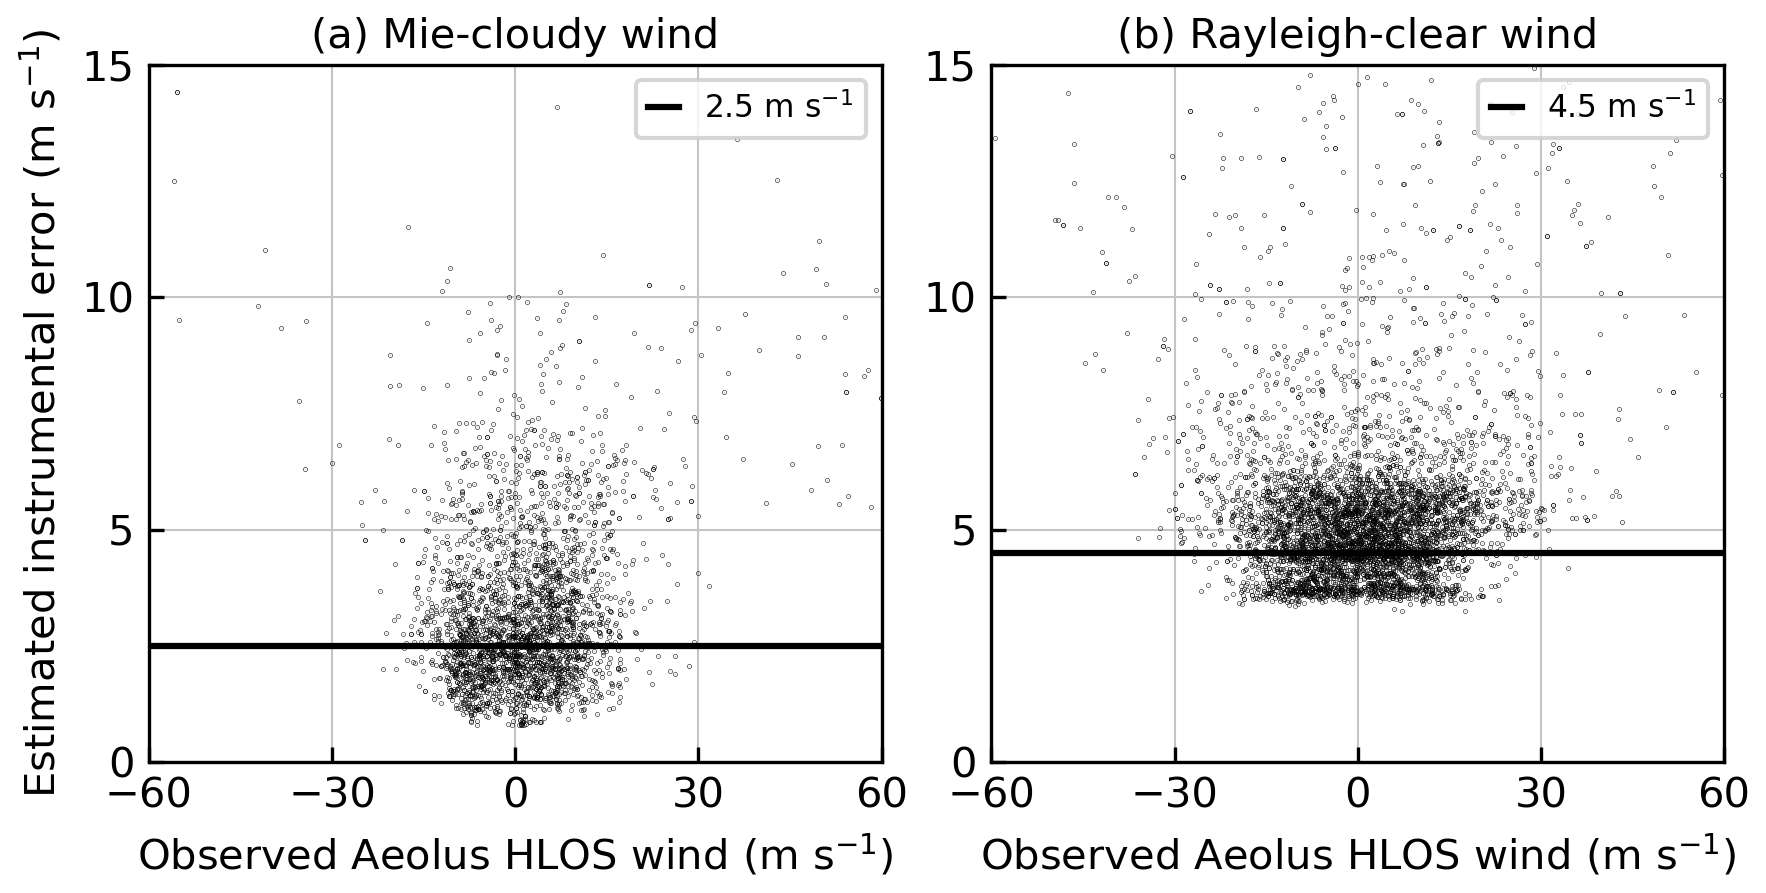
Figure 2Scatterplots (black circles) of valid observed Aeolus HLOS winds against their estimated instrumental errors from 25 August 2021, 06:00 UTC, to 27 August 2021, 00:00 UTC (cycling DA period of experiment 2500_L2B), for Mie-cloudy winds (a) and Rayleigh-clear winds (b). The black lines in panels (a) and (b) indicate the estimated instrumental errors for the greatest population of valid observed Aeolus HLOS winds, which are 2.5 and 4.5 m s−1, respectively. The results of experiments 2406_L2B, 2412_L2B, and 2418_L2B are similar to those of experiment 2500_L2B.
2.3 IMERG precipitation data
The precipitation dataset used for verifying rainfall forecasts in this study is IMERG Version 6B-Final. IMERG precipitation estimates combine various satellite passive microwave sensors related to precipitation, including the global precipitation measurement (GPM) constellation and microwave precipitation-calibrated geosynchronous infrared (GEO-IR) fields. IMERG precipitation estimates are half-hourly and on a grid over the globe. This dataset is available from June 2000 to the present (Huffman et al., 2019).
2.4 Statistical evaluation metrics
2.4.1 RMSE
Root-mean-square error (RMSE) can measure errors in the track, maximum surface wind speed (MWS) and minimum sea-level pressure (MSLP) between the forecasts and National Hurricane Center (NHC) best-track data. The RMSE is defined as follows:
where x is the location, MWS, or MSLP forecast of a TC, while xref is adopted from the NHC best-track data.
2.4.2 ETS
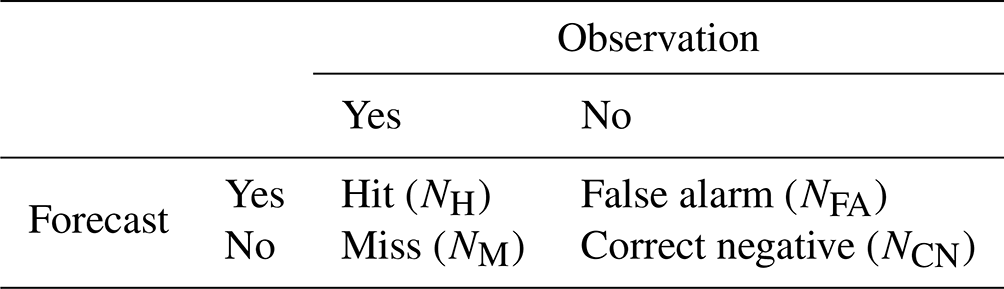
An equitable threat score (ETS) is a corrected ratio of the number of correctly predicted events to the total number of predicted or observed events. The definition of ETS is
where ref is the chance forecast:
Other variables are computed by a contingency table (Table 2), which defines hit (NH), false alarm (NFA), miss (NM), and correct negative (NCN).
3.1 Case description and experiment design
Ida (2021) originated from an AEW on 14 August 2021. On 24 August 2021, the AEW moved into the Caribbean Sea, reached the area near Aruba, Bonaire, and Curaçao, and interacted with MCSs along the northern coast of South America. On 25 August 2021, 12:00 UTC, as shown by Fig. 1a, the convection, indicated by the GOES-16 channel-eight BTs, was concentrated in the eastern area of a broad low-pressure system south of the subtropical ridge over the southwestern Caribbean Sea, which is shown by geopotential height at 700 hPa and RH at 850 hPa. Steered by the subtropical ridge, the convective disturbance began to turn north to northwestward on 26 August 2021, as demonstrated by the track of Ida (2021) in Fig. 1a. A TD formed on 26 August 2021, 12:00 UTC, and then intensified into a TS 6 h after cyclogenesis. Early on 27 August 2021, the first rapid intensification (RI) period occurred, and Ida (2021) strengthened into a hurricane on 27 August 2021, 18:00 UTC. After moving across the Isle of Youth, Ida (2021) made landfall in Cuba around 28 August 2021, 00:00 UTC. After passing Cuba, Ida (2021) experienced the second RI period from 28 August 2021, 12:00 UTC, to 29 August 2021, 12:00 UTC (Beven et al., 2022).
As shown by Table 3, eight experiments, i.e., experiments 2406, 2406_L2B, 2412, 2412_L2B, 2418, 2418_L2B, 2500, and 2500_L2B, are performed to investigate the impacts of assimilating Aeolus Mie-cloudy and Rayleigh-clear HLOS winds on the analysis and subsequent forecasts of Hurricane Ida (2021). DA was performed for both model domains. Experiment 2406 is initialized by the NCEP GFS FNL on 24 August 2021, 06:00 UTC. The first two digits of the experiment name indicate the day of the initial time, and the last two digits represent the hour of the initial time. After a 6 h spin-up, a cycling DA period from 24 August 2021, 12:00 UTC, to 26 August 2021, 06:00 UTC (eight DA cycles in total), is performed in experiment 2406. The data that were assimilated routinely into the NCEP Global Data Assimilation System (GDAS), including global upper air and surface weather observations as well as satellite data, are assimilated. The subsequent 48 h forecasts are initialized from the analysis of DA cycles 5–8. Experiment 2406_L2B is similar to experiment 2406, but it also assimilates Aeolus HLOS winds during cycling DA. The forecasts are not initialized from the analysis of DA cycles 1–4 in this study because the impacts of assimilating Aeolus HLOS winds are tiny if the number of DA cycles is not large enough.
Since Ida (2021) was a broad low-pressure system interacting with MCSs along the northern coast of South America on 24 August 2021, the forecasts of Ida (2021) are sensitive to its ICs. Consequently, except for experiments 2406 and 2406_L2B, we carry out three more sets of experiments with different initial times: 2412 and 2412_L2B (initialized on 24 August 2021, 12:00 UTC), 2418 and 2418_L2B (initialized on 24 August 2021, 18:00 UTC), and 2500 and 2500_L2B (initialized on 25 August 2021, 00:00 UTC). The cycling DA periods of all experiments are before the first RI of Ida (2021), enabling us to investigate the impacts of assimilating Aeolus HLOS winds on the intensity forecasts of the first and second rapid RI periods of Ida (2021).
As DA results are also sensitive to the homogeneous isotropic horizontal and vertical ensemble localization scales, we performed additional sensitivity experiments. The horizontal ensemble localization scale of experiment 2500_L2B_H1 reduces to 55 km, half of the default value for experiment 2500_L2B. The horizontal localization scale of experiments 2500_L2B_H2 increases to 220 km, double the default value, when the vertical localization scale is fixed at 3 grid units. Experiments 2500_L2B_V1 and 2500_L2B_V2 are similar to experiments 2500_L2B_H1 and 2500_L2B_H2 but for testing the sensitivity to vertical localization scale (see details in Table 3).
Table 3List of experiment configurations.
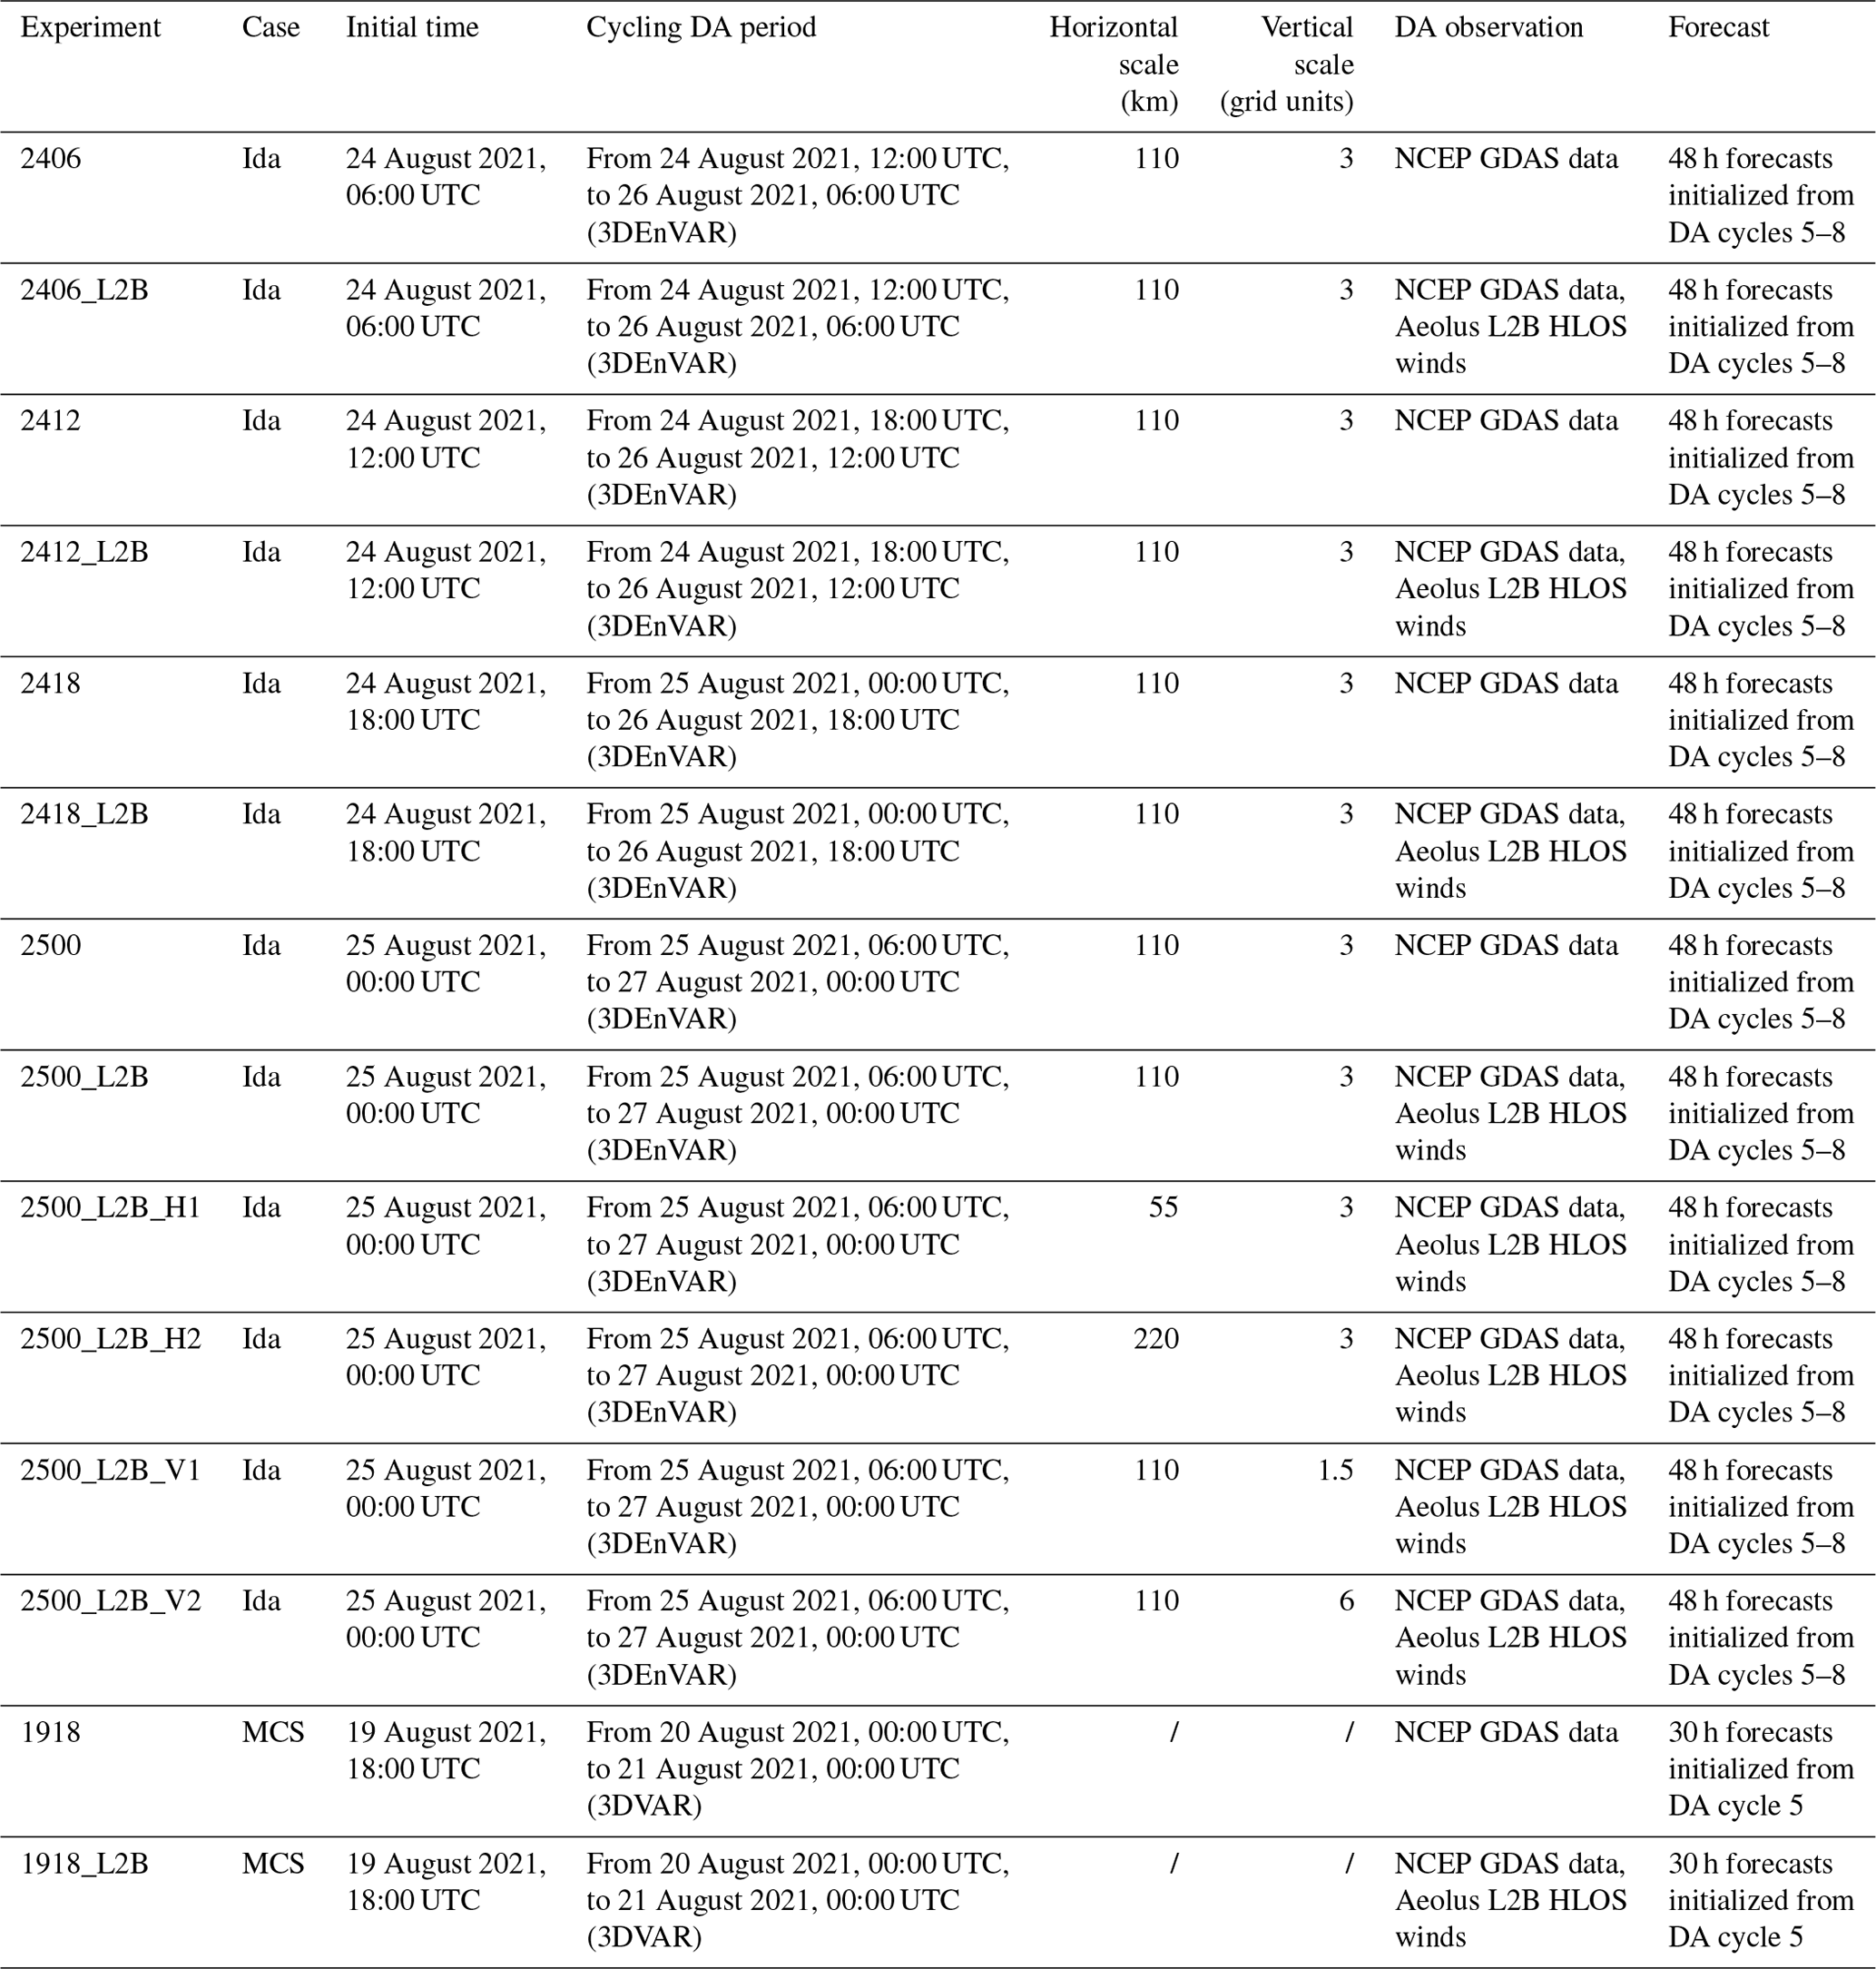
A slash (/) indicates that the horizontal and vertical localization scales are not needed.
3.2 Distributions of OmB and OmA
To reveal the influence of DA on initial analysis, Fig. 3 shows the distribution of normalized OmB and OmA for the cycling DA period of experiment 2500_L2B in both domains. Compared to observations, the analyses with DA enhanced the model fields as OmAs are smaller than the OmBs, and the OmAs are closer (relative to OmBs) to the zero line. The decreased OmAs relative to OmBs are associated with better hurricane forecasts in these experiments (see following sections).
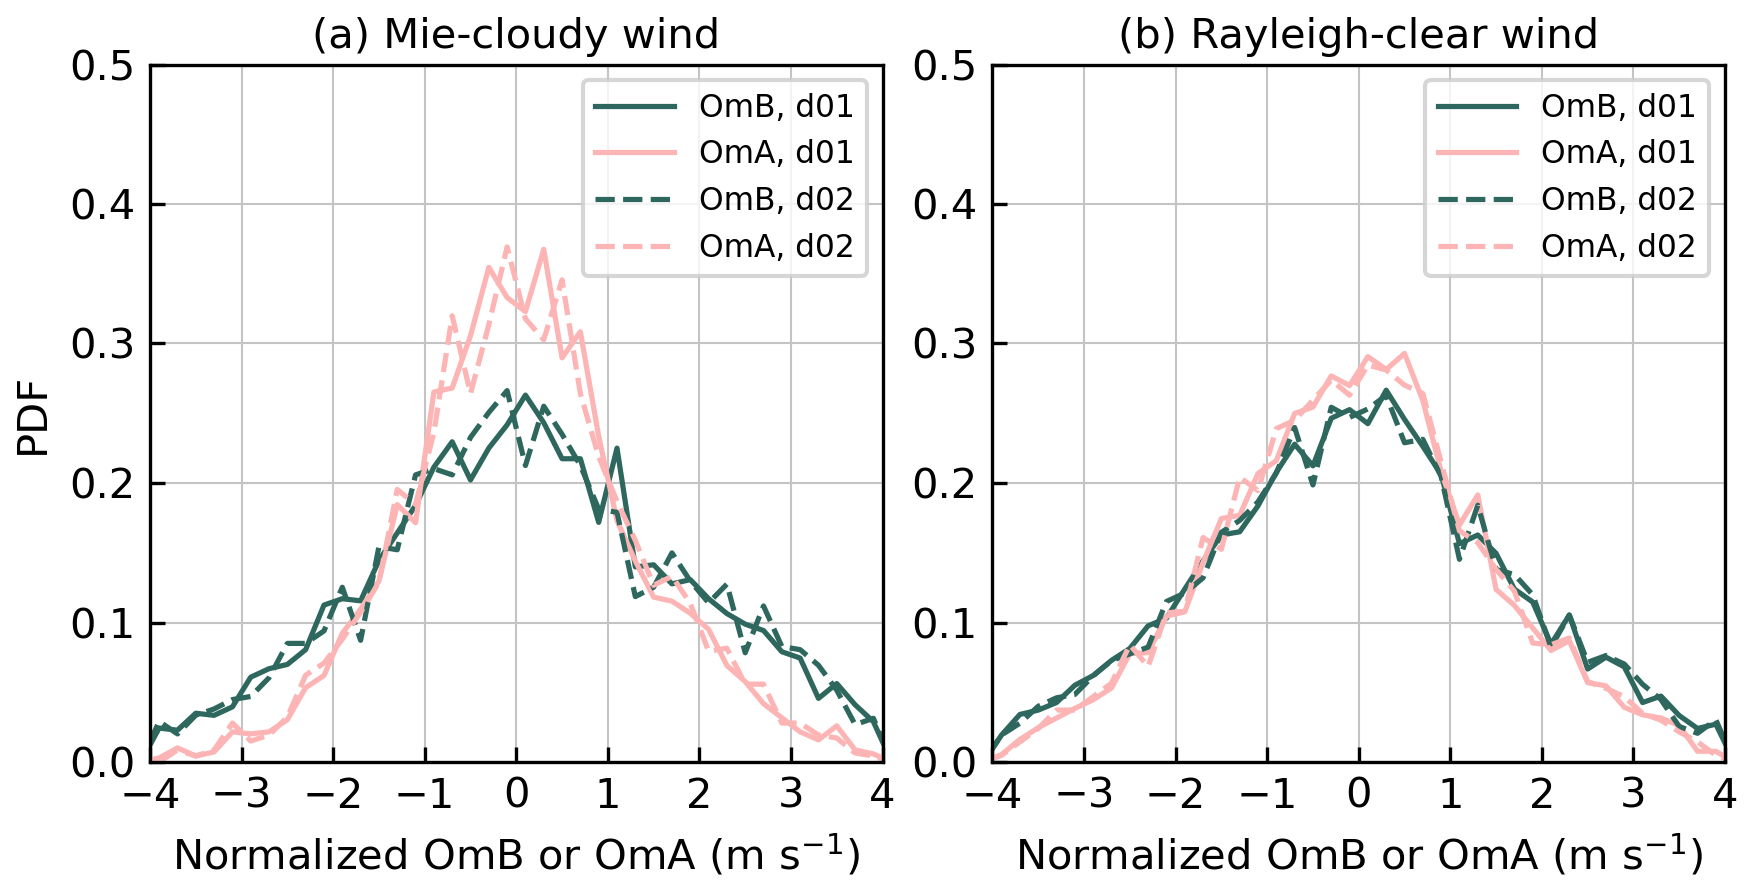
Figure 3Probability density functions (PDFs) of normalized OmB (green) and normalized OmA (pink) in domain 1 (d01, solid line) and domain 2 (d02, dashed line) from 25 August 2021, 06:00 UTC, to 27 August 2021, 00:00 UTC (cycling DA period of experiment 2500_L2B), for Mie-cloudy winds (a) and Rayleigh-clear winds (b). The PDFs are computed in 0.2 bins of normalized OmB or OmA.
3.3 Track forecasts
Figure 4a compares the 48 h track forecasts between experiments 2406 (without the assimilation of Aeolus HLOS winds) and 2406_L2B (with the assimilation of Aeolus HLOS winds) during the last four cycles of the cycling DA period (from 25 August 2021, 12:00 UTC, to 26 August 2021, 06:00 UTC). The 48 h track forecasts of experiment 2406 initialized from the last four DA cycles show that all track forecasts, where Ida generally moves northwestward, are southwest of the NHC best track. As shown by Fig. 4b–d, the 48 h track forecasts of experiments 2412, 2418, and 2500 (as in experiment 2406) also have systematic biases toward the southwest of the NHC best track of Ida (2021). In addition, the track forecast errors are reduced in experiments without the assimilation of Aeolus HLOS winds (see the numbers in Fig. 4e–h) when more NCEP GDAS data are assimilated, in addition to the forecasts initialized from DA cycles 5 and 6 of experiment 2406. Compared to experiments without the assimilation of Aeolus HLOS winds, the 48 h track forecasts become closer to the NHC best track of Ida (see Fig. 4a–d), and the averaged track forecast errors are reduced consistently in the experiments with the assimilation of Aeolus HLOS winds, as shown by Fig. 4e–h. The reductions in the averaged track forecast errors range from 10 to around 60 km after the assimilation of Aeolus HLOS winds.
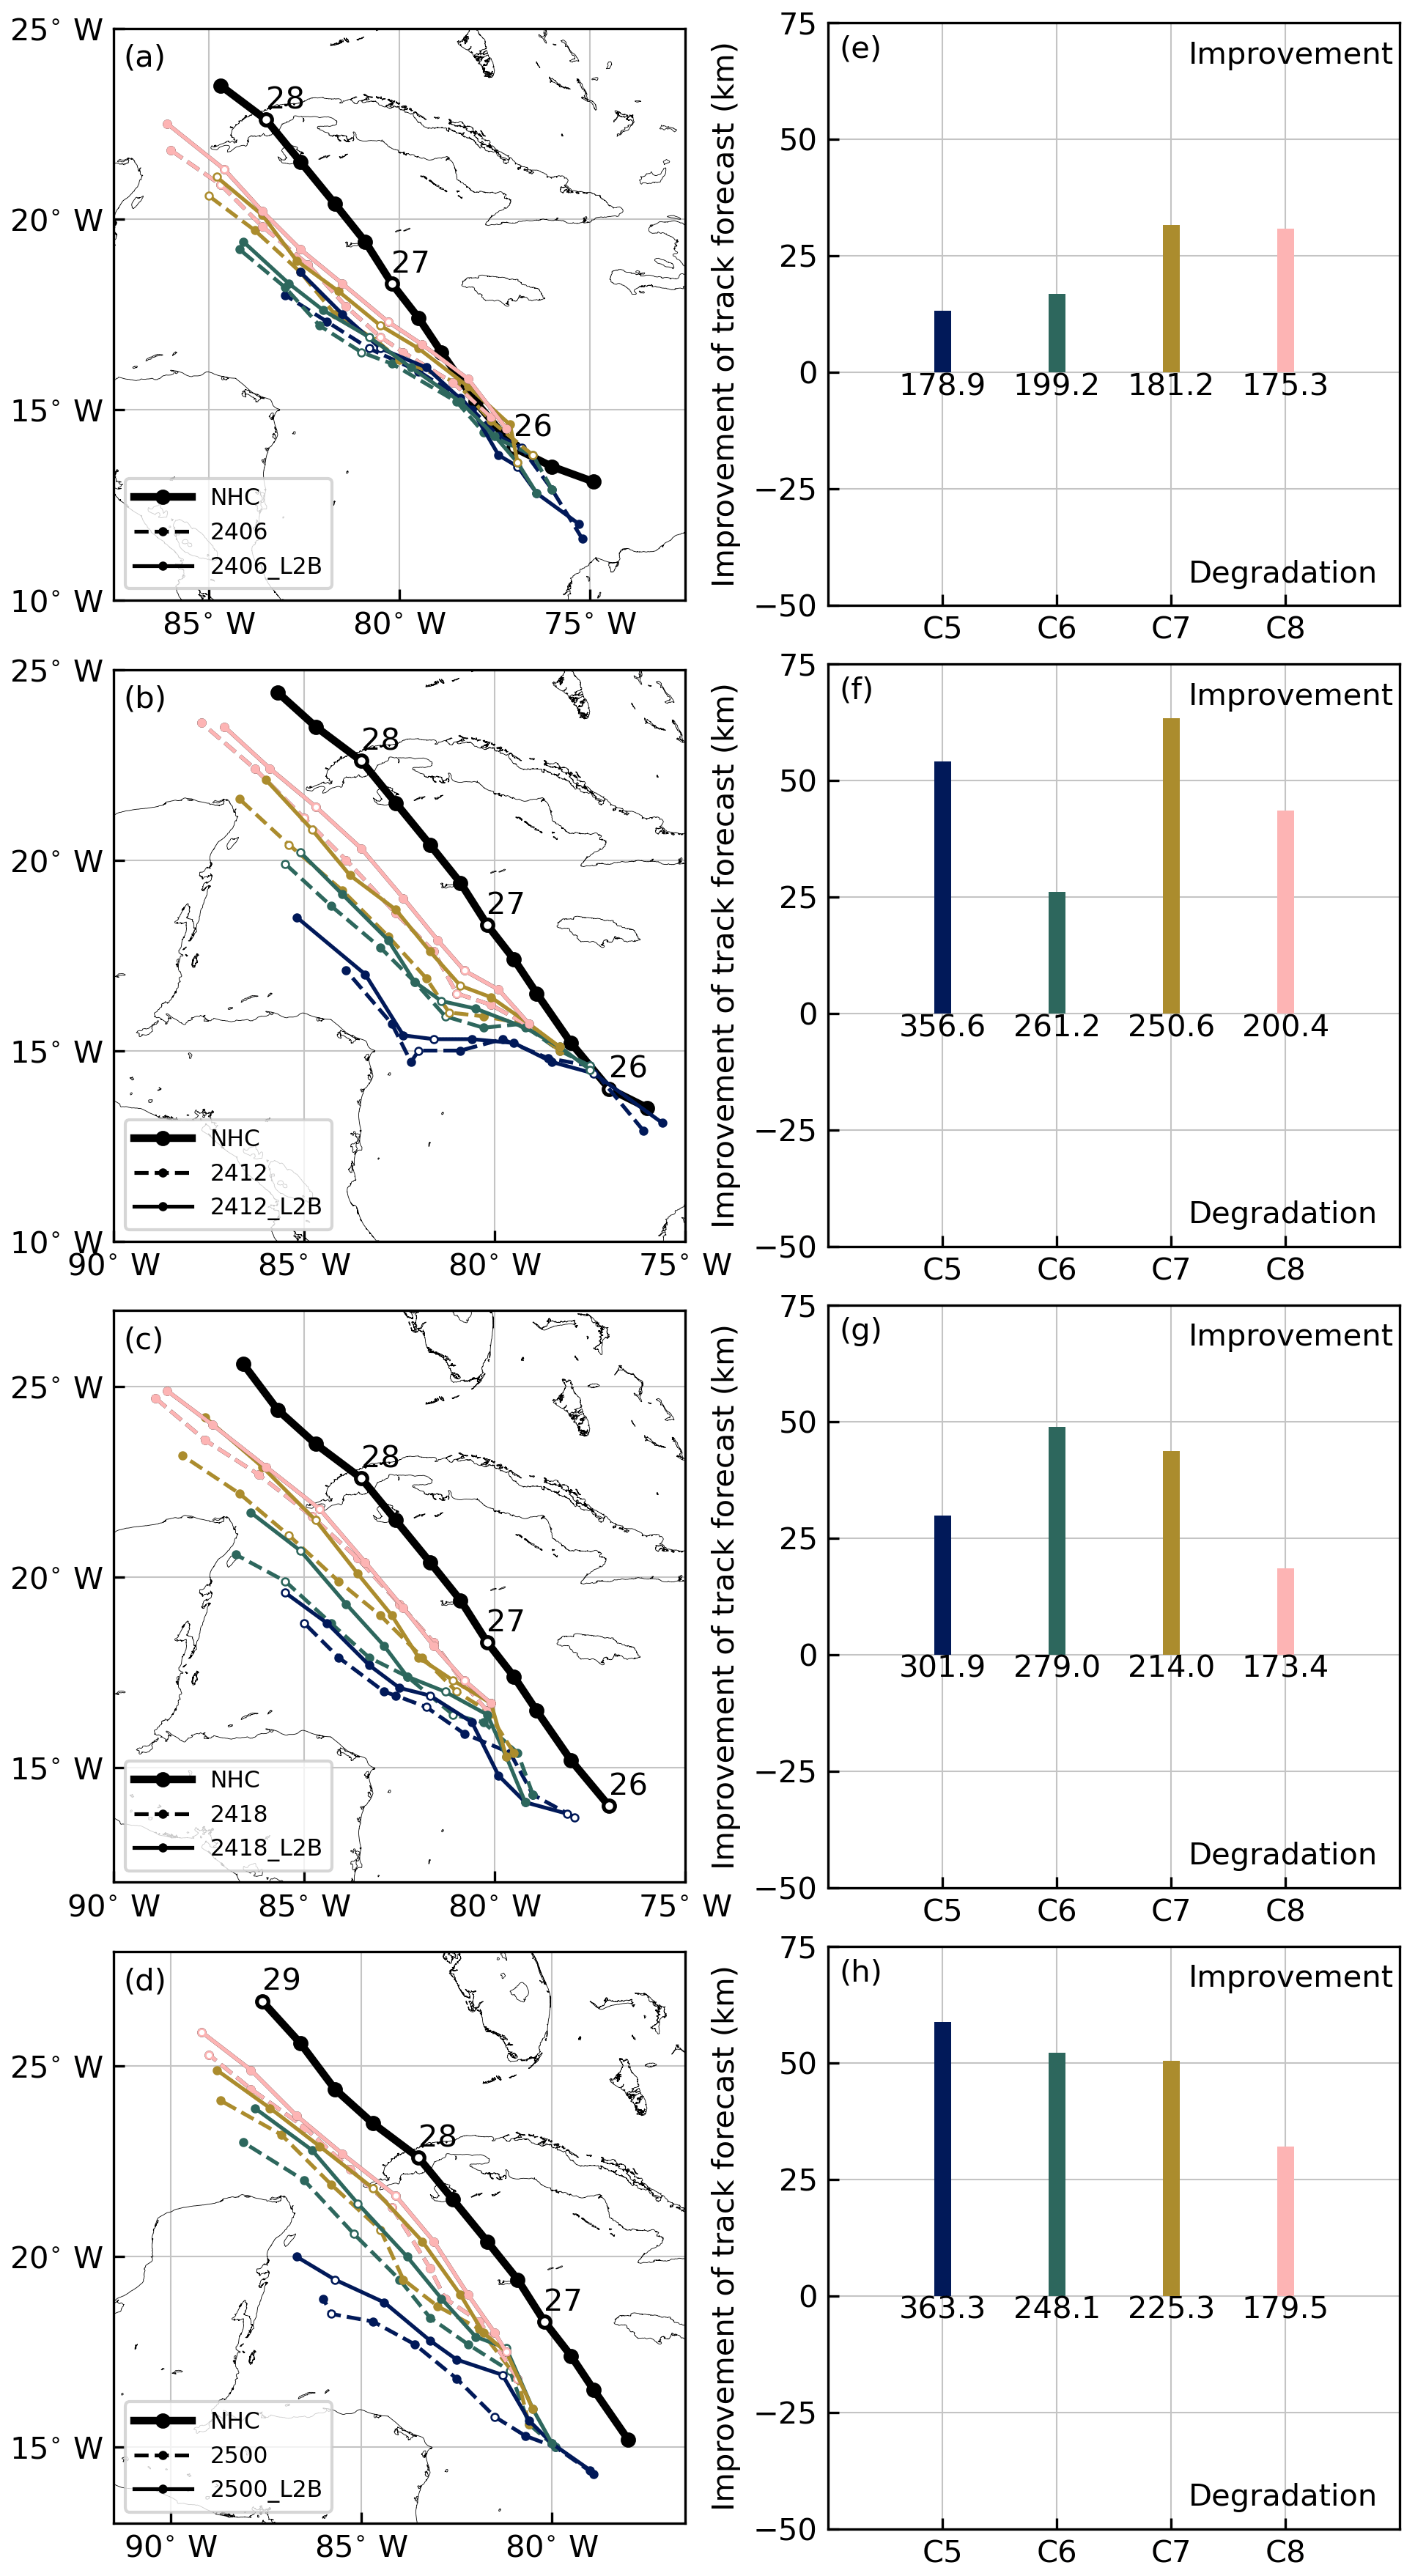
Figure 4Comparison of 48 h track forecasts of Hurricane Ida (2021) initialized from the analysis of DA cycles 5 (blue), 6 (green), 7 (brown), and 8 (pink) between experiments 2406 (dashed lines) and 2406_L2B (solid lines) (a), 2412 and 2412_L2B (b), 2418 and 2418_L2B (c), and 2500 and 2500_L2B (d). Tracks of Ida (2021) adopted from the NHC best-track data are shown by solid black lines in panels (a)–(d), and the days are illustrated above the open markers indicating 00:00 UTC. The forecasts of Ida (2021) are tracked by the Geophysical Fluid Dynamics Laboratory (GFDL) vortex tracker. Compared with the experiments without the assimilation of Aeolus HLOS winds, the averaged RMSE reductions in the 48 h track forecasts initialized from the analysis of DA cycles 5 (blue), 6 (green), 7 (brown), and 8 (pink) for experiments 2406_L2B, 2412_L2B, 2418_ L2B, and 2500_L2B are shown in panels (e)–(h), respectively. The numbers indicate the averaged RMSEs of track forecasts of the reference experiments. Positive values of RMSE reductions mean improvement, while negative values indicate degradation.
3.4 Intensity forecasts
As introduced in Sect. 3.1, Ida (2021) made cyclogenesis on 26 August 2021, 12:00 UTC, and strengthened into a TS 6 h later. Ida (2021) experienced its first RI period from 00:00 UTC to 18:00 UTC on 27 August 2021. After landfall and passing Cuba, Ida (2021) experienced the second RI period from 28 August 2021, 12:00 UTC, to 29 August 2021, 12:00 UTC. Figure 5a compares the 48 h MSLP forecasts initialized from the last four cycles (from 25 August 2021, 12:00 UTC, to 26 August 2021, 06:00 UTC) between experiments 2406 (without the assimilation of Aeolus HLOS winds) and 2406_L2B (with the assimilation of Aeolus HLOS winds). The 48 h MSLP forecasts of experiments 2406 and 2406_L2B capture the intensification processes well. However, they cannot capture the platform between the two RI periods (from 27 August 2021, 18:00 UTC, to 28 August 2021, 12:00 UTC) because their forecasts fail to predict the landfall of Ida (2021) in Cuba (see Fig. 4a). Figure 5e indicates a neutral impact of the assimilation of Aeolus HLOS winds on the MSLP forecasts for Ida (2021), compared to experiment 2406. Figure 6a and e compare the 48 h MWS forecasts initialized from the last four cycles between experiments 2406 and 2406_L2B. The conclusions are consistent with the MSLP forecasts of experiments 2406 and 2406_L2B. Similarly, the 48 h forecasts of experiments 2412 and 2412_L2B also predict the MSLP (see Fig. 5b) and the MWS (see Fig. 6b) reasonably, except for the forecasts initialized from DA cycle 5, and the impacts of assimilating Aeolus HLOS winds are neutral as well (see Fig. 5f).
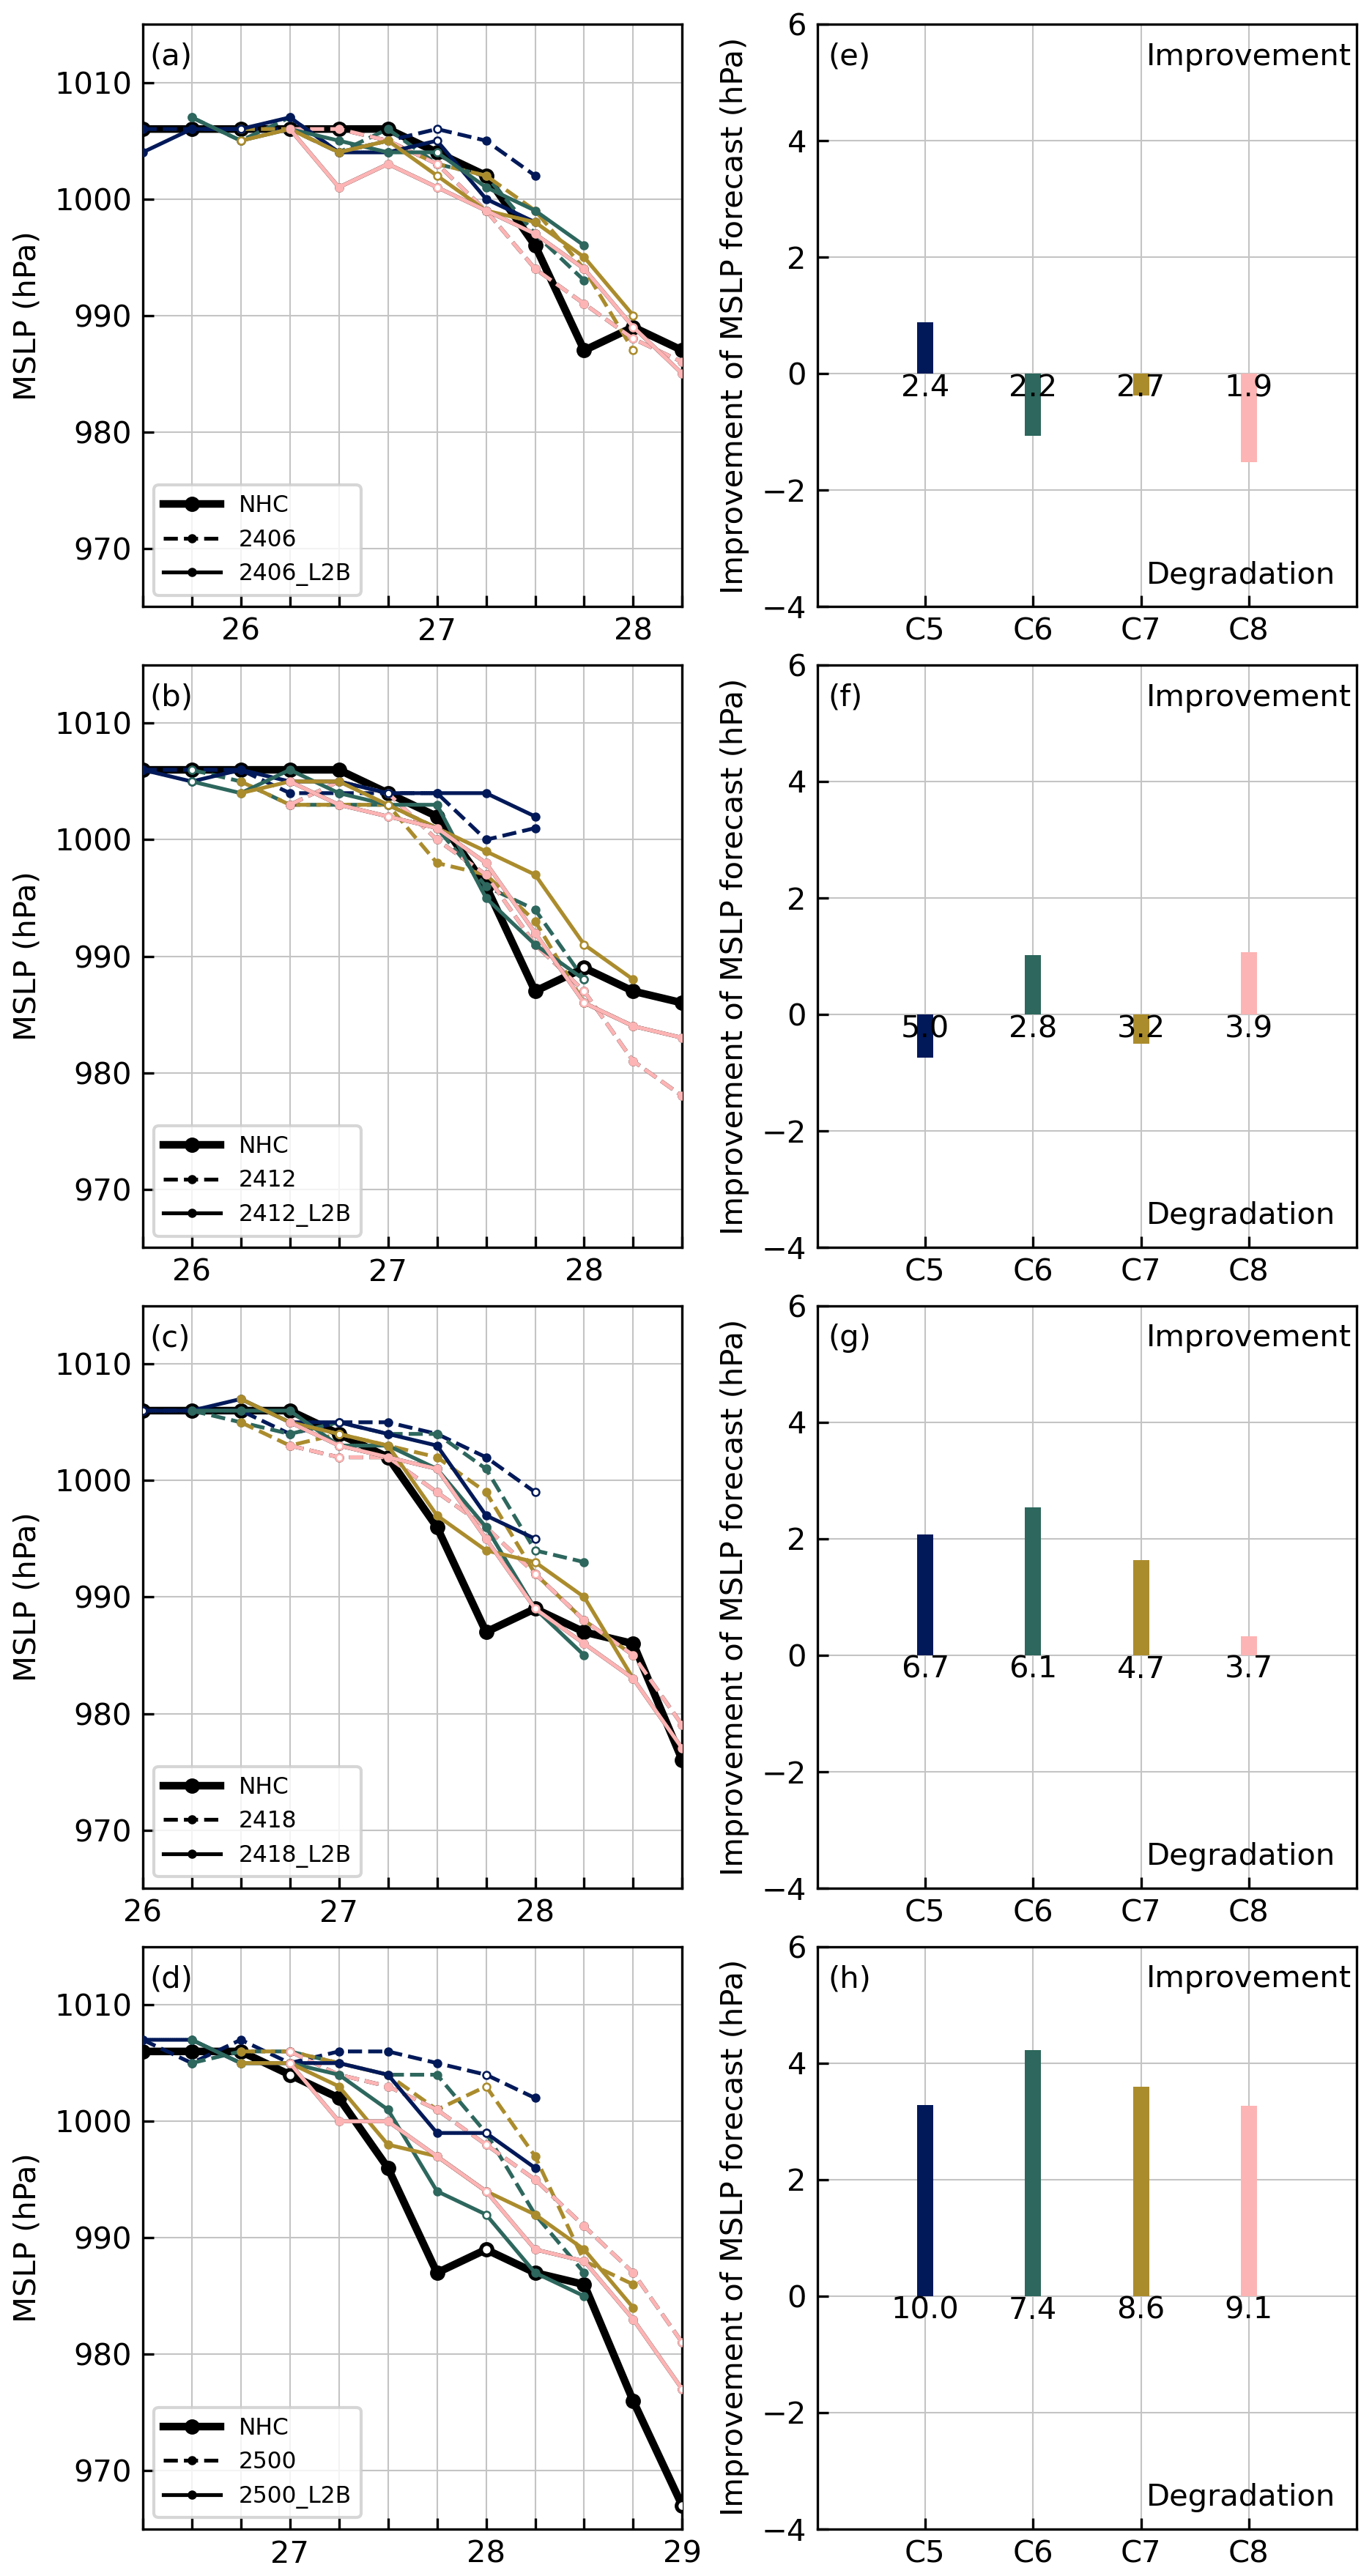
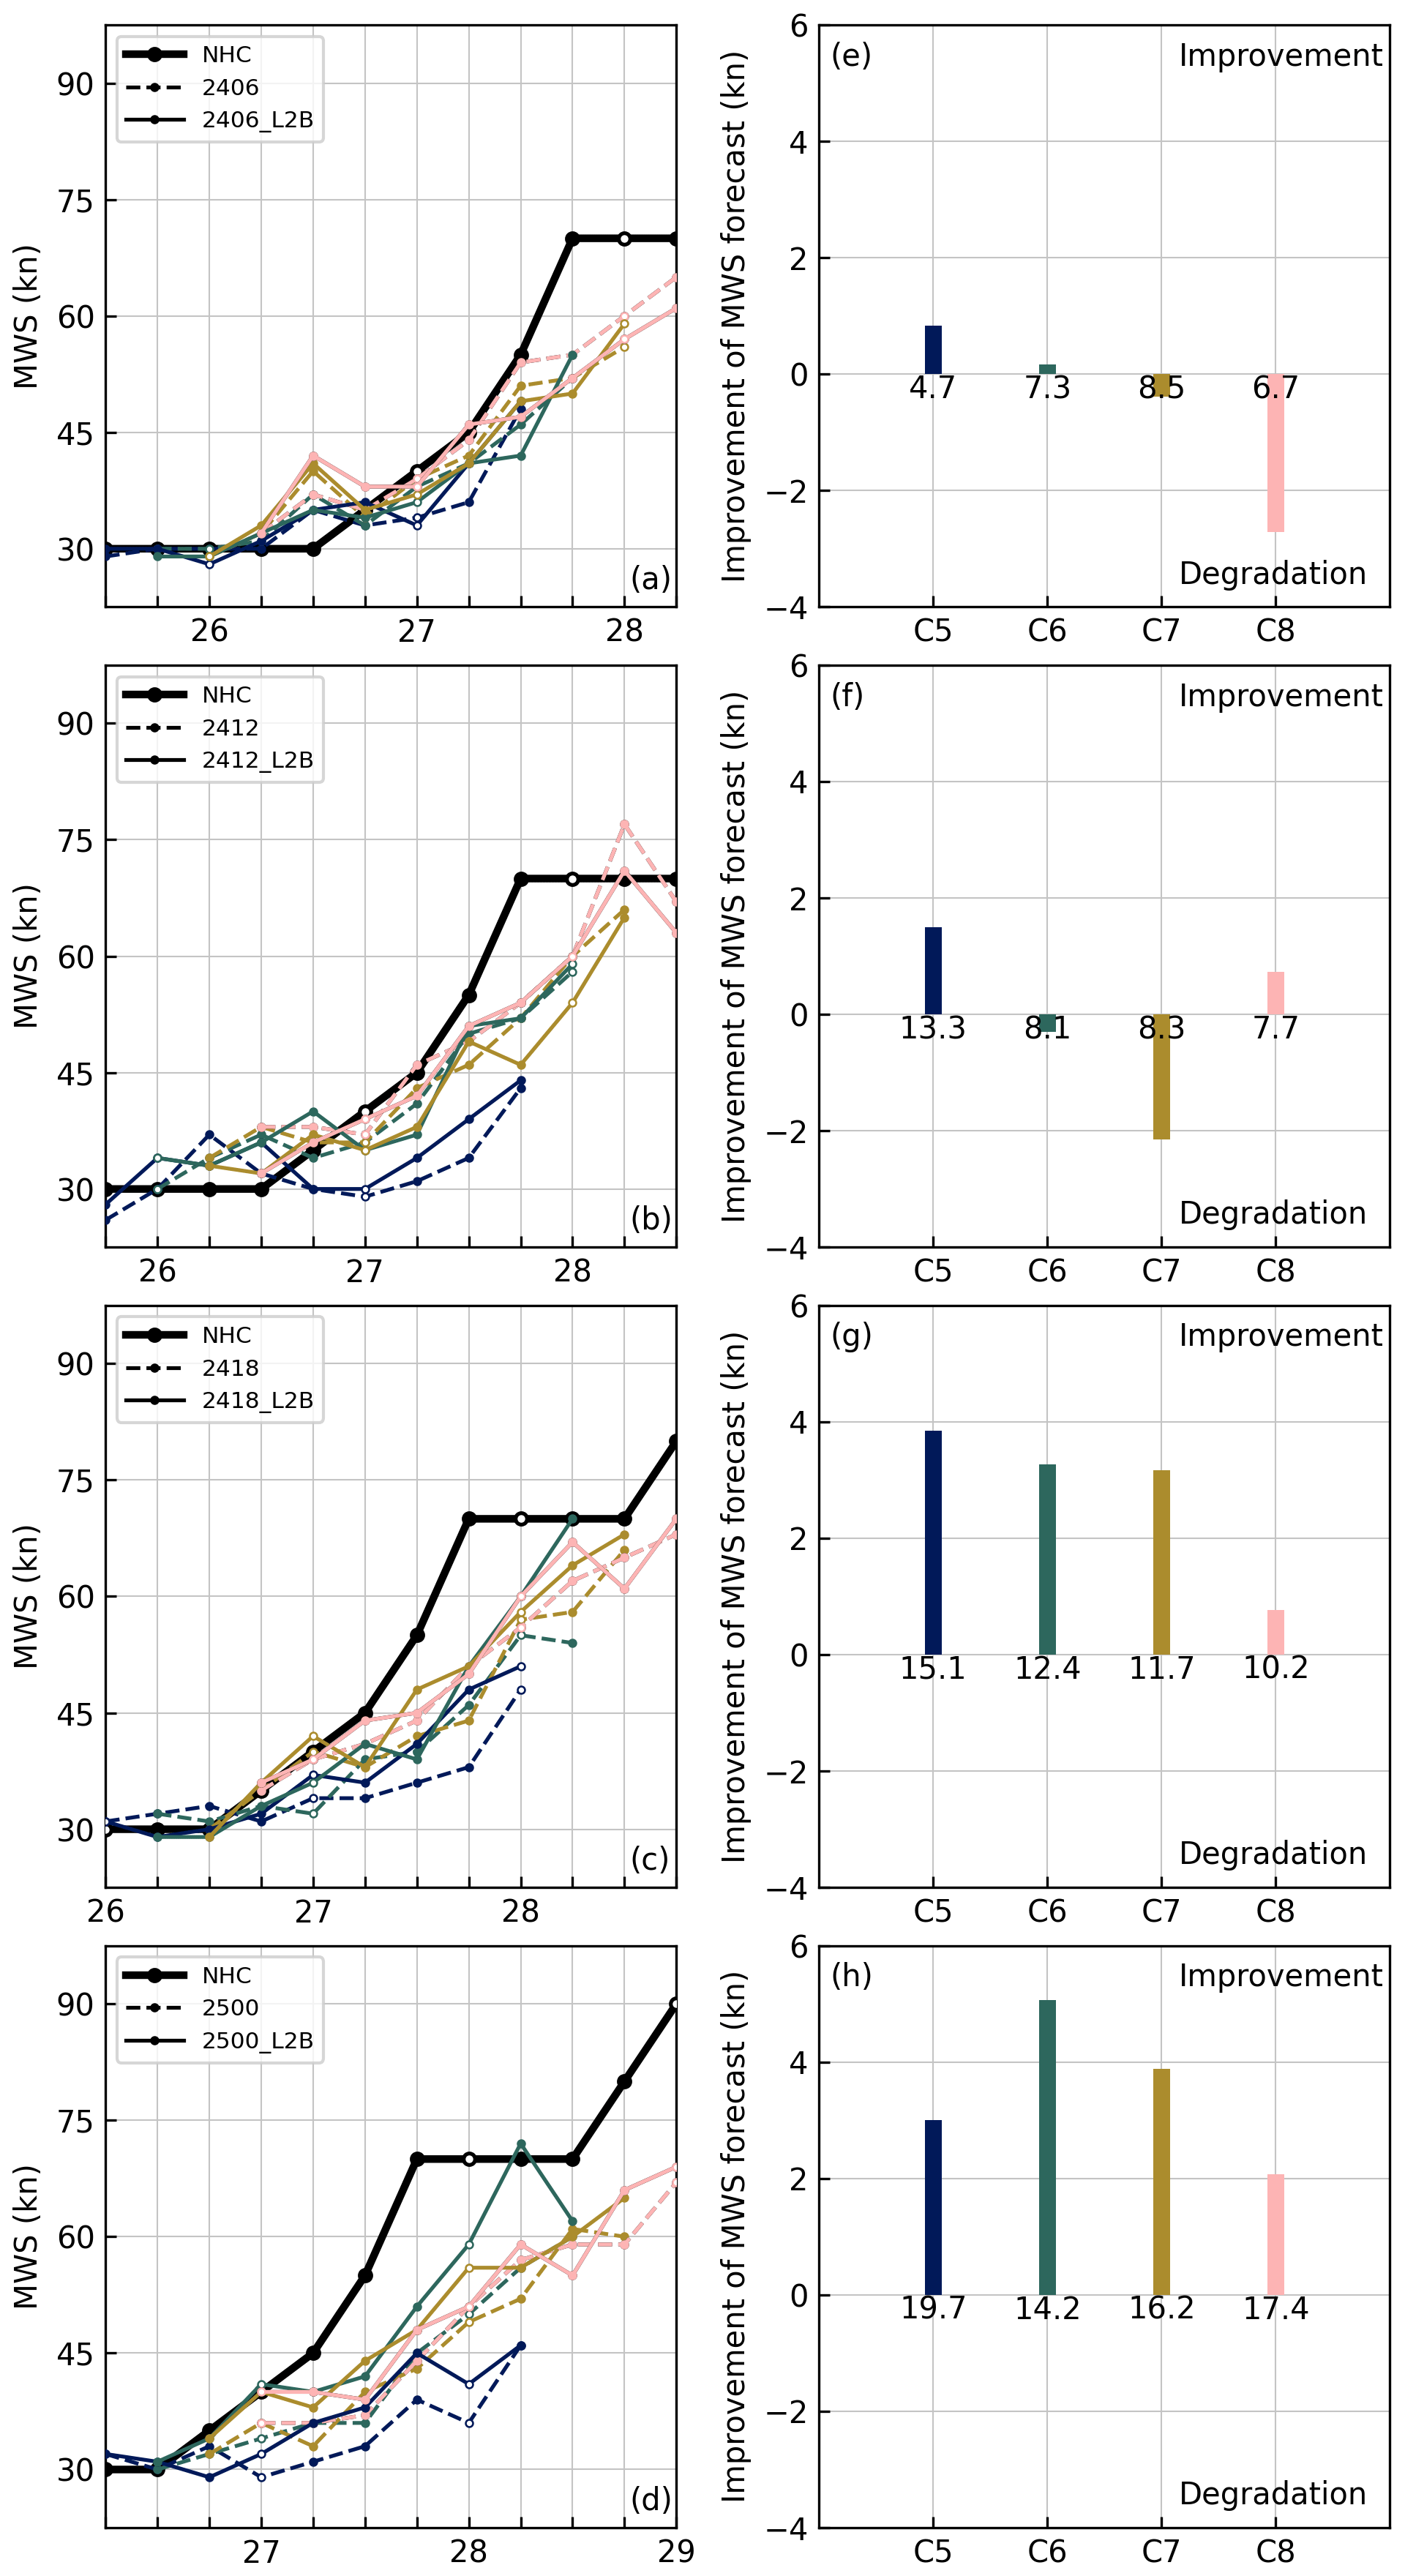
Nevertheless, Figs. 5 and 6g–h indicate the positive impacts of assimilating Aeolus HLOS winds on the MSLP and MWS forecasts, compared to experiments 2418 and 2500. The averaged improvements in the MSLP forecasts are up to 4 hPa, while those of the MWS forecasts can reach 5 kn after the assimilation of Aeolus HLOS winds. As shown by Figs. 5 and 6c–d, the 48 h MSLP and MWS forecasts of experiments 2418 and 2500 underestimate the intensity of Ida (2021) from the first to second RI period. The corresponding 48 h MSLP and MWS forecasts from experiments 2418_L2B and 2500_L2B also underestimate the intensity of Ida. However, they are stronger than the reference experiments due to deeper MSLPs and higher MWSs.
3.5 Precipitation forecasts
To evaluate the impacts of assimilating Aeolus HLOS winds on the rainfall structures of Ida (2021), we calculate ETS scores using the forecasts of 6 h accumulated precipitation against the IMERG precipitation data within a box centered on Hurricane Ida (2021). Figure 7a exhibits the improvements in the 48 h averaged ETS scores of experiment 2406_L2B (with the assimilation of Aeolus HLOS winds) for precipitation thresholds 10 and 15 mm when compared to experiment 2406 (without the assimilation of Aeolus HLOS winds). The improvements in experiment 2406_L2B are evident for 15 mm precipitation thresholds, compared with experiment 2406. Positive impacts of the assimilation of Aeolus HLOS winds on the 6 h accumulated precipitation forecasts for 10 and 15 mm precipitation thresholds can also be found in experiments 2412_L2B, 2418_L2B, and 2500_L2B (see Fig. 7b–d) when compared to their corresponding reference experiments. These results imply that assimilating Aeolus HLOS winds can improve simulations of the rainfall structure of strong convection for Ida (2021).
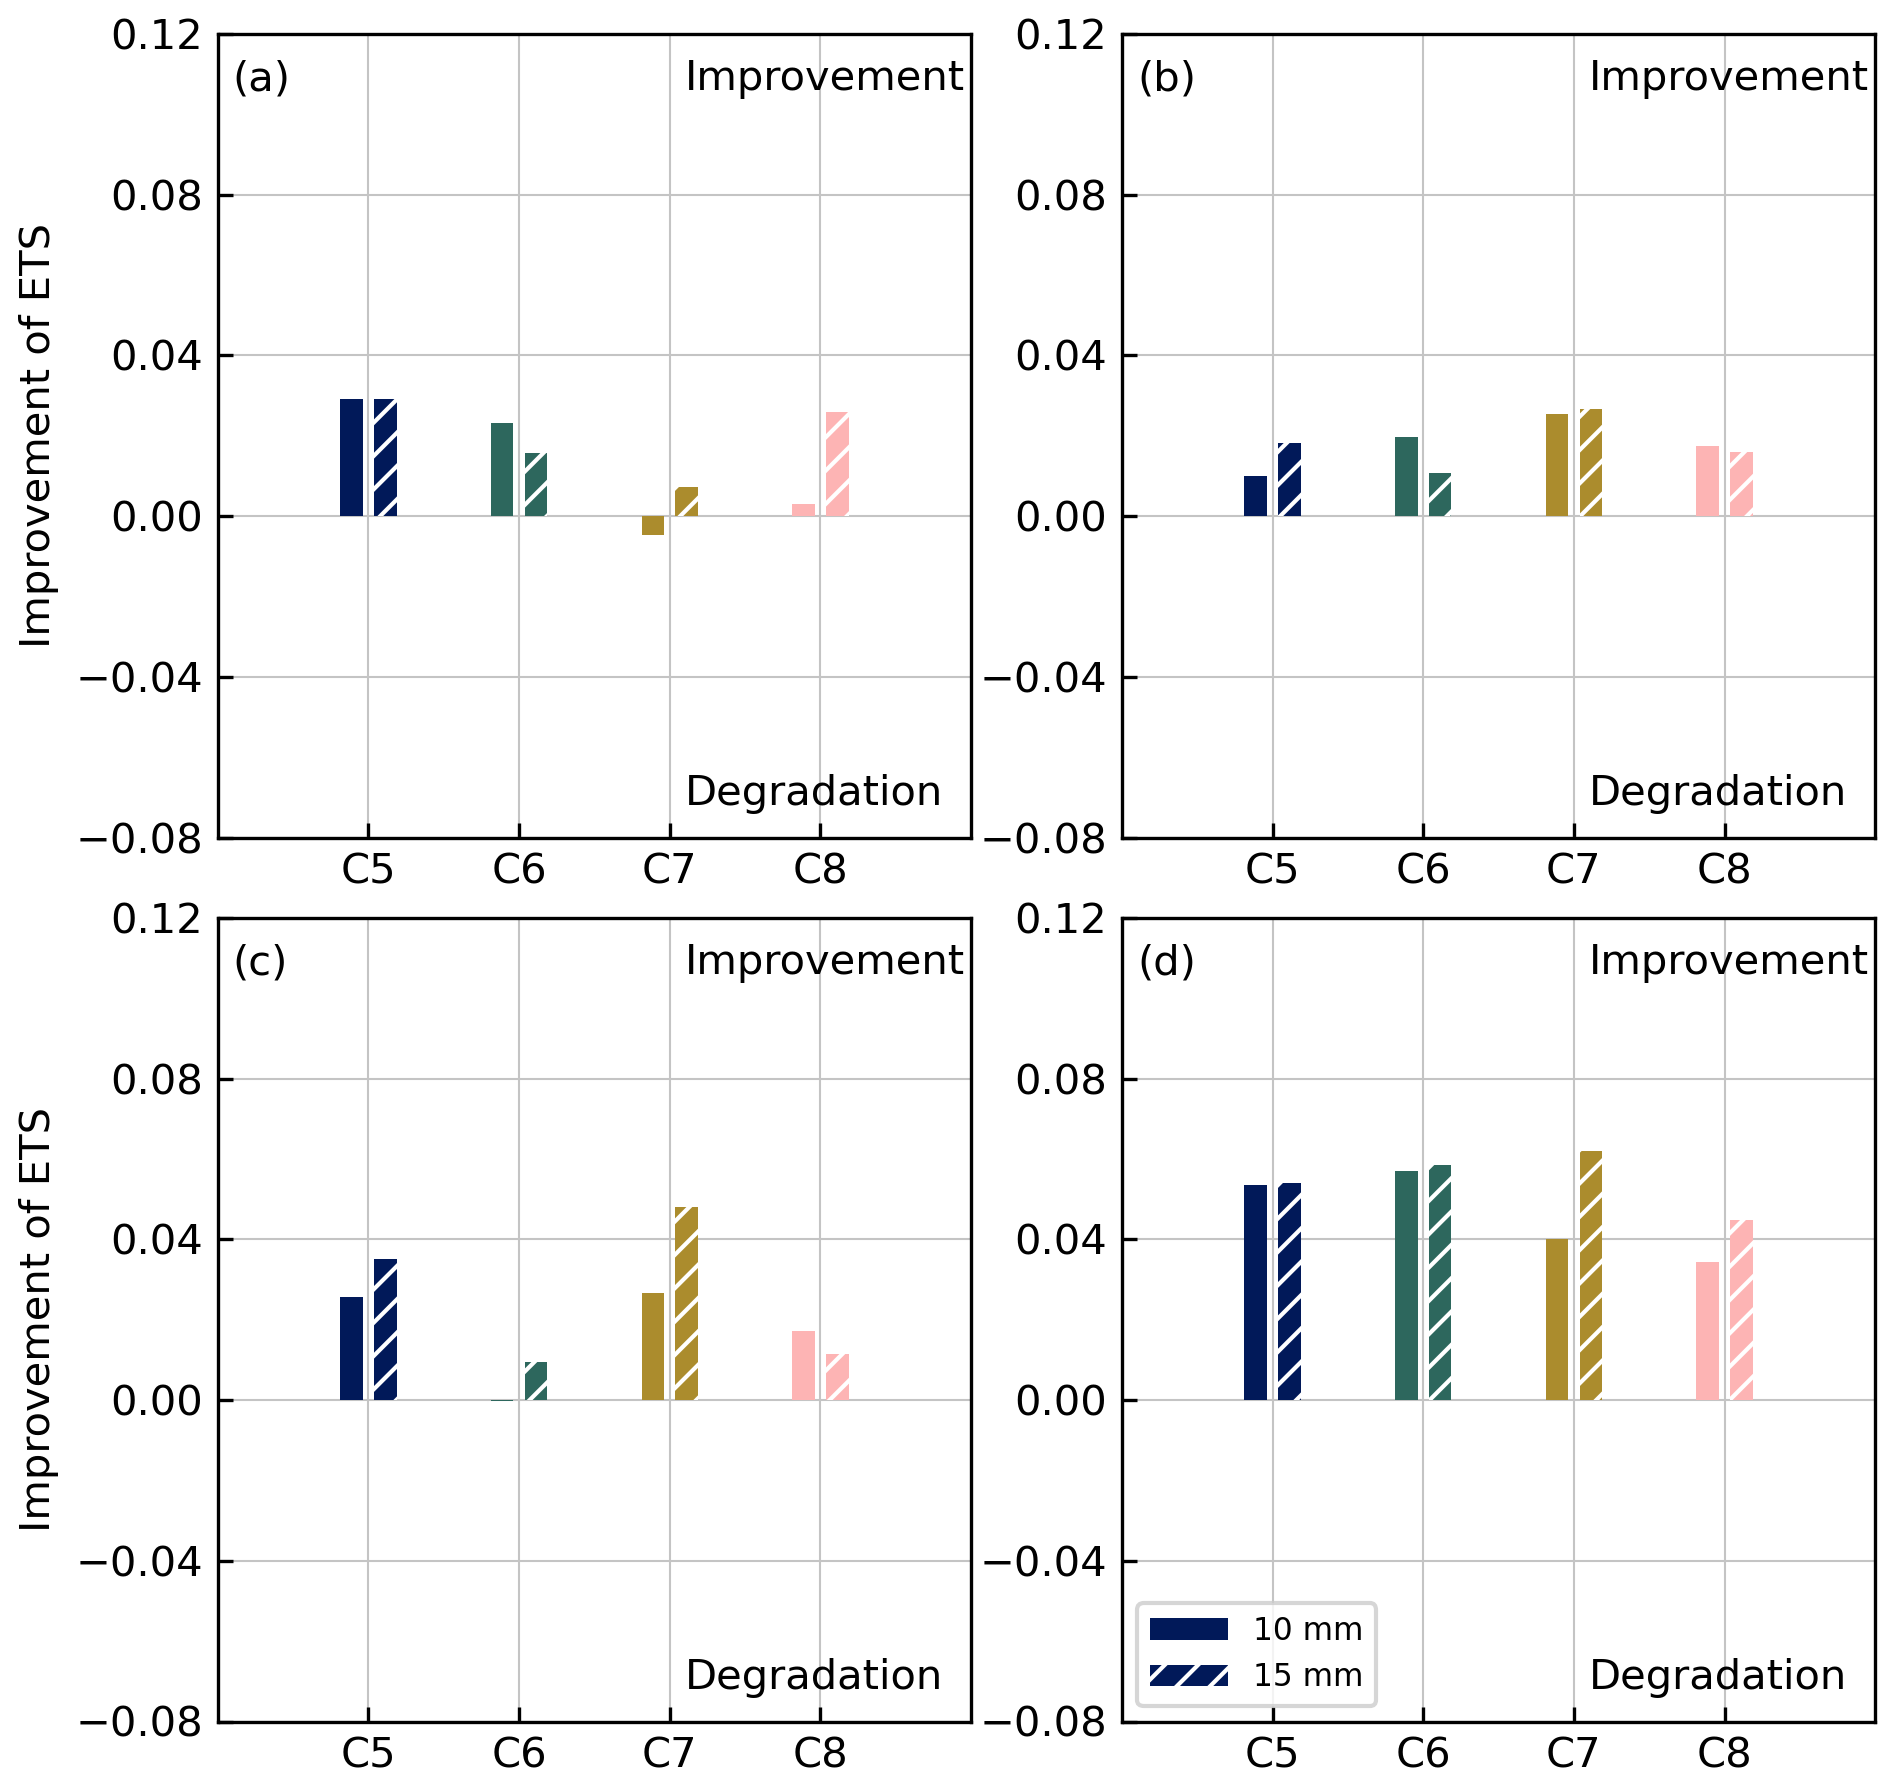
Figure 7Improvements in the 48 h averaged ETSs of forecasts initialized from the analysis DA cycles 5 (blue), 6 (green), 7 (brown), and 8 (pink) for different precipitation thresholds: 10 mm (without white lines) and 15 mm (with white lines) in experiments 2406_L2B (a), 2412_L2B (b), 2418_L2B (c), and 2500_L2B (d), compared with the corresponding experiments without the assimilation of Aeolus HLOS winds. The ETS scores are calculated using the forecasts of 6 h accumulated precipitation against the IMERG precipitation data within a box centered on Hurricane Ida (2021).
3.6 Sensitivity of Aeolus DA to horizontal and vertical localization scales
The DA results are affected by the homogeneous isotropic horizontal and vertical ensemble localization scales. In experiment 2500_L2B_H1, Ida (2021) dissipates 12 h after the initial time (results not shown), implying that the reduction in the horizontal localization scale to 55 km degrades the forecasts of Ida (2021). The reductions in the 48 h averaged track forecast errors, MSLP forecast errors, MWS forecast errors, and the improvements in ETSs for experiments 2500_L2B_H2, 2500_L2B_V1, and 2500_ L2B_V2, compared with experiment 2500_L2B, can be found in Fig. 8. Specifically, Fig. 8e–h demonstrate that reducing the vertical localization scale to 1.5 grid points also leads to the degradation of the forecasts of Ida (2021). Consequently, reducing the horizontal and vertical localization scales to half of their default values degrades the forecasts of Ida (2021) when compared with experiment 2500_L2B. Figure 8a–d and i–l show that the track forecasts are improved continuously in experiments 2500_L2B_H2 and 2500_L2B_V2 when compared with experiment 2500_L2B. However, the impacts on intensity and precipitation forecasts are small and mixed. Overall, the default horizontal localization scale (110 km) and vertical localization scale (3 grid units) are the best configurations for investigating the impacts of assimilating Aeolus HLOS winds on the analysis and forecasts of Hurricane Ida (2021); thus, they are used for other experiments in this study.
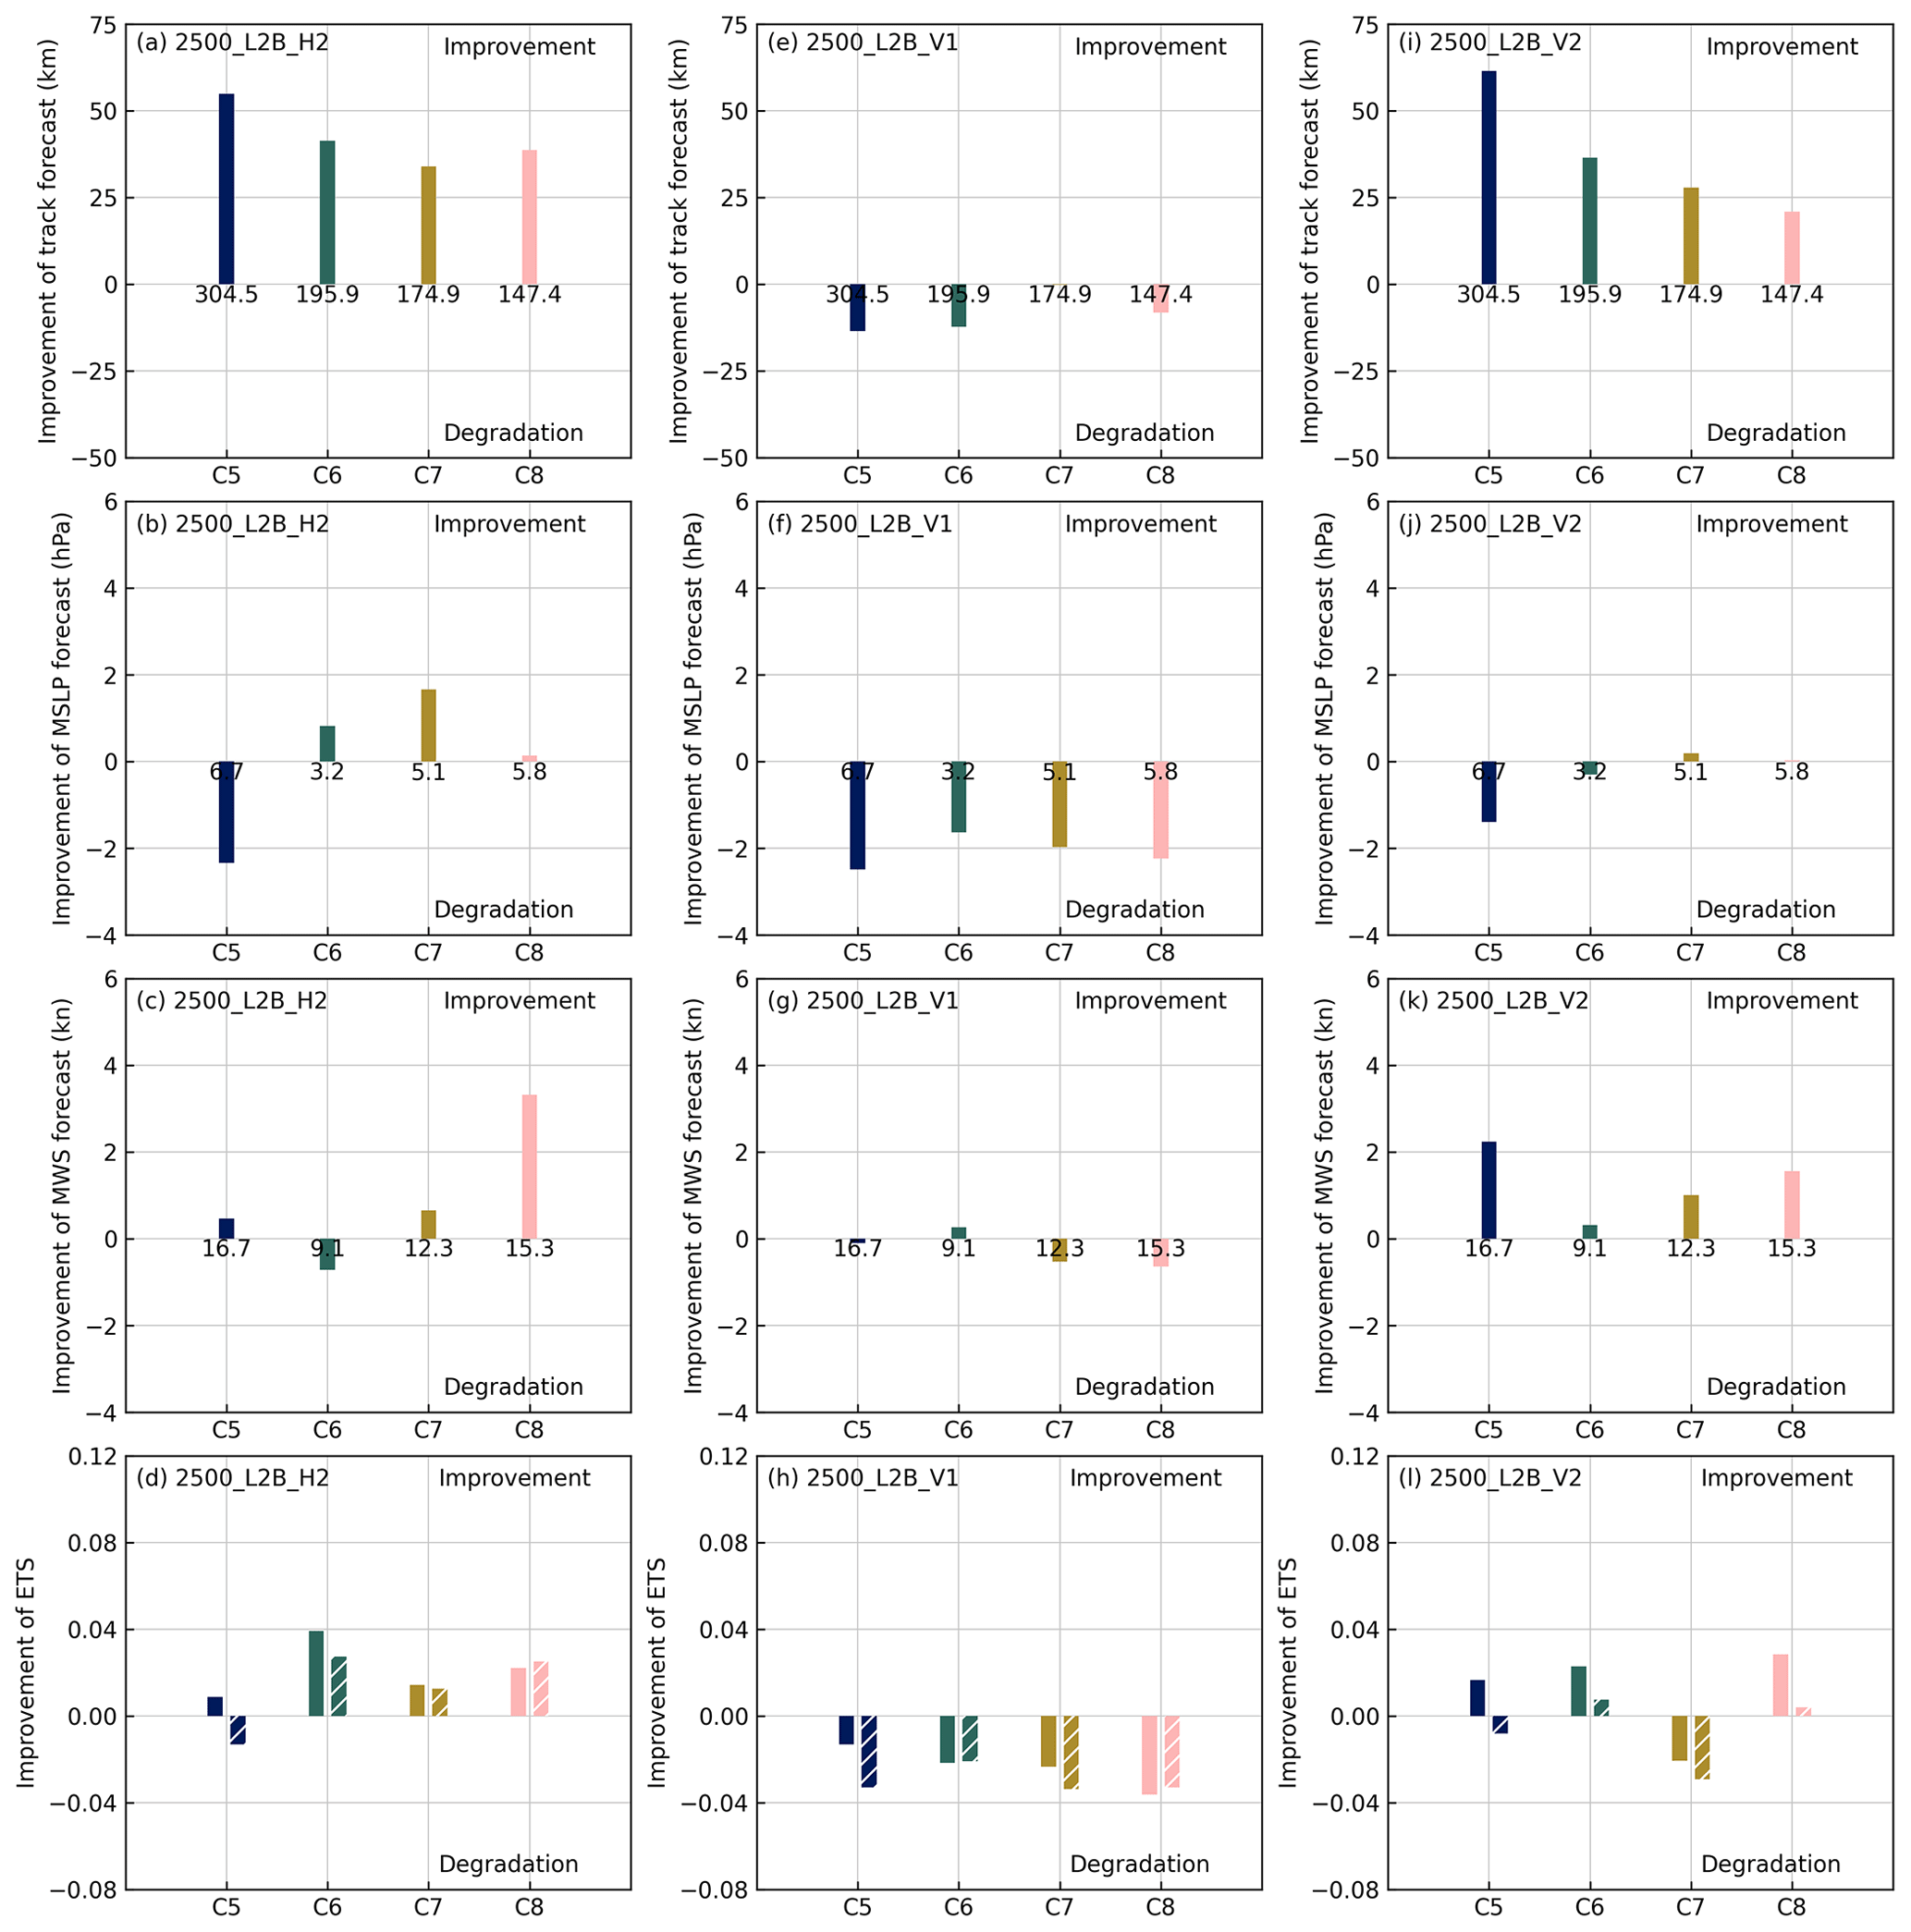
Figure 8The reductions in the 48 h averaged track forecast errors (a), MSLP forecast errors (b), and MWS forecast errors (c) and the improvements in ETSs (d) for DA cycles 5 (blue), 6 (green), 7 (brown), and 8 (pink) in experiments 2500_L2B_H2 compared with experiment 2500_L2B. Positive values of reductions in track, MSLP, and MWS forecast errors mean improvement, while negative values indicate degradation. (e–h, i–l) As in panels (a)–(d) but for experiments 2500_L2B_V1 and 2500_L2B_V2.
4.1 Analysis increments of Aeolus HLOS winds
As mentioned in Sect. 3.4, assimilating Aeolus HLOS winds leads to better intensity forecasts in experiments 2418_L2B and 2500_L2B from the first to second RI periods of Ida (2021). Thus, it is necessary to understand how the assimilation of Aeolus HLOS winds influences Ida's dynamic and thermodynamic structure and improves the intensity forecasts in experiments 2418_L2B and 2500_L2B. Commonly, improvements in a hurricane's inner core structure lead to positive impacts on hurricane intensity forecasts. Therefore, we choose experiments that assimilate Aeolus measurement swaths close to the center of Ida (2021) to examine their analysis increments over the hurricane's inner core region. As demonstrated by Fig. 1a, the Aeolus descending measurement swath on 25 August 2021, 12:00 UTC, and another on 26 August 2021, 12:00 UTC, are close to the center of Ida (2021) during the cycling DA period of experiments 2418_L2B and 2500_L2B and are suitable for investigating the analysis increments of Aeolus HLOS winds. Figure 9a and e show vertical cross sections of the analysis increments of Mie-cloudy winds and Rayleigh-clear winds for the selected Aeolus measurement swath on 25 August 2021, 12:00 UTC, in experiment 2418_L2B. Since the HLOS winds of the Mie channel are derived by the Doppler-shifted backscattered light from the Fizeau interferometer, which detects aerosols and small hydrometeors (Andersson et al., 2008; Reitebuch et al., 2009; Ingmann and Straume, 2016), the analysis increments of Mie-cloudy winds are located primarily near the cloud top (between 10 and 16 km), as revealed by Fig. 9a. The analysis increments of Mie-cloudy winds are mostly positive near the center of Ida (2021). Figure 9b shows that the Rayleigh-clear winds, whose range bin thickness is 750 m between 12 and 15 km, are measured from the surface up to over 20 km in the tropical region (0–30∘ N). In comparison, the maximum measurement height in the extratropical region (30–60∘ N) is approximately 17.5 km, and the vertical resolution between 5 and 10 km (500 m) is higher due to the detection of the jet stream (ESA, 2020). However, ALADIN is totally attenuated by optically thick clouds or aerosols, so there are no Rayleigh-clear winds under the cloud top near the center of Ida (2021). The resolution of the Mie-cloudy winds is much finer than that of the Rayleigh-clear winds, but the Rayleigh-clear winds have more extensive coverage. The analysis increments of Rayleigh-clear winds are roughly consistent with those of Mie-cloudy winds where they overlap. Figure 9b–d and f–h are similar to Fig. 9a and e, respectively, but for different experiments or times.
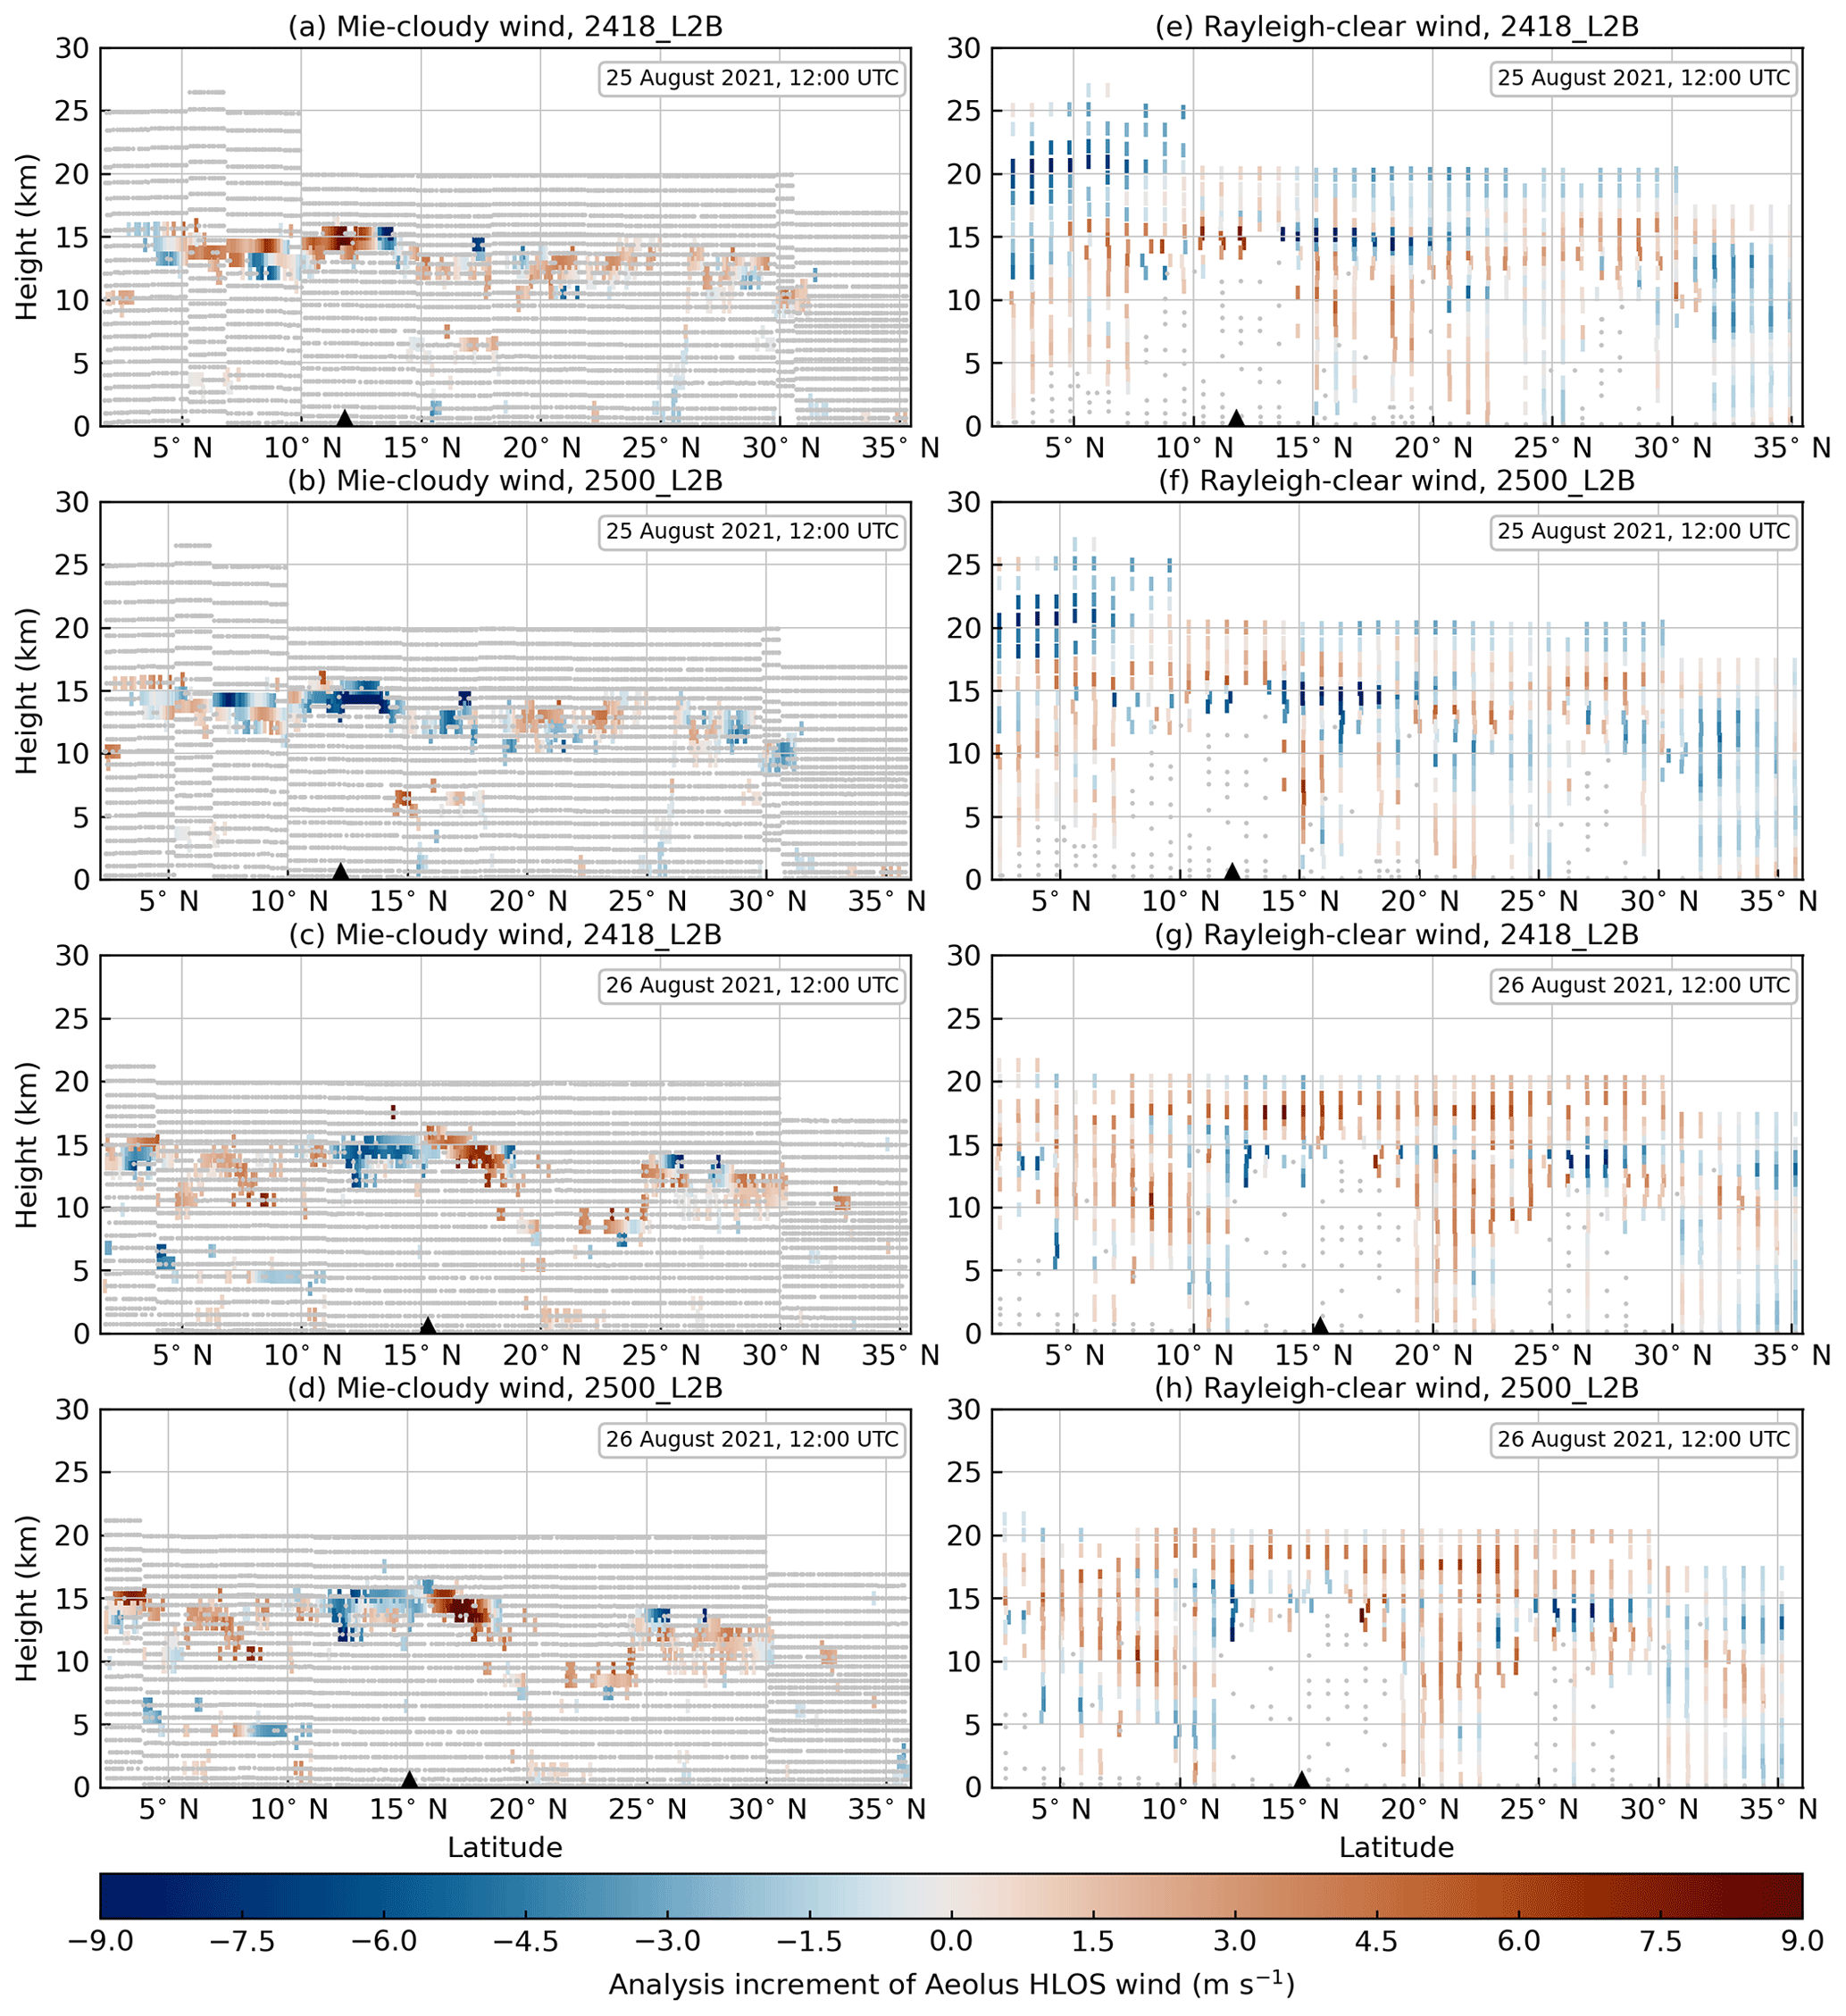
Figure 9Vertical cross sections of analysis increments of Mie-cloudy winds for the Aeolus descending measurement swath close to the center of Ida (2021) in experiments 2418_L2B (a) and 2500_L2B (b) on 25 August 2021, 12:00 UTC. The triangles indicate the locations of Ida (2021) in the simulations on 25 August 2021, 12:00 UTC. (c–d) As in panels (a)–(b) but for 26 August 2021, 12:00 UTC. (e–h) As in panels (a)–(d) but for Rayleigh-clear winds.
4.2 Vertical cross sections of analysis increments of zonal winds and RH
The Aeolus HLOS winds are perpendicular to the Aeolus orbit, about 10∘ off the zonal direction (Krisch et al., 2022). Thus, assimilating Aeolus HLOS winds generally impacts the zonal wind component more than the meridional wind component. Figure 10c compares vertical cross sections of zonal wind increments along the selected Aeolus descending measurement swath on 25 August 2021, 12:00 UTC, between experiments 2418 and 2418_L2B. The significant impacts of assimilating Aeolus HLOS winds on the analysis increments of zonal winds are located in the upper troposphere (near the cloud top), especially near the center of Ida (2021), which is consistent with Marinescu et al. (2022) and Garrett et al. (2022). As shown by Fig. 10c, the difference in the analysis increments of the zonal winds is negative at the cloud tops near the center of Ida (2021) due to the positive analysis increments of Mie-cloudy and Rayleigh-clear winds (descending orbit; see Fig. 9a and e). Figure 10f is similar to Fig. 10c but for experiments initialized on 25 August 2021, 00:00 UTC. Figure 10f demonstrates that the difference in the zonal wind increments is primarily positive at the cloud tops near the center of Ida (2021), owing to the negative analysis increments of Mie-cloudy and Rayleigh-clear winds (see Fig. 9b and f). Figure 11 examines vertical cross sections of analysis increments of RH along the selected Aeolus descending measurement swath on 25 August 2021, 12:00 UTC, for experiments initialized on 24 August 2021, 18:00 UTC, and 25 August 2021, 00:00 UTC. As with the zonal wind increments, the impacts of assimilating Aeolus HLOS winds on RH increments are also located primarily in the upper troposphere (between 10 and 15 km).
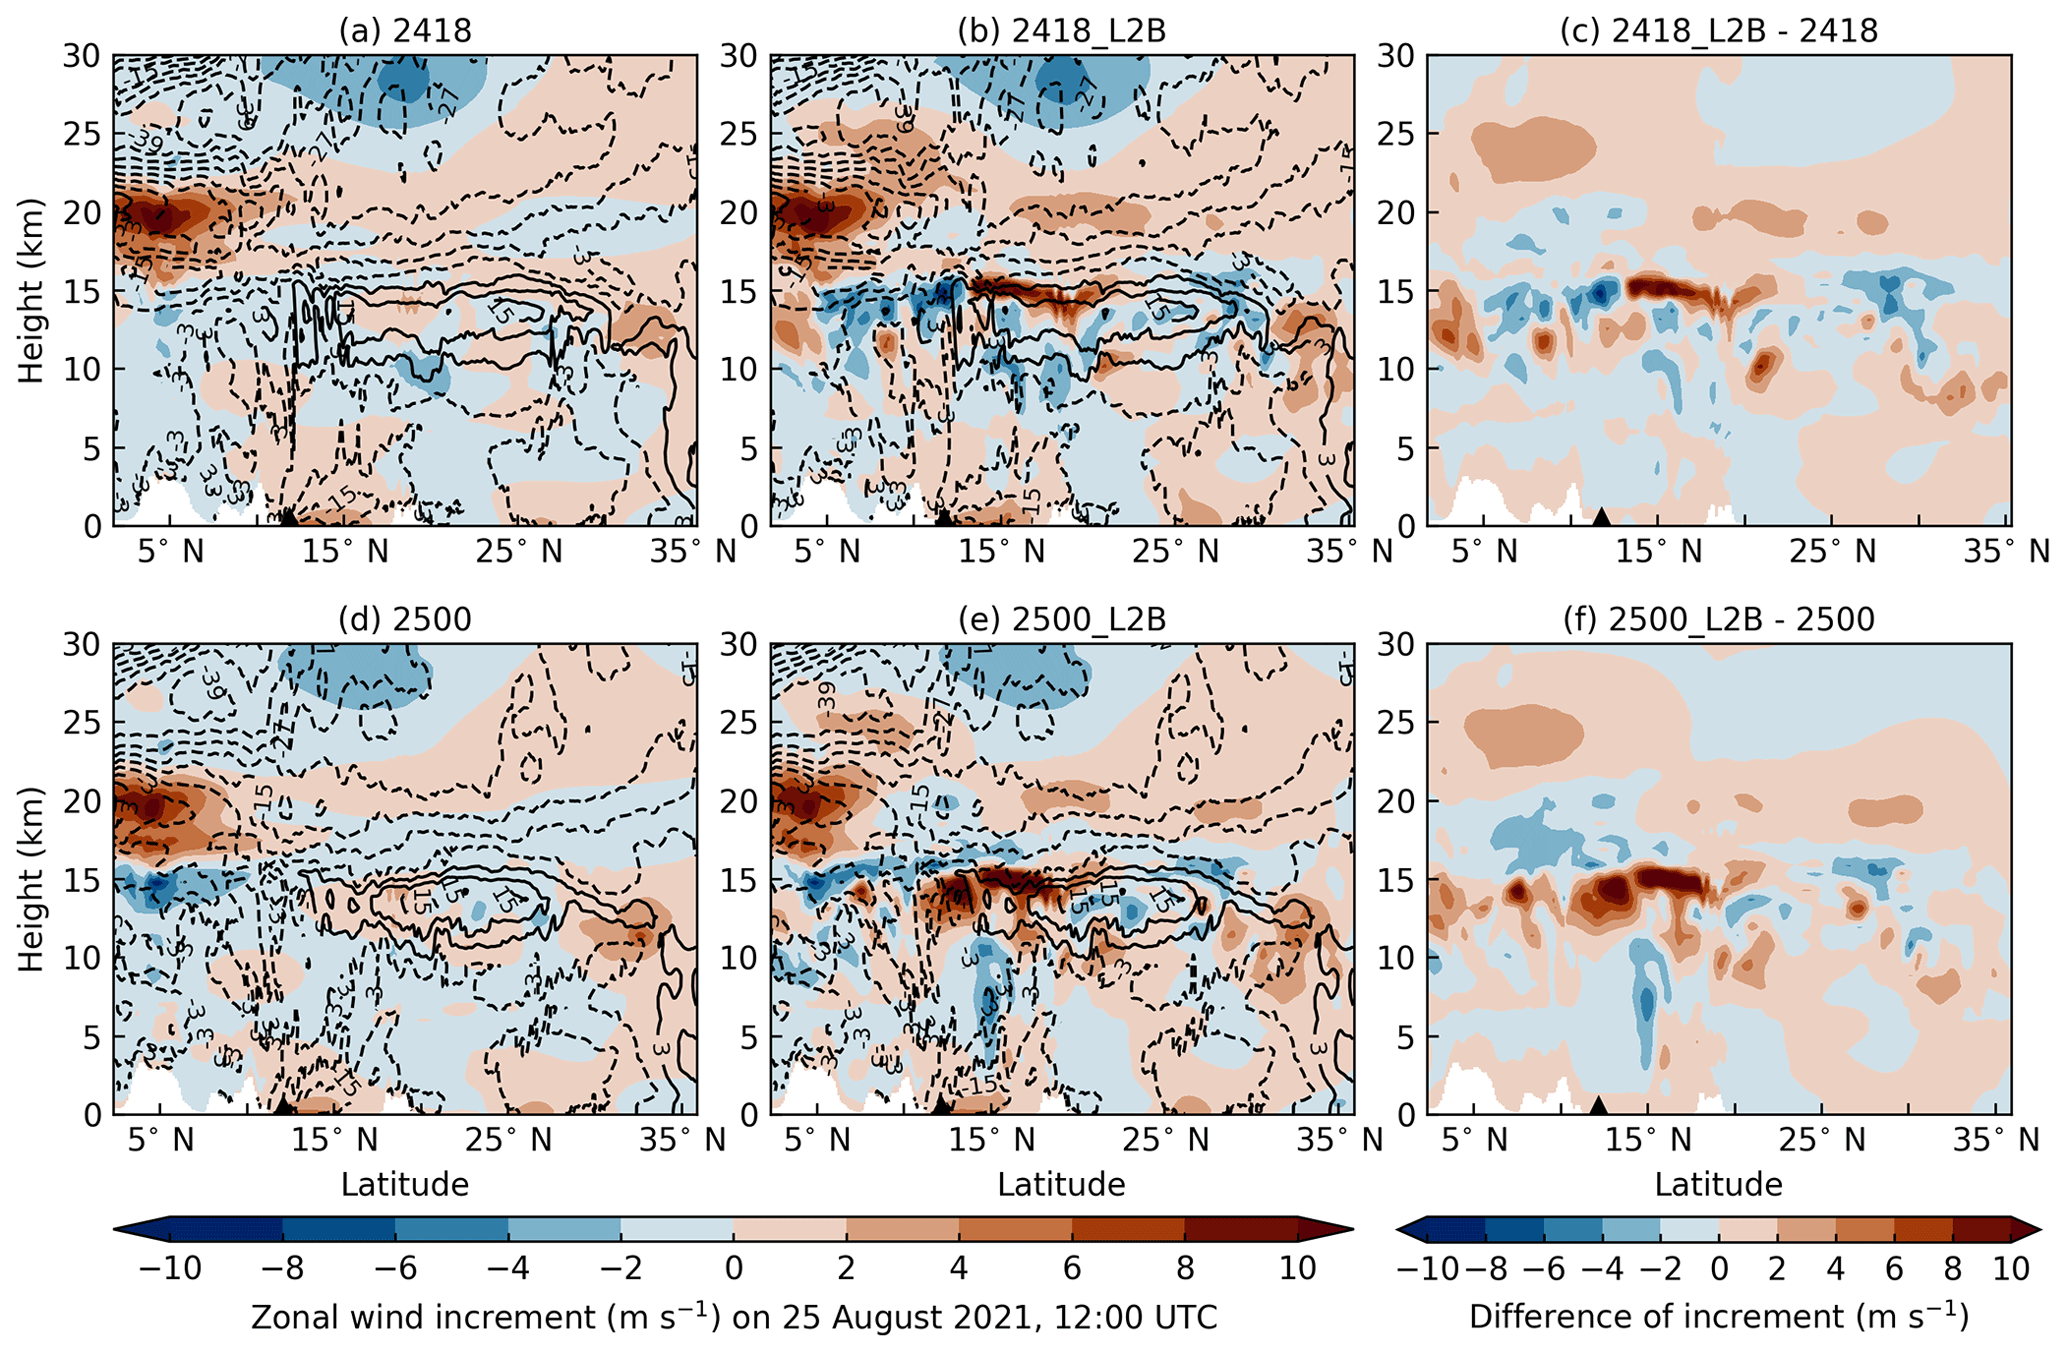
Figure 10Vertical cross section of zonal wind increments along the Aeolus descending measurement swath close to the center of Ida (2021) on 25 August 2021, 12:00 UTC, in experiments 2418 (a) and 2418_L2B (b). (c) The differences in the zonal wind increments between experiments 2418_L2B and 2418. The triangles indicate the locations of Ida (2021) in the simulations. (d–f) As in panels (a)–(c) but for experiments initialized on 25 August 2021, 00:00 UTC.
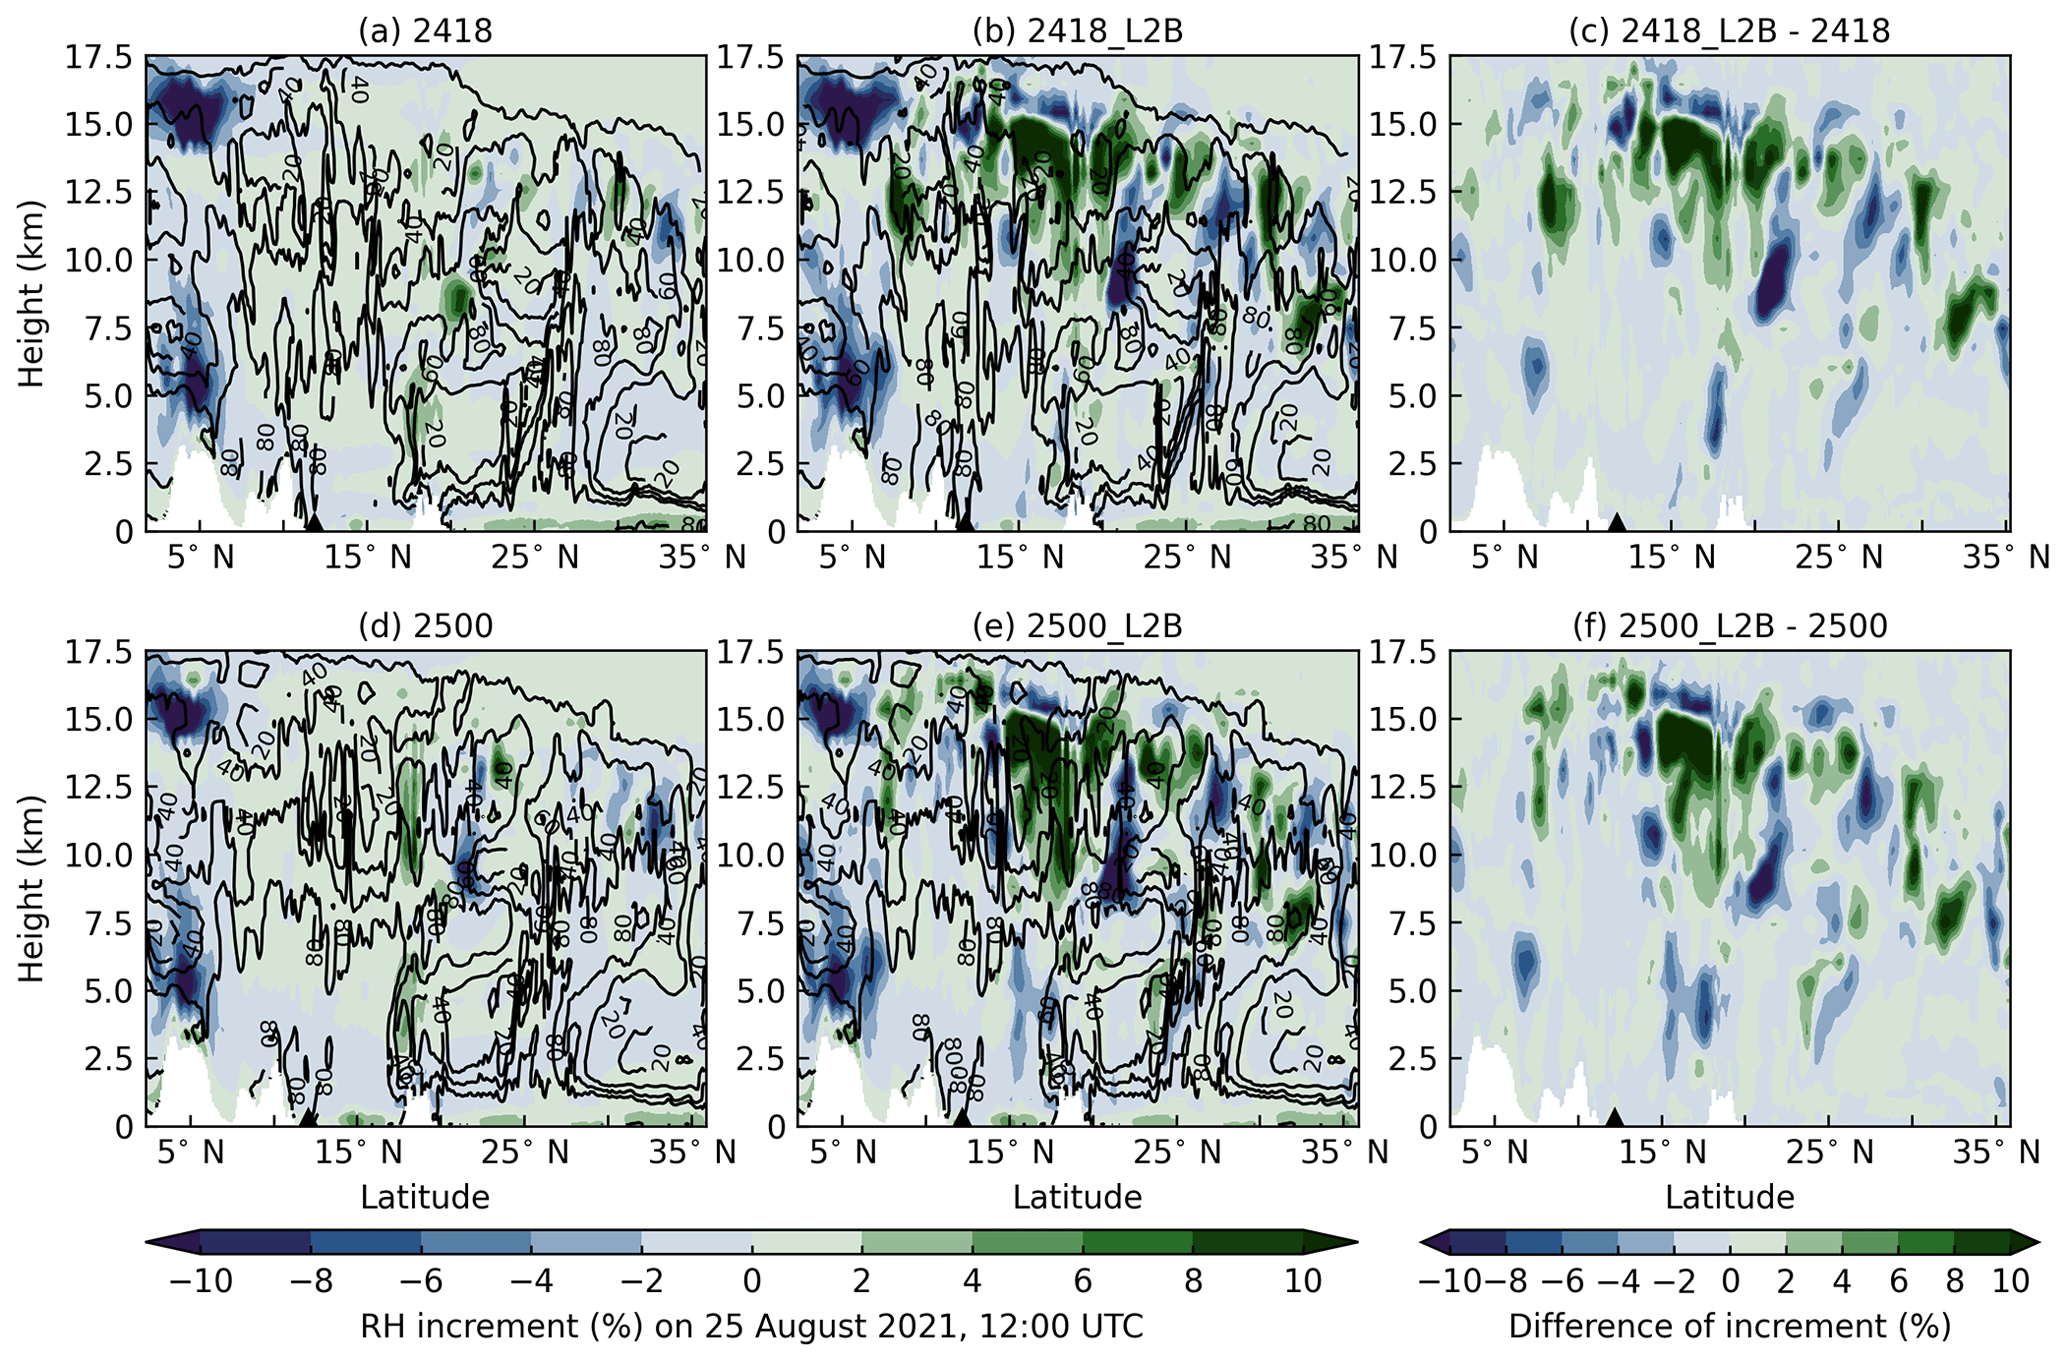
Figure 11As in Fig. 10 but for RH.
4.3 Vertical profiles of averaged analysis increments of divergence and RH
To further investigate the impacts of assimilating Aeolus HLOS winds on the dynamic and thermodynamic structure of Hurricane Ida (2021), we calculate the averaged analysis increments of divergence and RH within a 300 km radius of the center of Ida (2021). Figure 12a shows that after the assimilation of Aeolus HLOS winds on 25 August 2021, 12:00 UTC, the averaged analysis increments of divergence slightly increase in the upper level of the troposphere (near 200 hPa), which may help the intensification processes of Ida (2021). However, the difference in the analysis increments of divergence is tiny in the middle and lower troposphere between experiments 2418 and 2418_L2B because the major impacts of the assimilation of Aeolus HLOS winds are located at the cloud top near the center of Ida, as mentioned in Sect. 4.1 and 4.2. On 26 August 2021, 12:00 UTC, the analysis increments of divergence decrease in the lower and middle troposphere (below 400 hPa), which may be caused by the assimilation of NCEP GDAS data and different center locations of Ida (2021) in experiments 2418 and 2418_L2B. Figure 12b demonstrates that the averaged analysis increments of divergence near 200 hPa become stronger on 25 August 2021, 12:00 UTC, and the averaged analysis increments of convergence in the upper troposphere become weaker on 26 August 2021, 12:00 UTC, after the assimilation of Aeolus HLOS winds. Figure 12c–d show that the assimilation of Aeolus HLOS winds has only tiny impacts on the moisture structure of Ida (2021). In short, the assimilation of Aeolus HLOS winds leads to stronger divergence in the upper level of the troposphere, which could be one reason for the improved intensity forecasts of experiments 2418_L2B and 2500_L2B.
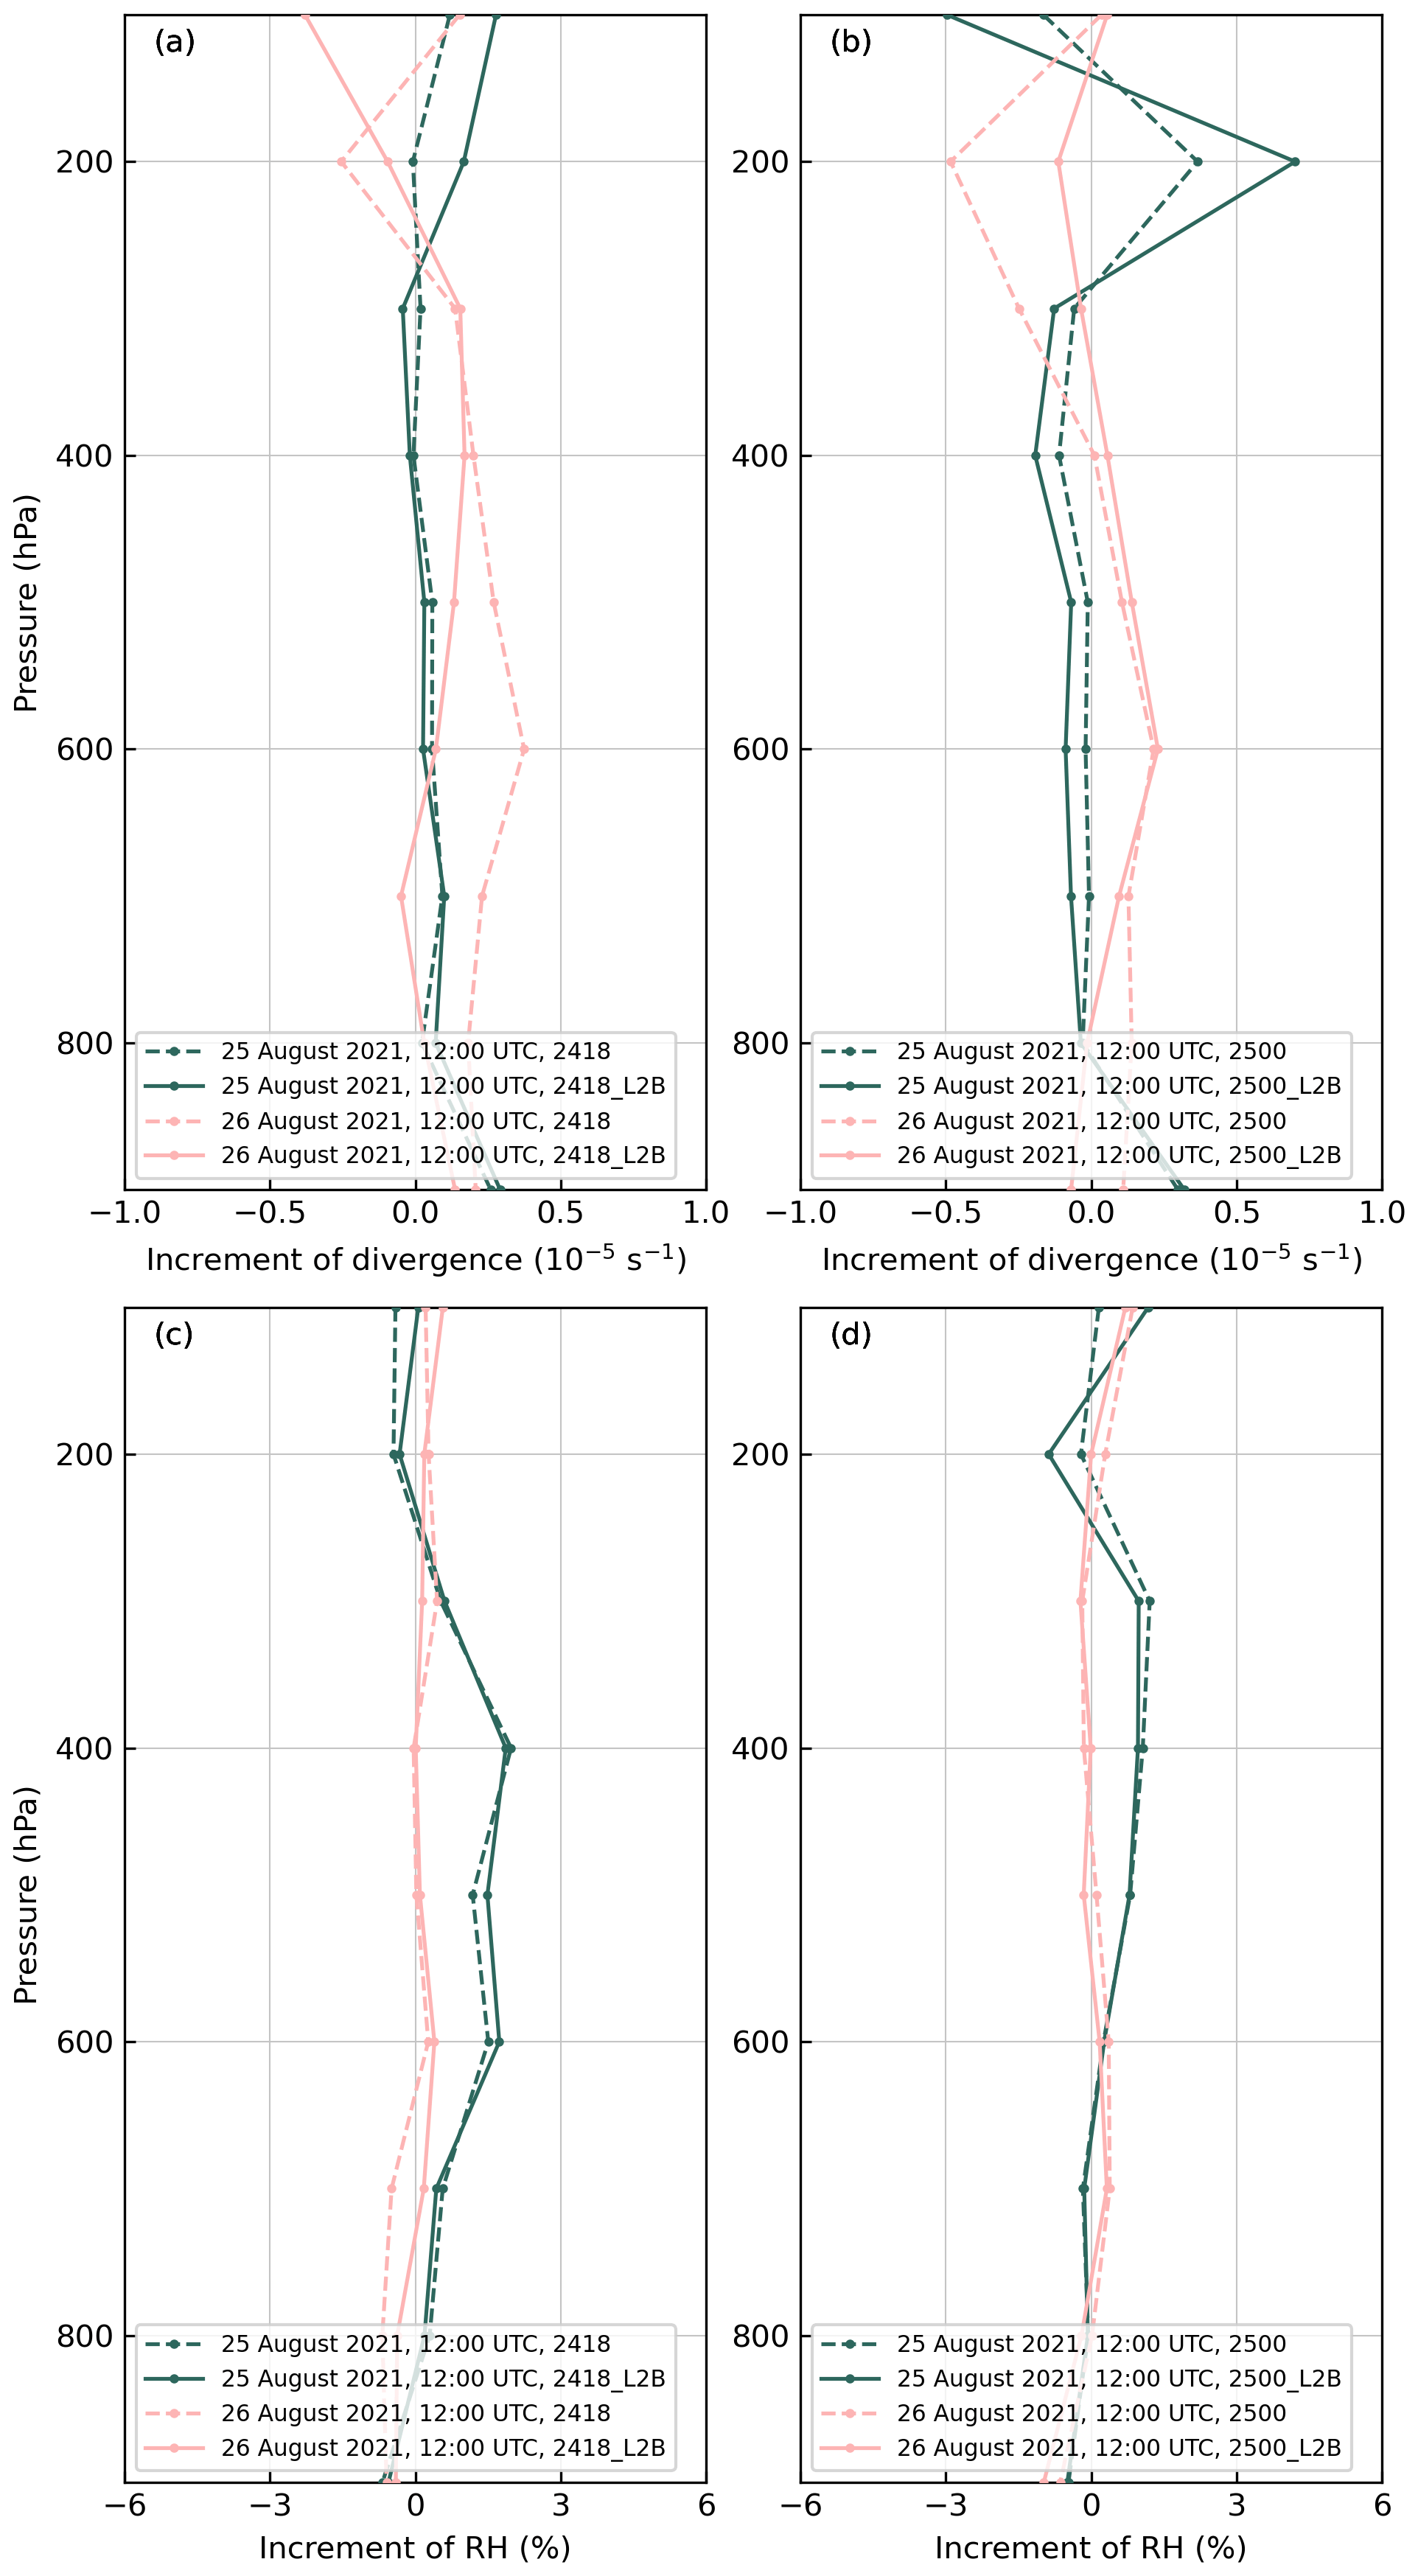
Figure 12Vertical profiles of averaged analysis increments of divergence (a) of experiments 2418 (dashed line) and 2418_L2B (solid line) on 25 August 2021, 12:00 UTC (green), and 26 August 2021, 12:00 UTC (pink). The analysis increments of divergence are averaged within a 300 km radius of the center of Ida (2021). (b) As in panel (a) but for experiments 2500 and 2500_L2B. (c–d) As in panels (a)–(b) but for averaged analysis increments of RH.
5.1 Case description and experiment design
As indicated by the GOES-16 channel eight (see Fig. 1b), there was a strong subtropical high over the AO on 21 August 2021, 00:00 UTC. TS Henri, moving northeastward, was west of the subtropical high, and MCSs could be found on the north coast of South America. As shown by the track of GFS-analyzed relative vorticity maxima at 700 hPa, an AEW, propagating westward on the south edge of the subtropical high, moved into the Caribbean Sea around 19 August 2021, 12:00 UTC. Steered by the subtropical ridge, the AEW, with scattered convection embedded inside, continued to move westward to northwestward and reached the western Caribbean Sea around 22 August 2021, 00:00 UTC. Experiments 1918 and 1918_L2B are carried out to assess the impacts of the assimilation of Aeolus HLOS winds on the analysis and forecasts of the MCS associated with the AEW. Experiment 1918 is initialized by the NCEP GFS FNL on 19 August 2021, 18:00 UTC, and assimilates only the NCEP GDAS data with three-dimensional variational DA (3DVAR) during the cycling DA period from 20 August 2021, 00:00 UTC, to 21 August 2021, 00:00 UTC (five DA cycles in total). The subsequent forecast is initialized from the analysis of DA cycle 5. Experiment 1918_L2B is similar to experiment 1918 but also assimilates Aeolus HLOS winds.
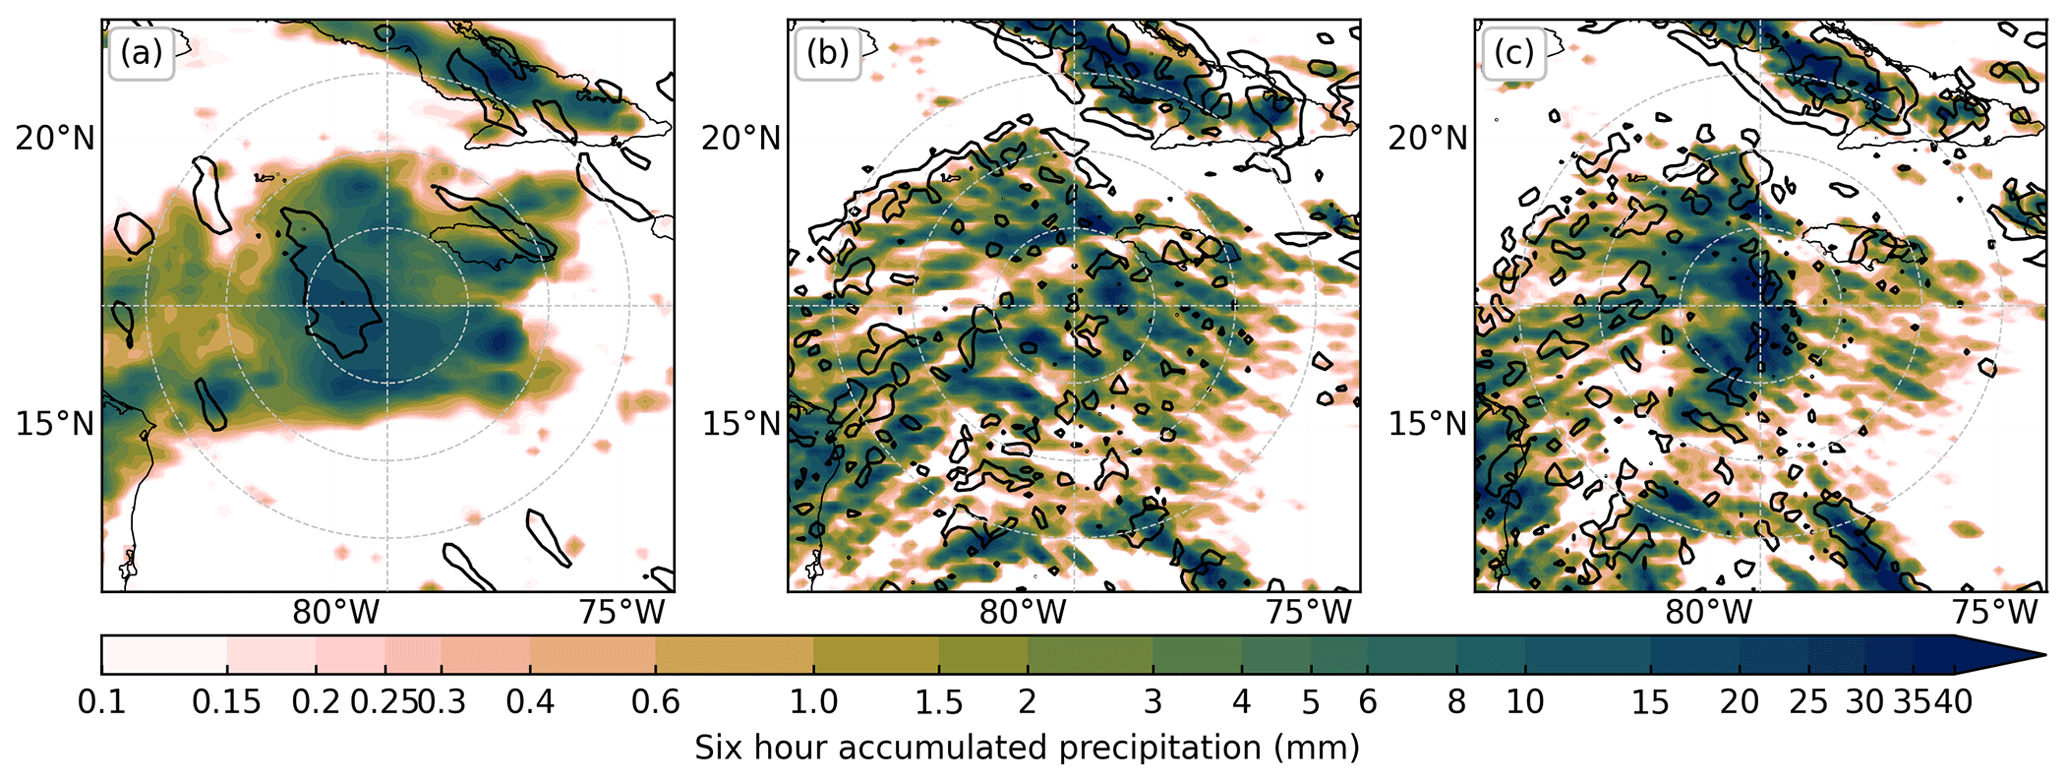
Figure 13(a) Divergence over s−1 at 850 hPa (black contour) from the GFS analysis on 22 August 2021, 00:00 UTC, and 6 h accumulated IMERG precipitation (color shading) from 21 August 2021, 18:00 UTC, to 22 August 2021, 00:00 UTC. (b–c) As in panel (a), but the divergence and precipitation are calculated by the WRF model simulations of experiment 1918 (b) and experiment 1918_L2B (c). The gray circles indicate 150, 300, and 450 km radii, respectively.
5.2 Results
Figure 13 shows the 6 h accumulated precipitation from 21 August 2021, 18:00 UTC, to 22 August 2021, 00:00 UTC, and the divergence over s−1 at 850 hPa on 22 August 2021, 00:00 UTC. As shown by Fig. 13a, a large area of 6 h accumulated rainfall over 10 mm from the IMERG precipitation dataset is located within a 150 km radius and west of the center of the AEW. Due to the downdraft created by the heavy rainfall, divergence over s−1 from the GFS analysis can also be found west of the center of the AEW on 22 August 2021, 00:00 UTC. Figure 13b shows only scattered convection and rainfall-induced low-level divergence near the center of the AEW in experiment 1918. As for experiment 1918_L2B (see Fig. 13c), a large area of 6 h accumulated rainfall over 10 mm and rainfall-induced low-level divergence are located at the center of the AEW within a 150 km radius. The structure is more consistent with the IMERG precipitation and the low-level divergence from the GFS analysis, implying a positive impact on numerical simulations of the MCS by assimilating Aeolus HLOS winds.
Measurement of three-dimensional wind profiles in the GOS is essential for improving the ICs of global NWPs, but it is insufficient over the oceans and remote land areas (WMO, 2017; Baker et al., 2014; Pu et al., 2017; Zhang and Pu, 2010; Pu et al., 2010; Rennie et al., 2021b). To fill the gap, the Aeolus satellite was launched by the ESA on 22 August 2018 and became the first spaceborne wind lidar (Reitebuch et al., 2020; ESA, 2022). Four types of Aeolus HLOS winds are available: Mie-clear, Mie-cloudy, Rayleigh-clear, and Rayleigh-cloudy (de Kloe et al., 2023), but Mie-cloudy and Rayleigh-clear winds have better quality than the others (Zuo et al., 2022; Rani et al., 2022). The influences of assimilating Aeolus Mie-cloudy and Rayleigh-clear NRT HLOS winds on the forecasts of TCs and tropical convective systems have yet to be investigated in detail. Thus, this study assesses the impacts of assimilating Aeolus Mie-cloudy and Rayleigh-clear HLOS winds on the analysis and forecasts of Hurricane Ida (2021) and an MCS embedded in an AEW during the CPEX-AW field campaign (2021). The WRF model and NCEP GSI-based 3DEnVAR hybrid DA system are applied in this study.
Ida (2021) originated from an AEW on 14 August 2021 and became a TD on 26 August 2021, 12:00 UTC. Six hours after cyclogenesis, it intensified into a TS. Ida (2021) experienced two RI periods: from 00:00 to 18:00 UTC on 27 August 2021 (RI1) and from 28 August 2021, 12:00 UTC, to 29 August 2021, 12:00 UTC (RI2). Between these two RI periods, Ida (2021) made landfall in Cuba around 28 August 2021, 00:00 UTC (Beven et al., 2022). Eight cycling DA experiments, i.e., experiments 2406, 2406_L2B, 2412, 2412_L2B, 2418, 2418_L2B, 2500, and 2500_L2B, are carried out to investigate the impacts of assimilating Aeolus HLOS winds on the track and intensity forecasts of Ida (2021), especially during the two RI periods. The horizontal and vertical ensemble localization scales of these eight cycling DA experiments are set to 110 km and 3 grid units, respectively, which has been proved reasonable for the DA experiments by a sensitivity study. Compared with the experiments without the assimilation of Aeolus HLOS winds (experiments 2406, 2412, 2418, and 2500), the track forecasts are improved after the assimilation of Aeolus HLOS winds (experiments 2406_L2B, 2412_L2B, 2418_L2B, and 2500_L2B). The impacts on intensity forecasts are neutral in experiments 2406_L2B and 2412_L2B, while small but continuous improvements in intensity forecasts can be found in experiments 2418_L2B and 2500_L2B. In addition, the ETS scores against the IMERG precipitation data near the center of Ida (2021) show that assimilating Aeolus HLOS winds can improve the 6 h accumulated precipitation forecasts for strong convection (10 and 15 mm). One possible reason for the improved intensity and precipitation forecasts after the assimilation of Aeolus HLOS winds is the stronger divergence in the upper level of the troposphere, as indicated by the averaged analysis increments of divergence within a 300 km radius of the center of Ida (2021) on 25 August 2021, 12:00 UTC, and 26 August 2021, 12:00 UTC, in experiments 2418_L2B and 2500_L2B. In addition to Hurricane Ida (2021), we also perform experiments 1918 and 1918_L2B to examine the impacts of assimilating Aeolus HLOS winds on an MCS embedded in an AEW, which was steered by a subtropical high and propagated westward from 19 August 2021, 12:00 UTC, to 20 August 2021, 00:00 UTC, in the Caribbean Sea. The results of the MCS demonstrate that assimilating Aeolus HLOS winds leads to the better structure of the 6 h accumulated precipitation from 21 August 2021, 18:00 UTC, to 22 August 2021, 00:00 UTC, and rainfall-induced low-level divergence on 22 August 2021, 00:00 UTC.
This study demonstrates the positive impacts of assimilating Aeolus Mie-cloudy and Rayleigh-clear winds on the forecasts of Hurricane Ida (2021) with comprehensive experiments. More case studies are needed if the operational assimilation of Aeolus HLOS winds is required. Future studies should emphasize improving the technique of the Aeolus HLOS wind assimilation with more cases of hurricanes and tropical convective systems.
The NCEP operational Global Forecast System analysis and forecasts at a 6 h interval are obtained from https://doi.org/10.5065/D65D8PWK (National Centers for Environmental Prediction et al., 2015). The Aeolus L2B scientific wind products are accessed via https://aeolus-ds.eo.esa.int/oads/access/collection/L2B_Wind_Products (ESA, 2021). The NHC best-track data for 2021 Atlantic Hurricane Season can be accessed via https://www.nhc.noaa.gov/data/tcr/index.php?season=2021&basin=atl (National Hurricane Center and Central Pacific Hurricane Center, 2022). IMERG precipitation data are downloaded from https://doi.org/10.5067/GPM/IMERG/3B-HH/06 (Huffman et al., 2019). The color maps of the figures for readers with color vision deficiencies are adopted from Crameri et al. (2020, https://doi.org/10.1038/s41467-020-19160-7).
CF collected the data, performed the experiments, analyzed the experiment results, and drafted the paper. ZP developed the overall research goals and aims, acquired the financial support for the project leading to this publication, and revised the paper critically.
The contact author has declared that neither of the authors has any competing interests.
Publisher's note: Copernicus Publications remains neutral with regard to jurisdictional claims in published maps and institutional affiliations.
This article is part of the special issue “Aeolus data and their application (AMT/ACP/WCD inter-journal SI)”. It is not associated with a conference.
We appreciate the NCAR WRF model development group for providing the WRF model, the UCAR Developmental Tested Center (DTC) for the GSI DA system source code, and the Center for High-Performance Computing (CHPC) at the University of Utah for computer support. Comments from Ying Wang, Ad Stoffelen, and the anonymous referee were helpful and greatly appreciated.
This research has been supported by the National Aeronautics and Space Administration (grant no. 80NSSC20K0900).
This paper was edited by Ad Stoffelen and reviewed by Ying Wang, Ad Stoffelen, and one anonymous referee.
Andersson, E., Dabas, A., Endemann, M., Ingmann, P., Källén, E., Offiler, D., and Stoffelen, A.: ADM-Aeolus science report, ESA, 130 pp., https://esamultimedia.esa.int/multimedia/publications/SP-1311/SP-1311.pdf (last access: 21 April 2023), 2008.
Baars, H., Herzog, A., Heese, B., Ohneiser, K., Hanbuch, K., Hofer, J., Yin, Z., Engelmann, R., and Wandinger, U.: Validation of Aeolus wind products above the Atlantic Ocean, Atmos. Meas. Tech., 13, 6007–6024, https://doi.org/10.5194/amt-13-6007-2020, 2020.
Baker, W. E., Atlas, R., Cardinali, C., Clement, A., Emmitt, G. D., Gentry, B. M., Hardesty, R. M., Källén, E., Kavaya, M. J., Langland, R., Ma, Z., Masutani, M., McCarty, W., Pierce, R. B., Pu, Z., Riishojgaard, L. P., Ryan, J., Tucker, S., Weissmann, M., and Yoe, J. G.: Lidar-measured wind profiles: The missing link in the global observing system, B. Am. Meteorol. Soc., 95, 543–564, https://doi.org/10.1175/BAMS-D-12-00164.1, 2014.
Banyard, T. P., Wright, C. J., Hindley, N. P., Halloran, G., Krisch, I., Kaifler, B., and Hoffmann, L.: Atmospheric gravity waves in Aeolus wind lidar observations, Geophys. Res. Lett., 48, e2021GL092756, https://doi.org/10.1029/2021GL092756, 2021.
Beven II, J. L., Hagen, A., and Berg, R.: National Hurricane Center tropical cyclone report: Hurricane Ida (AL092021), National Hurricane Center (NHC), 163 pp., https://www.nhc.noaa.gov/data/tcr/AL092021_Ida.pdf (last access: 21 April 2023), 2022.
Crameri, F., Shephard, G. E., and Heron, P. J.: The misuse of colour in science communication, Nat. Commun., 11, 5444, https://doi.org/10.1038/s41467-020-19160-7, 2020.
de Kloe, J., Stoffelen, A., Tan, D., Andersson, E., Rennie, M., Dabas, A., Poli, P., and Huber, D.: Aeolus data innovation science cluster DISC ADM-Aeolus Level-2B/2C processor input/output data definitions interface control document, ESA, 134 pp., https://earth.esa.int/eogateway/documents/20142/37627/Aeolus-L2B-2C-Input-Output-DD-ICD.pdf (last access: 21 April 2023), 2023.
Dudhia, J.: Numerical study of convection observed during the winter monsoon experiment using a mesoscale two-dimensional model, J. Atmos. Sci., 46, 3077–3107, https://doi.org/10.1175/1520-0469(1989)046<3077:NSOCOD>2.0.CO;2, 1989.
ESA: A guide to Aeolus range bin settings, Earth online, https://earth.esa.int/eogateway/news/a-guide-to-aeolus-range-bin-settings (last access: 24 December 2022), 2020.
ESA: ESA Aeolus online dissemination, ESA [data set], https://aeolus-ds.eo.esa.int/oads/access/collection/L2B_Wind_Products (last access: 5 September 2022), 2021.
ESA: Facts and figures, https://www.esa.int/Applications/Observing_the_Earth/Aeolus/Facts_and_figures, last access: 24 December 2022.
Garrett, K., Liu, H., Ide, K., Hoffman, R. N., and Lukens, K. E.: Optimization and impact assessment of Aeolus HLOS wind data assimilation in NOAA's global forecast system, Q. J. Roy. Meteor. Soc., 148, 2703–2716, https://doi.org/10.1002/qj.4331, 2022.
Guo, J., Liu, B., Gong, W., Shi, L., Zhang, Y., Ma, Y., Zhang, J., Chen, T., Bai, K., Stoffelen, A., de Leeuw, G., and Xu, X.: Technical note: First comparison of wind observations from ESA's satellite mission Aeolus and ground-based radar wind profiler network of China, Atmos. Chem. Phys., 21, 2945–2958, https://doi.org/10.5194/acp-21-2945-2021, 2021.
Hong, S.-Y. and Lim, J. O. J.: The WRF single-moment 6-class microphysics scheme (WSM6), J. Korean Meteor. Soc., 42, 129–151, 2006.
Hong, S.-Y., Noh, Y., and Dudhia, J.: A new vertical diffusion package with an explicit treatment of entrainment processes, Mon. Weather Rev., 134, 2318–2341, https://doi.org/10.1175/MWR3199.1, 2006.
Hu, M., Ge, G., Zhou, C., Stark, D., Shao, H., Newman, K., Beck, J., and Zhang, X.: GSI user's guide version 3.7, Developmental Testbed Center (DTC), 147 pp., https://dtcenter.org/sites/default/files/GSIUserGuide_v3.7_0.pdf (last access: 21 April 2023), 2018.
Huffman, G. J., Stocker, E. F., Bolvin, D. T., Nelkin, E. J., and Tan, J.: GPM IMERG final precipitation L3 half hourly 0.1 degree x 0.1 degree V06, Goddard Earth Sciences Data and Information Services Center (GES DISC) [data set], https://doi.org/10.5067/GPM/IMERG/3B-HH/06, 2019.
Ingmann, P. and Straume, A. G.: ADM-Aeolus mission requirements document, ESA, 57 pp., https://esamultimedia.esa.int/docs/EarthObservation/ADM-Aeolus_MRD.pdf (last access: 21 April 2023), 2016.
Janjić, T., Bormann, N., Bocquet, M., Carton, J. A., Cohn, S. E., Dance, S. L., Losa, S. N., Nichols, N. K., Potthast, R., Waller, J. A., and Weston, P.: On the representation error in data assimilation, Q. J. Roy. Meteor. Soc., 144, 1257–1278, https://doi.org/10.1002/qj.3130, 2018.
Jiménez, P. A., Dudhia, J., González-Rouco, J. F., Navarro, J., Montávez, J. P., and García-Bustamante, E.: A revised scheme for the WRF surface layer formulation, Mon. Weather Rev., 140, 898–918, https://doi.org/10.1175/MWR-D-11-00056.1, 2012.
Kain, J. S.: The Kain–Fritsch convective parameterization: An update, J. Appl. Meteorol. Clim., 43, 170–181, https://doi.org/10.1175/1520-0450(2004)043<0170:TKCPAU>2.0.CO;2, 2004.
Krisch, I., Hindley, N. P., Reitebuch, O., and Wright, C. J.: On the derivation of zonal and meridional wind components from Aeolus horizontal line-of-sight wind, Atmos. Meas. Tech., 15, 3465–3479, https://doi.org/10.5194/amt-15-3465-2022, 2022.
Laroche, S. and St-James, J.: Impact of the Aeolus level-2b horizontal line-of-sight winds in the Environment and Climate Change Canada global forecast system, Q. J. Roy. Meteor. Soc., 148, 2047–2062, https://doi.org/10.1002/qj.4300, 2022.
Lukens, K. E., Ide, K., Garrett, K., Liu, H., Santek, D., Hoover, B., and Hoffman, R. N.: Exploiting Aeolus level-2b winds to better characterize atmospheric motion vector bias and uncertainty, Atmos. Meas. Tech., 15, 2719–2743, https://doi.org/10.5194/amt-15-2719-2022, 2022.
Marinescu, P. J., Cucurull, L., Apodaca, K., Bucci, L., and Genkova, I.: The characterization and impact of Aeolus wind profile observations in NOAA's regional tropical cyclone model (HWRF), Q. J. Roy. Meteor. Soc., 148, 3491–3508, https://doi.org/10.1002/qj.4370, 2022.
Martin, A., Weissmann, M., Reitebuch, O., Rennie, M., Geiß, A., and Cress, A.: Validation of Aeolus winds using radiosonde observations and numerical weather prediction model equivalents, Atmos. Meas. Tech., 14, 2167–2183, https://doi.org/10.5194/amt-14-2167-2021, 2021.
Mlawer, E. J., Taubman, S. J., Brown, P. D., Iacono, M. J., and Clough, S. A.: Radiative transfer for inhomogeneous atmospheres: RRTM, a validated correlated-k model for the longwave, J. Geophys. Res.-Atmos., 102, 16663–16682, https://doi.org/10.1029/97JD00237, 1997.
National Centers for Environmental Prediction, National Weather Service, NOAA, and U.S. Department of Commerce: NCEP GFS 0.25 Degree Global Forecast Grids Historical Archive, Research Data Archive at the National Center for Atmospheric Research, Computational and Information Systems Laboratory [data set], https://doi.org/10.5065/D65D8PWK, 2015.
National Hurricane Center and Central Pacific Hurricane Center: 2021 Atlantic Hurricane Season, NOAA/NWS National Hurricane Center [data set], https://www.nhc.noaa.gov/data/tcr/index.php?season=2021&basin=atl (last access: 21 April 2023), 2022.
Pourret, V., Šavli, M., Mahfouf, J.-F., Raspaud, D., Doerenbecher, A., Bénichou, H., and Payan, C.: Operational assimilation of Aeolus winds in the Météo-France global NWP model ARPEGE, Q. J. Roy. Meteor. Soc., 148, 2652–2671, https://doi.org/10.1002/qj.4329, 2022.
Pu, Z., Zhang, L., and Emmitt, G. D.: Impact of airborne Doppler Wind Lidar data on numerical simulation of a tropical cyclone, Geophys. Res. Lett., 37, L05801, https://doi.org/10.1029/2009GL041765, 2010.
Pu, Z., Zhang, L., Zhang, S., Gentry, B., Emmitt, D., Demoz, B., and Atlas, R.: The impact of Doppler wind lidar measurements on high-impact weather forecasting: Regional OSSE and data assimilation studies in: Data Assimilation for Atmospheric, Oceanic and Hydrologic Applications (Vol. III), edited by: Park, S. K. and Xu, L., Springer, Cham, 259–283, https://doi.org/10.1007/978-3-319-43415-5_12, 2017.
Rani, S. I., Jangid, B. P., Kumar, S., Bushair, M. T., Sharma, P., George, J. P., George, G., and Das Gupta, M.: Assessing the quality of novel Aeolus winds for NWP applications at NCMRWF, Q. J. Roy. Meteor. Soc., 148, 1344–1367, https://doi.org/10.1002/qj.4264, 2022.
Reitebuch, O., Lemmerz, C., Nagel, E., Paffrath, U., Durand, Y., Endemann, M., Fabre, F., and Chaloupy, M.: The airborne demonstrator for the direct-detection Doppler wind lidar ALADIN on ADM-Aeolus. Part I: Instrument design and comparison to satellite instrument, J. Atmos. Ocean Tech., 26, 2501–2515, https://doi.org/10.1175/2009JTECHA1309.1, 2009.
Reitebuch, O., Lemmerz, C., Lux, O., Marksteiner, U., Rahm, S., Weiler, F., Witschas, B., Meringer, M., Schmidt, K., Huber, D., Nikolaus, I., Geiss, A., Vaughan, M., Dabas, A., Flament, T., Stieglitz, H., Isaksen, L., Rennie, M., de Kloe, J., Marseille, G.-J., Stoffelen, A., Wernham, D., Kanitz, T., Straume, A.-G., Fehr, T., von Bismark, J., Floberghagen, R., and Parrinello, T.: Initial assessment of the performance of the first wind lidar in space on Aeolus, in: EPJ Web of Conferences, Volume 237, The 29th International Laser Radar Conference (ILRC29), Heifei, Anhui Province, China, 24–28 June 2019, EPJ Web Conf., 237, 01010, https://doi.org/10.1051/epjconf/202023701010, 2020.
Rennie, M. P. and Isaksen, L.: The NWP impact of Aeolus level-2b winds at ECMWF, ECMWF, Technical memorandum no. 864, 110 pp., https://doi.org/10.21957/alift7mhr, 2020.
Rennie, M. P., Isaksen, L., Weiler, F., de Kloe, J., Kanitz, T., and Reitebuch, O.: The impact of Aeolus wind retrievals on ECMWF global weather forecasts, Q. J. Roy. Meteor. Soc., 147, 3555–3586, https://doi.org/10.1002/qj.4142, 2021a.
Rennie, M. P., Stoffelen, A., Khaykin, S., Osprey, S., Wright, C., Banyard, T., Straume, A. G., Reitebuch, O., Krisch, I., Parrinello, T., von Bismarck, J., and Wernham D.: Demonstrated Aeolus benefits in atmospheric sciences, in: 2021 IEEE International Geoscience and Remote Sensing Symposium (IGARSS), Brussels, Belgium, 11–16 July 2021, IEEE, 763–766, https://doi.org/10.1109/IGARSS47720.2021.9554267, 2021b.
Skamarock, W. C., Klemp, J. B., Dudhia, J., Gill, D. O., Liu, Z., Berner, J., Wang, W., Powers, J. G., Duda, M. G., Barker, D. M., and Huang, X.-Y.: A description of the advanced research WRF model version 4, National Center for Atmospheric Research (NCAR), No. NCAR/TN-556+STR, 145 pp., https://doi.org/10.5065/1dfh-6p97, 2019.
Tewari, M., Chen, F., Wang, W., Dudhia, J., LeMone, M. A., Mitchell, K., Ek, M., Gayno, G., Wegiel, J., and Cuenca, R. H.: Implementation and verification of the unified NOAH land surface model in the WRF model, 14.2a, in: 20th Conference on Weather Analysis and Forecasting/16th Conference on Numerical Weather Prediction (20WAF16NW), Seattle, Washington, U.S., 12–15 January 2004, https://ams.confex.com/ams/84Annual/techprogram/paper_69061.htm, 2004.
WMO: Guide to meteorological instruments and methods of observation, 2014 edn., World Meteorological Organization (WMO), Geneva, Switzerland, 1177 pp., https://doi.org/10.25607/OBP-432, 2017.
Witschas, B., Lemmerz, C., Geiß, A., Lux, O., Marksteiner, U., Rahm, S., Reitebuch, O., and Weiler, F.: First validation of Aeolus wind observations by airborne Doppler wind lidar measurements, Atmos. Meas. Tech., 13, 2381–2396, https://doi.org/10.5194/amt-13-2381-2020, 2020.
Witschas, B., Lemmerz, C., Geiß, A., Lux, O., Marksteiner, U., Rahm, S., Reitebuch, O., Schäfler, A., and Weiler, F.: Validation of the Aeolus L2B wind product with airborne wind lidar measurements in the polar North Atlantic region and in the tropics, Atmos. Meas. Tech., 15, 7049–7070, https://doi.org/10.5194/amt-15-7049-2022, 2022.
Wu, S., Sun, K., Dai, G., Wang, X., Liu, X., Liu, B., Song, X., Reitebuch, O., Li, R., Yin, J., and Wang, X.: Inter-comparison of wind measurements in the atmospheric boundary layer and the lower troposphere with Aeolus and a ground-based coherent Doppler lidar network over China, Atmos. Meas. Tech., 15, 131–148, https://doi.org/10.5194/amt-15-131-2022, 2022.
Zhang, L. and Pu, Z.: An Observing System Simulation Experiment (OSSE) to assess the impact of Doppler wind lidar (DWL) measurements on the numerical simulation of a tropical cyclone, Adv. Meteorol., 2010, 1–14, https://doi.org/10.1155/2010/743863, 2010.
Zuo, H., Hasager, C. B., Karagali, I., Stoffelen, A., Marseille, G.-J., and de Kloe, J.: Evaluation of Aeolus L2B wind product with wind profiling radar measurements and numerical weather prediction model equivalents over Australia, Atmos. Meas. Tech., 15, 4107–4124, https://doi.org/10.5194/amt-15-4107-2022, 2022.
- Abstract
- Introduction
- WRF model, DA system, IMERG, and statistical evaluation metrics
- Impacts of Aeolus data on numerical simulations of Hurricane Ida (2021)
- Diagnosis of influence of Aeolus DA on the analysis of Hurricane Ida (2021)
- Impacts of Aeolus data on numerical simulations of an MCS associated with an AEW
- Conclusions
- Data availability
- Author contributions
- Competing interests
- Disclaimer
- Special issue statement
- Acknowledgements
- Financial support
- Review statement
- References